Article

Spatio-Temporal Influencing Factors of the Coupling Coordination Degree Between China’s New-Type Urbanization and Transportation Carbon Emission Efficiency

1
School of Economics and Management, Beijing Jiaotong University, No. 3 Shangyuan Village, Haidian District, Beijing 100044, China
2
Beijing Laboratory of National Economic Security Early-Warning Engineering, Office Building 7, Beijing Jiaotong University, No. 3 Shangyuan Village, Haidian District, Beijing 100044, China
*
Author to whom correspondence should be addressed.
Land 2025, 14(3), 623; https://doi.org/10.3390/land14030623
Submission received: 9 February 2025 / Revised: 5 March 2025 / Accepted: 10 March 2025 / Published: 15 March 2025

Abstract

:
This study focuses on the coupling and coordination between China’s new-type urbanization (NU) and transportation carbon emission efficiency (CET), revealing its spatial and temporal evolution patterns and driving factors. In recent years, the rapid rise of the digital economy has profoundly reshaped traditional industrial structures. It has catalyzed new forms of production and consumption and opened up new pathways for carbon reduction. This makes synergies between NU and CET increasingly important for realizing a low-carbon transition. In addition, digital infrastructures such as 5G networks and big data platforms promote energy efficiency and facilitate industrial upgrading. It also promotes the integration of low-carbon goals into urban governance, thus strengthening the linkages between NU and CET. The study aims to provide a scientific basis for regional synergistic development and green transformation for the goal of “dual carbon”. Based on the panel data of 30 provinces in China from 2004 to 2021, the study adopts the entropy weight method and the super-efficiency SBM model to quantify NU and CET, and then analyzes their spatial and temporal interactions and spatial spillovers by combining the coupled coordination degree model and the spatial Durbin model. The following is found: (1) NU and CET show a spatial pattern of “leading in the east and lagging in the west”, and are optimized over time, but with significant regional differences; (2) the degree of coupling coordination jumps from “basic disorder” to “basic coordination”, but has not yet reached the level of advanced coordination, with significant spatial clustering characteristics (Moran’s I index between 0.244 and 0.461); (3) labor force structure, transportation and energy intensity, industrial structure and scientific and technological innovation are the core factors driving the coupled coordination, and have significant spatial spillover effects, while government intervention and per capita income have limited roles. This paper innovatively reveals the two-way synergistic mechanism of NU and CET, breaks through the traditional unidirectional research framework, and systematically analyzes the two-way feedback effect of the two. A multidimensional NU evaluation system is constructed to overcome the limitations of the previous single economic or demographic dimension, and comprehensively portray the comprehensive effect of new urbanization. A multi-dimensional coupled coordination measurement framework is proposed to quantify the synergistic evolution law of NU and CET from the perspective of spatio-temporal dynamics and spatial correlation. The spatial spillover paths of key factors are finally quantified. The findings provide decision-making references for optimizing low-carbon policies, promoting green transformation of transportation, and taking advantage of the digital economy.

1. Introduction

Against the backdrop of the urgent global response to climate change, green and low-carbon transformation has become a core issue for countries to realize sustainable development [1]. As the world’s largest carbon emitter, China’s “carbon peak” and “carbon neutral” goals (hereinafter referred to as the “dual carbon” goals) are not only the top-level design of the national strategy [2,3], but also a systematic challenge to economic structural transformation and regional synergistic development [4]. The realization of this goal depends on the synergistic promotion of many fields, among which the coupling and coordination of new-type urbanization (NU) and transportation carbon emission efficiency (CET) is especially crucial. NU emphasizes the transition from “land expansion” to “human-centered, intensive, green and low-carbon” mode, focusing on urban–rural integration, industrial upgrading and ecological protection [5]. As the second largest source of carbon emissions in the world [6], the improvement of the efficiency of the transportation sector is directly related to the national carbon emission reduction process. At the same time, the rapid development of the digital economy (DE) is reshaping traditional production methods and enhancing the formation of new productive forces. DE, characterized by digital technology penetration, data-driven innovation, and platform-based business models, can significantly accelerate the green transition by optimizing resource allocation and promoting energy efficiency. For instance, emerging digital technologies such as big data, artificial intelligence (AI), and Internet of Things (IoT) can effectively monitor urban traffic flows in real-time, improve transportation demand management, and facilitate smart transportation systems, thereby directly boosting CET. Moreover, the integration of DE into NU facilitates industrial digital transformation and upgrading, encourages cleaner production, and enhances regional innovation capability, further strengthening the coupling between NU and CET. However, the spatial distribution imbalance and uneven technology diffusion of DE might exacerbate existing regional gaps, presenting both opportunities and challenges for synergistic regional development [7]. Thus, exploring the interactive mechanisms among DE, NU, and CET becomes increasingly vital for achieving China’s dual-carbon targets. However, during China’s rapid urbanization and transportation expansion, problems such as regional development imbalance, technology penetration differences and insufficient policy synergy have become increasingly prominent [8]. As a result, the efficiency of carbon emissions shows a spatial differentiation pattern of “high in the east and low in the west” [9]. In this context, revealing the interaction mechanism between NU and CET and their spatial and temporal evolution patterns has become an important breakthrough in solving the bottleneck of the “dual-carbon” target [10].
The coupled and coordinated relationship between NU and CET is the key to realizing the green low-carbon transition and the “dual-carbon” goal [11,12]. Scholars have analyzed the interaction mechanism between the two from different perspectives, but there are significant differences in views, mainly reflected in the following three aspects: 1. NU is the driving force to enhance CET. Based on the perspective of economies of scale and technological innovation, some scholars believe that NU can promote CET enhancement through industrial structure optimization, intensive resource utilization and technology diffusion [13,14]. For example, Bornemann [15] points out that population agglomeration and industrial agglomeration in the process of NU can reduce the energy consumption per unit of transportation and enhance the overall transportation efficiency through shared transportation infrastructure (e.g., rail transportation network). Recent empirical studies demonstrate that digital twin-enabled smart logistics systems can further reduce energy consumption per unit transportation by 18–25% through real-time demand forecasting. In addition, technological spillovers within urban agglomerations (e.g., the promotion of new energy technologies) can accelerate the low-carbon transport transition [16]. Zhao [17] further suggests that NU-driven equalization of public services (e.g., intelligent transportation systems) can optimize the travel structure and reduce private car dependence, thereby reducing carbon emission intensity. This school of thought emphasizes that the synergistic effect of NU and CET has been initially seen in developed regions in the east, and that the core mechanism lies in the positive cycle of “agglomeration-efficiency-emission reduction” [18]. 2. Inhibitory effect of crude NU on CET. Another group of scholars focuses on the pressure of NU expansion on the resource environment, arguing that rough development without planning may exacerbate the degradation of carbon emission efficiency [19]. AlMulali [20] found in the central and western regions with lagging infrastructure the mismatch between the expansion of the transportation network and the surge in energy demand leads to the “high growth—high emission” dilemma. In addition, Zhu [21] points out that “passive NU” (i.e., population inflow lagging behind land development) in the central and western regions leads to fragmentation of transportation demand, exacerbating reliance on traditional fuel vehicles and further widening the regional CET gap. 3. The synergistic relationship has nonlinear characteristics. Some studies introduced the theory of Environmental Kuznets Curve (EKC) and proposed that the synergistic relationship between NU and carbon emission rate has nonlinear characteristics and critical thresholds [22,23,24]. Zhang [25] found, based on Chinese provincial data, that when the NU rate is lower than 60%, the effect of NU on CET is dominated by an inhibitory effect. And beyond this threshold, the superimposed effect of technological innovation and policy regulation turns the elasticity coefficient positive. This finding is consistent with Wang’s [26] “U-curve” hypothesis. That is, the infrastructure construction and energy demand surge at the early stage of NU will lead to a decline in carbon emission rate, but with the maturity of green technology and the improvement of the system, the synergistic effect will gradually appear. However, a follow-up study by Wang [27] emphasizes that the attainment of this threshold is highly dependent on regional endowments: in the eastern region, the threshold is about 55% due to stronger technological reserves and policy implementation, while in the central and western regions, the threshold may be as high as 70% due to the constraints of industrial structure and financial capacity, and the path of attaining the target is more tortuous.
Studies in recent years have also begun to focus on the spatial dependence of the synergistic relationship between NU and CET. Zhang [28] used the spatial Durbin model (SDM) to find that low-carbon transportation technologies (e.g., the popularization of electric vehicles) in the eastern provinces can lead to the enhancement of carbon emission rates in neighboring provinces through industry chain linkages and knowledge spillovers. However, this positive effect may be offset by the transfer of high-carbon industries from the central and western regions. These differences suggest that it is difficult for a single regional policy to achieve synergistic development on a national scale. Low-carbon synergistic transformation between regions must be promoted through cross-regional policy coordination and technology sharing [23]. Yang [29] further proposed the “center-edge” theory. It is argued that the NU process of core city clusters (e.g., Beijing-Tianjin-Hebei, Yangtze River Delta) can form regional low-carbon corridors through transportation integration and carbon trading market construction. On the other hand, due to the lack of policy synergy and technological segregation, the peripheral regions can hardly enjoy the spillover dividends and even increase the pressure on local emissions by taking over high-carbon industries. Notably, the national “East Data West Computing” project has established cross-regional digital synergy mechanisms, where western data centers utilizing eastern-developed AI energy-saving algorithms reduced PUE values by 0.15–0.3, mitigating 22–35% of carbon leakage effects. This theoretical framework provides an important basis for this study to reveal the spatial differentiation pattern of “East High, West Low”.
Traditional studies have mostly focused on economic or demographic dimensions, with less integrated consideration of social, spatial and environmental factors, neglecting the moderating role of social equity and ecological resilience on NU-CET synergy. The urbanization evaluation system proposed by Xu [30] measures the level of urbanization mainly through economic indicators such as urbanization rate and GDP growth rate. This framework effectively captures the direct impact of economic growth but lacks consideration of social inclusion and ecological environment. Jiang [31], on the other hand, focused on analyzing the impact of urbanization on carbon emissions. Despite focusing on the environmental effects of urbanization, the synergistic effects of economy, social structure and spatial layout on carbon emission efficiency were not explored in depth. In addition, Chen [32] analyzed the social effects of urbanization through social dimensions such as population mobility and per capita income in their study. However, it failed to incorporate industrial structure, green and low-carbon development and other factors, which led to a certain one-sidedness in its evaluation system. Similarly, Luo’s [33] study, although considering regional differences, mainly analyzed from the perspectives of land use and economic growth, and failed to fully reveal the relationship between NU and long-term goals such as regional balance and ecological restoration.
In contrast, the urbanization indicator system proposed in this paper breaks through the one-dimensional limitation of existing studies and combines five core areas: population urbanization, economic urbanization, social urbanization, spatial urbanization and environmental urbanization. Each area involves multiple dimensions and key indicators, comprehensively reflecting the multidimensional effects of NU. For example, the four indicators of population urbanization (PU) are able to capture population mobility and social inclusion more precisely [34]. The five indicators of economic urbanization (EU) systematically measure the changes in economic structure and the effects of industrial transformation in the process of urbanization [35,36]. The six indicators of social urbanization (SU) assess the impact of urbanization on social welfare, health, education and innovation capacity from a broader perspective [37]. The three indicators of spatial urbanization (SPU) reflect the sustainability of infrastructure development and spatial expansion [38]. Finally, the four indicators of environmental urbanization (ENU) comprehensively examine the ecological environmental protection and resource use efficiency in the urbanization process [39]. Compared with existing studies, the innovation of this paper is that it not only integrates a multi-dimensional indicator system of economic, demographic, social, spatial, and environmental dimensions, but also emphasizes the interaction and coordination among these dimensions. Therefore, the urbanization evaluation system proposed in this paper provides not only a more systematic framework for theoretical research, but also a more precise and actionable guide for regional policy design in practice through a comprehensive multi-dimensional analysis.
Most of the existing studies have explored the relationship between NU and CET [40,41]. However, static models are commonly used for analysis, failing to effectively capture the dynamic process of spatio-temporal evolution and inter-regional variability. To some extent, this approach ignores the complex spatio-temporal interactions between NU and CET and fails to reveal the specific differences and challenges in different regions and time periods. In contrast, this study introduces spatio-temporal data and spatial effects by combining spatio-temporal evolution and spatial spillover effects, using the coupled coordination degree model (CCDM) and spatial Durbin model (SDM) [36,42]. The interaction between NU and CET is systematically analyzed from a dynamic perspective. We not only focus on the data changes in different years but also analyze the regional differences among provinces at the spatial level, especially the different challenges and opportunities faced by the eastern and central-western regions in the process of NU.
Compared with previous studies, this paper demonstrates significant innovative points and marginal contributions in exploring the coupled coordination relationship between NU and CET. (1) In the context of the important policy orientation of emission peak and carbon neutrality, we examine the impacts of China’s current stage of NU and CET and verify the two-way synergistic relationship between the NU and CET. On the one hand, NU has a supportive driving effect on CET; on the other hand, CET has a feedback push on NU, which enriches the research results on the NU and CET. (2) Past studies have tended to look at only a single dimension when assessing NU and CET. However, this paper adopts a more comprehensive and systematic analytical framework within the policy. Specifically, we comprehensively assess NU from five dimensions: demographic, economic, social, spatial, and ecological. Meanwhile, we comprehensively assess CET from three input dimensions: labor, capital, and energy, as well as two output dimensions. Through this multidimensional analysis, we systematically reveal the current status of NU and CET in China at this stage. This not only helps the government to more accurately grasp the current development characteristics but also provides strong data support and decision-making basis for future policy formulation and strategic planning. Ensuring that China moves steadily forward on the path of pursuing sustainable development. (3) From the perspective of coupled and coordinated development, the analysis focuses on the interaction and conduction pathways of NU and CET. Through systematic study, we draw useful conclusions. These conclusions help to further deepen the comprehensive understanding of the developmental issues of NU and CET. Our analysis not only reveals the intrinsic links between the two, but also clarifies the specific ways and pathways through which they interact, providing an important reference for future policy formulation and strategic planning. (4) This paper starts from the spatial spillover perspective of coupled coordination. It deeply explores the spatial spillover effects of per capita income level, scientific and technological innovation, labor force structure, transportation and energy intensity, industrial structure, and the degree of government intervention on the degree of coupled coordination of NU and CET. Through this study, we draw conclusions with practical guidance. These findings enable the government to more precisely identify the key wants that affect the coupled and coordinated development. Thus, a solid foundation is laid for promoting high-quality development in NU. By considering the spatial spillover effect, we provide a more comprehensive and in-depth reference basis for the government to formulate relevant policies. It helps to realize the coordinated progress of NU and CET.
The structure of the subsequent sections in this paper is outlined as follows: Section 2: Methodology and Data Foundation. In this section, we will elaborate on the index system used, along with the research methods and models employed. This will provide a comprehensive overview of the analytical framework and data sources utilized in the study. Section 3: Analysis of Results and Discussion. This section will primarily focus on the temporal and spatial variations observed in the NU, CET, and their coupling coordination degree. Additionally, we will conduct a spatial autocorrelation test to examine the clustering patterns and spatial spillover effects of these factors. The findings will be discussed in detail to provide insights into the complex interactions and dynamics between NU and CET. Section 4: Conclusion and Policy Recommendations. Here, we will summarize the key conclusions drawn from the analysis and offer policy recommendations based on our findings. The aim is to provide valuable insights for policymakers to consider in their efforts to promote high-quality NU while also addressing the challenges of CET.

2. Methodology and Data

This paper uses data from 2004 to 2021 as the basis of the study to assess the development of NU and CET. Based on the above data, this paper introduces a CCDM to quantitatively assess the degree of coupling coordination between NU and CET. Meanwhile, with the help of SDM, the spatial spillover effects of NU and CET are explored. The process is shown in Figure 1.

2.1. Definition of Variables

2.1.1. NU Evaluation Indicator System

Reference to existing research results [7,43]. As depicted in Figure 2, 22 representative indicators were carefully selected in constructing the NU evaluation indicator system. These indicators cover five core perspectives, namely population urbanization (PU), economic urbanization (EU), social urbanization (SU), spatial urbanization (SPU) and environmental urbanization (ENU). Through the careful consideration of these 22 indicators, we strive to more accurately reflect the multidimensional characteristics and development trends of NU. The PU is the core of NU. This promotes the orderly movement of the rural population to the cities and facilitates the rational expansion of the size of the cities. It also enhances agglomeration effect, promotes economic development, and provides labor and consumers. However, it may also lead to problems such as urban congestion, increased pressure on infrastructure, and increased competition for jobs. The EU is the material basis of NU. It promotes urban economic activity agglomeration and industrial upgrading, optimizes industrial structure, increases employment opportunities, and attracts rural labor. The SU focuses on residents’ quality of life and happiness index. It also works to ensure harmony and stability in urban and rural society. As NU accelerates, urban residents’ lifestyles, values, and cultural practices change. We need to work to bridge the gap between urban and rural areas and to promote more balanced and harmonious development. The SPU aims to promote rural urbanization and urban upgrading and expansion, so as to optimize the layout of urban and rural areas and enhance the image and functions of cities. The ENU is committed to protecting and enhancing NU’s ecological environment and strives to realize a green, low-carbon, and circular development model. With the population and economic growth of cities, environmental problems are highlighted [44,45,46].
The index measurement method is as follows:
Drawing upon the insightful research conducted by Liao [47,48], the current study employs the entropy weight method to assess and quantify the NU levels in China’s 30 provinces. Using this method, we are able to obtain a comprehensive picture of the progress of NU and the gaps that exist, ultimately supporting informed decision-making and planning efforts. The formula is as follows:
Step 1: Dimensionless. Before applying the entropy weighting method, it is necessary to ensure that the data are consistent. It is usually necessary to first process the raw data in a dimensionless manner. The purpose of this step is to eliminate the errors that may be caused by the differences in units or scales between different indicators. This ensures the accuracy of the subsequent entropy weighting method calculations.
The positive indicator formula is as follows:
x i j k = x i j k x min , k x max , k x min , k
where xijk represents the value of the indicator in the i-th province, j-th year, and k-th indicator. The normalization ensures that all indicators have a consistent scale, ranging from 0 to 1.
The negative indicator formula is as follows:
x i j k = x max , k x i j k x max , k x min , k
where the range of values of the data xijk is limited to the interval [0, 1] to eliminate differences in units and magnitudes; xmin,k and xmax,k denotes the minimum and maximum values of the indicator in the region in the year, respectively.
Step 2: Data panning. Since 0 values and negative values appear after dimensionless processing, the data are leveled. The formula is as follows:
x i j k = x i j k + n
where n is the panning amplitude, generally taken as 1.
Step 3: Set relative weights for indicator values. The formula is as follows:
P i j k = x i j k Σ i Σ j x i j k
Step 4: Determine the entropy value. The formula is as follows:
e k = 1 ln n i j P i j k ln P i j k
Step 5: Determine the coefficient of variation. The formula is as follows:
g k = 1 e k
Step 6: Determine the indicator weights. The formula is as follows:
W k = g k k g k
Step 7: Measure the NU.
U = k W k x i j k
The seventh step is to obtain the comprehensive score of the NU level of 30 provinces.

2.1.2. CET Evaluation Indicator System

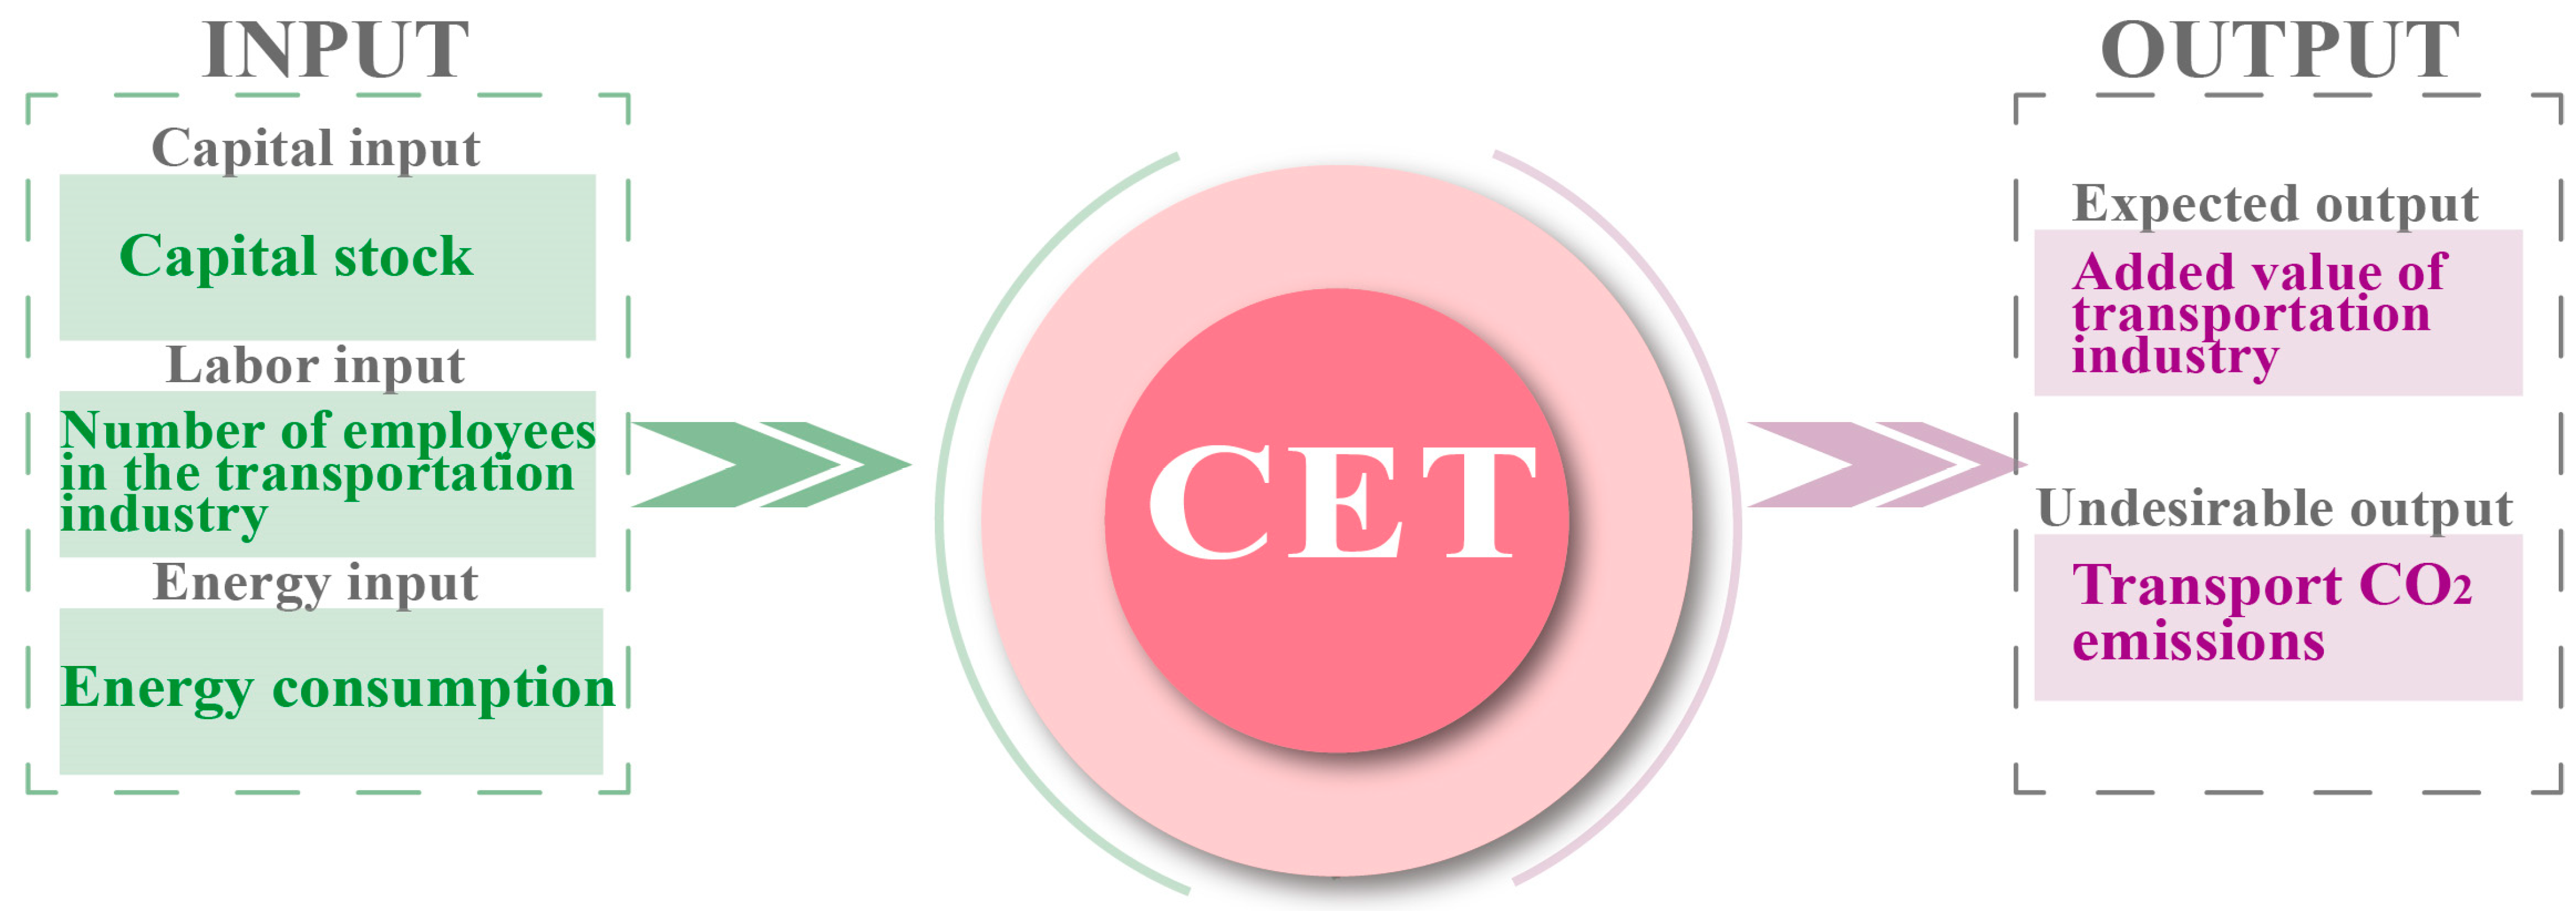
The CET indicator system constructed in this paper refers to previous studies [8,49]. As depicted in Figure 3, it mainly consists of two parts, inputs and outputs. The selection of input indicators is crucial when assessing CET. We choose the following three main input indicators: (1) Capital input: With reference to Vaninsky [50], we adopt capital stock as a measure of capital input. Capital stock can reflect the physical capital accumulated in the transportation industry over time. (2) Labor input: Labor input is a key indicator for assessing the human resources required for production activities in the industry. Here, we use the number of people employed in China’s transportation industry to measure labor input. This indicator can visually reflect the scale of human resources and the degree of labor intensity of the transportation industry. (3) Energy input: The transportation industry is an energy-intensive industry with huge energy consumption. Therefore, energy input is an important factor in measuring the CET [50]. The consumption of these energy types can comprehensively reflect the energy consumption structure and energy utilization efficiency.
In the selection of output indicators, we consider both desired and non-desired outputs: (1) Desired output: Economic returns are a key indicator of progress in the transportation sector. Here, we use the value-added component of the transportation sector as a yardstick for assessing the desired output. This indicator can reveal the extent to which the transportation sector contributes to economic growth. (2) Non-desired output: The ecological impact of industry operations needs to be taken into account when measuring carbon efficiency. Therefore, we choose transportation emissions as a measure of undesired output [51]. This indicator reveals the extent of environmental pollution caused by the transportation sector during production, thereby serving as a crucial aspect in evaluating carbon emission efficiency.
The index measurement method is as follows:
(1) Calculation of carbon emissions
Referring to the research findings of the IPCC, we can uniformly convert the aforementioned energy consumption into standard coal for calculation [52]. The formula is
C O 2 = i = 1 8 α β Q i × 44 12
where i denotes the energy species; CO2 is total carbon emissions; Qi is energy consumption; α and β  are standard coal conversion factors and carbon conversion factors, respectively [53]. Units: The units for Qi are energy units (typically tons of coal), while α and β are dimensionless factors used for conversion. The resulting CO2 will have units of carbon emissions (tons of CO2), as presented in Table 1.
(2) Super-Efficient SBM Modelling of Undesired Outputs
Super-Efficient SBM (SBM) is a non-parametric method for assessing system efficiency, especially in the presence of non-desired outputs (e.g., carbon emissions) [28,54]. Compared to traditional DEA models, SBM is able to handle non-desired outputs and thus avoid bias. In addition, the SBM model has the advantage that it allows efficiency values to exceed 1, which helps identify high-performing and efficient regions.
Measuring CET using SBM, let X R m × n  be the input matrix, Y g R s 1 × n  be the desired output matrix, Y b R s 2 × n  be the non-desired output matrix, and s R m , s g R s 1 , s b R s 2 denote the corresponding slack variables. With n decision units, denoted as DMU, and m, s1, s2 denoting the number of corresponding variables, the formula is
min ρ = 1 + 1 m i = 1 m s i x ¯ x i k 1 1 s 1 + s 2 i = 1 s 1 s i g y i k g + i = 1 s 2 s i b y i k b
s . t . j = 1 , j k n λ j x i j s i x i k i = 1 , 2 , , m j = 1 , j k n λ j y u j g + s u g y u k g u = 1 , 2 , , s 1 j = 1 , j k n λ j y v j b s v b y v k b v = 1 , 2 , , s 2
where ρ  denotes CET; j denotes provinces other than the province to be measured; xij denotes the i input of the province j; yujg denotes the u desired output of the province j; and yvjb denotes the v non-desired output of the province j.

2.1.3. Selection of Impact Factors

In exploring the characteristics of spatial relevance, we must fully consider the spatial spillover effects of various influencing factors. After conducting extensive research, we integrate the unique aspects of regional development, such as varying conditions and resource endowments, into our approach. In this paper, we select six influencing factors, as shown in Table 2. Mainly per capita income level, labor force structure, scientific and technological innovation, transportation and energy intensity, industrial structure, and the degree of governmental intervention. Explanation of variable selection: (1) Income per capita level (INC) is measured by GDP per capita, which reveals the economic prosperity of a region [27]. Not only does GDP per capita have a considerable influence on NU and CET, but it is also a key factor in assessing the degree of coupling harmonization. (2) Labor force structure (LS) is expressed as the share of non-farm employment [55]. This indicator not only reflects the level of NU in a region, but also has an impact on CET. Thus, it acts on the changes in the coupling coordination degree. (3) Transportation energy intensity (TEI) is expressed by calculating the ratio of energy consumption in the transportation sector to the GDP of each region [56]. This relationship not only promotes NU, but also drives the growth of coupling coordination. (4) Industrial structure (IS) is measured by the proportion of added value of the tertiary industry in the regional GDP [57]. The optimization and upgrading of industrial structure has a positive impact on both the development of NU and the enhancement of CET. (5) Science and Technology Innovation (STI) is measured by the number of patents granted [58]. Innovative activities have contributed to the prosperity of the urban economy and improved the urban ecosystem. It gives impetus to the process of NU and the enhancement of CET. (6) The degree of government intervention (GOV) is measured by the share of government expenditure in GDP [59]. Government involvement plays a guiding and planning role for urban development.

2.2. Model

2.2.1. Coupling Coordination Degree Model

Referring to Li [60], the coupling coordination degree is used to calculate the degree of coupling between NU and CET. The formula is
C = U 1 × U 2 U 1 + U 2 2 2
T = α U 1 + β U 2
D = C × T
where C is the coupling; U1 denotes NU; U2 denotes the CET; T is the harmonization index between NU and CET; α ,   β  are the parameters to be determined, α = β = 0.5 ; D is the coupling coordination degree. When the value of D increases, it reflects a subsequent increase in the degree of coordination between the two. On the contrary, if the D value decreases, it indicates a decrease in the degree of synergy between the two. Units: The units for both C and T are dimensionless, as they are indices or ratios. Therefore, the coupling coordination degree D is also dimensionless.
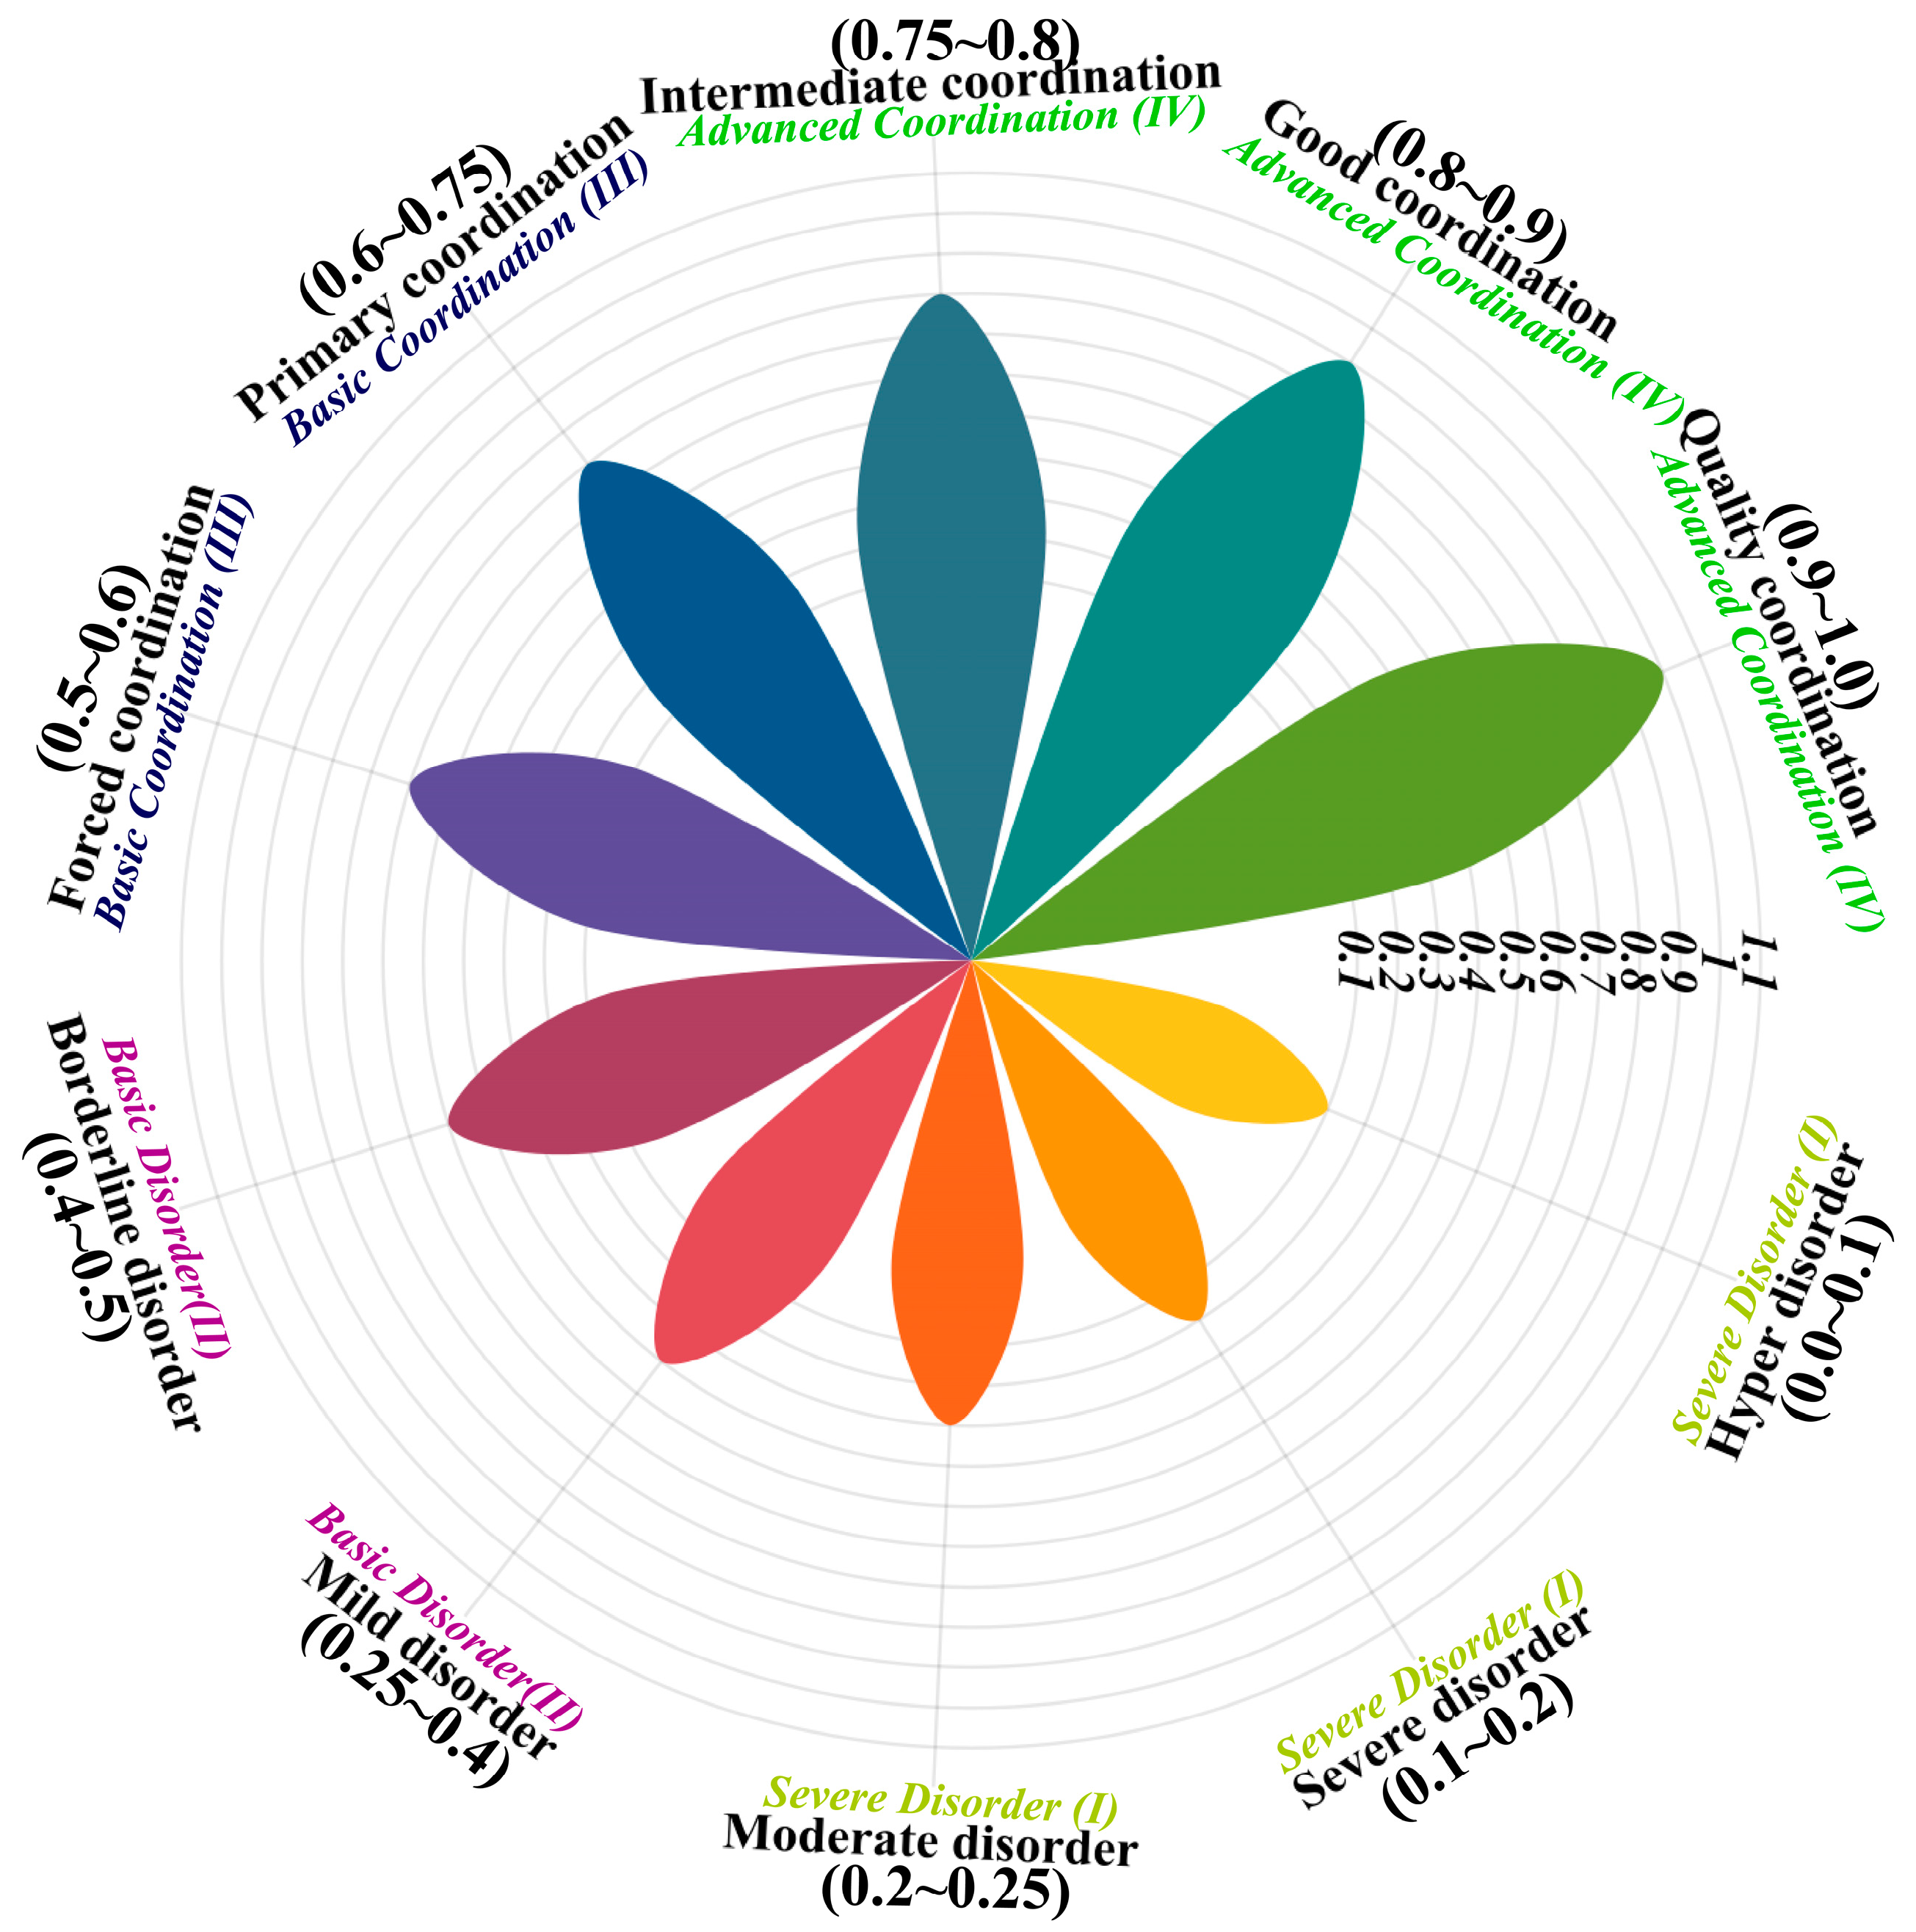
In this paper, we refer to the studies of Sun [61], which classify coupled coordination into four major categories: severe disorder, basic disorder, basic coordination, and advanced coordination (Figure 4).

2.2.2. Spatial Autocorrelation Model

A spatial autocorrelation model was chosen to evaluate the coupling coordination degree. It effectively reveals the spatial interdependence and local clustering characteristics of NU and CET [62].
The global spatial autocorrelation formula is
I = i = 1 n j = 1 n W i j y i y ¯ y j y ¯ S 2 i = 1 n j = 1 n W i j
S 2 = j = 1 n y j y ¯
where I denotes the Global Moran Index (GMI). The value range of GMI is [−1, 1]. If I > 0, it indicates that the NU and CET of each province show a positive spatial correlation on the whole. Provinces with stronger coupling coordination are often located near provinces with similarly high levels of coupling coordination. Conversely, provinces exhibiting weaker coupling coordination typically border provinces with similarly low coupling coordination. If I < 0, a negative spatial correlation is presented. This indicates that provinces with a higher coupling coordination degree often neighbor provinces with a lower coupling coordination degree, demonstrating a distinct and mutually exclusive spatial distribution. Wij denotes the spatial adjacency weight matrix, which is used to measure the adjacency between province i and j. If they share a boundary, Wij = 1. Conversely, if they do not share a boundary, Wij = 0; yi and yj denote the level of coupled harmonization of NU and CET in each province.
The specific formula for bivariate local spatial autocorrelation is as follows:
I = y i y ¯ s 2 j = 1 n W i j y j y ¯
where I’ denotes the Local Moran’s Index (LMI). The value range of LMI is [−1, 1]. All parameters are set as above.

2.2.3. SDM

In this paper, we not only explore the influence of NU within this province on the level of coupling coordination with its internal CET, but also further consider its potential impact on the CET coupling coordination degree in neighboring provinces. For this purpose, we chose the SDM, aiming to reveal the mechanism of this cross-regional spatial interaction more accurately [62,63]. The specific formula is
Y i t = ρ j = 1 n W i j Y j t + β X i t + θ j = 1 n W i j X j t + λ i + μ t + ε i t
where Yit denotes the coupled coordination of NU and CET in province i in year t; Wij denotes the spatial adjacency weight matrix, which is used to measure the adjacency between province i and j; Xit is the NU for province i in year t; β denotes the spatial autoregressive coefficient; ρ and θ are the parameters of the spatial lag term; λ i is the spatial fixed effects; μ t denotes the time fixed effects.

2.3. Study Area and Data Sources

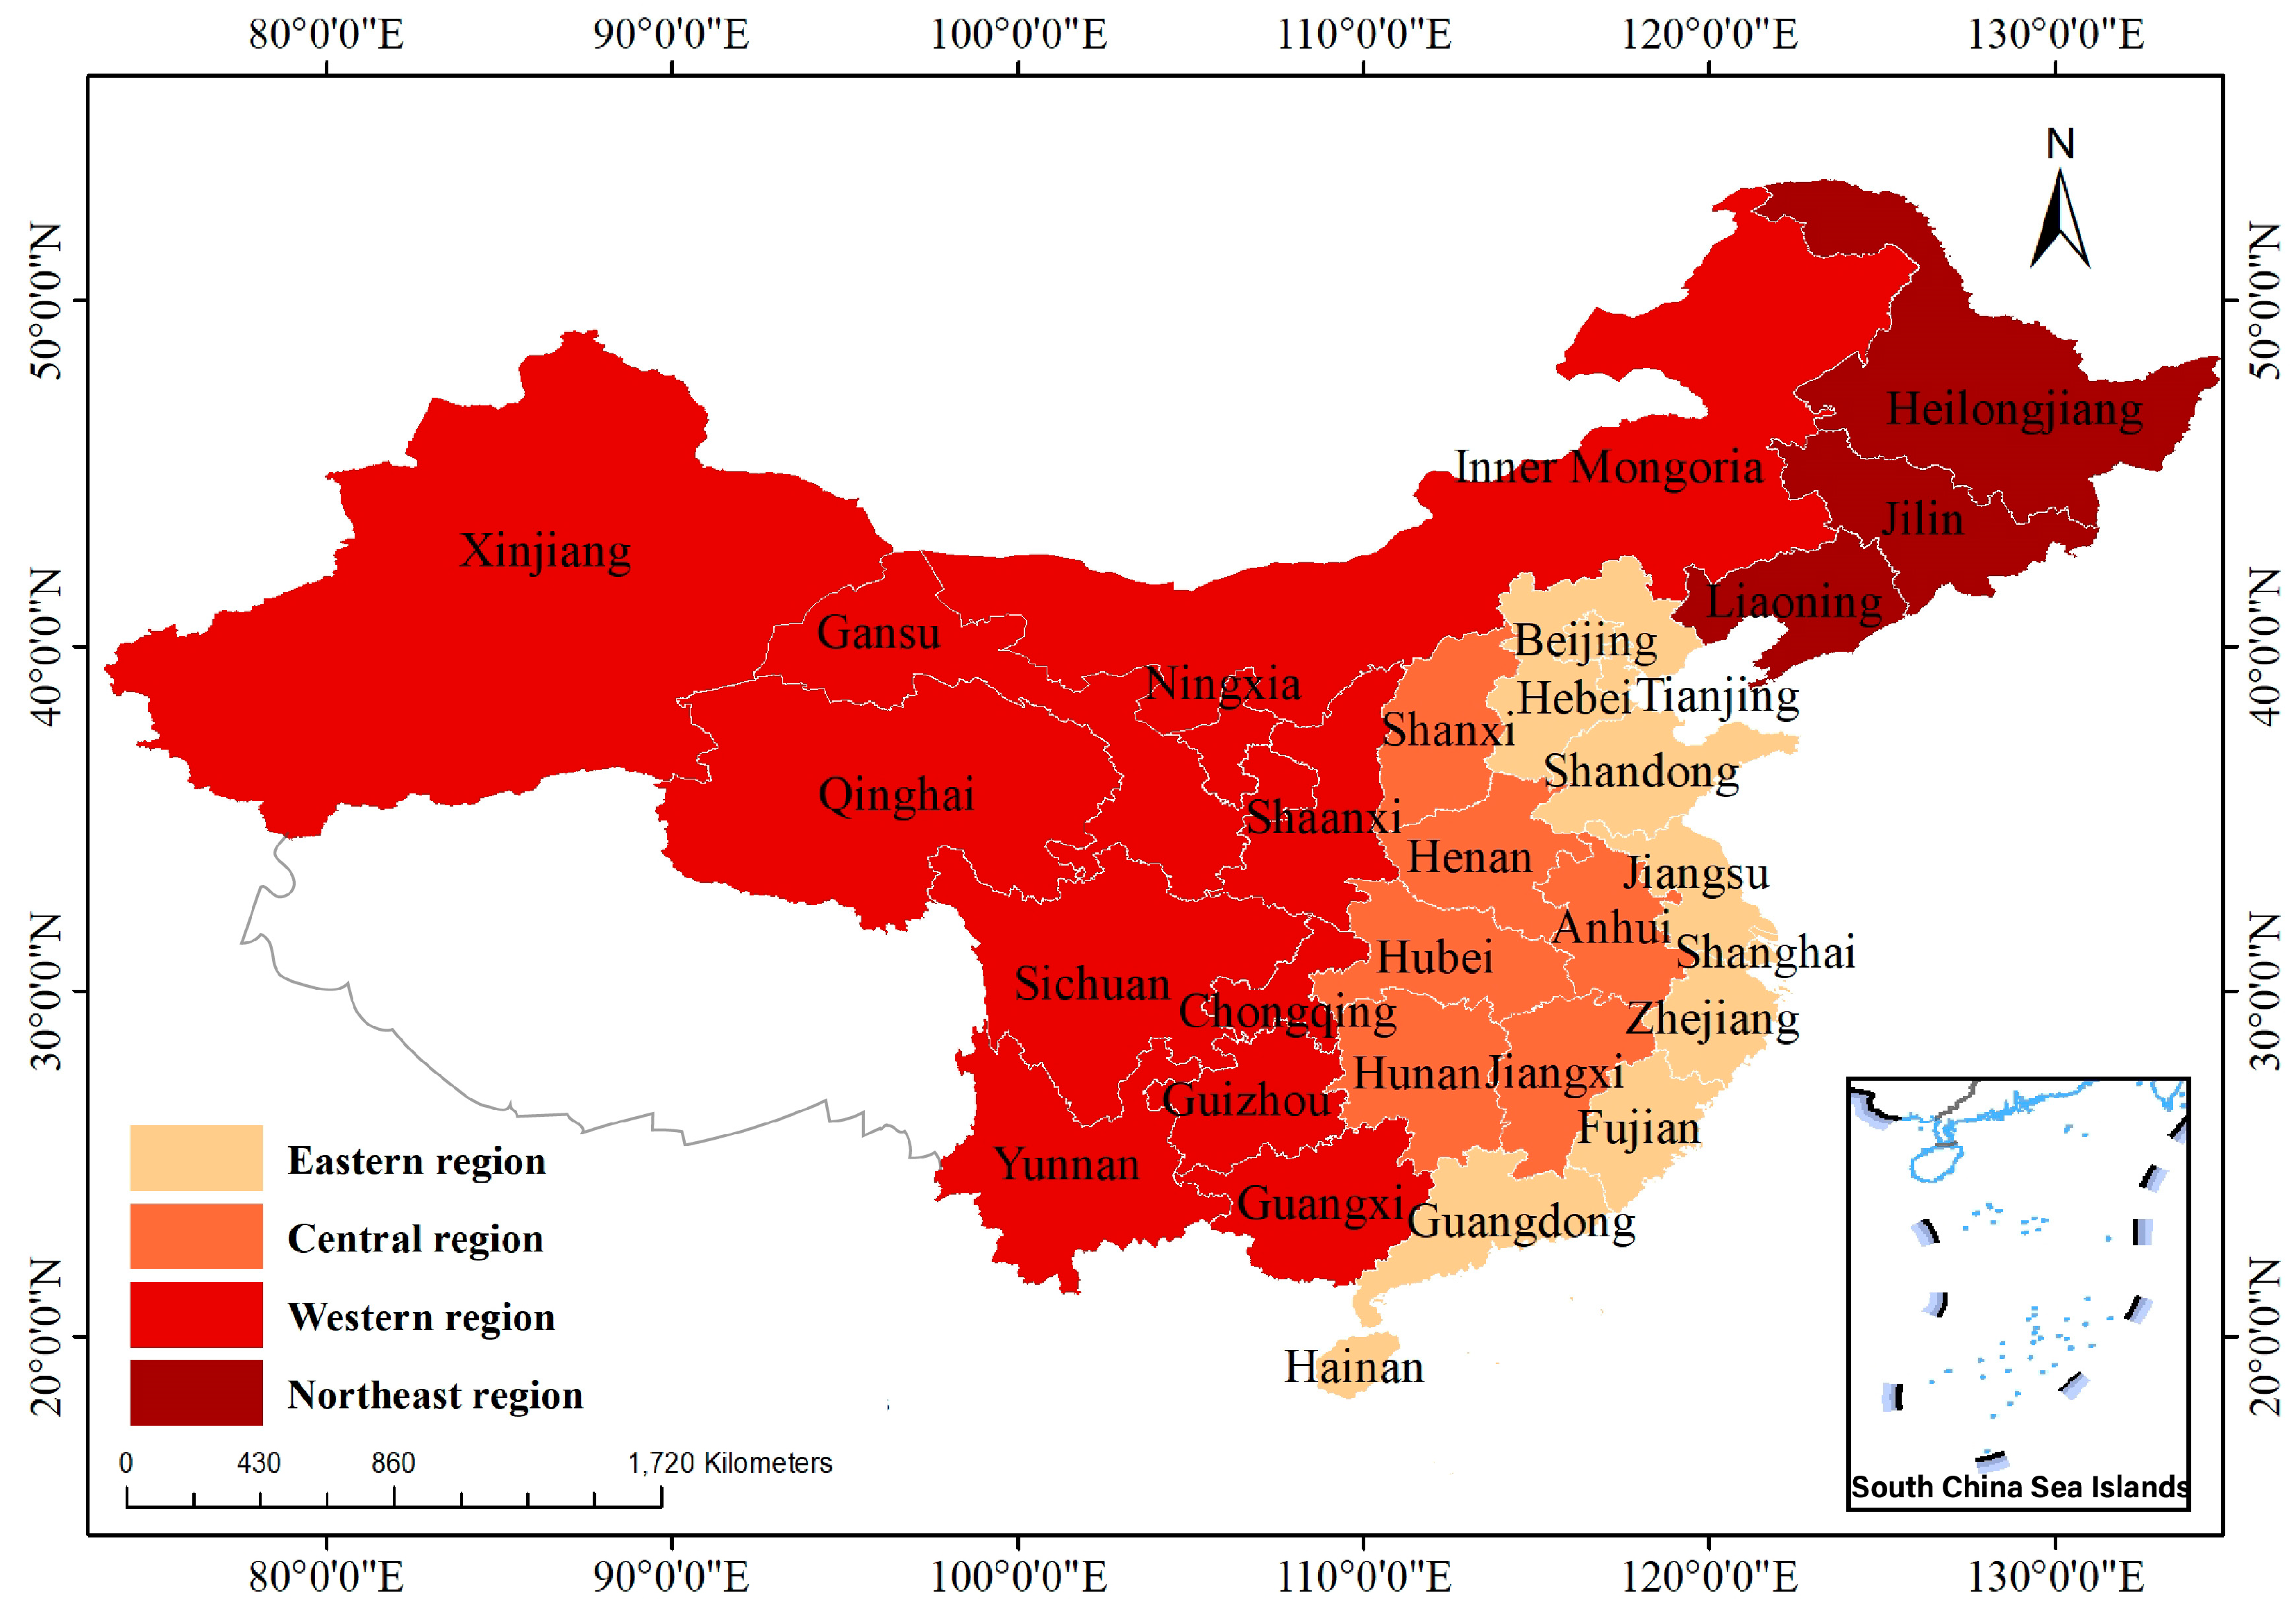
This study divides China into four main regions based on its geographical distribution: the Eastern Region (ER), the Central Region (CR), the Western Region (WR), and the Northeastern Region (NR). The study area excludes Hong Kong, Macau, Taiwan, and Tibet, as shown in Figure 5.
The data for the NU indicators are mainly from the China Statistical Yearbook (2004–2021), the China Regional Economic Statistics Yearbook, the China Urban Construction Statistics Yearbook, and the China Environmental Statistics Yearbook. The data for the CET indicators are mainly from the China Statistical Yearbook of Fixed Asset Investment, the China Transportation Yearbook, the China Energy Statistical Yearbook, and the China Labor Statistical Yearbook. In order to deal with missing values and outliers in the raw data, we took the following measures: Dealing with Missing Values: For partially missing indicator data, we used the mean interpolation method. That is, we fill in the missing values according to the average value of other related indicators in neighboring years or the same year. However, when there are more missing values or the data of neighboring years fluctuate greatly, we use linear interpolation. To ensure data quality, a data team was formed by three PhD students during the data preparation stage. Quality control measures such as cross-checking data validation were performed on the collected data to ensure the quality of the data.

3. Results and Discussion

3.1. Evolution of Spatio-Temporal Dynamics of NU

3.1.1. Trends in Chronological Evolution (NU)

Figure 6a illustrates the time evolution of the NU composite index from 2004 to 2021. Specifically, the NU index increases from 0.347 in 2004 to 0.543 in 2021, with a 56% increase. It shows a development trend of “slow development-rapid expansion-steady improvement”. This is the same as the result of Jiang [41] and Liu [64]. In the past, China’s economy mainly relied on resource consumption to achieve crude high-speed growth, which led to many problems and constrained the development of NU. The economy of each province is booming, thus significantly boosting the process of NU construction in each region. However, the NU of provinces has not yet left the crude development model. As a result, there is still a gap compared to developed countries. Figure 6b shows the temporal trends in different regions. Figure 6c shows the time trend of each province. Specifically, the ER has the highest NU index and the fastest growth rate, and is the only region among the four regions that exceed the national composite index; the NU index of the NR was higher than that of the CR in 2004–2012, while the CR counter-exceeds the NR in 2012–2021, and the growth rate of the NR has become slow; and the WR has the lowest index, and is very lagging in the process of urbanization. This is mainly due to the distinctive industrial composition of the regions, obvious differences in transportation facilities, deviations in policy support, and the wide gap in fiscal revenues among the regions. It leads to a huge gap in the NU of the four regions.

3.1.2. Analysis of Spatial Evolution Pattern (NU)

The NU showed significant spatial dynamics between 2004, 2008, 2012, 2016, and 2021, as shown in Figure 7. The highest NU indices in 2004 were in three provinces in the ER: Shanghai 0.524, Beijing 0.506, and Jiangsu 0.416. The lowest indices were in three provinces in the WR: Guizhou 0.242, Yunnan 0.248, and Gansu 0.282. In 2021, the NU of all provinces increased, with the indexes of the ER being higher than those of the WR and the NR.
From the point of view of spatial variation, because the ER has stronger economic strength, human resources, science and technology, and other resource advantages, its NU index is higher. This reflects the spatial development layout of NU in a “high east, low west” trend. Compared with 2004, the ER is still at a high level. Among them, Zhejiang province has the largest increase in NU level, as high as 27%. The next highest were 25.5% in Shanghai, 23.4% in Beijing, and 23.2% in Tianjin. Comparatively, the NU in the northeast is gradually slowing down. This is mainly attributed to its relatively homogeneous economic structure, serious brain drain, and gradual depletion of resources. These factors combine to constrain sustained economic growth, which in turn affects the improvement of NU levels. However, Yunnan and Guizhou had the smallest increase in NU levels, as low as 13%. Guangxi, Gansu, and Xinjiang have all increased by no more than 16%. This also reflects the fact that the WR is characterized by harsh natural conditions, insufficient resource endowment and a single industrial structure. The large size and sparse population of the provinces have also led to lagging economic development and affected the NU development process. As the country’s economic strength continues to grow, and thanks to a series of policies such as China’s New-type urbanization plan (2014–2020), it has been strongly supported. The economies of the provinces have been moving steadily forward, and the NU process has been accelerated. However, the NU level in the western and central regions typically falls behind that of the ER. This indicates that there are still some barriers and challenges to coordinating regional development. In order to break down these barriers, it is particularly important to conduct further in-depth studies on the state of spatial agglomeration and the degree of coordination among regions.

3.2. Evolution of Spatio-Temporal Dynamics of CET

3.2.1. Trends in Chronological Evolution (CET)

Based on the CET indicator system set in Figure 3. We conducted an in-depth data analysis using the advanced MaxDEA 8 Ultra software. We successfully measured the CET during the period from 2004 to 2021. Figure 8 visualizes the trend of CET in each province during this period. Figure 8a shows the time trend of CET from 0.300 in 2004 to 0.505 in 2021, which is a clear upward trend. As China strives to achieve its dual carbon goals, significant progress has been made in carbon emission reduction in the transportation sector. This remarkable achievement is mainly attributed to a series of environmental protection and sustainable development strategies that have been firmly implemented from the Tenth Five-Year Plan to the Thirteenth Five-Year Plan. These policies have not only promoted a significant increase in CET but also covered a wide range of specific actions. For example, this includes the following: actively encouraging technological innovation and fuel switching; optimizing the public transportation system to expand its coverage and improve service quality; and also encouraging and increasing research and development and support for intelligent transportation systems to achieve more efficient and environmentally friendly travel. However, our economy continues to grow along with our population. The ideal state of CET is indicated by a fraction of 1 in the super-efficiency SBM model, indicating the maximum efficiency value obtained (i.e., no waste and optimal carbon emission efficiency). As shown in Figure 8b, the nationwide average CET is 0.505 in 2021, implying that China’s transportation carbon emission efficiency is on average about 50% lower than the ideal state. This highlights the serious challenges facing emission reduction. We are required to further intensify our efforts to improve CET in order to cope with the increasing pressure to reduce emissions.
Specifically, the efficiency value of the ER is much higher, showing the trend of ER > CR > NR > WR. There are three main reasons for this: (1) the location advantage of the ER, the coastal area, and the well-developed water transportation; (2) the ER masters the customs office, which is conducive to the rapid transmission of goods and all kinds of information at a lower cost, and rapid economic growth has fueled a transportation boom; (3) the WR is characterized by deserts, the Gobi and rugged terrain. There is basically no water transportation. The backward development of highways, railroads and urban rail transportation has led to the region’s inaccessibility. Smaller cities, smaller populations, and low technological and innovation capabilities have led to slow economic development. Figure 8c shows the time trend of each province.

3.2.2. Analysis of Spatial Evolution Pattern (CET)

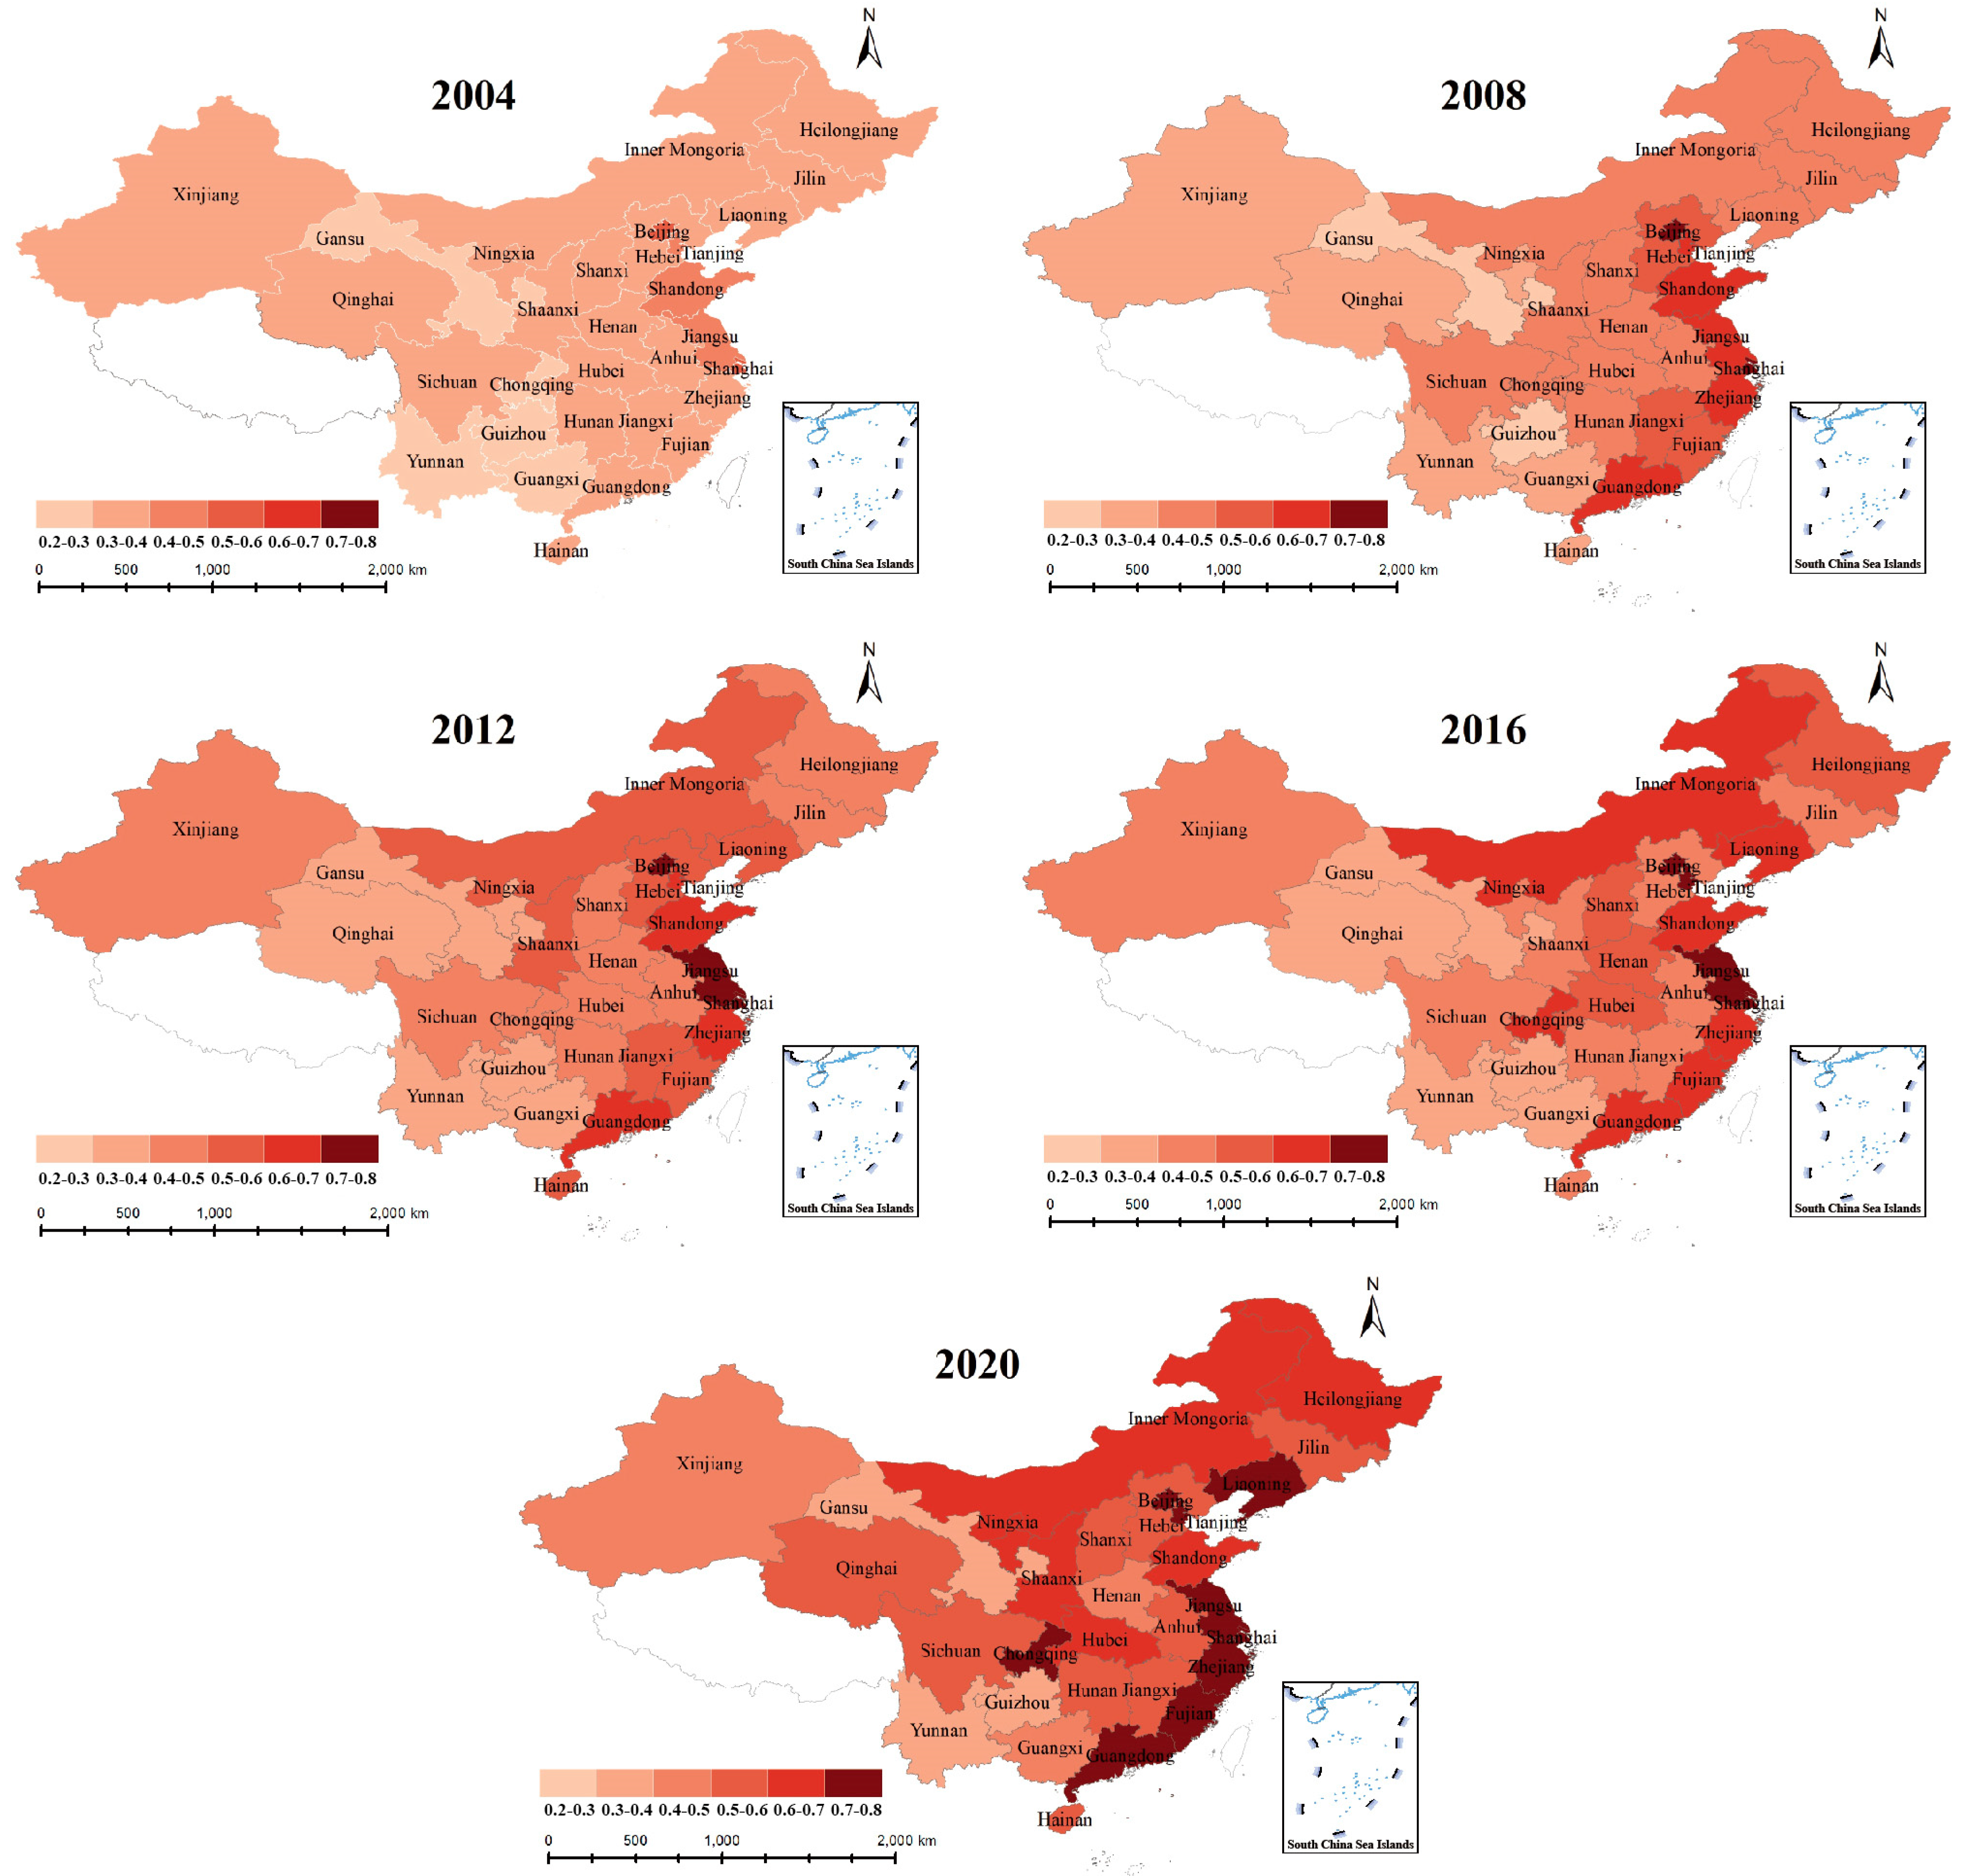
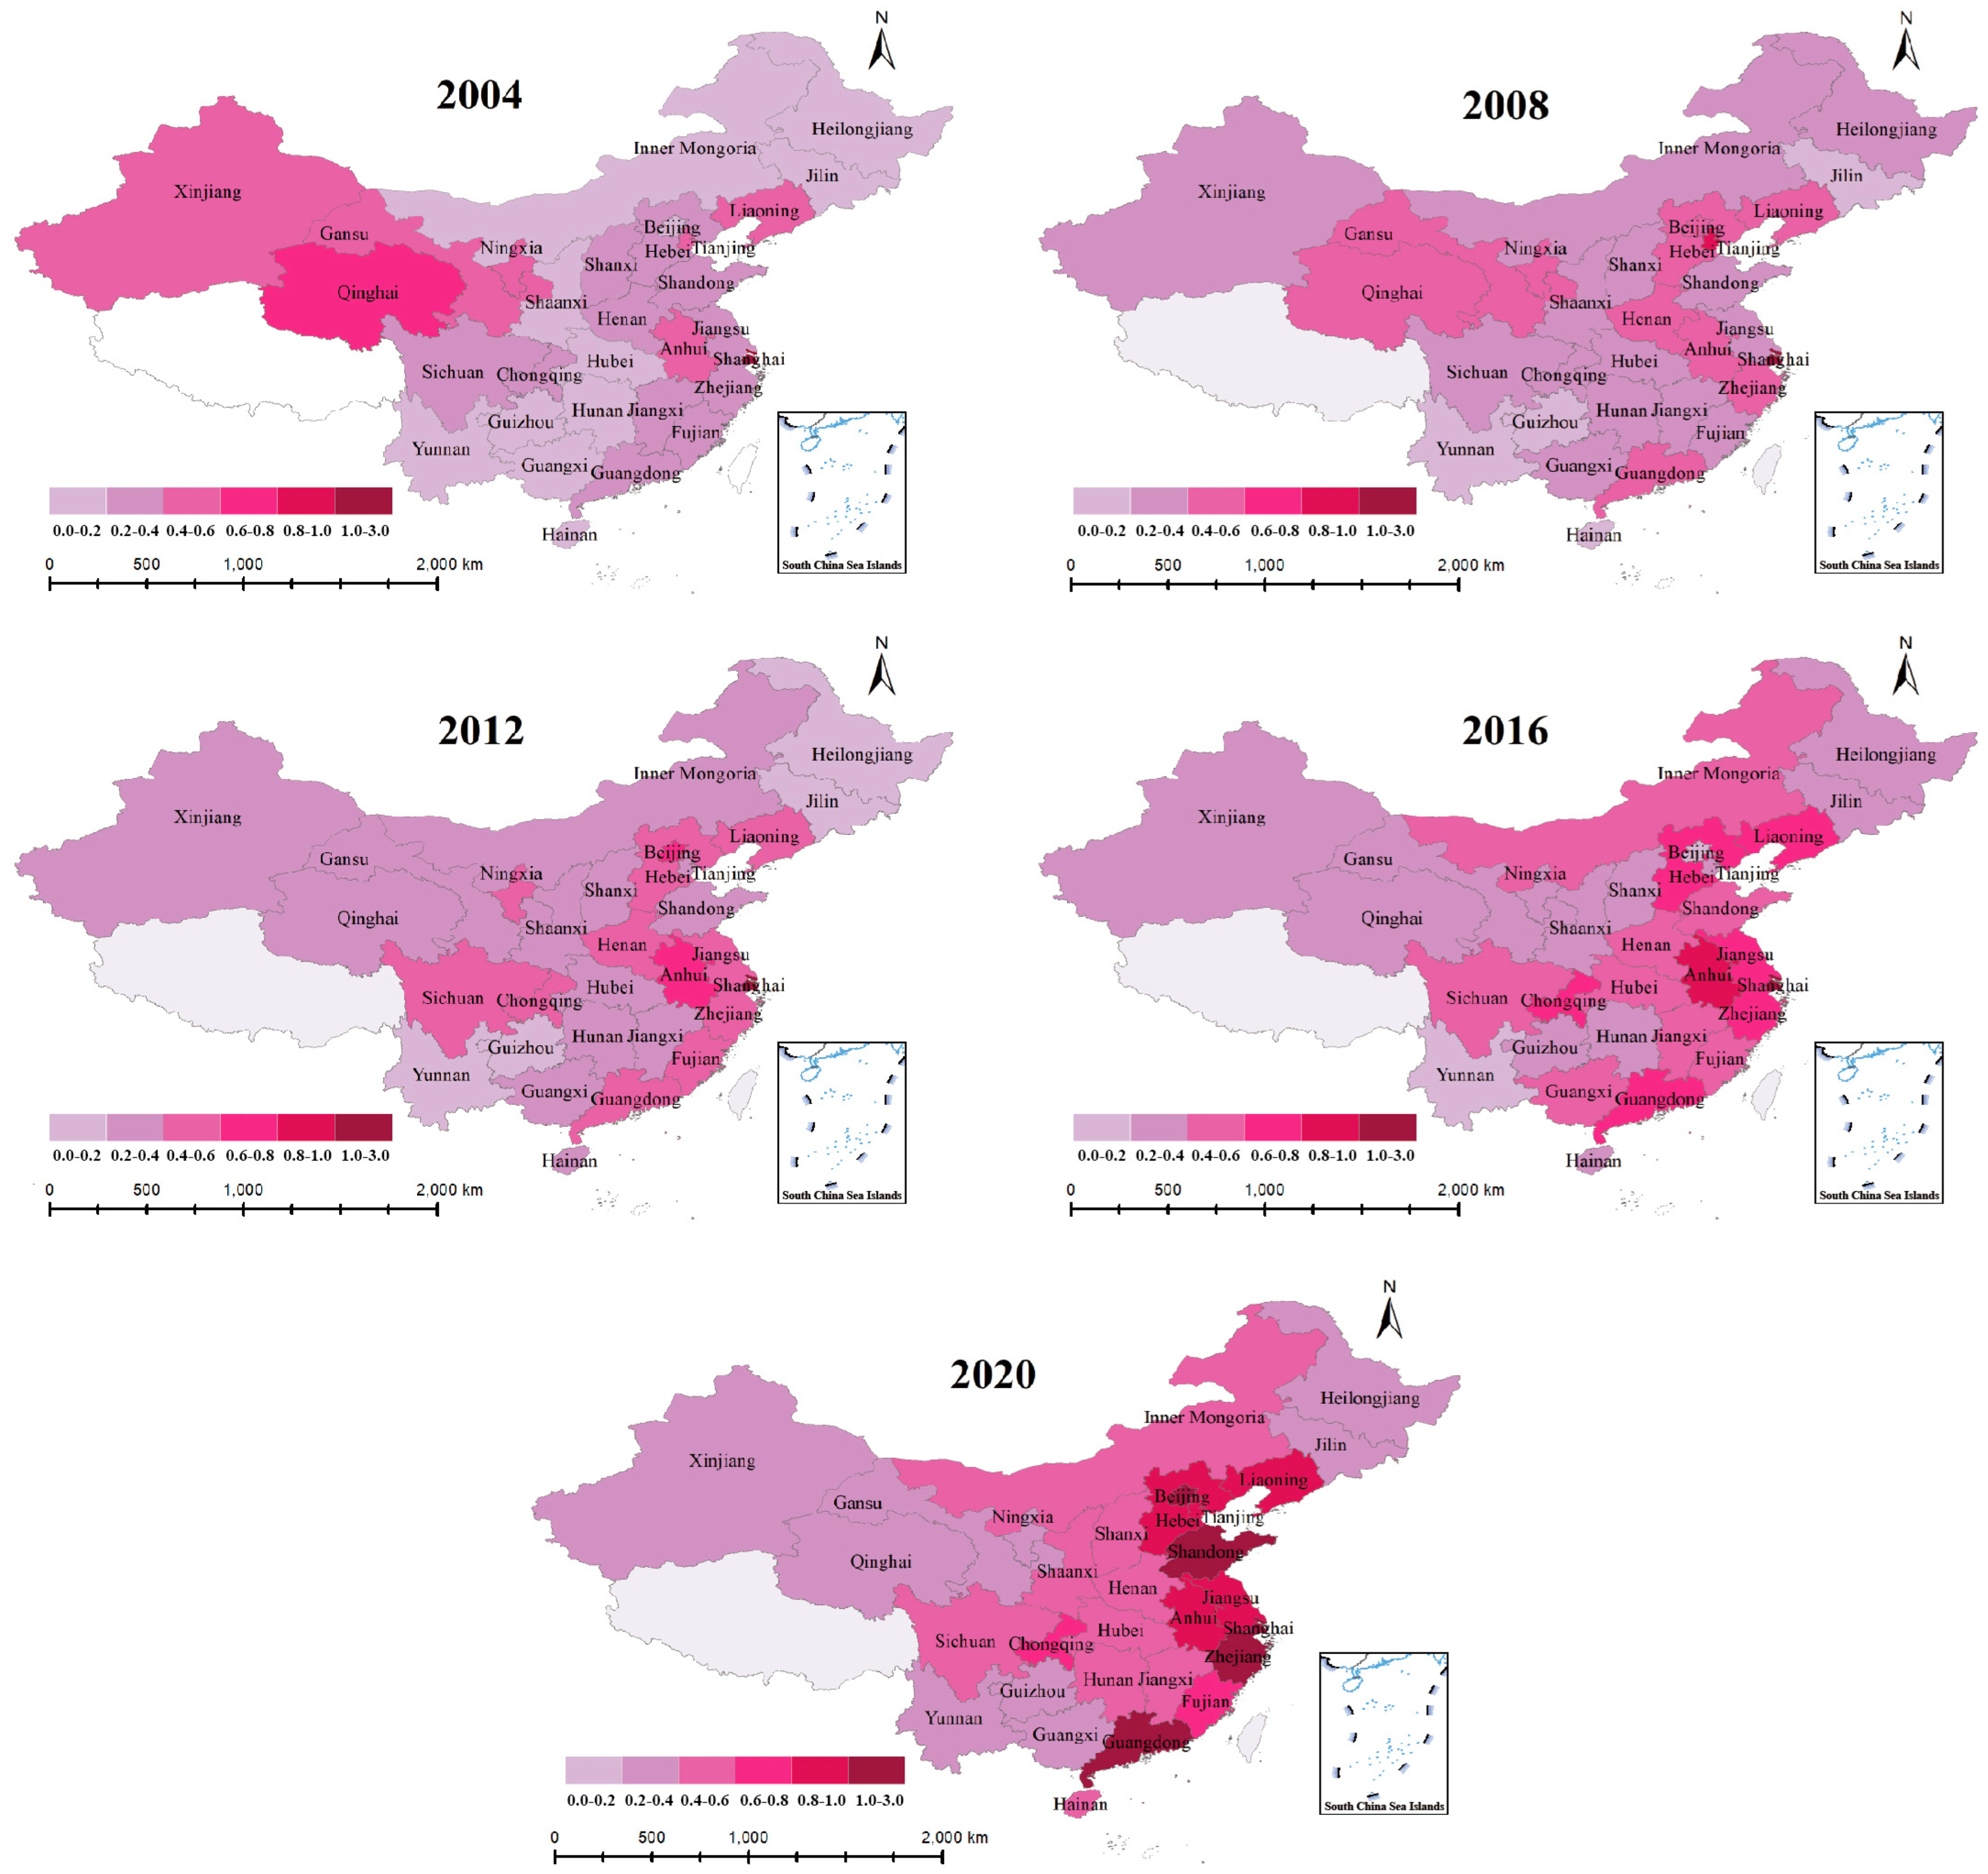
With the help of ArcGIS 10.8 software, five representative years, 2004, 2008, 2012, 2016, and 2021, were selected. A series of CET spatial distribution maps were drawn. These maps not only visualize the status of 30 provinces in China in terms of CET, but also clearly reflect the spatial dynamic changes of these provinces in the time series. As shown in Figure 9, the darker the color of the province shown on the map indicates that the province has a higher CET. The lighter the color, the lower the CET for that province.
In the 2021 CET assessment, Guangdong, Zhejiang, and Shanghai ranked among the top three, exhibiting the highest levels of efficiency. Beijing and Shandong follow with efficiency values above 1, reaching the optimal production frontier. Liaoning, Jiangsu, and Hebei also maintain an average efficiency value above 0.8, showing relatively high carbon emission management effectiveness. The outstanding performance of these regions in terms of carbon emission efficiency is primarily due to the level of economic advancement in the ER, along with a refined industrial structure, robust scientific and technological innovation abilities, comprehensive transportation amenities, and a well-connected transportation system. Nevertheless, it confronts the obstacle of undue strain on resources and the environment, with the CET in the CR typically hovering around 0.7. This is mainly due to the region’s abundant resources and favorable geographical location. However, compared with the ER, the scientific and technological innovation capacity and economic development level of the CR still needs to be improved. The NR is lagging behind in heavy industry due to a serious brain drain. Consequently, this has resulted in a progressive increase in the disparity of economic development levels across the region. This economic lag also directly puts the CET of Heilongjiang and Jilin provinces at a low level. However, Liaoning province is an exception, with a high CET of about 0.9. This is mainly due to Liaoning’s well-developed transportation network. It is also committed to building an international comprehensive transportation hub. The CET in the WR (Gansu, Ningxia, Qinghai, Xinjiang) is generally low. The average value is only between 0.2 and 0.4, with a gap of at least 60% from the optimal production frontier. The primary reasons for this are the scattered population, uniform industrial structure, and insufficient economic vitality in the WR. Together, these factors limit the improvement of CET. Compared to 2004, Guangdong province had the largest CET improvement, reaching 44%. This was followed by Liaoning province which reached 37%. Twenty-two provinces, including Tianjin, Hebei, and Shanxi, had smaller increases. However, six provinces such as Jiangsu, Fujian, and Chongqing decreased their CET. It may be related to its provinces’ transportation structure and underutilized capital investment. Generally speaking, China’s CET has a spatial distribution characteristic of “high in the east, low in the west, and better along the coast than inland”. Hence, enhancing CET in China holds immense importance in advancing green transportation progress and attaining sustainable development objectives.

3.3. Spatio-Temporal Dynamics of the Evolution of the Coupling Coordination Between NU and CET

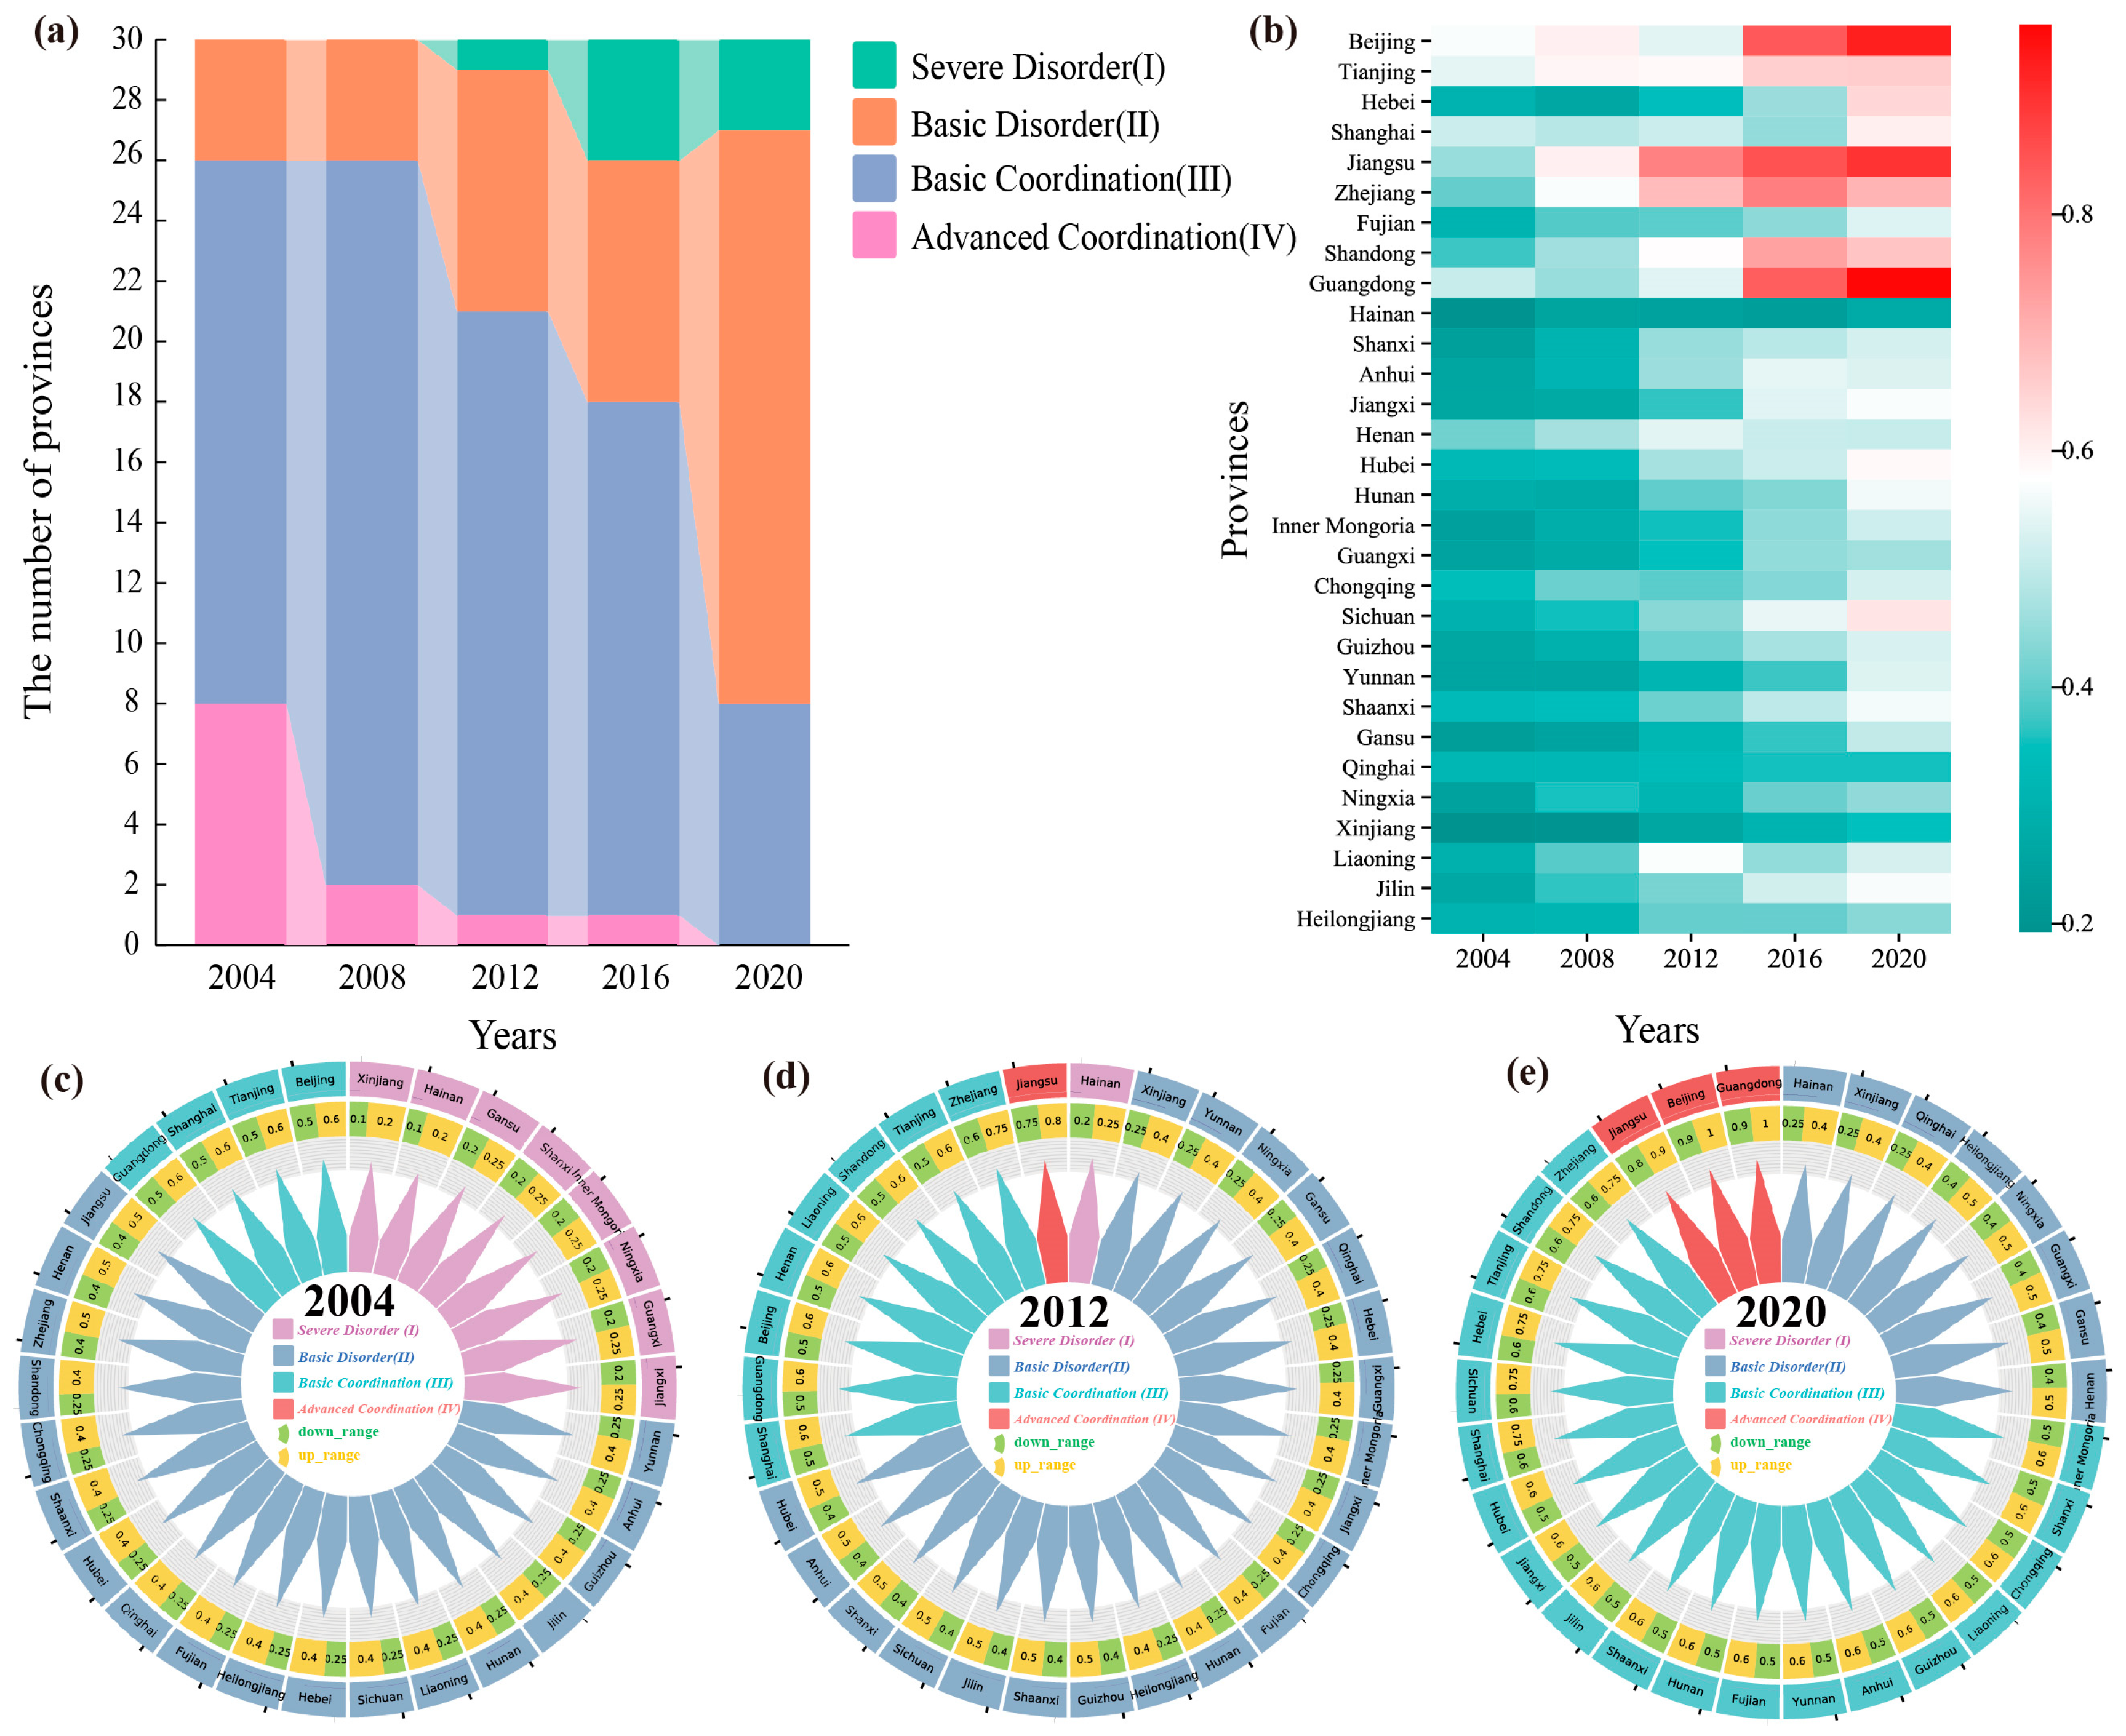
To assess and analyze coordinated development between NU and CET in 30 provinces during the period from 2004 to 2021, a CCDM was used for measurement. Through in-depth analysis of the resulting data, we further categorized the coordination levels and types of coordination between the two (Figure 10a).

3.3.1. Trends in Chronological Evolution (Coupling Coordination)

Figure 10b illustrates an accelerated upward trend in the coupled harmonization of NU and CET for the 30 provinces. Figure 10c–e show the type of coupling coordination in 30 provinces. Although the coupling coordination between NU and CET has moved from basic dysfunction to basic coordination. It shows an overall improvement in the coordination between the two. However, we still need to recognize that the current state is still a certain gap from the advanced coordination level. Thus, guided by the “dual-carbon” goal, our foremost task remains to foster the integrated and harmonious advancement of NU and CET. We must continue to deepen our research and seek more effective strategies to achieve a higher level of coordination between the two, so as to make a greater contribution to the realization of the “dual-carbon” goal. From the temporal dimension, significant provincial disparities in the coupling coordination degree between NU and CET were observed in China in 2004. Specifically, Hainan province had the lowest coupling degree of 0.198, while Beijing reached a relatively high level of 0.570. In that year, eight provinces reached Level I; eighteen provinces were at Level II; only four provinces (Beijing, Tianjin, Shanghai, and Guangdong) were at Level III; and no province had yet appeared to be at Level IV in that year. This distribution pattern reflects the different levels and stages of NU and CET harmonization among Chinese provinces at that time. Overall, the coupling and coordination of NU and CET is generally out of sync in all provinces. On the contrary, in 2021, the coupling degree of each province ranged from 0.270 (Hainan) to 0.961 (Guangdong), of which there were 0 provinces at Level I; 8 provinces at Level II; 19 provinces at Level III; and 3 provinces at Level IV (Beijing, Jiangsu and Guangdong). Overall, provinces generally jumped to a state of basic harmonization. This indicates a stable and positive trend. The two are well synchronized and integrated on the path of high-quality development. This reflects the effective implementation of policies and bodes well for the future prospects of sustainable development.

3.3.2. Analysis of Spatial Evolution Pattern (Coupling Coordination)

To visualize the spatial distribution of the coupling coordination between NU and CET across 30 provinces, we used ArcGIS 10.8 to spatially visualize the data in 2004, 2012, and 2021, as shown in Figure 11. The coupled and coordinated development exhibits distinct regional disparities. The distribution pattern of ER > CR > NR > WR is specifically manifested. To some extent, this distribution pattern positively correlates with the economic development level of each province. The ER has taken the lead in the coupled and coordinated development of NU and CET by virtue of its policy advantages. China’s long-standing regional development strategy has prioritized support for eastern coastal cities, followed by gradual radiation to CR and WR. With the increasing economic vitality, the ER has continued to strengthen the construction of public transportation and comprehensive transportation system with policy support, thus promoting the continuous growth of its coupling coordination. In contrast, the CR has not enjoyed the early development dividends of the ER, nor has it received the new policy support that the WR has received. The relatively limited area and resources of the CR and the lack of mature urban agglomerations have led to a relative lag in the degree of coordination of its coupling. The WR lags behind in industrial development due to relatively little policy support and less optimized resource allocation. The development of urban public transportation system is relatively weak, mostly presenting low-quality aggregation state, which in turn affects the enhancement of its coupling coordination. The situation in the NR is more complex. Due to the economic structure favoring heavy industry, serious population loss, insufficient scientific and technological innovation. It is difficult to implement the concept of green ecological development. Despite the abundance of natural resources, the allocation of resources is unreasonable. The construction of transportation infrastructure is relatively lagging behind and lacks sufficient financial and policy support. This has led to its slow economic development and low coupling coordination. In 2004, there was no Level IV in the country. Beijing, Tianjin, Shanghai, and Guangdong reached Level III. Seventeen provinces, including Hebei, Shandong, Anhui, and Zhejiang, were at Level II. Nine provinces, including Xinjiang, Inner Mongolia, and Guangxi, were at Level I. In 2021, provinces as a whole improved significantly, with three additional Level IV provinces (Beijing, Jiangsu, and Guangdong). At the same time, 14 provinces made a qualitative leap from Level II to Level III. The number of Level III provinces increased to 19. Five provinces, including Xinjiang, Qinghai and Ningxia, have also made the leap from Level II to Level III, bringing the number of Level II provinces to eight. There are no more Level I provinces in the country. Although most of the current provinces have reached Level III or Level IV. However, it is worth noting that regions such as Xinjiang, Shanxi, Inner Mongolia, Ningxia, and Gansu have long been underperforming in this area, and their coordination has continued to be at a low level. These regions may become potential barriers to constraining the NU and CET.

3.4. Spatial Autocorrelation Test of NU and CET

3.4.1. Global Autocorrelation

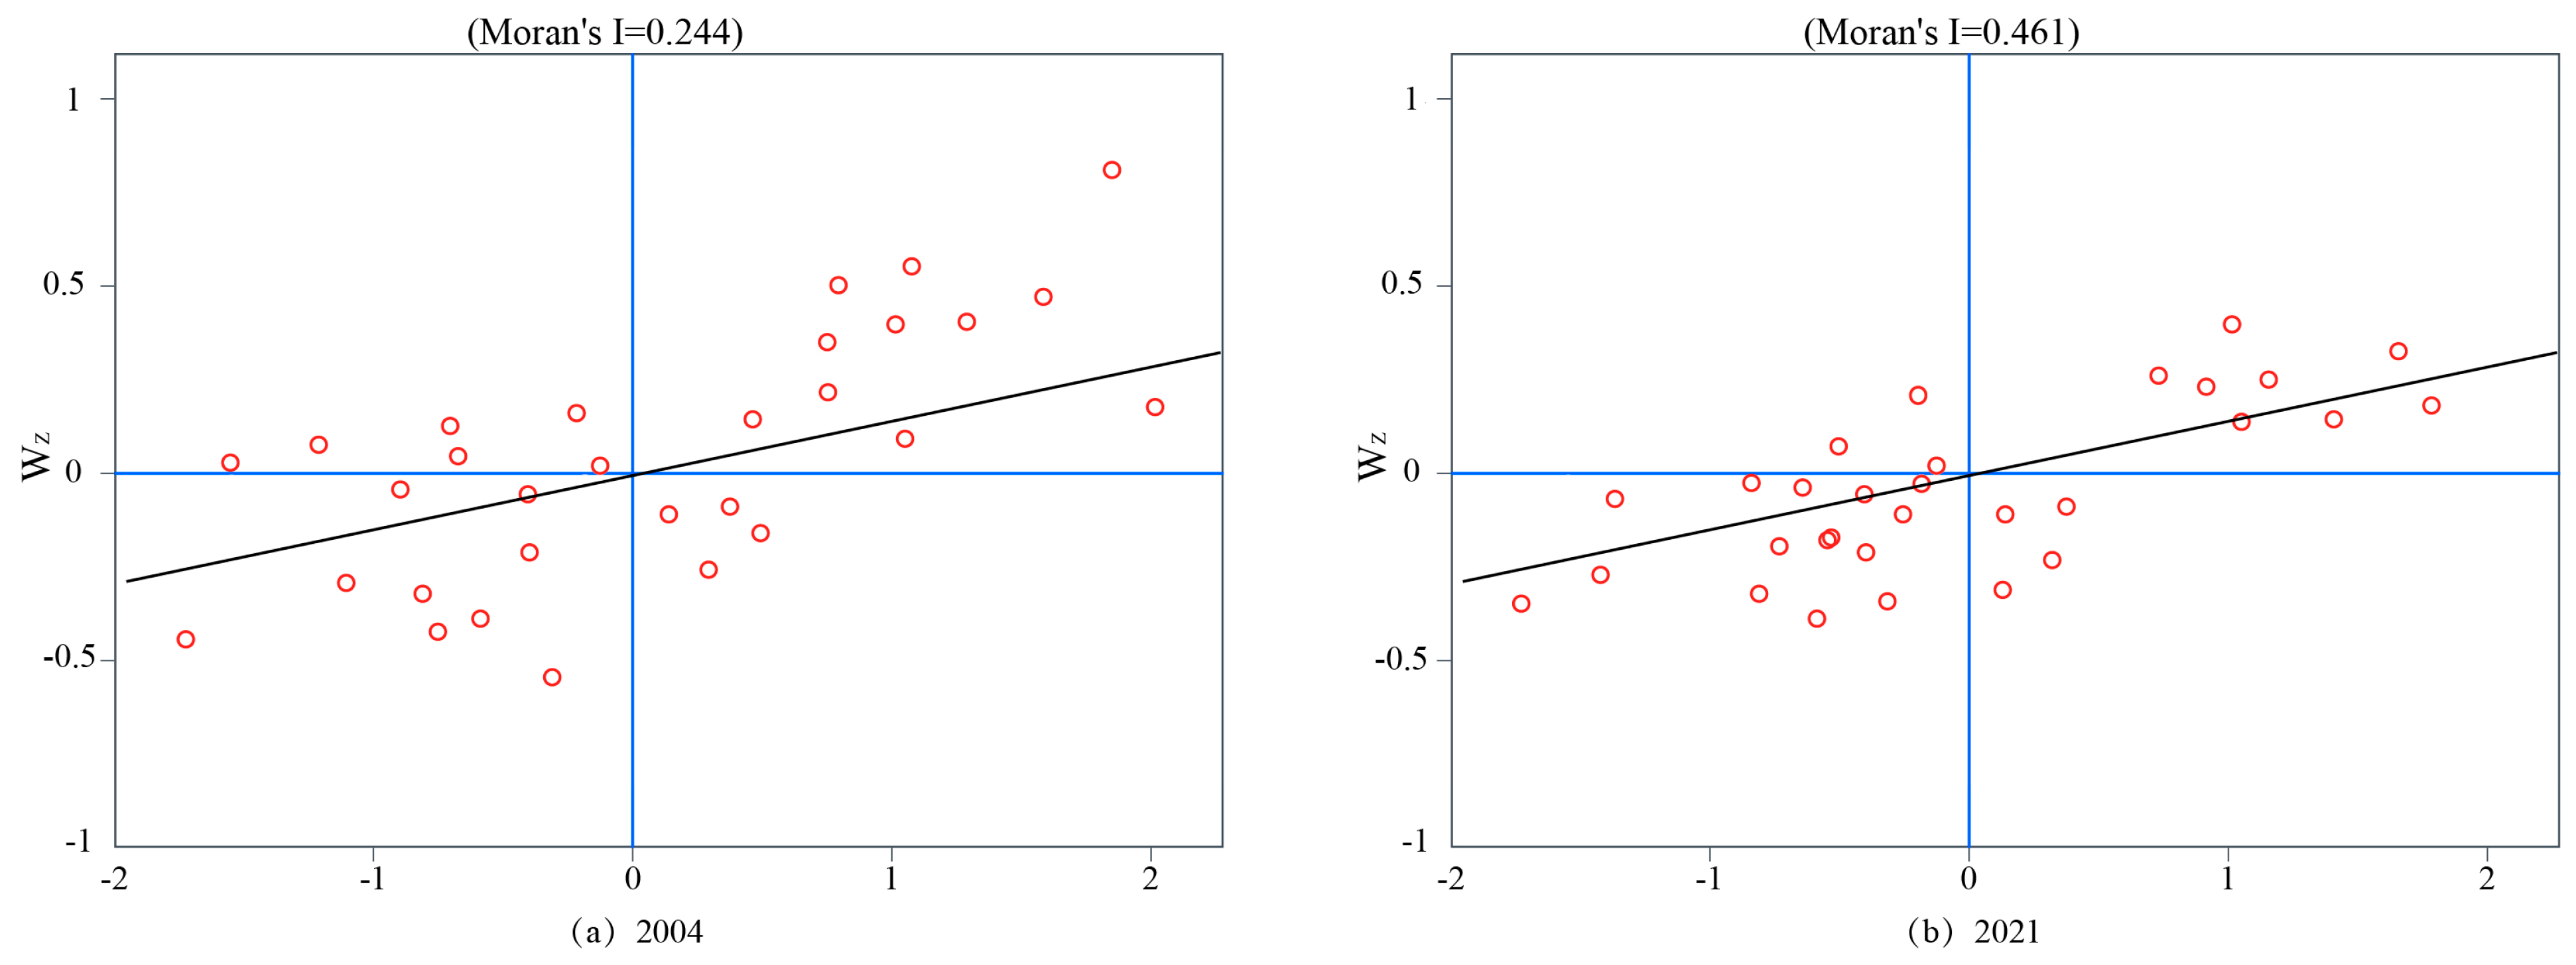
The GMI was analyzed for the coupling coordination between NU and CET between 2004 and 2021 using Stata 17.0 software, as shown in Table 3. The findings indicate that the GMI exceeded 0 over the studied period. The specific values fluctuated in the range of 0.244 to 0.463. And the GMI for each year passed the 1% significance level test. This finding suggests that the increase or decrease in the coupled coordination of NU and CET in each province is not only affected by its own factors, but also by the influence of neighboring regions. A significant spatial clustering distribution pattern is formed.

3.4.2. Local Autocorrelation

Through the validation of the GMI, we learn that the 30 provinces as a whole are characterized by significant positive spatial agglomeration distribution. The GMI reveals the overall spatial correlation though. However, it cannot reveal in detail the specific spatial correlations within provinces and between provinces and neighboring provinces. To further analyze the local characteristics of this spatial correlation, we plotted a local Moran scatterplot using Stata 17.0 software, as shown in Figure 12. This plot can visualize the local spatial relationship between each province and its neighboring provinces in terms of NU and CET coupling coordination. It helps us to identify areas of spatial clustering with high or low values, and also possible spatial heterogeneity. Through the analysis of the local Moran scatterplot, we can have a deeper understanding of the spatial distribution pattern of each province and its formation mechanism. As shown in the diagram, the majority of provinces in both 2004 and 2021 are mainly distributed in the first and third quadrants, i.e., the “High-High” and “Low-Low” quadrants. In 2004, the ER and CR showed mostly H-H agglomerations (Beijing, Guangdong, Shanghai, and 11 other provinces), while the WR was mostly L-L agglomerations (Inner Mongolia, Ningxia, and nine other provinces). By 2021, H-H agglomeration decreases to 8 provinces (Beijing, Guangdong, etc.), while L-L agglomeration expands to 15 provinces (Shaanxi, Chongqing, etc.). The H-H agglomeration area relies on a perfect economic development system and a rapid NU process. It promotes the enhancement of CET. A high level of coupling coordination was achieved, demonstrating prominent spatial agglomeration traits. And the L-L agglomeration areas are mainly concentrated in the WR. These areas are constrained by multiple factors such as poor natural conditions, insufficient resource endowment and single industrial structure. It makes the NU process slow, the development of transportation industry lags behind, and the CET is low, resulting in relatively low coupling coordination. Although the State has proposed a new western development strategy, further efforts are needed to overcome these challenges.

3.5. Spatial Spillover Effects of Coupled Harmonization

3.5.1. Model Testing and Estimation Results

After analyzing the Moran’s I index, we found that the coupling coordination degree between NU and CET exhibits a significant positive spatial clustering feature overall. Given this characteristic, we employed the Stata 17.0 software to perform some tests to determine the most appropriate spatial econometric model. Table 4 provides a detailed listing of the model’s test and estimation results. Firstly, we conducted the LM test and its robust, both of which passed the significance test, tending to favor the spatial Durbin model (SDM) as our preferred analysis method. Secondly, through the LR (SLM) and Wald (SLM) tests, we obtained statistics of 65.959 and 69.259, further strengthening the advantage of the SDM. Meanwhile, the LR (SEM) and Wald (SEM) tests also yielded statistics of 65.029 and 67.699, significant at the 1% level, confirming the SDM’s superiority over the Spatial Error Model (SEM). Next, the Hausman test pointed to a fixed-effects SDM. To determine the type of fixed effects more precisely, we conducted a joint significance LR test for time-fixed effects and spatial-fixed effects. The results show that, considering both temporal and spatial factors, we should select the dual fixed-effects SDM as the final analytical tool.

3.5.2. Analysis of Regression Results

According to the regression results in Table 5, factors such as LS, TEI, IS, and STI have a positive and significant contribution to the coupled and coordinated development of NU and CET. The role of INC and GOV is insignificant.
(1) The effect of INC on the development of coupled harmonization is positive, but the coefficient does not pass the significance test. Although INC improves, the imbalance in income distribution may lead to unequal distribution of resources. Meanwhile, as the NU process continues to accelerate, it increases the demand for transportation. But transportation infrastructure development cannot keep pace with the growth in demand. It may lead to traffic congestion and make CET lower. With the increase in INC, there is a lack of environmental policies or poor implementation of environmental policies. This can lead to increased vehicle use and ineffective control of energy consumption. This affects coupled and coordinated development. (2) The LS has a significant negative effect. With the process of rapid NU, the labor force is shifting from agriculture to secondary and tertiary industries, especially in infrastructure areas such as construction and transportation. If the adjustment of industrial structure fails to follow in time. It may lead to excessive concentration of labor in industries with high carbon intensity. The demand for labor in these fields may contradict the goal of low-carbon development. As a result, there is also a negative impact. Meanwhile, in some economically less developed regions, the labor force may be more inclined to flow to traditional high energy consumption and high emission industries. It is also not conducive to the coordinated development of the two. (3) The TEI has a significant positive effect. Reducing transportation energy intensity leads to decreased energy consumption. This increases energy utilization efficiency and helps to reduce negative environmental impacts. Firstly, technological advancements and industrial upgrading frequently accompany the decrease in TEI. Through the introduction of advanced transportation technology and equipment and the optimization of transportation organization and management, the efficiency and competitiveness can be improved. Advance the transportation industry’s progress towards being environmentally friendly, low in carbon emissions, and highly efficient. This is essential for coupled and coordinated development. Secondly, by reducing transportation energy intensity. It can reduce traffic congestion in towns and cities and reduce air and noise pollution. (4) The IS is significantly positive at the 5% level. Firstly, the optimization of the industrial structure has led to the emergence of new industries and facilitated the transformation and upgrading of traditional industries. The accelerated growth of the service and high-tech industries has resulted in increased job opportunities, drawing people to urban areas and promoting the development of NU. At the same time, with the increase in urban population and the expansion of consumer demand, the influence of market demand on industrial structure has become increasingly significant. It facilitates the refinement and improvement of the industrial structure. Secondly, the optimization of industrial structure can promote the development of the transportation industry in the direction of more efficient and more environmentally friendly. As the proportion of primary and secondary industries decreases and the proportion of the tertiary industry increases, it makes more resources tilted to more efficient and more environmentally friendly modes of transportation, thus enhancing CET. Ultimately, it promotes the coupled and coordinated development. (5) The STI is significantly positive at the 10% level. The STI has provided NU with the possibility of green development. For example, the development and utilization of renewable energy sources and the enhancement of energy storage technology provide more environmentally friendly energy solutions for urbanization. Meanwhile, the application of intelligent transportation management systems, vehicle networking technology, etc., reduces traffic congestion and vehicle idling phenomenon and greatly improves CET and energy utilization efficiency, especially the popularity of electric vehicles, compared with traditional fuel vehicles. Electric vehicles have the advantage of zero emission, which effectively improves CET. The advantages of STI are not only reflected in the economic benefits. It is also reflected in the environmental benefits. It provides strong support for the sustainable development of NU and CET. (6) The GOV has a positive promotion effect. There is often a lag in the formulation and implementation of government intervention policies. It is not able to respond in a timely manner to rapidly changing NU and transportation developments. And government intervention may involve the reallocation of resources. But if there are efficiency problems in the process of resource allocation, such as resource waste and mismatch, it may weaken the positive impact of the policy. At the same time, if the government intervention is excessive or inappropriate, it may destroy the normal operation of the market mechanism. This results in the inability to optimize the allocation of resources, which then affects the coupling coordination degree of NU and CET.

3.5.3. Decomposition of Spatial Spillover Effect

To more accurately understand and quantify the marginal effects of the coupled coordination degree of NU and CET, and thus provide a more detailed basis for policy formulation and resource optimization, we analyze the spatial spillover effects by subdividing them into direct and indirect effects, as shown in Table 6. The direct effect reveals the direct impact of local policy adjustments and changes in conditions in the region. Indirect effects, on the other hand, show how changes in one region spill over and affect neighboring regions. By breaking down these two effects in detail, we are able to understand the specific direction and intensity of different factors in the region as well as in neighboring regions. This helps policymakers to implement effective strategies locally. It also promotes synergistic development among regions to realize the improvement of overall CET and inter-regional harmony.
In terms of direct effect, the coefficient of INC is positive but fails the significance test. It suggests that an increase in INC leads to an increase in consumption capacity, which in turn contributes to an increase in transportation demand. However, the impact of this upgrading of consumption patterns on CET is complex. Higher-income households may be more inclined to use private cars, which would reduce CET, making the direct effect insignificant. They may also be more willing to use low-carbon modes of travel, e.g., public transportation or electric vehicles. This can help to increase the CET, which in turn promotes coupled and coordinated development. The coefficient of LS is significantly negative. The NU rate usually rises as the labor force shifts from agriculture to industry and services. This shift leads to an increase in urban population. This in turn increases the demand for transportation services, which directly contributes to the development of the transportation industry. This can lead to a decrease in CET, which is not conducive to the development of the coupling and coordination of the two. The coefficient of TEI is significantly positive. Improving energy efficiency, promoting clean energy, optimizing public transportation systems, and developing intelligent traffic management technologies can lead to a reduction in carbon emissions. In turn, CET will be improved to make it more coordinated with the NU process. The coefficients of IS and STI are significantly positive. It shows that IS, if shifted to low energy consumption and low-emission industries, will lead to a reduction in overall energy consumption and carbon emission. This shift can improve the efficiency of resource allocation and enhance CET, which in turn positively affects the coupling coordination degree. The STI can promote the progress of energy utilization technology and improve the efficiency of energy utilization. Simultaneously, as clean energy technology advances, the use of renewable energy sources like solar and wind power in transportation is becoming increasingly common, aiding in the enhancement of CET. The coefficient of GOV is positive. It indicates that the government may promote clean energy, encourage low-carbon transportation, and optimize transportation planning. It may also promote green development, which in turn enhances CET. Nonetheless, various factors often influence the effectiveness of government interventions, such as the strength of policy implementation, the market environment, and the level of technology. These factors may lead to uncertainty in policy effects, making the direct impact insignificant.
In terms of indirect effects, the spillover effects of INC, STI, and GOV on neighboring provinces are not significant. It suggests that there are differences in development speed, industrial structure, and resource allocation due to different provinces in the NU process. This imbalance may lead to the insignificant impact of coupled and coordinated development in one province on neighboring provinces. High-income regions may have achieved low-carbon development through, for example, technological innovation, but neighboring provinces may not have benefited fully due to lagging development. It may also be due to the fact that the diffusion and application of technological innovations require certain time and conditions. Its spatial spillover effect is limited and cannot significantly affect the CET of neighboring provinces. At the same time, there may be lags and inconsistencies in policy formulation and implementation. This leads to insufficiently close cooperation between regions. LS and IS are significantly positive. It indicates that the labor force flows from low-efficiency and high-emission industries to high-efficiency and low-emission industries. This flow pattern may lead to the transformation and upgrading of related industries in neighboring provinces. When labor flows to neighboring provinces, advanced technology and management experience are spread. Meanwhile, when the LS of a province is optimized, its related industries may also be developed. This in turn creates industrial linkages and complementary effects with neighboring provinces. It facilitates the attainment of optimal resource allocation and efficient utilization, thereby enhancing the CET of the entire region. The TEI coefficient is significantly negative. It indicates that as the NU process accelerates, although the increase in transportation energy intensity in a province will directly lead to a decrease in CET. However, this change may prompt the province to seek technological advances to improve energy use efficiency. It may spill over to neighboring provinces through labor mobility, commodity trade, and technology transfer. Thus, the energy use efficiency of neighboring provinces will be increased and CET will be enhanced.

3.5.4. Robustness Test

To deeply verify the robustness of the spatial effect of the coupled coordination of NU and CET. As shown in Table 7, we took two approaches to re-test the original empirical results: firstly, replacing the economic distance weight matrix as the new spatial weight matrix (column 3); secondly, lagging the influencing factors by one period of treatment (column 4). In this way, a more comprehensive and robust basis is provided. After further robustness, the results show that the absolute value of each regression coefficient in the third column has increased compared to the previous one, while the absolute value of each regression coefficient in the fourth column has decreased. Nevertheless, neither method changed the significance and direction of the original regression results, thus verifying the robustness of the main regression results. This suggests that regardless of which spatial weight matrix is used or whether the influencing factors are lagged, the coupled coordination degree relationship between NU and CET maintains consistency and reliability.

4. Conclusions and Future Works

4.1. Conclusions

This study reveals critical spatio-temporal disparities and mechanistic insights into the coupling coordination between China’s NU (NU) and transportation carbon emission efficiency (CET). Key findings and their implications are summarized as follows:
  • Analysis of regional differences and evolutionary trends: The spatial pattern of NU (NU) and carbon emission efficiency (CET) of transport shows a persistent and significant “east is stronger and west is weaker”. The formation of this pattern is deeply influenced by multiple factors, such as uneven distribution of resources, differences in infrastructure development, and different policy implementation strengths. Specifically, eastern coastal provinces such as Guangdong and Zhejiang have made significant progress in CET, with growth rates as high as 44% and 27%, respectively, demonstrating strong development momentum. However, in western regions, such as Gansu and Ningxia, the CET level has hovered below 0.4 for a long time, and the development is relatively lagging behind. From the perspective of time evolution trajectory, the development of NU and CET follows the law of “slow-fast-stable”. At the initial stage, the pace of development was relatively slow due to various constraints; then, with the promotion of policies and optimization of resource allocation, the pace of development accelerated significantly; finally, it entered a relatively stable growth stage. However, despite the positive overall development trend, the gap between regions has widened further due to structural problems in the western and northeastern regions. These regions often face challenges such as outdated industrial frameworks and serious brain drain, making it difficult for them to keep pace with the eastern regions in the development of NU and CET.
  • Coupling Coordination Dynamics: While coordination levels improved from “basic disorder” to “basic coordination” (2004–2021), advanced coordination remains elusive. Provinces like Beijing and Guangdong reached Level IV coordination by 2021, but Xinjiang and Inner Mongolia stagnated at Level III, constrained by fragmented transportation networks and low-tech industrial systems.
  • Spatial Spillover Mechanisms: TEI, IS, and STI significantly enhanced coordination, contributing 0.048, 0.491, and 0.050 to total effects, respectively. Conversely, INC and GOV exhibited limited spatial spillover, highlighting inefficiencies in cross-regional policy synergy.

4.2. Policy Recommendations

After conducting an in-depth analysis, it has been observed that the combined progress of NU and CET holds significant importance for China’s sustainable growth. In order to further enhance this synergy and ensure that development is comprehensive, enduring and resilient, this report makes the following recommendations:
(1) In order to promote the synergistic enhancement of NU and CET, the government should strengthen the coordinated development strategy between regions and optimize the policy orientation and incentive mechanism. Given the significant inter-provincial differences, the government needs to take into account the actual situation and development needs of each region. In particular, it should increase support for relatively backward regions such as the west. Specific measures include the following: a. Establish a regional coordinated development fund through the establishment of special funds, and support the infrastructure construction, industrial development and talent introduction in western and other relatively backward regions, so as to narrow the development gap between regions. b. Promote inter-regional cooperation and exchanges: Encourage industrial cooperation, technical exchanges and talent training among different regions, and attain optimal allocation and effective utilization of resources, technologies, and talents. c. Establishment of a regional coordinated development agency: Establish a specialized agency responsible for coordinating the development plans and policies of each region, and ensure policy consistency and coherence and promote synergistic development among regions. d. Formulate customized development strategies: Through resource endowment, industrial base and demographics of each region, formulate development plans and transportation strategies that are in line with local realities. In this way, we can realize development tailored to local conditions. e. Optimize policy incentives: By setting up incentive funds and providing tax incentives, motivate enterprises and individuals to participate in NU construction and transportation development. f. Establish a performance evaluation system: Regularly evaluate the implementation of policies in each region, and ensure the effectiveness and relevance of the policies. Meanwhile, adjust and improve the relevant policy measures in a timely manner. Through the above measures, the government can effectively promote the coordinated development between regions, optimize the policy orientation and incentive mechanism, and then promote the overall improvement of NU and CET.
(2) To deepen the integration of the two and to sustainably improve coupling harmonization, the following measures are essential: a. Clarify development goals: First, establish long-term and short-term goals for the development of coupling coordination, and ensure that the two can form a positive interaction in the development process. b. Strengthen transportation infrastructure: Increase investment in transportation infrastructure to enhance the coverage and service quality of the transportation network, and optimize the spatial layout of cities to provide a solid transportation foundation for NU. c. Promote technological innovation and application: Encourage a wide range of technological research, development and application in the field of transportation, especially in terms of energy conservation, emission reduction and efficiency enhancement, by adopting advanced traffic management systems, optimizing the design of traffic flows, and enhancing the energy efficiency of transportation means. Achieve a significant improvement in CET and thus promote the overall development of green transportation. The implementation of these technological innovations will help build a more environmentally friendly, efficient, and sustainable transportation system. d. Formulate favorable policies: Introduce favorable policies, such as financial subsidies and tax incentives. In this way, the economic burden of NU and transportation development will be reduced. e. Establish a monitoring and evaluation mechanism: Establish a regular monitoring and assessment mechanism to continuously track and assess, identify problems and adjust policy directions in a timely manner, and ensure the sustainability of the development of the integration of the two. Through the implementation of these measures, we will be able to further deepen the integration of development and promote the continuous improvement of the coupling and coordination between the two to contribute to the realization of economically, socially, and environmentally sustainable development.
(3) Strengthening regional cooperation and spatial planning is the key to promoting integrated regional development. In response to regional spatial autocorrelation and agglomeration characteristics, the government should make greater efforts to promote interregional cooperation and exchanges, and realize the industrial pattern of complementary advantages and linkage development. To this end, scientific and reasonable industrial development policies should be formulated to guide enterprises to strengthen technological innovation and industrial upgrading to meet the needs of regional economic development. It is crucial to jointly formulate spatial development planning. This will help ensure rational allocation and efficient utilization of resources and avoid waste of resources and duplicated construction. By promoting the establishment of cross-regional cooperation mechanisms, for example, cooperation agreements between local governments and joint actions by industry associations, information sharing and resource sharing can be strengthened to achieve mutual benefit and a win–win situation. In addition, administrative barriers should be broken down, and the free flow of factor markets should be promoted to create favorable conditions for the synergistic development of the regional economy. This will not only help enhance the comprehensive competitiveness of the entire region but also promote balanced development within the region. Broader social and economic benefits are realized. Therefore, strengthening regional cooperation and spatial planning is an important way to promote integrated regional development. The government should play its leading role and actively guide enterprises and all sectors of society to participate. This will promote regional economic prosperity and sustainable development.
(4) The spatial spillover effect should be considered in formulating policies, and comprehensive measures should be adopted to enhance the degree of coupling and coordination. In formulating relevant policies, the impact of spatial spillover effects should be fully considered. Avoid the “one-size-fits-all” and “zero-sum game” of policies, and realize the coordination and complementarity of policies. The following recommendations are made with regard to the impact of different influencing factors on the development of coupled harmonization: a. Optimizing the structure of the workforce: Rational mobility of labor across industries and regions should be promoted. In particular, more labor should be guided to move to the highly efficient and low-carbon tertiary industry. In this way, overall economic efficiency and green development can be enhanced. b. Reduce transportation energy intensity: Through measures such as promoting clean energy, improve energy efficiency of transportation, and develop intelligent transportation systems. Reduce energy consumption and carbon emissions per unit of transportation activity to realize green transportation. c. Adjust industrial structure: Encourage and support the development of low-carbon and environmentally friendly industries; promote the transformation and upgrading of the industrial structure in the direction of being high-end, green, and intelligent; and reduce the proportion of high-pollution and high-energy-consumption industries. d. Strengthen scientific and technological innovation: Increase investment in scientific and technological innovation, promote the wide application of new technologies in the NU and transportation industries, and enhance the overall technological level and competitiveness. e. Improve the policy system: Formulate and implement a series of policy measures conducive to the synergistic development of NU and transportation. f. Strengthen regional cooperation: Promote cooperation and exchanges between different regions in the development of NU and transportation industry; share resources, technologies, and experiences to realize complementary advantages and synergistic development among regions. Through the implementation of the above recommendations, we expect to further strengthen the synergy between NU and CET. This will promote China’s progress towards a greener, low-carbon, and sustainable development path.

4.3. Limitations and Future Directions

Although this study reveals the coupling and coordination mechanism between NU (NU) and carbon emission efficiency (CET) of transportation through the multi-dimensional indicator system and spatial measurement model, there are still the following limitations, and future research can be deepened in the following directions: 1. This study focuses on the coupling and coordination degree of NU and CET and their spatial spillover effects, but due to the research framework and data availability, the moderating and mediating effects among variables are not deeply explored. Future research can systematically analyze the micro-mechanisms of multi-factor interactions by constructing the chain path model of “NU→mediating variables→CET”, so as to provide a finer theoretical basis for policy targeting interventions. 2. Although this study identifies the local effects of government intervention (GOV) through SDM, it does not differentially assess the causal effects of specific policies (e.g., the pilot transportation emission reduction program under the “dual-carbon” goal, and the subsidies for new energy vehicles). In the future, a double difference model (DID) can be used to take a typical policy (e.g., the 2016 “financial subsidy policy for the promotion and application of new energy vehicles”) as a natural experiment. A “treatment group-control group” analytical framework is constructed to quantify the marginal contribution of policy shocks to the harmonization of NU and CET.
Although this study was conducted based on Chinese data, the research methodology used and the model constructed are widely applicable. Particularly for other countries with high carbon emissions and undergoing rapid urbanization, it has important reference value.
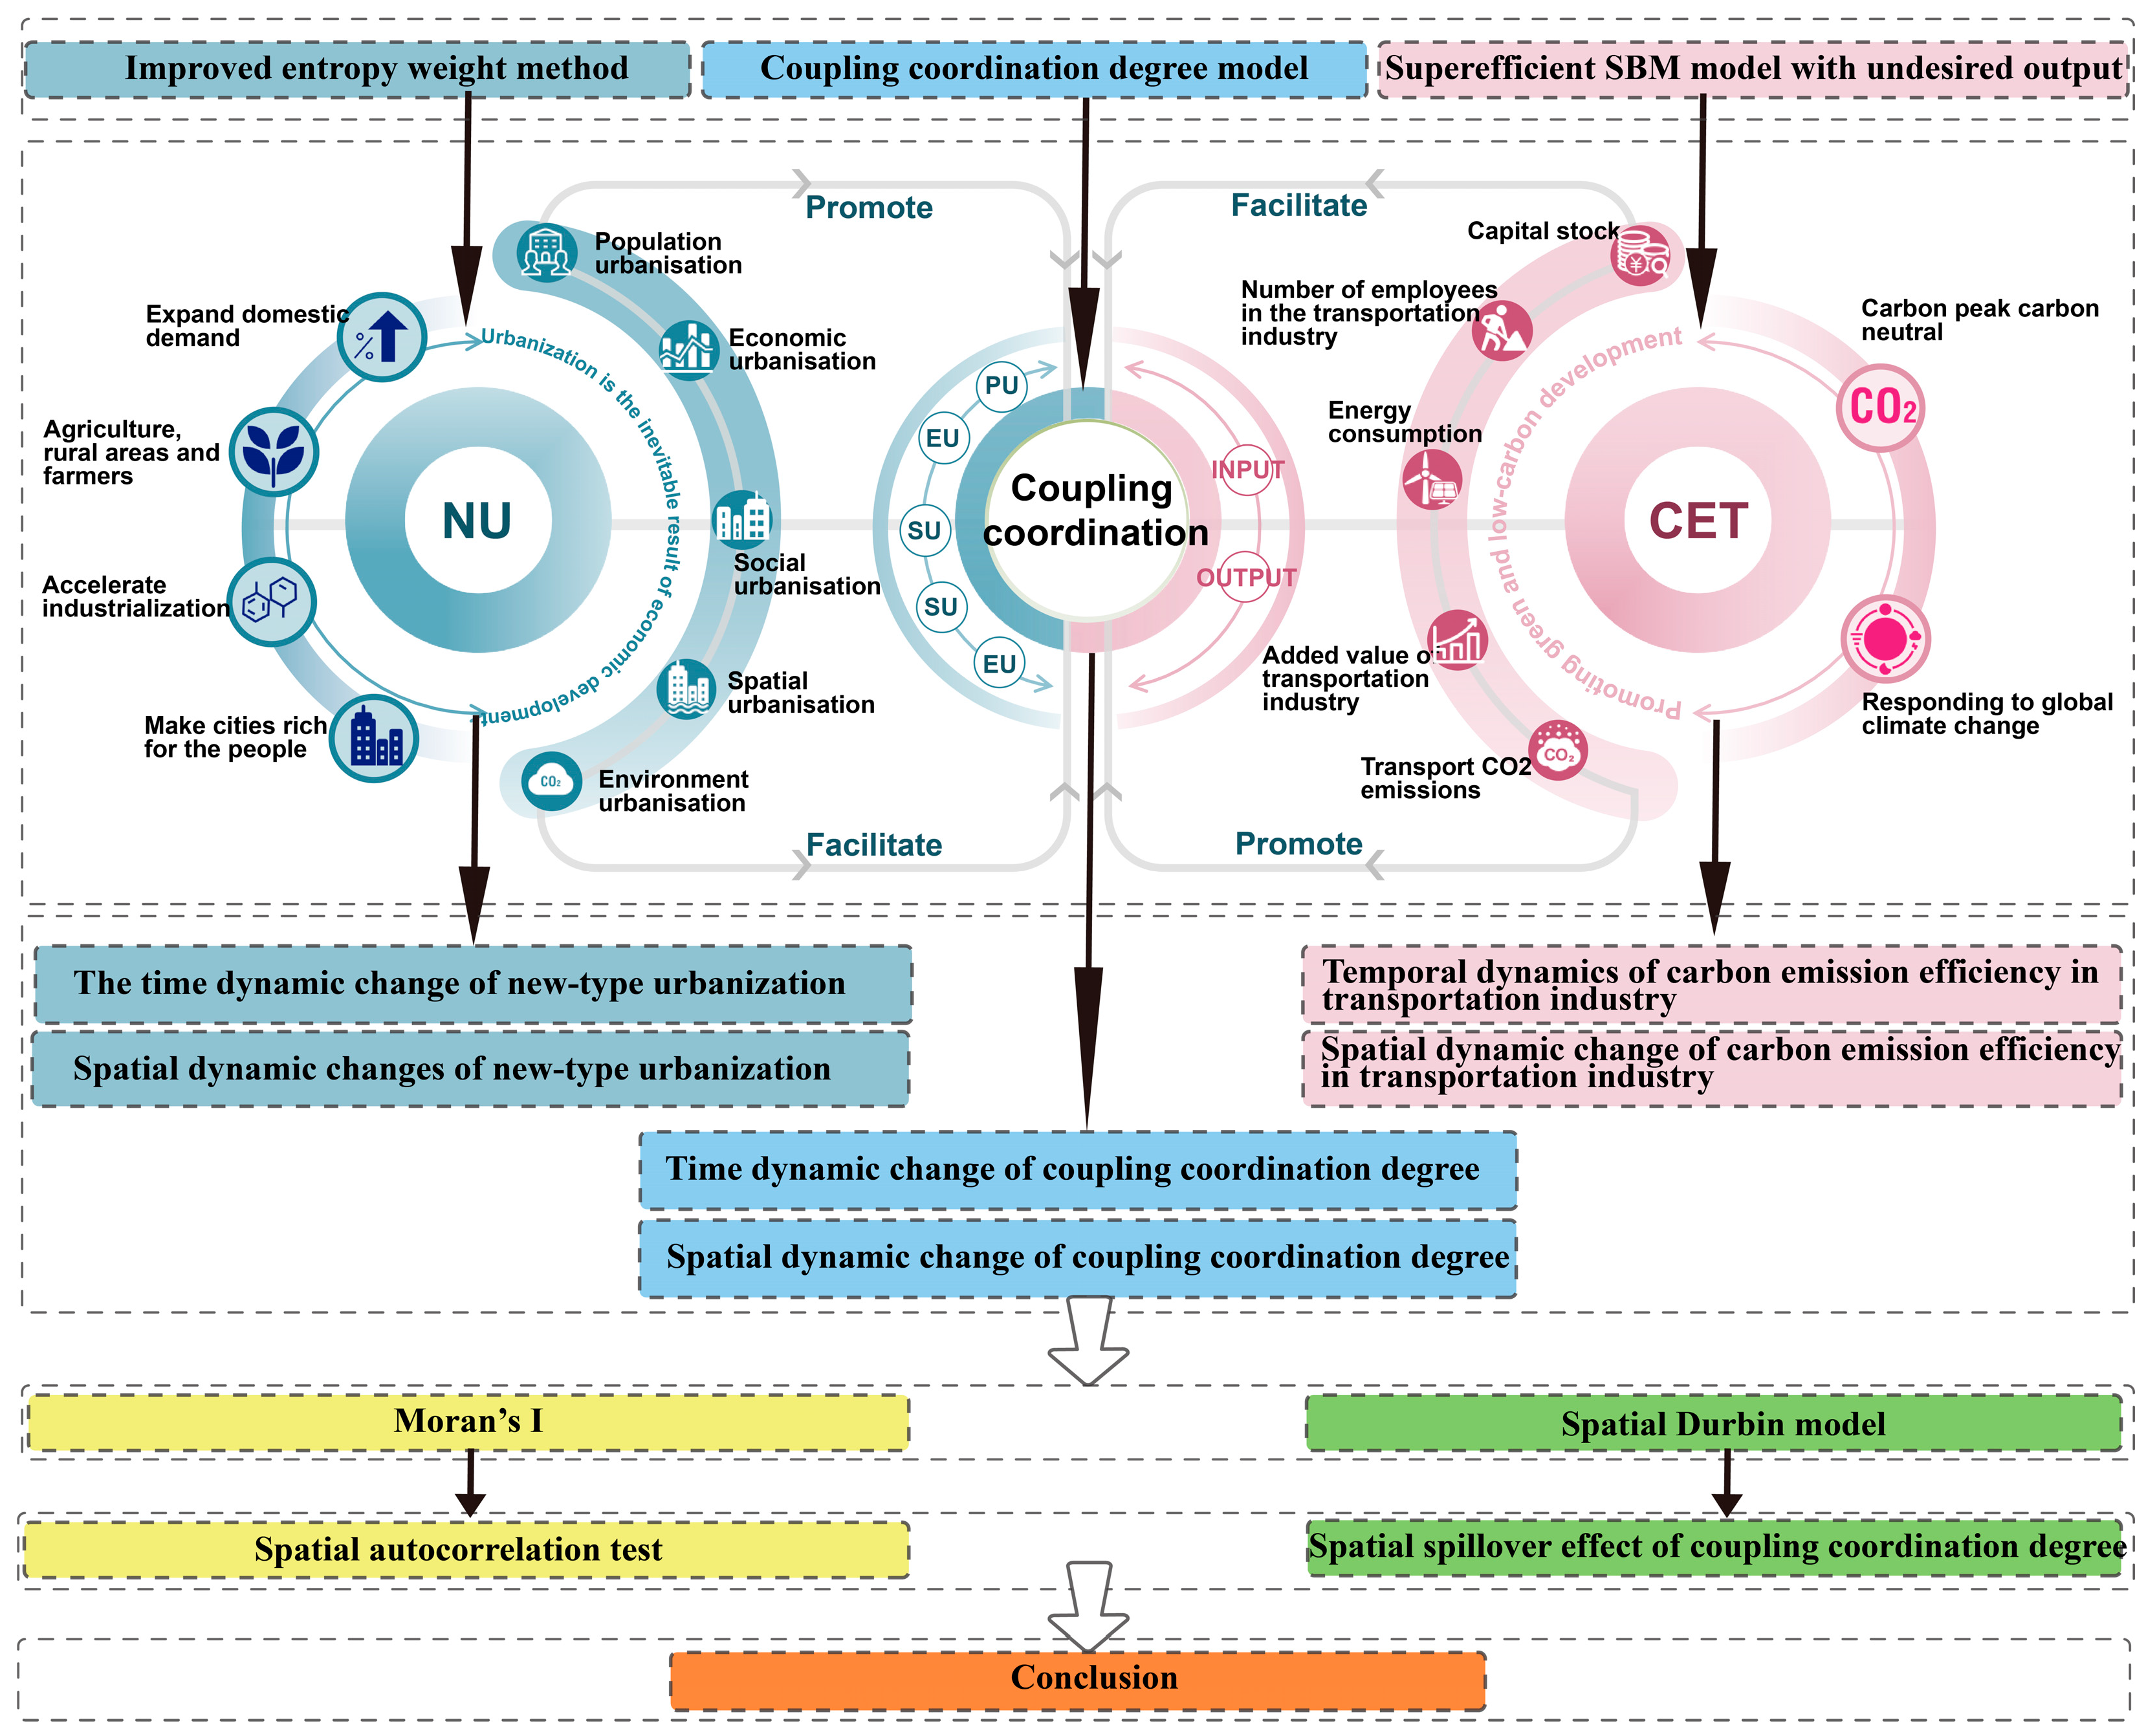
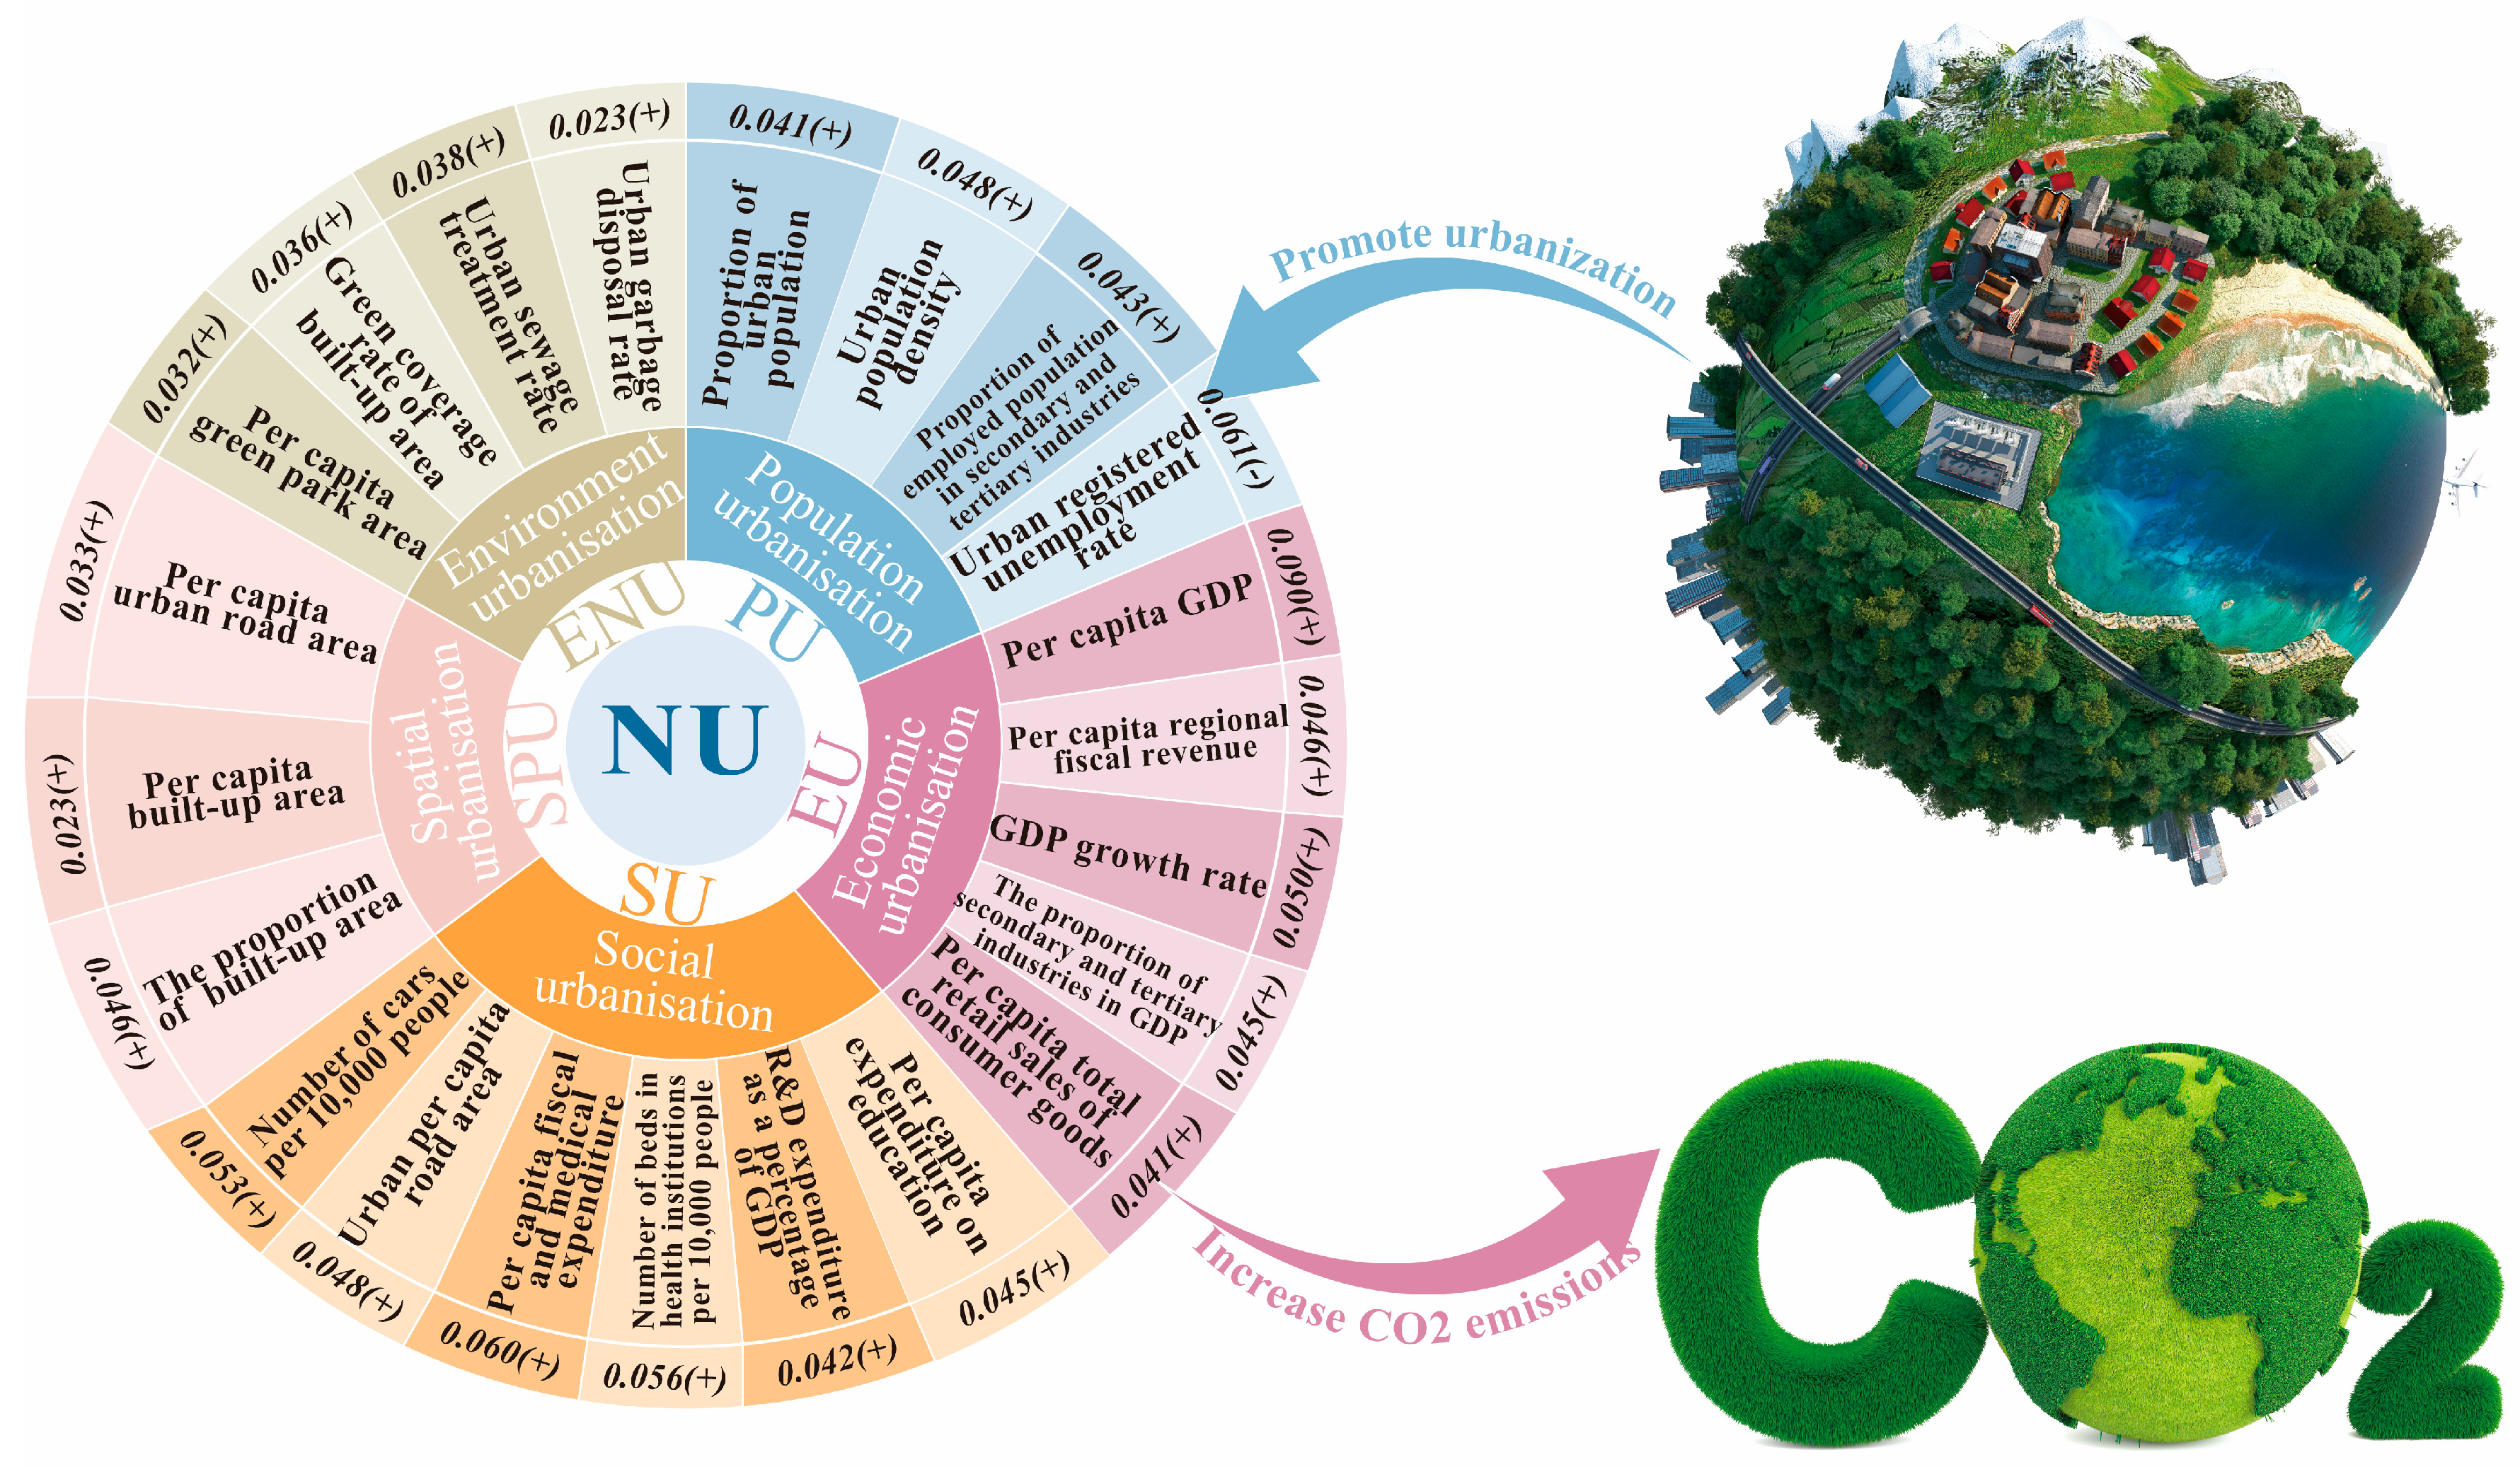
Author Contributions

Conceptualization, H.J. and W.L.; methodology, H.J.; validation, H.J. and R.T.; formal analysis, H.J. and R.T.; data curation, H.J. and R.T.; writing—original draft preparation, H.J. and R.T.; writing—review and editing, project administration, H.J.; funding acquisition, W.L. All authors have read and agreed to the published version of the manuscript.

Funding

This research was supported by Beijing Laboratory of National Economic Security Early-Warning Engineering, Beijing Jiaotong University. This research is funded by the Fundamental Research Funds for the Central Universities [2023JBW8006].

Data Availability Statement

Data will be made available on request.

Conflicts of Interest

The authors declare no conflicts of interest.

References

  1. Zhang, W.; Zhou, H.; Chen, J.; Fan, Z. An empirical analysis of the impact of digital economy on manufacturing green and low-carbon transformation under the dual-carbon background in China. Int. J. Environ. Res. Public Health 2022, 19, 13192. [Google Scholar] [CrossRef] [PubMed]
  2. Peng, H.-T.; Zhang, D.; Zhong, J.-T.; Guo, L.-F.; Guo, S.-Y.; Huang, J.-L.; Wang, D.-Y.; Miao, C.-H.; Zhang, X.-L.; Zhang, X.-Y. Representative CO2 emissions pathways for China’s provinces toward carbon neutrality under the Paris Agreement’s 2 °C target. Adv. Clim. Change Res. 2024, 15, 1096–1106. [Google Scholar] [CrossRef]
  3. Liu, X.; Xu, H. Does low-carbon pilot city policy induce low-carbon choices in residents’ living: Holistic and single dual perspective. J. Environ. Manag. 2022, 324, 116353. [Google Scholar] [CrossRef] [PubMed]
  4. Zhou, X.; Wu, B.; Liu, Y.; Zhou, Q.; Cheng, W. Synergistic effects of heat and carbon on sustainable urban development: Case study of the Wuhan Urban Agglomeration. J. Clean. Prod. 2023, 425, 138971. [Google Scholar] [CrossRef]
  5. He, C.; Chen, T.; Mao, X.; Zhou, Y. Economic transition, urbanization and population redistribution in China. Habitat Int. 2016, 51, 39–47. [Google Scholar] [CrossRef]
  6. Adopted, I. Climate Change 2014 Synthesis Report; IPCC: Geneva, Switzerland, 2014; pp. 1059–1072. [Google Scholar]
  7. Song, Q.; Zhou, N.; Liu, T.; Siehr, S.A.; Qi, Y. Investigation of a “coupling model” of coordination between low-carbon development and urbanization in China. Energy Policy 2018, 121, 346–354. [Google Scholar] [CrossRef]
  8. Meng, C.; Du, X.; Zhu, M.; Ren, Y.; Fang, K. The static and dynamic carbon emission efficiency of transport industry in China. Energy 2023, 274, 127297. [Google Scholar] [CrossRef]
  9. Xu, H.; Li, Y.; Zheng, Y.; Xu, X. Analysis of spatial associations in the energy–carbon emission efficiency of the transportation industry and its influencing factors: Evidence from China. Environ. Impact Assess. Rev. 2022, 97, 106905. [Google Scholar] [CrossRef]
  10. Pacheco-Torres, R.; Roldán, J.; Gago, E.; Ordóñez, J. Assessing the relationship between urban planning options and carbon emissions at the use stage of new urbanized areas: A case study in a warm climate location. Energy Build. 2017, 136, 73–85. [Google Scholar] [CrossRef]
  11. Lv, Q.; Liu, H.; Yang, D.; Liu, H. Effects of urbanization on freight transport carbon emissions in China: Common characteristics and regional disparity. J. Clean. Prod. 2019, 211, 481–489. [Google Scholar] [CrossRef]
  12. Li, R.; Li, L.; Wang, Q. The impact of energy efficiency on carbon emissions: Evidence from the transportation sector in Chinese 30 provinces. Sustain. Cities Soc. 2022, 82, 103880. [Google Scholar] [CrossRef]
  13. Wang, N.; Zhu, Y. The integration of traditional transportation infrastructure and informatization development: How does it affect carbon emissions? Energies 2022, 15, 7535. [Google Scholar] [CrossRef]
  14. Zhao, J.; Jiang, Q.; Dong, X.; Dong, K.; Jiang, H. How does industrial structure adjustment reduce CO2 emissions? Spatial and mediation effects analysis for China. Energy Econ. 2022, 105, 105704. [Google Scholar] [CrossRef]
  15. Bornemann, S.; Förster, M.; Knüppel, B.; Schmidt, I. Mobility and Transport in Agglomeration Areas—The Nuremberg Region in the 21st Century as an Example. In Mobily Traffic 21st Century; Springer: Berlin/Heidelberg, Germany, 2001; pp. 80–186. [Google Scholar] [CrossRef]
  16. Altenburg, T.; Rodrik, D. Green industrial policy: Accelerating structural change towards wealthy green economies. Green Ind. Policy 2017, 1, 2–20. [Google Scholar] [CrossRef]
  17. Zhao, C.; Wang, K.; Dong, X.; Dong, K. Is smart transportation associated with reduced carbon emissions? The case of China. Energy Econ. 2022, 105, 105715. [Google Scholar] [CrossRef]
  18. Li, X.; Zhou, X.; Zhao, Y.; Zhou, S. Exploring coupling coordination of new urbanization, green innovation and low-carbon development systems in China. J. Clean. Prod. 2025, 495, 145022. [Google Scholar] [CrossRef]
  19. Liu, B.; Tian, C.; Li, Y.; Song, H.; Ma, Z. Research on the effects of urbanization on carbon emissions efficiency of urban agglomerations in China. J. Clean. Prod. 2018, 197, 1374–1381. [Google Scholar] [CrossRef]
  20. Al-Mulali, U.; Sab, C.N.B.C.; Fereidouni, H.G. Exploring the bi-directional long run relationship between urbanization, energy consumption, and carbon dioxide emission. Energy 2012, 46, 156–167. [Google Scholar] [CrossRef]
  21. Zhu, E.; Qi, Q.; Chen, L.; Wu, X. The spatial-temporal patterns and multiple driving mechanisms of carbon emissions in the process of urbanization: A case study in Zhejiang, China. J. Clean. Prod. 2022, 358, 131954. [Google Scholar] [CrossRef]
  22. Ahmed, Z.; Wang, Z.; Ali, S. Investigating the non-linear relationship between urbanization and CO 2 emissions: An empirical analysis. Air Qual. Atmos. Health 2019, 12, 945–953. [Google Scholar] [CrossRef]
  23. Chen, C.; Qin, Y.; Gao, Y. Does new urbanization affect CO2 emissions in China: A spatial econometric analysis. Sustain. Cities Soc. 2023, 96, 104687. [Google Scholar] [CrossRef]
  24. Liu, Q.; Song, J.; Dai, T.; Shi, A.; Xu, J.; Wang, E. Spatio-temporal dynamic evolution of carbon emission intensity and the effectiveness of carbon emission reduction at county level based on nighttime light data. J. Clean. Prod. 2022, 362, 132301. [Google Scholar] [CrossRef]
  25. Zhang, N.; Wei, X. Dynamic total factor carbon emissions performance changes in the Chinese transportation industry. Appl. Energy 2015, 146, 409–420. [Google Scholar] [CrossRef]
  26. Wang, Q.; Wang, L. The nonlinear effects of population aging, industrial structure, and urbanization on carbon emissions: A panel threshold regression analysis of 137 countries. J. Clean. Prod. 2021, 287, 125381. [Google Scholar] [CrossRef]
  27. Wang, W.-Z.; Liu, L.-C.; Liao, H.; Wei, Y.-M. Impacts of urbanization on carbon emissions: An empirical analysis from OECD countries. Energy Policy 2021, 151, 112171. [Google Scholar] [CrossRef]
  28. Zhang, N.; Sun, F.; Hu, Y. Carbon emission efficiency of land use in urban agglomerations of Yangtze River Economic Belt, China: Based on three-stage SBM-DEA model. Ecol. Indic. 2024, 160, 111922. [Google Scholar] [CrossRef]
  29. Yang, Z.; Gao, W.; Han, Q.; Qi, L.; Cui, Y.; Chen, Y. Digitalization and carbon emissions: How does digital city construction affect china’s carbon emission reduction? Sustain. Cities Soc. 2022, 87, 104201. [Google Scholar] [CrossRef]
  30. Xu, W.; Wang, G.Y. The measure index system and evaluation research of new-type urbanization. Appl. Mech. Mater. 2014, 587, 176–180. [Google Scholar] [CrossRef]
  31. Jiang, B.; Ding, L.; Fang, X. Sustainable development of new urbanization from the perspective of coordination: A new complex system of urbanization–technology innovation and the atmospheric environment. Atmosphere 2019, 10, 652. [Google Scholar] [CrossRef]
  32. Chen, M.; Liu, W.; Lu, D.; Chen, H.; Ye, C. Progress of China’s new-type urbanization construction since 2014: A preliminary assessment. Cities 2018, 78, 180–193. [Google Scholar] [CrossRef]
  33. Luo, J.; Ma, W.; An, S.; Zhang, Z.; Fu, Y.; Huang, H.; Chang, G. Coupling analysis of multi-systems urbanization: Evidence from China. Ecol. Indic. 2025, 170, 112977. [Google Scholar] [CrossRef]
  34. Zhang, Z.; Hua, C.; Chen, X.-L.; Song, M. The spatial impact of population semi-urbanization on sulfur dioxide emissions: Empirical evidence from China. J. Environ. Manag. 2025, 375, 124257. [Google Scholar] [CrossRef] [PubMed]
  35. Wu, R.; Yu, G.; Cao, Y. The impact of industrial structural transformation in the Yangtze River economic belt on the trade-offs and synergies between urbanization and carbon balance. Ecol. Indic. 2025, 171, 113165. [Google Scholar] [CrossRef]
  36. Dogan, E.; Turkekul, B. CO2 emissions, real output, energy consumption, trade, urbanization and financial development: Testing the EKC hypothesis for the USA. Environ. Sci. Pollut. Res. 2016, 23, 1203–1213. [Google Scholar] [CrossRef]
  37. Zhang, Y.; Wang, Y. How does urbanization evolve heterogeneously in urbanized, urbanizing, and rural areas of China? Insights from ecosystem service value. Geogr. Sustain. 2024, 100254. [Google Scholar] [CrossRef]
  38. Jin, W.; Wang, S.; Zhao, W. Urban-rural carbon emission differences in China’s urbanization: Spatial effects and influencing factors. Environ. Pollut. 2025, 366, 125423. [Google Scholar] [CrossRef] [PubMed]
  39. Li, P.; Li, T. Spatiotemporal analysis of ecosystem services and the impact of new-type urbanization: A case study of Chengdu, China. Ecol. Indic. 2025, 171, 113191. [Google Scholar] [CrossRef]
  40. Ma, D.; Yan, Y.; Xiao, Y.; Zhang, F.; Zha, H.; Chang, R.; Zhang, J.; Guo, Z.; An, B. Research on the spatiotemporal evolution and influencing factors of urbanization and carbon emission efficiency coupling coordination: From the perspective of global countries. J. Environ. Manag. 2024, 360, 121153. [Google Scholar] [CrossRef]
  41. Jiang, J.; Zhu, S.; Wang, W.; Li, Y.; Li, N. Coupling coordination between new urbanisation and carbon emissions in China. Sci. Total Environ. 2022, 850, 158076. [Google Scholar] [CrossRef]
  42. Guo, M.; Chen, S.; Zhang, Y. Spatial analysis on the role of multi-dimensional urbanizations in carbon emissions: Evidence from China. Int. J. Environ. Res. Public Health 2022, 19, 5315. [Google Scholar] [CrossRef]
  43. Prastiyo, S.E.; Irham; Hardyastuti, S.; Jamhari, f. How agriculture, manufacture, and urbanization induced carbon emission? The case of Indonesia. Environ. Sci. Pollut. Res. 2020, 27, 42092–42103. [Google Scholar] [CrossRef] [PubMed]
  44. Zhang, B.; Yin, J.; Jiang, H.; Qiu, Y. Spatial–temporal pattern evolution and influencing factors of coupled coordination between carbon emission and economic development along the Pearl River Basin in China. Environ. Sci. Pollut. Res. 2023, 30, 6875–6890. [Google Scholar] [CrossRef] [PubMed]
  45. Muñoz, P.; Zwick, S.; Mirzabaev, A. The impact of urbanization on Austria’s carbon footprint. J. Clean. Prod. 2020, 263, 121326. [Google Scholar] [CrossRef]
  46. Zhang, W.; Xu, Y.; Streets, D.G.; Wang, C. Can new-type urbanization realize low-carbon development? A spatiotemporal heterogeneous analysis in 288 cities and 18 urban agglomerations in China. J. Clean. Prod. 2023, 420, 138426. [Google Scholar] [CrossRef]
  47. Liao, S.; Wu, Y.; Wong, S.W.; Shen, L. Provincial perspective analysis on the coordination between urbanization growth and resource environment carrying capacity (RECC) in China. Sci. Total Environ. 2020, 730, 138964. [Google Scholar] [CrossRef]
  48. Lei, Y.; Xiao, Y.; Wang, F.; Wang, R.; Huang, H. Investigation on the complex relationship between urbanization and eco-efficiency in urban agglomeration of China: The case study of Chengdu-Chongqing urban agglomeration. Ecol. Indic. 2024, 159, 111704. [Google Scholar] [CrossRef]
  49. Yu, Y.; Li, S.; Sun, H.; Taghizadeh-Hesary, F. Energy carbon emission reduction of China’s transportation sector: An input–output approach. Econ. Anal. Policy 2021, 69, 378–393. [Google Scholar] [CrossRef]
  50. Vaninsky, A. Energy-environmental efficiency and optimal restructuring of the global economy. Energy 2018, 153, 338–348. [Google Scholar] [CrossRef]
  51. Cheng, Y.; Lv, K.; Wang, J.; Xu, H. Energy efficiency, carbon dioxide emission efficiency, and related abatement costs in regional China: A synthesis of input–output analysis and DEA. Energy Effic. 2019, 12, 863–877. [Google Scholar] [CrossRef]
  52. Ma, M.; Zheng, J.; Ma, T. Spatiotemporal characteristics of the impact of new urbanization on China’s carbon dioxide emissions from a multi-dimensional perspective. Acta Sci. Circumstantiae 2021, 41, 2474–2486. [Google Scholar] [CrossRef]
  53. Solomon, S. IPCC (2007): Climate change the physical science basis. In Agu Fall Meeting Abstracts; Cambridge University Press: Cambridge, UK, 2007; p. U43D-01. [Google Scholar]
  54. Zhang, J.; Zeng, W.; Wang, J.; Yang, F.; Jiang, H. Regional low-carbon economy efficiency in China: Analysis based on the Super-SBM model with CO2 emissions. J. Clean. Prod. 2017, 163, 202–211. [Google Scholar] [CrossRef]
  55. Yu, R.; Wang, Z.; Li, Y.; Wen, Z.; Wang, W. Does population aging affect carbon emission intensity by regulating labor allocation? Sustainability 2023, 15, 9721. [Google Scholar] [CrossRef]
  56. Adams, S.; Boateng, E.; Acheampong, A.O. Transport energy consumption and environmental quality: Does urbanization matter? Sci. Total Environ. 2020, 744, 140617. [Google Scholar] [CrossRef] [PubMed]
  57. Zhang, Y.-J.; Liu, Z.; Zhang, H.; Tan, T.-D. The impact of economic growth, industrial structure and urbanization on carbon emission intensity in China. Nat. Hazards 2014, 73, 579–595. [Google Scholar] [CrossRef]
  58. He, Y.; Liu, G. Coupling coordination analysis of low-carbon development, technology innovation, and new urbanization: Data from 30 provinces and cities in China. Front. Public Health 2022, 10, 1047691. [Google Scholar] [CrossRef] [PubMed]
  59. Li, Y.; Gao, K. The impact of green urbanization on carbon emissions: The case of new urbanization in China. Front. Environ. Sci. 2022, 10, 1070652. [Google Scholar] [CrossRef]
  60. Li, Q.; Wei, Y.-N.; Dong, Y. Coupling analysis of China’s urbanization and carbon emissions: Example from Hubei Province. Nat. Hazards 2016, 81, 1333–1348. [Google Scholar] [CrossRef]
  61. Sun, Y.; Cui, Y. Analyzing the coupling coordination among economic, social, and environmental benefits of urban infrastructure: Case study of four Chinese autonomous municipalities. Math. Probl. Eng. 2018, 2018, 8280328. [Google Scholar] [CrossRef]
  62. Li, J.; Huang, X.; Chuai, X.; Yang, H. The impact of land urbanization on carbon dioxide emissions in the Yangtze River Delta, China: A multiscale perspective. Cities 2021, 116, 103275. [Google Scholar] [CrossRef]
  63. Wang, Y.; Zhao, T.; Wang, J.; Guo, F.; Kan, X.; Yuan, R. Spatial analysis on carbon emission abatement capacity at provincial level in China from 1997 to 2014: An empirical study based on SDM model. Atmos. Pollut. Res. 2019, 10, 97–104. [Google Scholar] [CrossRef]
  64. Liu, F.; Liu, C. Regional disparity, spatial spillover effects of urbanisation and carbon emissions in China. J. Clean. Prod. 2019, 241, 118226. [Google Scholar] [CrossRef]
Figure 1. NU and CET coupling coordination diagram.
Land 14 00623 g001
Figure 2. NU evaluation indicator system.
Land 14 00623 g002
Figure 3. CET evaluation indicator system.
Land 14 00623 g003
Figure 4. Coupled coordination degree classification.
Land 14 00623 g004
Figure 5. Study area.
Land 14 00623 g005
Figure 6. Temporal dynamics of NU. (a) The temporal trend of the composite index of NU for 30 provinces in China from 2004 to 2021; (b) time trends in different regions; (c) time trends in different province.
Land 14 00623 g006
Figure 7. The spatial dynamics of NU.
Land 14 00623 g007
Figure 8. Temporal dynamics of CET. (a) The temporal trend of the composite index of CET for 30 provinces in China from 2004 to 2021; (b) time trends in different regions; (c) time trends in different province.
Land 14 00623 g008
Figure 9. The spatial dynamics of CET in 30 provinces.
Land 14 00623 g009
Figure 10. Temporal dynamics. (a) The classification of harmonization levels and harmonization types; (b) the coupling harmonization degree; (ce) the type of coupling coordination.
Land 14 00623 g010
Figure 11. The spatial visualization of the coupled and coordinated development.
Land 14 00623 g011
Figure 12. Moran’s I scatterplot.
Land 14 00623 g012
Table 1. Standard coal conversion factors and carbon conversion factors.
Type of EnergyStandard Coal Conversion Factor α Carbon Emission Factor β
coals0.71460.7559
coke (processed coal used in blast furnaces)0.97140.855
crude oil1.42860.5857
petrol1.47140.5538
diesel1.47140.5714
diesel oil1.45710.5921
fuel oil1.42860.6185
petroleum1.42860.4483
Table 2. Influencing factors.
Variable NameDescription of VariablesVariable Symbol
Income per Capita LevelGDP per capitaINC
Labor Force StructureShare of non-farm payrollsLS
Transportation Energy IntensityThe share of transportation industry’s energy consumption in the regional economyTEI
Industrial StructureProportion of the output value of the secondary and tertiary industries to GDPIS
Science, Technology, and InnovationNumber of patents grantedSTI
Level of Government InterventionGovernment expenditure as a proportion of GDPGOV
Table 3. Moran’s I index.
YearMoran’s IYearMoran’s I
20040.24420130.374
20050.32920140.372
20060.29320150.389
20070.28220160.415
20080.27720170.425
20090.30320180.463
20100.38020190.450
20110.38320200.465
20120.36720210.461
Table 4. Test results.
Test MethodsEigenvalue (Math.)Test MethodsEigenvalue (Math.)
LM-lag68.898 ***LR-lag65.959 ***
LM-errors14.123 **LR-errors65.029 ***
Robust LM-lag93.166 ***Hausman test161.869 ***
Robust LM-errors38.391 ***LR test (spatial fixed effects)39.559 ***
Wald-lag69.259 ***LR test (time-fixed effects)646.799 ***
Wald-error67.699 ***
Note: *** and ** represent significance at 1% and 5% level of significance, respectively (robust standard errors).
Table 5. Spatial Durbin model regression results.
VariableValueVariableValue
lnINC0.027 (0.032)W×lnINC0.023 (0.057)
lnLS−0.664 (0.189) ***W×lnLS0.660 (0.338) *
lnTEI0.694 (0.182) ***W×lnTEI−0.631 (0.189) ***
lnIS0.297 (0.137) **W×lnIS0.187 (0.085) **
lnSTI0.022 (0.012) *W×lnSTI0.017 (0.029)
lnGOV0.106 (0.096)W×lnGOV0.078 (0.061)
R20.776--
Note: ***, ** and * represent significance at 1%, 5% and 10% level of significance, respectively (robust standard errors).
Table 6. Decomposition of spatial spillovers.
VariableDirect EffectIndirect EffectTotal Effect
lnINC0.031 (0.122)0.029 (0.053)0.060 (0.069)
lnLS−0.679 (0.191) ***0.672 (0.314) **−0.007 (0.002) ***
lnTEI0.699 (0.198) ***−0.651 (0.259) **0.048 (0.018) ***
lnIS0.300 (0.126) **0.191 (0.078) **0.491 (0.272) *
lnSTI0.026 (0.015) *0.024 (0.022)0.050 (0.041)
lnGOV0.109 (0.089)0.088 (0.055)0.197 (0.160)
Note: ***, ** and * represent significance at 1%, 5% and 10% level of significance, respectively (robust standard errors).
Table 7. Robustness test results.
VariableSpatial Adjacency Weight MatrixEconomic Distance Weight MatrixExplanatory Variables Lag by One Phase
lnINC0.027 (0.032)0.030 (0.034)0.019 (0.029)
lnLS−0.664 (0.224) ***−0.715 (0.297) **−0.524 (0.210) **
lnTEI0.694 (0.218) ***0.710 (0.229) ***0.599 (0.238) **
lnIS0.297 (0.107) ***0.320 (0.137) **0.242 (0.101) **
lnSTI0.022 (0.012) *0.034 (0.020) *0.015 (0.008) *
lnGOV0.106 (0.126)0.124 (0.127)0.089 (0.094)
W×lnINC0.023 (0.057)0.029 (0.060)0.017 (0.054)
W×lnLS0.660 (0.338) *0.711 (0.341) **0.589 (0.333) *
W×lnTEI−0.631 (0.289) **−0.733 (0.297) **−0.574 (0.229) **
W×lnIS0.187 (0.089) **0.192 (0.077) **0.130 (0.062) **
W×lnSTI0.017 (0.029)0.025 (0.029)0.009 (0.023)
W×lnGOV0.078 (0.081)0.084 (0.073)0.069 (0.056)
R20.77610.73210.7561
Note: ***, ** and * represent significance at 1%, 5% and 10% level of significance, respectively (robust standard errors).
Disclaimer/Publisher’s Note: The statements, opinions and data contained in all publications are solely those of the individual author(s) and contributor(s) and not of MDPI and/or the editor(s). MDPI and/or the editor(s) disclaim responsibility for any injury to people or property resulting from any ideas, methods, instructions or products referred to in the content.