Abstract
Urban land marketization is a strategy to alleviate land resource misallocation caused by government intervention, but there has been a debate regarding its effectiveness in reducing carbon emissions. This study examines the impact of market-oriented allocation of land resources on carbon emissions using panel data from 284 Chinese cities from 2007 to 2021. The results indicate four findings: (1) Urban land marketization can effectively reduce both the total carbon emission and carbon emission intensity, especially in the central and western cities, non-provincial capital cities, and resource-dependent cities. (2) Promoting land financing, expanding trade openness, and stimulating entrepreneurship are all significant mechanisms for the carbon emission reduction effect of urban land marketization. (3) As per capita income and environmental regulation increase, the impacts of land marketization on carbon emissions are nonlinear. (4) Surrounding cities’ carbon emissions are not mitigated due to administrative border barriers and regional protectionism. This paper sheds light on the role of land marketization in carbon emission reduction and thus provides practical policy implications for promoting economic transition and low-carbon development.
1. Introduction
In recent years, the significant impact of carbon emissions on human survival and sustainable development has been witnessed [1,2]. Global warming has become a critical concern for several nations [3,4]. In response to this challenging climate and environmental issue, the Intergovernmental Panel on Climate Change (IPCC) released a Special Report on Global Warming, recommending that the temperature target not exceed 1.5 °C and urging that carbon dioxide emissions be reduced to net zero by 2050. Nevertheless, global average surface temperatures rose by 1.1 °C between 2011 and 2020 [5]. As the world’s largest carbon emitter, the Chinese government has actively participated in global climate governance and has committed to achieving carbon neutrality by 2060 and reaching peak emissions by 2030 (i.e., the “dual carbon target”), as well as gradually shifting toward a dual control system for both total carbon emissions and carbon emission intensity.
Land is the most fundamental factor of production [6,7], which is important not only as a tool for government intervention [8] but also as a critical resource in local government competition. Many countries have undertaken government interventions in land resource allocation to promote development, which contributes to reducing carbon emissions [9,10,11]. However, strong government intervention has always existed in China’s land market compared to other countries [12], resulting in increasing carbon emissions [13]. This is because local governments could distort the resource allocation efficiency by controlling the land transfer process and adopting the “free or low-price transfer” strategy [14,15] to obtain fiscal and tax revenue [16,17,18] and attract investment [19]. To address the above problems, the central government in China has promoted the development of the land market and required local governments to adopt market-oriented allocation methods of bidding, auction, and listing instead of the planning allocation of agreements. Improving the level of land marketization has alleviated the distortion of land resource allocation [20]. However, whether it has promoted or inhibited carbon emissions remains unexplored.
Previous studies have focused on the impacts of land resource allocation on carbon emissions, such as land transfer scale, structure, and price [17,18]. Some of these studies concentrate especially on the impacts of the methods of land resource allocation on carbon emissions, revealing the carbon emission reduction effects of urban land marketization from various perspectives, which include the mediating effects of industrial structure upgrade and technological innovation [21,22], the spatial spillover effects [22], and the moderating effects of environmental governance [23]. For example, Li et al. [22], based on data from 285 prefecture-level cities in China, found that industrial land marketization improves industrial upgrading and technological innovation, reducing carbon intensity within a region and its neighboring regions. Similarly, some literature employed China’s provincial data to determine that land misallocation caused by agreement transfer significantly increases carbon emissions [13]. However, some studies reached completely different conclusions and argue that with increasing the level of urban land marketization, population and capital flows are becoming more frequent and concentrated [24], increasing carbon emissions. For example, Zhang et al. [25] adopted provincial data in China and discovered that urban land marketization induces a boost in carbon emissions by promoting land development and engineering construction.
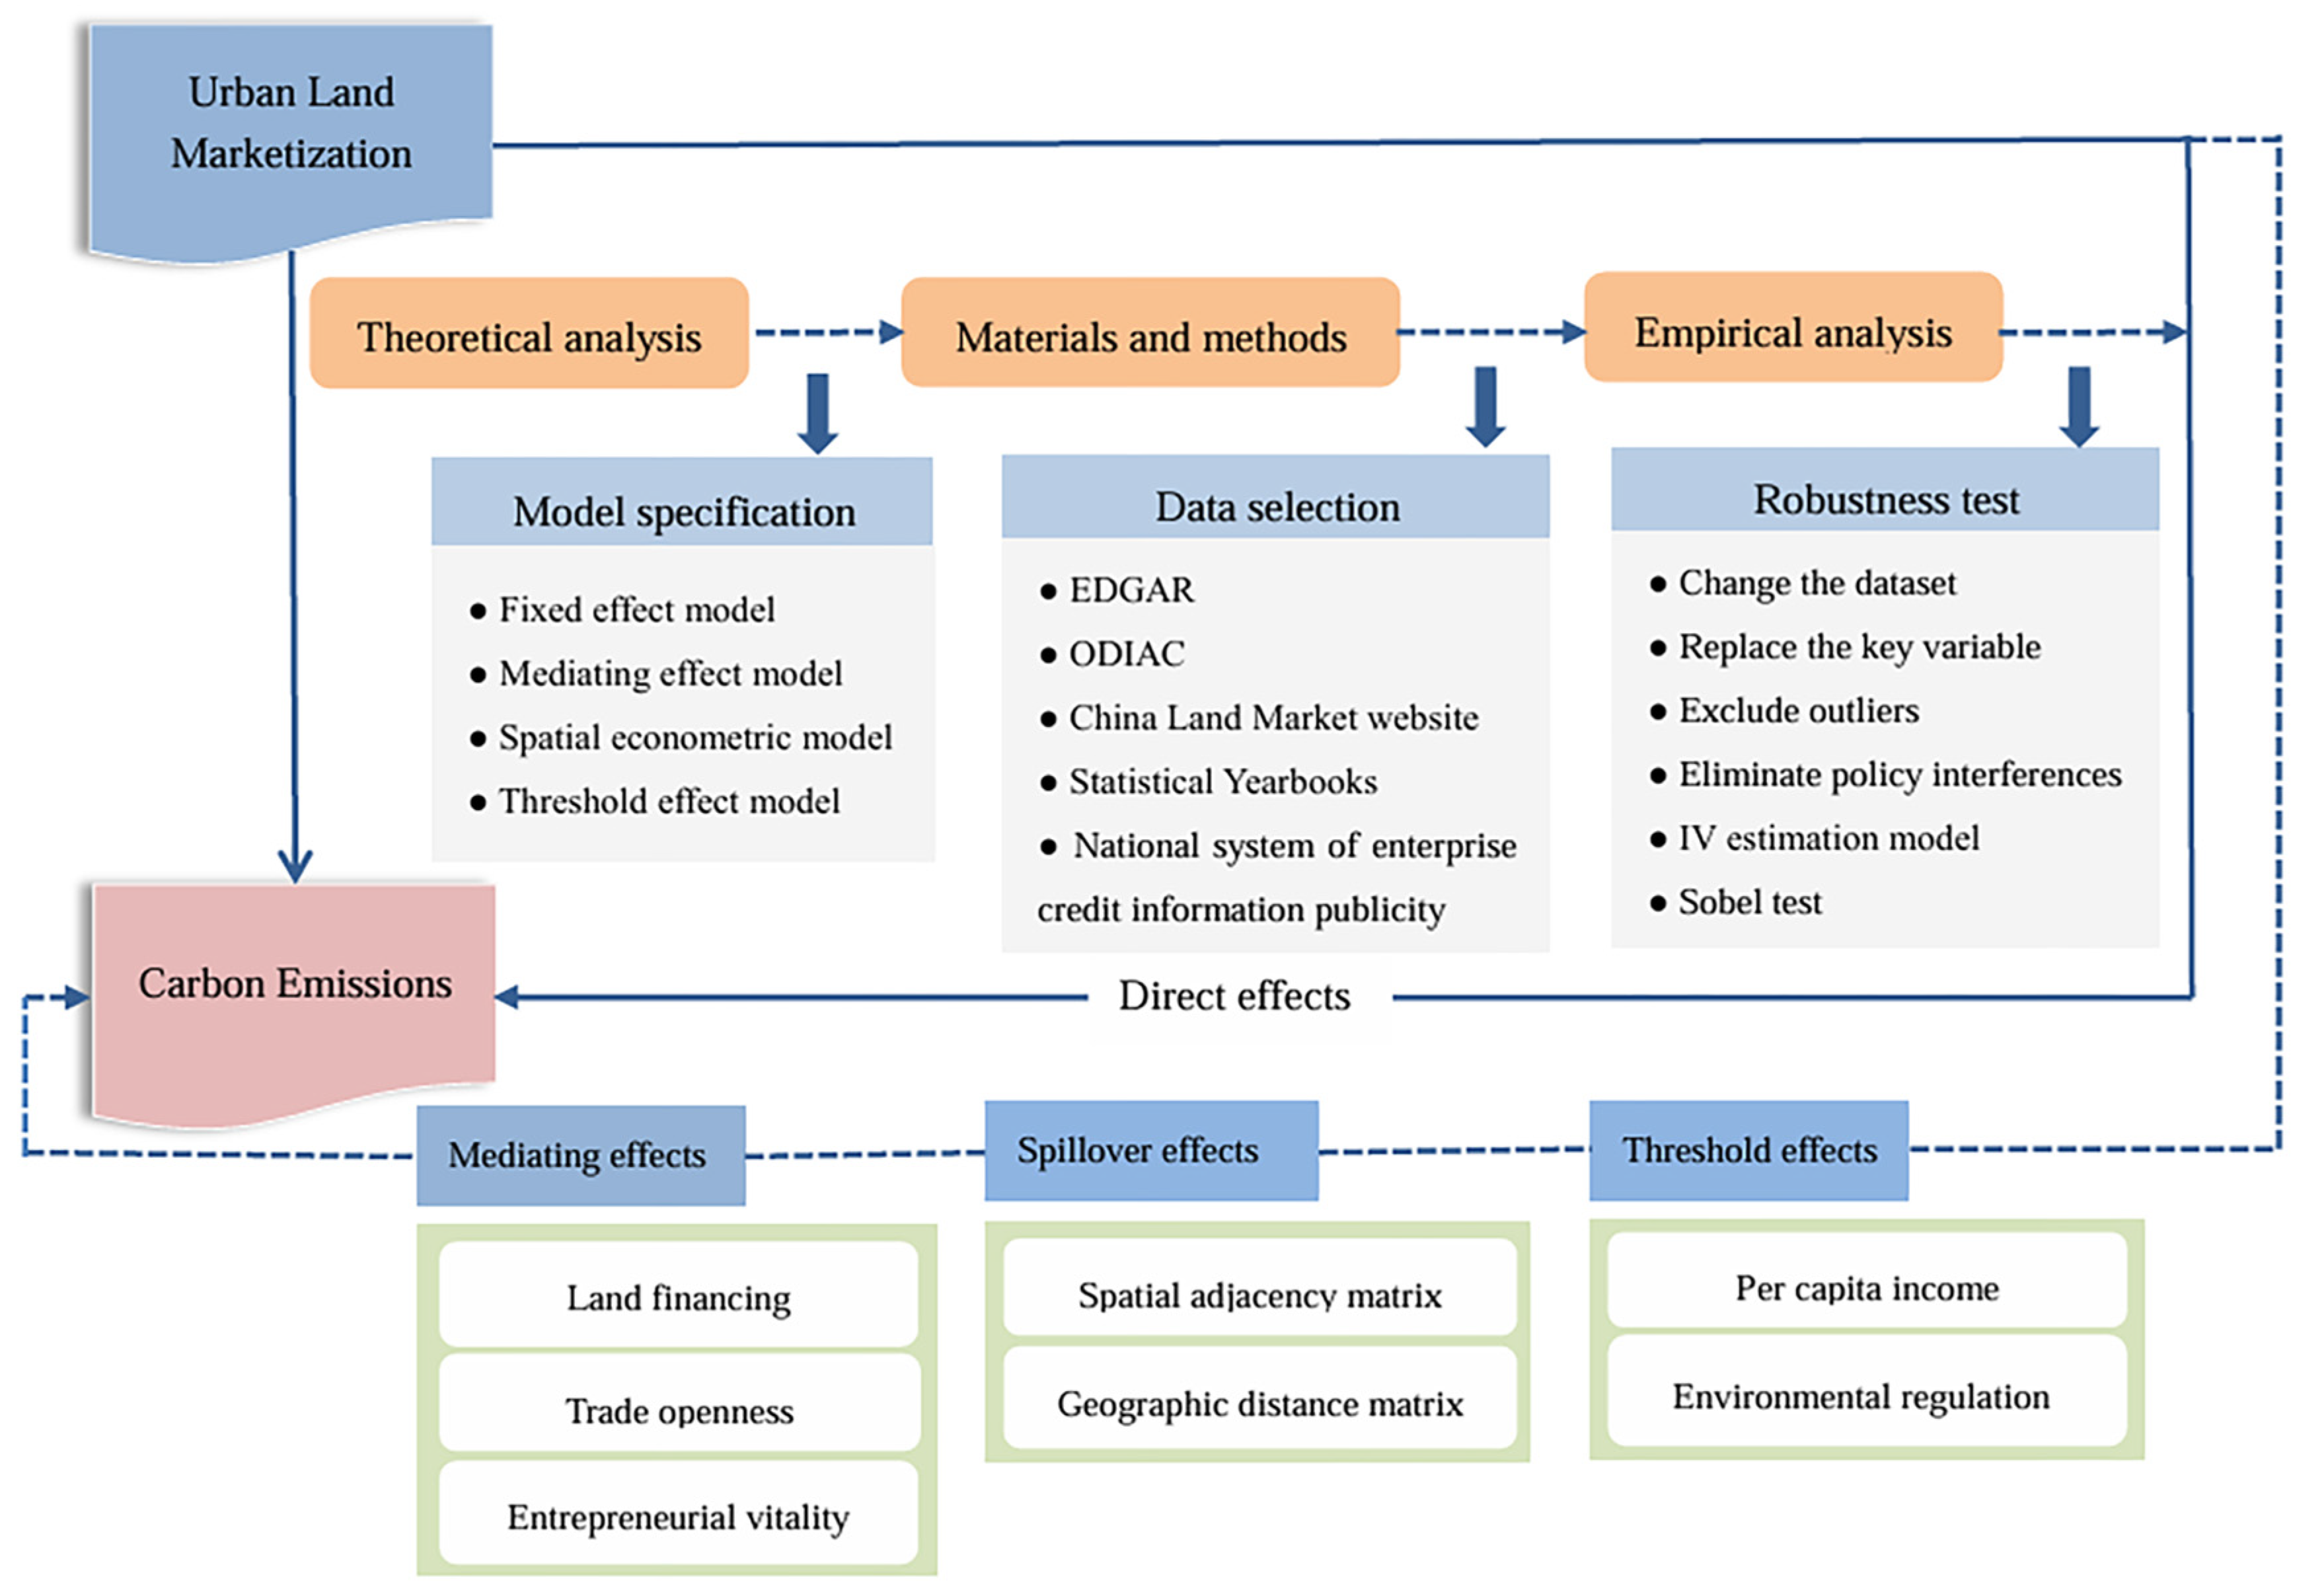
However, existing research still has four main limitations, despite providing sufficient insight into the relationship between marketization and carbon emissions. First, few studies focus on the impact of the land allocation method on carbon emissions, particularly the potential and unexplored mechanisms. Second, most studies focus on the average effects of urban land marketization on carbon emissions, lacking in concentrating on the spatial spillover effects and the nonlinear relationships. Third, studies mainly examine the distortion of the transfer of bidding, listing, and agreement [19,21,22], but neglect to consider the distortion of the auction transfer [26]. This could lead to the overestimation of urban land marketization levels because the government could intervene in the transfer process and prices. Fourth, existing studies primarily use data from statistical yearbooks on land transfer transactions and carbon emissions. This could lead to inaccuracies in the amount of carbon emissions. Figure 1 shows the analytical framework for this article. We investigated the direct effects of urban land marketization on carbon emissions through theoretical hypotheses and empirical analysis, as well as the mediating effects, threshold effects, and spatial spillover effects.
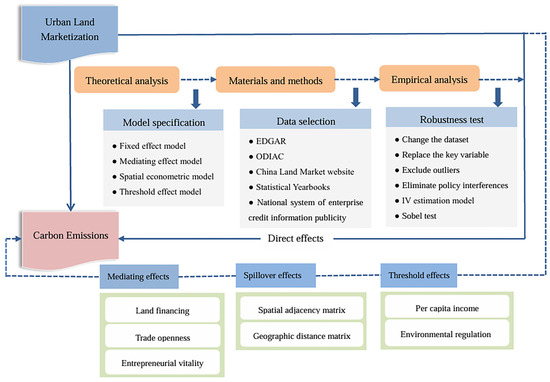
Figure 1.
Analytical framework of impact of urban land marketization on carbon emissions.
The contribution of this article’s findings can be summarized as follows: First, previous studies mainly used official statistical yearbooks, and the data were old, lacking sufficient proof from multi-source data. We investigate the impacts of urban land marketization on total carbon emissions and carbon emission intensity by using multiple data sources, which include the China Land Market Network, global grid data, raster data of carbon emissions, and statistical yearbooks. This helps provide novel and strong evidence for the ongoing debates and methodological references for future research. Second, most studies focus on the resource attributes of adjustment of industrial structure and technological innovation [21,22], and lack of consideration of the economic attributes of government financing, investment, and enterprise costs. This paper incorporates land financing, trade openness, and entrepreneurial vitality into the analytical framework for the first time to explain how urban land marketization affects carbon emissions. This helps enrich the theory of land resource allocation and provides a reference for carbon emission reduction in developing countries and emerging economies. Third, the impact of urban land marketization on carbon emissions may have different characteristics under different external influences, such as geographical relations, economic development, and environmental regulations. We provide an early insight into the spatial spillover effects and nonlinear relationships under different levels of per capita income and environmental regulation to improve our knowledge. Fourth, existing studies usually take the auction price as the full market price, but the real market price will reach the mean reversion in a certain region. This paper employs the average price of bidding, auction, and listing as the standard price to calculate the marketization level of urban land, considering the potential distortion of the auction transfer.
2. Theoretical Analysis and Research Hypotheses
Figure 1 shows a theoretical framework for understanding the relationship between urban land marketization and carbon emissions. Initially, rent dissipation theory and resource allocation theory are used to formulate hypotheses regarding the direct effects of urban land marketization on carbon emissions. Subsequently, the operational mechanisms are systematically analyzed across three dimensions, mediating effects, spatial spillover effects, and threshold effects, with corresponding research hypotheses provided.
2.1. The Impacts of Urban Land Marketization on Carbon Emissions
Following rent dissipation theory and resource allocation theory, market-oriented allocation of urban land resources can decrease “rent dissipation” caused by rent-seeking activities in local governments [27], thereby improving resource allocation efficiency [28] and environmental quality [20,29]. Unlike the planning allocation of government intervention, urban land marketization contributes to preventing official corruption in rent-seeking activities [26], developing market thresholds, and reducing carbon emissions [13,21,30]. Specifically, market-oriented allocation of urban land plays a key role in alleviating government intervention in land resource misallocation and curbing local governments’ “bottom-line competition” behavior [19], which helps curb energy-intensive, carbon-intensive, and inefficient enterprises related to officials entering the market, promoting low-carbon development. Thus, urban land marketization could select enterprises with high production efficiency and low emissions to enter the market, achieving carbon emission reduction [16,17,18].
Hypothesis 1.
Urban land marketization contributes to reducing carbon emissions.
2.2. The Mechanisms of Urban Land Marketization on Carbon Emissions
2.2.1. Land Financing
The role that urban land marketization plays in promoting land financing has been widely recognized [27,31,32]. In the process of land market transactions, local governments could provide limited land resources to entrepreneurs associated with officials, which results in the serious erosion of state assets and even leads to a number of illegal land activities, such as “rent-seeking” corruption [19,26]. In contrast, by using market mechanisms to transfer land, governments could increase their explicit fiscal revenue and degree of self-sufficiency by making use of the values and attributes of the land. Green and low-carbon development would be encouraged through land financing. Land financing and local government debt exhibit a substitution relationship [33]. With an increase in the scale of land financing, local governments could enhance environmental regulatory standards and improve investment attraction quality since financial and debt burdens are relieved. Moreover, it provides more fiscal expenditures for environmental protection and public goods [32], resulting in a reduction in carbon emissions. In addition, urban land marketization could provide governments with the opportunity to obtain fiscal revenue in order to decrease the number of mortgage loans issued by financial institutions such as banks and securities companies and enhance the scale and availability of enterprise loans [31], which would help relieve financing constraints for equipment replacement, technology research, and development.
2.2.2. Trade Openness
Local government intervention has resulted in a lower market price for land than its marginal price, which seriously undermines the competitive incentive mechanism based on market-oriented allocation. This leads to inefficient land use and overcapacity, which does not promote high-standard opening up [34], reducing carbon emissions by converting old energy to new kinetic energy [19]. Firstly, urban land marketization, under the comparative advantage principle, will provide more land resources to realize local specialized production for the purpose of expanding the production scale of domestic intermediate goods of high value. Meanwhile, urban land marketization could increase market opportunities and competitiveness in order to reduce trade barriers [34] and transaction costs, thereby developing the domestic market and promoting international commodities. Secondly, the “Pollution Halo” effects of trade openness would reduce carbon emissions through the diffusion of cleaner technologies and practices. Since trade liberalization has progressed, the international division of labor and the expansion of industrial chains would be conducive to the reduction in production costs and energy consumption. In addition, trade openness could stimulate enterprise competition and knowledge flow to introduce advanced technology and management experiences through trade exchange [35,36,37]. This would contribute to prompting environmental quality management of domestic enterprises to be in line with international standards [38] and achieving carbon emission mitigation.
2.2.3. Entrepreneurial Vitality
As the land marketization system improves, institutionalized rules for land market transfer will gradually replace personalized market rules. This helps to create a fair, just, and open market transaction environment, which enables limited land resources to be allocated to entrepreneurs in a more appropriate manner [31], stimulates regional entrepreneurial vitality [19], and reduces carbon emissions. First, institutionalized market allocation helps break the collusion between officials and businesses, which in turn reduces investment in rent-seeking activities and prevents excessive profits and rent-seeking from being obtained by related enterprises. This greatly enhances the enthusiasm of entrepreneurs and enhances their investment preferences, thereby improving market vitality. Second, land marketization would help reduce information asymmetry and transaction costs, provide decision-making for entrepreneurship, and promote the agglomeration of entrepreneurship. Third, urban land marketization could prevent land resources from being allocated to pollution-intensive enterprises [20], promote intensive land use, increase land economic supply, and reduce the difficulty for enterprises to obtain land property rights [7]. Further, the “catfish effect” occurs when new market entrants compel existing firms to innovate and optimize processes. In the context of land marketization, entrepreneurial competition drives firms to adopt green technologies and reduce emissions to maintain competitiveness. Land marketization could help promote mutual competition among market players as successive entrepreneurs enter the market. This could reduce costs and increase efficiency through improving manufacturing processes, introducing advanced management experience, and enhancing product quality. Entrepreneurship is an investment with social capital characteristics. As a result of new entrepreneurship investment practices, market players would be forced to improve their green production efficiency [39] and promote low-carbon development.
Hypothesis 2.
Urban land marketization can promote land financing, expand trade openness, and stimulate entrepreneurial vitality, thereby reducing carbon emissions.
2.3. The Threshold Effects of Urban Land Marketization on Carbon Emissions
2.3.1. Per Capita Income Level
The environmental Kuznets Curve (EKC) hypothesis holds that environmental quality gradually decreases with increasing per capita income and then gradually improves [40,41]. Low income levels tend to lead people to prioritize economic benefits over environmental quality. Local governments always overlook environmental sustainability in favor of market-oriented land allocation for population migration, industrial scale expansion, and infrastructure construction [25]. Moreover, low income levels would lead to an imbalance between fiscal revenues and expenditures. Such fiscal burdens restrict government expenditures on R&D and the application of low-carbon products [32], as well as environmental management, which severely limits the effectiveness of urban land marketization and does not effectively decrease carbon emissions. On the other hand, when income levels are high, individuals have a greater desire for environmentally friendly products and services [42,43]. In addition, the reduction in funding constraints makes technology diffusion and transfer easier. As income levels rise, market players have a greater need for information and a greater expectation of a supervision department. Thus, urban land marketization at higher income levels leads to the emergence of enterprises with high technological content and low energy consumption, thereby reducing urban carbon emissions.
2.3.2. Environmental Regulation
Adopting strict and appropriate environmental regulations encourages enterprises to pursue technical innovation and improve production capacity and quality, thereby counteracting environmental costs with an “innovation compensation” effect [44]. However, as environmental regulations continue to strengthen, this trend toward increasingly stringent regulations could lead to an increase in carbon dioxide emissions, known as the “compliance cost” effect [45,46]. When environmental regulations are relatively weak, enterprises take a portion of production expenses for the development of advanced production equipment and the upgrading of low-carbon technologies [47] in order to comply with environmental standards and maintain competitiveness. This could not only improve marginal production efficiency but also internalize the externality of carbon emissions by motivating enterprises, thereby reducing environmental governance costs. The market players, at this point, are often equipped with certain cutting-edge and green manufacturing techniques, which are more conducive to resulting in a new generation of industries characterized by low energy consumption and low emissions. While environmental regulations can curb the motivation of enterprises to “hitchhike” [48], they can also force them to increase pollution control costs, thereby crowding out investment in R&D [49], as well as disrupting the incentives provided by environmental regulations [50]. As a result, excessive environmental regulations may hinder enterprises from sustaining production activities and entering the market, thereby hindering land marketization’s ability to reduce carbon emissions.
Hypothesis 3.
With low income levels and strong environmental regulation, the impacts of urban land marketization on carbon emissions are positive.
2.4. The Spillover Effects of Urban Land Marketization on Carbon Emissions
For a long time, the “demonstration effect” has been observed in local governments’ land transfer behavior. In order to attract business investment and obtain greater fiscal and tax revenues, local governments often compete with surrounding regions. Through imitation and learning, they gradually align their land resource allocation methods with the practices of their surrounding areas [28]. For instance, Fan et al. [51] calculated the marketization level of urban land in China from 2007 to 2016 and confirmed this conclusion. However, local protectionism and administrative boundaries hinder the coordination mechanism between local governments and the flow of factor resources [52]. Thus, urban economic activities in the surrounding areas are restricted to a large extent. Jiang et al. [28] suggest that urban land marketization has a siphon effect on surrounding regions that is greater than the spillover effect, therefore reducing their land use efficiency. The impact of mismatches in land resources and price distortions on green total factor productivity and carbon emission efficiency has been examined, suggesting that local governments’ land supply behavior adversely affects the environmental quality of nearby areas [53].
Hypothesis 4.
Because of administrative border barriers and regional protectionism, urban land marketization has no spatial spillover effect on carbon emissions.
3. Materials and Methods
3.1. Model Specification
3.1.1. The Benchmark Regression Model
To estimate the effect of urban land marketization on carbon emission intensity, this paper constructed the following benchmark regression model:
where the dependent variable represents total carbon emissions (TCE) and carbon emission intensity (CEI), the independent variable represents urban land marketization, and is a group of control variables. is a constant term. Dummy variables and represent the fixed effect of city and the time fixed effect, respectively. is a random error term.
3.1.2. Mediating Effect Model
To verify Hypothesis 1, according to the mechanism analysis method proposed by Baron and Kenny [54], we establish the mediating effect model on the basis of the benchmark regression model.
where represents the mediating variables, including land financing, trade openness, and entrepreneurial vitality. If is significant and positive, it indicates that urban land marketization helps promote land financing, trade openness, and entrepreneurial vitality, and vice versa. If is significant, this indicates that the mediating effect is valid.
3.1.3. Threshold Regression Model
To verify Hypothesis 2, the following panel threshold regression model is constructed:
where represents the threshold variables, including per capita incomes and environmental regulations, is an indicative function with a value of 1 or 0. If the conditions in parentheses are met, the value of is 1, otherwise 0. Equation (4) considers the double-threshold case, and it can be degenerated to the single-threshold case or extended to the triple-threshold case according to the metrological test of sample data.
3.1.4. Spatial Econometrics Model
To verify Hypothesis 3, we introduce the spatial interaction terms of the dependent variable, independent variable and control variables into Equation (1), and then the spatial Durbin (SDM) model is extended to Equation (5).
where represents the spatial autoregression coefficient and represents the n-dimensional spatial weight matrix. To ensure the robustness of empirical results, we use both spatial adjacency matrix and geographical distance matrix in the spatial econometric model. Specifically, is constructed based on whether cities are adjacent, and is based on the inverse of the squared Euclidean distance between the locations of the municipal government. In addition, and are the elasticity coefficients of the spatial interaction terms of urban land marketization and control variables, respectively.
3.2. Variable Selection
3.2.1. Dependent Variable
The dependent variables are total carbon emissions and carbon emission intensity. The former is measured as the logarithm of total carbon emissions, and the latter is measured as the logarithm of carbon emissions per unit of actual GDP (2007 is selected as the base period).
3.2.2. Independent Variable
Urban land marketization refers to the extent to which land is used as a production factor and allocated through the market. At present, there are three measures. (1) The absolute index method mainly uses the area, parcel, or price of market-oriented land transactions as a measure of urban land marketization [55,56]. (2) The relative index method is the most common method for measuring urban land marketization, which is defined as the proportion of bidding, auction, and listing transfers [19,57,58]. (3) The complex index method mainly establishes an index system and applies a multi-factor weight evaluation method [59,60], thereby indirectly calculating the marketization level of urban land. Owing to the regional characteristics of the land market, the absolute index method is often unable to compare different regions, and the complex index method has a multiplier effect between the evaluation factors [60]. Therefore, the second method is usually used to measure the level of urban land marketization.
Drawing on the practice of previous studies [19,61], we use the average price of bidding, auction, and listing as the standard price to correct the area proportion of bidding, auction, and listing transfers, and it is used to measure the marketization level of urban land. The reason is that the potential distortions in market-oriented land resource allocation caused by bidding, auction, and listing practices in practice, as well as auction transfer, are rarely considered by local governments [61]. This method can be shown in Equation (6):
where represents the marketization level of urban land in city at time , represents the transfer method of bidding, auction, listing, or agreement, while represents the area of land transfer under method in city at time . The weight of method is represented by .
We collected data on 2,729,883 land transfers in China during 2007–2021. The data process is mainly as follows. First, we found that there were no duplicate data on the city, total land transfer price, and area at the same time. We unified the land use into the first-class land category according to “Current land use classification (GB/T21010-2017)”, as well as the methods of land transfer. Then, we deleted the samples with null values for “transfer methods”, “transfer areas”, and “transfer prices”, and then winsorized 2% for land transfer prices and areas to exclude the impact of outliers. Finally, we eliminated the influence of price factors by using the GDP deflator (selecting 2007 as the base period). Based on this, we calculated the marketization level of land transfer.
3.2.3. Control Variables
To avoid the estimation deviation caused by omitted variables, we use the following control variables [1,43,62]. Urban population (UP) is expressed by the logarithm of the total urban population at the end of the year. Industrial structure (IS) is expressed by the ratio of the added value of the second industry to GDP. Financial development (FD) is expressed by the logarithm of the ratio of the loan balance of financial institutions to GDP. Fiscal expenditure (FE) is expressed by the ratio of fiscal expenditure on science and education to the local fiscal expenditures in the general budget. Digital development (DD) is expressed by the logarithm of the ratio of telecommunication revenue to urban population. Urban green space (UG) is expressed by the ratio of urban green space area to administrative area.
3.2.4. Mediating Variables
Based on the above theoretical analysis and hypotheses, we selected the following mediating variables: (1) Land financing (LF). This study uses the logarithm of urban land transfer revenue to represent the scale of land financing [32]. (2) Trade openness (TO). We use the logarithm of the ratio of total exports to imports for urban populations as the proxy variable for trade openness [63]. (3) Entrepreneurial vitality (EV). Since the number of urban enterprises and new start-ups could be affected by city size, we employ the logarithm of the ratio of the number of registered industrial and commercial enterprises in that year to the administrative area to measure entrepreneurial vitality.
3.2.5. Threshold Variables
This paper uses the ratio of actual GDP to total urban population as a measure of per capita income level [40] and the index of total pollution of urban industrial SO2, smoke dust, and wastewater emissions as a measure of environmental regulation [64]. The specific methods used are as follows:
where is a dimensionless variable, referring to the level of environmental regulation in city at time , is the emission intensity of pollutant in city at time (measured by the ratio of the total emissions of pollutant to the actual added value of the secondary industry), and is the relative emission level of pollutant .
3.3. Data Source
The data on carbon dioxide emissions are derived from grid data provided by the Emissions Database for Global Atmospheric Research (EDGAR). We converted grid data into raster data and summarized the panel data of the carbon emissions of each city in China (unit: tons) by adopting R language 4.3.1 and ArcGIS 10.4 software. Land transaction data are obtained from the China Land Market Network (https://www.landchina.com/, accessed on 3 January 2024), which contains detailed information for each parcel, such as land transaction date, method, area, and price. Since land market reform was implemented by the Chinese government in 2007, the transaction information must be public and disclosed. In view of the adjustment of administrative division and the data availability, we select the panel data of 284 prefecture-level cities from 2007 to 2021 as the research samples, where some missing data are supplemented by linear interpolation. The variables are primarily from the China City Statistical Yearbook, China City Construction Statistical Yearbook, Provincial Statistical Yearbooks, City’s Statistical Yearbooks, and City’s Statistical Bulletins. The data on enterprise registration are derived from the national system of enterprise credit information publicity. Description statistics of the variables are shown in Table 1.

Table 1.
Description statistics of the variables.
4. Results
4.1. The Impact of Urban Land Marketization on Carbon Emissions
In Table 2, columns (1) and (3) represent the results of urban land marketization on carbon emissions without including control variables, whereas columns (2) and (4) represent the results after including control variables. The coefficients for ULM were negative and passed at least a 5% significance level test—regardless of whether control variables were included. Specifically, after including control variables, the coefficients of ULM for the total amount of carbon emissions and carbon emission intensity were −0.0482 and −0.1239, respectively. We found that increasing the marketization level of urban land by 1% reduced total carbon emissions by 4.82% and carbon emission intensity by 12.39%. Thus, the long-term goal of “dual carbon” could be achieved by promoting land market development. Meanwhile, the market-oriented allocation of land resources exerts a greater impact on carbon emission intensity than total carbon emissions because China has always pledged to international communities with a binding reduction target for carbon emission intensity. Thus, Hypothesis 1 is validated.
Table 2.
The benchmark regression results.
4.2. Robustness Tests
4.2.1. Change the Data Source
There is no singular accounting method or process of carbon emissions, which could have an important impact on the empirical results. We replaced the above dataset with data provided by the Center for Global Environmental Research. The results are presented in columns (1) and (2) of Table 3. We found that the relationship between urban land marketization and carbon emissions is significant and negative after considering the potential bias in the calculation of total carbon emissions. This indicates that urban land marketization inhibits carbon emissions.
Table 3.
Results of replacing the datasets and the core variables.
4.2.2. Replace the Variables
In addition, the measurement errors in the variables could affect the reliability of the result. Drawing on prior studies, we use per capita carbon emissions as the dependent variable [62,65] and replace the independent variable with the area ratio of bidding, auction, and listing based on the auction price as the standard price to check robustness [19,58]. As shown in columns (3) to (6) of Table 3, the impact of urban land marketization on carbon emissions is negative at least at the 5% significant level, which indicates that urban land marketization contributes to achieving carbon emission reduction, affirming the robustness of the benchmark regression results.
4.2.3. Adjust Selected Samples
This study excludes the municipalities directly under the central government (Beijing, Tianjin, Shanghai, and Chongqing) from the research sample. The results are presented in columns (1) and (2) of Table 4. The estimated coefficients for urban land marketization on total carbon emissions and carbon emission intensity remain significantly negative, and the coefficients are the same as the benchmark regression results, suggesting that the empirical results are robust.
Table 4.
Results of adjusting selected samples, removing the outliers, and controlling for province fixed effects.
4.2.4. Remove the Outliers
Outliers could influence the estimation results. As a result, we remove the outliers of the data on carbon emissions at two-sided 2%, and the results are shown in columns (3) and (4) of Table 4. We also find that the inhibiting effects of urban land marketization on carbon emissions are still significant.
4.2.5. Control for Province Fixed Effects
Local governments are influenced by higher-level governments when it comes to land supply [65]. We adopt the approach used by Yang et al. [19] to control the influence of provincial fixed effects in the benchmark regression model. Columns (5) and (6) of Table 4 provide the detailed results. The findings suggest that the impacts of urban land marketization on carbon emissions are not affected by the government at a higher level.
4.2.6. Eliminate the Interference of Other Policies
Moreover, the treatment effects related to the policies of carbon emission reduction may be a potential factor that affects the robustness of the results. To ensure that the impacts of urban land marketization on carbon emissions are effective, we incorporate dummy variables representing the policy implementation at the prefecture level, including the Low-carbon Cities Pilots (LCPs) launched in 2010, the Innovative Cities Pilots (ICPs) launched in 2008, and the Smart Cities Pilots (SCPs) launched in 2012. As shown in Table 5, the coefficients for the marketization of urban land are always significant and negative. As a result, urban land marketization had a robust and negative impact on carbon emissions when other policy interferences were excluded.
Table 5.
Results of eliminating the interference of other policies.
4.2.7. Consider the Endogeneity Problems
Following the methodology used by Du and Li [20], we lagged the marketization level of urban land and the interaction term of the area ratio of urban slopes less than 15°1 and the corresponding year as instrumental variables to evaluate the effects of urban land marketization on carbon emissions. Table 6 presents the results of instrumental variable estimation. Columns (1) to (3) of Table 6 exhibit the results of lagging the marketization level of urban land and the interaction term of the area ratio of slopes less than 15° and the corresponding year. The results of the F statistic and LM statistic indicate that the above instrumental variables satisfy the assumption of exogeneity, and the benchmark regression results are not distorted. Moreover, we only employ lagged urban land marketization as the instrumental variable. As shown in columns (4) to (6), the above conclusion is also confirmed.
Table 6.
Results of the instrumental variable estimation.
4.3. Mediating Effect Analysis
Table 7 reports that the coefficient of urban land marketization on the scale of land financing is positive, which is significant at the 1% level. This suggests that local governments can alleviate the distortion of land prices and increase the explicit income from land transfer by promoting the development of urban land marketization and presenting the attributes of land assets, which is consistent with the conclusion drawn by Cheng et al. [32]. Moreover, the results in columns (2) and (3) indicate that the coefficients of the mediating variables are significant and negative when incorporating land financing into the benchmark model, which supports Hypothesis 2.
Table 7.
Results of mechanism verification.
As shown in column (4), the estimated coefficient for urban land marketization is positive at the 10% significance level. This implies that urban land marketization is beneficial in enhancing the competitive matching mechanism and highlighting the comparative advantage of resource endowment, which in turn generates a favorable market environment for trade openness through enhancing commodity production and interregional division of labor. This is consistent with the findings of Jin and Zhou [34]. Meanwhile, the results in columns (5) and (6) indicate that trade openness plays a significant mediating role in the carbon emission reduction effects, which confirms Hypothesis 2.
In column (7), the impact of urban land marketization on entrepreneurial vitality is positive, which is significant at the 1% level. This could be attributed to the ability of urban land marketization to foster a fair and open market environment, reduce transaction costs incurred by enterprises in rent-seeking activities, and greatly enhance the dynamism of market participants and their enthusiasm for entrepreneurial endeavors. Meanwhile, the coefficients of columns (8) and (9) suggest that entrepreneurial vitality exerts negative effects on carbon emissions. The instrumental variable method was used to examine the test the robustness of the empirical results, and the results remained significant (in Table S1). Hypothesis 2 was verified.
4.4. Threshold Effect Analysis
4.4.1. Selection of Threshold Models
Before estimating the threshold effects, the method of Hansen [66] is used to test the panel threshold effects. The results of the threshold effects for repeated sampling 300 times are shown in Table 8. Accordingly, the threshold variable of per capita income level significantly exceeds the double-threshold test but does not pass the triple threshold. Additionally, environmental regulation significantly passes the single threshold when the dependent variable is the total carbon emissions; when the carbon emission intensity is the dependent variable, it passes the double-threshold test. This paper establishes corresponding threshold models to estimate the threshold effects, and the results are shown in Table 9. Threshold values and confidence intervals for threshold variables are presented in Table S2.
Table 8.
Results of the threshold effect tests.
Table 9.
Results of the threshold effects.
4.4.2. Analysis of the Threshold Effects
Table 9 shows the results of the threshold effects. The results of columns (1) and (2) describe an inverted U-shaped relationship between urban land marketization and carbon emissions when the per capita income level is the threshold variable. When per capita income is lower than the first threshold, the marketization of urban land leads to an increase in carbon emissions. When per capita income is between the first threshold and the second threshold, the impact is negative, but this does not work on a large scale. However, when per capita income exceeds the second threshold, urban land marketization significantly inhibits the production of carbon emissions.
The results of columns (3) and (4) reveal that when the degree of environmental regulation is the threshold variable, the carbon emission reduction effect of urban land marketization is limited. When the degree of environmental regulation is lower than the first threshold, the coefficients of urban land marketization on carbon emissions are negative at the 1% significance level. However, as environmental regulation surpasses the first threshold, the impact of urban land marketization on carbon emissions gradually shifts from negative significance to negative insignificance and even to positive significance at the 5% level. Thus, Hypothesis 3 is verified.
4.5. Spillover Effect Analysis
4.5.1. Selection of Spatial Econometric Models
This paper uses Moran’s I index to test the spatial autocorrelation for total carbon emissions, carbon emission intensity, and urban land marketization, and the results are presented in Table 10. We found that Moran’s I index is greater than 0 from 2007 to 2021 at the 1% significance level, which indicates that the spatial distribution of urban land marketization and carbon emissions show a clustering pattern. The Lagrange multiplier test (LM test) is also required to determine the specific form of the spatial econometric model. The results of the LM test are presented in Figure S1. We observed that the LM-lag test, LM-error test, Robust LM-lag test, and Robust LM-error test are positive at the 1% significant level, which indicates that both the spatial autoregressive model (SAR) and spatial error model (SEM) are valid. Therefore, the spatial Durbin model (SDM) should be used to investigate the spatial spillover effects of urban land marketization on carbon emissions.
Table 10.
Results of spatial autocorrelation test (Moran’s I index).
4.5.2. Analysis of the Spatial Spillover Effects
Table 11 presents the results of the spatial spillover effects of urban land marketization on carbon emissions under two different spatial weight matrixes. Following the test method proposed by Elhorst [67], the SDM, the Hausman test, and the Wald test are used to determine whether the fixed-effects model or random-effects model is optimal, and whether the SDM degenerates into the SAR model or the SEM, and the fixed-effects model of the SDM is the optimal model. Moreover, the LR test confirms the rationality of the model selection. The results of columns (1) to (4) indicate that the spatial autoregressive coefficient of total carbon emissions and carbon emission intensity is significant and positive. However, the spatial interaction coefficients of urban land marketization are not significant, suggesting that the sample cities just have spatial internal interaction effects of carbon emissions but no external interaction effect of land marketization. Because of the potential estimation errors stemming from the spatial interaction term coefficients caused by imprecise point estimates, this study employs partial differential equations to decompose the direct effects and indirect effects (i.e., spillover effects). We found that urban land marketization has no spillover effects on carbon emissions, thus supporting Hypothesis 4.
Table 11.
Results of the spatial spillover effects.
4.6. Heterogeneity Analysis
Table 12 presents the results of the heterogeneity analysis. In Panel A, we report the results of the heterogeneity analysis using total carbon emissions as the dependent variable. Panel B shows the results of the heterogeneity analysis for carbon emission intensity as the independent variable.
Table 12.
Results of heterogeneity analysis.
4.6.1. Regional Heterogeneity Analysis
In China, there are significant differences in location. Does regional heterogeneity affect the carbon emission reduction effect of urban land marketization? Columns (1) and (2) represent the results of regional heterogeneity2. We observed that urban land marketization in the eastern region has no impact on carbon emissions, while it has a significant negative impact in the central and western regions. Because the eastern regions are closer to coastlines, have more ideal international trade channels and external communication networks, and have stronger market competitiveness, the levels of trade openness for cities located in eastern regions are relatively high. However, the effect of urban land marketization on carbon emissions is not significant. The reason is that they are better able to integrate into the international economic system, attract a large amount of commodity circulation and trade cooperation, and then generate the “Pollution Halo” effect of trade openness. Cities located in the central and western regions of China are deep in the inland, with little international integration and few opportunities for international cooperation. Therefore, the improvement of land marketization would foster a good market environment, encourage trade opening and cooperation, and facilitate the development of low-carbon economies.
4.6.2. City-Tier Heterogeneity Analysis
In addition, the city tier could also have an impact on the emission reduction effect of urban land marketization. The results of city-tier heterogeneity are shown in columns (3) and (4)3. The results show that land marketization in capital cities has no significant impact on carbon emissions, whereas land marketization in non-capital cities has a significant and negative impact on carbon emissions, indicating that the development of land markets in non-capital cities is more conducive to promoting urban low-carbon development than in capital cities. First, capital cities have more advantages in terms of government budgets and fiscal revenues. In capital cities, the relationship between land supply and demand is more imbalanced, resulting in relatively high land prices and fiscal revenue, and they always assume more government functions and responsibilities. Second, capital cities have more advantages in terms of entrepreneurial conditions. They could have more innovation resources, better entrepreneurship policies, and entrepreneurial environments, which help stimulate entrepreneurial enthusiasm and vitality. Thus, urban land marketization has a very limited impact on carbon emissions, whereas the carbon emission reduction effects of urban land marketization in non-capital cities are more obvious.
4.6.3. City-Type Heterogeneity Analysis
Depending on the city type, divided according to the nature of resource dependence, the effects of urban land marketization on carbon emissions could be different. The results of heterogeneity analysis for city type are reported in columns (5) and (6)4. Based on the results, we found that the carbon emission reduction effects of urban land marketization in resource-dependent cities are greater than in non-resource-dependent cities. One of the possible explanations is that resource-dependent cities always have an industrial structure with the characteristics of a single economy; that is, they are dominated by energy-intensive industries, such as energy extraction and mineral processing. Under the circumstances, land use rights are often monopolized by local governments or large developers, and the supply and demand in the land markets are inflexible, resulting in higher greenhouse gas emissions. However, the industrial structure of non-resource-dependent cities is more diversified, including service, scientific, and technological innovations. Land use patterns are also more comprehensive, making it easier to mitigate carbon emissions.
5. Discussion
5.1. Interpretation of Findings
In this article, we used the average price of bidding, auction, and listing as the standard price to correct the marketization level of urban land transfer and investigate the impacts of urban land marketization on carbon emissions by providing scientific measurements, a method different from previous literature that overlooked the potential distortions of different land transfer methods [22]. The findings of this article are essentially in accord with the existing literature and confirm the positive role of urban land marketization [19,20,61]. We found that urban land marketization significantly inhibited carbon emissions from 284 Chinese cities at the prefecture level. Different from the previous literature that emphasized land use misallocation and price distortion [13,68], this paper focuses on the role of the market-oriented allocation method. These findings emphasize the efficiency gains from reduced rent-seeking and improved resource allocation. The reduction is stronger in central/western and resource-dependent cities, where marketization disrupts entrenched government interventions that previously favored energy-intensive industries. Conversely, in economically advanced eastern cities, where the industrialization level is already low and the market mechanism is more mature, marginal gains from further marketization may diminish. This nuance underscores the importance of tailoring land policy reforms to regional disparities rather than adopting a one-size-fits-all approach. Moreover, this paper plays an important role in resolving the existing debate on urban land marketization and carbon emissions. Similar to the conclusion of Li et al. [22] on industrial land marketization, we provide novel evidence in support of the perspective that market-oriented land allocation and reform can help reduce carbon emissions [69] instead of thinking that urban land marketization results in an increase in carbon emissions [25].
Previous studies have investigated whether urban land marketization can inhibit carbon emissions through economic growth, structural optimization, and technological innovation [13,21,22,30]. However, unlike these studies, we incorporated land financing, trade openness, and entrepreneurial vitality into the analytical framework for the first time to examine how urban land marketization affects carbon emissions. In our study, we confirmed that these variables have a significant mediating effect. Previous studies hold that local governments’ efforts will decrease environmental regulation standards and expand urban boundaries to increase land fiscal revenue, thereby increasing carbon emissions [55,70]. In contrast to this land financing approach, with the continued development of land transfer markets, local governments help obtain land increment benefits and increase local fiscal revenue by promoting urban land marketization. Land financing emerged as the most impactful channel, likely due to its direct fiscal benefits for local governments, which enable investments in green infrastructure and stricter environmental oversight. In addition, the means behind our findings support the “Pollution Halo” effect of trade openness rather than the “Pollution Haven” effect [35,38,71]. This shows that trade openness plays an important role in importing clean technologies and reducing carbon-intensive production chains. Our analysis also shows that urban land marketization helps improve the market access threshold [29], break the existing competitive situation, and transfer land resources to developers and enterprises with low energy consumption and emissions as soon as possible [19], thus continuously inhibiting carbon emissions. Although entrepreneurial vitality is theoretically promising, it showed the smallest effect, potentially because new market entrants in developing economies often prioritize rapid growth over sustainability, diluting the immediate carbon reduction impact.
Furthermore, the EKC hypothesis and the Porter hypothesis are widely used in discussing environmental issues in the existing literature [47,72]. While most studies have disproved this relationship [48,73], our study confirms the environmental Kuznets hypothesis and the Porter hypothesis [47]. Specifically, cities mainly depend on resource-intensive and capital-intensive industries at the low-income stage [74], making emission reduction and efficiency improvement difficult due to insufficient capital accumulation. As income level has increased, residents’ requirements for environmental quality have increased greatly [43], and productivity has also been further developed, which could provide necessary conditions for the function of resource allocation in the market mechanism. Additionally, the relationship with environmental regulation was counterintuitive. Our findings reveal that the “innovation compensation” effect would be generated under moderate environmental regulation conditions [48]. This suggests a policy trade-off: while regulation is necessary to prevent environmental free-riding, excessive rigidity may stifle the very market dynamism needed for sustainable transitions.
Finally, we found that the spatial autocorrelation coefficients of total carbon emission, carbon emission intensity, and urban land marketization are significantly positive, which may lead to bias in the impacts of urban land marketization on carbon emissions [22]. However, few studies have used spatial econometric models to estimate this effect. Despite interregional integration, land marketization’s benefits remain geographically contained due to fragmented fiscal incentives and competition. This finding contrasts with studies highlighting spillovers in industrial land markets [22]. For policymakers, this implies that cross-regional coordination mechanisms are critical to unlocking spillover potential, such as regional carbon trading platforms.
5.2. Policy Recommendations
We put forward the following policy implications. First, the market should play a crucial role in land resource allocation. The superior governments should strengthen supervision and oversight of the land resource allocation. Moreover, local governments should enhance open, just, and fair transaction rules to consolidate the effects of emission reduction. Second, local governments are responsible for protecting the right to land value-added revenue, increasing explicit fiscal revenue, achieving a high level of trade openness, improving the quality of cooperation, and creating a good market environment to stimulate entrepreneurial activity. Third, the government should be concerned not only with promoting economic growth and capital accumulation but also with preventing the implementation of high environmental regulation standards from killing the motivation of market players and entrepreneurs. They also should strengthen the establishment of cross-regional coordination mechanisms to overcome barriers to administrative boundaries and local protectionism. Fourth, under the current market-oriented allocation reform, new schemes of land market development should be arranged in the eastern, capital, and non-resource-dependent cities.
5.3. Limitations
There are three limitations to this study that could provide directions for further work. First, a complete analysis of the mechanism should be conducted to clarify how urban land marketization affects carbon emissions. Specifically, the mediating roles of industrial restructuring patterns and energy-intensive infrastructure development could encourage countries to promote the development of land markets to reduce carbon emissions. Under different cultural contexts, there are differentiated effects of urban land marketization on carbon emissions. Second, local governments of different administrative levels could affect the allocation of urban land resources, and further research into the multi-scale perspective of governments at different levels is an important direction. This requires comparative studies across administrative hierarchies (e.g., provincial vs. municipal governance) using hierarchical linear modeling, complemented by spatial econometric approaches to examine cross-regional spillover effects. Third, urban land marketization involves a wide range of land use patterns, including commercial land, industrial land, and residential land, and a typological analysis of commercial, industrial, and residential parcels should be carried out through using micro land transaction data coupled with business data.
6. Conclusions
Focusing on the fact that urban land marketization has a critical impact on China’s social and economic development, this paper investigates whether urban land marketization could effectively contribute to carbon emissions. We construct multiple datasets comprising millions of land transaction records, carbon emission grid data, raster data, and enterprise registration data. We provide new evidence of the effects of urban land marketization on total carbon emissions and carbon emission intensity, using panel data from 284 prefecture-level cities in China from 2007 to 2021 and applying the fixed-effect model, mediating effect model, threshold regression model, and spatial econometric model.
This paper draws the following conclusions: First, urban land marketization is a key factor in promoting low-carbon development. In particular, it has a greater carbon emission reduction effect in eastern regions and non-capital and resource-dependent cities. In central/western cities, transparency should be prioritized in land transactions to curb corruption and ensure equitable resource allocation. In coastal cities, trade openness should be leveraged to strengthen “Pollution Halo” effects via stricter alignment with international environmental standards. Fiscal dependency should be addressed by diversifying revenue streams to increase the revenue of local governments. Second, this study bridges a critical gap in the land–carbon literature by integrating economic attributes with traditional land allocation frameworks. Unlike prior studies, the main channels of urban land marketization’s impact on carbon emissions are promoting land financing, generating the “Pollution Halo” effect of trade openness, and stimulating the “catfish effect” of entrepreneurial activity. Third, there is a nonlinear variation trend in carbon emissions as the per capita income level increases and the degree of environmental regulations is improved. This is consistent with characteristics of the EKC hypothesis and the Porter hypothesis, in that the carbon emission effect first promotes and then inhibits, and first inhibits and then promotes, respectively. However, the nonlinear relationship between land marketization and emissions challenges the assumption of linear policy efficacy. For instance, stringent environmental regulations in developed regions may inadvertently suppress marketization’s benefits due to compliance costs, while weaker regulations in underdeveloped areas amplify risks of elite capture. In addition, due to the obstacles of administrative boundaries and the deficiencies of regional coordination mechanisms, marketization has failed to reduce surrounding cities’ carbon emissions.
Supplementary Materials
The following supporting information can be downloaded at: https://www.mdpi.com/article/10.3390/land14030618/s1.
Author Contributions
Conceptualization, J.L.; methodology, J.L.; software, J.L.; writing—original draft preparation, J.L.; validation, J.L.; writing—review and editing, S.L.; funding acquisition, S.L. All authors have read and agreed to the published version of the manuscript.
Funding
This research was funded by The National Social Science Fund of China, Research on Policy Evaluation and Risk Assessment of Collective-Owned Construction Land Reform [24BJL007].
Data Availability Statement
The data that support the findings of this study are available on request from the corresponding author.
Acknowledgments
Thanks for Dan Cheng’s valuable suggestions in revising the manuscript.
Conflicts of Interest
The authors declare no conflicts of interest.
Notes
| 1 | The slope data are derived from NASA ASTER Global Digital Elevation Model V003. |
| 2 | The eastern region in mainland China includes Beijing, Tianjin, Hebei, Shanghai, Jiangsu, Zhejiang, Fujian, Shandong, Guangdong, Hainan and Liaoning; The central region includes Shanxi, Henan, Hubei, Hunan, Anhui, Jiangxi, Heilongjiang and Jilin; The western region includes Inner Mongolia, Shaanxi, Gansu, Qinghai, Ningxia, Guangxi, Chongqing, Sichuan, Guizhou, Yunnan, Xinjiang and Tibet. |
| 3 | The provincial capital cities in mainland China includes Beijing, Tianjin, Shanghai, Chongqing, Shijiazhuang, Shenyang, Harbin, Hangzhou, Fuzhou, Jinan, Guangzhou, Wuhan, Chengdu, Kunming, Lanzhou, Nanning, Yinchuan, Taiyuan, Changchun, Nanjing, Hefei, Nanchang, Zhengzhou, Changsha, Haikou, Guiyang, Xi’an, Xining, Hohhot, Lhasa, Urumqi. |
| 4 | In 2013, the State Council of the Chinese government issued the Notice of the National Sustainable Development Plan for Resource-independent Cities (2013–2020). Based on this, we divided the sample cities into 114 resource-independent cities and 170 non-resources-independent cities. |
References
- Sun, L.; Li, W. Has the Opening of High-Speed Rail Reduced Urban Carbon Emissions? Empirical Analysis Based on Panel Data of Cities in China. J. Clean. Prod. 2021, 321, 128958. [Google Scholar] [CrossRef]
- Jiang, M.; An, H.; Gao, X. Adjusting the Global Industrial Structure for Minimizing Global Carbon Emissions: A Network-Based Multi-Objective Optimization Approach. Sci. Total Environ. 2022, 829, 154653. [Google Scholar] [CrossRef] [PubMed]
- Chen, J.; Cui, H.; Xu, Y.; Ge, Q. Long-Term Temperature and Sea-Level Rise Stabilization before and beyond 2100: Estimating the Additional Climate Mitigation Contribution from China’s Recent 2060 Carbon Neutrality Pledge. Environ. Res. Lett. 2021, 16, 074032. [Google Scholar] [CrossRef]
- Zameer, H.; Wang, Y.; Vasbieva, D.G.; Abbas, Q. Exploring a Pathway to Carbon Neutrality via Reinforcing Environmental Performance through Green Process Innovation, Environmental Orientation and Green Competitive Advantage. J. Environ. Manag. 2021, 296, 113383. [Google Scholar] [CrossRef] [PubMed]
- IPCC. Climate Change 2023 Synthesis Report; IPCC: Geneva, Switzerland, 2023. [Google Scholar]
- Liu, Y.; Li, J.; Yang, Y. Strategic Adjustment of Land Use Policy under the Economic Transformation. Land Use Policy 2018, 74, 5–14. [Google Scholar] [CrossRef]
- Hu, Y.; He, F.; Liao, K.; Liu, X. How Do Land Supply Admittance Regulations Affect Urban Carbon Emissions? J. Environ. Manag. 2023, 347, 119061. [Google Scholar] [CrossRef] [PubMed]
- Han, W.; Zhang, X.; Zheng, X. Land Use Regulation and Urban Land Value: Evidence from China. Land Use Policy 2020, 92, 104432. [Google Scholar] [CrossRef]
- Glaeser, E.L.; Kahn, M.E. The Greenness of Cities: Carbon Dioxide Emissions and Urban Development. J. Urban Econ. 2010, 67, 404–418. [Google Scholar] [CrossRef]
- Iwata, K.; Managi, S. Can Land Use Regulations and Taxes Help Mitigate Vehicular CO 2 Emissions? An Empirical Study of Japanese Cities. Urban Policy Res. 2016, 34, 356–372. [Google Scholar] [CrossRef]
- Leibowicz, B.D. Effects of Urban Land-Use Regulations on Greenhouse Gas Emissions. Cities 2017, 70, 135–152. [Google Scholar] [CrossRef]
- Huang, Z.; Du, X. Government Intervention and Land Misallocation: Evidence from China. Cities 2017, 60, 323–332. [Google Scholar] [CrossRef]
- Ma, A.; He, Y.; Tang, P. Understanding the Impact of Land Resource Misallocation on Carbon Emissions in China. Land 2021, 10, 1188. [Google Scholar] [CrossRef]
- Bai, X.; Shi, P.; Liu, Y. Realizing China’s Urban Dream. Nature 2014, 509, 158–160. [Google Scholar] [CrossRef]
- Liu, Y.; Li, Y. Revitalize the World’s Countryside. Nature 2017, 548, 275–277. [Google Scholar] [CrossRef] [PubMed]
- Ye, F.; Wang, W. Determinants of Land Finance in China: A Study Based on Provincial-level Panel Data. Aust. J. Public Adm. 2013, 72, 293–303. [Google Scholar] [CrossRef]
- Zeng, L.; Wang, Y.; Deng, Y. How Land Transactions Affect Carbon Emissions: Evidence from China. Land 2022, 11, 751. [Google Scholar] [CrossRef]
- Zhou, D.; Huang, Q.; Chong, Z. Analysis on the Effect and Mechanism of Land Misallocation on Carbon Emissions Efficiency: Evidence from China. Land Use Policy 2022, 121, 106336. [Google Scholar] [CrossRef]
- Yang, Y.; Xue, R.; Zhang, X.; Cheng, Y.; Shan, Y. Can the Marketization of Urban Land Transfer Improve Energy Efficiency? J. Environ. Manag. 2023, 329, 117126. [Google Scholar] [CrossRef]
- Du, W.; Li, M. The Impact of Land Resource Mismatch and Land Marketization on Pollution Emissions of Industrial Enterprises in China. J. Environ. Manag. 2021, 299, 113565. [Google Scholar] [CrossRef]
- Liu, X.; Xu, H.; Zhang, M. Impact and Transmission Mechanism of Land Leasing Marketization on Carbon Emissions: Based on the Mediating Effect of Industrial Structure. China Popul. Environ. 2022, 32, 12–21. [Google Scholar]
- Li, J.; Jiao, L.; Li, R.; Zhu, J.; Zhang, P.; Guo, Y.; Lu, X. How Does Market-Oriented Allocation of Industrial Land Affect Carbon Emissions? Evidence from China. J. Environ. Manag. 2023, 342, 118288. [Google Scholar] [CrossRef] [PubMed]
- Peng, S.; Wang, L.; Xu, L. Impact of the Marketization of Industrial Land Transfer on Regional Carbon Emission Intensity: Evidence from China. Land 2023, 12, 984. [Google Scholar] [CrossRef]
- Xi, Q.; Mei, L. How Did Development Zones Affect China’s Land Transfers? The Scale, Marketization, and Resource Allocation Effect. Land Use Policy 2022, 119, 106181. [Google Scholar] [CrossRef]
- Zhang, R.; Yang, R.; Huang, Y. Does the Marketization of Land Transfer Have an Impact on Carbon Emissions? Evidence from China. Front. Environ. Sci. 2022, 10, 1034273. [Google Scholar] [CrossRef]
- Cai, H.; Henderson, J.V.; Zhang, Q. China’s Land Market Auctions: Evidence of Corruption? RAND J. Econ. 2013, 44, 488–521. [Google Scholar] [CrossRef]
- Xu, S.; Chen, J.; Zhao, G. How Does the Land Leasing Marketization Affect the Economic Growth. China Ind. Econ. 2018, 44–61. [Google Scholar] [CrossRef]
- Jiang, X.; Lu, X.; Liu, Q.; Chang, C.; Qu, L. The Effects of Land Transfer Marketization on the Urban Land Use Efficiency: An Empirical Study Based on 285 Cities in China. Ecol. Indic. 2021, 132, 108296. [Google Scholar] [CrossRef]
- Lu, S.; Wang, H. Market-Oriented Reform and Land Use Efficiency: Evidence from a Regression Discontinuity Design. Land Use Policy 2022, 115, 106006. [Google Scholar] [CrossRef]
- Han, F.; Huang, M. Land Misallocation and Carbon Emissions: Evidence from China. Land 2022, 11, 1189. [Google Scholar] [CrossRef]
- Gong, G.; Wu, Q.; Gao, S. The Effect and Mechanism of Land Marketization on Regional Technological Innovation. Urban Probl. 2020, 68–78. [Google Scholar] [CrossRef]
- Cheng, J.; Zhao, J.; Zhu, D.; Jiang, X.; Zhang, H.; Zhang, Y. Land Marketization and Urban Innovation Capability: Evidence from China. Habitat Int. 2022, 122, 102540. [Google Scholar] [CrossRef]
- Cheng, Y.; Jia, S.; Meng, H. Fiscal Policy Choices of Local Governments in China: Land Finance or Local Government Debt? Int. Rev. Econ. Finance 2022, 80, 294–308. [Google Scholar] [CrossRef]
- Jin, W.; Zhou, C. Effect of Land Marketization Level and Land Prices on Foreign Direct Investment in China. Land 2022, 11, 1433. [Google Scholar] [CrossRef]
- Balsalobre-Lorente, D.; Gokmenoglu, K.K.; Taspinar, N.; Cantos-Cantos, J.M. An Approach to the Pollution Haven and Pollution Halo Hypotheses in MINT Countries. Environ. Sci. Pollut. Res. 2019, 26, 23010–23026. [Google Scholar] [CrossRef]
- Birdsall, N.; Wheeler, D. Trade Policy and Industrial Pollution in Latin America: Where Are the Pollution Havens? J. Environ. Dev. 1993, 2, 137–149. [Google Scholar] [CrossRef]
- Reppelin-Hill, V. Trade and Environment: An Empirical Analysis of the Technology Effect in the Steel Industry. J. Environ. Econ. Manag. 1999, 38, 283–301. [Google Scholar] [CrossRef]
- Tiwari, A.K.; Shahbaz, M.; Adnan Hye, Q.M. The Environmental Kuznets Curve and the Role of Coal Consumption in India: Cointegration and Causality Analysis in an Open Economy. Renew. Sustain. Energy Rev. 2013, 18, 519–527. [Google Scholar] [CrossRef]
- Yuan, H.; Feng, Y.; Lee, C.-C.; Cen, Y. How Does Manufacturing Agglomeration Affect Green Economic Efficiency? Energy Econ. 2020, 92, 104944. [Google Scholar] [CrossRef]
- Grossman, G.; Krueger, A. Environmental Impacts of a North American Free Trade Agreement; National Bureau of Economic Research: Cambridge, MA, USA, 1991. [Google Scholar]
- Panayotou, T. Environmental Degradation at Different Stages of Economic Development. In Beyond Rio; Ahmed, I., Doeleman, J.A., Eds.; Palgrave Macmillan: London, UK, 1995; pp. 13–36. ISBN 978-1-349-24247-4. [Google Scholar]
- Chavas, J.-P. On Impatience, Economic Growth and the Environmental Kuznets Curve: A Dynamic Analysis of Resource Management. Environ. Resour. Econ. 2004, 28, 123–152. [Google Scholar] [CrossRef]
- Zhang, L.; Mu, R.; Zhan, Y.; Yu, J.; Liu, L.; Yu, Y.; Zhang, J. Digital Economy, Energy Efficiency, and Carbon Emissions: Evidence from Provincial Panel Data in China. Sci. Total Environ. 2022, 852, 158403. [Google Scholar] [CrossRef]
- Porter, M.E.; Linde, C.V.D. Toward a New Conception of the Environment-Competitiveness Relationship. J. Econ. Perspect. 1995, 9, 97–118. [Google Scholar] [CrossRef]
- Barbera, A.J.; McConnell, V.D. The Impact of Environmental Regulations on Industry Productivity: Direct and Indirect Effects. J. Environ. Econ. Manag. 1990, 18, 50–65. [Google Scholar] [CrossRef]
- Zhao, X.; Sun, B. The Influence of Chinese Environmental Regulation on Corporation Innovation and Competitiveness. J. Clean. Prod. 2016, 112, 1528–1536. [Google Scholar] [CrossRef]
- Pei, Y.; Zhu, Y.; Liu, S.; Wang, X.; Cao, J. Environmental Regulation and Carbon Emission: The Mediation Effect of Technical Efficiency. J. Clean. Prod. 2019, 236, 117599. [Google Scholar] [CrossRef]
- Zhang, W.; Li, G.; Uddin, M.K.; Guo, S. Environmental Regulation, Foreign Investment Behavior, and Carbon Emissions for 30 Provinces in China. J. Clean. Prod. 2020, 248, 119208. [Google Scholar] [CrossRef]
- Huang, X.; Tian, P. How Does Heterogeneous Environmental Regulation Affect Net Carbon Emissions: Spatial and Threshold Analysis for China. J. Environ. Manag. 2023, 330, 117161. [Google Scholar] [CrossRef] [PubMed]
- Zhao, X.; Yin, H.; Zhao, Y. Impact of Environmental Regulations on the Efficiency and CO2 Emissions of Power Plants in China. Appl. Energy 2015, 149, 238–247. [Google Scholar] [CrossRef]
- Fan, X.; Qiu, S.; Sun, Y. Land Finance Dependence and Urban Land Marketization in China: The Perspective of Strategic Choice of Local Governments on Land Transfer. Land Use Policy 2020, 99, 105023. [Google Scholar] [CrossRef]
- Li, H.; Lu, J. Can Inter-Governmental Coordination Inhibit Cross-Border Illegal Water Pollution? A Test Based on Cross-Border Ecological Compensation Policy. J. Environ. Manag. 2022, 318, 115536. [Google Scholar] [CrossRef]
- Xie, R.; Yao, S.; Han, F.; Zhang, Q. Does Misallocation of Land Resources Reduce Urban Green Total Factor Productivity? An Analysis of City-Level Panel Data in China. Land Use Policy 2022, 122, 106353. [Google Scholar] [CrossRef]
- Baron, R.M.; Kenny, D.A. The Moderator-Mediator Variable Distinction in Social Psychological Research: Conceptual, Strategic, and Statistical Considerations. J. Pers. Soc. Psychol. 1986, 51, 1173–1182. [Google Scholar] [CrossRef] [PubMed]
- Zhang, W.; Xu, H. Effects of Land Urbanization and Land Finance on Carbon Emissions: A Panel Data Analysis for Chinese Provinces. Land Use Policy 2017, 63, 493–500. [Google Scholar] [CrossRef]
- Li, T.; Ma, J.; Mo, B. Does the Land Market Have an Impact on Green Total Factor Productivity? A Case Study on China. Land 2021, 10, 595. [Google Scholar] [CrossRef]
- Liu, T.; Lin, G.C.S. New Geography of Land Commodification in Chinese Cities: Uneven Landscape of Urban Land Development under Market Reforms and Globalization. Appl. Geogr. 2014, 51, 118–130. [Google Scholar] [CrossRef]
- Liu, T.; Cao, G.; Yan, Y.; Wang, R.Y. Urban Land Marketization in China: Central Policy, Local Initiative, and Market Mechanism. Land Use Policy 2016, 57, 265–276. [Google Scholar] [CrossRef]
- Zhao, K.; Shi, X.; Qu, F. Measurement and Empirical Study on Land Market Development of China: A Case Study from Eastern, Central and Western China. Econ. Geogr. 2008, 821–825. [Google Scholar]
- Zhao, Y.; Huang, X.; Zhong, T.; Peng, J.; Wang, X. Measurement Methods of Land Marketization in China. Resour. Sci. 2012, 34, 1333–1339. [Google Scholar]
- Lu, X.; Jiang, X.; Gong, M. How Land Transfer Marketization Influence on Green Total Factor Productivity from the Approach of Industrial Structure? Evidence from China. Land Use Policy 2020, 95, 104610. [Google Scholar] [CrossRef]
- Dong, F.; Hu, M.; Gao, Y.; Liu, Y.; Zhu, J.; Pan, Y. How Does Digital Economy Affect Carbon Emissions? Evidence from Global 60 Countries. Sci. Total Environ. 2022, 852, 158401. [Google Scholar] [CrossRef]
- Shahbaz, M.; Nasreen, S.; Ahmed, K.; Hammoudeh, S. Trade Openness–Carbon Emissions Nexus: The Importance of Turning Points of Trade Openness for Country Panels. Energy Econ. 2017, 61, 221–232. [Google Scholar] [CrossRef]
- Zhang, W.; Liu, X.; Wang, D.; Zhou, J. Digital Economy and Carbon Emission Performance: Evidence at China’s City Level. Energy Policy 2022, 165, 112927. [Google Scholar] [CrossRef]
- Zhang, M.; Tan, S.; Pan, Z.; Hao, D.; Zhang, X.; Chen, Z. The Spatial Spillover Effect and Nonlinear Relationship Analysis between Land Resource Misallocation and Environmental Pollution: Evidence from China. J. Environ. Manag. 2022, 321, 115873. [Google Scholar] [CrossRef] [PubMed]
- Hansen, B.E. Threshold effects in Non-Dynamic Panels: Estimation, Testing, and Inference. J. Econom. 1999, 93, 345–368. [Google Scholar] [CrossRef]
- Elhorst, J.P. Matlab Software for Spatial Panels. Int. Reg. Sci. Rev. 2014, 37, 389–405. [Google Scholar] [CrossRef]
- Gao, B.; Huang, Z.; Zhang, T.; Sun, X.; Song, M. Exploring the Impact of Industrial Land Price Distortion on Carbon Emission Intensity: Evidence from China. Land 2022, 12, 92. [Google Scholar] [CrossRef]
- Pu, W.; Zhang, A.; Zhang, Z.; Qin, S.; Xia, Q. Can Urban Land Market Reform Mitigate Industrial Emissions? Environmental Evidence from 257 Prefecture-Level Cities in China. Environ. Res. 2023, 236, 116707. [Google Scholar] [CrossRef] [PubMed]
- Wang, L.-O.; Wu, H.; Hao, Y. How Does China’s Land Finance Affect Its Carbon Emissions? Struct. Chang. Econ. Dyn. 2020, 54, 267–281. [Google Scholar] [CrossRef]
- Shao, Y. Does FDI Affect Carbon Intensity? New Evidence from Dynamic Panel Analysis. Int. J. Clim. Chang. Strateg. Manag. 2018, 10, 27–42. [Google Scholar] [CrossRef]
- Wang, Z.; Zhang, B.; Liu, T. Empirical Analysis on the Factors Influencing National and Regional Carbon Intensity in China. Renew. Sustain. Energy Rev. 2016, 55, 34–42. [Google Scholar] [CrossRef]
- Ozcan, B. The Nexus between Carbon Emissions, Energy Consumption and Economic Growth in Middle East Countries_ A Panel Data Analysis. Energy Policy 2013, 62, 1138–1147. [Google Scholar] [CrossRef]
- Cole, M.A. Limits to Growth, Sustainable Development and Environmental Kuznets Curves: An Examination of the Environmental Impact of Economic Development. Sustain. Dev. 1999, 7, 87–97. [Google Scholar] [CrossRef]
Disclaimer/Publisher’s Note: The statements, opinions and data contained in all publications are solely those of the individual author(s) and contributor(s) and not of MDPI and/or the editor(s). MDPI and/or the editor(s) disclaim responsibility for any injury to people or property resulting from any ideas, methods, instructions or products referred to in the content. |
© 2025 by the authors. Licensee MDPI, Basel, Switzerland. This article is an open access article distributed under the terms and conditions of the Creative Commons Attribution (CC BY) license (https://creativecommons.org/licenses/by/4.0/).