Article

Evaluation and Influencing Factors of Coupling Coordination of “Production–Living–Ecological” Functions Based on Grid Scale: Empirical Experience of Karst Beibu Gulf in Southwest Guangxi, China

1
School of Public Policy and Management, Guangxi University, Nanning 530004, China
2
Research Center for Natural Resources Management and Public Policy, Guangxi University, Nanning 530004, China
*
Author to whom correspondence should be addressed.
Land 2025, 14(3), 614; https://doi.org/10.3390/land14030614
Submission received: 9 February 2025 / Revised: 10 March 2025 / Accepted: 11 March 2025 / Published: 14 March 2025

Abstract

:
Territorial space (TS) is multifunctional, and exploring the relationships between functions and their influencing factors is key to achieving sustainable development of territorial space. However, existing research mostly focuses on the exploration of administrative units, while the exploration of grid units needs to be improved. This paper takes the Beibu Gulf Economic Zone (BGEZ) in Guangxi as the research object, evaluates the “Production–Living–Ecological” Functions (PLEFs) of territorial space using the land category scoring method and summarizes the evolution characteristics of its spatial pattern. It analyzes the dominant and combined functions of territorial space using the revealed comparative advantage index, explores the relationships between various functions by introducing a coupling coordination degree model, and comprehensively uses Geodetector and Geographically and Temporally Weighted Regression (GTWR) models to analyze the spatiotemporal heterogeneity of influencing factors on the coupling coordination degree of functions. The results indicate that at the grid scale (1) regional territorial space is dominated by ecological space, followed by production space, with living space accounting for the smallest proportion. Production space and ecological space has decreased, while living space has increased, with production and ecological spaces mostly flowing into living space. (2) The spatial distribution of production and ecological functions is relatively homogeneous, while the spatial differentiation of living functions is most significant. The grid can be divided into three function-dominant types and six function-combination types. (3) Living function is primarily disordered with production and ecological functions, while production–ecological function is mainly coordinated. (4) Policy regulation is a key factor affecting the degree of functional coordination, and the degree and scope of influence of each factor show significant spatiotemporal heterogeneity. This study reveals the functional relationships and the mechanisms of temporal and spatial evolution of TS at the grid scale, providing a scientific basis for the efficient and sustainable use of TS.

1. Introduction

Territorial space (TS) is an important carrier of human production, living activities, and ecological construction. The essence of TS utilization is the process of human transformation of the Earth’s surface, which is related to the improvement of human well-being and the sustainable development of regions [1]. The rapid advancement of industrialization, urbanization, and agricultural modernization has led to the disorderly expansion of urban areas and an imbalance in the allocation of resources between urban and rural areas. The pattern and functions of TS have undergone drastic changes, facing new challenges in sustainable development and utilization [2]. The Chinese government has clearly proposed to establish a new pattern of TS development from the perspective of multi-functional, and to build a development strategy of TS with “intensive and efficient production space, moderate livable living space, and beautiful ecological space” [3], which can be abbreviated as Production–Living–Ecological Space (PLES), serving as an important indicator for territorial planning and development [4]. Production space offers material and non-material products and services to humanity, providing essential material and technical support for living and ecological spaces. As the core of the PLES framework, living space serves as the primary area for daily human activities, fulfilling needs related to habitation, consumption, recreation, healthcare, and education, with both production and ecological spaces functioning in its service. Ecological space is the space that provides ecological products and services, maintains and constrains human society, and forms the basis for the sustainable development of production and living space [5,6]. The PLES composed of production, living, and ecological spaces, when implemented on land, is reflected as different types of land use that meet various needs for human survival and development. This forms the multifunctionality of land, which can be divided into production function, living function, and ecological function, abbreviated as “Production–Living–Ecological” Functions (PLEFs) [7]. Changes in the functional relationships of TS are influenced by multiple factors including natural, social, economic, and policy regulations. The balanced development of functions is an important prerequisite for achieving sustainable utilization and high-quality development of TS [8]. Revealing the effects of various factors on functional relationships can promote the orderly development and utilization of TS [9]. It is necessary to accurately grasp the influencing mechanisms of the changes in the relationships among the PLEFs of TS.
The concept of multifunctionality abroad originated from agricultural multifunctionality and gradually expanded to land use multifunctionality [10]. Early research focused on production function and later extended to ecological, socio-cultural, and other functions [11]. Due to different starting points and perspectives of scholars, the classification of land use multifunctionality varies, and research is mostly conducted based on social, economic, and environmental functions as criteria to distinguish land functions [12]. Chinese scholars have recently focused their research on the PLEFs of TS based on the development strategy of “intensive and efficient production space, livable and moderate living space, and beautiful ecological space”, which not only covers a mesoscopic scale with provinces, cities, or counties as research units but also includes exploring grid scales at the microscopic level, using Geographic Information System (GIS) technology to construct grids of different side lengths to analyze the study area. In the administrative unit, many scholars have defined the connotation of the PLEFs of TS and followed the logical idea of “identification–classification–evaluation”, selected provinces [13,14], cities [15,16] and counties [17,18] as research units, and constructed the evaluation index system of the PLEFs by the methods of index quantification [19,20,21] and spatial overlay [22]: Production function focuses on agricultural output value, industrial output value, etc. [23]; living function focuses on population density, road network density, public service facility coverage, etc. [24]; ecological function emphasizes vegetation coverage, water conservation, etc. [25], and uses methods such as the weighted summation model [26], TOPSIS model [27], comprehensive index [28], fuzzy comprehensive evaluation [29], and improved mutation level [30] to evaluate PLEFs. At the same time, methods such as spatial autocorrelation analysis [31,32], LISA spatiotemporal transition [33], and kernel density analysis [34,35] are widely used to explore the spatial distribution of PLEFs. The research found that economically developed areas exhibit a high concentration of production and living functions, while ecologically fragile areas have a prominent ecological function but often weaker production and living functions. As for grid units, the evaluation of PLEFs is often based on the land use classification scoring method due to the differences in the strength of land use functions [36,37]. Research has found that grid units can more finely reflect the spatial differentiation texture characteristics of PLEFs within each administrative unit compared to administrative units.
Foreign scholars focus on the quantitative assessment and dynamic simulation of the functional relationships of TS, and also pay attention to the synergy, conflict, and dynamic balance mechanisms between different functions [38,39]. The rational allocation of resources in TS is based on its functional coordination relationship. With the evaluation and measurement of the functions of TS, scholars often introduce trade-off synergy models or coupling coordination models to analyze the changes in the coupling coordination of PLEFs [40,41,42,43]. The former is mainly used to determine whether there is a conflict or harmonious symbiotic relationship between functions, while the latter can further reflect the degree of disordered competition or harmonious order based on the coupling coordination degree between functions. Some scholars have analyzed the advantages and disadvantages of PLEFs and their dominance in the TS of each research unit using the revealed comparative advantage (RCA) index [44,45]. Most empirical studies show that in regions with rapid industrialization and urbanization, production and living functions often exhibit a synergistic relationship [22], but there is significant ecological pressure, and the two often represent a trade-off with ecological function [46,47]. However, for karst mountainous areas, vegetation coverage and biodiversity are relatively favorable, but due to ecological sensitivity and terrain constraints, the development of production and living space is limited.
In addition, the functions of TS and their relational changes are influenced by multiple factors. Both Chinese and foreign scholars have chosen relevant factors from aspects such as natural resources, socio-economics, and policy regulations [33,48,49], using various methods including Geodetector [50], geographically weighted regression model (GWR) [51], obstacle degree model [52], grey relational analysis model [53], spatial econometric models [54], redundancy analysis [55], and principal component analysis (PCA) [56] to explore the direction and intensity of the effects of various factors on the levels and relationships of PLEFs. Some studies have found that there are differences in the driving mechanisms of the spatiotemporal evolution of the PLEFs between karst and non-karst areas, with the former being more influenced by natural endowment factors, while the latter is more significantly affected by socio-economic factors [57,58]. Regarding the research units, although the analysis of spatio-temporal patterns of PLEFs in TS is based on administrative units, and some of them choose the grid scale to reveal the functional differences in TS at the micro level, due to the availability of data, most of the studies on the functions of TS and the influence mechanism of the changes in their relationships choose administrative units, which tends to neglect the influence of changes in the TS on the socio-ecological system at the micro scale [59], and there are few studies on the influence mechanism of PLEFs in grid units, which makes it difficult to propose effective planning suggestions for the orderly development and utilization of TS based on the influencing factors at the micro level [7,60].
The Beibu Gulf Economic Zone (BGEZ) in Guangxi, China, is located at the junction of the three major economic circles of South China, Southwest China, and the Association of Southeast Asian Nations (ASEAN). It is the only coastal area in the western development region of China. It has both maritime routes and land borders with Southeast Asian countries, making its “coastal and border” location advantage obvious. This area is located in the transitional zone from the Yunnan–Guizhou Plateau in China to the southeastern coastal hilly region. It is rich in natural resources, has a large ecological environment capacity, a high population carrying capacity, and great development potential. It is an important area for planning and layout of new modern port clusters, industrial clusters, and the construction of high-quality livable cities in China’s coastal regions. In recent years, as a window for China’s open cooperation with Southeast Asia, the BGEZ has played a significant role as a southwest passage to the sea, deeply integrating into the “Belt and Road” initiative. Economic strength has increased, progress has been made in infrastructure and public service construction, characteristic advantageous industries have developed rapidly, the living standards of the people have improved, and social changes and development have had a profound impact on the regional TS pattern and functions. At the same time, the region still faces the following issues: the overall economic strength is weak, the levels of industrialization and urbanization are low; economic factors are dispersed, the central cities have insufficient radiating and driving effects; the port scale is small, and the transportation facilities for collection and distribution are lagging behind; there is significant pressure on coastal ecological protection and restoration. These issues pose new challenges for the allocation of resources in TS. Although research has gradually focused on the functional enhancement and coordinated development of TS in this region, most empirical explorations have been conducted from the perspective of administrative units [56,58,59], few studies reveal the temporal and spatial differences in various factors affecting the functional relationships of TS from a more microscopic perspective of grid units. In summary, this paper will explore the following questions in order to outline strategies for enhancing the functions and coordinated development of regional territorial space based on grid scale, providing scientific support for the orderly development and high-quality development of the Beibu Gulf Economic Zone in Guangxi:
(1)
Evaluate PLEFs from the grid scale and summarize the temporal and spatial evolution characteristics of PLEFs;
(2)
Introduce the Coupling Coordination Degree (CCD) model to measure the spatial and temporal changes in PLEFs coordination status;
(3)
Integrated Geodetector and Geographically and Temporally Weighted Regression (GTWR) models to reveal the impact mechanism of the PLEFs relationship in TS.

2. Study Area and Data Sources

2.1. Study Area

The Guangxi Beibu Gulf Economic Zone is located between the karst region in the southwest of Guangxi and the coastal area of the Beibu Gulf (Figure 1b). It is a comprehensive transition zone between mountains and the sea and is a key area for the western development of China and for open cooperation with the Association of Southeast Asian Nations (ASEAN). The terrain is surrounded by mountains on the west, north, and east. The central and southern parts are gentle, and the karst landforms in the northwest are widespread [61]. The region is located in the subtropical monsoon climate zone, with abundant water and heat resources, a forest coverage rate of more than 50%, a superior ecological environment, and high population carrying capacity. At the end of 2020, the resident population was 22.8286 million, accounting for 45.41% of the total population of Guangxi. The economic zone is composed of Nanning, Beihai, Qinzhou, Fangchenggang, Yulin, and Chongzuo. The area is about 42,500 square kilometers, accounting for 17.89% of the area of Guangxi [62]. This is an important area for the planning and layout of new modern port clusters, industrial clusters, and the construction of high-quality livable cities in China’s coastal areas. In 2020, the GDP of the economic zone was CNY 1069.410 billion, accounting for 48.3% of the region. Per capita GDP fiscal revenue accounting for the proportion of the region reached 52.5%. Economic development and social change have a profound impact on the development and utilization of TS.

2.2. Data Sources

Research data are based on collections from 2010, 2015, and 2020 (Table 1): (1) land use data, population density data, GDP density data, NDVI data, and DEM data are all sourced from the Resource and Environmental Science Data Center of the Chinese Academy of Sciences, with a resolution of 1 km. (2) The road data are from Open Street Map. (3) Public facilities and industrial development serve as POI data, sourced from the Gaode map’s API interface. Through data filtering, valid POIs are selected, and ArcGIS 10.8 is used to convert them into spatial data. The public facilities include six types of POI data: catering services, shopping services, scientific and cultural services, life services, healthcare services, and sports and leisure services; industrial development is represented by company POI data, which includes company and factory data.

3. Research Framework and Methods

3.1. Research Framework

In this paper, 3 km, 4 km, and 5 km grids were constructed to cover the study area, and a 4 km × 4 km grid was selected as the study unit based on the comprehensive consideration of the area, visualization effect, and evolutionary characteristics of the spatial distribution of PLEFs. The accessibility and completeness of the data in 2010, 2015, and 2020 are greater. Therefore, 2010, 2015, and 2020 were selected as the study time nodes: utilizing land use transfer matrix to grasp the transfer situation of PLES; constructing a PLEFs evaluation system based on land classification scoring methods, conducting functional evaluations of TS, and summarizing the temporal and spatial evolution characteristics of PLEFs, using Revealed Comparative Advantage index to identify the dominance and functional strength combination types of PLEFs; introducing a Coupling Coordination Degree model to measure the coordinated development level of PLEFs, exploring the coupling coordination among PLEFs; comprehensively using Geodetector and Geographically and Temporally Weighted Regression models to reveal the spatiotemporal differentiation of the influencing factors on the coupling coordination relationship of PLEFs, summarizing the influence mechanisms of PLEFs’ relationships in TS during different periods (Figure 2).

3.2. Research Method

3.2.1. Classification of TS and Its PLEFs Evaluation

Territorial Space classification is based on the perspective of PLEFs, which is based on the classification system of multi-period land use remote sensing monitoring data set (CNLUCC) of Chinese Academy of Sciences (Table 2). Based on the previous achievements of the spatial classification system of PLES [63], the PLES in the Beibu Gulf Economic Zone of Guangxi is reclassified.
Land has multi-functional attributes. A land use type can have multiple land use functions, but its functions will be different in primary and secondary strength. Based on the classification of TS, the PLEFs are assigned. This method is widely used in the evaluation of the PLEFS of TS at the grid scale [36,37]. In this paper, the PLEFs score is between 0 and 5 points (Table 3): The 5-point representation function is the strongest. The 3-point representation function is strong. The 1-point representation function is weak. The 0-point representation function is weak to negligible.

3.2.2. Land Use Transfer Matrix

The land use transfer matrix is the application of the Markov model in land use/cover change; it not only reflects the various land use types at a specific time in the region, but also reflects the mutual transformation of land use types [45]. This article uses land use transfer matrices to explore the transfer situation of the primary and secondary classifications of economic zone PLEFs during the research period.

3.2.3. Revealed Comparative Advantage Index

Based on the Revealed Comparative Advantage Index (RCA), this paper evaluates the strong, medium, and weak levels of the production function, living function, and ecological function of the grid unit. It also identifies functional dominance and functional strength combination types [45].

3.2.4. Coupling Coordination Degree Model

Coupling refers to the relationship between two or more systems that interact and influence each other in the development process. The coupling coordination degree characterizes the degree of mutual promotion and restriction between functions at high and low levels, which can reflect the degree of interaction and coordinated development between functions [23]. In this paper, the Coupling Coordination Degree (CCD) model is used to evaluate the coupling coordination relationship of the PLEFs of the grid unit [42]. It is divided into severe disorder, moderate disorder, general coordination, moderate coordination, and high coordination types (Table 4).

3.2.5. Geodetector

Geodetector is a new statistical method used to detect spatial heterogeneity and reveal the driving factors behind it. It consists of factor detection, interaction detection, ecological detection, and risk detection [64]. In this paper, factor detection is used to identify the key influencing factors that affect the coupling and coordination relationship of PLEFs. Interaction detection is used to further observe the interaction between two factors.

3.2.6. Geographically and Temporally Weighted Regression

The Geographically and Temporally Weighted Regression (GTWR) model is an improved spatial linear regression model. Compared with the traditional regression model, the model can perform local rather than global parameter estimation. The GTWR model introduces the time dimension on the basis of considering spatial heterogeneity. It can effectively deal with spatio-temporal non-stationarity [65]. This paper introduces the Geographically and Temporally Weighted Regression to reveal the spatial and temporal heterogeneity of the influencing factors of the coupling and coordination relationship of PLEFs.

4. Results and Analysis

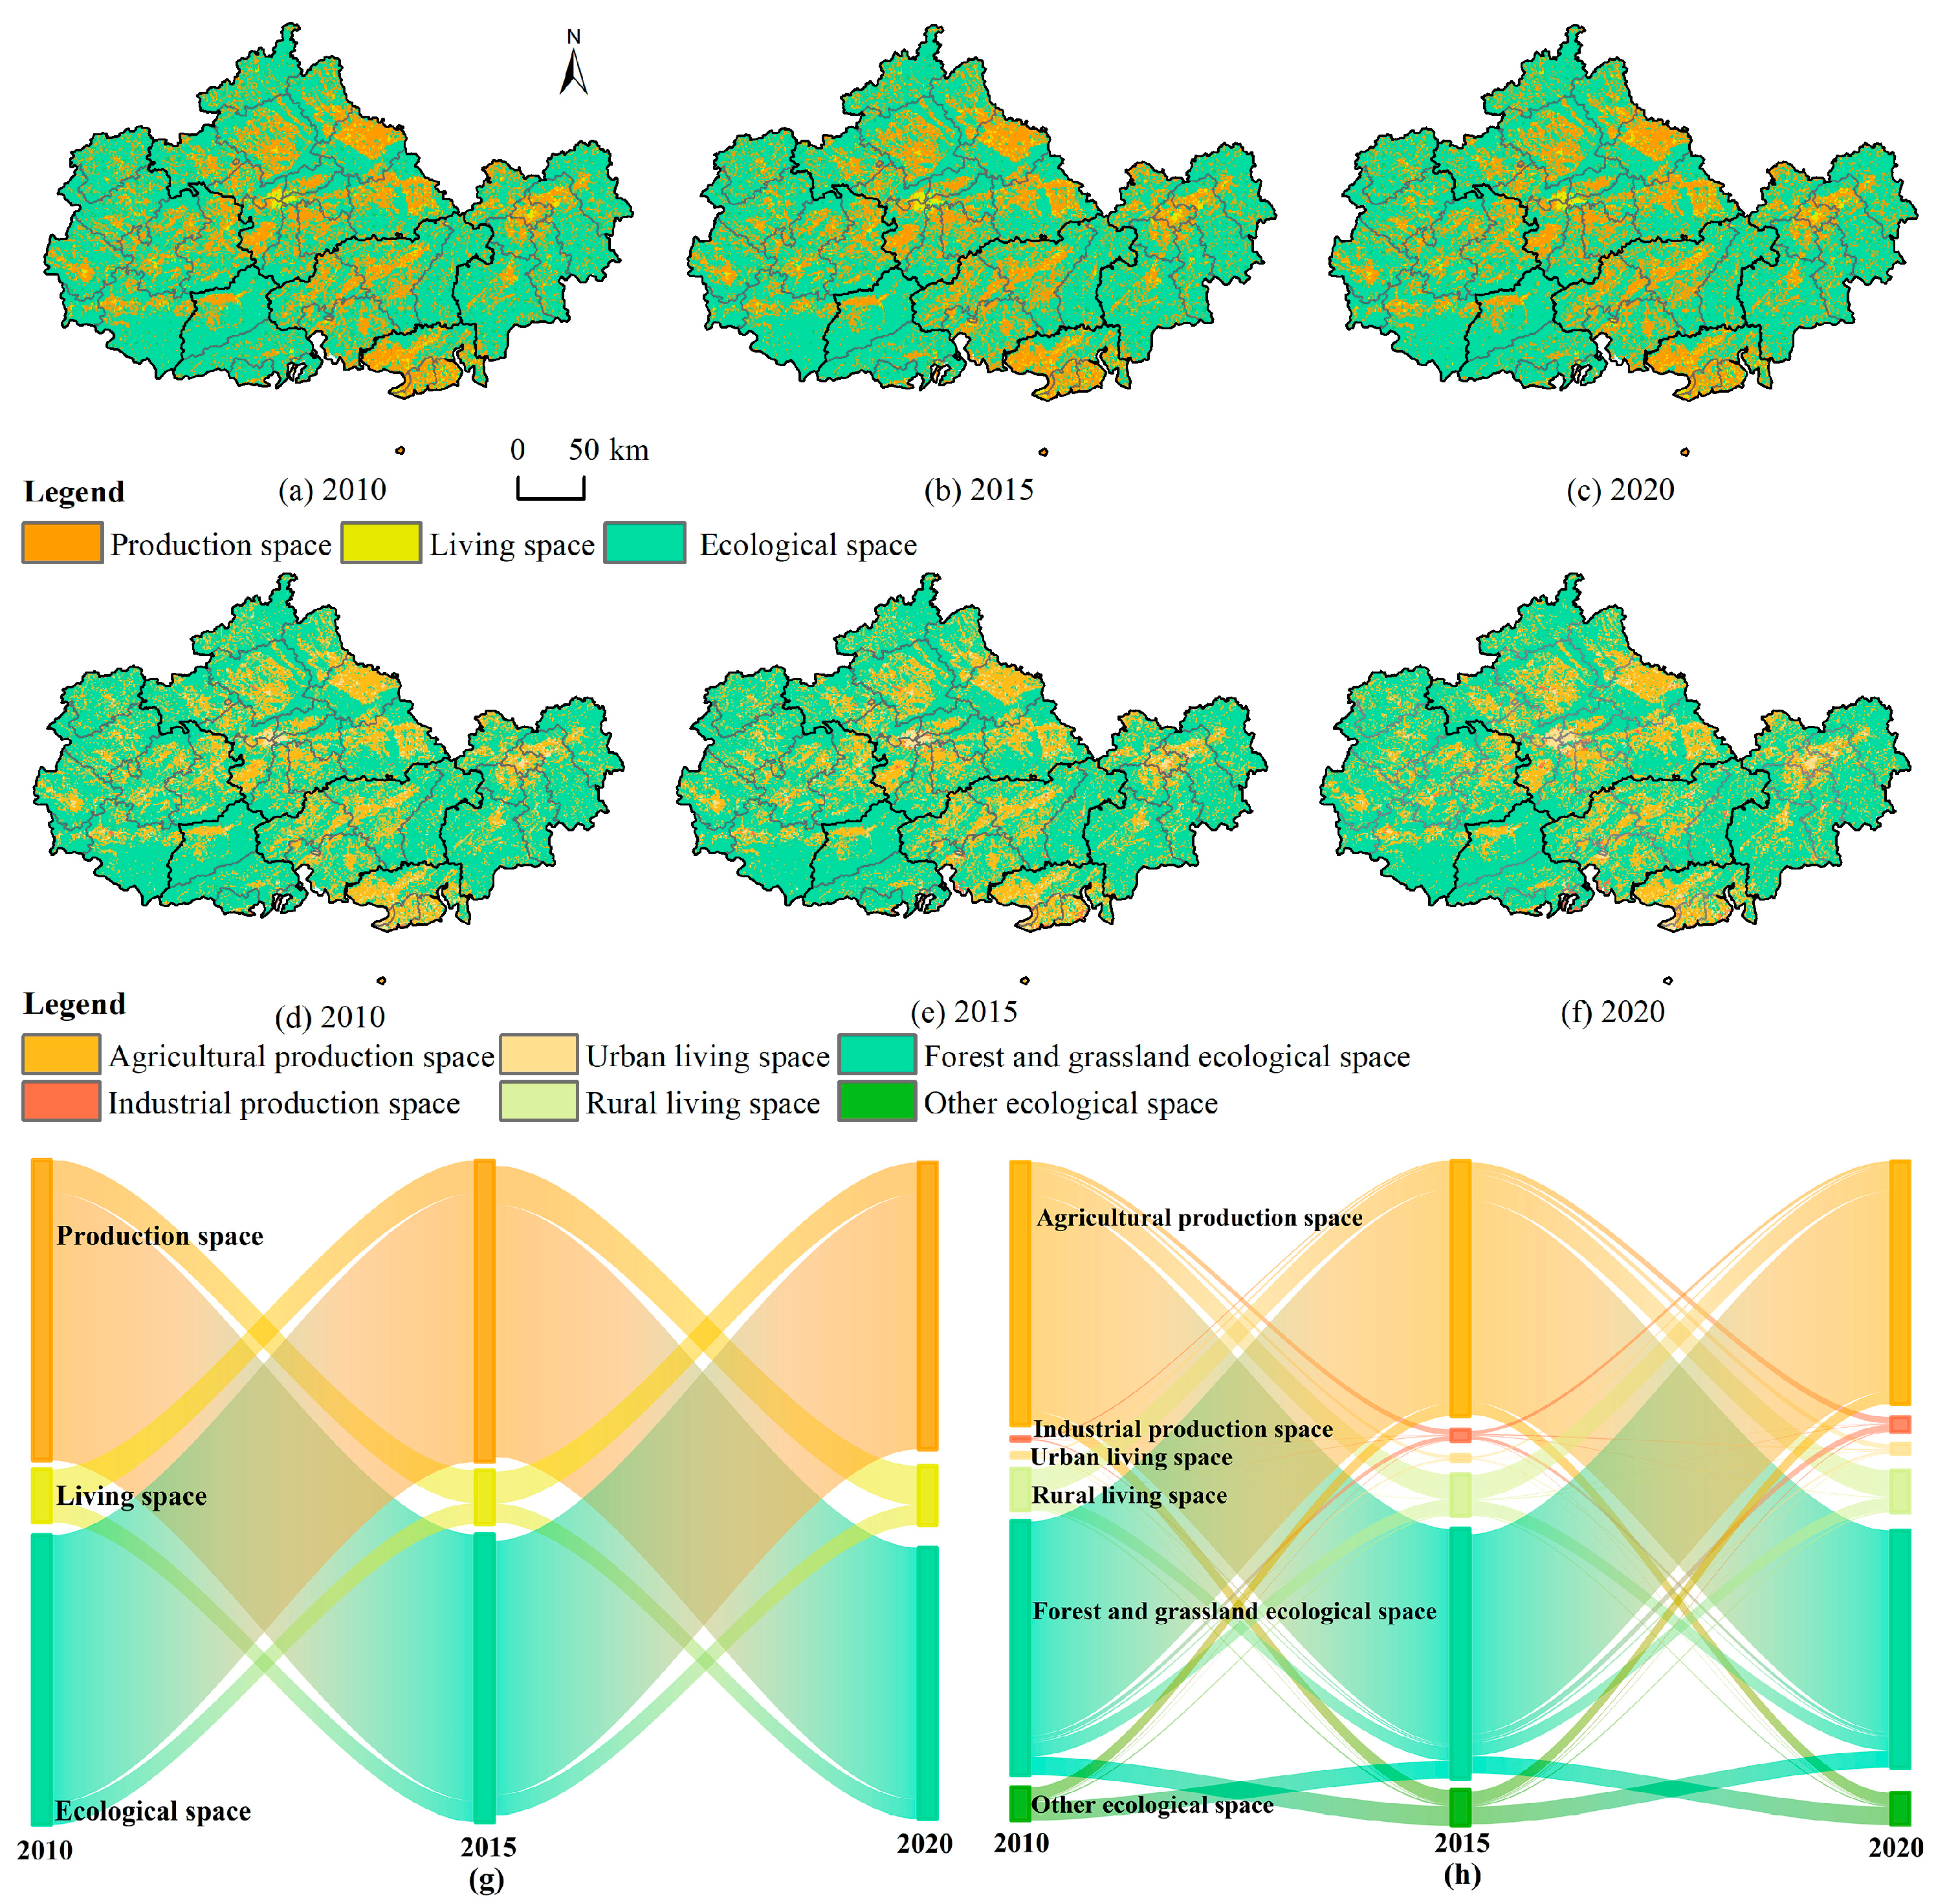
4.1. Analysis of Spatio-Temporal Variation Characteristics of PLES in TS

ArcGIS 10.8 software was used to extract the PLES pattern of the BGEZ from 2010 to 2020. The results show (Figure 3) that from 2010 to 2020, the TS of the BGEZ is primarily ecological space, accounting for 66.90% of the economic zone’s area. Production space followed, accounting for 29.70%, and living space is the smallest at 3.30%. The spatial pattern of PLES in various periods is relatively stable. Living space is mainly distributed in the urban areas of the central and eastern municipalities. Production space is distributed in the hinterland of the counties around Nanning and in the coastal counties in the south, and the rest of the space is mostly ecological space. In the secondary classification of PLES, the proportion of forest–grassland ecological space and agricultural production space is dominant. Forest–grassland ecological space is widely distributed across various districts and counties in the economic zone, especially in the eastern, western, and northern mountainous areas, while production space is mostly agricultural production space, concentrated in the counties surrounding Nanning in the central region and the southern coastal counties. During the study period, production and ecological spaces showed a decreasing trend, while living spaces gradually increased. In the secondary classification, this was reflected in the decrease in agricultural production spaces and forest–grassland ecological spaces, along with the increase in rural and urban living space.
Analysis of the transfer situation of PLES in the BGEZ during different periods (Figure 3g,h). The primary classification of PLES is the mutual conversion between production and ecological spaces, while the increase in living space comes from production and ecological spaces, mainly from the inflow of production space. At the secondary classification of PLES, the transition patterns were as follows: In the production space, agricultural production space decreased while non-agricultural production space increased, with agricultural production space mainly flowing into forest and grass ecological space and rural living space. The increase in non-agricultural production space mainly came from inflows of agricultural production space and forest and grass ecological space. In living space, both rural and urban living spaces increased, with rural living space experiencing a more significant increase. Rural living space and urban living space mainly stem from the conversion of agricultural production space and forest–grass ecological space. Within ecological space, forest–grassland ecological space decreased significantly, primarily transitioning into agricultural production space and other ecological space. In summary, due to the decrease in agricultural production space being greater than the increase in non-agricultural production space, the production space in the region has decreased; the significant reduction in forest–grassland ecological space resulted in a decrease in regional ecological space; meanwhile, the increase in rural and urban living space led to an overall increase in living space, with the increase in rural living space being greater than that in urban living space.

4.2. Analysis of Spatio-Temporal Variation Characteristics of PLEFs in TS

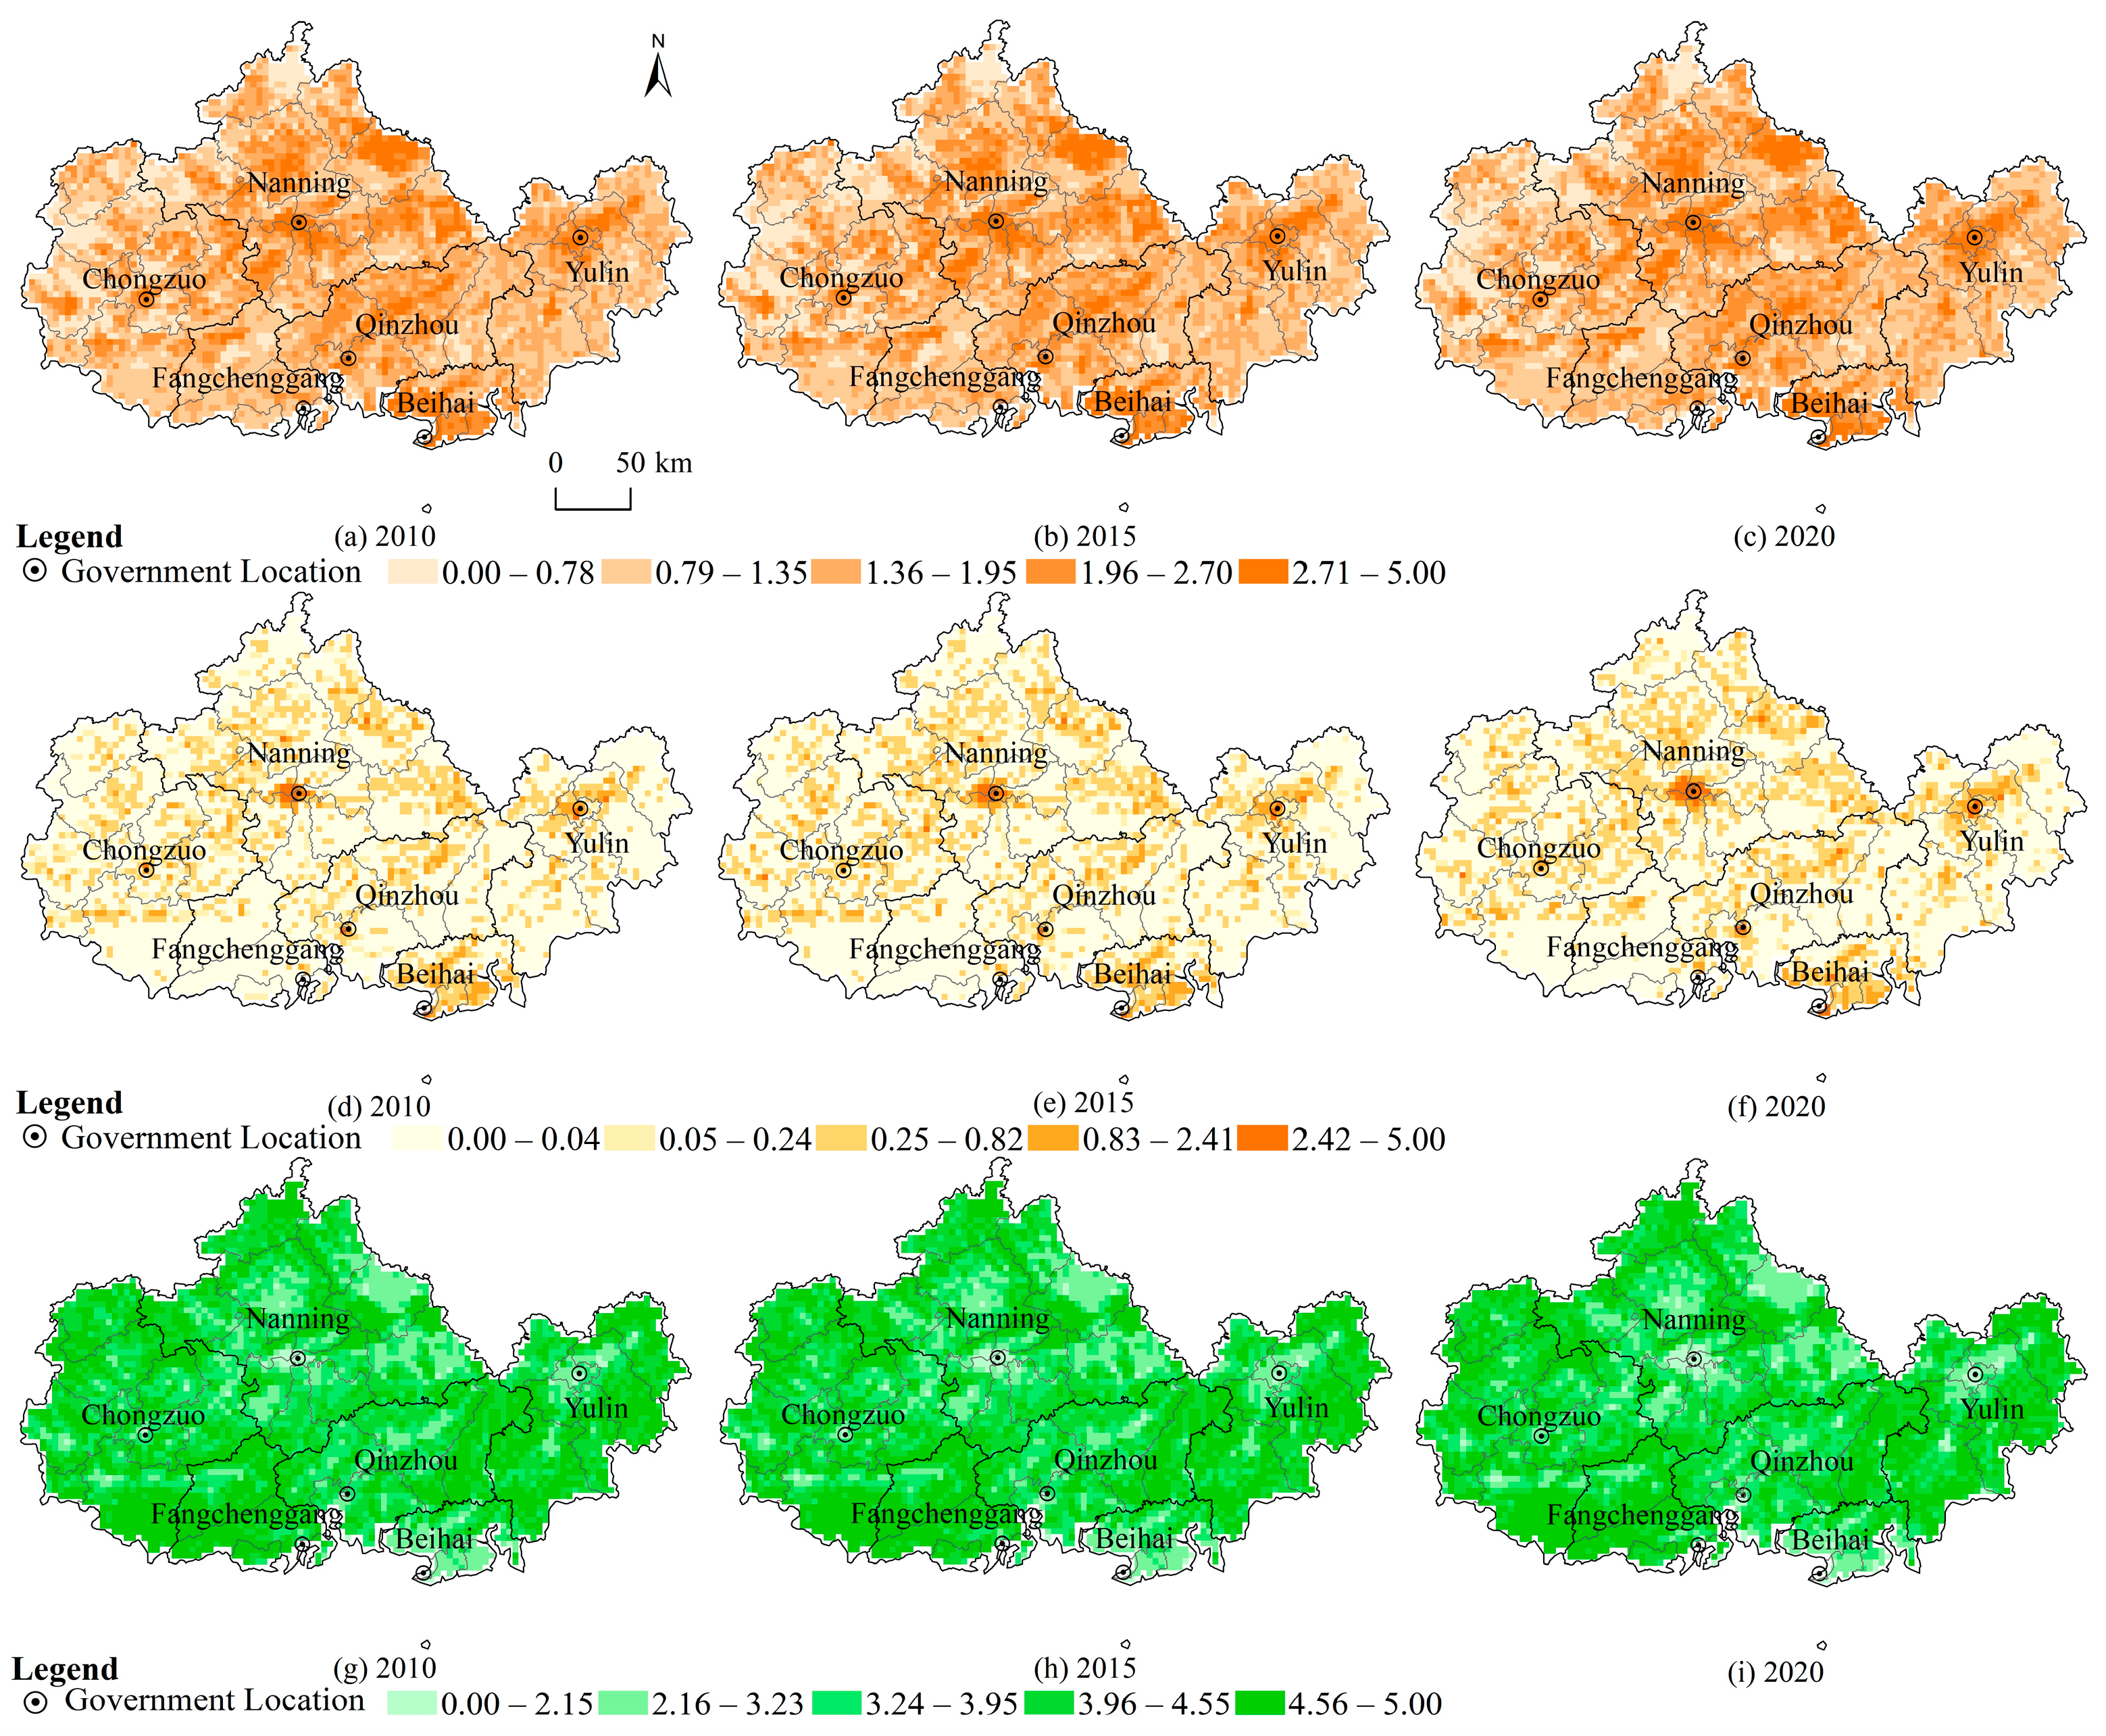
4.2.1. Evaluation Results of PLEFs in TS

Based on the evaluation of PLEFs at the grid-cell level from 2010 to 2020, the spatiotemporal distribution pattern of PLEFs was obtained (Figure 4). During the study period, the spatial pattern of the PLEFs in the TS remained relatively stable. The regional ecological function is generally high and spatially balanced. Low and relatively low values are clustered in the urban areas of each city, while the remaining regions predominantly exhibited relatively high and high ecological function values. The spatial pattern of the production function also remained stable. The central urban area of Nanning and its surrounding counties, as well as the coastal counties and districts in the south, exhibited a relatively high production function with a balanced spatial distribution. In the eastern region, high and relatively high values of the production function are mostly concentrated in urban areas, while the western region generally had lower production function values. The spatial pattern of the living function showed the most significant overall disparity, with high values primarily concentrated in the central urban area of the capital city. Relatively high and medium values are scattered in a “starry sky” pattern across the counties surrounding the urban areas with high living function values in each city.

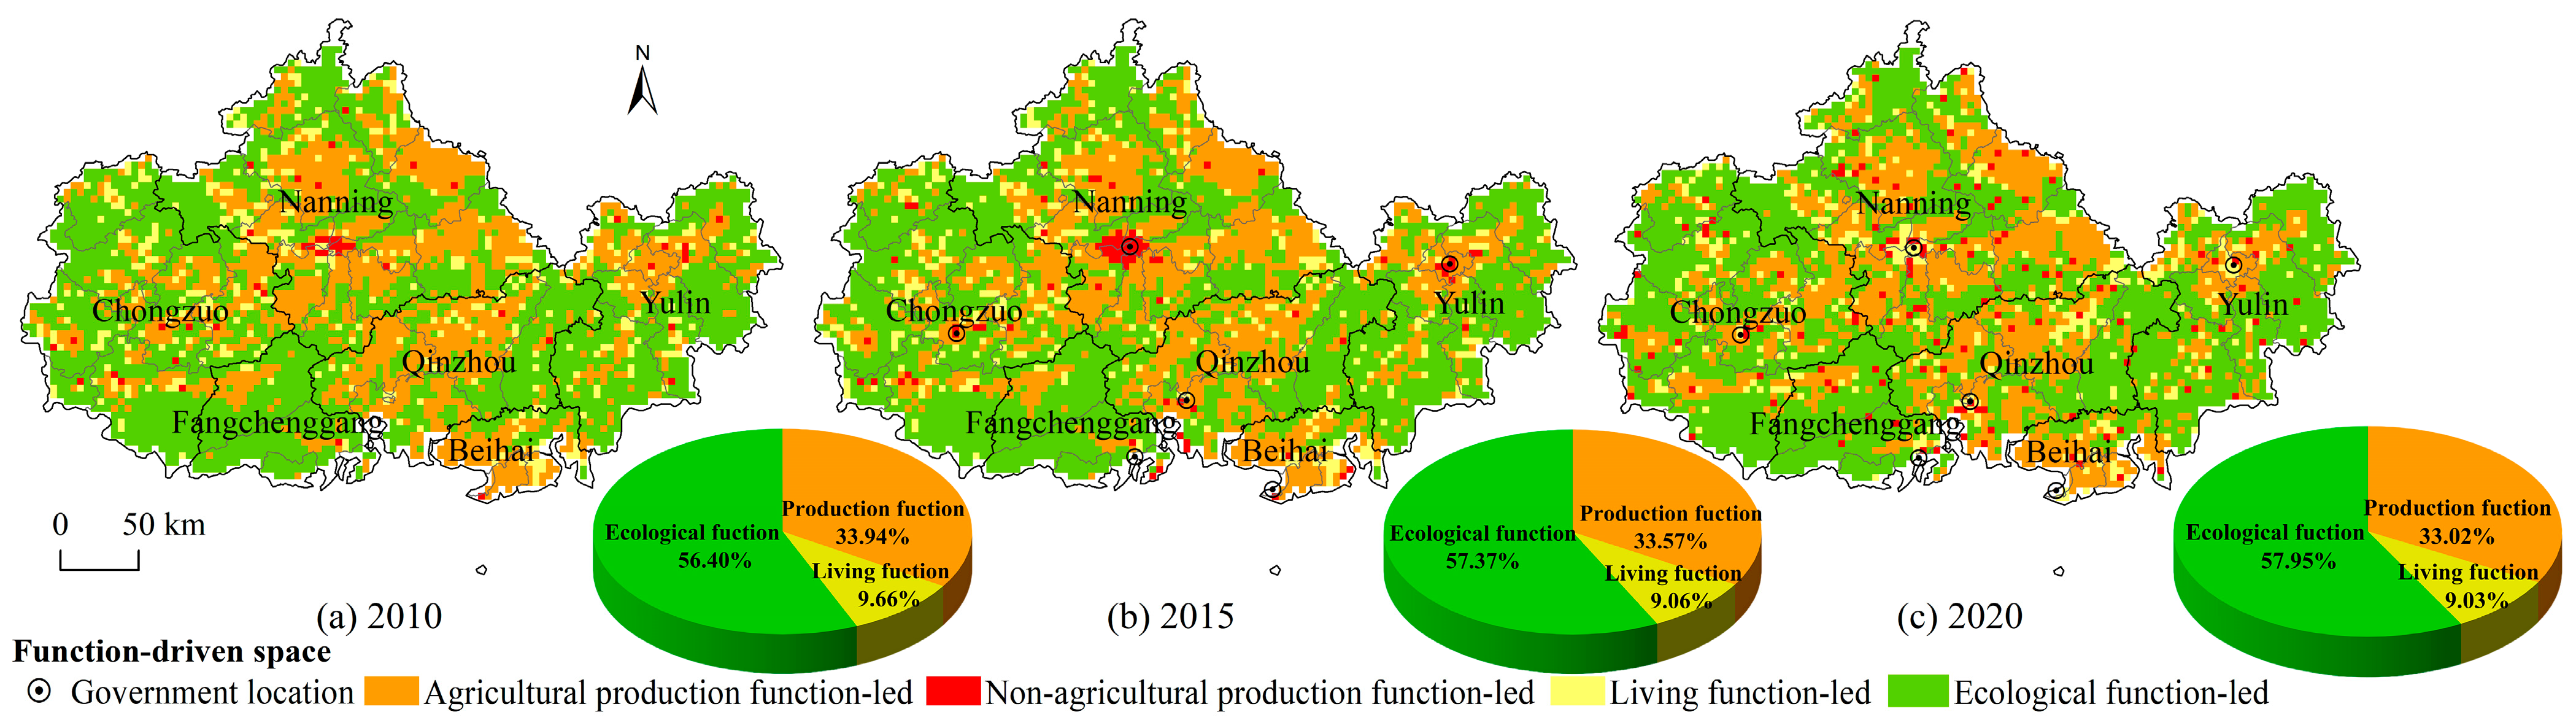
4.2.2. Spatio-Temporal Variation Dominated by PLEFs in TS

Based on the evaluation of the PLEFs at the grid-cell level, the dominant types of PLEFs were identified using the revealed comparative advantage index (Figure 5). From 2010 to 2020, the ecological function-dominant grids accounted for the largest proportion, approximately 57.20%, followed by the production function-dominant grids at about 33.50%, while the living function-dominant grids constituted the smallest proportion at approximately 9.25%. To distinguish the spatiotemporal changes between agricultural and non-agricultural production-dominant grids, the production function-dominant grids were further subdivided into agricultural production-dominant and non-agricultural production-dominant grids. During the study period, the BGEZ primarily exhibited contiguous development dominated by agricultural production function, distributed across the central and southern counties and districts, as well as the peripheries of urban areas in the eastern and western regions. Non-agricultural production-dominant grids were concentrated and expanded in the urban area of Nanning, the capital city, while showing a “starry sky” pattern of increase and diffusion in other urban areas and counties. Temporally, the spatial distribution of non-agricultural production-dominant grids displayed a “polarization–diffusion” trend, evolving from clustered distributions to a “starry sky” pattern. Although the living function-dominant grids accounted for the smallest proportion, they gradually replaced production function-dominant grids in the central urban area of Nanning and the eastern urban area of Yulin, forming “small clusters” and exhibiting initial polarization effects. Meanwhile, the remaining grids dominated by living function mostly increased in a strip-like pattern. The rest of the study area was predominantly composed of ecological function-dominant grids.

4.2.3. Spatio-Temporal Variation in PLEFs Combinatorial Type in TS

Simultaneously, the combination types of PLEFs were identified based on the revealed comparative advantage index. From the perspective of grid-based combinations of PLEFs, the spatial patterns of the six combination types of grids remained relatively stable (Figure 6). Overall, the proportion of strong ecological function—medium living function—weak production function is the highest, followed by strong production function—medium living function—weak ecological function. The proportion of strong living function—medium ecological function—weak production is the smallest. Additionally, the proportion of strong production function—medium ecological function—weak living function, strong living function—medium production function—weak ecological function and strong living function—medium ecological function—weak production have all declined, while the proportion of strong ecological function—medium production function—weak living function has increased. This reflects the frequent competition and transformation among various territorial spaces during the rapid economic development and urbanization of the region, with continuous changes in the functional levels of TS. In terms of spatial distribution, the two combination types of strong production function—medium living function—weak ecological function and strong ecological function—medium living function—weak production function are widely distributed. Specifically, strong production function—medium living function—weak ecological function is continuously distributed in the counties surrounding the central and southern urban areas, while strong ecological function—medium living function—weak production function is mainly distributed in the eastern, western, and northern mountainous regions, particularly in the western karst mountainous areas. Notably, during the study period, only the main urban area of the capital city Nanning exhibited the combination type of strong living function—medium production function—weak ecological function, and it showed an expanding trend. The urban areas of other cities belonged to the combination type of strong production function—medium living function—weak ecological function, indicating that the urban area of Nanning, relying on its industries and economic development, has gradually improved transportation facilities and public service facilities to provide a convenient and comfortable living environment for residents. In addition, the two major combination types of strong ecological function—medium production function—weak living function and strong production function—medium ecological function—weak living are mainly distributed on the outskirts and surrounding areas of the aggregated zones of strong production function—medium living function—weak ecological function.

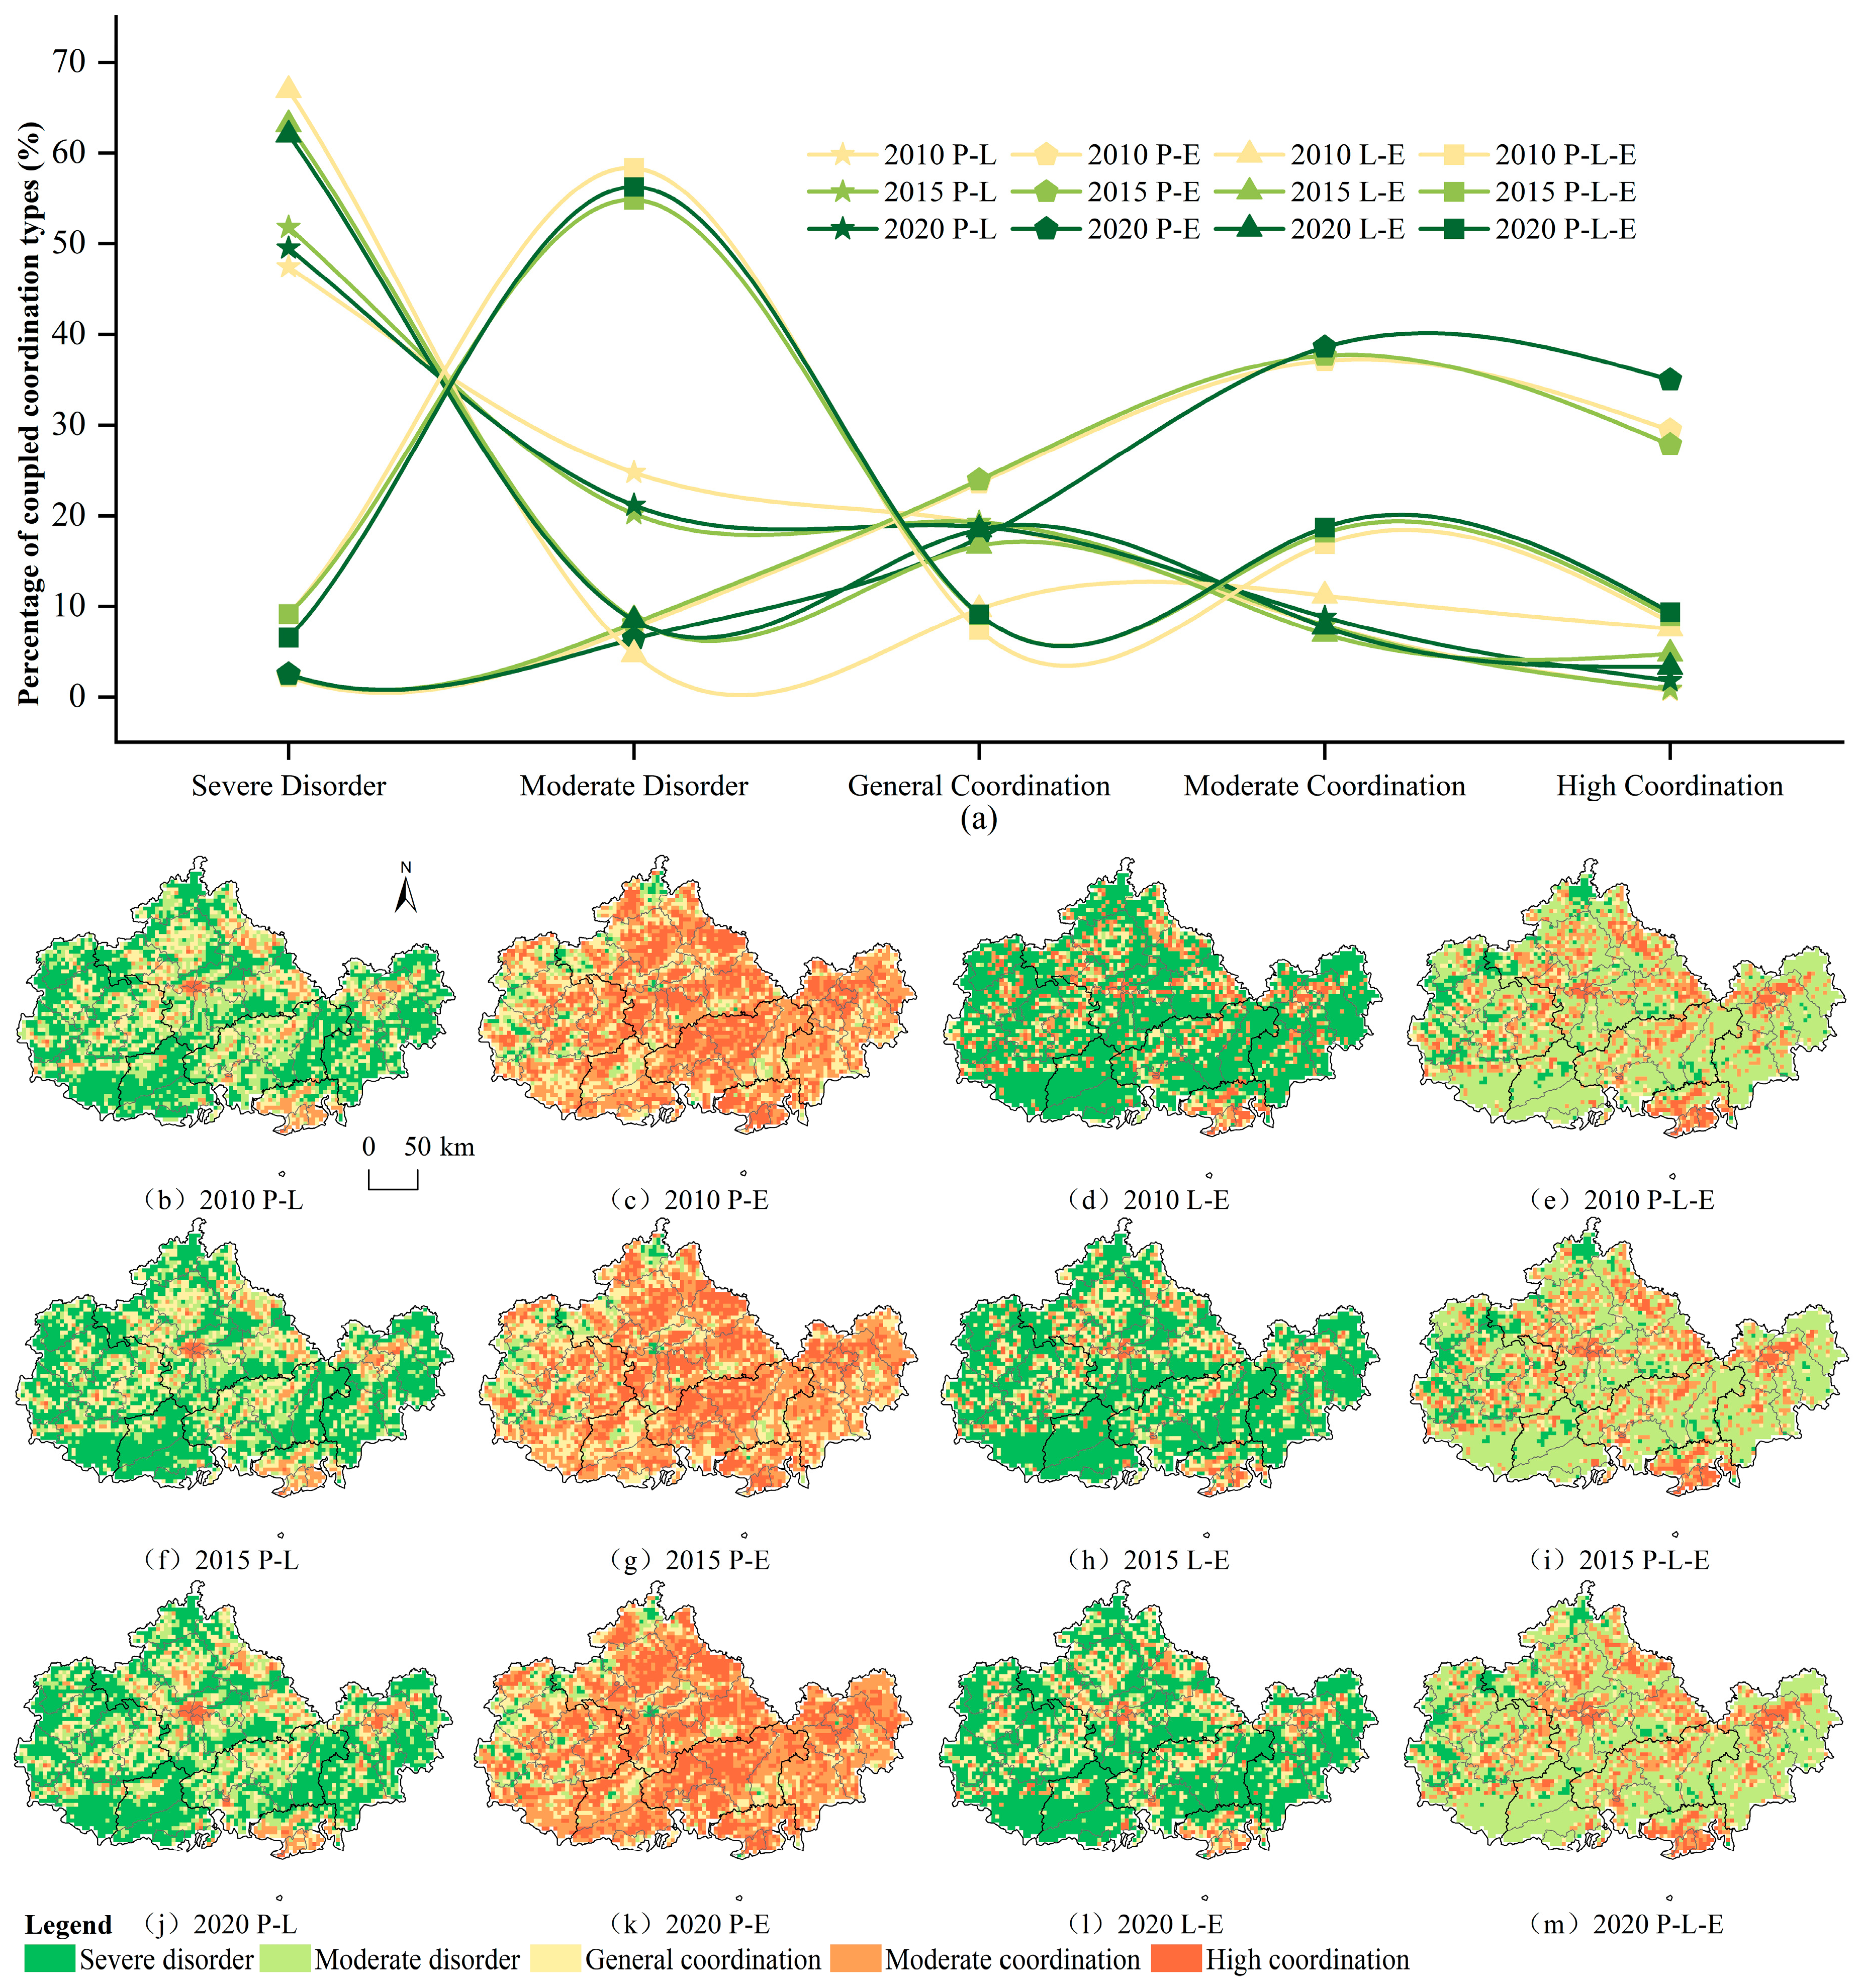
4.3. Evaluation of Coupling and Coordination Among PLEFs in TS

Based on the evaluation of the PLEFs at the grid-cell level from 2010 to 2020, the coupling coordination degree model was employed to analyze the coupling coordination relationships among these functions (Figure 7). During the study period, the coupling coordination relationship of P-L-E is mainly characterized by moderate disorder, followed by moderate coordination. Over time, the proportion of grids with severe and moderate disorder decreased, while the proportion of grids with general, moderate, and high coordination increased. Severe disorder grids were primarily located in the karst mountainous areas of the west and north. While moderate disorder grids accounted for the largest proportion and were widely distributed in the east, west, and central regions. Grid cells with high coordination were mainly concentrated in the central, eastern, and coastal urban areas; moderate coordination grids, which ranked second in proportion, and the less prevalent general coordination grids were both dispersed in the counties surrounding the urban areas of each city. The coupling coordination relationships between L-E and P-L function was predominantly characterized by severe disorder. While the P-E coupling coordination relationship was mainly coordination, with most cases being moderate coordination.
Based on the evaluation of the PLEFs in TS, the production function in regional grid cells showed high-value clustering in urban areas, gradually decreasing toward the surrounding county hinterlands. While the living function predominantly shows high and relatively high values in the urban areas of each city. Since both living and production functions are concentrated in urban areas, they exhibit a coordinated state and develop in an agglomerated manner. Additionally, the ecological function is generally greater and spatially balanced in the counties outside the urban area, and the living and ecology are mostly in the surrounding counties of the urban area, but the spatial distribution is scattered. Moreover, the production function is primarily based on agricultural production, and its dominant grids are mostly located in the hinterlands of counties surrounding urban areas. In these regions, production and living spaces gradually decreased compared to urban areas, while ecological space increased, leading to a gradual enhancement of ecological function. As a result, the coordination degree of the production–ecological relationship was highest in the counties surrounding urban areas, forming contiguous clusters. In mountainous areas, constrained by topography, production space is difficult to establish, and ecological space in urban areas is encroached upon by production and living space, resulting in lower ecological function. Therefore, mountainous and urban areas were mostly characterized by a trade-off between production and ecology, with a lower degree of coordination.

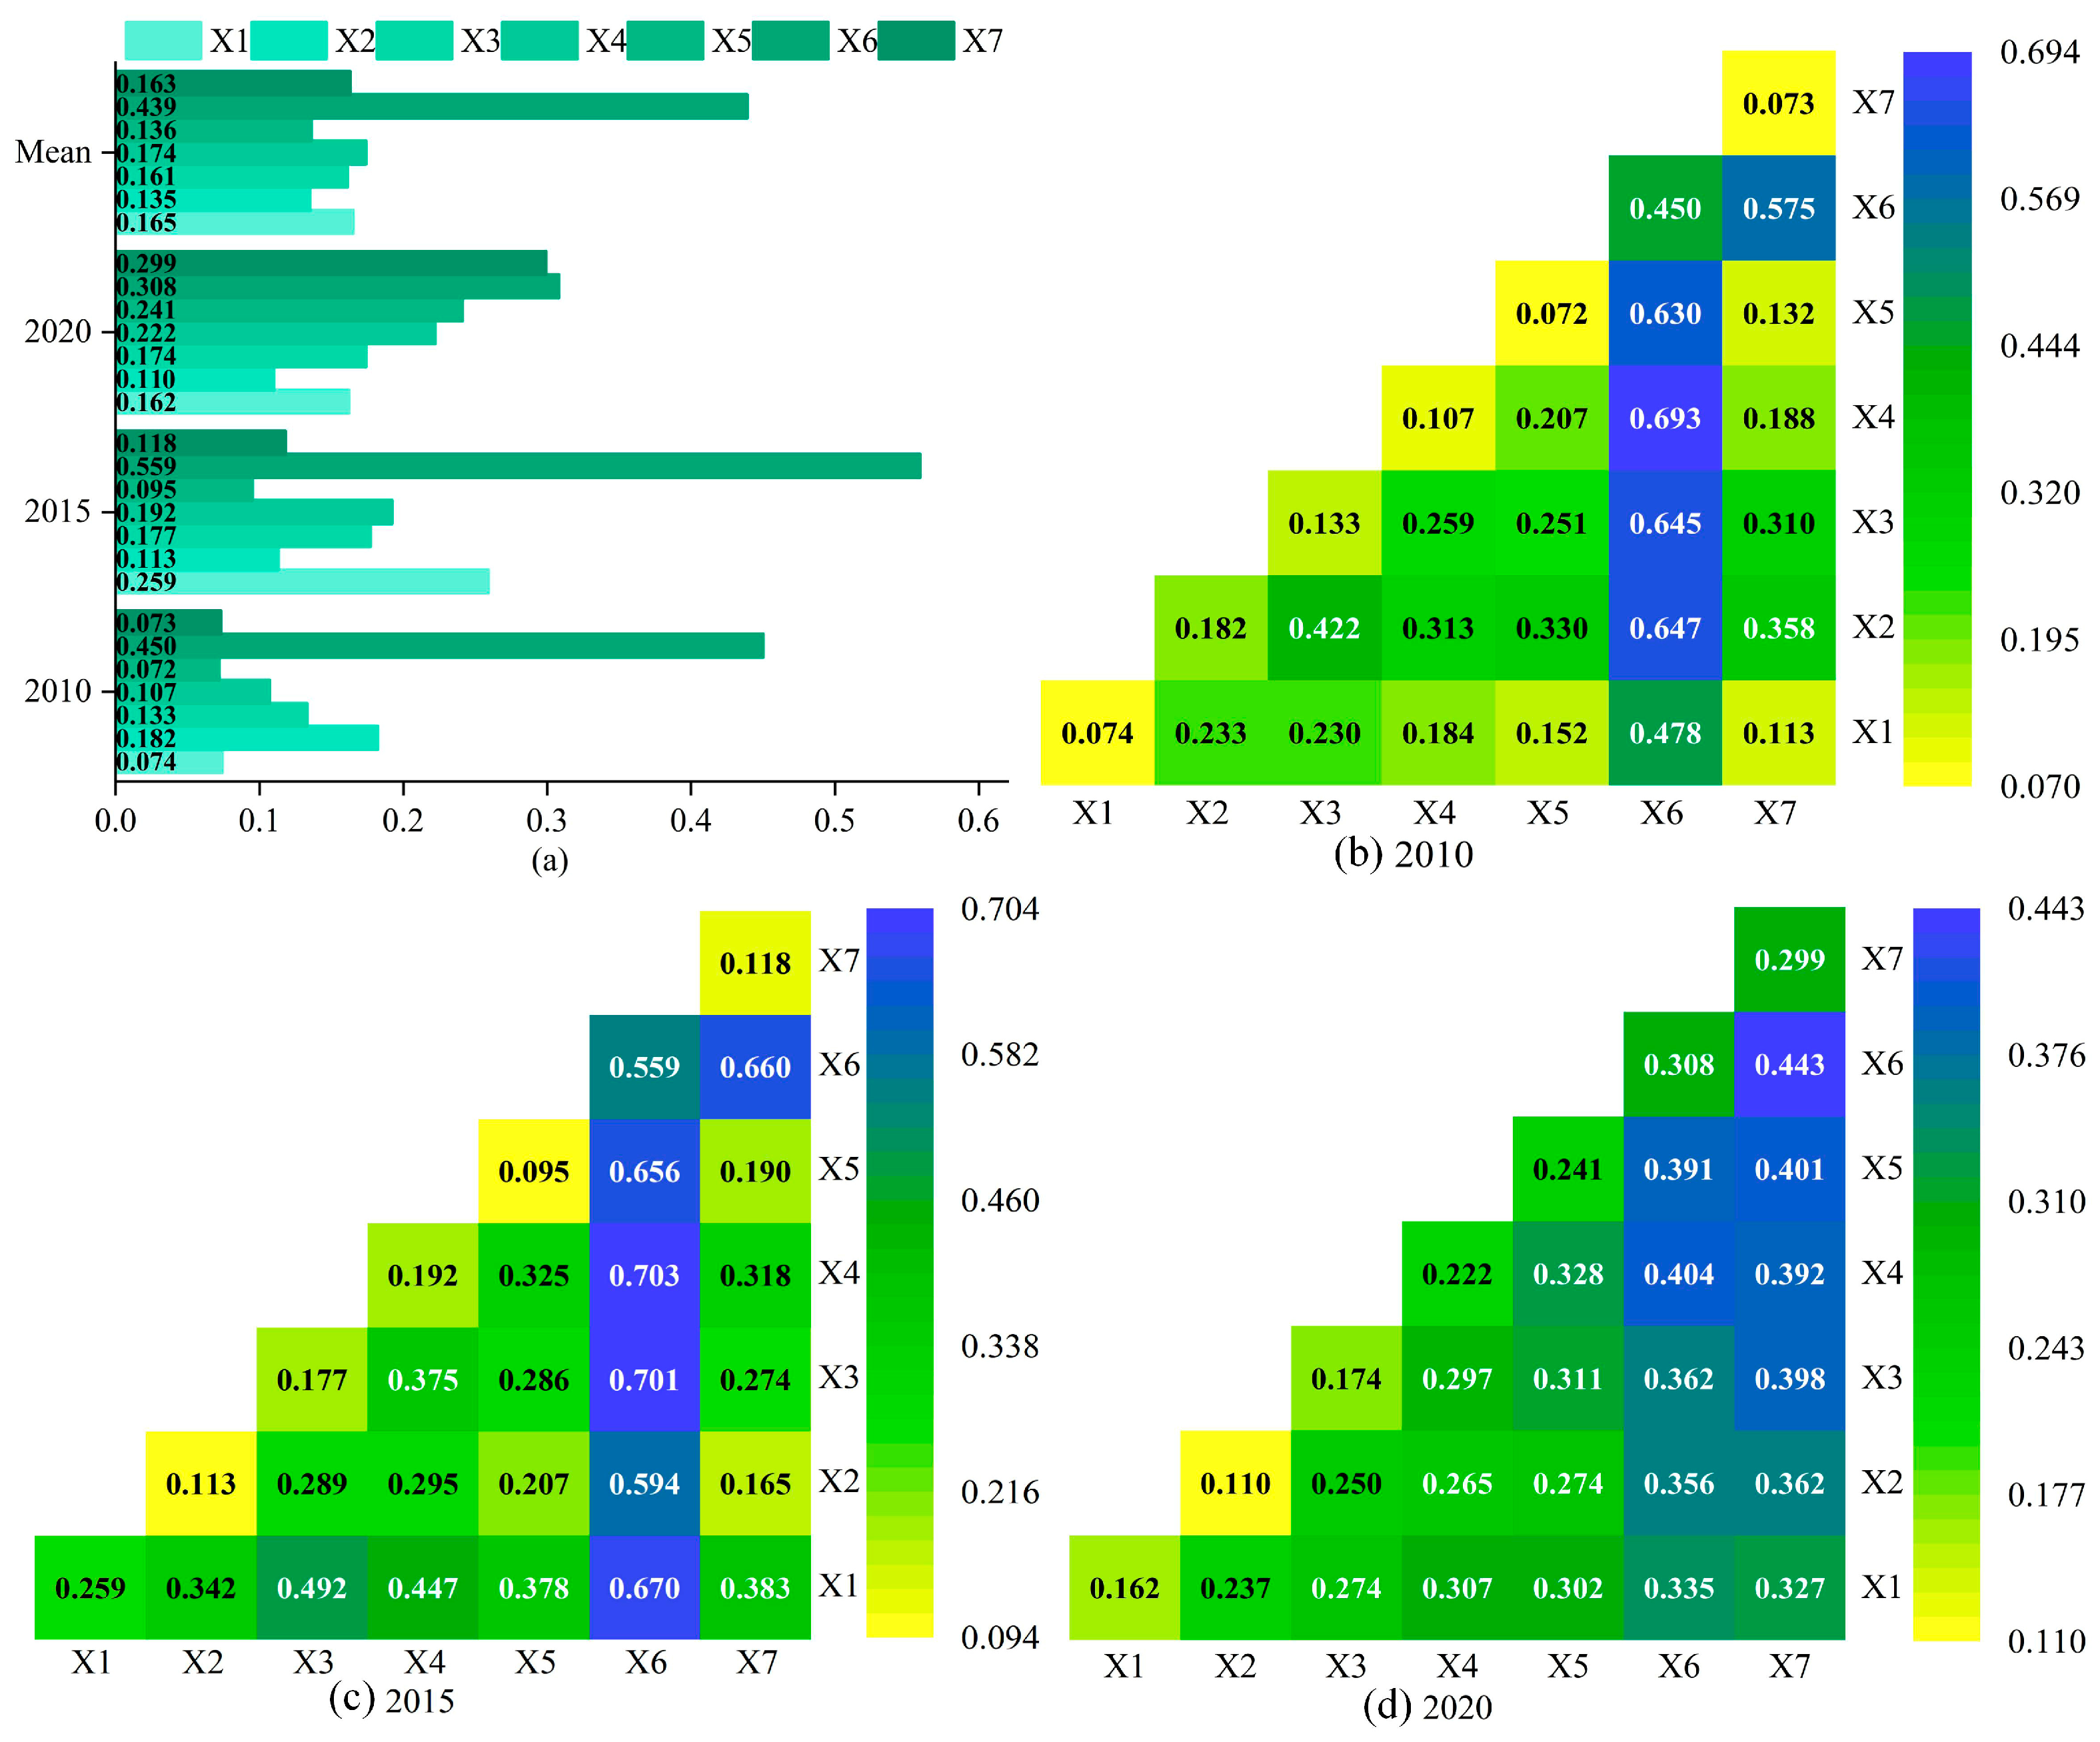
4.4. Influencing Factors of Coupled Coordination Relationships of PLEFs in TS

The regional natural endowments, socio-economics, and policy regulations exert profound influences on the spatial pattern and functions of TS. Due to the relatively balanced regional climate conditions, this study selects elevation (X1) for natural endowment, population density (X2), road facilities (X3), public facilities (X4), industrial development (X5) for socio-economics, and ecological protection (X6), and cultivated land protection (X7) for policy regulation, with a total of seven indicators as influencing factors of the coupling coordination relationship of PLEFs. Considering the differences in the strength of the effects of various influencing factors on the relationship of PLEFs, a Geodetector is used for single-factor effect and two-factor interaction analysis.
The results of the single-factor detection (Figure 8a) reveal that all p-values are 0, indicating that the influencing factors significantly contributed to the spatial variation in the coupling and coordination of PLEFs in TS from 2010 to 2020. The average explanatory power of each factor is X6 > X4 > X1 > X7 > X3 > X5 > X2. The q-values for single-factor explanatory power are mostly below 0.2, suggesting that ecological conservation has a significantly stronger contribution to the coupling and coordination of PLEFs in TS compared to other factors. In the time series, the influence of public facilities, industrial development, and cultivated land protection on the relationship among PLEFs in TS has been continuously increasing, while the influence of population density has gradually decreased.
The interactive detection results of the Geodetector (Figure 8b–d) reveal that the combined influence of different impact factors is higher than that of any single factor. This indicates that a single factor alone cannot fully explain the spatial differentiation in the coupling and coordination relationship among the PLEFs. Rather, this relationship was influenced not only by individual factors but also by the combined effects of multiple factors. Notably, the interaction between ecological protection and other factors significantly intensified between 2010 and 2015, with the interaction with public services exhibiting the strongest explanatory power among all interactions, at 0.693 and 0.703, respectively. In 2010, it was followed by the interaction between ecological protection and population density, with an explanatory power of 0.647. In 2015, the interaction between ecological protection and road facilities were secondary, with an explanatory power of 0.701. In 2020, the interactions among various factors changed, with the interaction between cultivated land protection and other factors being the most significant, among which the interaction between cultivated land protection and ecological protection had the strongest explanatory power at 0.443. Additionally, the interactions between cultivated land protection and industrial development, road facilities, and public facilities also showed noticeable enhancement.

4.5. Spatial-Temporal Heterogeneity of Factors Influencing the Coupled Coordination Relationship of PLEFs in TS

In this study, SPSS 26 was used to construct an Ordinary Least Squares (OSL) model for collinearity diagnosis of influencing variables. The variance inflation factor (VIF) of all indicators was less than 5, indicating that the multicollinearity test was passed. Based on the OSL model constructed by SPSS 26 and the Geographically Weighted Regression (GWR) and Geographically and Temporally Weighted Regression (GTWR) models constructed by GTWR_Beta1.1, R2, Adjusted R2, and AICc were selected to measure and compare the fit of different models. The R2 and Adjusted R2 of the GTWR model were both greater than those of the OSL and GWR models, and the AICc was smaller than that of the OSL and GWR models. This shows that the GTWR model has the best fit, and each factor has a more explanatory power for the coupling and coordination degree of the PLEFs in the BGEZ (Figure 9o).
The GTWR model explains that the regression coefficients of influencing factors vary with spatial and temporal, and the degree and scope of their effects exhibit spatiotemporal heterogeneity (Figure 9).
From the perspective of natural endowments, the spatial differentiation of elevation regression coefficients remained relatively stable. Significantly positive effects of elevation were observed not only in the eastern and western mountainous areas but also in the urban core of Nanning and its northeastern counties. In other regions, the influence of elevation is mostly negative. In the eastern region, including the Liuwandashan and Darong Mountain in Yulin, and Shiwandashan in Fangchenggang in the southwest, is complex, making it difficult to establish production–living space. The PLEFs in these areas primarily relied on ecological space with high vegetation coverage and rich biodiversity. As the regional economic growth center, Nanning is located in a basin where industries and population are concentrated, highlighting its production–living functions. Qingxiu Mountain, serving as the “green eye and lung” of the urban area, and Daming Mountain, a national nature reserve, are important ecological barriers for the capital city, both enhancing ecological function. Consequently, this synergy enhanced the coupling coordination of PLEFs in TS. During the study period, both positive and negative elevation effects intensified in the later stage compared to the earlier phase. This demonstrated a growing spatiotemporal prominence of elevation’s dualistic impacts on the coupling coordination pattern of PLEFs in TS.
From the perspective of socio-economic, (1) during the study period, the positive influence of regional population density significantly weakened, while the negative influence slightly intensified, accompanied by a shift in the spatial pattern of these effects. In the earlier period, this factor exhibited the strongest positive influence in the western mountainous areas, with a notably weaker positive impact in the eastern and coastal regions. Conversely, the central and southwestern regions experienced negative effects. In the later period, the influence of this factor shifted from positive to negative in the southern coastal areas, central regions, and eastern plains. The high-density population aggregation in these areas created conflicts and pressures on the PLEFs. The positive impacts of this factor were primarily observed in the eastern, western, and northern mountainous regions. (2) In both study periods, road facilities exhibited the strongest positive force in the mountainous counties located in the northern part of Nanning. The regression coefficients indicate a positive effect in the central regions, with this effect becoming more pronounced in the later period compared to the earlier one. This positive influence gradually extends from the northern mountainous areas to the southern coastal and southwestern regions. However, the regression coefficients for this factor were mostly negative in the eastern and western regions. Strengthening the transportation infrastructure network in the central region and enhancing the transportation connectivity between Nanning, the capital of Guangxi, and the coastal areas can promote resource sharing and industrial cooperation between the capital and coastal cities. This has a significant positive impact on the coordinated development of the PLEFs in the central TS. (3) The spatial pattern of the positive and negative impacts of public facilities remained relatively stable, characterized by positive effects in the central-eastern and coastal regions and negative effects in the western region. Compared to the earlier period, the positive influence of public facilities in the later period not only strengthened but also extended from the central regions toward the coastal and eastern areas. During the study period, public services exerted the strongest positive factor in the urban area of Nanning, the capital city, and the eastern hinterland. In the later period, the influence of this factor also reached its peak in the southern coastal regions. The well-developed public service facilities in these areas play a significant role in coordinating the PLEFs of TS. Moreover, the positive role of optimizing public facilities in improving the relationship between the PLEFs in coastal and eastern regions is becoming increasingly prominent. (4) Industrial development referred to the transformation and upgrading of the industrial structure from a primary industry-dominated model to one focused on secondary and tertiary industries, thereby enhancing land output efficiency and strengthening the production and living functions of TS. Industrial development primarily exerted a positive and increasingly significant influence on the coordination of the PLEFs of TS. In the earlier period, the urban area of Nanning exhibited the highest positive influence, with this influence gradually decreasing toward its northern and western peripheries and showing a trend of extending toward the coastal areas. In the later period, the most significant positive influence was observed in the northern mountainous regions of Nanning, while the positive impact of industrial development in coastal areas became increasingly prominent and expanded in scope.
From the perspective of policy regulation, (1) The eastern, western, and northern regions are predominantly mountainous, with karst landforms in the west and north. These mountainous regions not only serve as ecological barriers but are also ecologically sensitive and fragile zones. The southern region borders the sea, necessitating a focus on ecological protection during the development and utilization of TS. The regression coefficients for ecological protection exhibit spatial heterogeneity, with a relatively stable pattern of positive and negative influences during the study period. Negative impacts in central Nanning and the east, with positive impacts dominating in the rest of the region, and the strongest positive forces in the north, between the east and the center, and along the south coast areas. In the later period, both positive and negative influences of ecological protection weakened. And a trend of positive effects shifted from the southern coastal area toward the transitional zone between the central and eastern regions and even the northern mountainous areas. (2) The regression coefficients for cultivated land protection are all positive, with a significant enhancement of positive effects and a shift in the pattern of high and low impact differences. In the earlier period, the areas with the highest positive influence were primarily located in the southern region, with a gradual decrease in influence toward the eastern, western, and central regions. The central and eastern regions exhibited the weakest positive effects of cultivated land protection. In the later period, the areas with the highest positive influence shifted to the eastern and western regions, as well as parts of the northern mountainous areas, where agricultural production remains dominant. Cultivated land protection, supported by policy measures, provides stable land resources for sustainable agricultural development in these regions. In contrast, the central and southern coastal regions showed lower positive effects of this factor. The central region, where the capital city, Nanning, is located, has already transitioned its industrial structure toward secondary and tertiary industries. In the later period, with the development of port-related economic activities and the growth of non-agricultural industries in the coastal areas, the positive influence of cultivated land protection has weakened.

5. Discussion

5.1. Mechanisms Affecting the Coupled Coordination Relationship of PLEFs in TS

This article discusses the coupling and coordination relationship of PLEFs in TS of the BGEZ in Guangxi at the grid scale and analyzes the influencing factors of the changes in inter-functional relationships. Based on the previous analysis results, it attributes the influencing factors of the coupling and coordination relationship of PLEFs in TS of the study area, summarizing the driving factors and mechanisms of the changes in their coupling and coordination relationship (Figure 10). The Beibu Gulf Economic Zone in Guangxi is the only coastal area in the western region of China, and it is a region where China has both maritime channels and land borders with Southeast Asian countries, clearly characterized by its “coastal and border” location. This study evaluated the functions of TS and analyzes relationships through grid scale, concluding that since the implementation of the “Belt and Road” initiative, the regional economic strength has increased, industries have developed, infrastructure has improved, and the functions of TS have become complex and variable under social changes, with distinct regional development characteristics. In the early stages of research, the level of regional industrialization and urbanization was low, and ecological resources were relatively abundant. The overall production and living functions of TS were lower than ecological function, and most grid PLEFs relationships in the region were in a state of moderate disorder. Apart from the urban areas, the county regions still show an industrial pattern dominated by the primary industry. Although an economic pattern centered around the capital Nanning has initially formed, the scale of the port economy is limited, the advantages of border trade have not been highlighted, and the transportation facilities connecting Nanning with coastal areas are lagging behind. In the late stage of the research, with the industrial transformation and structural upgrading of the urban areas in each city, the infrastructure and living facilities are complete, production and living functions are gradually upgraded, the coordination of PLEFs is improved, and the proportion of the moderate coordination relationship grid increases. With the industrial transformation of the capital and the offshore urban areas, between the central and eastern parts of the region as a highly populated area, production and living space crowds the ecological space, and the pressure of ecological protection and restoration in these areas increases.
The impact of policy regulation on the functional relationship of regional TS is profound, and the interaction between ecological protection and other factors has significantly increased in the early stages of research. The western and northern parts of the BGEZ in Guangxi are widely distributed with karst landforms, featuring undulating mountains, high vegetation coverage, rich biodiversity, and overall high ecological function. Only the Nanning Basin, Yulin Basin, and Beihai Nanliu River Plain have gentle terrain, suitable for population and industrial agglomeration. These flat areas have gradually become gathering places for urbanization or industrialization in various cities, serving as “highlands” for regional production and living function, with a high degree of coordination in their PLEFs. However, due to complex geological conditions and the impact of karst stoniness, there is an urgent need to strengthen karst ecological restoration, alleviate the degradation of karst ecosystems, and enhance vegetation coverage, which can effectively mitigate the urgency of sustainable development between the economy, society, and natural ecosystems. In recent years, the southern coastal area of the BGEZ has built a modern industrial cluster with the port industrial park as the carrier and industry as the pillar. This has increased production and living space, putting pressure on the ecosystem. Therefore, through coastal ecological protection projects, not only can the coast be protected, but the scale of coastal plants such as mangroves can also be restored, enhancing coastal biodiversity and ecosystem stability. Therefore, focusing on ecological protection and governance in mountainous and coastal areas provides a stable ecological resource foundation for regional industrial development and infrastructure construction. In the late stage of the study, the interaction between cultivated land protection and other factors has increased, and this factor plays a more significant role in the east, west, north, and most of the counties in these regions, except for the urban areas, which are dominated by the primary production. The regional plantation pattern of “eastern vegetables and western sugar” has been formed, the development and transformation of the secondary and tertiary industries lag behind compared with the central and coastal areas. Comprehensive management of cultivated land resources is required, improving the infrastructure conditions of cultivated land, enhancing soil fertility and water resource utilization efficiency, and preventing illegal occupation of cultivated land resources through land protection, ensuring the quantity, quality, and ecological safety of cultivated land, and promoting sustainable agricultural development.
During the research period, the role of economic and social development in promoting the coordination of relationships among PLEFs gradually became prominent, especially in Nanning, the capital of Guangxi, and the southern coastal region, initially forming an integrated pattern centered on Nanning, with the three cities of Beihai, Qinzhou, and Fangchenggang along the coast. Road facilities in the early stage played a strong role, improving the hierarchical structure of the regional road network, enhancing the connectivity and accessibility of the road network, and providing objective conditions for the flow and optimal allocation of resources and talents. At the same time, the public services in areas such as science, education, culture, and health are well-equipped, achieving equalization of public services, promoting residents’ access to various social welfare, facilitating the integrated development of the service industry, and providing a foundation for improving quality of life and industrial transformation; the continuous development of transportation and public service support not only strengthens the flow of talent, technology, and capital but also drives the formation of industrial chains such as automobile manufacturing, new energy batteries, and electronic information, promoting Nanning and coastal cities to gradually complete industrial transformation and structural upgrading, thus making the role of later industrial development more significant.

5.2. Contributions and Limitations

This article constructs a 4 km × 4 km grid covering the Beibu Gulf Economic Zone in Guangxi, achieving an evaluation of the coupling and coordination of PLEFs at the grid scale and analyzing the mechanisms affecting the coupling and coordination relationship of PLEFs, which to some extent compensates for the current empirical research on PLEFs that focuses more on the administrative unit scale and neglects the micro grid scale. The study of PLEFs from the grid scale can further explore the functional differences and texture characteristics of TS within the districts and counties and can grasp the functions of the regional TS and its relationship more accurately. At the same time, analyzing the spatial and temporal heterogeneity of the influencing factors on the coupling and coordination relationship of PLEFs in TS from the grid scale, which can clarify the strength and temporal–spatial differences in each influencing factor’s functional role on TS at the micro level, providing a scientific basis for formulating relevant spatial planning for the efficient and sustainable use of TS in karst regions.
However, socioeconomic statistics are mostly based on administrative units. In China, the comprehensiveness of township and village-level socioeconomic data is inadequate and difficult to obtain. When socioeconomic data at the district and county level is quantified at the grid scale, its precision often fails to meet the research needs at the grid scale. Therefore, the impact factor data selected in this paper is mainly obtained through the collection of POI data. In future research, collecting more categorized POI data or using field-survey data can further enhance the impact factor, offering a more comprehensive understanding of the mechanisms driving changes in the relationships of the PLEFs of TS.

6. Conclusions

Based on the three-period land use remote sensing monitoring data in 2010, 2015, and 2020, this paper takes the Beibu Gulf Economic Zone of Guangxi as the study area, and constructs a 4 km × 4 km grid as the study unit to reveal the influencing factors and influencing mechanisms of the coupled coordination relationship of PLEFs. The main conclusions are as follows:
(1)
The territorial space of the region is primarily ecological space, followed by production space, with living space being the smallest; under the primary classification, production and ecological spaces predominantly flow into living space; under the secondary classification, there is a significant conversion between agricultural production space and forest and grassland ecological space, which also flows into rural living space.
(2)
The spatial pattern of PLEFs in TS is relatively stable: Ecological function is generally high and evenly distributed. Production function tends to cluster in urban areas, with low levels in the west. Living function shows the most significant spatial differences, clustering in the central capital city. The regional grids can be divided into three types based on functional dominance and six types based on functional combination.
(3)
The coupling and coordination of the Production–Living–Ecological function is mainly moderately disordered. Living function is seriously disordered with production and ecological function. The production–ecological function is mainly moderately coordination.
(4)
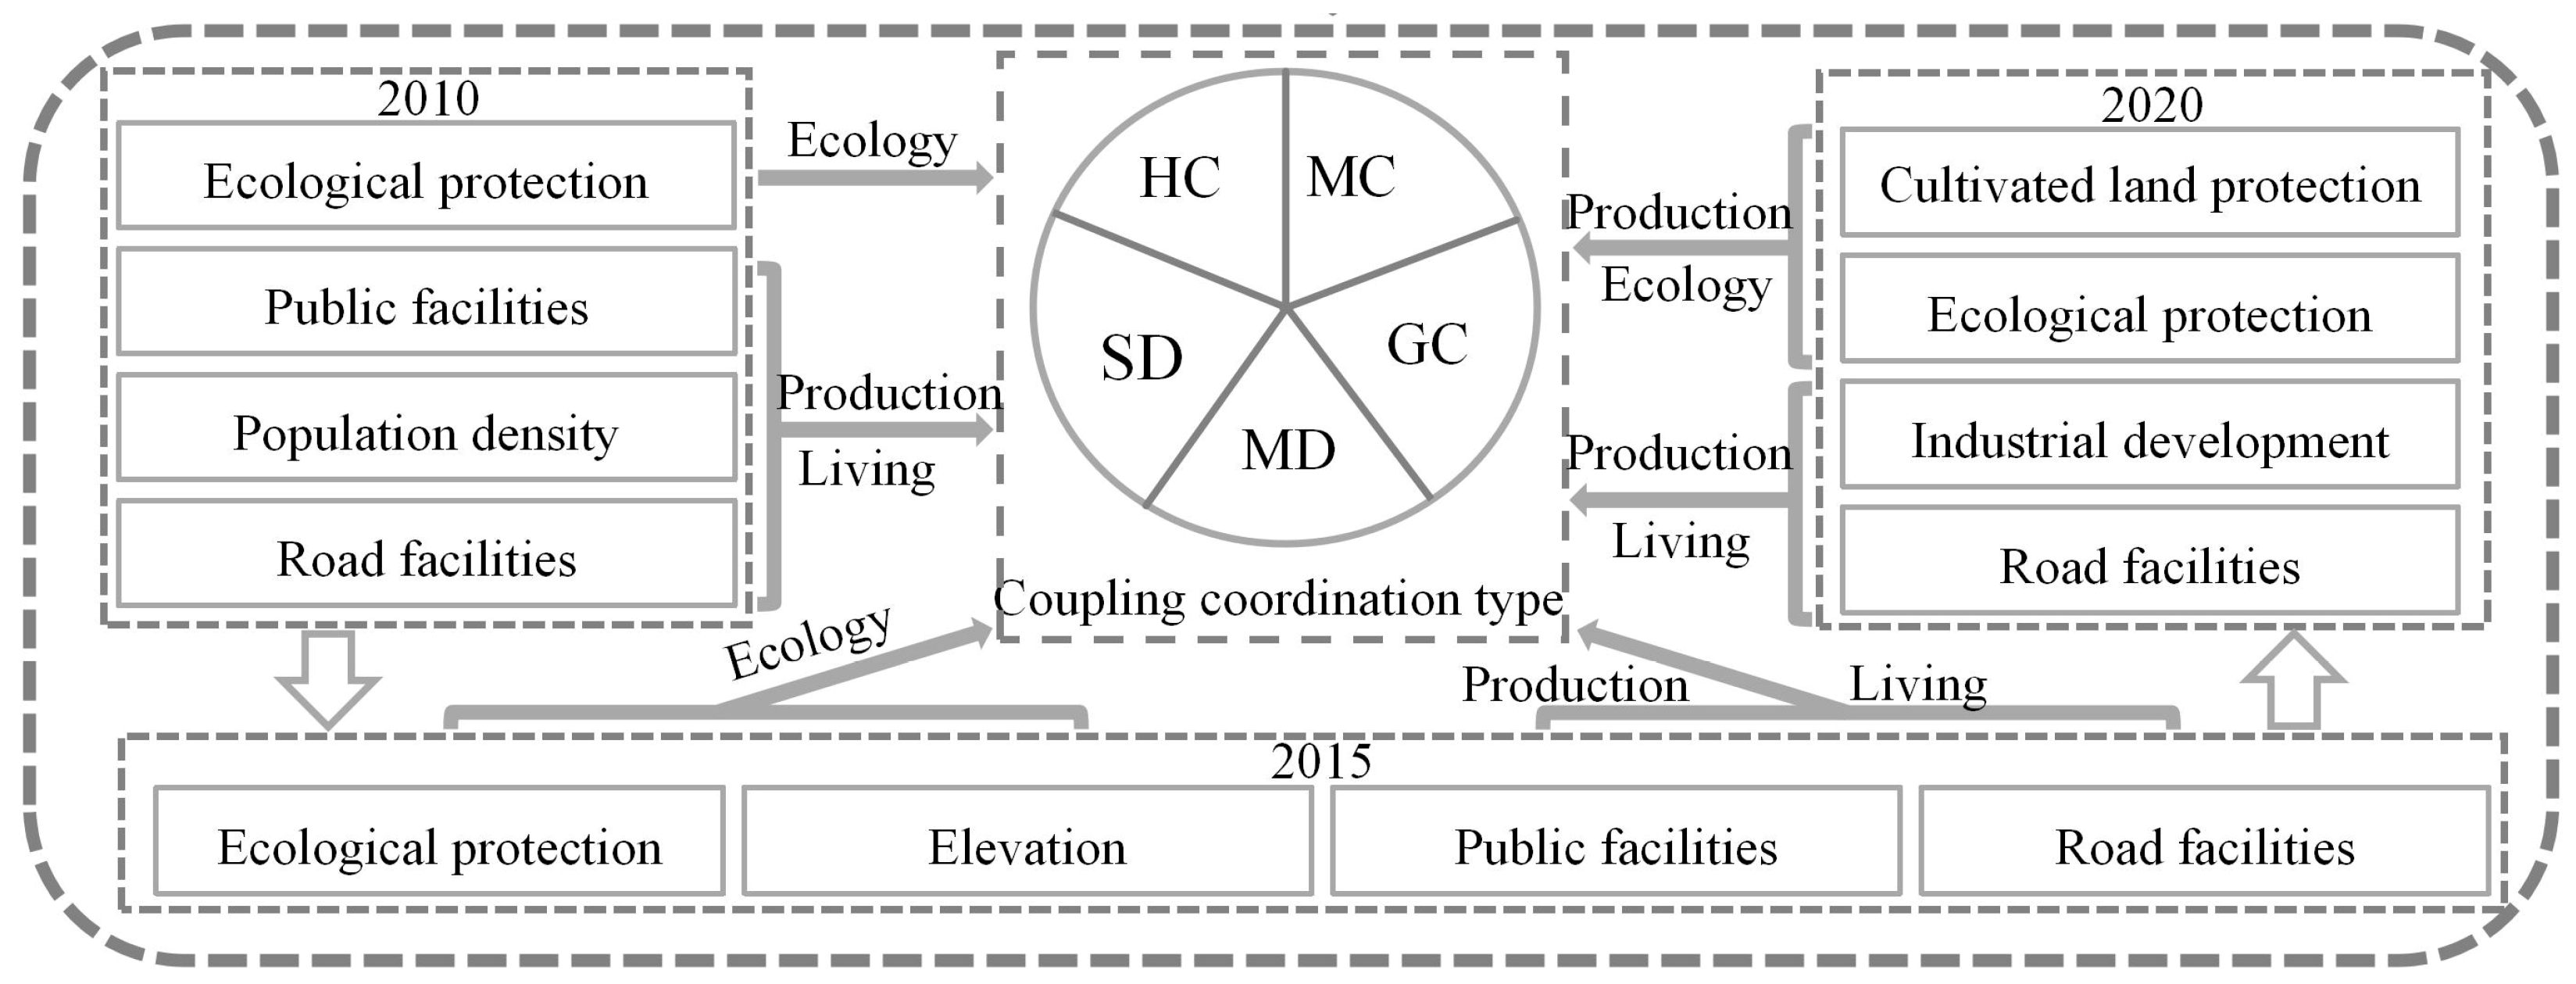
Ecological protection has a significant impact on the coupling coordination degree of PLEFs compared to other factors, while the influence of public facilities, industrial development, and cultivated land protection continues to strengthen, the effect of population density gradually weakens. The interaction between ecological protection and other factors significantly increased from 2010 to 2015. In 2020, the interaction between cultivated land protection and other factors significantly increased.

Author Contributions

Conceptualization, T.F.; methodology, T.F. and D.W.; software, D.W., X.Y. and R.D.; validation, T.F. and D.W.; formal analysis, T.F. and D.W.; data curation, D.W.; writing—original draft preparation, T.F. and D.W.; writing—review and editing, T.F., D.W., X.Y., R.D., M.Z. and S.C.; visualization, D.W.; supervision, T.F.; project administration, T.F.; funding acquisition, T.F. All authors have read and agreed to the published version of the manuscript.

Funding

This research was funded by the Project from Natural Science Foundation of Guangxi [grant number 2021GXNSFBA220009].

Data Availability Statement

All data analyzed in the research are presented in the paper, and all can be used to provide appropriate references.

Acknowledgments

Thank you to everyone who contributed to this study.

Conflicts of Interest

The authors declare no conflicts of interest.

Abbreviations

TSTerritorial Space
PLESProduction–Living–Ecological Space
PLEFsProduction–Living–Ecological Fuctions
P-L-EProduction–Living–Ecology
P-LProduction–living
P-EProduction–Ecology
L-ELiving–Ecology
VIFVariance Inflation Factor
OLSOrdinary Least Squares
GWRGeographically Weighted Regression
GTWRGeographical and Temporal Weighted Regression
CCDCoupling Coordination Degree
PCAPrincipal Component Analysis
BGEZBeibu Gulf Economic Zone
GISGeographic Information System
ASEANAssociation of Southeast Asian Nations
NDVINormalized Difference Vegetation Index
POIPoint of Interest

References

  1. Wang, Q.; Chen, T.; Li, A.; Zhang, S.; Wang, Y. Evaluation of Territorial Utilization Quality Based on “Production-Living-Ecological” Perspectives-A Case Study of Panxi Region. Mt. Res. 2020, 38, 290–302. [Google Scholar]
  2. Huang, J.; Lin, H.; Qi, X. A literature review on optimization of spatial development pattern based on ecological-production-living space. Prog. Geogr. 2017, 36, 378–391. [Google Scholar]
  3. Ding, Z.; Tian, P.; Tang, Y. Terrain Gradient Effect on Land Spatial Function Changes in Typical Mountainous and Hilly Areas. Res. Soil Water Conserv. 2023, 30, 379–386. [Google Scholar]
  4. Wang, Y.; Zhao, R.; Li, Y.; Yao, R.; Wu, R.; Li, W. Research on the evolution and the driving forces of land use classification for production, living, and ecological space in China’s Qilian Mountains Nature Reserve from 2000 to 2020. Environ. Sci. Pollut. Res. 2023, 30, 64949–64970. [Google Scholar] [CrossRef] [PubMed]
  5. Song, W.; Cao, S.; Du, M.; He, Z. Aligning territorial spatial planning with sustainable development goals: A comprehensive analysis of production, living, and ecological spaces in China. Ecol. Indic. 2024, 160, 111816. [Google Scholar] [CrossRef]
  6. Zhu, Z.; Peng, S.; Ma, X.; Lin, Z.; Ma, D.; Shi, S.; Gong, L.; Huang, B. Identification of potential conflicts in the production-living-ecological spaces of the Central Yunnan Urban Agglomeration from a multi-scale perspective. Ecol. Indic. 2024, 165, 112206. [Google Scholar] [CrossRef]
  7. Yang, T.; Yang, D.; Sun, J.; Luo, J.; Cui, J.; Kong, X. Spatio-temporal evolution and driving mechanism of production, living and ecological function in karst mountainous areas: A case study of Guizhou Province. Ecol. Sci. 2023, 42, 215–224. [Google Scholar]
  8. Qu, Y.; Wang, S.; Tian, Y.; Jiang, G.; Zhou, T.; Meng, L. Territorial spatial planning for regional high-quality development-An analytical framework for the identification, mediation and transmission of potential land utilization conflicts in the Yellow River Delta. Land Use Policy 2023, 125, 106462. [Google Scholar]
  9. Li, J.; Sun, W.; Li, M.; Meng, L. Coupling coordination degree of production, living and ecological spaces and its influencing factors in the Yellow River Basin. J. Clean. Prod. 2021, 298, 126803. [Google Scholar] [CrossRef]
  10. Fang, Y.; Liu, B.; Liu, J. Territorial types and optimization strategies of agriculture multifunctions: A case study of Jilin Province. Prog. Geogr. 2019, 38, 1349–1360. [Google Scholar] [CrossRef]
  11. SchoBer, B.; Helming, K.; Wiggering, H. Assessing land use changeimpacts: A comparison of the SENSOR land use function approach with other frameworks. J. Land Use Sci. 2010, 5, 159–178. [Google Scholar]
  12. Reidsma, P.; König, H.; Feng, S.; Bezlepkina, I.; Nesheim, I.; Bonin, M.; Sghaier, M.; Purushothaman, S.; Sieber, S.; Van Ittersum, M.K.; et al. Methods and tools for integrated assessment of land use policies on sustainable development in developing countries. Land Use Policy 2011, 28, 604–617. [Google Scholar] [CrossRef]
  13. Deng, Y.; Yang, R. Influence Mechanism of Production-Living-Ecological Space Changes in the Urbanization Process of Guangdong Province, China. Land 2021, 10, 1357. [Google Scholar] [CrossRef]
  14. Zhang, X.; Xu, Z. Functional Coupling Degree and Human Activity Intensity of Production-Living-Ecological Space in Underdeveloped Regions in China: Case Study of Guizhou Province. Land 2021, 10, 56. [Google Scholar] [CrossRef]
  15. Liu, Y.; Xu, R.; Yang, J.; Xie, X.; Cui, X. Decoding Land Use Conflicts: Spatiotemporal Analysis and Constraint Diagnosis from the Perspectives of Production–Living–Ecological Functions. Land 2024, 13, 2187. [Google Scholar] [CrossRef]
  16. Lei, W.; Gu, J.; Xie, H. Land use pattern and multifunctional evolution in Hunan Province using “production-living-ecosystem” space. Trans. CSAE 2024, 40, 283–293. [Google Scholar]
  17. Hong, T.; Liang, N.; Li, H. Study on the Spatial and Temporal Evolution Characteristics and Driving Factors of the “Production–Living–Ecological Space” in Changfeng County. Sustainability 2023, 15, 10445. [Google Scholar] [CrossRef]
  18. Gong, Z.; Yuan, Y.; Qie, L.; Huang, S.; Xie, X.; Zhong, R.; Pu, L. Spatiotemporal Differentiation and Coupling Coordination Relationship of the Production–Living–Ecological Function at County Scale: A Case Study of Jiangsu Province. Land 2023, 12, 2027. [Google Scholar] [CrossRef]
  19. Yuan, W.; Bai, L.; Gao, X.; Zhou, K.; Gao, Y.; Zhou, X.; Qiu, Z.; Kou, Y.; Lv, Z.; Zhao, D.; et al. The Ecological Risks in Arid Zones from a Production-Living-Ecological Space Perspective: A Case Study of the Tuha Region in Xinjiang, China. Remote Sens. 2024, 16, 3224. [Google Scholar] [CrossRef]
  20. Zhou, D.; Xu, J.; Lin, Z. Conflict or coordination? Assessing land use multi-functionalization using production-living-ecology analysis. Sci. Total Environ. 2017, 577, 136–147. [Google Scholar] [CrossRef]
  21. Zou, L.; Liu, Y.; Yang, J.; Yang, S.; Hu, Y. Quantitative identification and spatial analysis of land use ecological-production-living functions in rural areas on China’s southeast coast. Habitat Int. 2020, 100, 102182. [Google Scholar] [CrossRef]
  22. Xu, L.; Wang, J.; Zhang, G.; Ma, L. Functional evolution characteristics and zoning control of the “Production-Living-Ecological” function in of the region around Beijing and Tianjin. Urban Probl. 2022, 10, 35–44. [Google Scholar]
  23. Shan, W.; Jin, X.; Ran, N.; Fan, Y.; Liu, J.; Zhou, Y. “Production-Living-Ecological” Function Evaluation and Coupling Coordination Analysis of Land Use in Jiangsu Province. Resour. Environ. Yangtze Basin 2019, 28, 1541–1551. [Google Scholar]
  24. Jia, K.; Yu, Y.; Chen, G.; Tang, L.; Yuan, Y. Optimization of territorial spatial pattern in the Hohhot-Baotou-Ordos-Wulanchabu integrated development area based on the “production-living-ecology” functions. J. Arid Land Resour. Environ. 2024, 38, 169–178. [Google Scholar]
  25. Zhao, H.; Gu, T.; Sun, D.; Miao, C. Dynamic evolution and influencing mechanism of urban human settlements in the Yellow River Basin from the perspective of “production-living-ecological” function. Acta Geogr. Sin. 2023, 78, 2973–2999. [Google Scholar]
  26. Lin, S.; Lu, R.; Ye, Z.; Liu, S. Spatial Evolution and Coupling Coordination of Territorial Space Functions in China–Vietnam Border Area. China Land Sci. 2022, 36, 90–101. [Google Scholar]
  27. Tian, C.; Cheng, L.; Yin, T. One village, one strategy: Set priorities for the construction of rural production-living-ecological function and improvement of human settlement environment quality. Chin. J. Agric. Resour. Reg. Plan. 2022, 43, 201–209. [Google Scholar]
  28. Zhang, L.; Ji, X.; Su, Y.; Lu, Z. Spatial–Temporal Evolution and Coupling and Coordination of “Production-Life-Ecological” in Energy-Rich Area: A Perspective on Structure and Function. Land 2025, 14, 520. [Google Scholar] [CrossRef]
  29. Dou, Y.; Ye, W.; Li, B.; Liu, P. Tourism Adaptability of Traditional Village Based on Living-Production-Ecological Spaces: A Case Study of Zhangguying Village. Econ. Geogr. 2022, 42, 215–224. [Google Scholar]
  30. Wang, F.; Dong, Y. Dynamic evaluation of land use functions based on grey relation projection method and diagnosis of its obstacle indicators: A case study of Guangzhou city. J. Nat. Resour. 2015, 30, 1698–1713. [Google Scholar]
  31. Lu, Z.; Zhang, M.; Hu, C.; Ma, L.; Chen, E.; Zhang, C.; Xia, G. Spatiotemporal Changes and Influencing Factors of the Coupled Production–Living–Ecological Functions in the Yellow River Basin, China. Land 2024, 13, 1909. [Google Scholar] [CrossRef]
  32. Xu, J.; Tong, Z.; Liu, X.; Zhang, J. Evaluation of Ecological Carrying Capacity in Western Jilin Province from the Perspective of “Production–Living–Ecological Spaces” Coupling Coordination. Sustainability 2025, 17, 211. [Google Scholar] [CrossRef]
  33. Yin, J.; Song, C.; Shi, P.; Gao, P.; Zhang, X. Spatial and temporal transition characteristics and influencing factors of “production-living-ecological” functions of rural areas at county level in Gansu province from the perspective of coupling. Geogr. Res. 2024, 43, 874–892. [Google Scholar]
  34. Wang, Y.; Wang, Y.; Xu, W.; Sheng, Z.; Zhu, Z.; Tang, H. Eco-environmental effect and driving factors of changing “production-living-ecological space” in northern Xinjiang, China. Front. Ecol. Evol. 2023, 11, 1248702. [Google Scholar] [CrossRef]
  35. Yu, T.; Huang, X.; Cui, X. From pixels to Policy: Unveiling the interplay of Production, Living, and ecological functions in Nanjing metropolitan area. Ecol. Indic. 2024, 166, 112443. [Google Scholar] [CrossRef]
  36. Hou, Y.; Zhang, Z.; Wang, Y.; Sun, H.; Xu, C. Function Evaluation and Coordination Analysis of Production-Living-Ecological Space Based on the Perspective of Type-Intensity-Connection: A Case Study of Suzhou, China. Land 2022, 11, 1954. [Google Scholar] [CrossRef]
  37. Duan, Y.; Wang, H.; Huang, A.; Xu, Y.; Lu, L.; Ji, Z. Identification and spatial-temporal evolution of rural “production-living-ecological” space from the perspective of villagers’ behavior: A case study of Ertai Town, Zhangjiakou City. Land Use Policy 2021, 106, 105457. [Google Scholar] [CrossRef]
  38. Huang, A.; Wang, Y.; Xiang, Y.; Xu, X.; Li, T.; Zhou, G.; Yuan, Z.; Zhu, L. A comprehensive framework for assessing spatial conflicts risk: A case study of production-living-ecological spaces based on social-ecological system framework. Habitat Int. 2024, 154, 103218. [Google Scholar] [CrossRef]
  39. Qu, Y.; Dong, X.; Su, D.; Guang, H.; Ma, W. How to balance protection and development? A comprehensive analysis framework for territorial space utilization scale, function and pattern. J. Environ. Manag. 2023, 339, 117809. [Google Scholar] [CrossRef]
  40. Yang, Y.; Ren, X.; Yan, J. Trade-offs or synergies? Identifying dynamic land use functions and their interrelations at the grid scale in urban agglomeration. Cities 2023, 140, 104384. [Google Scholar] [CrossRef]
  41. Kang, Q.; Guo, Q.; Ding, Y.; Zhang, Y. Tradeoffs/synergies analysis of “Production-Living-Ecological” functions in Shanxi province. J. Nat. Resour. 2021, 36, 1195–1207. [Google Scholar] [CrossRef]
  42. Li, W.; Zeng, Y.; Peng, Y.; Chen, W.; Dong, Y.; Ye, Z.; Chen, Y. Spatiotemporal Variation and Driving Mechanisms of the Global ProductionLiving-Ecological Space Coupling Coordination Degree. Land 2024, 13, 2136. [Google Scholar] [CrossRef]
  43. Shan, Y.; Wei, S.; Yuan, W.; Miao, Y. Spatial-temporal differentiation and influencing factors of coupling coordination of “production-living-ecological” functions in Yangtze River Delta urban agglomeration. Acta Geogr. Sin. 2022, 42, 6644–6655. [Google Scholar]
  44. Li, Y.; Zhang, S.; Zhao, J.; Zhang, G.; Qu, G.; Ma, S.; Liu, X. Spatiotemporal evolution and Sustainably comprehensive zoning optimization of production-living-ecological functions in the Mountain-Flatland areas. Heliyon 2024, 10, e23425. [Google Scholar] [CrossRef]
  45. Wang, Y. Spatial–temporal evolution of “Production-Living-Ecologica” function and layout optimization Strategy in China: A case study of Liaoning Province, China. Environ. Sci. Pollut. Res. 2023, 30, 10683–10696. [Google Scholar] [CrossRef] [PubMed]
  46. Li, Z.; Li, Y.; Wang, L.; Pei, Y. Study on the Functional Characteristics and Division Optimization of “Production-Living-Ecological” of Geographical Space in Yunnan Province. Ecol. Econ. 2021, 37, 94–101. [Google Scholar]
  47. Ling, Z.; Li, Y.; Jiang, W.; Liao, C.; Ling, Y. Dynamic Change Characteristics of “Production-living-ecological Spaces” of Urban Agglomeration Interlaced with Mountains, Rivers and Sea: A Case Study of the Beibu Gulf Urban Agglomeration in Guangxi. Econ. Geogr. 2022, 42, 18–24. [Google Scholar]
  48. Feng, T.; Yu, X.; Dong, R.; Zhang, F.; Li, C. Spatial-temporal evolution and influencing factors of the coordination degree of “production-living-ecological” functions in Guangxi Beibu Gulf Economic Zone from the coupling perspective. J. China Agric. Univ. 2024, 29, 303–316. [Google Scholar]
  49. Wang, P.; Pu, X.; Yang, P.; Luo, C. Identification and Spatial-Temporal Evolution Analysis of “Production-Living-Ecological” Space in Karst Area-A Case Study of Huaxi District, Guiyang City. J. Northwest For. Univ. 2023, 38, 263–274. [Google Scholar]
  50. Gao, Y.; Bai, L.; Zhou, K.; Kou, Y.; Yuan, W.; Zhou, X.; Qiu, Z.; Zhao, D.; Lv, Z.; Wu, Q.; et al. Study on the Coupling Coordination Degree and Driving Mechanism of “Production-Living-Ecological” Space in Ecologically Fragile Areas: A Case Study of the Turpan-Hami Basin. Sustainability 2024, 16, 9054. [Google Scholar] [CrossRef]
  51. Zhao, J.; Zhao, Y. Synergy/trade-offs and differential optimization of production, living, and ecological functions in the Yangtze River economic Belt, China. Ecol. Indic. 2023, 147, 109925. [Google Scholar] [CrossRef]
  52. Zhou, H.; Wu, X.; Nie, H.; Wang, X.; Zang, S. Coupling coordination analysis and obstacle factors identification of rural living-production-ecological functions in a farming-pastoral ecotone. Ecol. Indic. 2024, 158, 111398. [Google Scholar] [CrossRef]
  53. Liang, H.; Li, J.; Yin, S.; Feng, L.; Shao, J.; Li, S. Spatial-temporal evolution and influencing factors analysis of coupling coordination of “production-living-ecological” functions in central-southern Liaoning and Harbin-Changchun urban agglomeration. J. China Agric. Univ. 2023, 28, 218–233. [Google Scholar]
  54. Kang, Q.; Guo, Q.; Ding, Y.; Zhang, Y.; Hu, Y.; Chen, S. Temporal and Spatial Evolution and Driving Factors of Productional-Living-Ecological Functions of Shanxi Province during 2005–2018. Bull. Soil Water Conserv. 2021, 41, 327–337. [Google Scholar]
  55. Jiao, G.; Yang, X.; Huang, Z.; Zhang, X.; Lu, L. Evolution characteristics and possible impact factors for the changing pattern and function of “Production-Living-Ecological” space in Wuyuan county. J. Nat. Resour. 2021, 36, 1252–1267. [Google Scholar] [CrossRef]
  56. Feng, T.; Yu, X.; Zhou, Y.; Dong, R.; Wu, D.; Zhang, M. Research on the Coordination Relationship and Zoning Optimization of Territorial Spatial Functions in Southern Karst Regions Based on a Multi-Scale Fusion Model. Land 2025, 14, 430. [Google Scholar] [CrossRef]
  57. Xie, X.; Li, X. Spatio-temporal evolution characteristics and influencing factors of “production-living-ecological” functions in Henan Province, China. Trans. CSAE 2021, 37, 243–252. [Google Scholar]
  58. Lin, S.; Lu, R.; Liu, S.; Ye, Z.; Wei, Q.; Luo, J. Land use pattern and multifunctional evolution in the border areas in the Guangxi Zhuang Autonomous Region based on “production-living-ecosystem” space. Trans. CSAE 2021, 37, 265–274. [Google Scholar]
  59. Pang, L.; Zhou, X.; Wei, L. Function evaluation and coupling coordination analysis of “productive-living-ecological” land space in Guangxi Zhuang Autonomous Region during 2009–2018. Bull. Soil Water Conserv. 2021, 41, 237–244. [Google Scholar]
  60. Zhao, R.; Xiong, K.; Lan, A.; Chen, Q.; Liu, Z.; Feng, F.; Yu, N. Changes in Ecological-Production-Social Functions in Karst Areas: Insight from Guizhou Province, South China Karst. Land 2025, 14, 209. [Google Scholar] [CrossRef]
  61. Jiang, H.; Cui, Z.; Fan, T.; Hua, Y. Impacts of land use change on carbon storage in the Guangxi Beibu Gulf Economic Zone based on the PLUS-InVEST model. Sci. Rep. 2025, 15, 6468. [Google Scholar] [CrossRef] [PubMed]
  62. Gao, C.; Hu, B.; Wang, Z.; Huang, S.; Zhang, L. Study on spatiotemporal changes of ecosystem service trade-offs/synergies and driving mechanisms in the key zone of mountain-river-sea coupling: A case study of the southwest Guangxi Karst-Beibu Gulf. Ecol. Indic. 2024, 169, 112892. [Google Scholar] [CrossRef]
  63. Kong, D.; Chen, H.; Wu, K. The evolution of “Production-Living-Ecological” space, eco-environmental effects and its influencing factors in China. J. Nat. Resour. 2021, 36, 1116–1135. [Google Scholar] [CrossRef]
  64. Zhang, L.; Hu, B.; Zhang, Z.; Liang, G. Research on the spatiotemporal evolution and mechanism of ecosystem service value in the mountain-river-sea transition zone based on “production-living-ecological space”-Taking the Karst-Beibu Gulf in Southwest Guangxi, China as an example. Ecol. Indic. 2023, 148, 109889. [Google Scholar] [CrossRef]
  65. Li, W.; Cai, Z.; Jin, L. Spatiotemporal characteristics and influencing factors of the coupling coordinated development of production-living-ecology system in China. Ecol. Indic. 2022, 145, 109738. [Google Scholar] [CrossRef]
Figure 1. (a) Location of Guangxi; (b) location of BGEZ; (c) districts and counties of the study area; (d) land use of the study area in 2020.
Land 14 00614 g001
Figure 2. Research framework.
Land 14 00614 g002
Figure 3. Spatial distribution and transfer of PLES in the BGEZ. (ac) Spatial distribution of PLES from 2010 to 2020 under the primary classification. (df) Spatial distribution of PLES from 2010 to 2020 under the secondary classification. (g) Transfers of PLES from 2010 to 2020 under the primary classification. (h) Transfers of PLES from 2010 to 2020 under the secondary classification.
Land 14 00614 g003
Figure 4. Spatial distribution pattern of PLEFs in the BGEZ. (ac) spatial distribution of production function from 2010 to 2020. (df) spatial distribution of living function from 2010 to 2020. (gi) spatial distribution of ecological function from 2010 to 2020.
Land 14 00614 g004
Figure 5. Statistical analysis of the number and spatial distribution of functionally dominant grids in the BGEZ.
Land 14 00614 g005
Figure 6. Statistical analysis of the number and spatial distribution of functional combinations in the BGEZ.
Land 14 00614 g006
Figure 7. Statistics and spatial–temporal distribution of coupled coordination types of PLEFs in the BGEZ. Note: P-L, P-E, L-E, P-L-E, respectively, represent production–living, production–ecology, living–ecology, production–living–ecology coupling coordination. (a) Proportion of coupling coordination types of PLEFs in the BGEZ from 2010 to 2020.
Land 14 00614 g007
Figure 8. Single-factor detection and two-factor interaction detection results of PLEFs coupling coordination degree in BGEZ. (a) Single-factor detection results from 2010 to 2020. (bd) Two-factor interaction detection results from 2010 to 2020.
Land 14 00614 g008
Figure 9. Spatial and temporal differentiation pattern of regression coefficients of GTWR model for the coupling coordination degree of PLEFs in the BGEZ. (o) R2 and AICc based on OSL, GWR, and GTWR models.
Land 14 00614 g009
Figure 10. Influence mechanism of coupled coordination relationship of PLEFs in BGEZ.
Land 14 00614 g010
Table 1. Data and information used in the study.
Data AttributeIndexOriginal ResolutionDateData Sources
Raster dataLand use/cover1 km2010–2020https://www.resdc.cn/
(accessed on 10 September 2024)
Population density1 km2010–2020https://www.resdc.cn/
(accessed on 10 September 2024)
GDP density1 km2010–2020https://www.resdc.cn/
(accessed on 10 September 2024)
NDVI1 km2010–2020https://www.resdc.cn/
(accessed on 10 September 2024)
DEM1 km2020https://www.resdc.cn/
(accessed on 10 September 2024)
Vector dataRoad data/2010–2020https://www.openstreetmap.org/
(accessed on 10 September 2024)
POI data/2010–2020https://lbs.amap.com/
(accessed on 10 September 2024)
Table 2. PLES classification system for land use in the BGEZ.
Primary ClassificationSecondary ClassificationLand Use Types
Production spaceAgricultural production spacePaddy fields, dry land
Industrial production spaceIndustrial, mining and other construction land
Living spaceUrban living spaceUrban land
Rural living spaceRural settlements
Ecological spaceForest and grass ecological spaceWoodland, shrubbery, sparse woodland, other woodland, high coverage grassland, medium coverage grassland, low coverage grassland
Other ecological spaceRivers, lakes, reservoirs, ponds, permanent glaciers and snow, beach, shoaly land, sand land, gobi, saline–alkali land, swamps, bare land, bare rock texture, other
Table 3. Classification system and scoring of land use PLEFs in the BGEZ.
Primary ClassificationSecondary ClassificationProduction FunctionLiving FunctionEcological Function
Cultivated landPaddy field303
Dry land303
Forest landWoodland105
shrubbery005
Sparse woodland005
Other woodlands005
Grass landHigh coverage grassland305
Medium coverage grassland103
Low coverage grassland001
WaterRiver channel101
Reservoir pond101
Beach005
Shoaly land005
Urban and rural areas, industrial and mining, residential landUrban land550
Rural settlements350
Other construction land510
Unused landSandy land001
Saline–alkali land001
Marshland005
Bare land001
Bare rock texture001
Table 4. Classification of coupling coordination degree types of PLEFs.
Coordination CategoryCharacteristic
Severe Disorder (SD)The level of each function is at a low level, and the overall coordination between functions is very poor.
Moderate Disorder (MD)The functional level and coordination have improved but are still poor.
General Coordination (GC)The gap between the functions gradually narrowed, and the mutual restriction between the functions gradually turned into mutual promotion.
Moderate Coordination (MC)There is a positive coordination and promotion effect between the functions, and it gradually presents a common coordinated development.
High Coordination (HC)Each function is at a high level of development, and the coordinated development of functional coupling is also at a high level.
Disclaimer/Publisher’s Note: The statements, opinions and data contained in all publications are solely those of the individual author(s) and contributor(s) and not of MDPI and/or the editor(s). MDPI and/or the editor(s) disclaim responsibility for any injury to people or property resulting from any ideas, methods, instructions or products referred to in the content.

