Article

Biomass Characteristics of Tropical Montane Rain Forest in National Park of Hainan Tropical Rainforest

1
Hainan Academy of Forestry/Hainan Academy of Mangrove, Haikou 571100, China
2
Hainan Key Laboratory of Monitoring and Application of Tropical Forestry Resources, Haikou 571100, China
3
Ministry of Education Key Laboratory for Ecology of Tropical Islands, College of Life Sciences, Hainan Normal University, Haikou 571158, China
*
Authors to whom correspondence should be addressed.
Land 2025, 14(3), 608; https://doi.org/10.3390/land14030608
Submission received: 1 February 2025 / Revised: 5 March 2025 / Accepted: 11 March 2025 / Published: 13 March 2025

Abstract

:
Forest biomass, as a carrier of carbon, is an important indicator for judging forest productivity, stability and sustainable development capacity. Using the survey data of sample plots in eight forest areas in central Hainan, the biomass distribution of tropical mountain rainforests in National Park of Hainan Tropical Rainforest in different community sizes, diameter classes, altitudes and spaces was measured to explore the relationship between forest biomass and environmental factors. The results show that (1) the total area of tropical montane rainforests in National Park of Hainan Tropical Rainforest was about 983.70 km2, distributed within an altitude range of 700–1300 m; the total aboveground biomass was about 25.208 million tons, which decreased first and then increased with increasing altitude, with an average aboveground biomass per unit area of 236.00 t·hm−2; (2) the primary forest accounted for 83.23% of the total aboveground biomass of the tropical mountain rainforest with only 29.84% of the total area, and the aboveground biomass per unit area was generally higher than that of the secondary forest; and (3) medium- and large-diameter trees were the main carriers of aboveground biomass in tropical mountain rain forests. More than 83.73% of the aboveground biomass was concentrated in large-diameter trees. The results of this study provide a reference for others aiming to perform measurement and evaluation of the carbon sink and the capacity for carbon neutrality in tropical rainforest ecosystems or to maintain regional biodiversity.

1. Introduction

Forest biomass is the total weight of organic matter, either fresh or dry, present in a given area of forest over a specific period. Biomass stores carbon, thus making it an important indicator for assessing the productivity, stability and sustainability of forests [1]. Tropical forests are the most diverse and productive ecosystems on earth, and they play an essential role in the carbon and water cycles as well as in sustaining global biodiversity [2]. The global forest carbon stock, which represents around 77% of vegetative carbon stock, is the largest reservoir of carbon in terrestrial ecosystems, closely linked to addressing climate change. Studying forest biomass can clarify ecological processes and carbon cycle mechanisms of forests. Tropical forests exhibit a complex community structure with diverse plant species and rapid growth rates, and the tropical trees within them are recognized as the most effective carbon sequestration method known to date [3]. Worldwide, tropical forests store about 200–300 Pg of carbon, which is equivalent to one-third of the total atmospheric carbon stock, and they perform 60% of the global photosynthesis [4,5]. Over 1 billion tons of carbon are sequestered annually by tropical forests, meaning that these forests compose half of the global terrestrial carbon sink and offset 15% of anthropogenic carbon emissions [6]. Changes in carbon stocks in tropical vegetation are responsible for 67% of the global CO2 fluctuation, thus demonstrating their high sensitivity [7]. Studying the biomass of tropical forests is vital for understanding global carbon storage, the carbon cycle, carbon balance and global change.
Forest biomass is affected by various types of biotic and abiotic factors as well as by its own biological characteristics [8]. Some studies suggest that greater biodiversity leads to higher biomass levels due to the increased availability of ecological niches and resource utilization strategies [9]. However, it has also been demonstrated that, within a certain range, an increase in biodiversity has a relatively small impact on biomass whereas alterations in species composition have a more pronounced effect on biomass [10]. In terms of their own biological characteristics, diameter at breast height (DBH), tree height, wood density and forest type are the primary factors influencing forest biomass [11]. Among types of biomass, crown biomass exceeds ground cover biomass, but trunk biomass exceeds crown biomass [2]. There are also differences in biomass distribution within a single forest type that occurs across several different geographic regions. For example, tropical forests in Asia have higher carbon stocks and sinks than tropical forests in Africa or South America [2].
In recent years, many researchers have conducted studies on tropical rainforest biomass using technical methods such as satellite remote sensing, ground measurement and ecosystem modeling to simulate the ecological processes and dynamic changes of tropical rainforests [12,13,14]. This existing literature provides a sound scientific research foundation from which to delve deeper into the ecological roles of tropical rainforests and to forecast global climate change. Nevertheless, the biomass and ecosystem functions of tropical rainforests continue to evolve due to the escalating effects of climate change and human activity. Further investigation and exploration are still required to fully grasp how biomass is currently distributed and how it will change over time in different types of forests across various regions worldwide. Home to the most densely clustered, typologically varied, optimally conserved and extensively continuous ‘continental island-type’ tropical rainforests in China, Hainan Island ranks among the world’s most ecologically significant hotspots with unparalleled potential for tropical rainforest biodiversity preservation [15,16]. Tropical rainforests on Hainan Island can be classified into two forest types, according to their elevation: tropical lowland rainforests and tropical montane rainforests [17]. Tropical montane rainforests have a wide-ranging east–west distribution, mainly on the Wuzhi, Diaoluo and Limu Mountains, and in Bawangling, Jianfengling and other regions [18]. Some studies have also indicated that montane rainforests exhibit significant heterogeneity in community composition that is primarily influenced by hydrothermal factors [13,19]. These previous studies focused on one certain region each and failed to describe the overall characteristics of Hainan’s tropical montane rainforests. Therefore, this study investigates and analyzes the biomass distribution patterns of tropical montane rainforests in the National Park of Hainan Tropical Rainforest across different community sizes, diameter classes, altitudes and spatial dimensions. The research integrates field survey data from eight spatially distributed plots (representing primary distribution areas) with remote sensing technology and niche models. The objectives are to clarify the following: (1) What are the distribution characteristics of aboveground biomass in tropical montane rainforests at a community scale? (2) What spatial distribution patterns does the aboveground biomass of tropical montane rainforests exhibit across the National Park of Hainan Tropical Rainforest? Through addressing these questions, this study aims to support the systematic assessment and monitoring of carbon dynamics in Hainan’s tropical rainforests, enhance comprehensive ecosystem protection and systematic restoration, improve climate change resilience and maintain regional biodiversity and ecological balance.

2. Study Area and Methodology

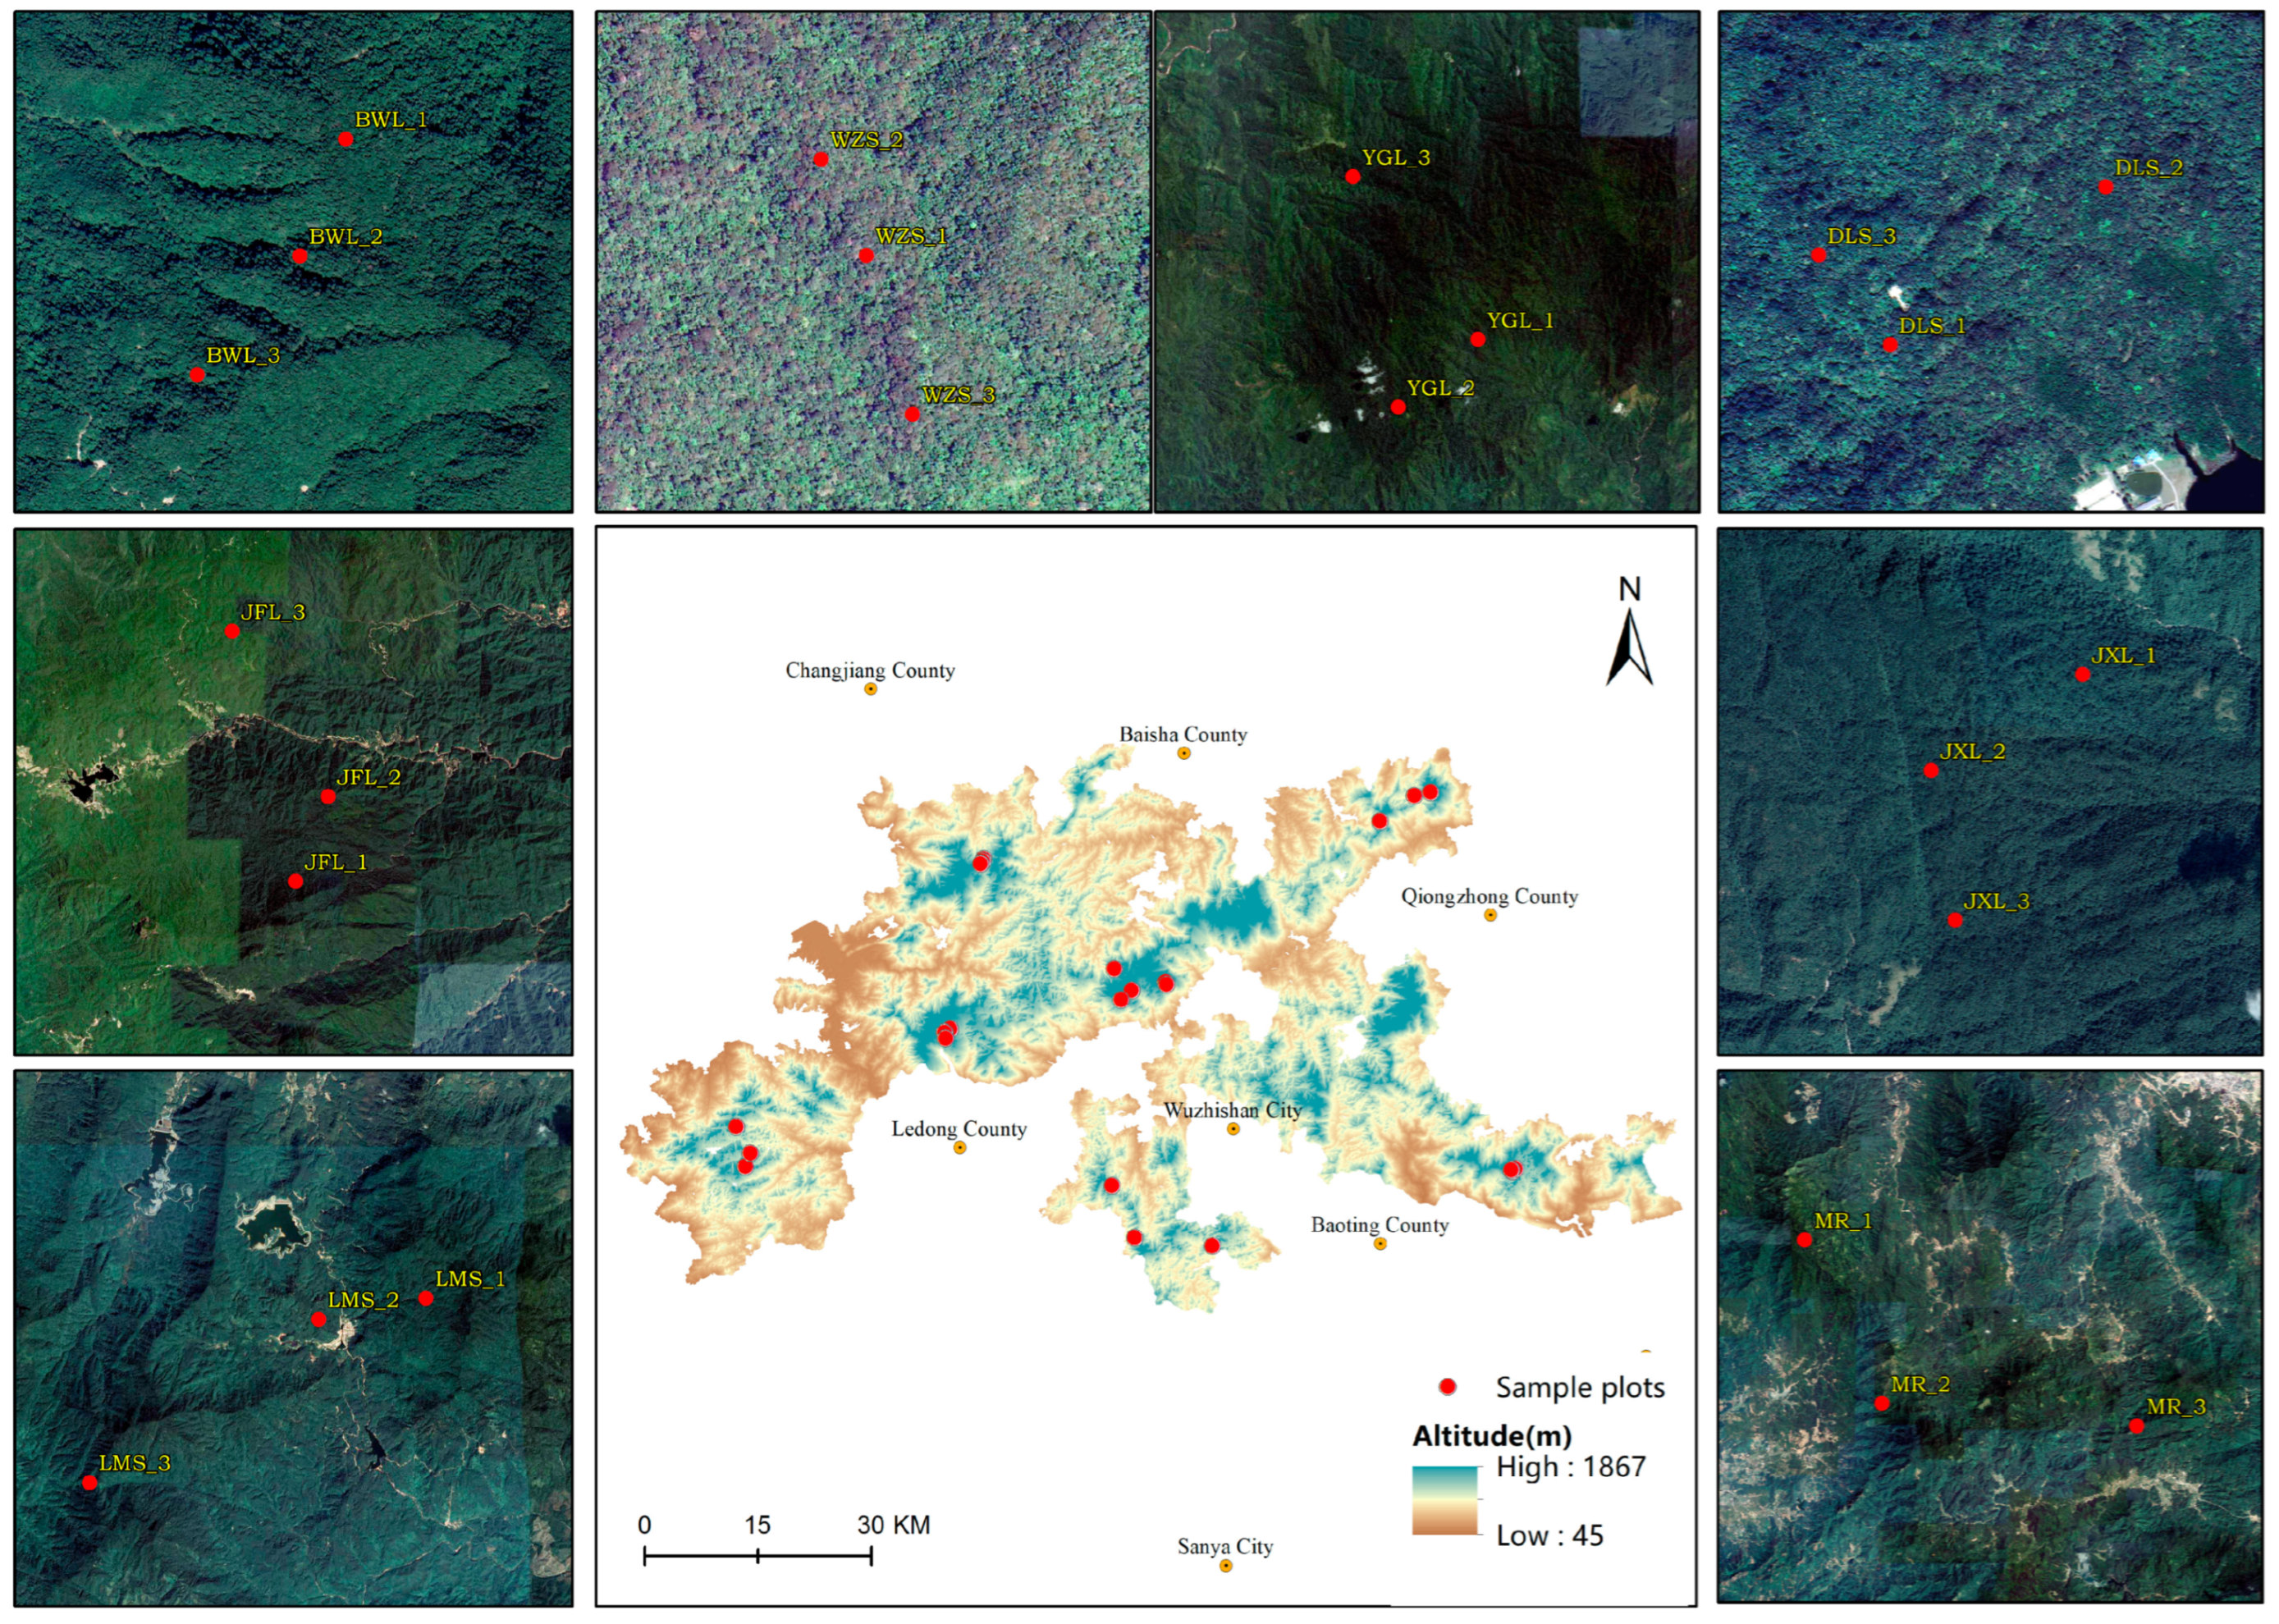
2.1. Overview of the Study Area

National Park of Hainan Tropical Rainforest is located in the south–central part of Hainan Island. With a total area of 4269 km2, the park spans nine counties (cities), including Wuzhi Mountain, Qiongzhong, Baisha, Dongfang, Lingshui, Changjiang, Ledong, Baoting and Wanning (Figure 1). It is the origin and catchment area for the major water systems of Hainan Island, including the Nandujiang River, the Changhua River and the Wanquan River. This region falls within the tropical oceanic monsoon climate zone and is characterized by a mean annual temperature of 22.5–26.0 °C and a mean annual precipitation of 1759 mm. It is situated at an altitude of 45–1867 m, with up to 95.9% forest coverage [20]. There are 9 soil types and 11 subtypes, including latosol soil, lateritic red soil, yellow soil and meadow soil, and there are 82 clusters of 9 vegetation types and 15 subtypes, including tropical coniferous forest, alpine cloud forest, tropical montane rainforest, tropical lowland rainforest, monsoon forest and plantation [21]. As one of the 34 global biodiversity hotspots, National Park of Hainan Tropical Rainforest is home to a rich array of species, including 4367 higher plant species and 651 wild vertebrate species. It serves as an essential reservoir of water, food supplies, financial resources and carbon sequestration [20].

2.2. Data Source

Studies have indicated that, when determining the biomass of tropical montane rainforests, the sample area should be at least 2500 m2 to realistically reflect the true regional stand biomass characteristics [22]. The distribution area and species structure of tropical montane rainforests were referenced in Flora of Hainan [18]. The research team established three 30 m × 30 m sample plots in each of the eight tropical montane rainforest areas, namely Wuzhi Mountain, Bawangling, Diaoluo Mountain, Jiaxiling, Yinggeling, Jianfengling, Limu Mountain and Maorui. The 24 plots had a combined area of 21,600 m2 (Figure 1). The RTK (real-time kinematic) carrier-phase difference technique and a compass were utilized to set up the sample plots during the field survey. Vascular plants with a DBH of at least 1 cm were tallied in the sample plots, and the species name, DBH, tree height, crown diameter, clear length and spatial location of each were recorded. Detailed information on the sample plots is shown in Table 1.
Climate variables were obtained from the World Climate Database (https://www.worldclim.org/ accessed on 3 March 2021); topographic variables were from the Computer Network Information Center, Chinese Academy of Sciences (CAS) (http://www.gscloud.cn accessed on 6 May 2023); NDVI data came from the inversion of landsat-8 data in the Earth Observation Data Sharing Program (http://ids.ceode.ac.cn/ accessed on 17 May 2024); NPP data came from the Data Center for Resources and Environmental Sciences, CAS (www.resdc.cn accessed on 4 December 2023); land use type data came from the SinoLC-1 dataset [23]; nighttime light remote sensing data came from the National Oceanic and Atmospheric Administration, USA (https://www.noaa.gov/ accessed on 28 April 2024); and soil variables came from the China soil dataset of the Harmonized World Soil Database version 1.1 (HWSD v1.1).

2.3. Diameter Classification

Based on the sample plot survey and in accordance with similar studies [24,25], the standing trees were divided into seven diameter classes based on their size in centimeters: I (1 ≤ DBH < 5), II (5 ≤ DBH < 10), III (10 ≤ DBH < 15), IV (15 ≤ DBH < 20), V (20 ≤ DBH < 25), VI (25 ≤ DBH < 30) and VII (DBH ≥ 30).

2.4. Biomass Calculation

Sample plots that were the same as or similar to the study site were selected for the biomass regression model, if possible. In this paper, the sample plot plants were divided into two categories (DBH ≥ 5 cm and DBH < 5 cm), and the formulas below were used to calculate their respective biomasses.
The biomass model for trees with DBH ≥ 5 cm was based on the biomass model for tropical montane rainforests on Hainan Island, which included the biomasses of over 70 tree species of tropical montane rainforests from Jianfengling and of 56 tree species of tropical montane rainforests from Limu Mountain by Li Yide et al. [22], which were measured by clear-cutting. Only plants with a 5 cm DBH at minimum were used in this model, and the proportions of trees of different diameter classes in the sample plots were closest to the values used in this paper. The formula is as follows:
W = 0.042086 ( D 2 H ) 0.970315
where W denotes aboveground biomass (kg), D denotes DBH (cm) and H denotes tree height (m).
The biomass model for trees with DBH < 5 cm was built off the model for aboveground biomass estimation in the tropics obtained by Chave et al. [11] that was based on 27 forest sample plots in tropical regions worldwide. The specific formula is as follows:
W = ρ / ρ ave exp 1.839 + 2.116 ln ( D )
where W denotes aboveground biomass (kg), ρ denotes wood density (g.cm−3), ρave denotes average wood density (g.cm−3) and D denotes DBH (cm).

2.5. Spatial Distribution Simulation

The spatial distribution of tropical montane rainforests within the scope of National Park of Hainan Tropical Rainforest was simulated by ArcGIS 10.8.1 and MaxEnt 3.4.1 software, according to the species composition characteristics of the tropical montane rainforests obtained from the sample plots of the survey. A total of 302 field-collected distribution points of five representative tropical montane rainforest plants (Dacrycarpus imbricatus, Dacrydium pectinatum, Alseodaphnopsis hainanensis, Pinus kwangtungensis and Syzygium araiocladum) were used as the basis in combination with meteorological, topographic, vegetation index, soil and human-induced ecosystem stress data (Table 2).
(1) All variable factors were spatially processed and standardized to the same range, coordinate system and resolution. (2) Distribution points were saved in csv format files, and variable spatial data were converted to asc format for subsequent use. (3) The pre-processed plant distribution points and environment variables were imported into MaxEnt software, with the random test proportion and regularization multiplier set to 25% and 1.15, respectively. The importance of variable factors was tested using jackknife, while the model’s running precision was assessed using the area under curve (AUC) value. The precision requirement was considered met if the AUC value exceeded 0.9 [26]. The model was run ten times, and the average result of the ten was taken as the final simulation result. After comparison with the actual distribution points, 0.63 was selected as the lowest distribution threshold for montane rainforests because it reflected the actual distribution of montane rainforests most accurately. (4) Regarding classification of forest naturalness, both the third forest resources class II survey in Hainan Province and historical literature [27] on the criteria for the classification of forest naturalness were referenced here. This paper categorized the naturalness of tropical montane rainforests into different levels: level I represented forest types that were either pristine or near to being pristine; level II represented natural forest types with little human interference or with communities in the middle or later stages of succession, where zonal climax species were clearly visible; level III represented secondary forest types with high anthropogenic interference; and level IV represented those in the degraded secondary forest stage. Natural forests in naturalness levels I and II were classified as primary forests, while those below level II were classified as secondary forests.

3. Results and Analysis

3.1. Characteristics of Aboveground Biomass in Different Areas

The estimated aboveground biomass per three sample plots (2700 m2) in the eight areas of tropical montane rainforest ranged from 39.61 to 107.99 t, with an average of 63.72 t. The maximum aboveground biomass per unit area was 399.97 t·hm−2 in Jiaxiling, the minimum was 124.60 t·hm−2 in Yinggeling and the overall average aboveground biomass per hectare of tropical montane rainforest was 236.00 t·hm−2 (Table 3).

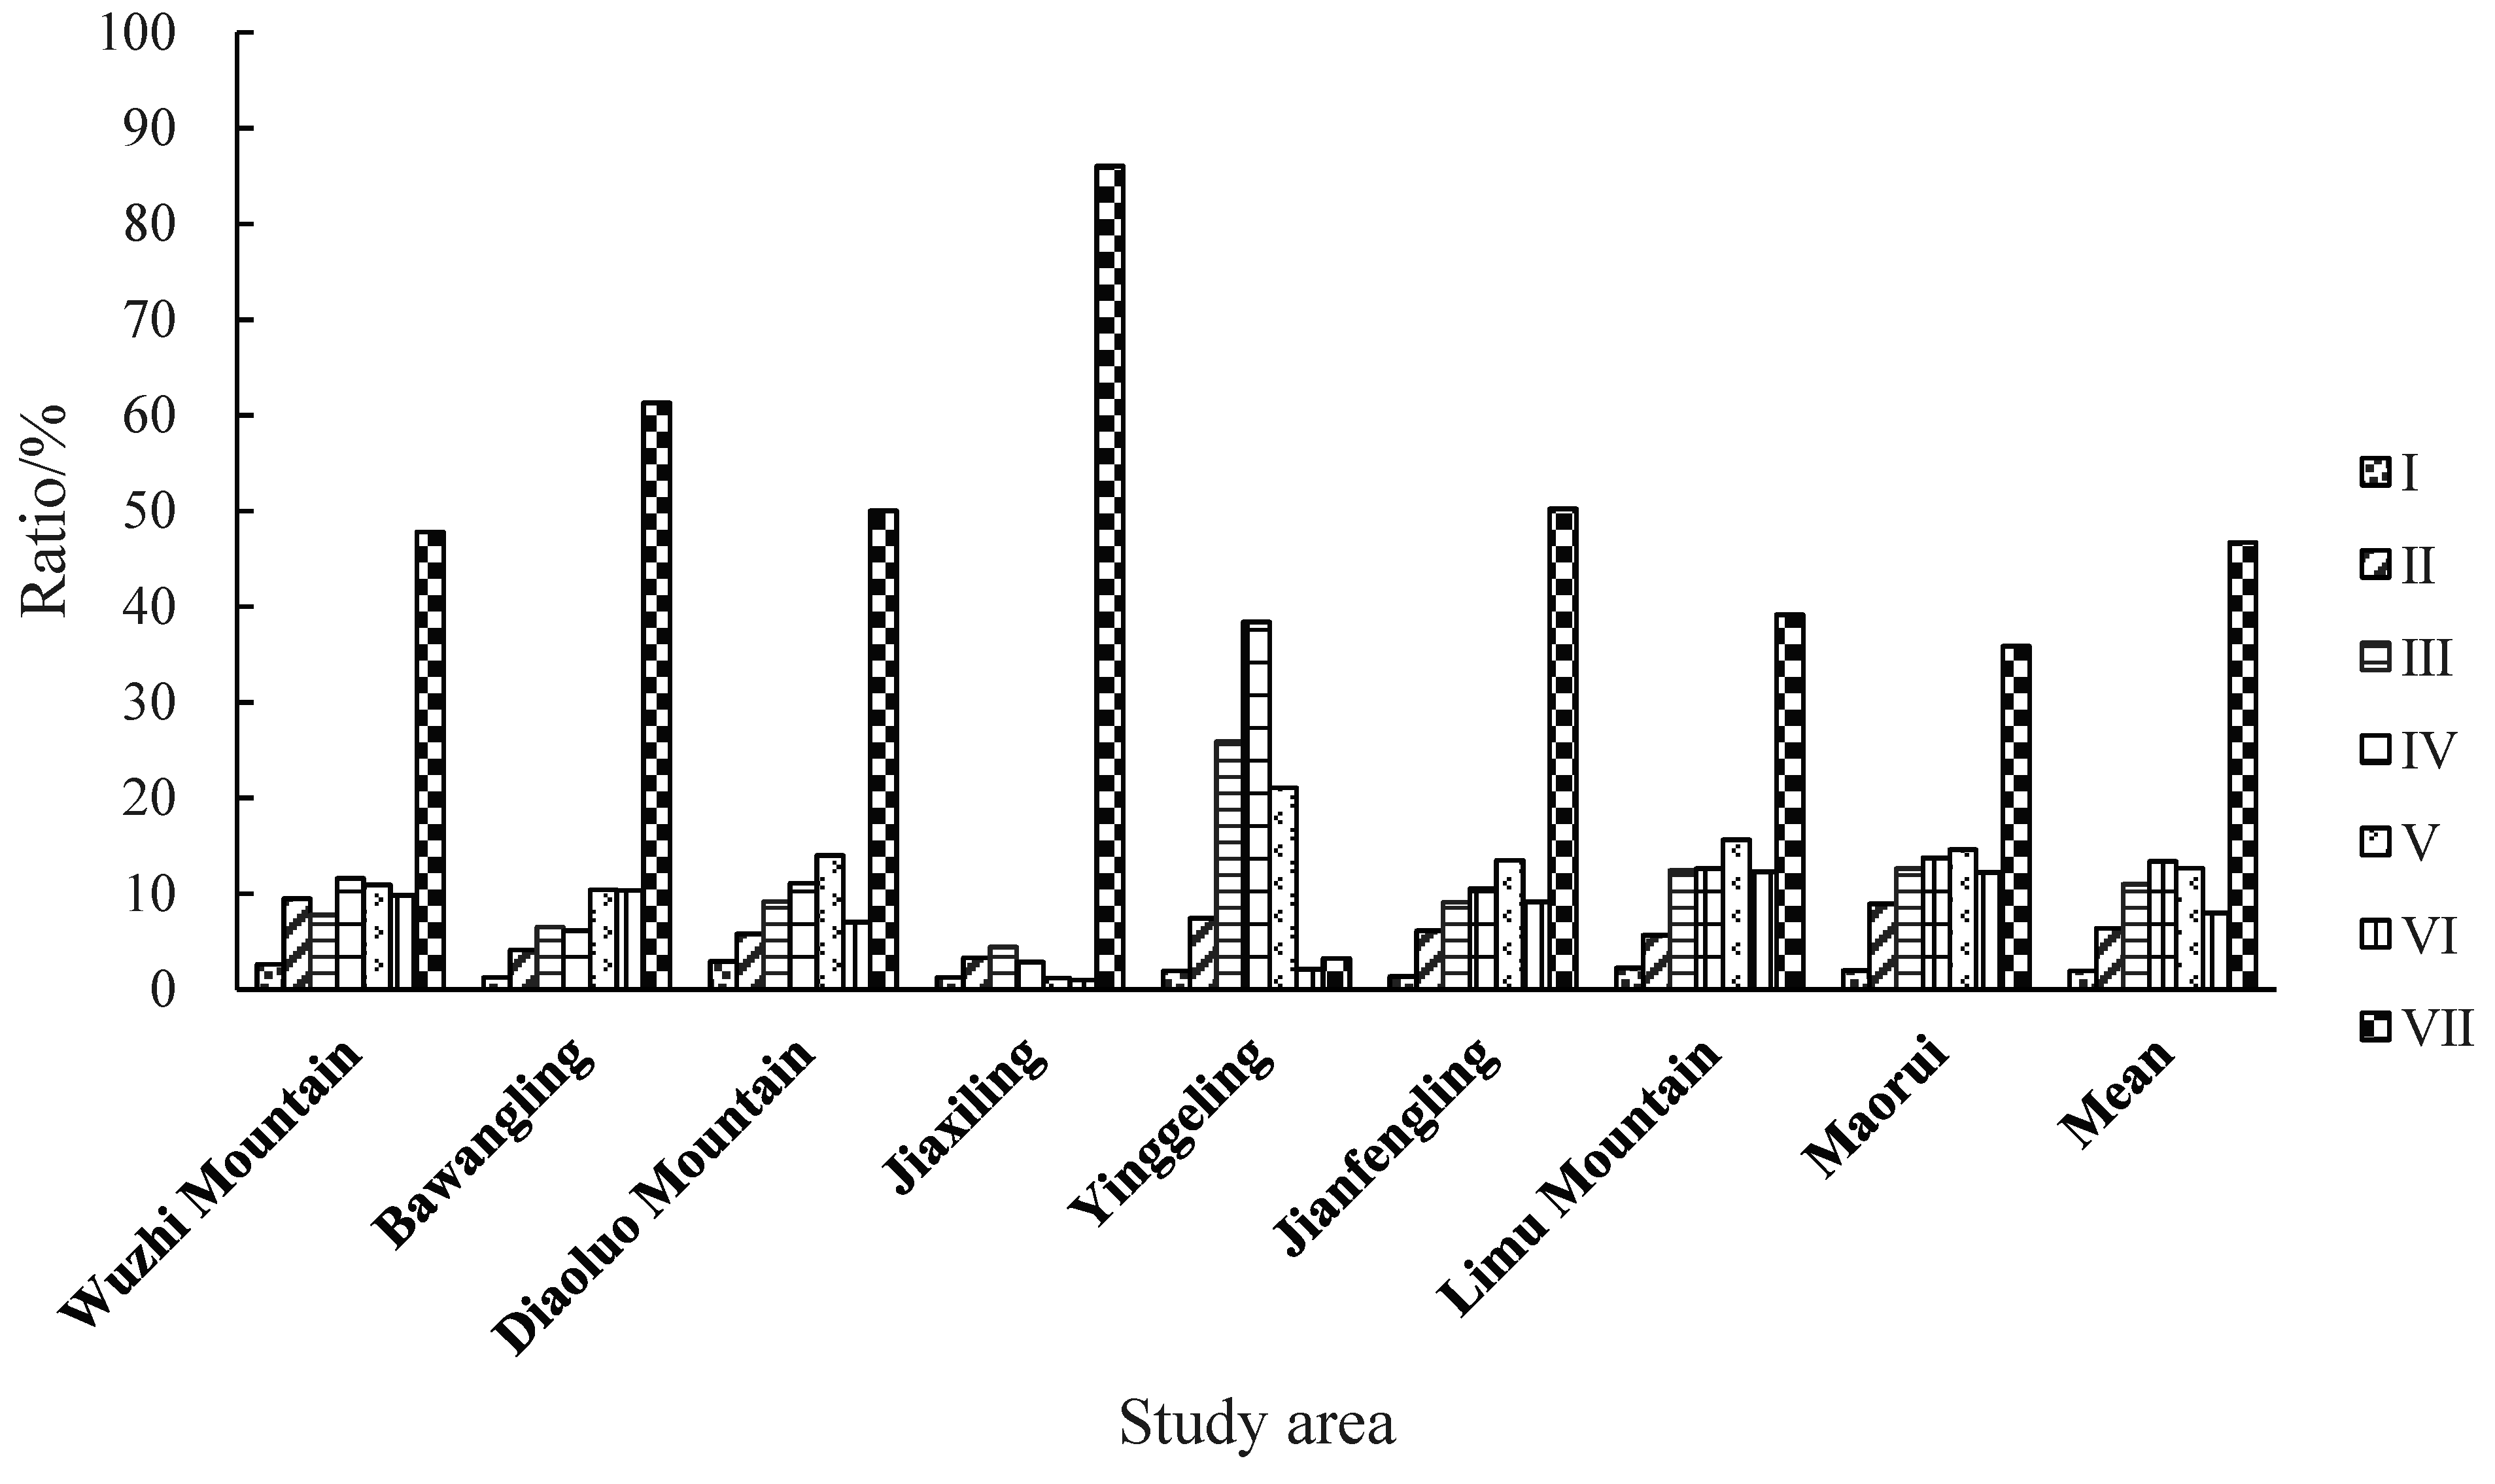
3.2. Distribution Pattern of Aboveground Biomass by Diameter Class

The statistical results (Table 4, Figure 2) indicate that the average aboveground biomass of plants across all eight areas in diameter class I was 4.16 t·hm−2, representing 1.94% of the total aboveground biomass. It was 13.45 t·hm−2 (6.36%) for diameter class II, 22.02 t·hm−2 (10.99%) for diameter class III, 25.04 t·hm−2 (13.38%) for diameter class IV, 25.94 t·hm−2 (12.66%) for class V, 17.96 t·hm−2 (7.98%) for class VI and 127.42 t·hm−2 (46.70%) for class VII. The majority of the tropical montane rainforest aboveground biomass was distributed in classes VII, V, IV and III, representing 83.73% of the total.
The analysis of the average diameter–class distribution across eight sampling regions demonstrated a pronounced dominance of juvenile cohorts (Figure 3): class I individuals composed 57.96% of the total population, with subsequent classes II–VII progressively decreasing to 21.59%, 9.34%, 4.48%, 2.78%, 1.31% and 2.54% respectively. Cumulatively, the first two diameter classes accounted for 79.54% of all recorded specimens. Furthermore, analysis of individual regions revealed essentially consistent diameter–class distribution patterns across all eight sampling areas.

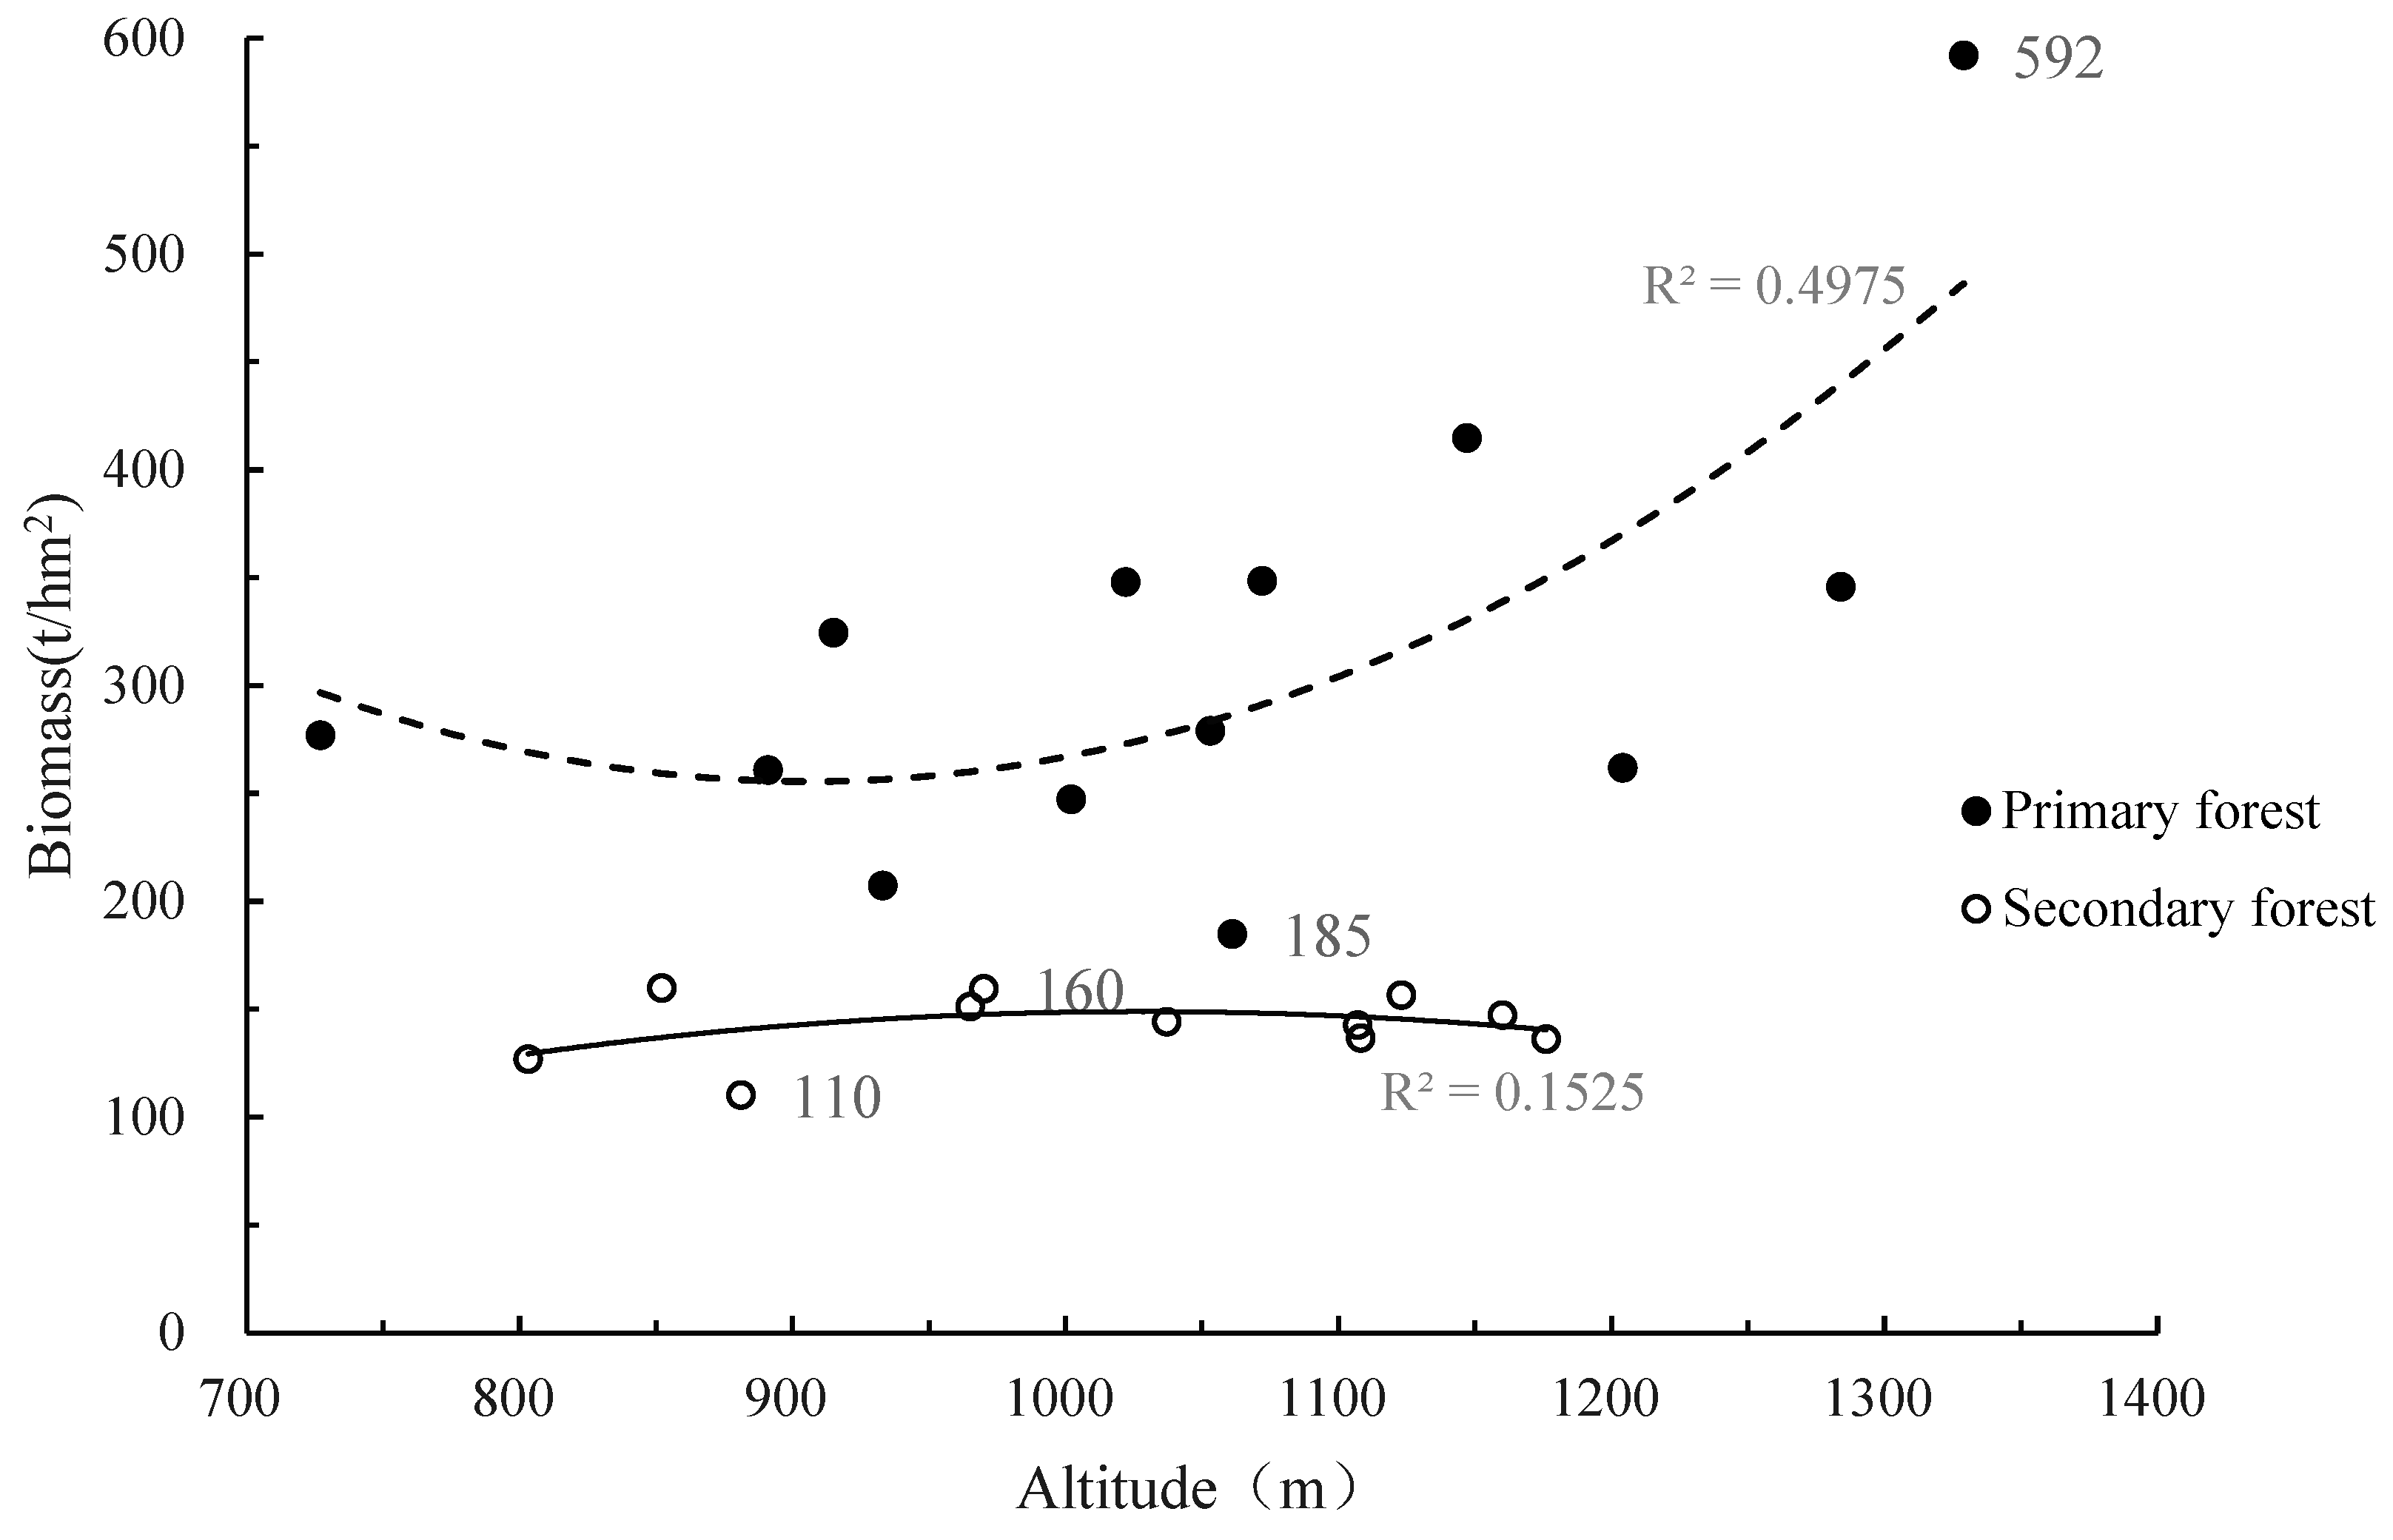
3.3. Distribution Pattern of Aboveground Biomass with Altitude

Regression analysis statistics were performed on the relationship between the aboveground biomass per unit area and the altitude of the 24 sample plots in the eight areas by using an independent 900 m2 sample plot as the unit. The results indicate that the aboveground biomass of tropical montane rainforests presented a pattern of initial decline that then rose with increasing altitude. The highest aboveground biomass per unit area was 592.0 t·hm−2 and the lowest was 110.0 t·hm−2. The average aboveground biomass per unit area was 319.0 t·hm−2 for primary forests and 143.0 t·hm−2 for secondary forests, and the aboveground biomass per unit area of primary forests was similarly generally higher than that of secondary forests. Initially, the aboveground biomass of primary forests decreased, but then it rose steadily with increasing altitude. In contrast, the aboveground biomass of secondary forests increased slightly before decreasing, and it showed relatively minor changes throughout (Figure 4).

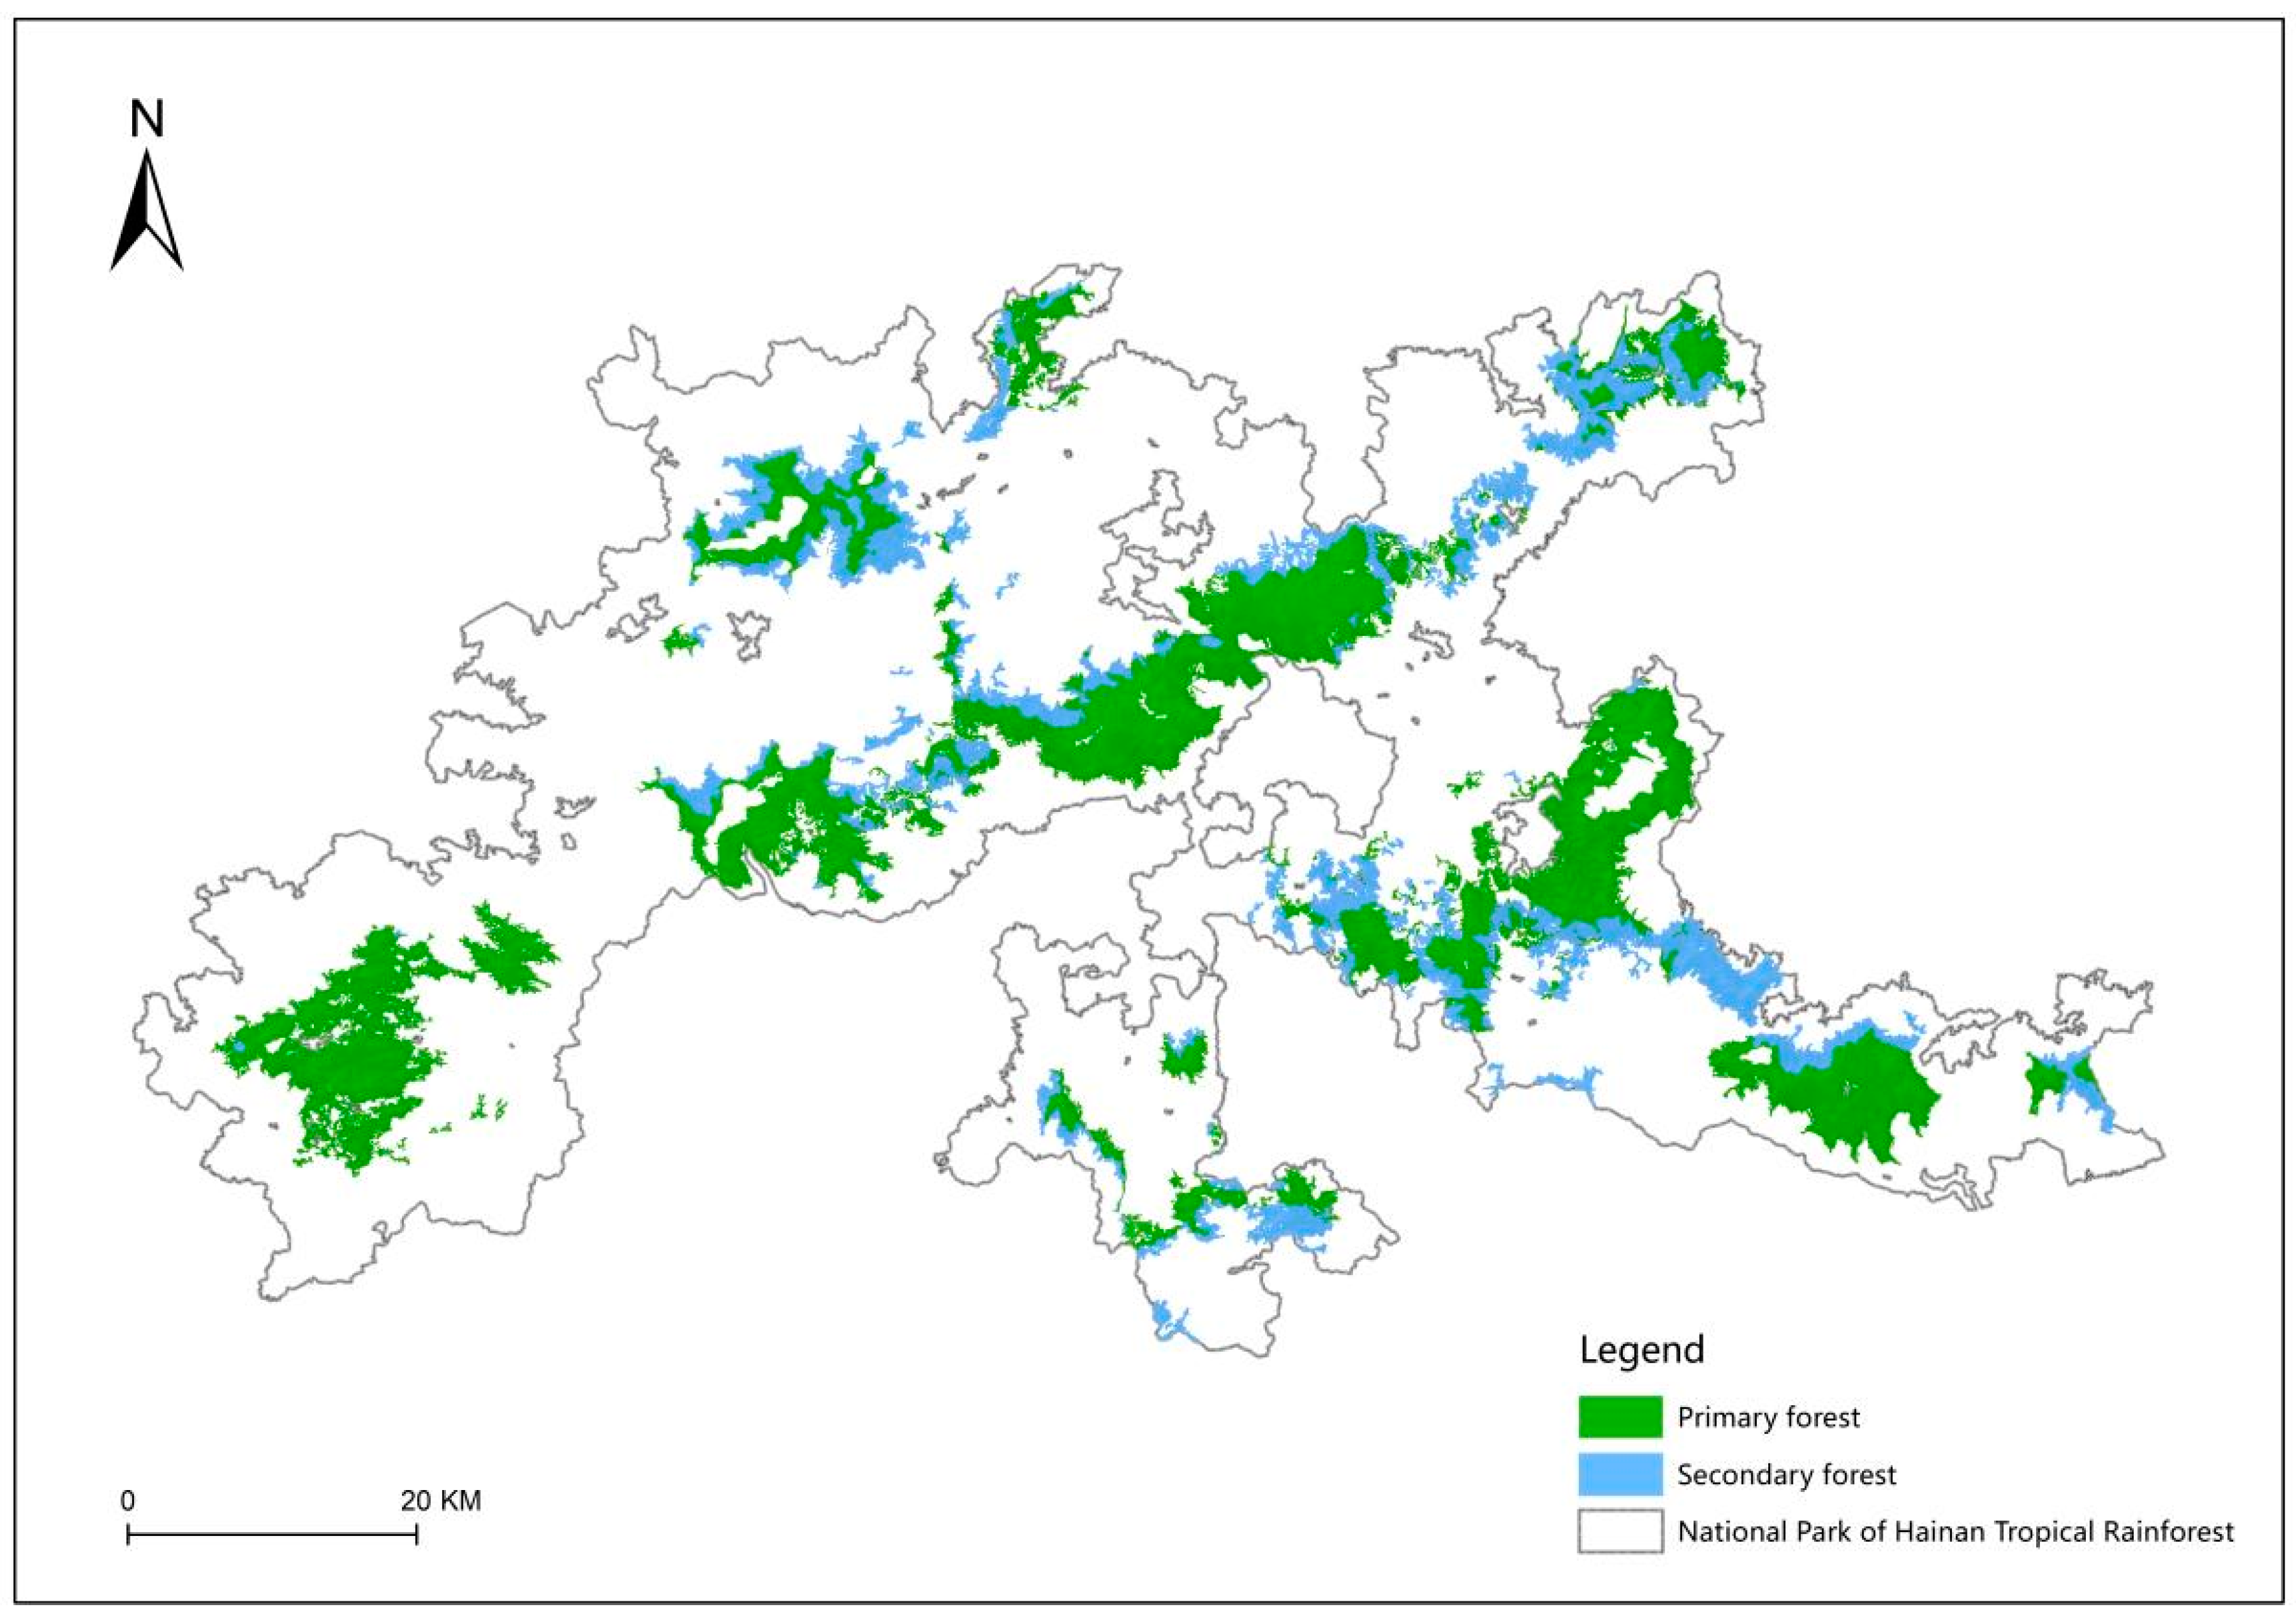
3.4. Characterization of the Spatial Distribution of Tropical Montane Rainforest

According to the model fitting results, about 983.70 km2 of tropical montane rainforests was distributed across the National Park of Hainan Tropical Rainforest, with 690.17 km2 (representing 29.84%) of primary forests and 293.53 km2 (representing 70.16%) of secondary forests. The total aboveground biomass was 25.208 million t, including 20.981 million t (83.23%) in primary forests and 4.227 million t (16.77%) in secondary forests. The tropical montane rainforests were mainly distributed between altitudes of 700 m and 1300 m, with 93.71% of the secondary forests distributed below an altitude of 1000 m, and 86.75% of the primary forests distributed above an altitude of 700 m (Table 5, Figure 5).

4. Discussion

4.1. Controlling Factors of Tropical Montane Rainforest Biomass in Hainan

The biomass of tropical forests varies greatly in different regions due to different terrain conditions and forest structures. Large-diameter trees in forests can accumulate massive biomass, significantly influencing the biomass per unit area [28,29,30]. In this study, most trees in the tropical montane rainforests fell into diameter classes I and II, representing 79.55% of the total number of plants. However, their biomass only accounted for 8.29% of the total biomass, and 83.73% of the biomass was distributed among diameter classes III, IV, V and VII. Moreover, the biomass per unit area was generally higher in primary forests (319 t·hm−2) than in secondary forests (143 t·hm−2), thus indicating that forest biomass was primarily stored in medium- and large-diameter trees.
Environmental changes due to increases in altitude can also impact forest biomass significantly [30]. Here, the biomass of tropical montane rainforests initially decreased before increasing as the altitude increased, which was consistent with the results of Hao Qingyu et al. [31], who found that the biomass of tropical montane rainforest communities differed at different altitudes in the Yinggeling area, as well as with the findings of [32], who studied the relationship between biodiversity and ecosystem function in the natural tropical forests of Hainan Island. However, the fluctuation in biomass with altitude seen in primary forests, where it initially decreased and then increased, contrasted with the pattern seen in secondary forests, where biomass rose at first and then slowly declined. This difference may be related to the lower temperature at higher altitudes, which is unfavorable to the growth of secondary succession forests [33].
Typically, forests growing in low-altitude gully areas have more favorable soil and hydrothermal conditions and have advantages in plant height, density and diameter class when compared to forests at higher altitudes. On the one hand, Hainan has ample heat and precipitation. Variation in precipitation levels across the eastern, central, western and southwestern mountainous regions of Hainan contributes to the diverse spatial distribution of montane rainforests. Various dominant communities are distributed across varying altitudes in different regions, with typical montane rainforests mostly consisting of large-diameter tree species such as Dacrydium pectinatum, Pinus kwangtungensis, Dacrycarpus imbricatus and Syzygium araiocladum. There are also many areas where montane rainforests or transition types of montane and lowland rainforests have inconspicuous dominant species [18]. Thus, the findings of this study, which differ somewhat from conventional results, reveal the diversity and heterogeneity of Hainan’s tropical montane rainforests in terms of their spatial distribution and community composition. On the other hand, the practice of commercial logging in natural forests was discontinued in 1994 in Hainan, and the National Natural Forest Resources Protection Project was initiated in 1998 [34,35]. Easily accessible regions at lower altitudes have experienced extensive logging, thereby resulting in the growth of secondary forests that are mostly of medium mature age, teeming with plants but having low biomass levels overall. In contrast, montane rainforests at higher altitudes have been subjected to less logging, thereby allowing for the conservation of primary forests containing medium- and large-diameter trees that play a key role in enhancing the biomass of the community [28]. For these two reasons, the biomass of tropical montane rainforests in the National Park of Hainan Tropical Rainforest exhibited a gradual rise as the altitude increased.

4.2. Relationship Between Biomass in Tropical Montane Rainforests and in Other Tropical Forests

Tropical montane rainforests across the varied geography of Hainan were observed to vary significantly in their biomass (Table 6). Previous studies have indicated that the average biomasses of tropical montane rainforests in the Yinggeling, Bawangling, Jianfengling, Diaoluo Mountain and Limu Mountain areas, which all have different altitudes, are about 152.6 t·hm−2 [31], 373.1 t·hm−2 [36], 272.9–453.13 t·hm−2 [37,38], 160.39 ± 42.13 t·hm−2 [39] and up to 507.24 t·hm−2 [40], respectively. In this study, the biomasses of those same areas were 124.60 t·hm−2, 347.50 t·hm−2, 293.29 t·hm−2, 190.86 t·hm−2 and 197.28 t·hm−2, respectively, with an average biomass of 236.00 t·hm−2. These values were overall consistent with the results of the previous study. In the Limu Mountain area, the varying stages of succession (early and late) led to significant differences in the number of large-diameter trees in the sample plots, which affected the results greatly. In short, the difference in altitude at the Yinggeling area sample plot was the key factor contributing to its variation in biomass.
Moving to other regions (Table 7), the average biomass of tropical montane rainforest in Xishuangbanna, Yunnan was about 249.6 t·hm−2 [30]; the biomass of tropical montane rainforest at similar altitudes in Borneo, Southeast Asia was 294 t·hm−2 [33]; and the biomass of tropical montane rainforest in Hawaii ranged from 217.5 to 250.3 t·hm−2 [41], all of which do not differ significantly from the overall aboveground biomass of tropical montane rainforests in Hainan (236.00 t·hm−2). This further demonstrates the reliability of the results of the present study as a reference for research on tropical montane rainforest biomass globally.
Hainan Island is located at the northern edge of the tropics, with a complex and heterogeneous vegetation composition [17]. On the island, the biomasses of monsoon rainforests, tropical cloud forests and lowland rainforest secondary forests are roughly 125.8 t·hm−2 [31], 164.57 t·hm−2 [42] and 137.91 ± 31.02 t·hm−2. Tropical forests in Hainan also differ significantly in their forest structure and species composition compared to typical tropical forests in other parts of the world [37]. For example, the biomasses of tropical moist rainforests in Cambodia, tropical moist rainforests in Malaysia, tropical rainforests in Brazil, tropical forests in Peru and tropical forests in Venezuela are 295.0 t·hm−2 [43], 338 t·hm−2 [44], 264.0 t·hm−2 [45], 275.32–279.64 t t·hm−2 [46] and 234 ± 22 t·hm−2 [47], respectively (Table 7). Here, the aboveground biomass was higher in Hainan’s tropical montane rainforests than in its monsoon rainforests, tropical cloud forests, lowland rainforest secondary forests and other forest types in the same region, but it was slightly lower than that of tropical moist rainforests in Southeast Asia and Brazil. Due to differences in factors such as altitude, precipitation and temperature, the biomass of tropical montane rainforests is higher than that of monsoon rainforests and cloud forests, but it is lower than that of moist rainforests. Hainan’s monsoon rainforests are mainly distributed in the southwestern region of Hainan Island, where the climate is drier than the central and eastern regions due to more pronounced seasonality that is heavily influenced by humidity factors. Monsoon rainforests are a transitional type between tropical rainforests and tropical savannas [17], where rainfall and air moisture are reduced, thus leading to slower tree growth and lower biomass [48,49]. Cloud forests in Hainan are mostly distributed on mountain tops or ridges at an altitude above 1200 m [18], where low temperatures and gusty winds are both prevalent and where dense clouds affect solar radiation year-round. As a result, plant height and diameter tend to be smaller, with lower biomasses compared to tropical forests found at lower altitudes [50]. Similarly, tropical moist rainforests mostly thrive in low-altitude gully areas, where soil, water and thermal conditions are superior to those of tropical montane rainforests. Thus, trees tend to develop an advantage in plant height, density and diameter class, which results in higher forest biomass.

4.3. Uncertainty Analysis of Biomass Estimation

While historical studies only considered one region at a time, the present study established 24 sample plots across various altitude zones and forest succession stages in eight areas within central Hainan, where tropical montane rainforests dominate. The spatial distribution of tropical montane rainforests in the National Park of Hainan Tropical Rainforest was fitted using ecological niche simulation to enhance the accuracy of estimating the overall and regional biomass characteristics of tropical montane rainforests in Hainan. However, due to limitations in topography, accessibility and habitat heterogeneity in this study, the density of forest plots needed to be increased at different altitudes and succession stages in the same area. The selection of the biomass regression model significantly impacted the results of the study. The sample plots selected in this study covered a wide spatial range. Despite attempts to select models from the same or from areas similar to the study site, there remained considerable uncertainty. Furthermore, ecological niche modeling was carried out to expand the representative population categories and to enhance the environmental background data. Additionally, the extensive distribution of tropical montane rainforests resulted in significant biomass heterogeneity between regions, which led to an uneven distribution of biomass. All of these factors can either directly or indirectly impact biomass estimation results and thus increase the uncertainty of our results.

4.4. Prospect

This study explores the impacts of climate, topography, vegetation, soil and disturbances on forest biomass. Future research could further refine the mechanisms of these factors, particularly conducting in-depth analyses of their profound influences on biomass distribution and dynamics under Hainan Island’s unique geographical and climatic conditions. The dynamic changes of these controlling factors and their effects on biomass also warrant continued attention. Although this study preliminarily compares biomass differences between Hainan tropical montane rainforests and other tropical forests, future work could expand the scope and depth of comparisons to include tropical montane rainforests in other regions, diverse tropical forest types and globally representative tropical forests. Such comparisons would deepen our understanding of the distinctiveness of Hainan’s tropical montane rainforests and their role in global forest ecosystems. Lastly, while multiple methods and technologies were employed for biomass estimation in this study, certain uncertainties remain. Future efforts could enhance measurement accuracy and reliability by increasing sampling plot density, optimizing regression model selection and enriching environmental background data. Additionally, exploring novel methodologies and technologies such as remote sensing and drone-based approaches could improve both the efficiency and precision of biomass assessments.

5. Conclusions

This paper utilized sample surveys of and model fitting techniques for the tropical montane rainforests of the National Park of Hainan Tropical Rainforest to obtain the biomass and area distribution characteristics of the park’s tropical montane rainforests across different areas, diameter classes and altitudes. The main conclusions were as follows:
(1) The average biomass per unit area of tropical montane rainforests was 236.00 t·hm−2 (319 t·hm−2 for primary forests and 143 t·hm−2 for secondary forests), with primary forests typically having a higher biomass per unit area than secondary forests.
(2) Aboveground biomass was primarily stored in medium- and large-diameter trees in tropical montane rainforests. The plants in diameter classes I and II composed 79.55% of the total plant count, but only contributed 8.29% to the overall biomass, whereas trees in diameter classes III, IV, V and VII stored 83.73% of the total biomass.
(3) The National Park of Hainan Tropical Rainforest was observed to have about 983.70 km2 of tropical montane rainforests, which were distributed at altitudes ranging from 700–1300 m. The total aboveground biomass was about 25.280 million t, which first decreased and then gradually rose as the altitude increased. In primary forests, the biomass decreased initially, then rose steadily with altitude, whereas the biomass of secondary forests increased slightly before decreasing. Primary forests composed 83.23% of the biomass in tropical montane rainforests, though they only covered 29.84% of the total area.

Author Contributions

Conceptualization, T.W.; methodology, T.W. and Z.C.; software, T.W. and Z.C.; validation, Y.C. (Yiqing Chen) and J.L.; investigation, X.C. and Y.L.; data curation, X.P.; writing—original draft preparation, T.W.; writing—review and editing, T.W. and Y.C. (Yukai Chen); funding acquisition, T.W. All authors have read and agreed to the published version of the manuscript.

Funding

This work was funded by the Hainan Provincial Technical Innovation Program for Provincial Research Institutes (No. KYYSLK2024-001); the Hainan Province Science and Technology Special Fund (ZDYF2023RDYL01); and the National Park of Hainan Tropical Rainforest Resources Comprehensive Investigation Monitoring Project.

Data Availability Statement

The original contributions presented in the study are included in the article, further inquiries can be directed to the corresponding authors.

Conflicts of Interest

The authors declare no conflicts of interest.

References

  1. Gatti, C.R.; Castaldi, S.; Lindsell, A.J.; Coomes, D.A.; Marchetti, M.; Maesano, M.; Di Paola, A.; Paparella, F.; Valentini, R. The impact of selective logging and clearcutting on forest structure, tree diversity and above-ground biomass of African tropical forests. Ecol. Res. 2015, 30, 119–132. [Google Scholar] [CrossRef]
  2. Blundo, C.; Carilla, J.; Grau, R.; Malizia, A.; Malizia, L.; Osinaga, A.O.; Bird, M.; Bradford, M.; Catchpole, D.; Ford, A.; et al. Taking the pulse of Earth’s tropical forests using networks of highly distributed plots. Biol. Conserv. 2021, 260, 108849. [Google Scholar]
  3. Schleussner, C.; Rogelj, J.; Schaeffer, M.; Lissner, T.; Licker, R.; Fischer, E.M.; Knutti, R.; Levermann, A.; Frieler, K.; Hare, W. Science and policy characteristics of the Paris Agreement temperature goal. Nat. Clim. Change 2016, 6, 827–835. [Google Scholar] [CrossRef]
  4. Pan, Y.; Birdsey, A.R.; Fang, J.; Houghton, R.; Kauppi, P.E.; Kurz, W.A.; Phillips, O.L.; Shvidenko, A.; Lewis, S.L.; Canadell, J.G.; et al. A Large and Persistent Carbon Sink in the World’s Forests. Science 2011, 333, 988–993. [Google Scholar] [CrossRef]
  5. Avitabile, V.; Herold, M.; Heuvelink, G.B.; Lewis, S.L.; Phillips, O.L.; Asner, G.P.; Armston, J.; Ashton, P.S.; Banin, L.; Bayol, N.; et al. An integrated pan-tropical biomass map using multiple reference datasets. Glob. Change Biol. 2016, 22, 1406–1420. [Google Scholar] [CrossRef]
  6. Anja, R. The declining tropical carbon sink. Nat. Clim. Change 2021, 11, 727–728. [Google Scholar]
  7. Fan, L.; Wigneron, J.P.; Ciais, P.; Chave, J.; Brandt, M.; Fensholt, R.; Saatchi, S.S.; Bastos, A.; Al-Yaari, A.; Hufkens, K.; et al. Satellite-observed pantropical carbon dynamics. Nat. Plants. 2019, 5, 944–951. [Google Scholar] [CrossRef]
  8. Labrière, N.; Locatelli, B.; Vieilledent, G.; Kharisma, S.; Basuki, I.; Gond, V.; Laumonier, Y. Spatial congruence between carbon and biodiversity across forest landscapes of northern Borneo. Glob. Ecol. Conserv. 2016, 6, 105–120. [Google Scholar] [CrossRef]
  9. Chen, C.; Xiao, W.; Chen, H.Y.H. Meta-analysis reveals global variations in plant diversity effects on productivity. Nature 2025, 638, 1–6. [Google Scholar] [CrossRef]
  10. Patrick, L.T.; Sonia, K.; Yuval, R.Z.; Dee, L.E.; Wang, S.; De Mazancourt, C.; Loreau, M.; Gonzalez, A. Scaling up biodiversity–ecosystem functioning relationships: The role of environmental heterogeneity in space and time. Proc. R. Soc. B Biol. Sci. 2021, 288, 20202779. [Google Scholar]
  11. Chave, J.; Andalo, C.; Brown, S.; Cairns, M.A.; Chambers, J.Q.; Eamus, D.; Fölster, H.; Fromard, F.; Higuchi, N.; Kira, T.; et al. Tree allometry and improved estimation of carbon stocks and balance in tropical forests. Oecologia 2005, 145, 87–99. [Google Scholar] [CrossRef] [PubMed]
  12. Fu, Y.; Li, R.; Zhu, Z.; Xue, Y.; Ding, H.; Wang, X.; Na, J.; Xia, W. SCARF: A new algorithm for continuous prediction of biomass dynamics using machine learning and Landsat time series. Remote Sens. Environ. 2024, 314, 114348. [Google Scholar] [CrossRef]
  13. Lin, M.; Ling, Q.; Pei, H.; Song, Y.; Qiu, Z.; Wang, C.; Liu, T.; Gong, W. Remote Sensing of Tropical Rainforest Biomass Changes in Hainan Island, China from 2003 to 2018. Remote Sens. 2021, 13, 1696. [Google Scholar] [CrossRef]
  14. Abbas, S.; Wong, M.S.; Wu, J.; Shahzad, N.; Muhammad Irteza, S. Approaches of Satellite Remote Sensing for the Assessment of Above-Ground Biomass across Tropical Forests: Pan-tropical to National Scales. Remote Sens. 2020, 12, 3351. [Google Scholar] [CrossRef]
  15. IUCN. The IUCN Red List of Threatened Spaecies. Version 2013.1. Available online: http://www.iucnredlist.org (accessed on 2 July 2013).
  16. Zang, R.; Ding, Y. Forest recovery on abandoned logging roads in a tropical montane rain forest of Hainan Island, China. Acta Oecol. 2009, 35, 462–470. [Google Scholar] [CrossRef]
  17. Yang, X.B.; Chen, Z.Z.; Li, D.H. Classification and distribution of vegetation in Hainan, China. Sci. Sin. 2021, 51, 321–333. [Google Scholar] [CrossRef]
  18. Yang, X.B.; Chen, Z.Z.; Li, D.H. The Colored Illustrated Flora of Hainan Province; Science Press: Beijing, China, 2019. [Google Scholar]
  19. Zhu, Q.; Guo, H.; Zhang, L.; Liang, D.; Liu, X.; Wan, X.; Liu, J. Tropical Forests Classification Based on Weighted Separation Index from Multi-Temporal Sentinel-2 Images in Hainan Island. Sustainability 2021, 13, 13348. [Google Scholar] [CrossRef]
  20. Chiaka, C.J.; Yang, Q.; Zhao, Y.; Agostinho, F.; Almeida, C.M.; Giannetti, B.F.; Li, H.; Wu, M.; Liu, G. Assessment of Water-Related Ecosystem Services and Beneficiaries in the National Park of Hainan Tropical Rainforest. Land 2024, 13, 1804. [Google Scholar] [CrossRef]
  21. Wei, L.; Li, M.; Ma, Y.; Wang, Y.; Wu, G.; Liu, T.; Gong, W.; Mao, M.; Zhao, Y.; Wei, Y.; et al. Construction of an Ecological Security Pattern for the National Park of Hainan Tropical Rainforest on the Basis of the Importance of the Function and Sensitivity of Its Ecosystem Services. Land 2024, 13, 1618. [Google Scholar] [CrossRef]
  22. Li, Y.D. Comparative analysis for biomass measuerment of tropical mountain rain forest in Hainan Island, China. Acta Ecol. Sin. 1993, 4, 313–320. [Google Scholar]
  23. Li, Z.H.; He, W.; Cheng, M.F.; Hu, J.X.; An, X.; Huang, Y.; Yang, G.Y.; Zhang, H.Y. SinoLC-1: The first 1-meter resolution national-scale land-cover map of China created with the deep learning framework and open-access data. Zenodo 2023. [Google Scholar] [CrossRef]
  24. Cotillas, M.; Espelta, M.J.; Sánchez-Costa, E.; Sabaté, S. Aboveground and belowground biomass allocation patterns in two Mediterranean oaks with contrasting leaf habit: An insight into carbon stock in young oak coppices. Eur. J. For. Res. 2016, 135, 243–252. [Google Scholar] [CrossRef]
  25. Mcgarrigle, E.; Kershaw, J.A.; Lavigne, M.B.; Weiskittel, A.R.; Ducey, M. Predicting the number of trees in small diameter classes using predictions from a two-parameter Weibull distribution. Forestry 2011, 84, 431–439. [Google Scholar] [CrossRef]
  26. Kilak, H.S.; Alavi, J.S.; Esmailzadeh, O. Spatial resolution matters: Unveiling the role of environmental predictors in English yew (Taxus bacata L.) distribution using MaxEnt modeling. Earth Sci. Inform. 2025, 18, 214. [Google Scholar] [CrossRef]
  27. Wu, Y.L.; Li, J.Z.; Yang, Y.P.; Zhou, Z.X. Research advances in assessment of forest naturalness. Chin. J. Ecol. 2010, 29, 2065–2071. [Google Scholar]
  28. Brown, I.F.; Martinelli, L.A.; Thomas, W.W.; Moreira, M.Z.; Ferreira, C.C.; Victoria, R.A. Uncertainty in the biomass of Amazonian forests: An example from Rondônia Brazil. For. Ecol. Manag. 1995, 75, 175–189. [Google Scholar] [CrossRef]
  29. Tian, H.; Melillo, M.J.; Kicklighter, W.D.; McGuire, A.D.; Helfrich Iii, J.; Moore Iii, B.; Vörösmarty, C.J. Climatic and Biotic Controls on Annual Carbon Storage in Amazonian Ecosystems. Glob. Ecol. Biogeogr. 2000, 9, 315–335. [Google Scholar] [CrossRef]
  30. Zheng, Z.; Liu, H.M.; Feng, Z.L. Biomass of tropical montane rain forest in Xishuangbanna of Southwest China. Chin. J. Ecol. 2006, 4, 347–353. [Google Scholar]
  31. Hao, Q.Y.; Liu, Q.; Wang, S.Q.; Zhong, Q.; Wang, Y.; Ruan, C.; Yan, T.; Du, S.; Huang, Y. Biomass of Forest Communities at Different Altitude Regions. J. Trop. Subtrop. Bot. 2013, 21, 529–537. [Google Scholar]
  32. Piao, S.L. The Relationships Between Biodiversity and Ecosystem Functioning in Natural Tropical Forests of Hainan Island, China; Chinese Academy of Forestry: Beijing, China, 2013. [Google Scholar]
  33. Kitayama, K.; Aiba, S. Ecosystem structure and productivity of tropical rain forests along altitudinal gradients with contrasting soil phosphorus pools on Mount Kinabalu Borneo. J. Ecol. Eng. 2002, 90, 37–51. [Google Scholar] [CrossRef]
  34. Chen, P.; Yan, G.F.; Li, X.Y. The Evaluation on Effects of Natural Forest Protective Project (NFPP) in Hainan. For. Econ. 2007, 10, 52–57. [Google Scholar]
  35. Li, X.Y.; Li, H.L.; Zhu, Y.J. Empirical Analysis on Effects of Natural Forest Protection Project in Hainan Province. J. Beijing For. Univ. (Soc. Sci.) 2008, 3, 57–61. [Google Scholar]
  36. Chen, Y.F.; Qiao, T.; Lei, Y.C.; Chen, Q.; Wang, J. Analysis on Early Stage Trees Carbon Storage Change of Tropical MontaneRain Forest in Bawangling of Hainan Island. For. Res. 2013, 26, 337–343. [Google Scholar]
  37. Chen, D.X.; Li, Y.D.; Liu, H.P.; Xu, H.; Xiao, W.; Luo, T.; Zhou, Z.; Lin, M. Biomass and carbon dynamics of a tropical mountain rain forest in China. Sci. China Life Sci. 2010, 53, 798–810. [Google Scholar] [CrossRef]
  38. Li, Y.D.; Zeng, Q.B.; Wu, Z.M.; Du, Z.; Zhou, G.; Chen, B.; Zhang, Z.; Chen, H. Study on biomass of tropical mountain rain forest in Jianfengling, Hainan province. Chin. J. Plant Ecol. 1992, 4, 293–300. [Google Scholar]
  39. Wang, L.Y.; Zhou, Z.; Zhang, T.; Lin, M.X.; Zhang, C.S.; Li, Y.D.; Chen, D.X. Effects of tree species composition and diameter class structure on biomass restoration of secondary tropical forest. Plant Sci. J. 2022, 40, 169–176. [Google Scholar]
  40. Huang, Q.; Li, Y.D.; Lai, J.Z.; Peng, G. Study on biomass of tropical mountain rain forest in Limushan, Hainan island. Chin. J. Plant Ecol. 1991, 3, 197–206. [Google Scholar]
  41. Schuur, E.A.; Matson, P.A. Net primary productivity and nutrient cycling across a mesic to wet precipitation gradient in Hawaiian montane forest. Oecologia 2001, 128, 431–442. [Google Scholar] [CrossRef]
  42. Shao, X.L.; Chen, Y.K.; Wang, X.X.; Wang, X.; Wu, Y.; Hong, X.J.; Fang, Y.S.; Lu, Y.Q.; Long, W.X. Distribution patterns of aboveground biomass of tropical cloud forests in Hainan Island. Chin. J. Ecol. 2018, 37, 2566–2572. [Google Scholar]
  43. Brown, S. Estimating Biomass and Biomass Change of Tropical Forests: A Primer; FAO Forestry Paper No. 134; Forest Resources Assessment Publication: Rome, Italy, 1997; pp. 1–31. [Google Scholar]
  44. Brown, S.; Iverson, R.L.; Prasad, A.; Liu, D. Geographical distributions of carbon in biomass and soils of tropical Asian forests. Geocarto Int. 2008, 8, 45–59. [Google Scholar] [CrossRef]
  45. Keller, M.; Palace, M.; Hurtt, G. Biomass estimation in the Tapajos National Forest, Brazil: Examination of sampling and allometric uncertainties. Ecol. Manag. 2001, 154, 371–382. [Google Scholar] [CrossRef]
  46. Nebel, G.; Kvist, P.L.; Vanclay, K.J.; Christensen, H.; Freitas, L.; Ruíz, J. Structure and floristic composition of flood plain forests in the Peruvian Amazon I. Overstorey. For. Ecol. Manag. 2001, 150, 27–57. [Google Scholar] [CrossRef]
  47. Saldarriaga, J.G.; West, D.C.; Tharp, M.L.; Uhl, C. Long-term chronosequence of forest succession in the upper Rio Negro of Colombia and Venezuela. J. Ecol. 1988, 76, 938–958. [Google Scholar] [CrossRef]
  48. Brando, P.M.; Nepstad, D.C.; Davidson, E.A.; Trumbore, S.E.; Ray, D.; Camargo, P. Drought effects on litterfall, wood production and belowground carbon cycling in an Amazon forest: Results of a throughfall reduction experiment. Philos. Trans. R. Soc. B Biol. Sci. 2008, 363, 1839–1848. [Google Scholar] [CrossRef] [PubMed]
  49. Nepstad, D.C.; Moutinho, P.; Dias-Filho, M.B.; Davidson, E.; Cardinot, G.; Markewitz, D.; Figueiredo, R.; Vianna, N.; Chambers, J.; Ray, D.; et al. The effects of partial throughfall exclusion on canopy processes, aboveground production, and biogeochemistry of an Amazon forest. J. Geophys. Res. 2002, 107, D20. [Google Scholar] [CrossRef]
  50. Long, W.X.; Zang, R.G.; Ding, Y. Community characteristics of tropical montane evergreen forest and tropical montane dwarf forest in Bawangling National Nature Reserve on Hainan Island, South China. Biodivers. Sci. 2011, 19, 558–566. [Google Scholar]
Figure 1. Location of the study area.
Land 14 00608 g001
Figure 2. Ratio of aboveground biomass in different diameter classes to area’s total aboveground biomass. (For definition of diameter classes, read Table 4).
Land 14 00608 g002
Figure 3. Number of plants per diameter class as a proportion of the area’s total. (For a definition of diameter classes, read Table 4).
Land 14 00608 g003
Figure 4. Changes in aboveground biomass per unit area with altitude in different forest types.
Land 14 00608 g004
Figure 5. Spatial distribution of tropical montane rainforests in National Park of Hainan Tropical Rainforest.
Land 14 00608 g005
Table 1. Plot attributes.
Study AreaGeographic Location
(°)
Sample Plot Area (m2)Altitude
(m)
Slope (°)Number of Plants with DBH > 1 cm (Plants)Dominant Tree SpeciesForest Type
Wuzhi Mountain109°25.5′~109°25.6′ E,
18°56.9′~18°57.1′ N
3× (30 m × 30 m)1083~11019~231152Pinus kwangtungensis, Dacrydium pectinatum, Castanopsis fissa, Syzygium araiocladum, Dendropanax hainanensisSecondary forest
Bawangling109°11.5′~109°11.7′ E,
19°5.4′~19°5.8′ N
3× (30 m × 30 m)1044~116012~211272Dacrydium pectinatum, Syzygium araiocladum, Quercus patelliformis, Dendropanax hainanensis, Lithocarpus amygdalifoliusPrimary forest
Diaoluo Mountain109°51.7′~109°52.0′ E,
18°43.7′~18°43.8′ N
3× (30 m × 30 m)961~10618~261161Semiliquidambar cathayensis, Lithocarpus amygdalifolius, Quercus championii, Daphniphyllum paxianum, Schima superbaPrimary forest
Jiaxiling109°8.9′~109°9.3′ E,
18°52.9′~18°58.6′ N
3× (30 m × 30 m)1204~12982~191246Dacrydium pectinatum Lithocarpus amygdalifolius, Syzygium araiocladum, Quercus patelliformis, Castanopsis carlesii, Castanopsis tonkinensisPrimary forest
Yinggeling109°21.42′~109°23.0′ E,
18°55.48′~18°58.0′ N
3× (30 m × 30 m)803~110823~301253Castanopsis hainanensis, Lepisanthes rubiginosa, Pterospermum lanceifolium, Diospyros strigoseSecondary forest
Jianfengling108°53.1′~108°54.2′ E,
18°43.3′~18°46.3′ N
3× (30 m × 30 m)915~102219~451314Lithocarpus fenzelianus, Quercus patelliformis, Gironniera subaequalis, Diospyros eriantha, Lithocarpus amygdalifoliusPrimary forest
Limu Mountain109°41.4′~109°45.3′ E,
19°8.5′~19°10.5′ N
3× (30 m × 30 m)727~103715~251068Dacrydium pectinatum, Dacrycarpus imbricatus, Quercus patelliformis, Maclurodendron oligophlebium, Canarium albumSecondary forest
Maorui109°21.4′~109°29.6′ E,
18°38.1′~18°42.3′ N
3× (30 m × 30 m)852~110717~311145Lithocarpus corneus, Nephelium topengii, Canarium album, Alseodaphnopsis hainanensis, Xanthophyllum hainanenseSecondary forest
Table 2. Variable factors and related information.
Variable TypeVariable Factor AbbreviationDescription
Climate variablesTemAnnual mean temperature/°C
PreAnnual mean precipitation/mm
Topographic variablesaltAltitude/m
sloSlope/°
Vegetation variablesLanduseLand use type
NDVINormalized difference vegetation index/%
NPPNet primary productivity/J/(m2·a)
Soil variablessoilSoil type
KK value of soil erodibility/%
Human-induced ecosystem stress variablespopNighttime light index/%
Table 3. Aboveground biomass distribution attributes of tropical montane rainforest sample plots in different areas.
AreaClassSample Plot Aboveground Biomass (kg) Aboveground Biomass per Hectare (t·hm−2) Total Aboveground Biomass per Hectare (t·hm−2) Forest TypeNaturalness
Wuzhi MountainDBH ≥ 5 cm38,568142.84146.69 Secondary forestLevel III
DBH < 5 cm10373.84
BawanglingDBH ≥ 5 cm92,653343.16347.50 Primary forestLevel I
DBH < 5 cm11734.34
Diaoluo MountainDBH ≥ 5 cm51,706191.50197.28 Primary forest + Secondary forestLevels II & III
DBH < 5 cm15605.78
JiaxilingDBH ≥ 5 cm106,643394.97399.97 Primary forestLevel I
DBH < 5 cm13495.00
YinggelingDBH ≥ 5 cm33,059.67122.44124.6Secondary forestLevels III & IV
DBH < 5 cm583.22.16
JianfenglingDBH ≥ 5 cm78,133289.38293.29Primary forestLevel II
DBH < 5 cm10573.91
Limu MountainDBH ≥ 5 cm50,904188.53190.86Primary forest + Secondary forestLevels I, II & III
DBH < 5 cm6292.33
MaoruiDBH ≥ 5 cm49,829184.55187.8Primary forest + Secondary forestLevels II & III
DBH < 5 cm8773.25
Table 4. Distribution of aboveground biomass by diameter class in tropical montane rainforest.
AreaWuzhi MountainBawanglingDiaoluo MountainJiaxilingYinggelingJianfenglingLimu MountainMaoruiMean
Biomass
(t·hm−2)
Diameter
1 ≤ DBH < 5 (Level I)3.844.345.78 5.00 2.38 3.99 4.28 3.66 4.16
5 ≤ DBH < 10 (Level II)13.9314.31 11.40 13.13 9.27 18.01 10.80 16.77 13.45
10 ≤ DBH < 15 (Level III)11.3922.57 18.08 17.72 32.23 26.72 23.72 23.74 22.02
15 ≤ DBH < 20 (Level IV)17.0221.28 21.89 11.43 47.86 30.94 24.07 25.84 25.04
20 ≤ DBH < 25 (Level V)16.0036.12 27.63 4.71 26.23 39.54 29.85 27.46 25.94
25 ≤ DBH < 30 (Level VI)14.4035.87 13.84 3.82 2.63 26.75 23.42 22.97 17.96
DBH ≥ 30 (Level VII)70.11213.01 98.67 344.15 4.00 147.35 74.72 67.36 127.42
Table 5. Distribution of tropical montane rainforest aboveground biomass at different altitudes.
Vegetation ClassificationElevation Zone (m)Area (km2)Aboveground Biomass (10,000 t)Proportion of Total Area (%)
Secondary forest only600–7009.0813.08 3.09
700–80084.23121.29 28.70
800–900107.06154.17 36.47
900–100083.78120.65 28.54
1000–11007.5210.82 2.56
1100–12000.290.41 0.10
1200–13001.582.27 0.54
Subtotal 293.53422.70 100.00
Primary forest only600–70044.03 133.84 6.38
700–800100.20 304.61 14.52
800–900129.77 394.50 18.80
900–1000133.17 404.84 19.30
1000–1100147.43 448.17 21.36
1100–120088.15 267.99 12.77
1200–130047.42 144.14 6.87
Subtotal 690.172098.10100.00
All tropical montane rainforest600–70053.11 146.92 5.40
700–800184.43 425.90 18.75
800–900236.83 548.67 24.08
900–1000216.95 525.49 22.05
1000–1100154.94 459.00 15.75
1100–120088.44 268.40 8.99
1200–130048.99 146.42 4.98
Total983.70 2520.80 100.00
Table 6. Comparative analysis of tropical montane rainforest aboveground biomass on Hainan Island: current investigation versus prior empirical data.
AreaThis Study (t·hm−2)Historical Research (t·hm−2)
Yinggeling124.60152.60
Bawangling347.50373.10
Jianfengling293.29272.9–453.13
Diaoluo Mountain190.86160.39 ± 42.13
Limu Mountain197.28507.24
Mean236.00311.27
Table 7. Global comparative analysis of tropical forest aboveground biomass.
AreaAboveground Biomass (t·hm−2)
Tropical montane rainforests in Xishuangbanna, Yunnan249.6
Tropical montane rainforests in Borneo, Southeast Asia294
Tropical montane rainforests in Hawaii217.5~250.3
Tropical montane rainforests in Hainan236
Monsoon rainforests in Hainan125.8
Tropical cloud forests in Hainan164.57
Lowland rainforest secondary forests in Hainan137.91 ± 31.02
Tropical moist rainforests in Cambodia295
Tropical moist rainforests in Malaysia338
Tropical rainforests in Brazil264
Tropical forests in Peru275.32~279.64
Tropical forests in Venezuela234 ± 22
Disclaimer/Publisher’s Note: The statements, opinions and data contained in all publications are solely those of the individual author(s) and contributor(s) and not of MDPI and/or the editor(s). MDPI and/or the editor(s) disclaim responsibility for any injury to people or property resulting from any ideas, methods, instructions or products referred to in the content.

