Article

Spatial Heterogeneity of the Natural, Socio-Economic Characteristics and Vitality Realization of Suburban Areas in China

1
Key Laboratory of Urban Environment and Health, Institute of Urban Environment, Chinese Academy of Sciences, Xiamen 361021, China
2
University of Chinese Academy of Sciences, Beijing 100049, China
3
Xiamen Key Laboratory of Smart Management on the Urban Environment, Xiamen 361021, China
4
Fujian Key Laboratory of Digital Technology for Territorial Space Analysis and Simulation, Fuzhou 350108, China
5
School of Geographical Sciences, Faculty of Science and Engineering, University of Nottingham, Ningbo 315100, China
6
School of Architecture and Urban-Rural Planing, Fuzhou University, Fuzhou 350108, China
*
Author to whom correspondence should be addressed.
Land 2025, 14(3), 593; https://doi.org/10.3390/land14030593
Submission received: 20 February 2025 / Revised: 7 March 2025 / Accepted: 8 March 2025 / Published: 12 March 2025
(This article belongs to the Special Issue Suburban Land Development and Rural-Urban Integration)

Abstract

:
Suburban areas are the transitional zone between urban and rural areas, serving as key areas for addressing issues related to urban and regional sustainable development. In this study, 294 prefecture-level cities in China were selected as research objects. The spatial heterogeneity of social, economic, and natural characteristics, as well as the vitality realization of suburbs in China, was quantitatively analyzed at a national scale, and the impact of socio-economic and natural factors on the realization of suburban vitality was discussed. The results show that China has large suburban areas, with 431 km2 of peri-urban, 1816 km2 of mid-suburban, and 5384 km2 of outer-suburban areas, respectively. However, the suburban areas in China exhibit significant spatial heterogeneity (p < 0.001), with larger areas mainly located in the northeast and north. The vitality of the peri-suburban, mid-suburban, and outer-suburban areas exhibits spatial clustering (p < 0.001), with corresponding global Moran’s I values of 0.292, 0.272, and 0.380, respectively. The suburban areas with high vitality are mainly clusters in the southeast coastal regions, and the farther a suburban area is from the built-up areas, the lower its vitality. Various socio-economic and natural factors have different impacts on suburban vitality. The key negative factors are the proportion of agricultural land and elevation, while the positive factors are the density of points of interest (POIs) and the proportion of built-up areas. Finally, we discuss the causes of spatial heterogeneity of suburban vitality in China and the pathways to enhance it. This study provides a scientific reference for the sustainable development of the urban–rural transition zones in other regions and countries in the world.

1. Introduction

More than half of the world’s population has lived in urban areas since the beginning of the 21st century, and humans have since entered the stage of urbanization development [1,2]. Rapid urban expansion, especially extensive urban sprawl, has caused serious damage to the ecosystem of cities and their surrounding areas, leading to various ecological and environmental problems, such as the heat island effect, environmental pollution, and biodiversity decline [3,4,5]. Urbanization impacts extend far beyond its spatial boundary, forming a teleconnection with hinterlands [6,7]. Therefore, to solve the problem of urban sustainable development, the whole region around the cities must be considered to achieve regional sustainable development [8,9]. As a transitional zone between urban and rural areas, suburban areas serve as key zones linking urban and natural functions and are significantly influenced by urban expansion [10]. Unlike urban centers, where populations and buildings are densely concentrated, suburban areas have fewer people and vast natural or semi-natural spaces, including farmland, woodland, grassland, and water bodies. As an integrated area of urban and rural regions, the suburbs have characteristics different from both urban areas and traditional villages. Although suburban areas are dominated by agriculture, they are no longer rural in the traditional sense. Due to the limited land resources, construction space in suburban areas is restricted. At the same time, large portions of farmland need to be preserved to ensure food production. Therefore, finding a way to use the suburban ecosystems to serve the sustainable development of the city and region without destroying the basic landscape pattern has become a hot topic regarding promoting the research on urban and regional sustainable development [9,11,12].
In recent years, nature-based solutions have received increasing attention and have been widely used in urban and regional sustainable development practices [13]. Green infrastructure usually refers to a multi-scale, multi-type, and multi-functional green network composed of various open spaces and natural areas, including greenways, wetlands, rain gardens, forests, native vegetation, and other elements [14,15]. As an important carrier for nature-based solutions, green infrastructure plays a key role in achieving sustainable urban development goals, which include regulating local climate [16], reducing air pollution [17], maintaining biodiversity [18], and improving population health [19]. The large farmland and ecological space in the suburbs are a direct link between the city and nature and have significant potential to function as green infrastructure. Integrating suburban farmland and ecological spaces into urban green infrastructure and encouraging people to visit for leisure, entertainment, and commercial activities can effectively alleviate the problem of insufficient urban green space.
Vitality is often used to represent the attractiveness of a particular space to people and their various activities. It is typically measured by the number of people gathering in a given space or the diversity of activities [20]. Currently, vitality studies are mostly carried out on urban architectural spaces and parks, such as the vitality of green spaces like urban parks [21,22]. Research on the vitality of suburban areas can reflect their ability to attract people, particularly those from cities, engaging in various activities. This, in turn, demonstrates the realization of the potential of green infrastructure in suburban farmland and ecological spaces. Current research on suburban vitality mainly focuses on redistributing urban functions and enhancing the intensity and attractiveness of various socio-economic activities in the suburbs through rational spatial planning and multifunctional development [23], such as developing suburban parks [24] and multifunctional development of farmland [25] and utilizing digital technology to enhance suburban vitality [26].
China is experiencing an unprecedented rapid urbanization process, with the ur-banization rate rising from 17.9% in 1978 to 56.1% in 2015 [27]. China’s sustainable urbanization faces significant challenges in the coordinated development of cities and regions, especially due to the extensive spatial sprawl of Chinese cities, which needs to be strictly controlled [28,29]. Therefore, China has proposed a new type of urbanization—the National New Type Urbanization Plan (2014–2020)—and a rural revitalization policy—the Rural Revitalization Strategic Plan (2018–2022)—both of which emphasize the coordinated development of cities and regions. The former focuses on comprehensive urban-rural planning, urban–rural integration, and ecologically livable and harmonious development. The latter delineates four types of villages and towns, including agglomeration and upgrading villages, relocation and withdrawal villages, suburban integration villages, and characteristic protection villages. Suburban integration villages are an important bridge used for coordinating the development of cities and their surrounding areas, promoting the sustainable development of cities and regions. With its expansive territory, varied topography, and diverse climate, China exhibits notable regional disparities in development. Suburban development in different regions needs to be implemented according to local conditions. However, current studies have paid little attention to the imbalance of suburban development in China, especially the research on the vitality of suburban development. The current natural, socio-economic characteristics will have a profound impact on the future development of suburban areas, and a comprehensive analysis of these characteristics is essential for the effective implementation of management strategies and policies.
In this study, we selected 294 prefecture-level cities in China as the research object. Each suburb was divided into three layers: peri-suburban, mid-suburban and outer-suburban. The natural and socio-economic characteristics of the peri-, mid- and outer-suburban areas in China were quantitatively analyzed, and a suburban vitality index was put forward to conduct research from a national scale to systematically examine the following scientific questions: 1. What is the spatial heterogeneity of social, economic, and natural characteristics, as well as the vitality realization, in Chinese suburban areas? 2. How do social, economic, and natural factors influence the vitality realization in China’s suburban areas? For the first time, this paper provides a panoramic description of the development status of urban suburbs in Chinese Mainland. The research results will provide scientific and technological support for the implementation of rural revitalization and new urbanization strategies in China’s rural–urban boundary zone and serve as a scientific reference for policymakers and researchers working on the sustainable development of similar regions worldwide.

2. Materials and Methods

2.1. Selection of Chinese Cities and the Division of Suburban

This study selected all 294 prefecture-level cities in mainland China. Expanding outward from the urban built-up area boundary, we delineated peri-, mid-, and outer-suburban areas based on travel distances: 1 km (15 minutes by walking), 5 km (by public transportation), and 15 km (by driving), respectively, following the methodology in [12] (see Figure 1). We considered the enforcement effectiveness of policymakers and retained only the portions within the administrative boundaries of each city. Furthermore, to better capture the daily travel ranges of urban residents with varying frequencies of suburban visits, user types, and travel preferences, this study adopts Euclidean distance instead of network distance. Compared to network distance, Euclidean distance offers stronger operability due to its uniform standard across different cities. Additionally, it avoids systematic errors caused by complex factors such as insufficient road network coverage in suburban areas and differences in infrastructure development between cities.

2.2. Indicators of the Natural and Socio-Economic Characteristics

The selection of indicators is based on three main considerations. First, comprehensive theoretical basis; second, data availability; third, the ability to cover cities across the country. To enhance the comprehensiveness and accuracy of our study, we adopted Ma’s socio-economic–natural complex ecosystem theory [30] as the theoretical framework for selecting key factors from the natural, social, and economic domains. Meanwhile, data availability is a key consideration in indicator selection. Given China’s vast territory and diverse regional characteristics, the selected indicators must be applicable to both coastal and remote inland cities across the country. Therefore, we used publicly available geographic information data as the driving indicators, ensuring their recognized availability and accuracy. Additionally, our selected indicators (such as cropland, greenland, and POI density) are based on the core hypotheses and objectives of our study, and their relevance has been validated in existing literature [31,32]. Hence, these indicators play a crucial role in exploring regional vitality, as supported by existing research. The natural characteristics include the distribution of cropland, green space, built-up areas, water bodies, and topography and elevation. The socio-economic characteristics include population, economic development (GDP), social activities (POIs), and road density. All indicators are shown in Table 1. Details on the data sources and quantification methods for each indicator are provided in Section 2.7. The quantification of all indicators is based on a 500 m resolution grid and was achieved using the batch processing and summary statistics functions of Python 3.12 and ArcGIS Pro 3.1.6. The visualization of quantification results was made by ArcGIS Pro.

2.3. Quantitative Assessment of Vitality of Suburban

This study utilizes Baidu heatmap data from the peri-, mid-, and outer-suburban areas of 294 prefecture-level cities in China to quantitatively assess the degree of vitality within each suburban area. The calculation formula is as follows:
V i t a l i t y = i = 1 N H i N
where Hi represents the i-th Baidu heatmap pixel value within the peri-, mid-, and outer-suburban areas; i = 1, 2, …, N. N is the total number of Baidu heatmap pixels within the corresponding suburban area. Vitality refers to the degree of vitality, representing the number of people visiting per unit area in the suburban area; the higher the value, the higher the degree of vitality in that area.

2.4. Spatial Heterogeneity Analysis

Moran’s I index could calculate spatial autocorrelation, measuring the degree of similarity and correlation in spatial distributions of various indicators, while hotspot analysis further identifies hot spots within spatial clusters. The commonly used method for hotspot analysis is the Getis-Ord Gi* statistic, which determines the spatial locations where high or low value clusters are by calculating Z-scores and p-values. While Moran’s I index focuses on the overall spatial structure and autocorrelation characteristics across the whole study area, hotspot analysis targets local spatial clustering phenomena. In this study, we utilized the spatial autocorrelation (Moran’s I) and hotspot analysis (Getis-Ord Gi*) tools of ArcGIS Pro to sequentially analyze spatial heterogeneity of natural and socio-economic characteristics and vitality realization across the suburban areas for the 294 cities. During Moran’s I analysis, the spatial weight matrix was constructed using inverse distance weighting (IDW) with Euclidean distances between population-weighted grid centroids. No row standardization was applied to preserve raw distance decay relationships (ArcGIS Pro default settings). Hotspot analysis was also performed using the ArcGIS Pro default settings.

2.5. Correlation and Regression Analysis

Pearson product–moment correlation coefficient is a common measure of the linear relationship between two variables X and Y, with values ranging from [−1, +1]. The larger the absolute value of the correlation coefficient, the stronger the correlation, while those close to 0 indicate a weak linear connection. Linear regression is a type of regression analysis that models the relationship between one or more independent variables and a dependent variable using a least squares function known as the linear regression equation. The R-squared value is commonly used to measure the goodness-of-fit of a linear regression model, with values ranging from 0 to 1. An R-squared value closer to 1 indicates a better fit of the model, meaning that a higher proportion of the variance is explained by the model, whereas a value near 0 suggests that the model poorly accounts for the variability in the data. The correlation analysis and linear regression between the various characteristics across the suburban areas was conducted with the help of R.

2.6. Normalization and Visualization

The Natural Breaks method is a statistical approach used for classification and grading based on the statistical distribution patterns of numerical data. It maximizes the differences between classes by identifying natural turning points and characteristic points within the data, thereby grouping the subjects of study into clusters with similar attributes. This method normalized the characteristic indicators and vitality index because the breakpoints themselves serve as clear boundaries for classification. ArcGIS Pro provides a data visualization method based on natural breakpoints. To compare the differences in various indicators among the peri-, mid-, and outer-suburban areas, we first classify the results into five categories according to their values: very low, low, medium, high, and very high. We then applied the breakpoint thresholds sequentially to visualize the results of each indicator and vitality. The darker the color, the higher the degree indicated.

2.7. Data Sources and Preprocessing

Through resampling and reclassification tools of ArcGIS Pro, the land use data were divided into five land use types: cropland, greenland, water bodies, built-up, and other types of land (moss, bare land, snow and ice, etc.), with a resolution of 500 m. The mobile population location data represent the number of terminals that have called the positioning SDK of Baidu every hour with an original data resolution of 200 m. The Baidu Huiyan population location data, supported by the Baidu platform, offers comprehensive coverage and fine-grained resolution. The quality of this dataset has been validated in urban studies [33,34]. During data selection, we sampled natural weeks across four seasons while excluding holiday periods to minimize potential anomalies caused by irregular population movements (Table 2). For data analysis using the ArcGIS platform, we aggregated the raw 200 m resolution population location data into a unified 500 m resolution population heatmap by applying a standardized fishnet grid. In subsequent analyses across different spatial buffers (e.g., urban–suburban zones), we addressed partial grid coverage by assigning weights proportional to the overlapping area. This approach reduced analytical bias and improved data accuracy. The formula for calculating adjusted population heat values in partially covered grids is
N 1 = A 1 25 N 0
where N1 represents adjusted population value incorporated into the suburban buffer zone; A1 represents the area of the population grid covered by the suburban buffer (unit: ha); N0 represents the original population value of the grid. In addition, we resampled population, elevation, and other raster data at a 500 m resolution during data preprocessing, and summarized statistics for POIs and other vector point data. The attributes and sources of all data in the study are listed in Table 3.

3. Results

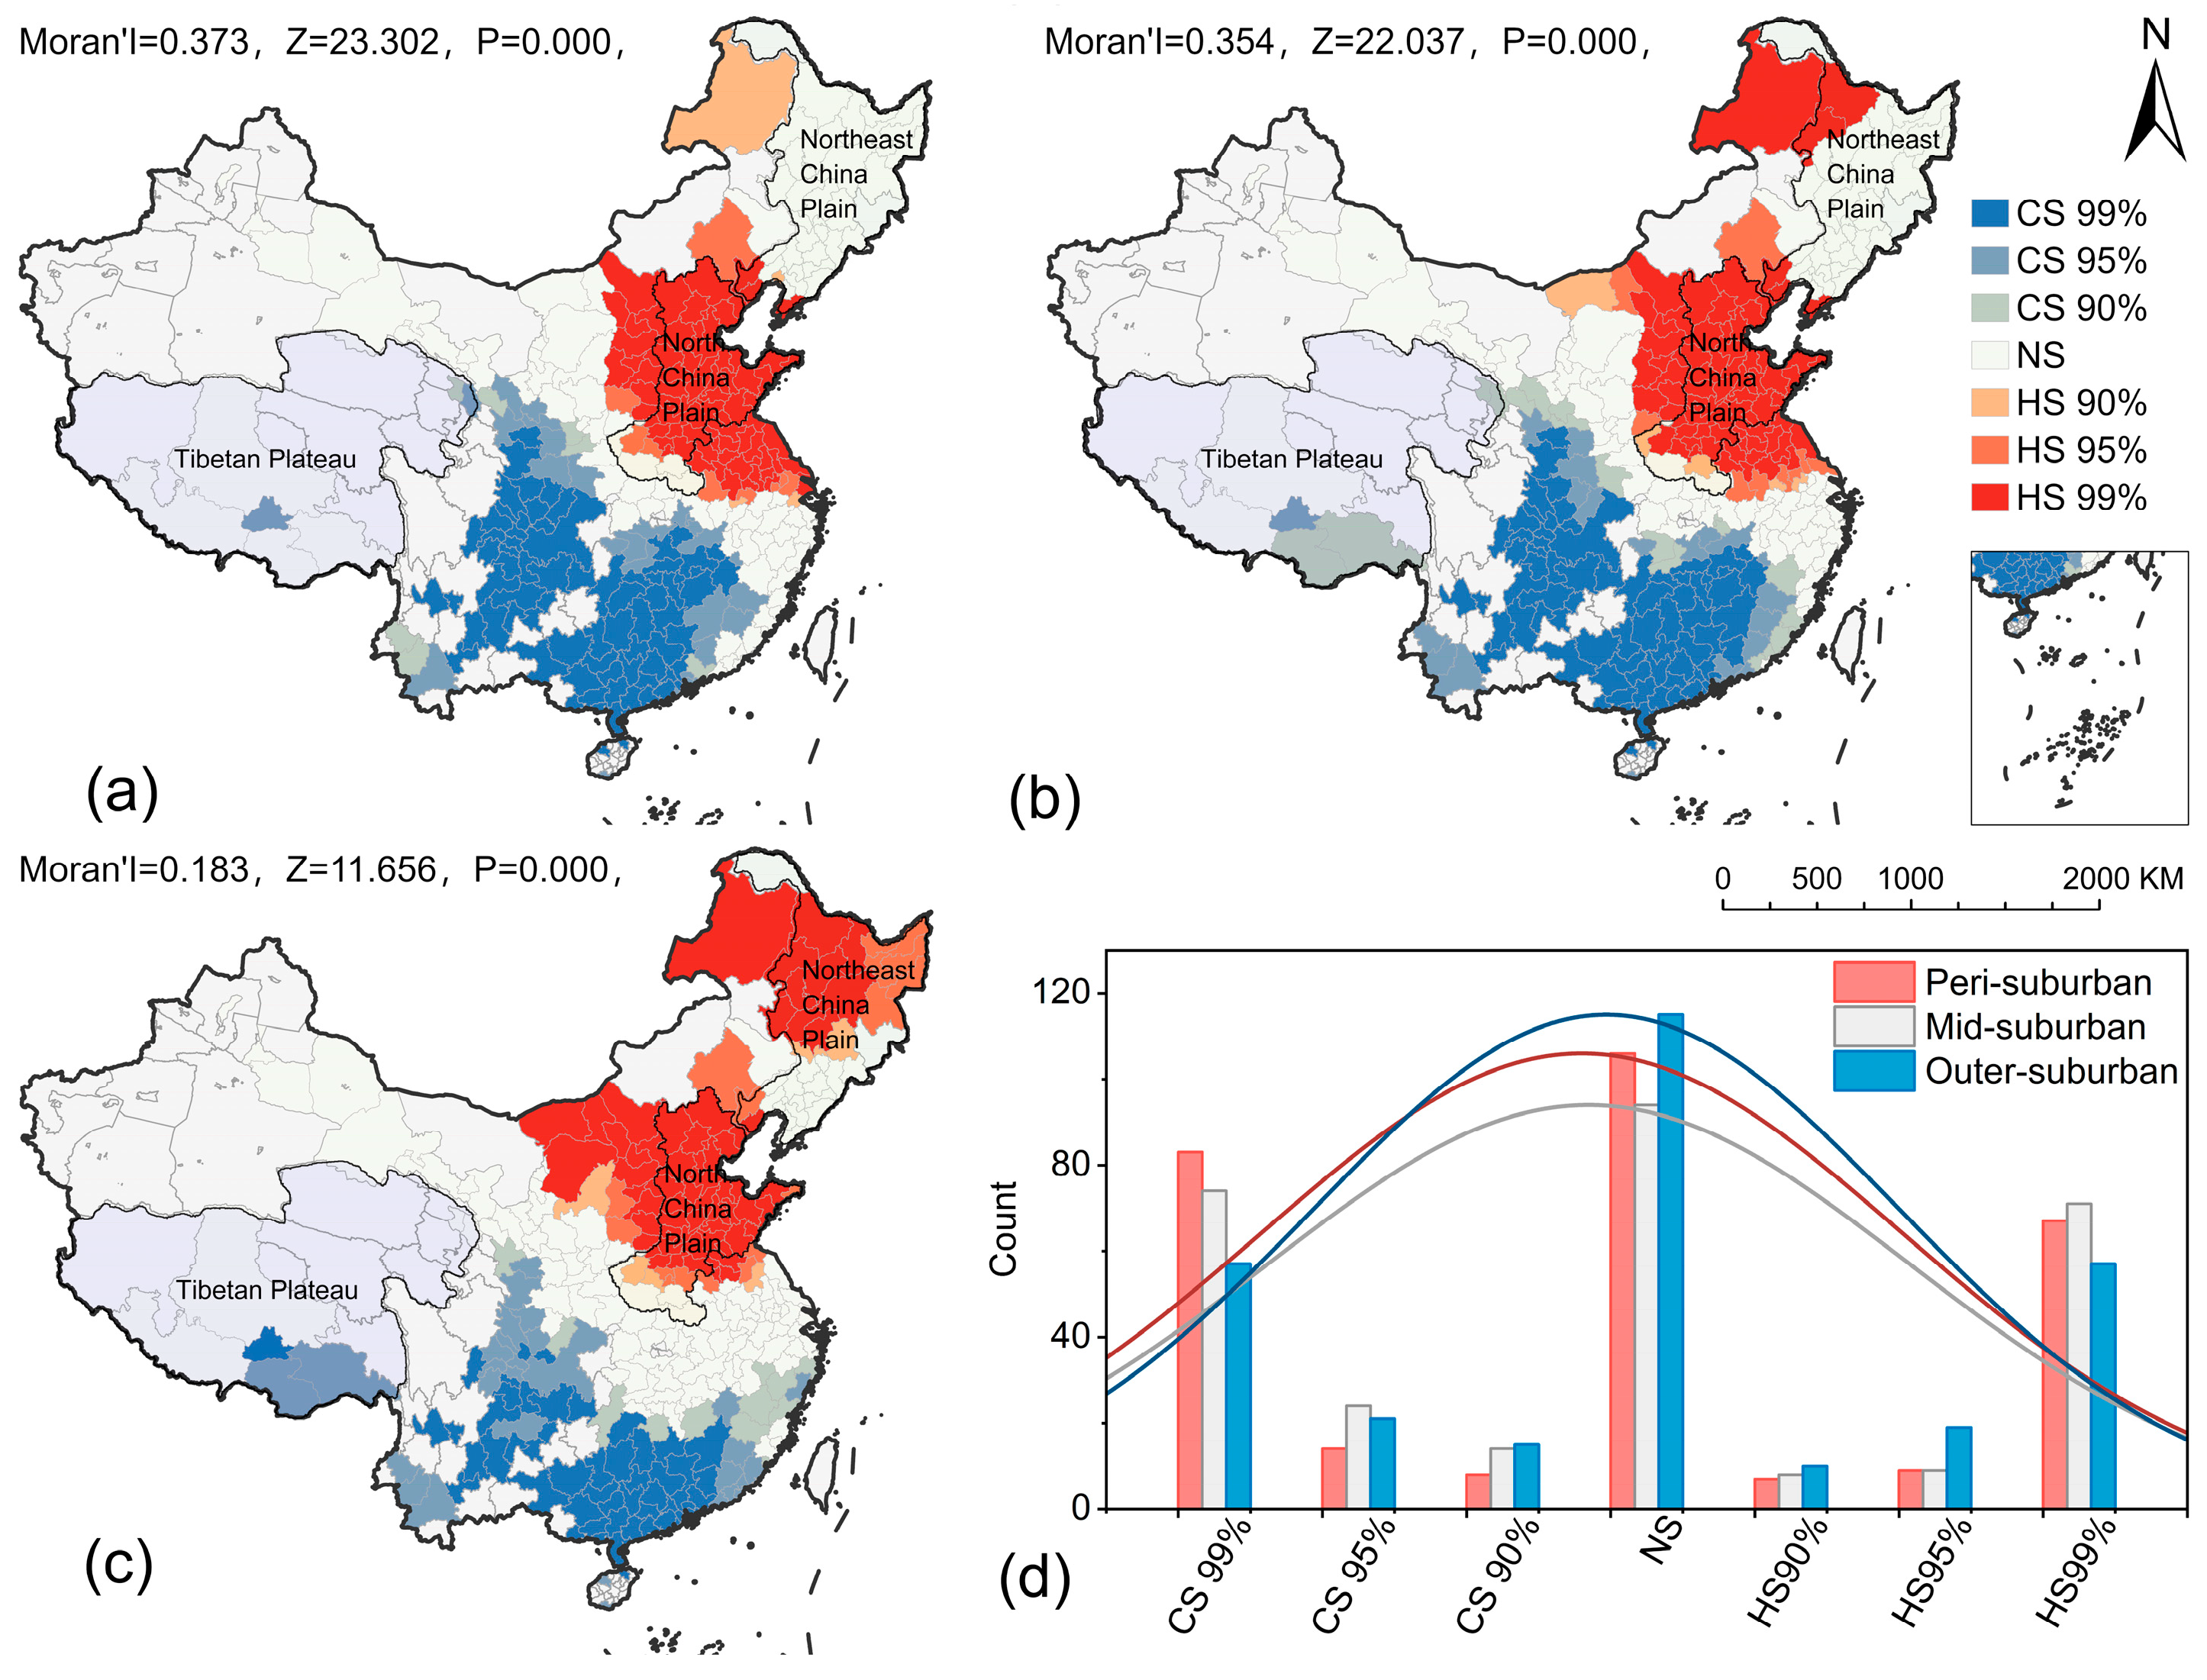
3.1. Spatial Heterogeneity of Natural, Socio-Economic Characteristics of Suburban Areas

The average areas of peri-, mid-, and outer-suburban areas in the 294 cities are 431 km2, 1816 km2, and 5384 km2, respectively. The spatial distribution of suburban shows highly significant clustering patterns (p < 0.001). Hot spot cities with larger suburban areas are mainly located in the North China Plain and Northeast China Plain, while cold spot cities with smaller suburban areas are mainly located in the mountainous areas of southwest China. As the gradient transitions from peri-suburban to outer-suburban, the number of hot spot cities increases and moves to Northern China, while the number of cold spot cities increases first and then decreases, clustering to Southwestern China (Figure 2).
The natural and socio-economic characteristics of peri-, mid-, and outer-suburban areas in the 294 cities in China also show a significant spatial clustering pattern (p < 0.001). The degree of clustering varies among different natural and socio-economic indicators, as well as across different suburban areas for the same feature. Among the 20 natural and socio-economic indicators, cropland shows the most pronounced clustering distribution. The Moran’s I values for cropland area are 0.550, 0.588, and 0.495, respectively (Figure 3). In contrast, green space area consistently has the lowest Moran’s I values, at 0.068, 0.088, and 0.114 (Table 4). As the gradient transitions from peri-urban to outer-suburban, the clustering intensity (Moran’s I) of cropland area and number of POI increases and then decreases. In contrast, the cropland rate initially decreases and then increases. Meanwhile, the clustering intensity of green space area, greenland rate, and POI density consistently increases throughout the gradient. Detailed spatial heterogeneity maps of each natural and socio-economic characteristics are shown in Supplementary Materials.

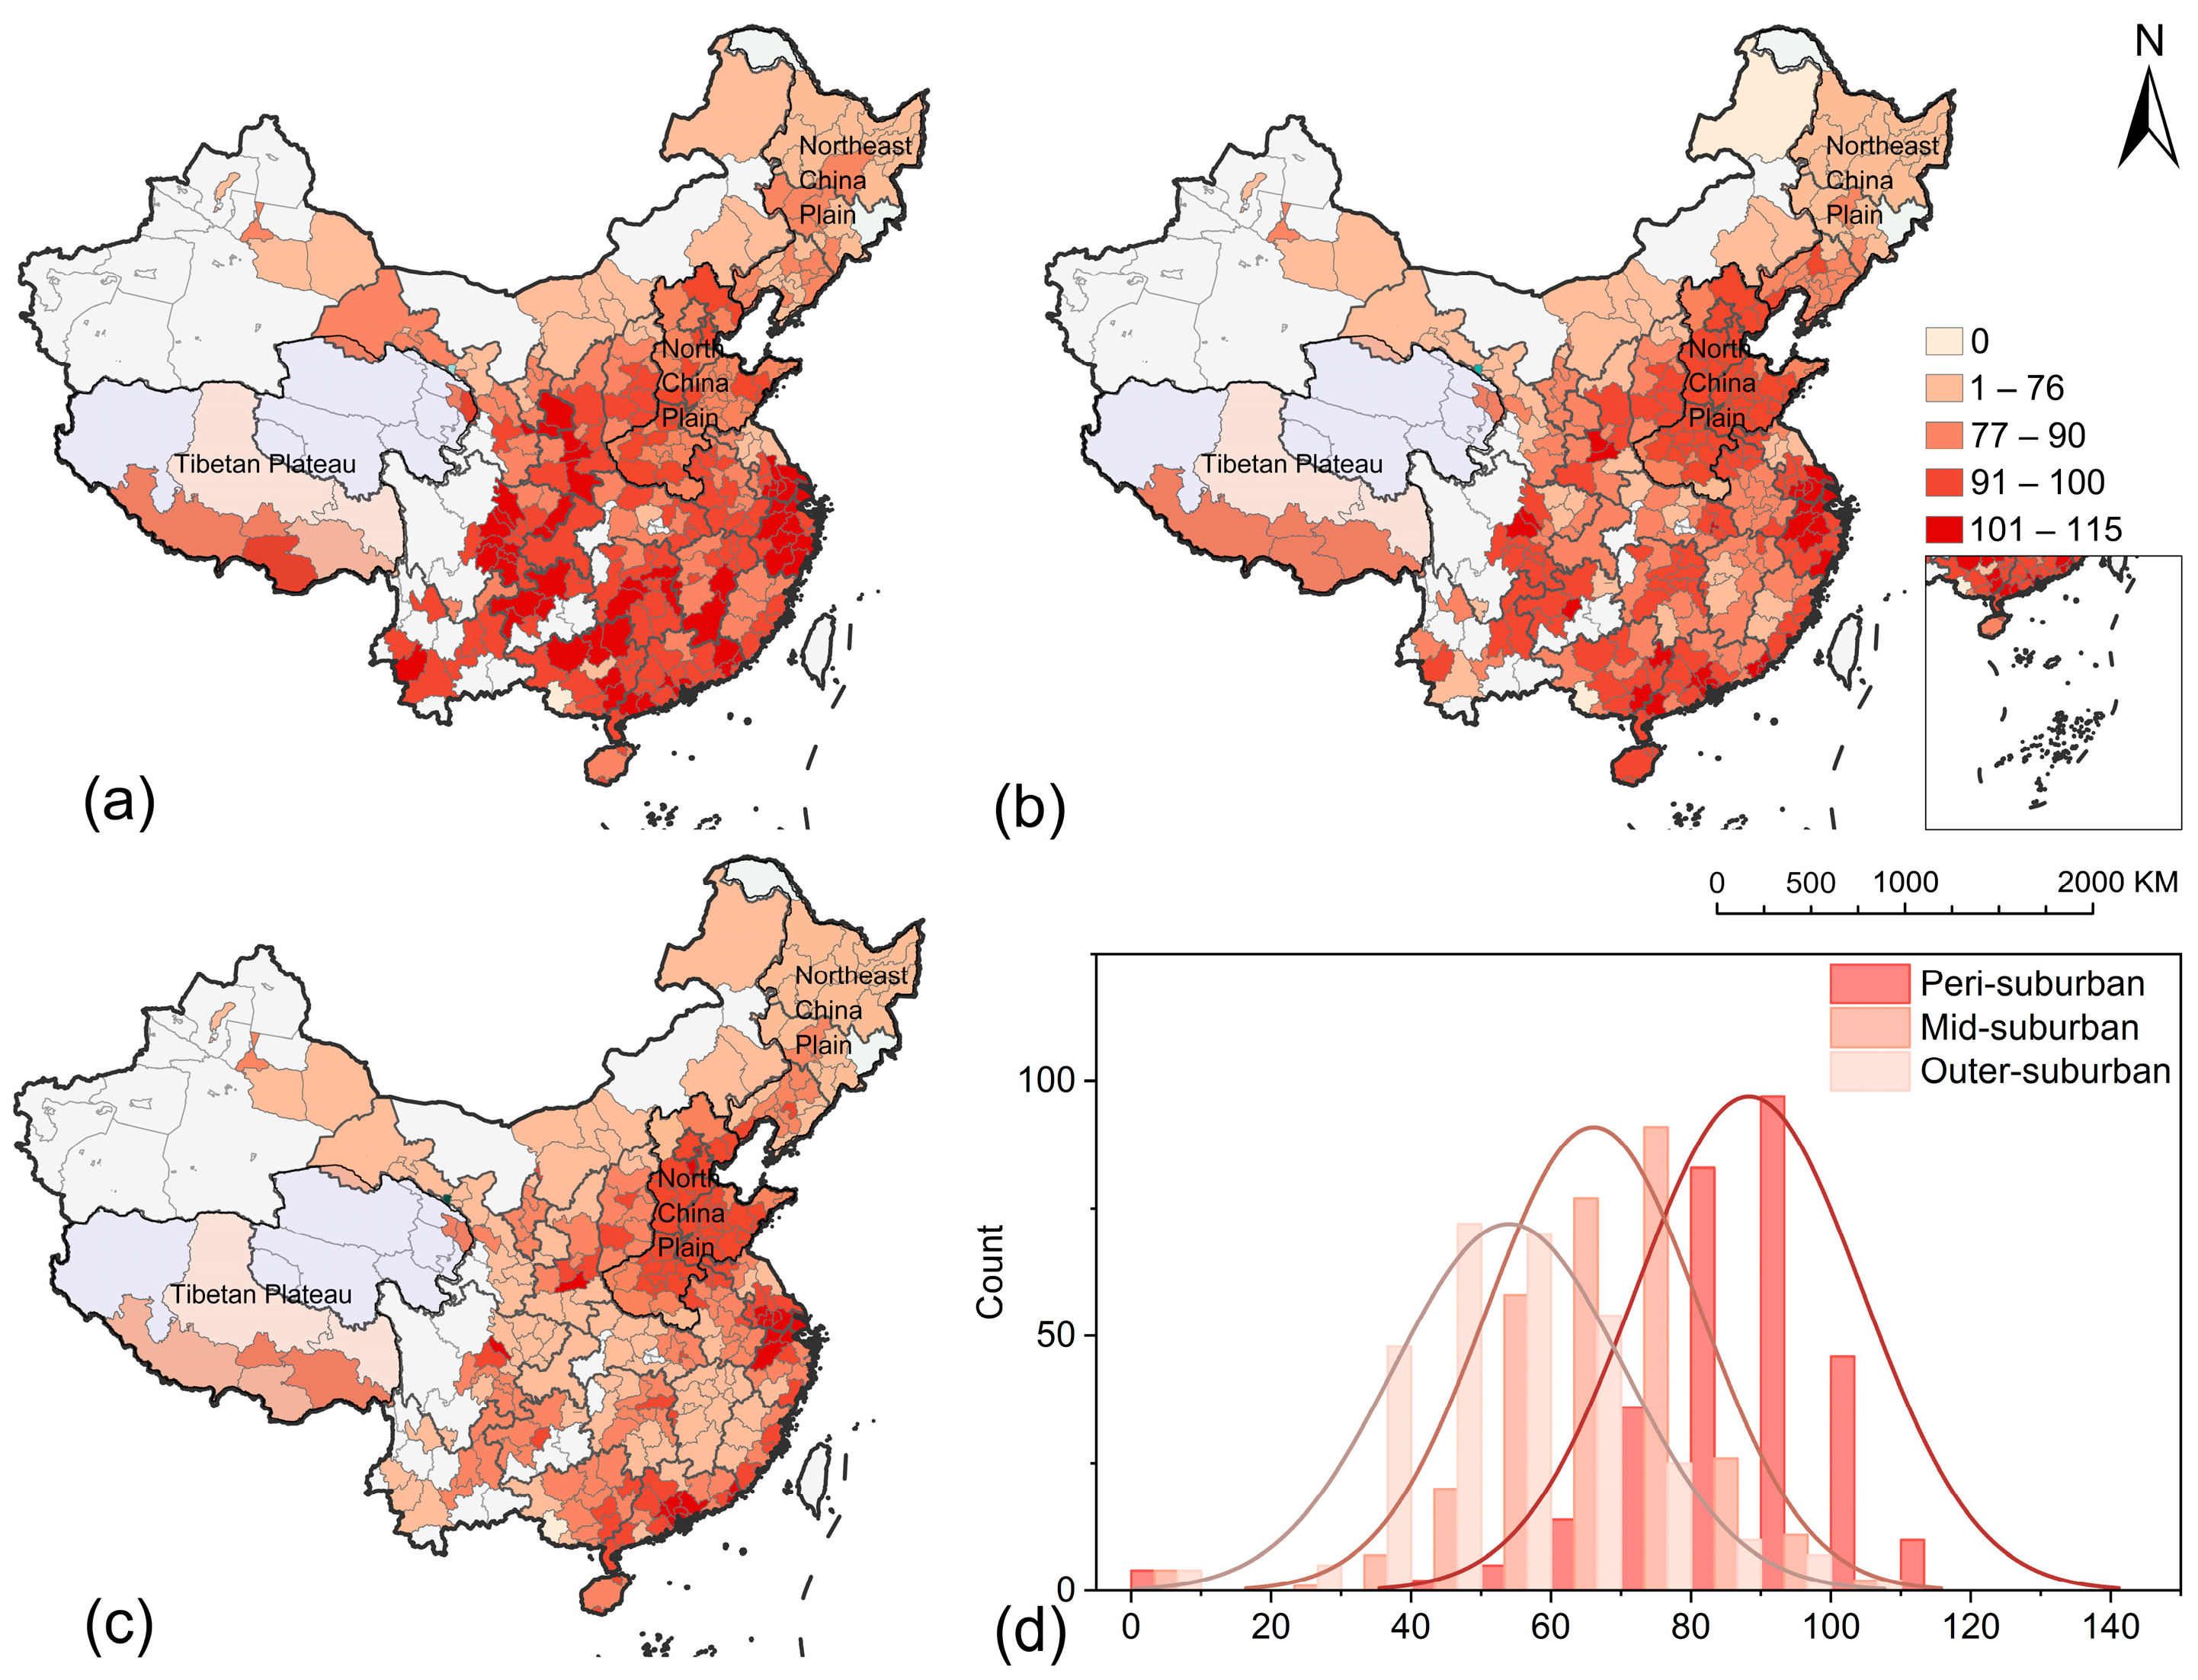
3.2. Spatial Heterogeneity of Vitality in Suburban

The vitality of the peri-, mid-, and outer-suburban of the 294 cities in China also shows significant spatial heterogeneity (p < 0.001). The suburban areas in the eastern coastal and south China regions have higher vitality (Figure 4). The further the suburban areas are from the urban areas, the lower the vitality. The vitality of the peri-suburban area is mostly concentrated at a higher level, and its distribution curve is the most right-skewed among the three types of suburban areas, indicating that there are relatively more cities with high peri-suburban vitality. The vitality of the mid-suburban area is mostly concentrated at medium level, with a left-skewed distribution curve. The vitality of the outer-suburban area is mainly concentrated at a low level, and its distribution curve is further left-shifted compared to the mid-suburban area vitality.
The vitality of the peri-suburban, mid-suburban, and outer-suburban areas exhibits spatial clustering (p < 0.001), with corresponding global Moran’s I values of 0.292, 0.272, and 0.380, respectively (Figure 5). Hot spots of peri-suburban vitality are mainly distributed in Southern China, with cold spots appearing in the northern regions and the Tibetan Plateau. Hot spots of mid-suburban vitality are found in the southeast coastal areas, with cold spots in the Tibetan Plateau, northeast and northwest regions of China. Hot spots of outer-suburban vitality are contracted toward the coast in the southeast coastal region, with some expansion toward the north China region, while cold spots are primarily distributed in some parts of Central China, and the northeast and northwest regions of China.

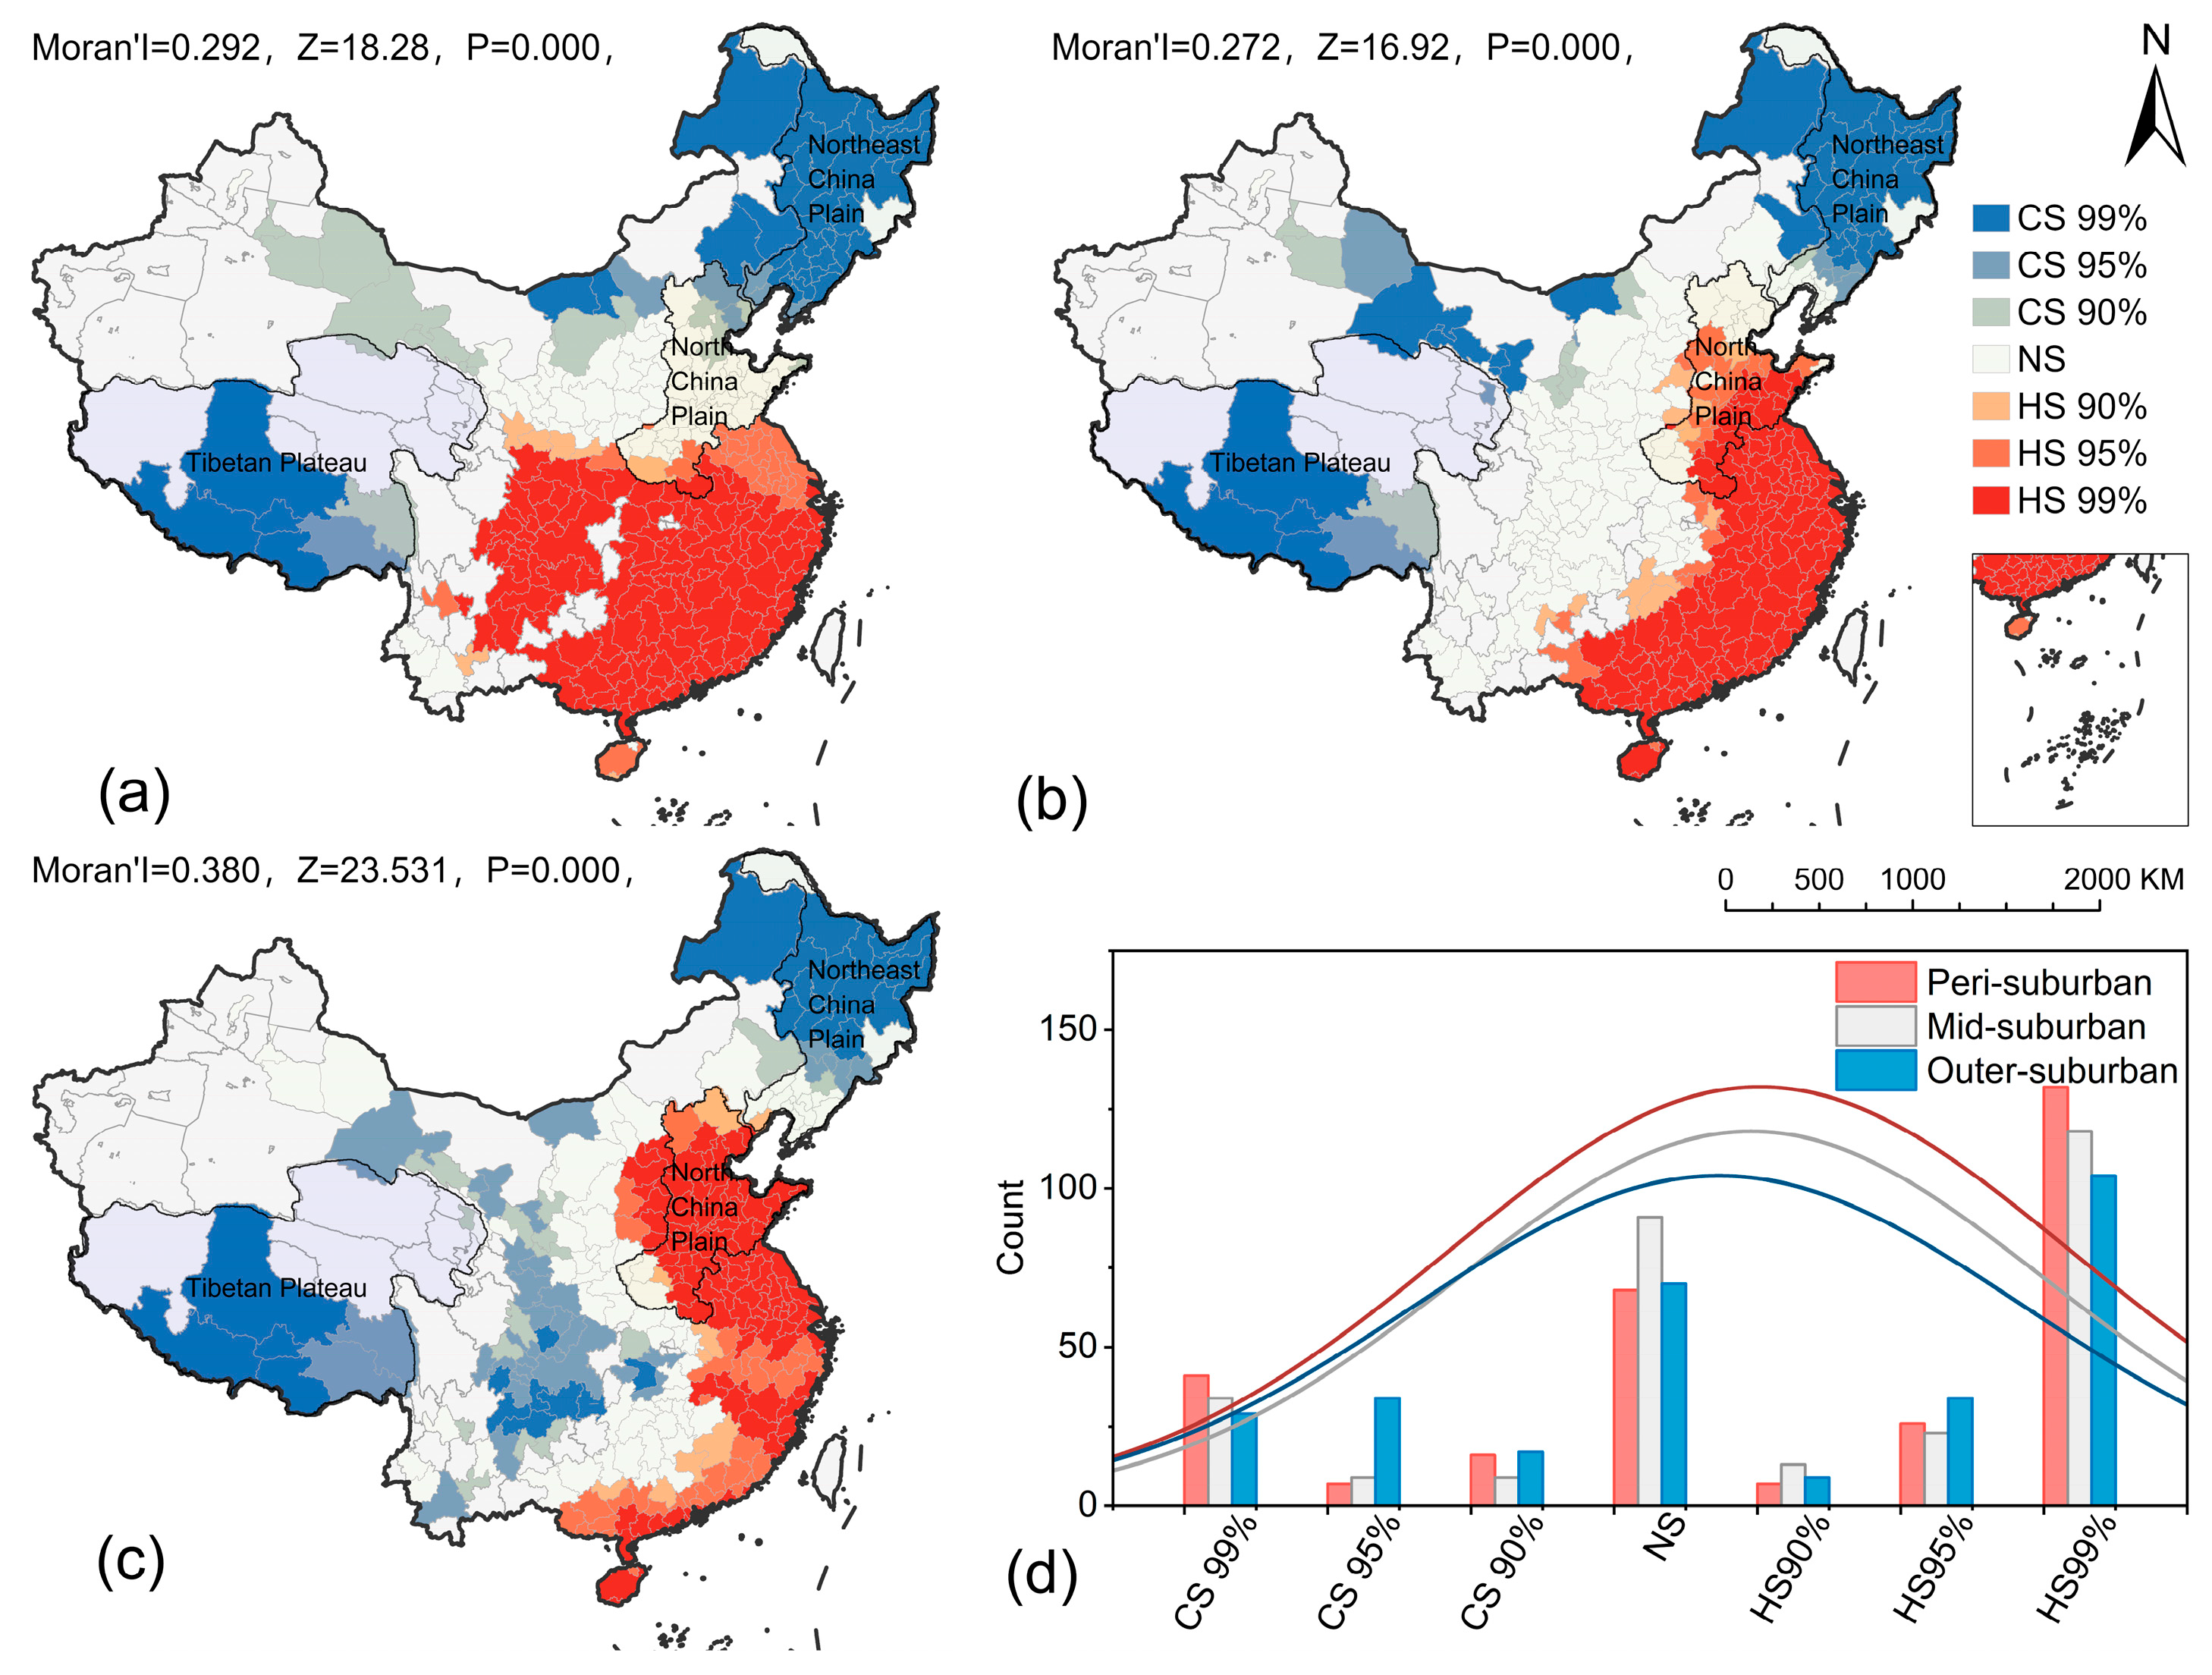
3.3. Impacts of Natural and Socio-Economic Characteristics on Suburban Vitality

The correlation analysis results indicate that there are differences in the factors impacting the distribution of vitality in the three types of suburban (Figure 6). The independent variable most correlated with the vitality of the peri-suburban is the POI density, with a correlation coefficient of 0.52. Both the mid-suburban and outer-suburban vitality shows a significant positive correlation with the built-up rate, with correlation coefficients of 0.74 and 0.85, respectively. The independent variables most negatively correlated with the vitality of the peri-suburban, mid-suburban, and outer-suburban areas are cropland rate, mean elevation, and mean elevation, with correlation coefficients of −0.2, −0.32, and −0.33, respectively.
The results of the multiple stepwise linear regression show that socio-economic activities are the main factors affecting the vitality of suburban (Table 5): The peri-suburban vitality regression model contains variables such as the built-up rate, population per square kilometer, and POI density (R2 = 0.347); The regression model for the mid-suburban vitality contains built-up rate, population per square kilometer, (R2 = 0.589). The outer-suburban vitality regression model contains only built-up rate (R2 = 0.726). The built-up rate is a significant positive correlation factor for mid-suburban and outer-suburban vitality, especially for outer-suburban areas. In the peri-suburban areas, POI density is the most significantly positively correlated factor. The VIF values for all variables ranged from 1.054 to 1.465, which indicates the absence of severe multicollinearity among the variables.

4. Discussion

4.1. Potential Mechanisms Underlying the Heterogeneity of Suburban Vitality

Natural and socio-economic characteristics affect suburban vitality. According to our research, different factors have varying impacts on suburban vitality. The negative factors on suburban vitality mainly include the proportion of agricultural land and elevation. The impact of agricultural land proportion is more significant in peri-suburban areas, while the elevation factor is more significant in mid- and outer-suburban areas. In peri-suburban areas, a large number of croplands is generally observed in non-open operation conditions, and a wide distribution of farmland excludes human activities inside the farmland, while restricting the development of surrounding commercial, entertainment, and other infrastructure, thereby reducing the vitality of the area. For example, the existing large rural lots in China’s Tianjin region were found to negatively affect the level of urbanization [23]. In the mid- and outer-suburban areas, higher elevation led to increased construction cost and greater development difficulties, thus limiting the suburban vitality. The main positive factors are POI density and the proportion of built-up areas. The POI density’s impact is more significant in the peri-suburban areas, while the proportion of built-up areas is more significant in mid- and outer-suburban areas. The POI density represents the number of facilities hosting human activities in a certain area, reflecting the supply capacity of infrastructure and public services, which are crucial for enhancing suburban vitality, such as accessibility to peri-urban parks in Chengdu [24]. The proportion of built-up areas serves as the material foundation for accommodating various POIs. From the peri-suburban to the mid- and outer-suburban areas, there is a progressive relationship between the factors affecting suburban vitality. The proportion of built-up areas is an important driving factor for improving vitality in the mid- and outer-suburban areas, but with the proportion of built-up areas increased, the POI density may become a more significant driving factor. The progressive relationship of driving factors also reflects a gradient change in the realization of the vitality from the peri-suburban areas to the mid- and outer-suburban areas. It illustrates the city radiation from the center to the surrounding suburban areas. The vitality of China’s suburban is largely influenced by the urban development. In addition, previous policies related to urban and rural development in China have also contributed to the spatial heterogeneity of the current suburban vitality. A one-size-fits-all policy has varying impacts across different regions because it fail to account for local differences in development. Suburban areas in the southeast coastal region benefit from favorable natural and socio-economic conditions for vitality realization, while the suburbs in the northwest area will inevitably lag behind under the same policy background, which may further exacerbate the spatial heterogeneity of suburban vitality in the future.

4.2. Pathways to Enhance Suburban Vitality

The urban sprawl development during the last decades has led to severe resource waste and ecological degradation in China. The National New Type Urbanization Plan aims to strictly limit urban expansion of urban areas in the future. Therefore, suburban areas can play a crucial role in alleviating the shortage of urban construction land. According to the Rural Revitalization Strategic Plan (2018–2022), villages near cities have the potential to serve as urban backyards while also possessing the necessary conditions of urban transformation. To enhance suburban vitality, efforts should focus on promoting the integrated development of urban and rural industries, improving infrastructure connectivity, and ensuring the co-construction and shared use of public services. Both policies emphasize the need to retain suburban landscape characteristics while maintaining a multifunctional balance among production, ecology, and landscape culture [25]. The key step in integrating suburban farmland into urban green infrastructure is making cropland accessible to the public and encouraging multiple ecosystem services beyond food production, such as climate regulation and cultural landscapes. For instance, suburban economic growth and employment can be promoted by developing the existing cropland into parks and supporting a farm-style tourism industry. Additionally, suburban farmland can be incorporated into green belts, corridors, or green networks to strengthen urban and regional ecological security. Digital technology also plays a vital role in enhancing suburban vitality, as exemplified by the case in Guangzhou [26].
In efforts to enhance the vitality of suburban areas, the spatial heterogeneity of the natural, socio-economic characteristics and vitality of the suburban areas in China should be fully considered. Given the diverse conditions and needs across different regions of China, suburban development strategies should be tailored to local contexts. The southeastern coastal regions should prioritize the agglomeration of high-tech and advanced industries while simultaneously developing green agricultural infrastructure. In contrast, the central and western regions require accelerated infrastructure development and industrial diversification, whereas the northeastern region should focus on industrial transformation and ecological agriculture improvement. Through effective policy guidance and optimized resource allocation, suburban vitality across regions can be enhanced, ultimately promoting suburban integration and sustainable development.
During policy implementation, cost–benefit analysis and social impact assessment need to be incorporated to enhance the scientific basis and practicality of policymaking.

5. Conclusions

The challenges of sustainable development driven by urbanization necessitate a holistic approach that considers both cities and their surrounding areas. As a transitional zone between urban and rural areas, suburban areas are significantly influenced by urban dynamics. Meanwhile, suburban areas encompass extensive ecological space, including farmland, serving as key interfaces between cities and nature.
This study analyzed 294 prefecture-level cities across China, providing a comprehensive overview of suburban development nationwide. Our findings reveal significant spatial heterogeneity in the distribution, natural and socio-economic characteristics, and vitality realization of suburban areas. In general, suburban vitality in the southeast coastal region is significantly higher than in other areas, whereas the northwest and northeast remain relatively underdeveloped.
Across peri-, mid- and outer-suburban areas, spatial heterogeneity is evident but varies in nature. The farther the suburban areas are from the urban core, the lower their vitality. Both natural and socio-economic factors shape suburban vitality, with different factors exerting varying degrees of influence. The key negative factors include the proportion of cropland and elevation, whereas the primary positive factors are POI density and the proportion of built-up areas. Moreover, the impacts of these influencing factors shift progressively from peri-suburban to the mid- and outer-suburban areas.
Policy factors also play a crucial role in driving the spatial heterogeneity of suburban development. Given the diverse conditions and needs across different regions of China, strategies for enhancing suburban vitality must be adapted to the local situation. Moving forward, it is essential to fully consider the spatial heterogeneity of the natural and socio-economic characteristics and suburban vitality. Targeted measures should be implemented based on regional and typological differences to enhance suburban vitality effectively.

Supplementary Materials

The following supporting information can be downloaded at https://www.mdpi.com/article/10.3390/land14030593/s1. Supplementary figures (Figures S1–S20) associated with this article can be found in Supplementary Materials.

Author Contributions

T.L.: Conceptualization, Methodology, Writing—Original Draft, Writing—Review and Editing, Supervision, Project administration, Funding acquisition. Z.Z.: Methodology, Data Curation, Writing—Review and Editing. H.G.: Software, Methodology, Writing, Visualization. Y.H.: Methodology, Data Curation, Writing. J.C.: Methodology, Writing. X.W.: Writing—Review and Editing. X.C.: Data Curation. Y.Z.: Visualization. All authors have read and agreed to the published version of the manuscript.

Funding

This work was supported by the National Key R&D Program of China (Grant No. 2022YFC3800700) and the National Natural Science Foundation of China (42271299).

Data Availability Statement

The data supporting the findings of this study are available upon request from the corresponding author.

Conflicts of Interest

The authors declare that they have no known competing financial interests or personal relationships that could have appeared to influence the work reported in this paper.

References

  1. Grimm, N.B.; Faeth, S.H.; Golubiewski, N.E.; Redman, C.L.; Wu, J.; Bai, X.; Briggs, J.M. Global change and the ecology of cities. Science 2008, 319, 756–760. [Google Scholar] [CrossRef] [PubMed]
  2. Zhao, J.; Dai, D.; Lin, T.; Tang, L. Rapid urbanisation, ecological effects and sustainable city construction in xiamen. Int. J. Sust. Dev. World 2010, 17, 271–272. [Google Scholar] [CrossRef]
  3. Seto, K.C.; Gueneralp, B.; Hutyra, L.R. Global forecasts of urban expansion to 2030 and direct impacts on biodiversity and carbon pools. Proc. Natl. Acad. Sci. USA 2012, 109, 16083–16088. [Google Scholar] [CrossRef] [PubMed]
  4. Rahman, M.M.; Alam, K. Clean energy, population density, urbanization and environmental pollution nexus: Evidence from bangladesh. Renew. Energ. 2021, 172, 1063–1072. [Google Scholar] [CrossRef]
  5. Qian, Y.; Chakraborty, T.C.; Li, J.; Li, D.; He, C.; Sarangi, C.; Chen, F.; Yang, X.; Leung, L.R. Urbanization impact on regional climate and extreme weather: Current understanding, uncertainties, and future research directions (vol 39, pg 819, 2022). Adv. Atmos. Sci. 2023, 40, 333. [Google Scholar] [CrossRef]
  6. Seto, K.C.; Reenberg, A.; Boone, C.G.; Fragkias, M.; Haase, D.; Langanke, T.; Marcotullio, P.; Munroe, D.K.; Olah, B.; Simon, D. Urban land teleconnections and sustainability. Proc. Natl. Acad. Sci. USA 2012, 109, 7687–7692. [Google Scholar] [CrossRef]
  7. Gueneralp, B.; Seto, K.C.; Ramachandran, M. Evidence of urban land teleconnections and impacts on hinterlands. Curr. Opin. Environ. Sust. 2013, 5, 445–451. [Google Scholar] [CrossRef]
  8. Morgan, K. Sustainable regions: Governance, innovation and scale. Eur. Plan. Stud. 2004, 12, 871–889. [Google Scholar] [CrossRef]
  9. Mayer, H.; Habersetzer, A.; Meili, R. Rural-urban linkages and sustainable regional development: The role of entrepreneurs in linking peripheries and centers. Sustainability 2016, 8, 745. [Google Scholar] [CrossRef]
  10. Zhu, Y.; Reid, B.J.; Meharg, A.A.; Banwart, S.A.; Fu, B. Optimizing peri-urban ecosystems ( pure ) to re-couple urban-rural symbiosis. Sci. Total Environ. 2017, 586, 1085–1090. [Google Scholar] [CrossRef]
  11. Lin, T.; Gibson, V.; Cui, S.; Yu, C.; Chen, S.; Ye, Z.; Zhu, Y. Managing urban nutrient biogeochemistry for sustainable urbanization. Environ. Pollut. 2014, 192, 244–250. [Google Scholar] [CrossRef]
  12. Lin, T.; Cai, J.; Geng, H.; Zheng, Y.; Zeng, Z.; Zheng, Y. Incorporating suburban cropland into urban green infrastructure: A perspective of nature-based solutions in china. Nat.-Based Solut. 2024, 5, 100122. [Google Scholar] [CrossRef]
  13. Diep, L.; Mcphearson, T. Nature—based solutions for global climate adaptation. Nature 2022, 606, 653. [Google Scholar] [CrossRef]
  14. Li, F.; Liu, X.; Zhang, X.; Zhao, D.; Liu, H.; Zhou, C.; Wang, R. Urban ecological infrastructure: An integrated network for ecosystem services and sustainable urban systems. J. Clean Prod. 2017, 163, S12–S18. [Google Scholar] [CrossRef]
  15. Grabowski, Z.J.; Mcphearson, T.; Matsler, A.M.; Groffman, P.; Pickett, S.T. A What is green infrastructure? A study of definitions in us city planning. Front. Ecol. Environ. 2022, 20, 152–160. [Google Scholar] [CrossRef]
  16. Cuthbert, M.O.; Rau, G.C.; Ekstrom, M.; O’Carroll, D.M.; Bates, A.J. Global climate-driven trade-offs between the water retention and cooling benefits of urban greening. Nat. Commun. 2022, 13, 1–10. [Google Scholar] [CrossRef] [PubMed]
  17. Diener, A.; Mudu, P. How can vegetation protect us from air pollution? A critical review on green spaces‘ mitigation abilities for air-borne particles from a public health perspective-with implications for urban planning. Sci. Total Environ. 2021, 796, 148605. [Google Scholar] [CrossRef] [PubMed]
  18. Bux, Q.; Anderson, P.; O’Farrell, P.J. Understanding the local biodiversity and open space strategies in two south african cities. Ecol. Soc. 2021, 26, 4. [Google Scholar] [CrossRef]
  19. Zheng, Y.; Lin, T.; Hamm NA, S.; Liu, J.; Zhou, T.; Geng, H.; Zhang, J.; Ye, H.; Zhang, G.; Wang, X.; et al. Quantitative evaluation of urban green exposure and its impact on human health: A case study on the 3-30-300 green space rule. Sci. Total Environ. 2024, 924, 171461. [Google Scholar] [CrossRef]
  20. Wu, C.; Ye, X.; Ren, F.; Du, Q. Check-in behaviour and spatio-temporal vibrancy: An exploratory analysis in shenzhen, china. Cities 2018, 77, 104–116. [Google Scholar] [CrossRef]
  21. Ma, Z. Deep exploration of street view features for identifying urban vitality: A case study of qingdao city. Int. J. Appl. Earth Obs. 2023, 123, 103476. [Google Scholar] [CrossRef]
  22. Geng, H.; Lin, T.; Han, J.; Zheng, Y.; Zhang, J.; Jia, Z.; Chen, Y.; Lin, M.; Yu, L.; Zhang, Y. Urban green vitalization and its impact on green exposure equity: A case study of shanghai city, china. J. Environ. Manag. 2024, 370, 122889. [Google Scholar] [CrossRef] [PubMed]
  23. Khan, M.; Wu, Q.; Yan, S.; Bilal, K.; Junaid, M.B.; Hatamleh, W.A. Multifunctional Role of Land-Use Planning in Peri-Urban and Urban Agricultural Drylands: The Mediating Effect of Urbanization Level. J. Urban Plan. Dev. 2025, 151, 04024067. [Google Scholar] [CrossRef]
  24. Yang, L.; Lu, Y.; Cao, M.; Wang, R.; Chen, J. Assessing accessibility to peri-urban parks considering supply, demand, and traffic conditions. Landsc. Urban Plan 2025, 257, 105313. [Google Scholar] [CrossRef]
  25. Luo, X.; Ye, Y.; Guo, X.; Zhao, X.; Kuang, L. Multifunctional Evolution Response Mechanisms to Urbanization Processes on Peri-Urban Cultivated Land, Nanchang City, China. Land 2025, 14, 259. [Google Scholar] [CrossRef]
  26. Lei, J.; Xie, Y.; Chen, Y.; Zhong, T.; Lin, Y.; Wang, M. The Transformation of Peri-Urban Agriculture and Its Implications for Urban–Rural Integration Under the Influence of Digital Technology. Land 2025, 14, 375. [Google Scholar] [CrossRef]
  27. Guan, X.; Wei, H.; Lu, S.; Dai, Q.; Su, H. Assessment on the urbanization strategy in China: Achievements, challenges and reflections. Habitat Int. 2018, 71, 97–109. [Google Scholar] [CrossRef]
  28. Bai, X.; Shi, P.; Liu, Y. Realizing china’s urban dream. Nature 2014, 509, 158–160. [Google Scholar] [CrossRef]
  29. Chen, X.; Le Yu Li, Y.; Liu, T.; Liu, J.; Peng, D.; Zhang, X.; Fang, C.; Gong, P. China’s ongoing rural to urban transformation benefits the population but is not evenly spread. Commun. Earth Environ. 2024, 5, 1–14. [Google Scholar] [CrossRef]
  30. Ma, S.; Wang, R. Socio-economic-natural complex ecosystem. Acta Ecol. Sin. 1984, 4, 1–9. [Google Scholar]
  31. Deng, C.; Zhou, D.; Wang, Y.; Wu, J.; Yin, Z. Association between Land Use and Urban Vitality in the Guangdong–Hong Kong–Macao Greater Bay Area: A Multiscale Study. Land 2024, 13, 1574. [Google Scholar] [CrossRef]
  32. Liu, S.; Zhang, L.; Long, Y. Urban vitality area identification and pattern analysis from the perspective of time and space fusion. Sustainability 2019, 11, 4032. [Google Scholar] [CrossRef]
  33. Meng, X.; Ma, S.; Xiang, W.; Kan, C.; Wu, K.; Long, Y. Classification of shrinking cities in China using Baidu big data. Acta Geogr. Sin. 2021, 76, 2477–2488. [Google Scholar]
  34. Gu, H.; Shen, R.; Chen, Q.; Duan, M.; Zhao, X. Site Selection for Elderly Care Facilities in the Context of Big Data: A Case Study of Xi’an, China. Sustianability 2025, 17, 1540. [Google Scholar] [CrossRef]
  35. Chen, Y.; Lin, M.; Lin, T.; Zhang, J.; Jones, L.; Yao, X.; Geng, H.; Liu, Y.; Zhang, G.; Cao, X.; et al. Spatial heterogeneity of vegetation phenology caused by urbanization in china based on remote sensing. Ecol. Indic. 2023, 153, 110448. [Google Scholar] [CrossRef]
  36. Feng, Z.; Liwenjun Li, P.; Xiao, C. Relief degree of land surface and its geographical meanings in the qinghai-tibet plateau, china. Acta Geogr. Sin. 2020, 75, 1359–1372. [Google Scholar]
Figure 1. Schematic diagram of peri-suburban, mid-suburban, and outer-suburban areas (taking Shanghai City as an example).
Land 14 00593 g001
Figure 2. Current status of suburbs in the Chinese 294 cities. Among these, (ac) show the spatial distribution of peri-, mid-, and outer-suburban areas. (d) shows the number of cities with different suburban sizes.
Land 14 00593 g002
Figure 3. Spatial heterogeneity of suburban areas in the Chinese 294 cities. Among these, (ac) show the hot spot based on suburban area size. (d) shows the distribution of the number of cities that keep cold and hot spots.
Land 14 00593 g003
Figure 4. Suburban vitality in the 294 cities in China. (ac) represent the vitality of the peri-suburban, mid-suburban, and outer-suburban areas, respectively. (d) is a distribution map showing the number of cities with different levels of vitality in the three types of suburban areas.
Land 14 00593 g004
Figure 5. Spatial heterogeneity of suburban vitality in the 294 cities in China. (ac) are hotspot analysis results for the vitality of the three types of suburban areas, respectively; (d) is a distribution map showing the number of cities with hot and cold spots in terms of vitality for the three types of suburban areas.
Land 14 00593 g005
Figure 6. The correlation between the natural and socio-economic characteristics and suburban vitality in China. *** p < 0.001, ** p < 0.01, * p < 0.05.
Land 14 00593 g006
Table 1. Indicators of natural and socio-economic features in the study.
IDNatural CharacteristicsUnitsIDSocio-Economic CharacteristicsUnits
1Suburban Areakm21Total GDPMillion Yuan
2Cropland Areakm22GDP per square kilometerMillion Yuan per square kilometer
3Greenland Areakm23Total populationPerson
4Water Areakm24Population per square kilometerPerson per square kilometer
5Built-up Areakm25Road lengthkm
6Other Land Use Areakm26Road densitykm/km2
7Cropland Rate%7Number of POIsPoints
8Greenland Rate%8POI densityPoints per square kilometer
9Water Rate%--
10Built-up Rate%--
11Other Land Use Rate%--
12Mean Elevationm--
13Relief Amplitude°--
Table 2. Collection time of Baidu Huiyan population data.
SpringSummerAutumnWinter
Workday10 January 2024;
11 January 2024;
12 January 2024;
15 January 2024;
16 January 2024
10 April 2023;
11 April 2023;
12 April 2023;
15 April 2023;
16 April 2023
10 July 2023;
11 July 2023;
12 July 2023;
15 July 2023;
16 July 2023
10 October 2023;
11 October 2023;
12 October 2023;
15 October 2023;
16 October 2023
Weekend13 January 2024;
14 January 2024
13 April 2023;
14 April 2023
13 July 2023
14 July 2023
13 October 2023;
14 October 2023
Note: The collection process takes place each hour, from 0:00 to 23:00 each day.
Table 3. The attributes and sources of data in the study.
Data NameData TypeTimeResolutionData Source
City BoundariesVector2020--https://www.webmap.cn (accessed on 10 January 2024, below)
Built-up area BoundaryVector2020--Chen et al., 2023 [35]
Land Use CoverRaster202010 mhttps://viewer.esa-worldcover.org/worldcover/
ElevationRaster2020500 mhttps://www.resdc.cn/data.aspx?DATAID=123
Relief AmplitudeRaster2020500 mFeng et al., 2020 [36]
GDPRaster20201 kmhttp://geodata.nnu.edu.cn
PopulationRaster20201 kmhttps://www.worldpop.org/
Road NetworkVector2020--https://www.openstreetmap.org/
Point of InterestVector2020--https://www.amap.com
Mobile Population LocationVector2023500 mhttps://huiyan.baidu.com/products/platform
Table 4. Moran’I, Z, and p values of natural and socioeconomic features in three types of suburban areas of 294 cities.
Natural and Socio-Economic CharacteristicsPeri-SuburbanMid-SuburbanOuter-Suburban
Moran’IZpMoran’IZpMoran’IZp
Cropland Area0.55034.4860.0000.58836.5060.0000.49530.6850.000
Greenland Area0.0684.6140.0000.0885.9920.0000.1147.8310.000
Water Area0.25916.3830.0000.30619.9880.0000.43827.6140.000
Built-up Area0.37923.7920.0000.43427.1580.0000.50631.4220.000
Other Land Use Area0.17511.1010.0000.17211.0880.0000.1248.3860.000
Cropland Rate0.71644.0860.0000.66741.0480.0000.67441.5030.000
Greenspace Rate0.51731.8830.0000.54033.2780.0000.57435.3940.000
Water Rate0.41025.4350.0000.45027.9730.0000.54033.9510.000
Built-up Rate0.21513.4430.0000.38223.7210.0000.48730.3200.000
Other Land Use Rate0.22814.4860.0000.18011.6170.0000.17611.3540.000
Mean Elevation0.35722.7350.0000.35822.8150.0000.36223.0400.000
Relief Amplitude0.28317.9710.0000.30319.1750.0000.34321.5760.000
Total GDP0.24916.0300.0000.34122.2440.0000.33422.1340.000
GDP per square kilometer0.36222.9820.0000.38526.5190.0000.41028.1160.000
Total Population0.17811.3990.0000.24015.2160.0000.30019.0010.000
Population per square kilometer0.50131.0150.0000.47930.0810.0000.49831.8330.000
Road Length0.29518.6730.0000.33220.9140.0000.35522.3620.000
Road Density0.31319.5030.0000.36122.6130.0000.47530.0720.000
Number of POI0.27517.5500.0000.36523.6710.0000.35423.0870.000
POI Density0.40725.4290.0000.46030.9450.0000.49132.1610.000
Table 5. The multiple regression results of the suburban vitality in China.
Peri-SuburbMid-SuburbOuter-Suburb
Coef. Coef. Coef.
Intercept68.168Intercept47.297Intercept39.397
Built-up rate0.831 ***Built-up rate1.8 ***Built-up rate1.8 ***
Population per square kilometer0.089 ***Population per square kilometer0.214 ***----
POI density0.129 ***--------
R-square0.347R-square0.589R-square0.726
Adj. R-square0.34Adj. R-square0.587Adj. R-square0.725
RMSE11.07RMSE8.868RMSE8.204
F51.401F208.841F772.574
p<0.001p<0.001p<0.001
Note: All models’ independent variables have been tested with VIF, and the VIF values are less than 5. *** p < 0.001.
Disclaimer/Publisher’s Note: The statements, opinions and data contained in all publications are solely those of the individual author(s) and contributor(s) and not of MDPI and/or the editor(s). MDPI and/or the editor(s) disclaim responsibility for any injury to people or property resulting from any ideas, methods, instructions or products referred to in the content.

