Abstract
Human needs alter ecosystem services (ESs), which then affect human needs. Based on the human needs theory, human needs in ESs are classified into four major categories of needs. A monetization method was used to quantify the ecosystem service need value (ESNV), the ES value equivalent method was used to calculate the ES supply value (ESSV), and the correlation coefficient method was used to understand the relationships and mutual influences among human needs. Finally, the supply and demand relationships were compared to obtain the gap between the supply of and demand for ESs. Taking Hechi City, a city with a predominantly karst landscape, as an example, we found that: (1) the total area of high-value areas and generally high-value areas in Hechi City increased by 10,935.15 km2, whereas the total area of low-value areas decreased by 11,094.07 km2. (2) A positive correlation exists between the various demands. Spiritual needs and material needs are moderately significantly positively correlated, with a correlation coefficient of 0.54. Security needs are positively correlated with material needs, with a correlation coefficient of 0.6. (3) The ESNV and ESSV in Hechi City are slightly imbalanced. Du’an requires an external ecosystem supply of CNY 21.9192 million for living material, while Jinchengjiang has the potential to export a water supply value of CNY 22.9934 million to external ecosystems. (4) The centers of gravity of various types of supply and demand are distributed primarily within Jinchengjiang District, only the center of gravity of production material needs is in the northern part of Du’an County. The distance between the centers of gravity of the demand and supply for living materials increased by 2100.44 m, the distance between the centers of gravity of the demand and supply for oxygen security increased by 639.15 m. The results are complementary to current research on ESs from the perspective of ES demand. These findings can thus provide scientific foundational information to help decision makers understand the balance between the supply and demand of ESs in a region and promote the construction of a human-harmonious ecosystem.
1. Introduction
Ecosystem services (ESs) serve as the mediums and conduits through which various ecological elements in ecosystems, by virtue of their functions and structures, fulfill human needs and benefit human society [1]. In 1992, the United Nations Environment Programme released the “World Environment Situation Report 1972–1992,” which served as an environmental protection alert to all countries worldwide. In 2000, the United Nations included “ensuring environmental sustainability” as one of the Millennium Development Goals, indicating that ecological conservation has gradually become an important global development issue. In 2005, the United Nations released the Millennium Ecosystem Assessment report, elucidating the importance of ES assessment for ecological conservation. Research on ESs for human coexistence has gradually become a global academic hotspot [2,3,4].
The concept of ESs is widely understood as “the benefits that humans derive from the natural functions of a healthy ecosystem” [5]. In academia, research on ESs has focused primarily on two aspects. One is the discussion of ESs from the perspective of influencing factors and driving mechanisms, in which spatiotemporal characteristics and influencing factors [6,7] and the balance and synergy among driving mechanisms [8,9] are the focus. The other aspect is the valuation of ESs [10] and the subsequent study of the flow of ESs [11,12]. In terms of ES demand, scholars have studied the influencing factors of single ecosystem service demand and its changes, such as cultural demand, food demand, etc. [13,14], as well as the influencing factors of multiple types of demand [15,16], and further explored the correlation and coupling mechanism between ecosystem service supply and demand [17]. On the other hand, scholars have evaluated the demand for ecosystem services, and their evaluation indices mostly include consumption, preference, or perception type indices [18,19].
In terms of quantifying the demand for ecosystem services, scholars have studied the quantitative assessment of the demand for ecosystem services through biophysical indicators and monetary values (monetary indicators). Monetary value is intuitive to policy makers and investors, while it is based on biophysical properties that mediate comparisons of multiple ecosystem services and their supply and demand. Since the turn of the century, an increasing number of studies have focused on the demand for ecosystem services [20,21,22,23,24] and, although some scholars have proposed the concept of the value of ES demand, actual research has not directly calculated the value of this demand. Often, the degree of coordination of ES supply and demand indices is calculated by combining ES supply [25,26]; alternatively, the quantities of various demands are calculated for discussion. However, the results of these indices do not leverage the advantage of value quantification, meaning that they do not intuitively show the degree of mismatch between ESNV and ESSV through value comparison. Additionally, calculating similar ES demand indices is relatively complex and involves the use of numerous formulas, making them difficult to compute. In studies that calculate demand quantities, comparisons are difficult because of the inconsistency in the calculated dimensions of various demands [27]. And because there are different views on the connotation of demand for ecosystem services, there are relatively few quantitative studies on the value of demand for ecosystem services [28,29,30]. In summary, academic research on ESs typically starts from the supply side, discussing the functions and values provided by ecosystems while overlooking the reality of human interaction with ecosystems. As part of the ecosystem, humans not only (but also not exclusively) consume environmental resources and services but also contribute to the development, maintenance, and flow of environmental resources and services. Different human needs and preferences can affect the supply of ESs. Therefore, it is necessary to study ESs from the perspective of human needs theory.
Human needs can alter the ecological environment, while the ecological environment, in turn, can affect the fulfillment of human needs. A large body of literature focusing on human needs addresses socioeconomic [31] and ethical issues [32], such as poverty, social welfare, social exclusion, and human rights. Research on human needs is abundant in the fields of philosophy (from early Greek philosophers to Marx, Rawls, or Habermas), sociology [33], psychology [34], and economics [35]. Many studies discuss various aspects of human needs at the theoretical level, but there is a lack of research on the relationship between human needs and ESs; quantifying human needs is a major challenge in the academic community.
ESs belong to the supply side and do not directly possess economic attributes. The existence of human needs gives ESs economic value. Marx and Engels’ theory of supply and demand proposes that the purpose of production is to meet consumption, and the purpose of supply is to meet demand. Supply and demand are premised on each other, with demand exerting a certain influence on supply. It is impossible for demand to be passively determined by supply without conditions. Therefore, focusing solely on supply and ignoring demand is one-sided. Transparency in the value of supply and demand for ecosystem services can lead to their recognition in public decision making, valuing, and taking full account of the role of natural capital. Values have a double meaning, referring to both what we consider important (i.e., goals or objectives) and the relative value of trade-offs (the contribution of an object or behavior to the achievement of a particular goal) [36]. Consequently, there is a need to conduct research on the valuation of human needs in ESs to further refine the concept of ES value. While research on valuations has been conducted at the supply level of ESs, such as studies on ES value [37,38] and equivalent factors, related research from the perspective of the valuation of human needs is lacking.
In summary, the scientific questions this paper proposes to address are: “How should the valorization of ecosystem service supply and demand be scientifically calculated? How should the theoretical basis in the demand for ecosystem services be accounted for?”. Therefore, this paper discusses human demand in ecosystem services at the theoretical level, which helps to dissect and innovate the demand for ecosystem services at the theoretical level. Human needs are further quantified using valorization theory in order to explore the hierarchical relationships among human needs in ecosystems and to clarify the causes and associations of needs. This study utilizes a value-based calculation method to quantify ecosystem service demand from the perspective of human needs, examining the supply–demand relationship and enhancing the comparability of demand quantification. It simultaneously conducts the calculation of supply and demand centers to understand the varying difficulty in achieving dynamic supply–demand balance. It assesses the value of ecosystem service functions on both the supply and demand sides, comparing the alignment between ecosystem service demand and supply. This analysis clarifies future development directions for the study area, enhances understanding of ecosystem service matching, and facilitates a more efficient and intensive layout of ecological land use, providing guidance for the optimization and adjustment of ecological land.
2. Argumentation of Human Needs Theory
2.1. Exact Meaning of Human Needs
There is currently no consensus in the academic community regarding the exact meaning of “human needs.” Doyal and Gough [39] associate this ambiguity with the different ways in which the term is used: as a universal and intrinsic personal motivator; as a societal prerequisite for achieving a range of goals; or as normative policy priorities to be implemented [40]. These interpretations correspond to different perspectives that psychologists, sociologists, and political scientists might use, but they are not mutually exclusive. Some authors, such as Max-Neef [41], have proposed a matrix of needs and different categories of need satisfiers to reflect these individual, social, or political viewpoints. Human needs arising from personal attributes, material assets, objective actions, and social interactions at different times vary, as do the ways in which these needs are satisfied.
2.2. Hierarchical Relationships Among Human Needs
Human needs are hierarchical in nature. Maslow established a pyramid in his famous formula, where the satisfaction of basic needs (such as protection and survival) is a prerequisite for achieving higher levels of satisfaction (such as status or self-actualization). However, some scholars argue that preferences for the sequence and degree of need satisfaction depend on the individual and their interactions with background factors, including power relations and the needs of others. For example, we may take risks with basic needs such as secure housing to gain higher returns, such as finding a better job, and may be driven by the needs of others, such as our children, rather than our own needs. Therefore, critics of the Maslow view need to be independent of a hierarchy system, as the satisfaction of each need is partially independent of time and external factors [42]. In this paper, however, an argument is made that, regardless of whether our private and public goals are met, they must always be achieved on the basis of successful social interactions with others in the past, present, or future. Thus, regardless of what a person’s goals are and what cultural customs and values people have, certain prerequisites are needed to achieve these goals, and after basic human needs are determined, diverse human needs emerge.
In this way, we define survival as the most basic human need for ESs. Before participants can effectively engage in their way of life to achieve any other valuable goals, they must meet their survival needs.
2.3. Universality of Human Needs
Although the time, place, and cultural groups in which different people grow and live vary, we all have some common similarities. Braybrooke [43] studied needs that are necessary for social functioning; if these basic needs are not met, some form of objective, serious harm can occur [44]. Many types of needs exist, and everyone has them. Some of these needs are common to all of us, regardless of our location, time, and sociopolitical background. For example, all people worldwide need ecosystems to provide food resources, thus reflecting the universality of needs.
2.4. Dynamic Structure of Human Needs
Human needs are dynamic, evolving with current living conditions, risks, and challenges [45]. Depending on historical developments or economic status, people’s actual needs undergo phased changes [46]. For example, in agrarian societies, humans extract materials for survival and production from ecological land to sustain their own survival and development. More recently, in industrial societies, due to issues such as large-scale emissions, ecological environments have been damaged, reducing the ecological value they provide. People’s direct experiences include environmental pollution, such as air and water pollution, leading them to value clean water and the atmosphere and thus protect these resources. Moreover, as modern society has developed rapidly and both technological levels and conservation awareness have improved, people are paying more attention to the spiritual and cultural services provided by ecological land, such as leisure and entertainment.
Therefore, human demand for ESs varies with changes in technological and economic levels, as exemplified by China’s primary contradiction: “the contradiction between the growing needs of the people for a better life and the inadequate and unbalanced development.” A better life refers to both the enrichment of material life and the continuous improvement in one’s spiritual life. Rooted in present-day China, with the continuous transformation of China’s social productivity and the rapid growth of social material wealth, the material living standards of the Chinese people have greatly improved. Today, people have shifted from a high dependence on material needs during the era of scarcity economics to a focus on spiritual needs and improvement while also demanding that the value provided by ESs be richer and more easily accessible [47].
2.5. Objective Aspects of Human Needs
Human needs are objective, whereas preferences are subjective. An individual’s need for clean water and air depends on the objective physiological requirements of humans. In contrast, an individual’s desire to see rivers or mountains depends on the nature of his or her beliefs and attitudes toward objects. In other words, there are subjective and objective aspects to needs. Objective needs depend on the “way the world works” rather than “how human thinking works.” In many cases, humans may be unaware that they have subjective needs, even though these needs exist; for example, various hormones in our bodies are critical to our survival, but we do not knowingly have a subjective need for them. For example, our body structure determines that we need clean water and air.
2.6. Human Needs and Ecosystem Relationships
Ecological land includes forests, grasslands, and water bodies. In this discussion, only the demands that humans generate for ecological land are considered. According to the nature of needs in human needs theory, human demands for ESs are classified into four major categories (Figure 1). First, based on the hierarchical nature of human needs, it is concluded that the generation of demand stems from the necessity of maintaining basic survival. Therefore, we propose that survival needs represent the lowest level of human demand. Second, the universality of human needs indicates that ecosystems are needed to provide food resources for humans. People worldwide consistently have this kind of need, thus giving rise to material needs. Third, the objectivity of human needs implies that objective needs depend on the “way the world works” rather than “how human thinking works.” The structure of the human body determines that humans need clean water, soil, and air, thus leading to safety needs. Fourth, the dynamic nature of human needs combined with current development outcomes leads to the conclusion that spiritual needs are an inevitable product of development. The connotations of each need are shown in Table 1.
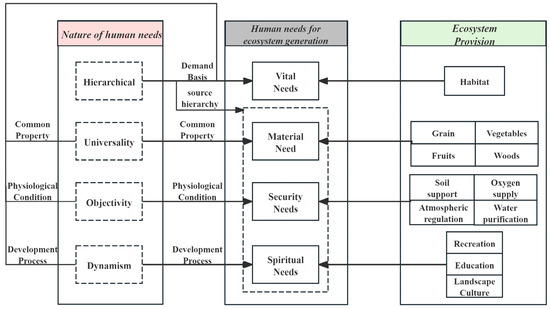
Figure 1.
Human needs theory applied to ecosystems.

Table 1.
Correspondence between human demand and supply in ecosystem.
In this paper, the degree of satisfaction of needs is discussed, and these needs are valued on the basis of the connotations of various human needs. These values are subsequently compared with ES values. The coupling relationships between human needs in the study area are discussed, and an exploration is undertaken regarding which human needs in the study area can be self-sufficient and outwardly fulfilling and which human needs cannot be completely met without external inputs. Figure 2 illustrates the theoretical framework of this paper. Human life needs are considered the most basic requirements and prerequisites for other needs. If an ecosystem cannot support human life needs, there should be no human activities in that area, and the supply of ESs for human needs should be absent. Therefore, life needs are assumed to be always met and cannot flow between regions. When discussing the coupling relationships between human needs, the relationships between life needs and other needs are not considered.
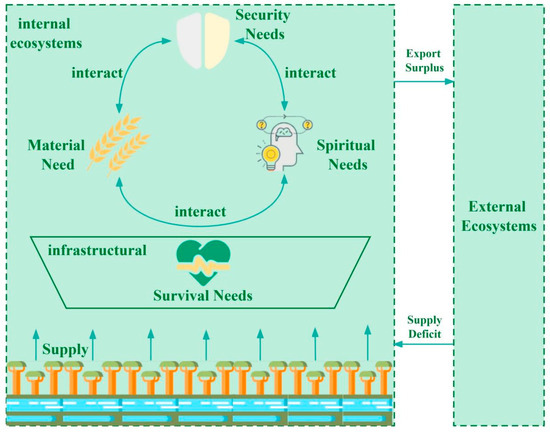
Figure 2.
Theoretical framework diagram.
3. Overview of the Study Area and Data Sources
3.1. Overview of the Study Area
Hechi City is located at the northwestern border of Guangxi, at the southern foot of the Yunnan–Guizhou Plateau, and serves as an important passageway from the southwest to coastal ports. It is situated between 106°34′–109°09′ E longitude and 23°41′–25°37′ N latitude and bordered by Liuzhou to the east, Nanning to the south, Baise City to the west, and Qiannan Buyi and Miao Autonomous Prefecture of Guizhou Province to the north. The city spans 260 km east to west and 228 km north to south, covering a total area of 33,476.47 km2. It administers 2 districts and 9 counties. Hechi City is a typical large rocky mountainous area with extensive mountain distributions. It is also one of China’s major karst landform areas, with karst topography covering 65.74% of its total area. As of the end of 2020, the total area of soil erosion in Hechi City was 6491.78 km2. Rocky desertification land accounts for 21.60% of this area; furthermore, soil erosion accounted for more than 35% of the total rocky desertification area in Guangxi. The geomorphological resources are characterized by many rocks, few flat lands, and susceptibility to drought and flooding. Economically, the service industry is booming, with rapid tourism development leveraging the city’s health and longevity resources. The urban population continues to grow, with the urbanization rate steadily increasing. In 2020, the total registered population of the city was 4.3383 million. The population is mainly concentrated in the eastern and southern regions, particularly in Du’an Yao Autonomous County, Yizhou District, and Dahua Yao Autonomous County, whereas Tian’e County and Fengshan County in the west have relatively few inhabitants.
Therefore, Hechi City faces prominent ecological issues typical of karst regions, such as soil erosion and rocky desertification. The unique characteristics of its ecosystems constrain sustainable urban development. The complex natural environment, multiethnic integration, diverse human needs, and unique regional cultural environment pose significant challenges to sustainable development in this area. In such areas, there are abundant ecological resources, a high proportion of ecological land, and relatively lagging economic development, making the matching of ecosystem service supply with human needs particularly important. The geographical profile of the study area is shown in Figure 3.
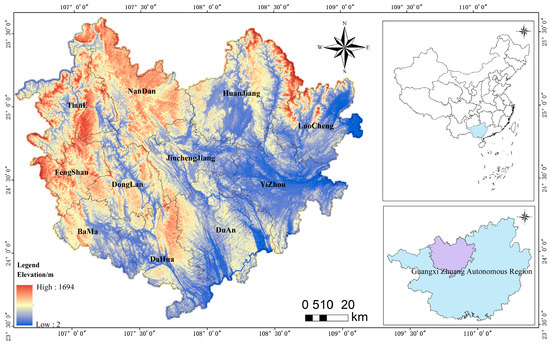
Figure 3.
Overview map of the study area.
3.2. Data Sources
The data sources and processing methods used in this study are as follows: (1) land use data for Hechi City were obtained from the Chinese Academy of Sciences Resource and Environmental Science Data Center (http://www.resdc.cn/), accessed on 1 April 2023, 30 × 30 m raster data. The land use data for the years 2000, 2005, 2010, 2015, and 2020 were classified as arable land, forestland, grassland, water bodies, residential land, and industrial and transportation land. (2) The 2020 slope data were obtained from NASA, the National Geospatial-Intelligence Agency (NGA), and the joint measurement of digital elevation data from the German and Italian aerospace agencies SRTM. (3) Net primary productivity (NPP) data for the years 2005, 2010, 2015, and 2020 were obtained from the MODIS NPP product. Both slope and NPP data were processed via the Google Earth Engine (GEE) to obtain average values (https://earthengine.google.com/), accessed on 6 July 2023. (4) The 2020 rocky desertification data were provided by the National Ecosystem Science Data Center, National Science and Technology Infrastructure of China (http://www.nesdc.org.cn), accessed on 23 July 2023. (5) GDP data for the years 2005, 2010, 2015, and 2020 were obtained from 1 km×1 km raster data downloaded from the Chinese Academy of Sciences Resource and Environmental Science Data Center and resampled to 30 × 30 m raster data via ArcGIS 10.3 software. Specific data sources are shown in Table 2 below.
Table 2.
Table of data sources.
3.3. Technical Lines of Research
In this study, the value of ESs is calculated from the perspectives of supply and demand. These calculations quantify human material, spiritual, and safety needs from the demand side and enable a more scientific analysis of the relationships among these three types of needs to be conducted. From the supply side, the ES value equivalent is used to calculate the ES provided by the study area itself. Supply and demand are compared, and the findings provide the basis for a discussion regarding whether the study area can meet its local needs without external inputs from ecosystems. The specific research approach is shown in Figure 4.
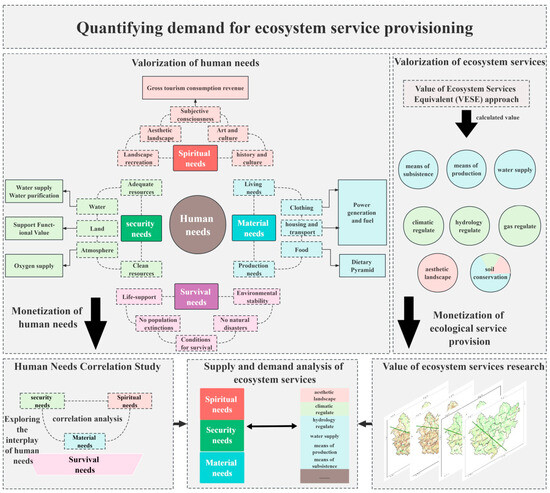
Figure 4.
Research Technology Roadmap.
4. Research Methods
4.1. Quantification of Human Needs
4.1.1. Quantification of Material Needs
Material needs include people’s needs for food, clothing, housing, and transportation in daily life, as well as their needs for food, building materials, and industrial materials provided by the natural environment. This paper subdivides material needs into living material needs and production material needs.
Mature research has been conducted on the daily dietary structure of living materials [48]. In 1992, the U.S. Department of Agriculture officially released a “Food Guide Pyramid” for a healthy dietary structure to maintain the absorption of nutrients for daily life; many countries have developed dietary guidelines to guide their residents toward a balanced diet. In 1997, China released the “Chinese Residents’ Dietary Guidelines” and “Chinese Residents’ Balanced Dietary Pagoda.” With the development of China’s society and economy, the dietary consumption and nutritional status of Chinese residents have changed significantly. To help residents balance their diet to obtain reasonable nutrition and improve their national health, the Chinese Nutrition Society has issued new versions of the “Chinese Residents’ Dietary Guidelines (2007)” and “Chinese Residents’ Balanced Dietary Pagoda (2007).” This paper localizes the dietary pyramid on the basis of the local output of the study area and the consumption habits of residents recorded in the statistical yearbook, as shown in Figure 5, calculates the average daily consumption per person, and then monetizes the consumption of each type of food on the basis of its selling price, thus monetizing the living material needs of humans. The calculation formula is as follows:
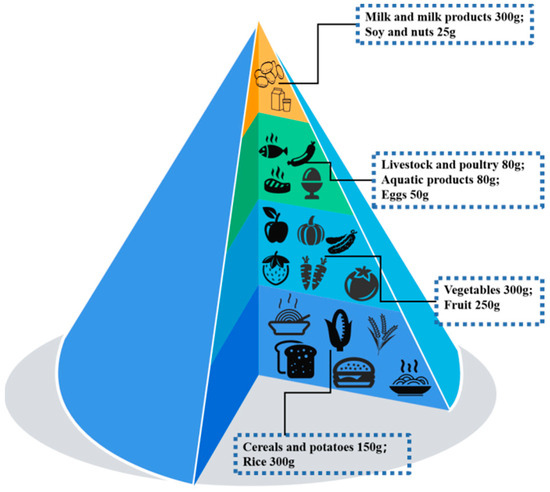
Figure 5.
Pyramid of material requirements.
In the equation, Vl represents the total value of human living material needs, Gi is the quantity needed per person per day of the i-th type of food, Vi is the price of the i-th type of food, and P is the total population of the local area.
In terms of human production material needs, electricity and fuel are products obtained by consuming various production materials in the ecosystem. Therefore, per capita electricity and fuel costs are used to calculate the demand for ecosystem production materials.
4.1.2. Quantification of Safety Needs
Quantification of Oxygen Security Needs
The energy in ecosystems, including the energy consumed by humans, primarily comes from solar energy fixed by photosynthesis. Plants convert solar energy into chemical energy, which is stored in organic matter and transferred through the food chain via animal consumption. Therefore, the energy consumed by consumers corresponds to the consumption of photosynthesis products. The oxygen and food needed by humans to maintain their metabolism and activities also directly or indirectly come from photosynthesis and plant products. Therefore, by measuring the amount of oxygen consumed by human respiration, we can estimate the human demand for oxygen from ecological land.
An average adult male at rest breathes approximately 7 or 8 L (approximately 0.007 or 0.008 m3) of air per minute. The total amount of air breathed in a day is approximately 11,000 L (11 m3). Approximately 20% of the air inhaled is oxygen, whereas exhaled air contains approximately 15% oxygen. Therefore, each breath consumes 5% of the oxygen inhaled, which is converted to carbon dioxide. Thus, a person consumes approximately 550 L of pure oxygen per day (0.5 m3, oxygen has a density of 1.429 g/L under standard conditions). This equates to a daily oxygen consumption of approximately 780 g per adult male. The oxygen demand was calculated separately for the different sexes.
In the equation, VO represents the total value of oxygen demand, and VOC represents the value of oxygen production. According to relevant studies, the most economical price for producing oxygen by using hydrogen peroxide in the laboratory is 0.2 yuan/g [49]. Pi represents the total population of sex i (based on data from the statistical yearbook). For this calculation, the standard oxygen consumption rate for adults (males and females) is uniformly used without considering factors such as age (elderly, children, youth). L represents the per capita daily oxygen consumption, which is 780 g for males and 700 g for females.
Quantification of Water Security Needs
Water security needs are divided into water purification values and water supply values. The water supply value is directly calculated by multiplying the total amount of domestic water used in each district and county of Hechi City by the water fee.
With respect to the value of water purification, various types of water can be transformed into usable water resources via ecological processes in the ecosystem, similar to the function of a pollution treatment plant. Therefore, the cost of purifying water in a treatment plant is used to calculate the value of human demand for water purification. In accordance with the “National Urban Sewage Treatment Plant Pollution Discharge Standard” [50] sewage treatment plants in Hechi City generally comply with the Class A standard for primary treatment, with an effluent standard of total nitrogen of 15 mg/L and total phosphorus of 0.5 mg/L. The nitrogen and phosphorus discharged in this area need to be completely purified by the natural environment to be converted into water resources that humans can use. The current treatment costs for nitrogen and phosphorus are 1.5 yuan/kg and 2.5 yuan/kg, respectively. Therefore, by multiplying the total annual water supply by the effluent standards for nitrogen and phosphorus and then by the treatment costs, the value of the human need for the ecological land purification of water can be calculated. The specific formula is as follows.
In the equation, Vw represents the total value of the water safety demand, QW represents the total water supply, QN represents the total nitrogen effluent standard, QP represents the total phosphorus effluent standard, VN and VP represent the treatment costs for nitrogen and phosphorus, respectively, and VWG represents the water supply demand.
Quantification of the Soil Security Needs
The study area is a typical southwestern karst landform area with severe rocky desertification, and the entire area falls within the scope of rocky desertification control [51]. Rocky desertification can lead to soil erosion, a decrease in land productivity, and the exposure of large areas of bedrock on the surface; these factors affect the soil carrying capacity, production function, ecological function, etc. Therefore, the cost of controlling rocky desertification in the region reflects the value of soil safety. Combining the content of rocky desertification control in the “Hechi City Land Space Ecological Restoration Plan 2021–2035” [52], the investment per acre for rocky desertification control is determined to be CNY 0.05 million. The area of construction land intuitively reflects the transformation of rocky desertification areas to meet the demand for land support functions. Therefore, by multiplying the construction land area for each year by the investment per acre for rocky desertification control, the value of the soil safety demand can be calculated.
The value of other soil demands has been considered in the calculations for oxygen safety, water safety, etc. For example, when various crops are sold, their value already considers the cost of the soil production function. When considering water use, the cost of nitrogen and phosphorus treatment already accounts for the soil purification properties. To avoid the irrational quantification of demand value due to double counting, which could affect the final comparison of soil safety supply and demand results, the values of the remaining functions of soil safety are not calculated separately.
4.1.3. Quantification of Spiritual Needs
The spiritual demand of human beings for ecological land can be reflected in the demand for the beauty of the natural landscape, the demand for culture and other aspects, and the need for the natural environment to provide human beings with leisure and entertainment places and cultural and educational venues and to realize the landscape value of ecological land. The natural environment provides a space for human beings to escape from the pressure of daily life, for people to relax and enjoy life, and then realize the landscape value of ecological land. For example, the magnificence of mountains and rivers, the tranquility of forests, and the vastness of lakes can effectively enhance people’s mental health and sense of well-being.
However, these needs are subjective and often difficult to quantify to the individual level for specific calculations. Each person’s experience of natural landscapes and cultural experiences is unique, making it difficult to accurately reflect the value of such spiritual needs through traditional economic indicators. Inspired by certain scholars who quantify the demand for cultural services through visitor statistics [53], we employ tourism revenue as an indirect indicator to quantify spiritual demand, aiming to standardize all dimensions of demand and assign a monetary value to them. Tourism income not only reflects the degree of recognition of tourists of the natural and cultural resources of a certain region, but also the actual value of these resources in meeting the spiritual needs of human beings. According to the statistical yearbook of Hechi City, the total income from tourism can serve as a quantitative embodiment of the spiritual needs of human beings, reflecting the economic price that people are willing to pay for the enjoyment of natural landscapes and cultural activities. Therefore, according to the Hechi City Statistical Yearbook, the total income from tourism in each region is taken as a valorization of human spiritual needs.
4.2. Human Needs Relevance Calculations
4.2.1. Min–Max Normalization
Min–max normalization is a common data normalization method used to scale data to a specific range. This normalization method maps the data between a given minimum and maximum value, usually in the range [0, 1], through a linear transformation. The formula is as follows:
where Xnorm represents the normalized data, X represents the original data, Xmin represents the minimum value in the dataset, and Xmax represents the maximum value in the dataset.
4.2.2. Spearman Correlation Coefficient
The basic idea of Spearman correlation is to perform rank transformation for two variables X and Y, which are represented by ranks RX and RY; then, the correlation between RX and RY is calculated according to the method of Pearson correlation analysis, and the Spearman correlation coefficient is defined as the Pearson correlation coefficient between the rank variables. For samples with sample size i, i raw data were converted into rank data, and the calculation formula was as follows:
where Xi is the i-th sample of X, Yi is the i-th sample of Y, is the average of the X samples, and is the average of the Y samples, is Spearman Correlation Coefficient.
4.3. Calculation of Ecosystem Service Value
ES value is defined as the value of the products and services provided to the entire society by the ecosystems of a country or region through their functions and is used to measure the ES output of ecosystems and their ability to meet human needs. The ESs calculated in this paper are all services originally provided by the ecosystem; that is, they are calculated through the value generated in the current area and do not involve the value of services generated by neighboring ecosystems. On the basis of the equivalent factor table revised by Xie Gaodi et al. [54], combined with the characteristics of the karst area in Hechi, Guangxi, and the theory of human needs, an equivalent factor table is compiled (Table 3). The standard unit of the ES value equivalent factor refers to the economic value of the natural food production per hectare of the average annual yield of farmland. According to the research of Xie [55], the economic value of a standard unit of ES value equivalent factor is equal to one-seventh of the market value of the average grain yield per year. The calculation formula is as follows.
Table 3.
Table of factors for the equivalent value of ES.
In the equation, D represents the value of the standard unit ES value equivalent factor; o denotes the type of food crop; A is the total area of all food crops planted; ao is the planting area of the o-th crop; po is the average yield per unit area of the o-th food crop; and qo is the average price of the o-th food crop.
4.3.1. Construction of the Spatiotemporal Dynamic Equivalent Table for Ecosystem
Service Value per Unit Area
Considering the variability in the provisioning of ESs across different times and spaces [9] and on the basis of the characteristics of karst regions and the relevant experiences of scholars [56], a spatiotemporal dynamic equivalent table for ES values was constructed via the method of adjusting the spatiotemporal dynamics factors of NPP, precipitation, and slope regulation.
In the equation, Fim represents the unit area value equivalent of the adjusted ES function of type i in ecosystem type m; Fm denotes the value equivalent of the m-th ES of the ecosystem type before adjustment; and Nx indicates the x-th spatiotemporal regulation factor of the ecosystem type.
The calculation method for the spatiotemporal regulation factor of NPP (N1) is as follows:
In the equation, Pj represents the annual average (NPP of the study area in grams of carbon per square meter per year (gC·m−2·a−1)), and P represents the national average annual NPP (gC·m−2·a−1).
The calculation method for the spatiotemporal regulation factor of precipitation (N2) is as follows:
In the equation, Rj refers to the annual average precipitation per unit area (mm·hm−2) in the study area, and R represents the national annual average precipitation per unit area (mm·hm−2).
Considering that most of the land in the karst region of southwest China is difficult to utilize because of its topography and geomorphology, the topographic relief spatiotemporal regulation factor (N3) is used for adjustment. Additionally, because higher average slopes are more challenging to utilize, the calculation method is as follows:
In the equation, Sj represents the average slope within the study area, whereas S denotes the national average slope.
The dynamic equivalent table of the ES value per unit area for the different regions and years after the above adjustments is shown in Table 4.
Table 4.
Equivalent value of ecosystem services per unit area (yuan/hm2).
4.3.2. Construction of the Ecological Payment Willingness Coefficient
Payment willingness refers to the estimation or cost that consumers are willing to pay for the goods and services they receive [57]. Under market economy conditions, the best measure of consumer willingness to pay for a final consumer good is the market price itself. However, ESs generally lack market price and value information; accurately measuring consumer willingness to pay on the basis of market prices is not possible. Therefore, referring to relevant scholars [58], a development stage coefficient that can characterize the level of willingness to pay is designed on the basis of a simplified Pielou growth curve [59] and an Engel coefficient representing people’s living standards to construct an ecological payment willingness coefficient to correct the value of ESs.
In the equation, Wc represents the ecological payment willingness index for year c; e is the base of the natural logarithm; and Enc is the Engel coefficient for year i in the study area.
Therefore, the formula for calculating the value of ESs is as follows.
In the equation, represents the total value of ESs, and Si represents the area of the i-th type of ecosystem in the study area.
4.4. Calculation of Center of Gravity Shift
In this paper, we use the Centroid Migration tool in ArcGIS to visualize the spatial and temporal shift of the center of gravity of the supply and demand of different ecosystem services. Center of gravity shift is usually a process used in geospatial analysis to study the change of the location of the center of gravity of a specific object or region (e.g., city, population, land use, etc.). The center of gravity, also known as the center of mass, is the average position of a geometric shape. The center of gravity is the weighted average position of all points in a geometric shape, and its position depends on the boundaries and area of the shape. In GIS, the center of gravity can be used to represent the center of a feature within an area. The calculation method is as follows: firstly, the supply and demand of ecosystem services in each county and region in different years as calculated above are imported into a vector map, and the center of gravity of the supply and demand of each ecosystem service in different time periods is calculated using the “Center of Mean” tool in ArcGIS. The “Point Set to Line” tool was then used to derive the trajectory of the center of gravity.
5. Research Results
5.1. Spatiotemporal Characteristics of Ecosystem Services
According to relevant scholars, the study area was divided via a grid method to express the spatial distribution of ESs. Grid cells of size 1 km × 1 km were selected for the spatial distribution characteristic study [60]. The natural breakpoint method was used to divide the service function values into five regions, resulting in areas with low, relatively low, moderate, relatively high, and high ES function values. Referring to the delineation of the Hu Huanyong Line [61], an 80 per cent line is used to distinguish the high-value areas in the study area. The high-value area on the right side of the line accounts for 80 per cent of the total high-value area, allowing for a clearer spatial representation of changes in ecosystem service provision within the study area, as shown in Figure 6.
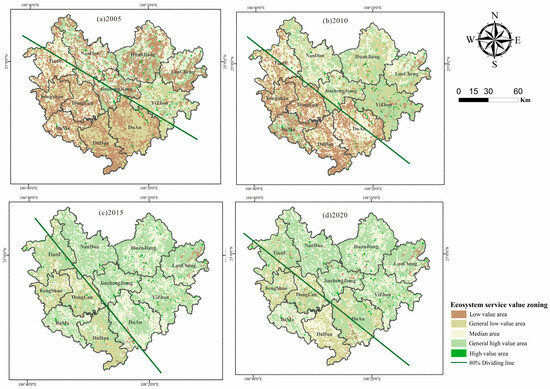
Figure 6.
Zoning map of ecosystem service values.
Overall, from 2005 to 2020, there was a clear upward trend in the total value of ESs at the regional scale, but a slight decline was observed in 2020 compared with 2015. The total area of high-value and moderately high-value areas increased from 5236.4 km2 in 2005 to 16171.15 km2 in 2020, whereas the total area of low-value areas decreased from 11841.27 km2 in 2005 to 747.2 km2 in 2020. The overall trend shows a significant increase in high-value areas and the decrease in low-value areas. Especially in 2015, a significant transformation of low-value areas in the southwestern region into moderate- and relatively low-value areas was observed. High-value area demarcation lines were delineated to better observe the spatial changes in ES values within the study area. Over time, these lines continuously moved southward, indicating a continuous extension of high-value and moderately high-value areas from northeast to southwest in the study area. However, in 2020, there was a slight northward shift in the high-value area demarcation lines, along with a counterclockwise rotation of approximately 20 degrees.
5.2. Analysis of Human Demand Correlations
First, the results of the monetization of various human demands were standardized. Second, the standardized results were imported into Origin 2020 software for Spearman correlation analysis to calculate the relationships between various human demands, as shown in Figure 7.
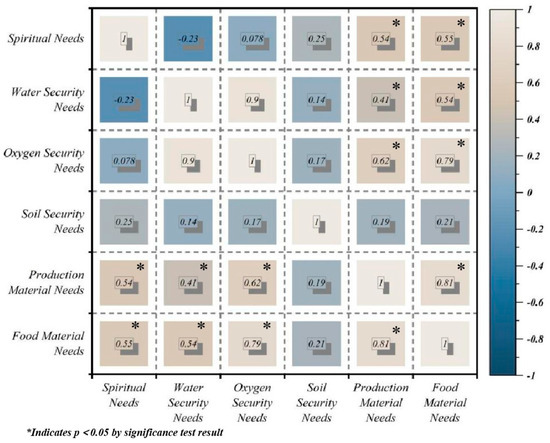
Figure 7.
Human Needs Correlation Analysis Chart.
Overall, generally positive correlations are found between the various demands. Spiritual needs and material needs are generally significantly positively correlated, with an average correlation coefficient of 0.54, and they are not strongly correlated with safety needs. Safety needs are positively correlated with material needs, with an average correlation coefficient of 0.6. In terms of specific subcategories of demands, spiritual needs are weakly negatively correlated with water safety needs, with a correlation coefficient of −0.23, and they are not correlated with oxygen safety needs. They are weakly positively correlated with soil safety needs and positively correlated with production material needs and life material needs. There is a strong correlation between water safety needs and oxygen safety needs, with a correlation coefficient of 0.9. However, soil safety needs are not strongly correlated with any other needs and exhibit weak positive correlations. There is a strong positive correlation between production material needs and life material needs.
5.3. Analysis of Ecosystem Service Supply and Demand
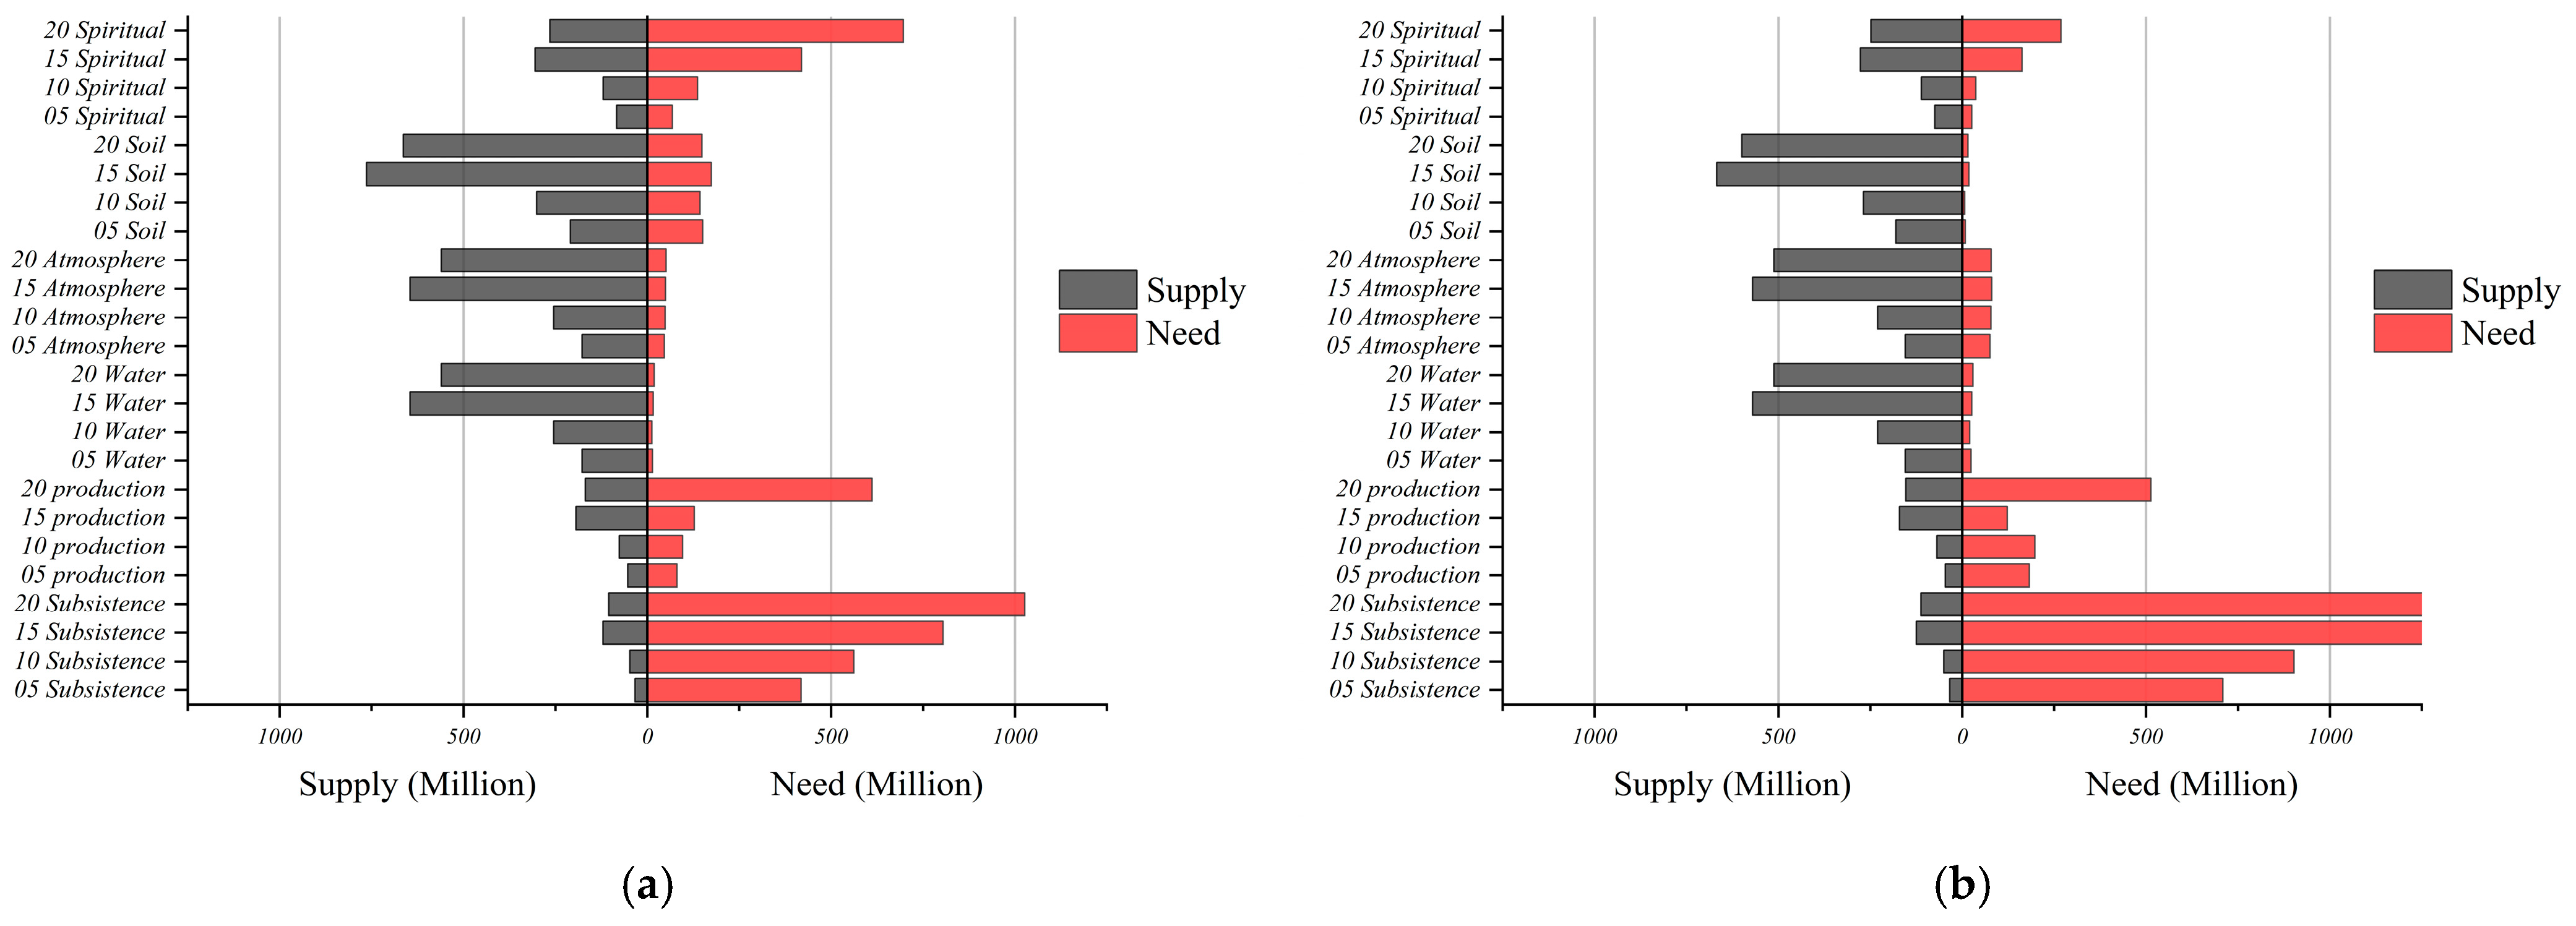
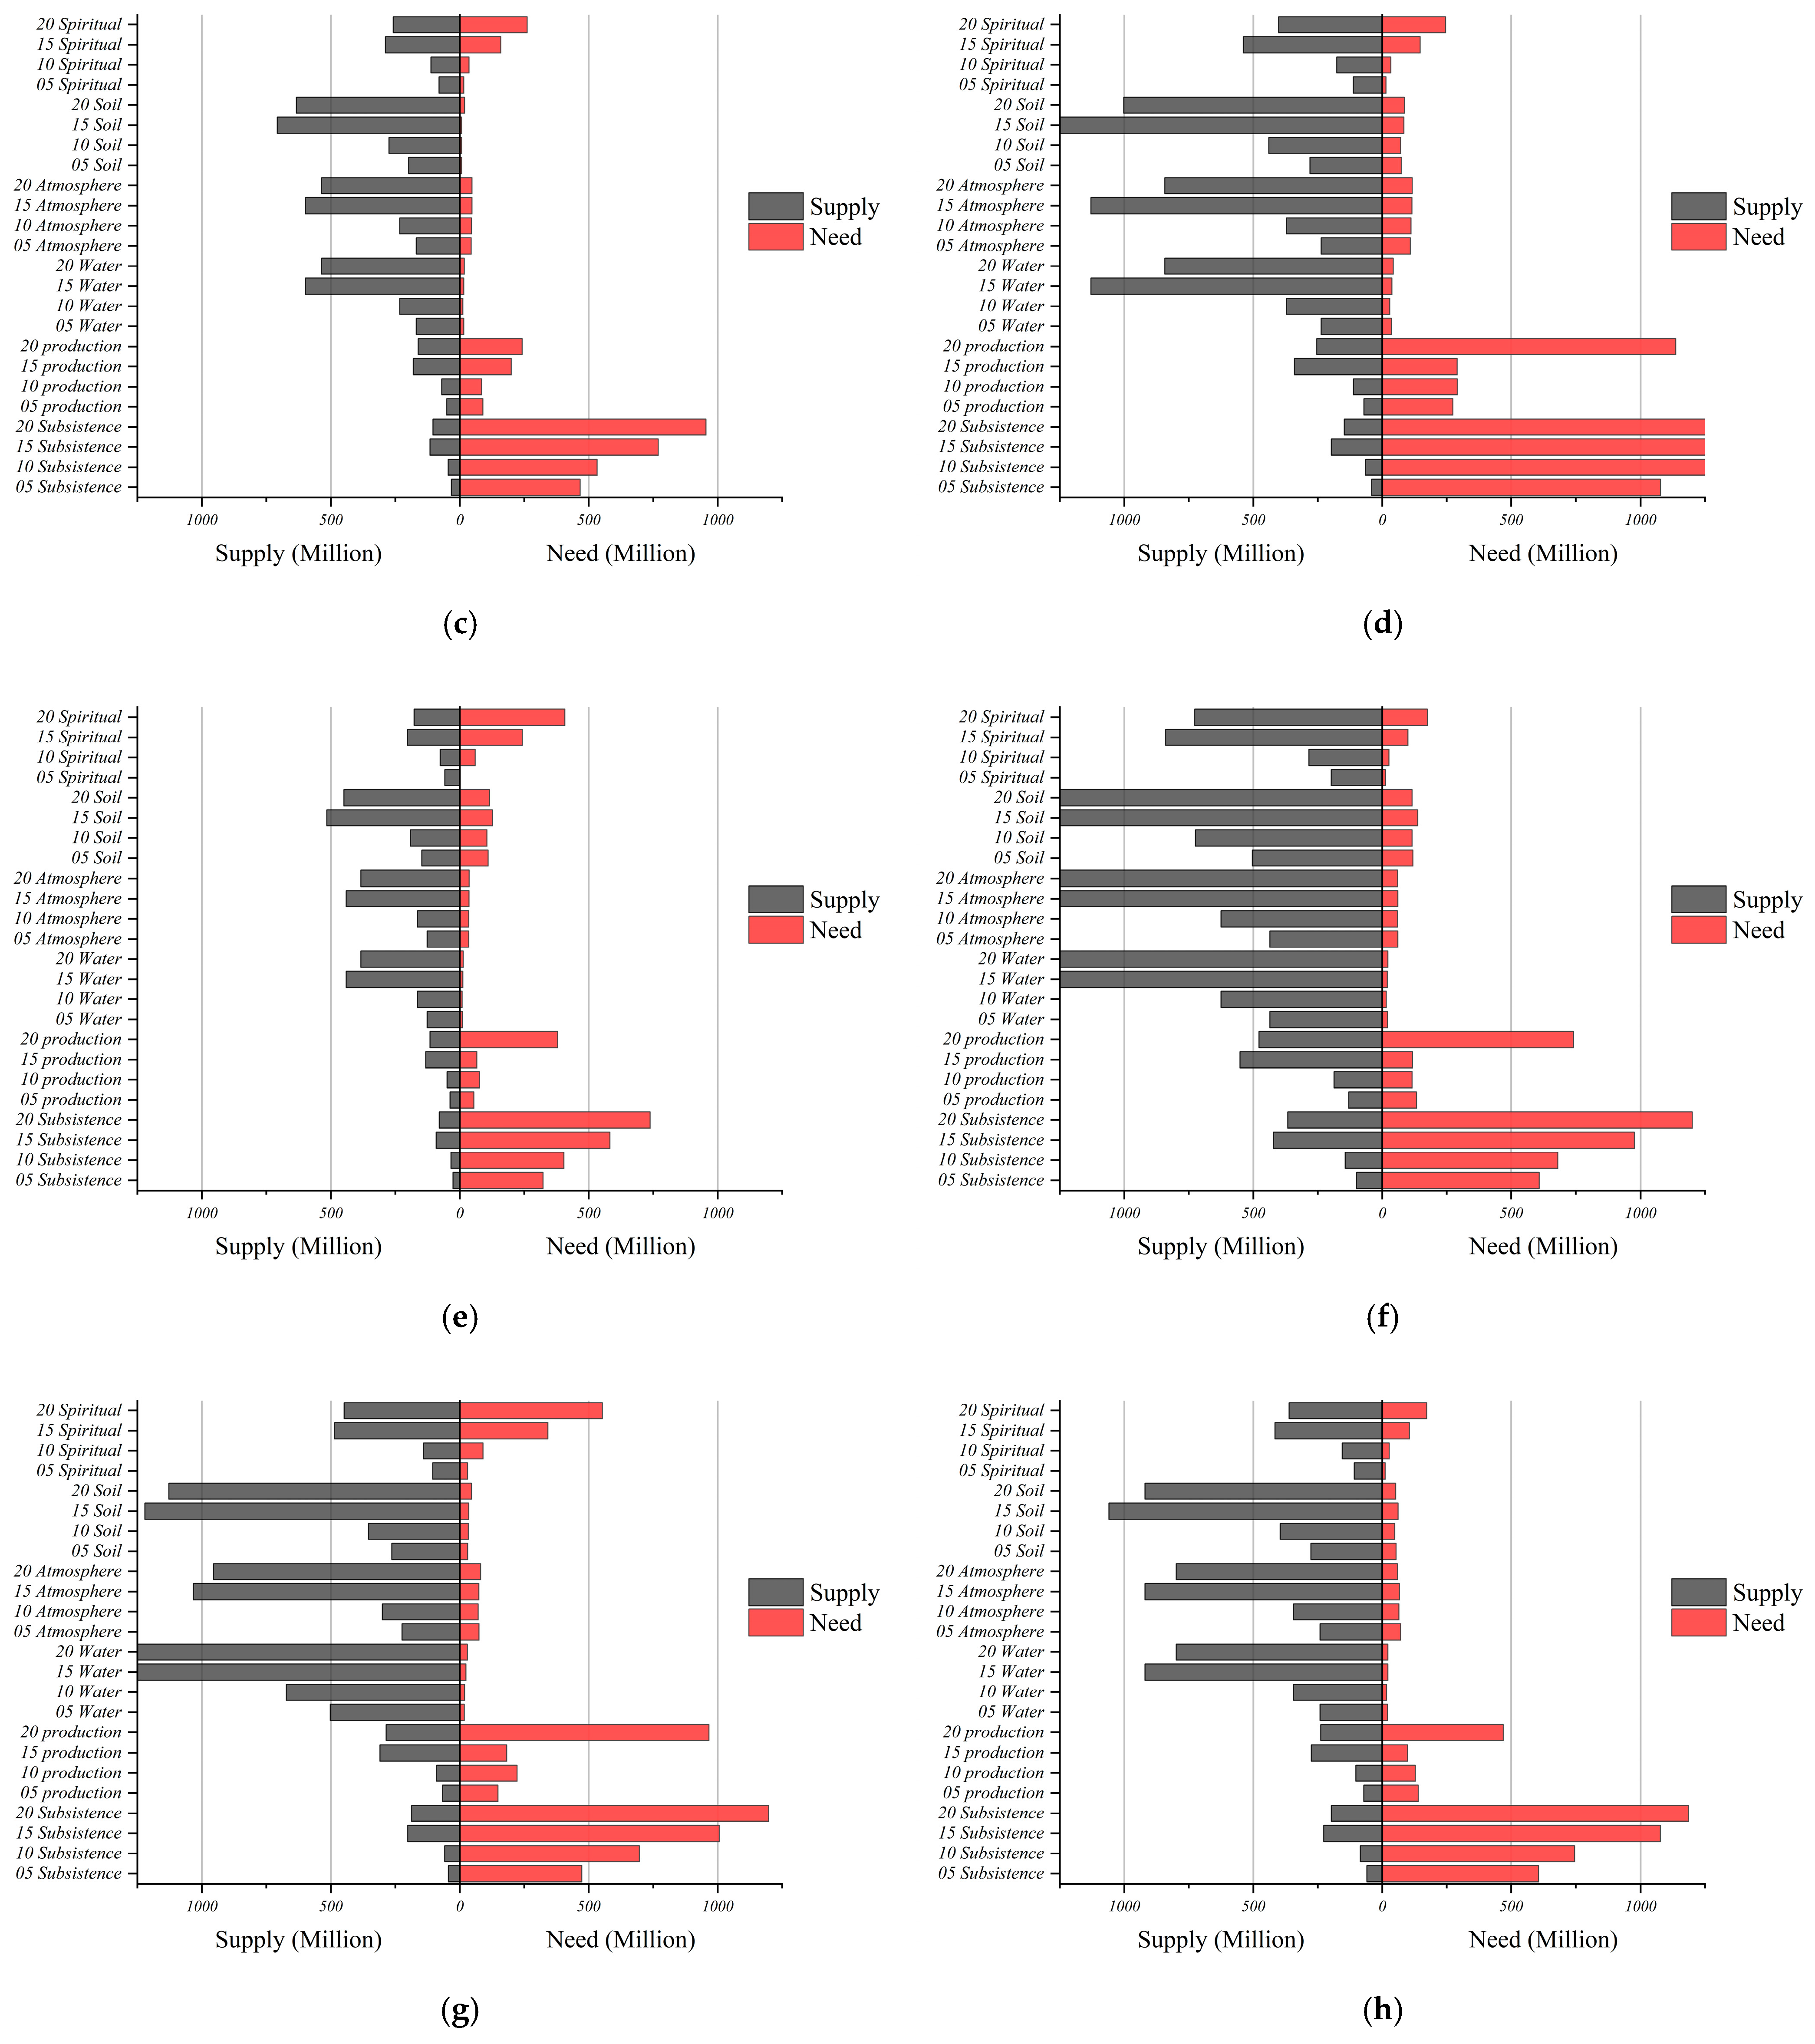
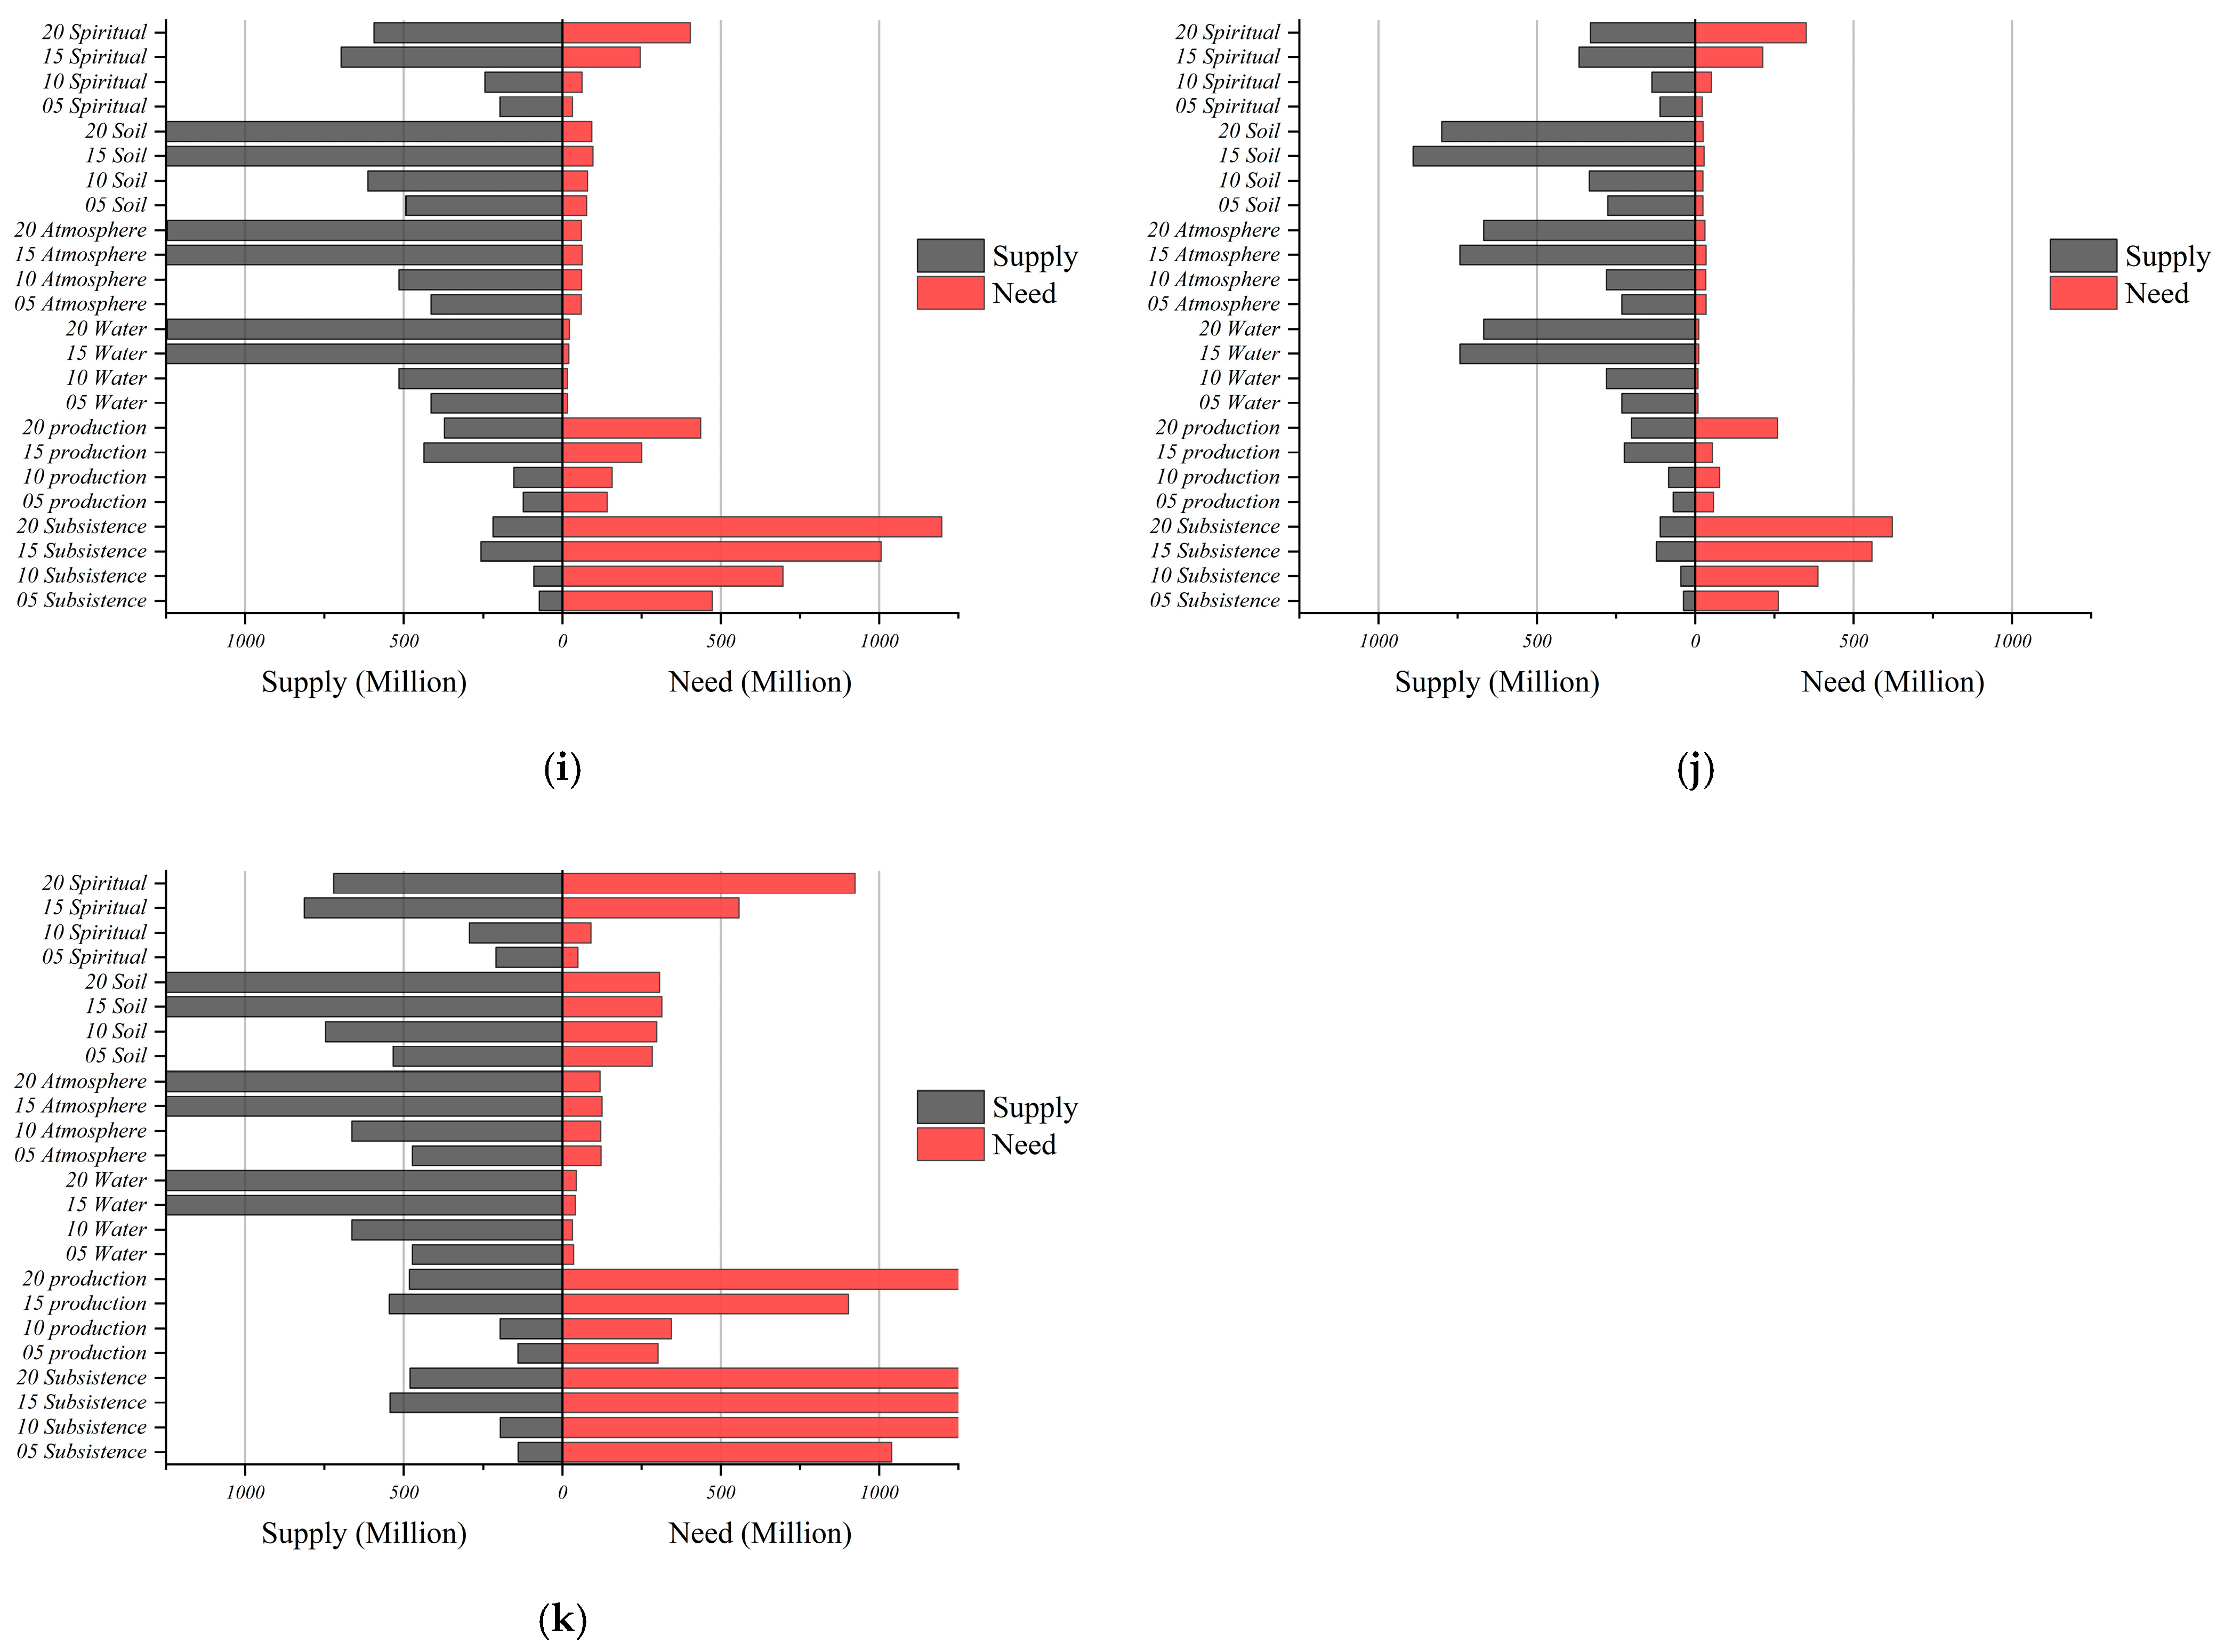
Specific details of Figure 8 are provided in Appendix A. In general, the supply of living materials in all regions is far below demand. Among them, the Jingcheng River has the largest gap between the supply and demand for living materials. The ability of most regions to supply production materials cannot meet increasingly growing human needs. In some regions, such as Huanjiang and Nandan, the supply and demand for production materials were in a balanced state before 2015. However, after 2015, the demand for living materials increased rapidly, leading to an insufficient supply of production materials in these areas. Most regions far exceed the demand for safety, making this demand the main output subject of ESs in this study area. Notably, in terms of spiritual needs, both the supply and demand in the study area, except for Bama and Fengshan in 2020, are steadily increasing, where the supply in other areas can meet human needs.
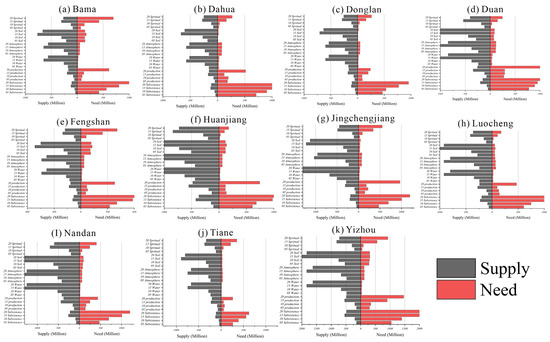
Figure 8.
Supply and demand diagram for ecosystem services.
Further calculations were conducted to determine the difference between the supply and demand of various services. Du’an experienced the most severe shortage of supplies of living material in 2020, reaching CNY −2191.92 million. This occurred because Du’an has the largest area of rocky mountains in Hechi City, accounting for 89% of the total area, with less than 0.7 acres of arable land per capita, resulting in relatively low levels of food production. However, the area has a large population compared with the national average and scarce arable land, resulting in a severe shortage of living material supplies. Jingcheng River District had the most abundant supply of water safety needs in 2015 and contributed a surplus of CNY 2299.34 million in water supply value to the ecosystem.
5.4. Analysis of the Spatial Shift in the Center of Gravity of Supply and Demand for Ecosystem Services
After the quantitative relationship between the supply and demand of ESs was calculated, the spatial situation of the supply and demand of ESs was further analyzed. Then, the centers of gravity of the supply and demand of various types of ESs from 2005 to 2020 were calculated; the results are shown in Figure 9.
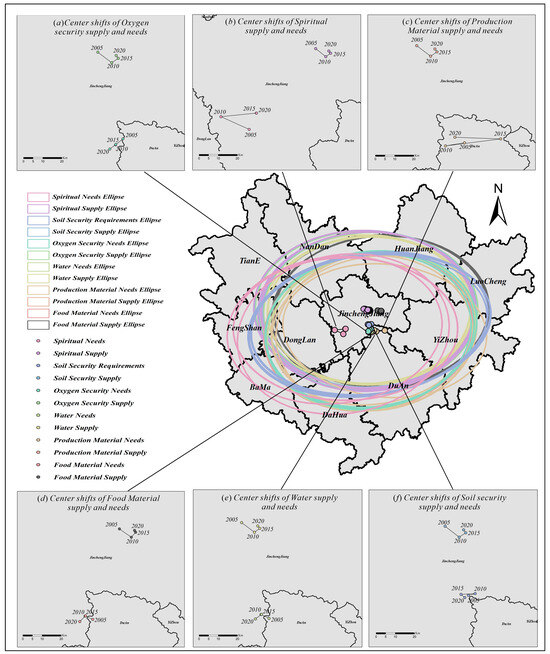
Figure 9.
Shift in the center of gravity of supply and demand for ecosystem services.
Overall, the centers of gravity of supply and demand of all types are basically distributed within Jinchengjiang District, and only the center of gravity of demand for production substances is in northern Du’an County. All types of demand centers of gravity are distributed on the south side of their corresponding supply centers of gravity. However, the oxygen safety demand center of gravity, as shown in Figure 9a, moved to the southwest by 1654.36 m in 2005, then slightly to the northeast, then to the southwest by 2911.06 m by 2020. The distance from the oxygen safety supply center of gravity increased by 639.15 m. Regarding the spiritual needs and supply center of gravity, as shown in Figure 9b, the spiritual needs center of gravity first moved to the northwest by 7178.75 m in 2005, then to the northeast by 8243.74 m, and then slightly moved to the northeast by 33.58 m in 2020. Compared with that in 2005, the distance between the center of gravity of the spiritual demand and the center of gravity of the supply had decreased by 2188.13 m in 2020. The center of gravity of the demand for production materials is shown in Figure 9c. The center of gravity of the demand first moved to the southwest by 3361.98 m, then to the northeast by 9707.93 m, and then to the northwest by 8001 m in 2020. In general, the center of gravity shifted to the northwest by 1933.82 m from 2005 to 2020, and the distance between the center of gravity of the demand for productive materials and the center of gravity of the supply was 3097.16 m lower in 2020 than in 2005. The center of gravity of the demand for food material is shown in Figure 9d. The needs center of gravity first shifted to the northwest by 1465.75 m, then slightly to the east, and in 2020, it shifted to the southwest by 1399.58 m. In total, it shifted to the west by 2314.67 m. The distance between the center of gravity of the demand for food materials and the center of gravity of supply in 2020 increased by 2100.44 m compared with that in 2005. The center of gravity of the demand for water security is shown in Figure 9e. Its center of gravity movement trajectory was similar to that of food material needs, both of which first moved to the northwest and then to the southwest. The distance between the center of gravity for needs and supply of water security in 2020 decreased by 1149.59 m compared with that in 2005. The soil security needs, as shown in Figure 9f, starting in 2005 first moved slightly to the northeast by 1215.41 m, then to the west by 2454.03 m, and finally to the southeast by 853.67 m in 2020. In 2020, the distance between the center of gravity for needs and supply of soil security decreased by 890.83 m compared with that in 2005. There are two categories of human needs where the distance between the center of demand and the corresponding center of supply has increased: the needs for oxygen security and the needs for food material. For all other needs, the distance between the center of demand and the corresponding center of supply has decreased.
6. Discussion and Limitations
6.1. Analyzing the Relationship from the Perspective of Human Needs Theory to Further Improve the Accuracy of Ecosystem Service Demand Calculations
By comparing the satisfaction levels of ES supply and demand across different regions, types, and times, clear development directions can be provided for the study area. The study area should enhance its ability to supply material needs, compensate for supply shortages, and maintain a surplus supply for water security and atmospheric security needs, which can be exported. This approach can achieve a dynamic balance between supply and needs through the output of ESs.
Current quantitative research on the demand for ecosystem services mostly calculates its quantity, such as per capita cereal consumption [62], demand for cultural services [63,64,65], demand for water resources [66], etc. The calculation of quantity has no intuitive knowledge of how much quantity is required [67] Moreover, the calculated demand is not comprehensive enough, only one type of supply and demand is calculated, and the comparability between demands is not strong, while the quantification of demand for value data can provide fast, low-cost, and comparable information for a large number of different ecosystems. Therefore, from the perspective of human needs theory, discussing the demand for ESs and establishing a complete system can improve the comprehensiveness of the discussion regarding the ES supply–demand relationship. Supply and demand always occur simultaneously and influence each other. The supply of ESs can change due to various human behaviors, and human needs are also affected by the supply situation, resulting in demands from different directions and at different levels. Compared with other scholars who use remote sensing images or raster data and other spatial data to calculate human needs at a holistic level [68], this study proposes a classification table of human needs. Furthermore, each type of demand is calculated separately with the county as the statistical unit. Calculating the problem from a demand perspective can bring the results closer to the real demand value and be more relevant to the theme of demand calculation. Calculations at the county level combine the minimum scale of human needs and human activities. The use of spatial ranges such as rasters or grids cannot depict the range of human activities, which occur only when human needs are generated. Therefore, whether from the supply or demand side, data are calculated separately from the perspective of each county, thus reflecting the uniqueness and universality of human needs. The study area shows that the northeastern part has a strong ability to supply ES values, and the southwestern part has a continuously increasing ability to supply ESs, which is consistent with the spatiotemporal change characteristics of ES functions in the southwestern karst region studied by Jiang [69]. In the calculation of the centers of gravity of human demand and ecological service supply, the distances between the centers of gravity of oxygen safety demand and living material demand and their corresponding centers of gravity of supply increased, and the distances between the centers of gravity of the remaining demands and their corresponding centers of gravity of supply decreased. This finding indicates that the difficulty of fulfilling most of the supply–demand relationships is decreasing and that the demands are being fulfilled in a more simplified way.
6.2. Mismatch Between In Situ Ecosystem Service Supply and Demand Requires External Ecosystem Inputs
ESs involve processes of transfer, transformation, and transmission, leading to cross-regional inputs or outputs. According to convection–diffusion theory in fluid mechanics [70], convection relies on the physical quantity carried by macroscopic fluid movements. It involves the process of mass or energy transfer on the basis of pressure differences (gravity, buoyancy, interaction forces, driving forces, etc.), achieved through the direct application of external pressure on the fluid or by rotating and moving a rigid body to induce fluid motion (e.g., water flowing from upstream to downstream). The calculations of the supply and demand values of the ESs in this study indicate that surplus services from the supply side flow to the high-demand side due to “pressure differences,” leading to a dynamic balance in space and time. However, the supply of ESs still needs to meet certain conditions. For example, in the Tibetan region, oxygen is scarce, but owing to its high altitude, oxygen cannot be supplied from the outside, which also indicates that the input and output of ESs need to follow the physical laws of real life.
From the perspective of different administrative divisions, Yizhou District, Luocheng County, and Huanjiang County have consistently maintained high ES values, whereas Donglan County, Fengshan County, Bama County, and Dahua County have shown significant increases, with many low-value areas transforming into nearly non-existent areas. This phenomenon is due mainly to severe rocky desertification in the southwestern region of Hechi City, resulting in low outputs per unit area [71] and consequently lower values of ESs. However, many rocky desertification control projects have been carried out in the southwestern region of Hechi City since 2013, reducing the area of rocky desertification and improving the various functions of the land [72], leading to a steady increase in ES functions. The ESs in the northeastern part of the study area have remained high since 2005, as this area is characterized by abundant high-quality forestland [73]. The calculations revealed that the habitat quality in the northeastern part of Hechi City is high, with low habitat destruction, and the terrain in the eastern part is relatively flat, with fewer karst landforms, improving the accessibility of the various functions of the ecosystem for humans. It is worth noting that, in terms of spiritual demand, both supply and demand in the study area are on a steady upward trend, with supply able to meet human demand in all areas except Bama and Fengshan in 2020. Bama has been heavily promoting recreation tourism since 2015, developing around the three core sectors of health food, health services, and health science and technology, attracting a large number of tourists to come and live in recreation [74], leading to a large increase in human spiritual demand in the region, so regions with high-quality natural conditions can draw on the recreation tourism policy of Bama County for reference.
Based on the results, it can be concluded that the ecosystem products and functions generated in situ within the study area are insufficient to fully meet the well-being needs of the local residents and beneficiaries [75]. Nonetheless, a significant population resides in this area, indicating that ecosystem services possess a degree of fluidity. This necessitates the acquisition of additional inputs of ecosystem services from external sources to fulfill the ecological well-being of the regional population. Human activities can only occur if there is a dynamic equilibrium relationship between supply and demand, illustrating that there is a process of external input of ecosystem services into the interior of the study area in order to achieve a balance between supply and demand. Therefore, the significant difference in in situ supply and demand values obtained in this study is in line with the real situation and is also a research direction worthy of further exploration.
6.3. Diverse Relationships Among Human Needs
China’s Ecological Conservation Redline policy provides important support for guaranteeing the functions of ecosystems, maintaining biodiversity, and supporting sustainable economic and social development, thus further promoting the harmonious coexistence of human activities and natural resources and the unity of economic development and ecological benefits [76,77]. In the process of delineating ecological redlines, the goal is to protect ecological land, maintain ecological functions, and provide better ESs. Since the beneficiaries of ESs are humans, the delineation and management of ecological redlines are also driven by human needs. It is essential to discuss human needs in the context of ESs to enhance the current research, which focuses solely on the supply side of ESs, and improve the concept of ESs by discussing the relationship between supply and demand.
The definition of human needs was combined with human need interrelationships and hierarchies. The findings indicate that material needs have a certain hierarchical relationship with the other two types of needs, whereas spiritual needs and safety needs belong to the same hierarchical level. The negative correlation between water safety needs and spiritual needs can be understood as follows: when two needs are at the same level and when one of the needs is satisfied to a certain extent, the demand generated flows to higher-level needs. Therefore, the correlation between needs at the same level will show a partial negative correlation. The weak positive correlation between soil safety needs and all other needs indicates that there is a certain degree of independence among needs within the same category. Furthermore, all needs have an unchangeable demand for land, and the functions of land are limited by its availability and supportive attributes. Thus, differences in other factors, such as living conditions and cultural groups, have relatively small impacts on the demand for land. Therefore, the relationship between human needs can be used to formulate policies to meet multiple types of needs in order to improve the targeted provision of ecosystem services. For example, spiritual needs and security needs belong to the same level, and it has been proved that the progress of meeting them is basically the same, so policies can be formulated for these two types of needs, and the efficiency of policy implementation can be improved.
6.4. Limitations and Prospects
In the study of human demand for ESs, there is still an easily understandable fact; that is, some needs vary due to location, time, and social–political background. What are the differences between the demands of contemporary society and those of preindustrial society, between Western and Eastern cultures, between the Northern and Southern Hemispheres of the globe, or even between different regions within the same city? This topic is also worthy of further discussion.
In the quantification of supply and demand for ecosystem services, the calculation of supply incorporates the willingness to pay. Although we have optimized the willingness to pay index to make the quantification results more aligned with actual conditions, willingness to pay is a coefficient derived from market competition. As such, further adjustments are needed to better fit the non-competitive value of ecosystem services.
On the demand quantification side, using tourism revenue as a measure of spiritual demand may lead to misunderstandings about the target demographic, and this approach is also not comprehensive enough [78]. Therefore, the quantification of spiritual demand based on valuation needs to consider further methods to enhance the comprehensiveness of the quantification and clarify the entities being quantified. Validation of the obtained ecosystem service demand results improves the scientific validity of the quantitative results.
On the basis of the research in this paper, the research scale should be expanded, and the spatial heterogeneity of human needs should be explored on a larger scale. The calculation of the ESNV on the basis of regional economic data in this paper is limited, and the ESNV of multiple regions cannot be calculated conveniently and quickly. The next step should be to determine a calculation method for multisource remote sensing data to invert the ESNV of different regions. We propose that telecorrelations between human needs can be found in different regions; this theory deserves further study. After calculating the supply–demand matching relationship on a larger scale, the results of surplus supply and demand shortage can be obtained. Furthermore, an exploration of the form and rules that should govern the flow of surplus ES functions would be worthwhile.
7. Conclusions
This study provides a theoretical basis for the demand for ecosystem services grounded in human needs theory. By using the value equivalence and valuation calculations of ecosystem service values, we analyzed the supply and demand values of ecosystem services in the study area. The research on valuation theory enhances the scientific rigor of measuring ecosystem service demand while also making it more comprehensible. Additionally, correlation analysis was used to determine the impact relationships between different human needs. The results are as follows:
(1) In terms of the supply of ESs in the study area, the overall trend showed a significant increase in the high-value areas and a significant decrease in the low-value areas. Specifically, the ES values in Yizhou District, Luocheng County, and Huanjiang County have consistently remained relatively high, whereas those in Donglan County, Fengshan County, Bama County, and Dahua County have significantly increased, with many low-value areas transforming into nearly no low-value areas.
(2) Overall, there is a positive correlation among different human needs. Spiritual needs and material needs generally have a significant positive correlation, with an average correlation coefficient of 0.54. There is no significant correlation between safety needs and other needs, whereas safety needs and material needs are positively correlated, with an average correlation coefficient of 0.6. The definitions of human needs were combined; the results indicate that a certain hierarchical relationship exists between material needs and the other two types of needs, whereas spiritual needs and safety needs have the same hierarchical level.
(3) Overall, the supply of living materials in all areas is far below demand; the supply capacity of production materials in most areas cannot meet the growing human demands; the supply of safety needs in all regions far exceeds demand; and in terms of spiritual needs, the supply and demand in the study area are steadily increasing. The exceptions are Bama and Fengshan in 2020, where the supply in other regions could meet human needs.
(4) The centers of gravity of various types of supply and demand are basically distributed within Jinchengjiang District, and only the center of gravity of production material demand is in northern Du’an County. There are two types of centers of gravity of human demand, namely, the demand for oxygen safety and the demand for subsistence materials, whose distances from their corresponding centers of gravity of supply have increased. The distances between the remaining centers of gravity of demand and their corresponding centers of gravity of supply have decreased. The difficulty of meeting most supply and demand relationships is decreasing, and needs are being met more easily.
(5) The capacity of the study area to supply material needs should be increased to mitigate shortages. Additionally, surplus supplies should be maintained for water safety and air safety needs and exported externally to achieve a dynamic balance between supply and demand through the output of ESs.
Author Contributions
Conceptualization, J.W. and M.F.; methodology, J.W., X.H. and Y.W.; software, X.H. and Y.W.; validation, M.F., H.W. and J.W.; formal analysis, J.W. and M.F.; investigation, J.W., X.H. and Y.W.; resources, M.F. and H.W.; data curation, J.W.; writing—original draft preparation, J.W.; writing—review and editing, J.W. and M.F.; visualization, J.W., X.H. and Y.W.; supervision, M.F.; project administration, M.F. and H.W.; funding acquisition, M.F. and H.W. All authors have read and agreed to the published version of the manuscript.
Funding
This research was jointly supported by the National Natural Science Foundation of China (Grant No. 41771204).
Data Availability Statement
The original contributions presented in the study are included in the article, further inquiries can be directed to the corresponding author.
Acknowledgments
Thanks to the National Ecosystem Science Data Center, National Science & Technology Infrastructure of China, for providing data support.
Conflicts of Interest
The authors declare no conflicts of interest.
Appendix A
The supplementary subplot of Figure 8 is shown below.
References
- Zeng, J.; Cui, X.Y.; Chen, W.X.; Yao, X.W. Ecological management zoning based on the supply-demand relationship of ecosystem services in China. Appl. Geogr. 2023, 155, 12. [Google Scholar] [CrossRef]
- Liu, Z.; Wang, S.; Fang, C. Spatiotemporal evolution and influencing mechanism of ecosystem service value in the Guangdong-Hong Kong-Macao Greater Bay Area. J. Geogr. Sci. 2023, 33, 1226–1244. [Google Scholar] [CrossRef]
- Fang, X.N.; Ma, Q.; Liu, Z.F.; Wu, J.G. Landscape sustainability and land sustainability: A bibliometric analysis. Land Use Policy 2024, 147, 14. [Google Scholar] [CrossRef]
- Peng, J.; Liu, Y.X.; Corstanje, R.; Meersmans, J. Promoting sustainable landscape pattern for landscape sustainability. Landsc. Ecol. 2021, 36, 1839–1844. [Google Scholar] [CrossRef]
- Jeffers, E.S.; Nogue, S.; Willis, K.J. The role of palaeoecological records in assessing ecosystem services. Quat. Sci. Rev. 2015, 112, 17–32. [Google Scholar] [CrossRef]
- Harrison, P.; Berry, P.; Simpson, G.; Haslett, J.; Blicharska, M.; Bucur, M.; Dunford, R.; Egoh, B.; Garcia-Llorente, M.; Geamănă, N. Linkages between biodiversity attributes and ecosystem services: A systematic review. Ecosyst. Serv. 2014, 9, 191–203. [Google Scholar] [CrossRef]
- Liu, W.; Zhan, J.; Zhao, F.; Yan, H.; Zhang, F.; Wei, X. Impacts of urbanization-induced land-use changes on ecosystem services: A case study of the Pearl River Delta Metropolitan Region, China. Ecol. Indic. 2019, 98, 228–238. [Google Scholar] [CrossRef]
- Feng, Z.; Jin, X.; Chen, T.; Wu, J. Understanding trade-offs and synergies of ecosystem services to support the decision-making in the Beijing–Tianjin–Hebei region. Land Use Policy 2021, 106, 105446. [Google Scholar] [CrossRef]
- Castro, A.J.; Verburg, P.H.; Martín-López, B.; Garcia-Llorente, M.; Cabello, J.; Vaughn, C.C.; López, E. Ecosystem service trade-offs from supply to social demand: A landscape-scale spatial analysis. Landsc. Urban Plan. 2014, 132, 102–110. [Google Scholar] [CrossRef]
- Bateman, I.J.; Harwood, A.R.; Mace, G.M.; Watson, R.T.; Abson, D.J.; Andrews, B.; Binner, A.; Crowe, A.; Day, B.H.; Dugdale, S. Bringing ecosystem services into economic decision-making: Land use in the United Kingdom. Science 2013, 341, 45–50. [Google Scholar] [CrossRef]
- Bagstad, K.J.; Johnson, G.W.; Voigt, B.; Villa, F. Spatial dynamics of ecosystem service flows: A comprehensive approach to quantifying actual services. Ecosyst. Serv. 2013, 4, 117–125. [Google Scholar] [CrossRef]
- Jones, L.; Norton, L.; Austin, Z.; Browne, A.; Donovan, D.; Emmett, B.; Grabowski, Z.; Howard, D.; Jones, J.P.; Kenter, J. Stocks and flows of natural and human-derived capital in ecosystem services. Land Use Policy 2016, 52, 151–162. [Google Scholar] [CrossRef]
- Liu, W.; Zhan, J.Y.; Zhao, F.; Zhang, F.; Teng, Y.M.; Wang, C.; Chu, X.; Kumi, M.A. The tradeoffs between food supply and demand from the perspective of ecosystem service flows: A case study in the Pearl River Delta, China. J. Environ. Manag. 2022, 301, 10. [Google Scholar] [CrossRef] [PubMed]
- Wilkins, E.J.; Chikamoto, Y.; Miller, A.B.; Smith, J.W. Climate change and the demand for recreational ecosystem services on public lands in the continental United States. Glob. Environ. Chang. 2021, 70, 12. [Google Scholar] [CrossRef]
- Zhao, H.; Li, C.; Gao, M. Investigation of the relationship between supply and demand of ecosystem services and the influencing factors in resource-based cities in China. Sustainability 2023, 15, 7397. [Google Scholar] [CrossRef]
- Chen, Y.; Qiao, X.; Yang, Y.; Zheng, J.; Dai, Y.; Zhang, J. Identifying the spatial relationships and drivers of ecosystem service supply–demand matching: A case of Yiluo River Basin. Ecol. Indic. 2024, 163, 112122. [Google Scholar] [CrossRef]
- Jiang, B.; Chen, Y.; Bai, Y.; Xu, X. Supply–Demand Coupling Mechanisms for Policy Design. Sustainability 2019, 11, 5760. [Google Scholar] [CrossRef]
- Wei, H.; Fan, W.; Wang, X.; Lu, N.; Dong, X.; Zhao, Y.; Ya, X.; Zhao, Y. Integrating supply and social demand in ecosystem services assessment: A review. Ecosyst. Serv. 2017, 25, 15–27. [Google Scholar] [CrossRef]
- Martín-López, B.; Iniesta-Arandia, I.; García-Llorente, M.; Palomo, I.; Casado-Arzuaga, I.; Amo, D.G.D.; Gómez-Baggethun, E.; Oteros-Rozas, E.; Palacios-Agundez, I.; Willaarts, B. Uncovering ecosystem service bundles through social preferences. PLoS ONE 2012, 7, e38970. [Google Scholar] [CrossRef]
- Ayanu, Y.Z.; Conrad, C.; Nauss, T.; Wegmann, M.; Koellner, T. Quantifying and mapping ecosystem services supplies and demands: A review of remote sensing applications. Environ. Sci. Technol. 2012, 46, 8529–8541. [Google Scholar] [CrossRef]
- Baró, F.; Haase, D.; Gómez-Baggethun, E.; Frantzeskaki, N. Mismatches between ecosystem services supply and demand in urban areas: A quantitative assessment in five European cities. Ecol. Indic. 2015, 55, 146–158. [Google Scholar] [CrossRef]
- Larondelle, N.; Lauf, S. Balancing demand and supply of multiple urban ecosystem services on different spatial scales. Ecosyst. Serv. 2016, 22, 18–31. [Google Scholar] [CrossRef]
- Peng, J.; Wang, X.; Liu, Y.; Zhao, Y.; Xu, Z.; Zhao, M.; Qiu, S.; Wu, J. Urbanization impact on the supply-demand budget of ecosystem services: Decoupling analysis. Ecosyst. Serv. 2020, 44, 101139. [Google Scholar] [CrossRef]
- Yao, J.; Chen, N.; Liu, M.; Chen, W.; He, X. An analysis of the co-benefits of the supply–demand for multiple ecosystem services for guiding sustainable urban development. Ecol. Indic. 2023, 147, 109917. [Google Scholar] [CrossRef]
- Shen, J.S.; Li, S.C.; Wang, H.; Wu, S.Y.; Liang, Z.; Zhang, Y.T.; Wei, F.L.; Li, S.; Ma, L.; Wang, Y.Y.; et al. Understanding the spatial relationships and drivers of ecosystem service supply-demand mismatches towards spatially-targeted management of social-ecological system. J. Clean Prod. 2023, 406, 14. [Google Scholar] [CrossRef]
- Sun, R.; Jin, X.B.; Han, B.; Liang, X.Y.; Zhang, X.L.; Zhou, Y.K. Does scale matter? Analysis and measurement of ecosystem service supply and demand status based on ecological unit. Environ. Impact Assess. Rev. 2022, 95, 12. [Google Scholar] [CrossRef]
- Jia, Q.Q.; Jiao, L.M.; Lian, X.H.; Wang, W.L. Linking supply-demand balance of ecosystem services to identify ecological security patterns in urban agglomerations. Sust. Cities Soc. 2023, 92, 14. [Google Scholar] [CrossRef]
- Villamagna, A.M.; Angermeier, P.L.; Bennett, E.M. Capacity, pressure, demand, and flow: A conceptual framework for analyzing ecosystem service provision and delivery. Ecol. Complex. 2013, 15, 114–121. [Google Scholar] [CrossRef]
- Schröter, M.; Barton, D.N.; Remme, R.P.; Hein, L. Accounting for capacity and flow of ecosystem services: A conceptual model and a case study for Telemark, Norway. Ecol. Indic. 2014, 36, 539–551. [Google Scholar] [CrossRef]
- Geijzendorffer, I.R.; Martín-López, B.; Roche, P.K. Improving the identification of mismatches in ecosystem services assessments. Ecol. Indic. 2015, 52, 320–331. [Google Scholar] [CrossRef]
- Foramitti, J. A framework for agent-based models of human needs and ecological limits. Ecol. Econ. 2023, 204, 107651. [Google Scholar] [CrossRef]
- Marek, F.; Oexle, N. The significance of social support after loss by suicide. Psychiatr. Prax. 2023, 50, 119–121. [Google Scholar]
- Ormel, J.; Lindenberg, S.; Steverink, N.; Verbrugge, L.M. Subjective well-being and social production functions. Soc. Indic. Res. 1999, 46, 61–90. [Google Scholar] [CrossRef]
- Maslow, A.H. A Dynamic Theory of Human Motivation. In Understanding Human Motivation; Howard Allen Publishers: London, UK, 1958. [Google Scholar]
- Greenberg, J.; Koole, S.L.; Pyszczynski, T.A. Handbook of Experimental Existential Psychology; Guilford Press: New York, NY, USA.
- Yu-chu, X.; Su-xin, Z.; Bing, L.; Yin-jun, Z.; Bao-qing, H. Spatial zoning for land ecological consolidation in Guangxi based on the ecosystem services supply and demand. J. Nat. Resour. 2020, 35, 217–229. [Google Scholar] [CrossRef]
- Costanza, R.; d’Arge, R.; De Groot, R.; Farber, S.; Grasso, M.; Hannon, B.; Limburg, K.; Naeem, S.; O’neill, R.V.; Paruelo, J. The value of the world’s ecosystem services and natural capital. Nature 1997, 387, 253–260. [Google Scholar] [CrossRef]
- Gómez-Baggethun, E.; Barton, D.N. Classifying and valuing ecosystem services for urban planning. Ecol. Econ. 2013, 86, 235–245. [Google Scholar] [CrossRef]
- Doyal, L.; Gough, I. A theory of human needs. Crit. Soc. Policy 1984, 4, 6–38. [Google Scholar] [CrossRef]
- Gasper, D. Conceptualising Human Needs and Wellbeing, in Wellbeing in developing countries: From theory to research. In Wellbeing in Developing Countries: From Theory to Research; Cambridge University Press: Cambridge, UK, 2007; pp. 1–29. [Google Scholar]
- Ekins, P.; Max-Neef, M. Real Life Economics; Routledge: London, UK, 2006. [Google Scholar]
- Tay, L.; Diener, E. Needs and subjective well-being around the world. J. Personal. Soc. Psychol. 2011, 101, 354. [Google Scholar] [CrossRef]
- Braybrooke, D. Meeting Needs; Princeton University Press: Princeton, NJ, USA, 2014; Volume 70. [Google Scholar]
- Wiggins, D. An Idea we Cannot do Without: What difference will it make (eg. to moral, political and environmental philosophy) to recognize and put to use a substantial conception of need? R. Inst. Philos. Suppl. 2005, 57, 25–50. [Google Scholar] [CrossRef]
- Bai, Y.; Wang, M.; Li, H.; Huang, S.; Alatalo, J. Ecosystem service supply and demand: Theory and management application. Acta Ecol. Sin. 2017, 17. [Google Scholar] [CrossRef]
- Vita, G.; Hertwich, E.G.; Stadler, K.; Wood, R. Connecting global emissions to fundamental human needs and their satisfaction. Environ. Res. Lett. 2019, 14, 014002. [Google Scholar] [CrossRef]
- Cardoso, R.; Sobhani, A.; Meijers, E. The cities we need: Towards an urbanism guided by human needs satisfaction. Urban Stud. 2022, 59, 2638–2659. [Google Scholar] [CrossRef]
- Leech, R.M.; Worsley, A.; Timperio, A.; McNaughton, S.A. Understanding meal patterns: Definitions, methodology and impact on nutrient intake and diet quality. Nutr. Res. Rev. 2015, 28, 1–21. [Google Scholar] [CrossRef] [PubMed]
- Feng, Y.; Tian, Y.; Zhu, J.; Xiao, W.; Li, Q. Evaluation of forest carbon fixation and oxygen release service value and heterotrophic respiration loss. Acta Ecol. Sin. 2020, 40, 5044–5054. [Google Scholar]
- Yuhua, Z.; Xuefang, W. Development of water pollutant discharge standards in China for more than 40 years. Environ. Pollut. Control 2016, 38, 99–104+110. [Google Scholar] [CrossRef]
- Shao, Q.; Liu, S.; Ning, J.; Liu, G.; Yang, F.; Zhang, X.; Niu, L.; Huang, H.; Fan, J.; Liu, J. Assessment of ecological benefits of key national ecological projects in China in 2000–2019 using remote sensing. Acta Geogr. Sin. 2022, 77, 2133–2153. [Google Scholar]
- Bureau, H.C.N.R. Hechi City Land Space Ecological Restoration Plan 2021–2035; Sino-German Cooperation on Climate Change: Beijing, China, 2021. [Google Scholar]
- Cui, F.Q.; Tang, H.P.; Zhang, Q.; Wang, B.J.; Dai, L.W. Integrating ecosystem services supply and demand into optimized management at different scales: A case study in Hulunbuir, China. Ecosyst. Serv. 2019, 39, 17. [Google Scholar] [CrossRef]
- Xie, G.; Zhang, C.; Zhang, C.; Xiao, Y.; Lu, C. The value of ecosystem services in China. Resour. Sci. 2015, 37, 1740–1746. [Google Scholar]
- Xie, G.; Zhang, C.; Zhang, L.; Chen, W.; Li, S. Improvement of the Evaluation Method for Ecosystem Service Value Based on Per Unit Area. J. Nat. Resour. 2015, 30, 1243–1254. [Google Scholar]
- Ni, W.; Zhang, X.; Yang, L.; He, Y.; Chen, W. Study on the Scale Effect of Ecosystem Service Value Estimation Based on Land Use. Ecol. Econ. 2022, 38, 170–178. [Google Scholar]
- Ito, K.; Zhang, S. Willingness to pay for clean air: Evidence from air purifier markets in China. J. Political Econ. 2020, 128, 1627–1672. [Google Scholar] [CrossRef]
- Xue, M.; Xing, L.; Wang, X. Spatial Correction and Evaluation of Ecosystem Services in China. China Land Sci. 2018, 32, 81–88. [Google Scholar]
- Li, J. Value Assessment is the Key of Environmental Assessment. China Popul. Resour. Environ. 2002, 3, 13–19. [Google Scholar]
- Wei, X.; Xin, S.; Zhang, Y.; Long, Y.; Zhang, X. Spatial difference of ecological services and its influencing factors under different scales:Taking the Nanchang Urban Agglomeration as an example. Acta Ecol. Sin. 2023, 43, 7585–7597. [Google Scholar] [CrossRef]
- Guo, H.; Wang, X.; Wu, B.; Li, X. Cognizing Population Density Demarcative Line (Hu Huanyong-Line) Based on Space Technology. Bull. Chin. Acad. Sci. 2016, 31, 1385–1394. [Google Scholar]
- Dabasinskas, G.; Sujetoviene, G. Spatial and Temporal Changes in Supply and Demand for Ecosystem Services in Response to Urbanization: A Case Study in Vilnius, Lithuania. Land 2024, 13, 454. [Google Scholar] [CrossRef]
- Luo, C.; Yu, H.T.; Liu, Y.; Yang, W. Supply and demand assessment of physical activity services provided by urban green spaces: A case study of Chongqing, China. Urban For. Urban Green. 2024, 95, 13. [Google Scholar] [CrossRef]
- Pinto, L.V.; Inácio, M.; Bogdzevic, K.; Gomes, E.; Pereira, P. Factors affecting the use of cultural ecosystem services in Lithuanian coastal area. Ocean. Coast. Manag. 2024, 251, 13. [Google Scholar] [CrossRef]
- Wang, Z.; Sun, X.Y.; Shan, R.F.; Wang, B.Y. Mapping and assessing supply-demand matching of recreational ecosystem services in Shandong province, China. Ecol. Indic. 2024, 160, 11. [Google Scholar] [CrossRef]
- Jiang, Y.C.; Ouyang, B.; Yan, Z.G. Spatial Correlation between the Changes in Supply and Demand for Water-Related Ecosystem Services. ISPRS Int. J. Geo Inf. 2024, 13, 68. [Google Scholar] [CrossRef]
- Brander, L.M.; de Groot, R.; Schägner, J.P.; Guisado-Goñi, V.; van’t Hoff, V.; Solomonides, S.; McVittie, A.; Eppink, F.; Sposato, M.; Do, L.; et al. Economic values for ecosystem services: A global synthesis and way forward. Ecosyst. Serv. 2024, 66, 13. [Google Scholar] [CrossRef]
- Meng, X.; Wu, Y. Supply-demand bundles and ecological function management of urban ecosystem services: Taking central urban area of Qigihar as an example. Chin. J. Appl. Ecol. 2023, 34, 3393–3403. [Google Scholar] [CrossRef]
- Jiang, M. Study on the Spatiotemporal Variation and Asscoiated Driving Factors of Ecosystem Services in the Southwest Karst of China. Doctoral Thesis, Huazhong Agricultural University, Wuhan, China, 2022. [Google Scholar]
- Huppert, H.E.; Neufeld, J.A. The fluid mechanics of carbon dioxide sequestration. Annu. Rev. Fluid Mech. 2014, 46, 255–272. [Google Scholar] [CrossRef]
- Zhu, X.C.; Ma, M.G.; Tateno, R.; He, X.H.; Shi, W.Y. Effects of vegetation restoration on soil carbon dynamics in Karst and non-karst regions in Southwest China: A synthesis of multi-source data. Plant Soil 2022, 475, 45–59. [Google Scholar] [CrossRef]
- Kaikai, H.; Qingming, C.; Xing, C.; Zhiguo, Y.; Jing, H.; Jiangtao, C.; Hao, A.; Wenshuo, Z. Progress of Research on Karst Desertification in Southwest China and Qinba Area of Shaanxi Province. Carslolgica Sin. 2024, 43, 147–162. [Google Scholar] [CrossRef]
- Shuai, N.; Hu, Y.C.; Gao, M.W.; Guo, Z.L.; Bai, Y.P. Construction and optimization of ecological networks in karst regions based on multi-scale nesting: A case study in Guangxi Hechi, China. Ecol. Inform. 2023, 74, 14. [Google Scholar] [CrossRef]
- Deng, Q.C.; Liu, Y.Q.; Wei, Y.P.; Liang, W.; Zhu, K.X.; Li, Y.H.; Zhang, L.H. Understanding the coupled relationship between regional longevity and physical geographical environment in Hechi, Guangxi, China. Sci. Rep. 2024, 14, 15. [Google Scholar] [CrossRef]
- Deng, Q.C.; Chen, L.J.; Wei, Y.P.; Li, Y.H.; Han, X.R.; Liang, W.; Zhao, Y.J.; Wang, X.F.; Yin, J. Understanding the Association between Environmental Factors and Longevity in Hechi, China: A Drinking Water and Soil Quality Perspective. Int. J. Environ. Res. Public Health 2018, 15, 2272. [Google Scholar] [CrossRef] [PubMed]
- Yong, L.; Jingfeng, F.; Quan, W.; Shuxi, L.; Binyong, L. Primary exploration of ecological theories and technologies for delineation of ecological redline zones. Acta Ecol. Sin. 2016, 36, 1244–1252. [Google Scholar]
- Zou, C.; Xu, M.; Ling, N.; Xu, D. Analysis on the Connotation of Ecological Protection Redline and Suggestions on Ecological Protection Redline Drawing. Environ. Prot. 2015, 43, 54–57. [Google Scholar]
- de Groot, R.S.; Wilson, M.A.; Boumans, R.M.J. A typology for the classification, description and valuation of ecosystem functions, goods and services. Ecol. Econ. 2002, 41, 393–408. [Google Scholar] [CrossRef]
Disclaimer/Publisher’s Note: The statements, opinions and data contained in all publications are solely those of the individual author(s) and contributor(s) and not of MDPI and/or the editor(s). MDPI and/or the editor(s) disclaim responsibility for any injury to people or property resulting from any ideas, methods, instructions or products referred to in the content. |
© 2025 by the authors. Licensee MDPI, Basel, Switzerland. This article is an open access article distributed under the terms and conditions of the Creative Commons Attribution (CC BY) license (https://creativecommons.org/licenses/by/4.0/).