3.1. Accuracy Assessment of the Vegetation Suppression Probability Surfaces
Table 1 presents the AUC results found for the probability surfaces of the study area in the Amazon biome. It is observed that the value obtained for the baseline models is higher than that obtained for the machine-learning-based models in all prediction periods. Among these models, Random Forest (RF) achieved the best performance, while the Sim Weight—TerrSet obtained the lowest AUC value.
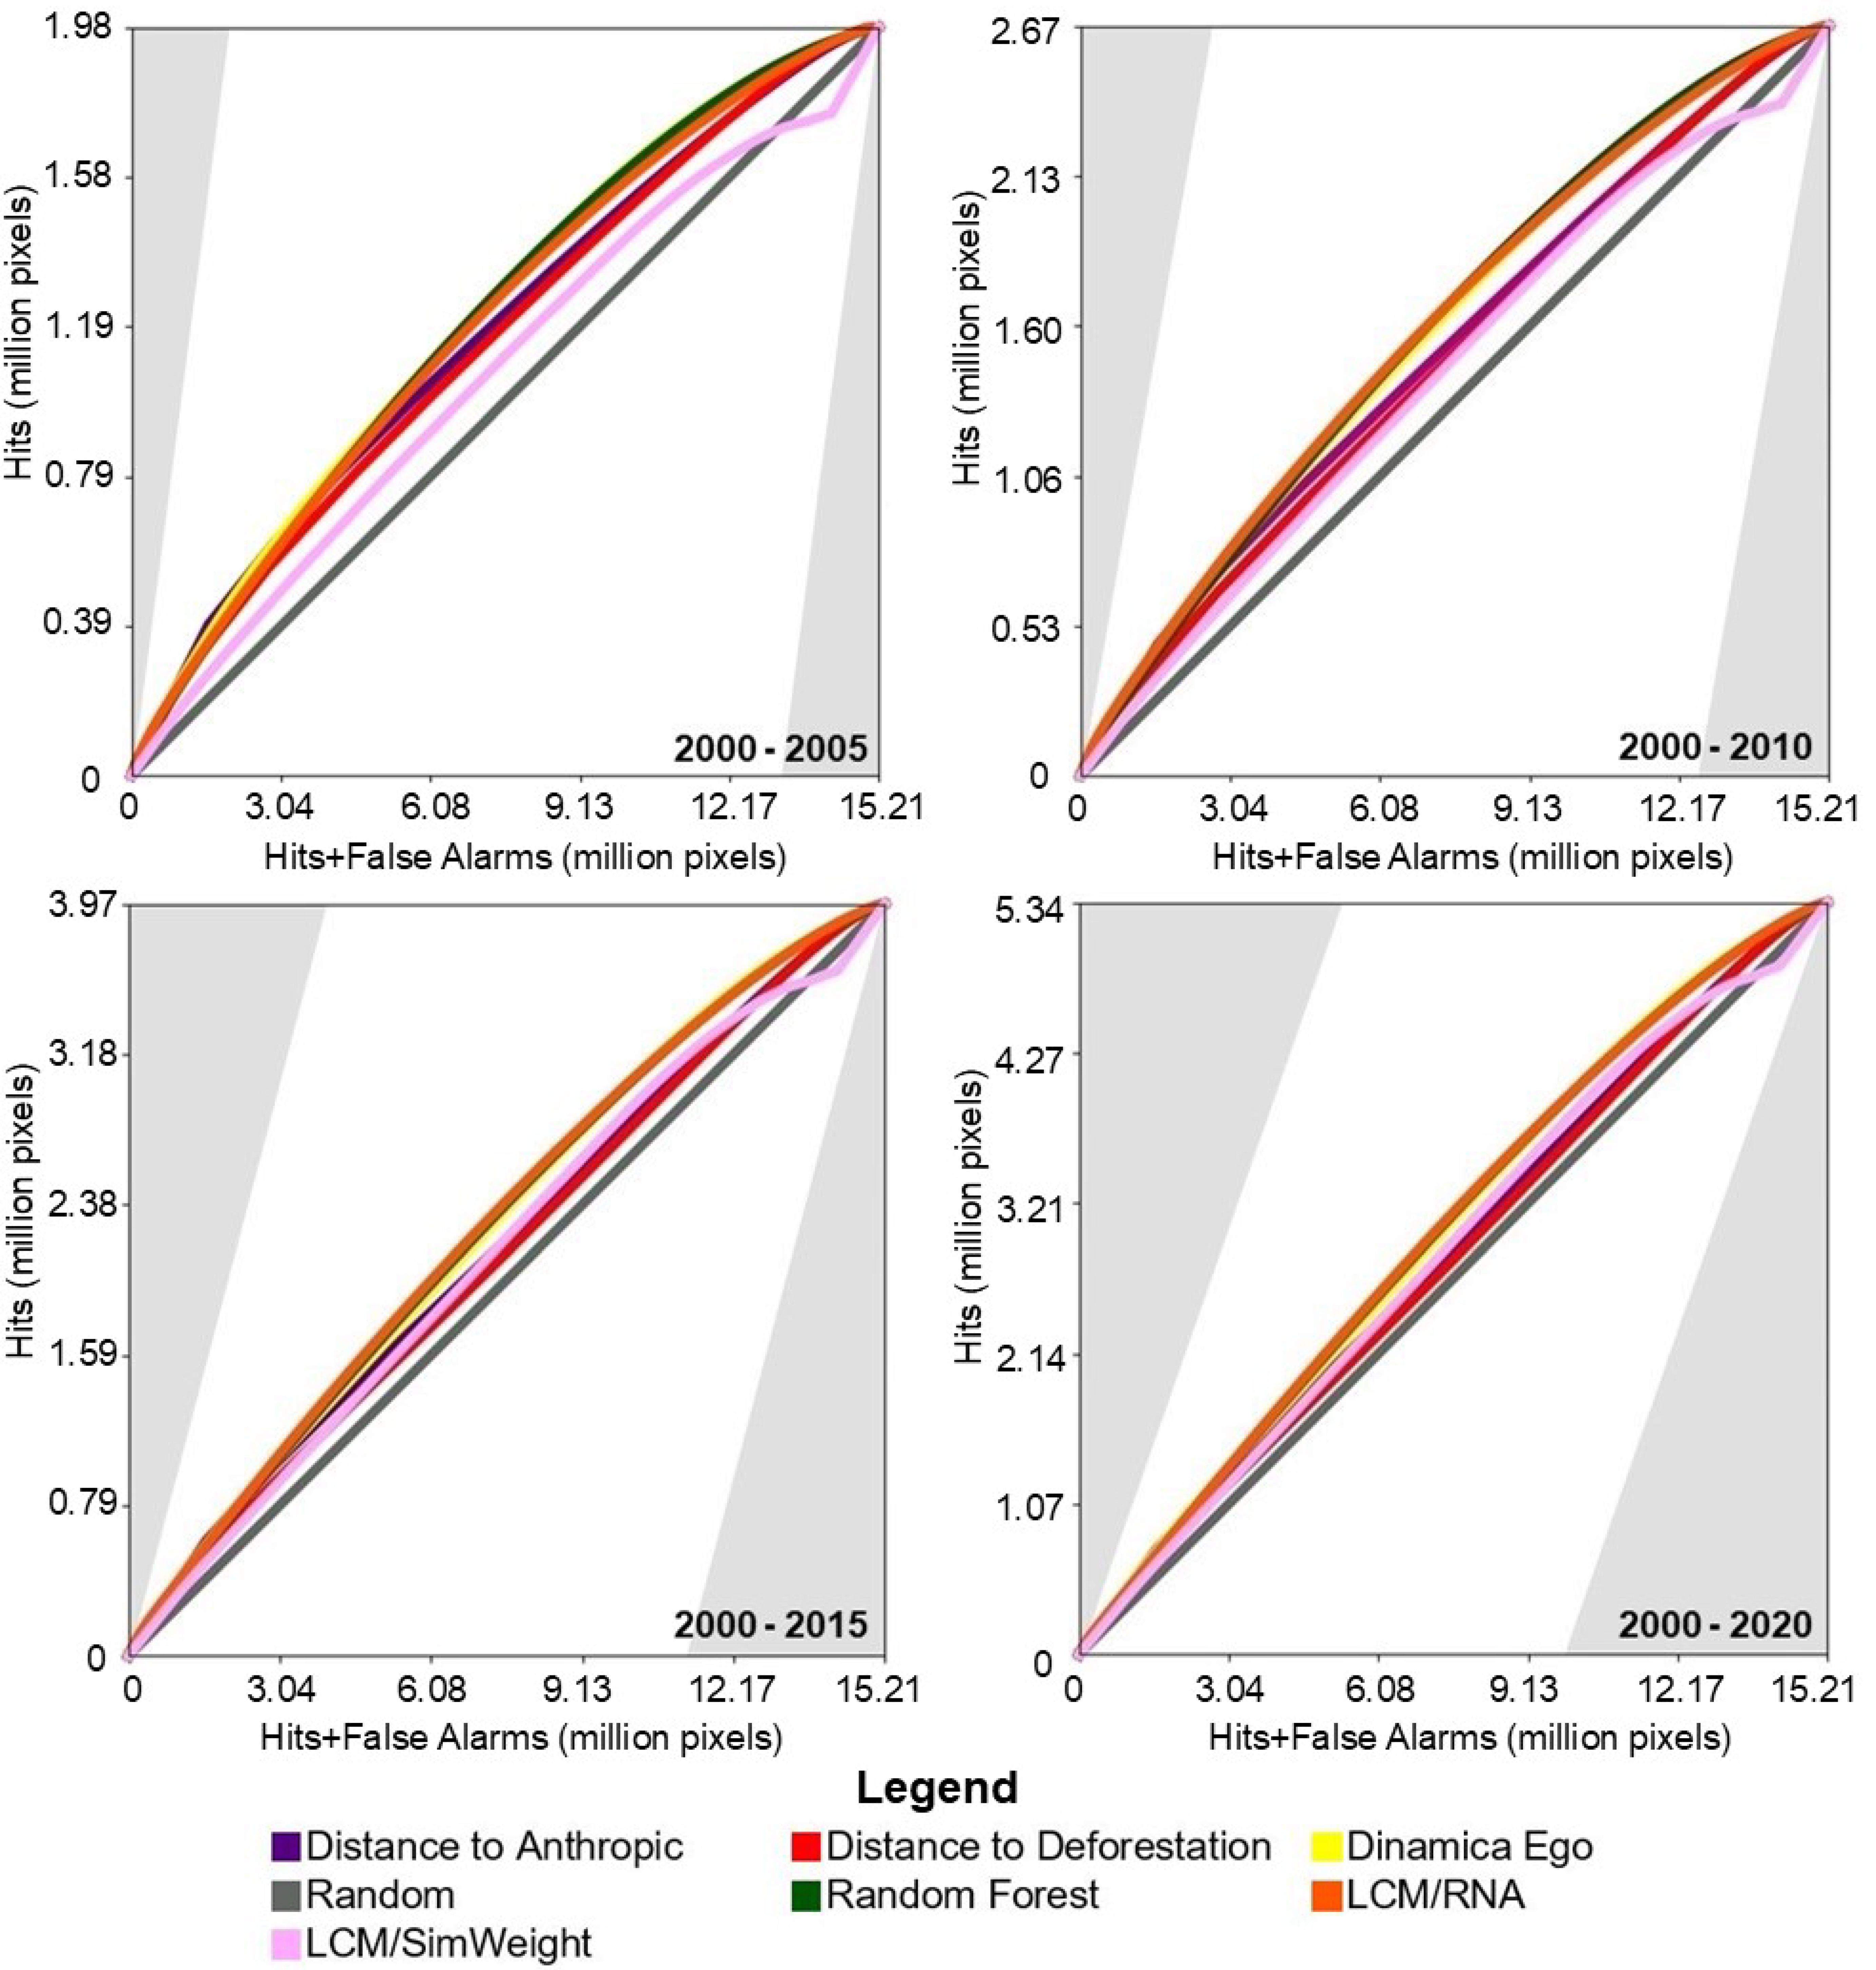
Figure 4 shows the results of the TOC evaluation. It can be observed that in all prediction periods, the performance of the baseline models was slightly superior to the machine-learning-based models.
For the study area in the Cerrado biome,
Table 2 presents the AUC results found for the probability surfaces. The models with the best performance were Random Forest and ANN-TerrSet. The baseline models and Weights of Evidence–Dinamica Ego achieved slightly lower performance, while the model using Sim Weight—TerrSet obtained the worst performance.
Figure 5 presents the results of the TOC evaluation. For this study area, the baseline models achieved intermediate TOC values, outperforming two of the four machine-learning-based models.
For the study area in the Pampa biome, the AUC results for the probability surfaces are presented in
Table 3. Random Forest, Weights of Evidence–Dinamica Ego, and ANN–TerrSet methods presented better performance. The baseline model of distance to anthropogenic uses in 2000 showed a slightly lower AUC values. The models with the lowest values were the distance from vegetation suppression between 1995 and 2000 and Sim Weight—TerrSet.
Figure 6 presents the results of the TOC evaluation. For this study area, with the exception of the Sim Weight—TerrSet model, machine learning models demonstrated superior performance compared to baseline models.
In general, it is observed that for all study areas in each prediction period, the models performed similarly to each other. Nevertheless, it can be seen that the further away from the training period the prediction is made, the worse the model’s performance tends to be. This is observed in all tested conditions, regardless of the method or study area.
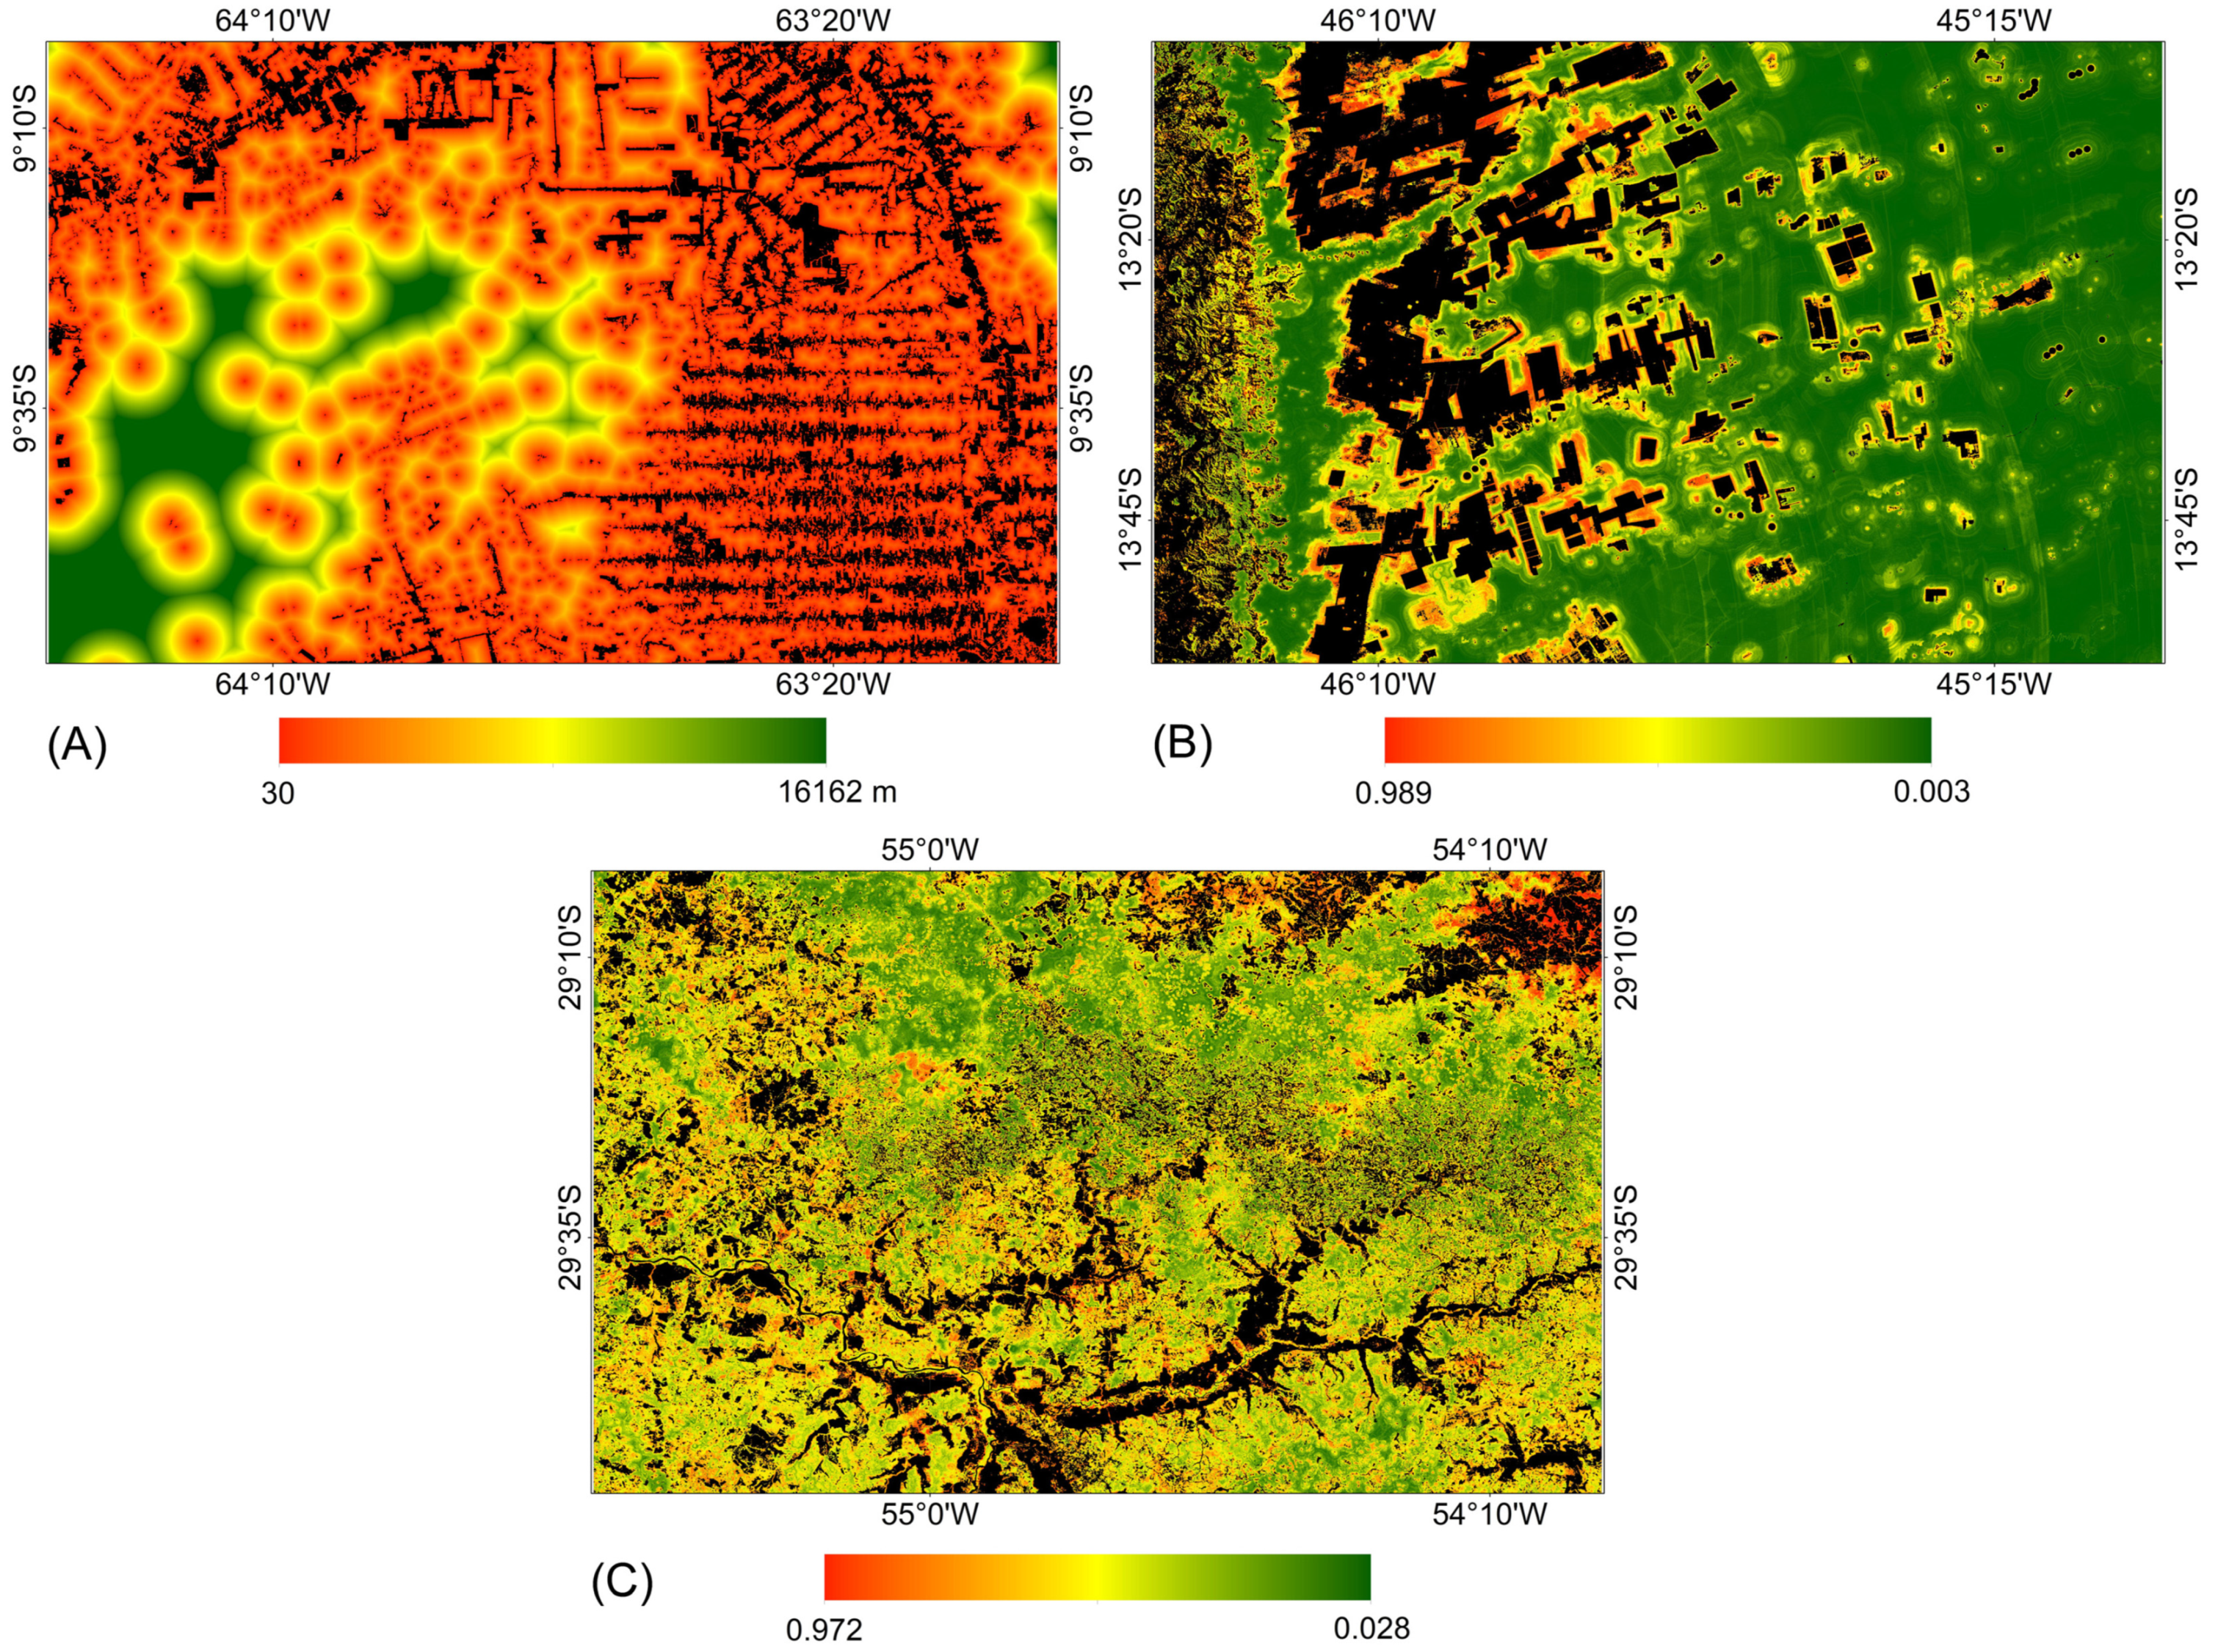
Figure 7 presents the probability surfaces with the highest average AUC values over the four prediction periods for each study area. For each model, the same probability surface was used to allocate changes in the four prediction periods. It is noted that for the study area in the Amazon biome, the areas considered most susceptible to vegetation suppression are located near the areas defined as anthropic uses in the year 2000. In contrast, for the study areas in the Pampa and Cerrado biomes, the areas considered most susceptible to vegetation suppression were defined by training with machine learning methods.
3.2. Accuracy Assessment of the Predicted Maps
Figure 8,
Figure 9 and
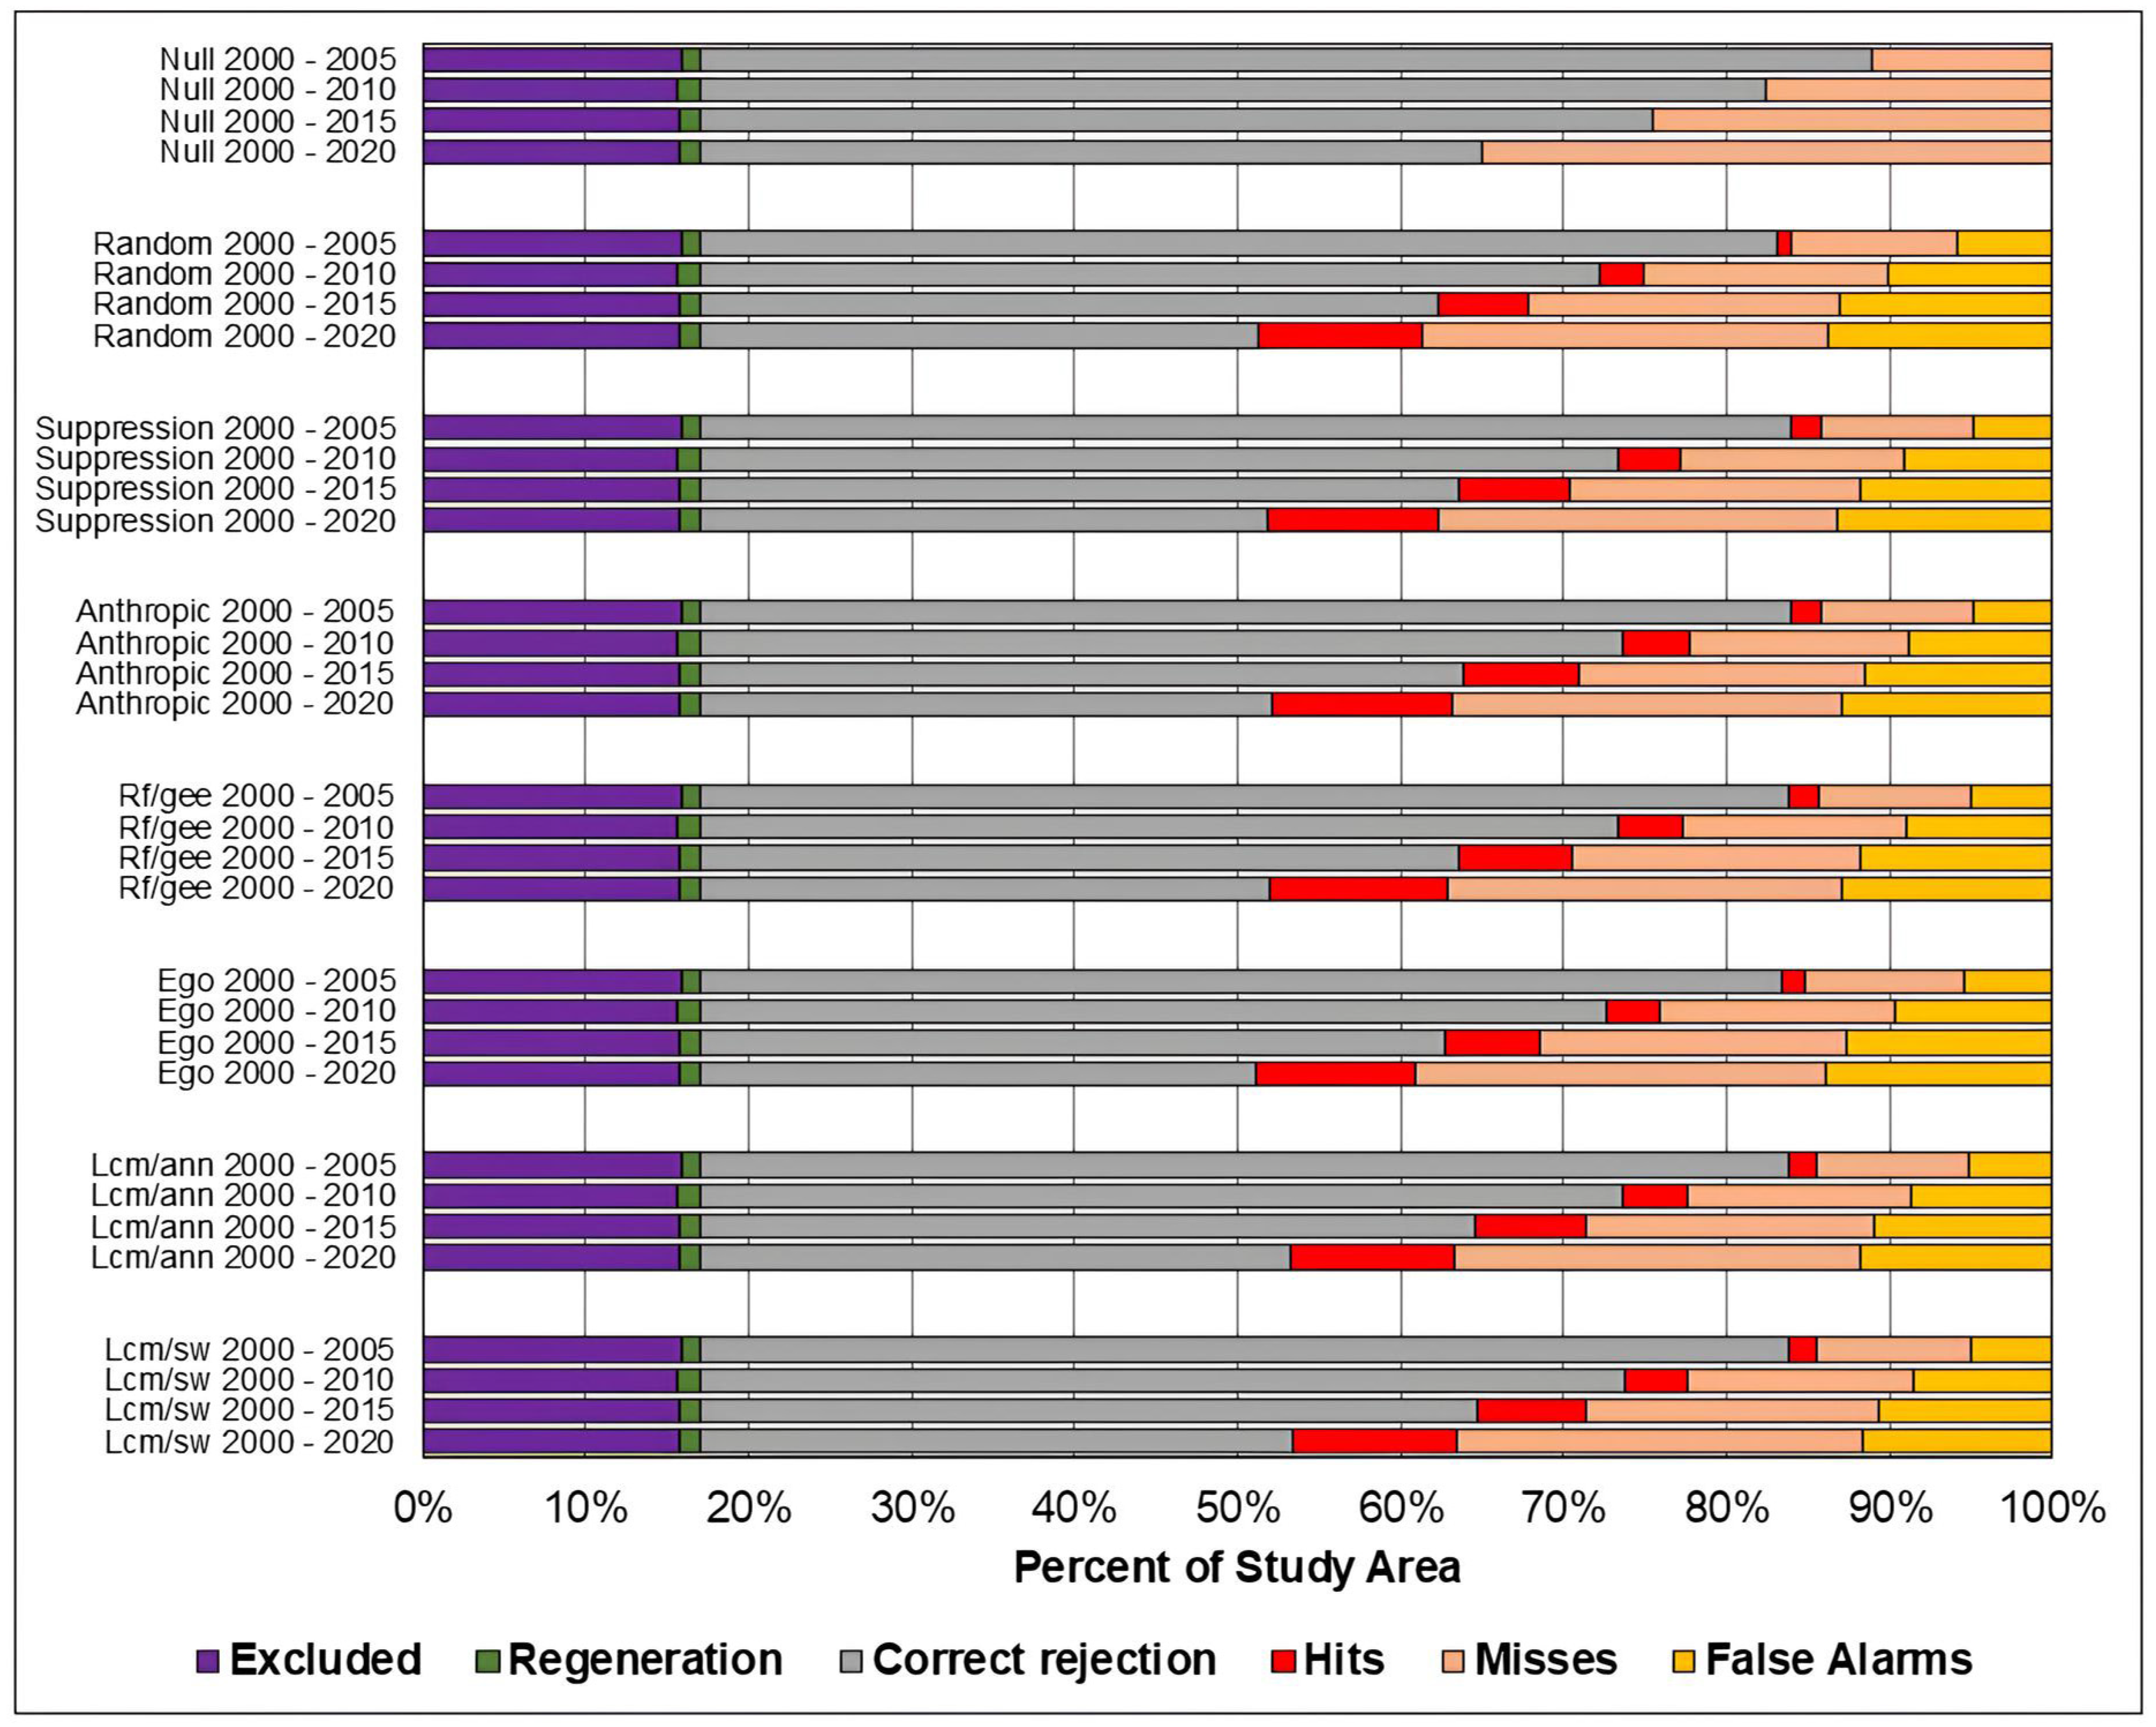
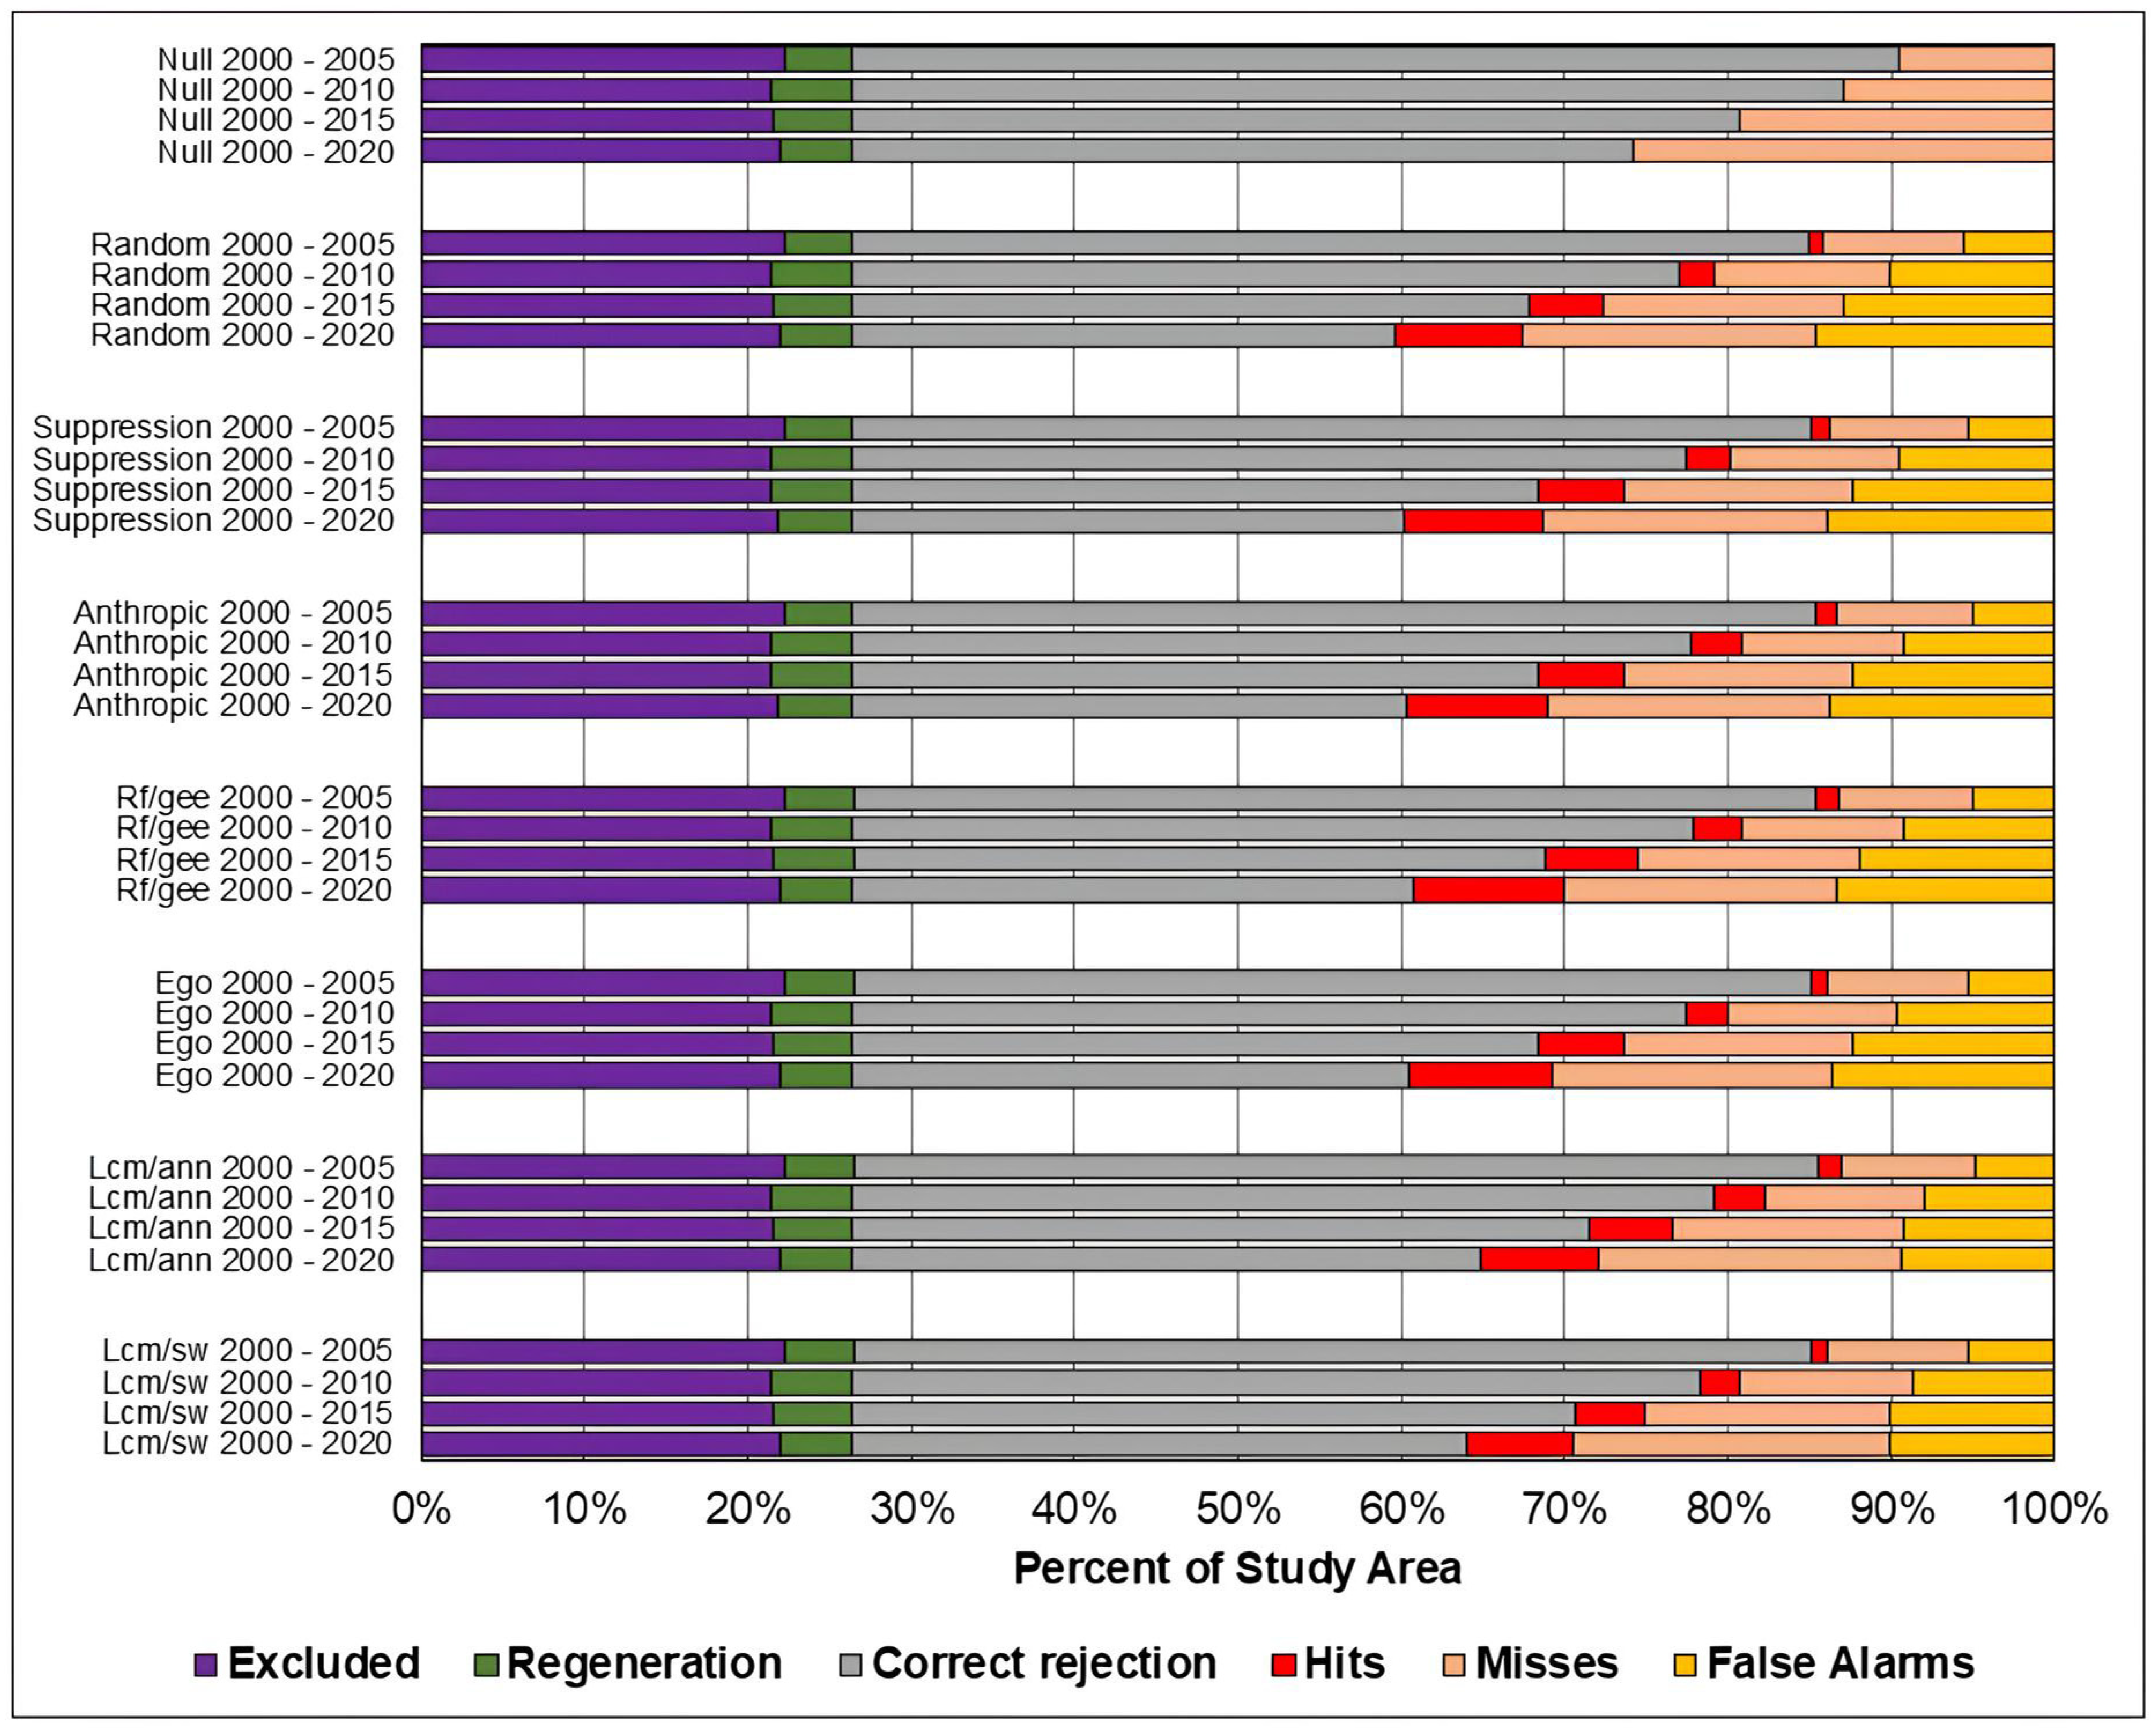
Figure 10 present, respectively, for the study areas in the Amazon, Cerrado, and Pampa biomes, the results of the evaluation of predicted maps using the three-map technique. The components of excluded areas, shown in purple, and regeneration, shown in green, have the same size for each study area and prediction period, regardless of the model. For the null change model, misses, false alarms, and hits cannot be computed because there is no change to compare with the reference map.
As in the TOC assessment, the components of the three-map assessment were similar across models across all prediction periods, and worsened as the prediction period increased. Considering the Overall accuracy, the null change model outperformed the other in most cases, although with small differences. The exceptions occurred in the study area of the Cerrado biome for the predictions in the years 2010, 2015, and 2020. For 2010 and 2015, the ANN-TerrSet model outperformed the null change model. For 2020, the ANN-TerrSet, Sim Weight—TerrSet, and Random Forest models performed better than the null change model.
When comparing the results of baseline models with those of machine learning-based models, no clear distinction is observed between the two categories of models.
It can be observed that the quantity of misses was greater than false alarms for all study areas, models, and prediction periods. This indicates that disagreements due to the omission of changes contained in the reference were greater than disagreements due to the allocation of incorrectly predicted changes.
It is noted that the component of correct rejection is the most abundant in all scenarios, indicating that the main source of agreement was the prediction of persistence. Furthermore, when comparing the results of the Sim Weight and ANN methods with the other models, a larger area of correct rejections and fewer hits, omissions, and false alarms is observed. This occurs mainly because these models predict a smaller amount of changes when compared to the others.
Figure 10.
Evaluation of the predicted maps for the study area in the Pampa biome using the three-map comparison method
Table 4 presents the Figure of Merit values for all models and prediction periods in the study area of the Amazon biome. The models that achieved the highest Figure of Merit values for the prediction of 2005 were distance from anthropogenic uses and distance from vegetation suppression, while the models with the lowest values were random and Weights of Evidence–Dinamica Ego. For the 2010 and 2015 predictions, the highest values were found for the distance from anthropogenic uses and ANN-TerrSet models, while the lowest values were obtained for the Random and Dinamica EGO models. And for the 2020 prediction, the highest values were found for the distance from anthropogenic uses and Random Forest models, while the lowest values were found for the Random and Weights of Evidence–Dinamica Ego models.
Table 4.
Figure of Merit for the models of the study area in the Amazon biome.
Table 4.
Figure of Merit for the models of the study area in the Amazon biome.
| | Baseline Models | Machine-Learning-Based Models |
|---|
| | Anthropic | Suppression | Random | ANN | Sim Weight | Random Forest | Dinamica Ego |
|---|
| 2000–2005 | 0.114 | 0.114 | 0.053 | 0.104 | 0.103 | 0.107 | 0.079 |
| 2000–2010 | 0.155 | 0.143 | 0.098 | 0.148 | 0.147 | 0.146 | 0.117 |
| 2000–2015 | 0.195 | 0.184 | 0.146 | 0.191 | 0.189 | 0.187 | 0.157 |
| 2000–2020 | 0.228 | 0.219 | 0.205 | 0.216 | 0.214 | 0.225 | 0.201 |
Table 5 presents the Figure of Merit values for all models and prediction periods in the study area of the Cerrado biome. The models that obtained the highest Figure of Merit values for the 2005 prediction were ANN-TerrSet and distance from vegetation suppression, while the models with the lowest values were random and Weights of Evidence–Dinamica Ego. For the 2010 prediction, the highest values were found for the ANN-TerrSet and Sim Weight-TerrSet models, while the lowest values were for the Random and Weights of Evidence–Dinamica Ego models. And for the 2015 and 2020 predictions, the highest values were found for the ANN-TerrSet and Random Forest models, while the lowest values were for the Random and Weights of Evidence–Dinamica Ego models.
Table 6 presents the Figure of Merit values for all models and prediction periods in the study area of the Pampa biome. The models that achieved the highest Figure of Merit values for the predictions of 2005, 2010, and 2015 were ANN-TerrSet and Random Forest, while the lowest values were the random and Sim Weight—TerrSet models. And for the 2020 prediction, the highest values were found for the Random Forest and Weights of Evidence–Dinamica Ego models, while the lowest values were for the Sim Weight-TerrSet and Random models.
Figure 11,
Figure 12 and
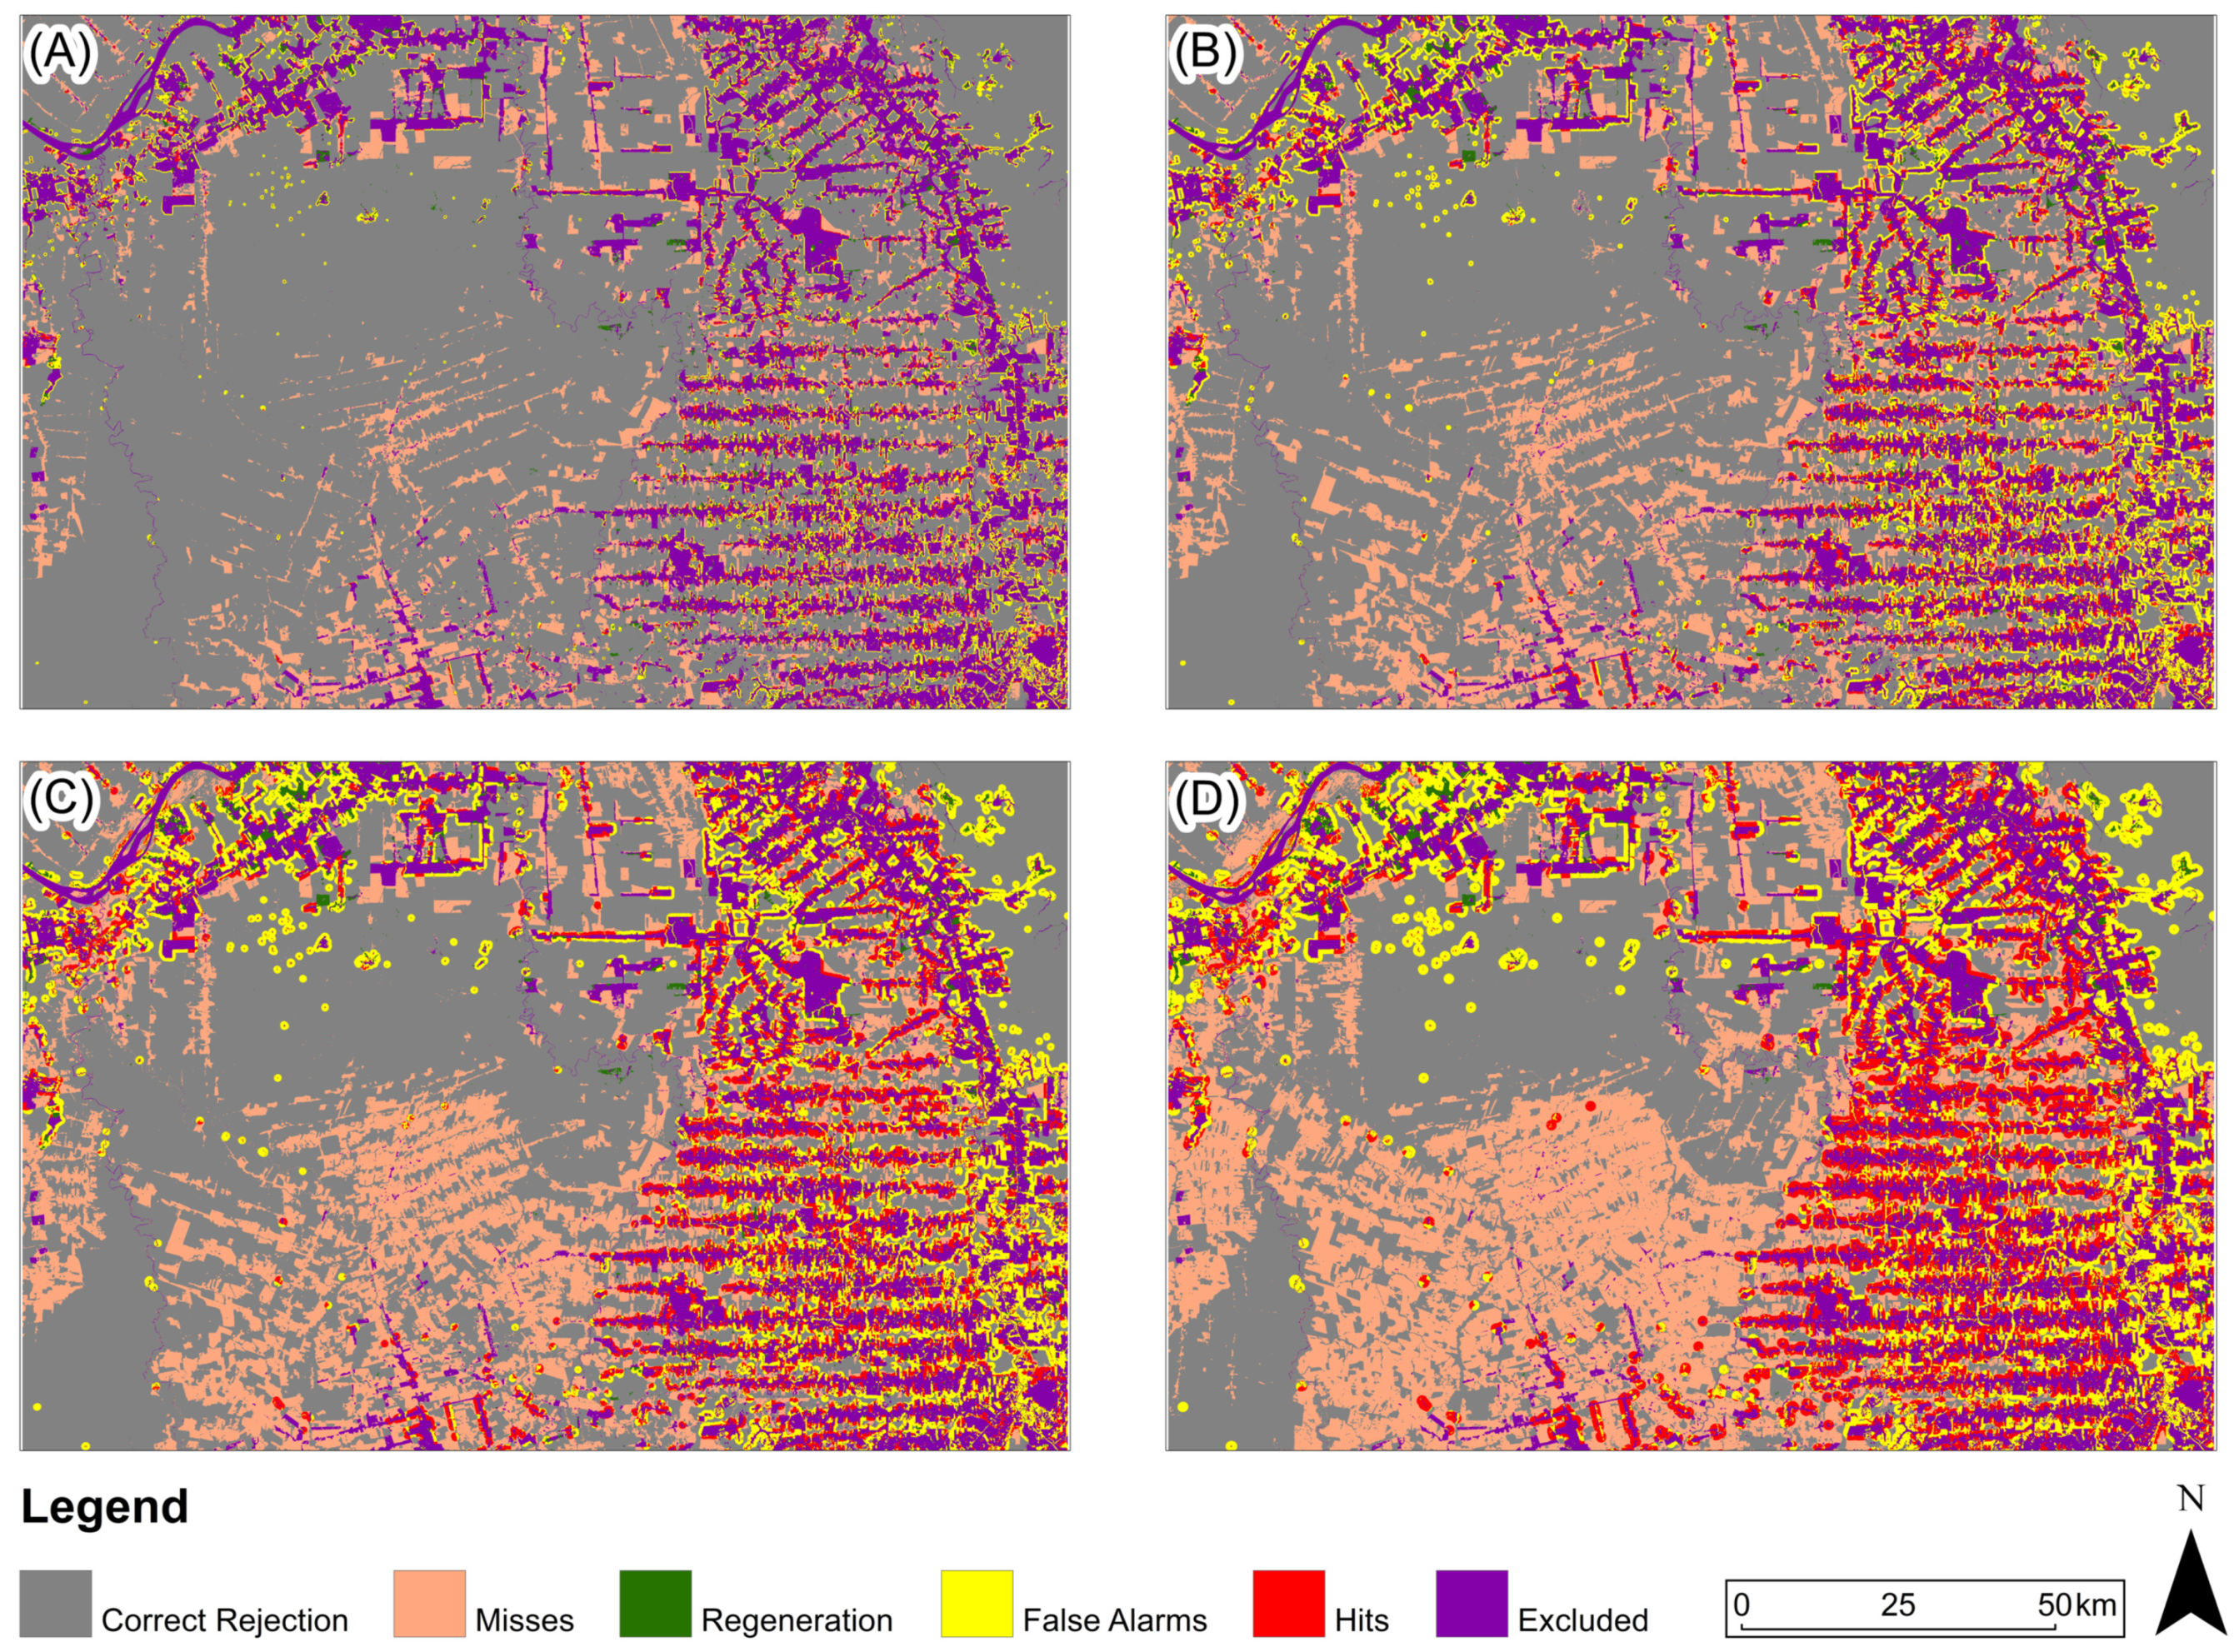
Figure 13 present, for the three study areas, the predictive map that obtained the highest Figure of Merit value for each prediction period. For the study area in the Amazon biome (
Figure 11), the predicted map with the highest Figure of Merit value for all prediction periods was generated based on the Euclidean distance from anthropogenic uses in 2000.
For the study area in the Cerrado biome (
Figure 12), predicted map with the highest Figure of Merit value for all periods was generated based on the ANN-TerrSet model.
For the study area in the Pampa biome (
Figure 13), the predicted map with the highest Figure of Merit value for 2005 and 2010 was generated based on the ANN-TerrSet model, and for the years 2015 and 2020 based on the Random Forest model.


