Article

Mitigating the “Empty Shell” Phenomenon in Farmer Professional Cooperatives: Insights Based on Demonstration Cooperative Policies in China

1
School of Economics and Management, Beijing Jiaotong University, Beijing 100044, China
2
Committee of the China Democratic National Construction Association in Qiannan Prefecture, Duyun 558000, China
*
Author to whom correspondence should be addressed.
Land 2025, 14(3), 557; https://doi.org/10.3390/land14030557
Submission received: 14 January 2025 / Revised: 27 February 2025 / Accepted: 4 March 2025 / Published: 6 March 2025
(This article belongs to the Section Land Socio-Economic and Political Issues)

Abstract

:
Farmer professional cooperatives are essential in promoting China’s rural revitalization. However, the widespread occurrence of “empty shell” cooperatives, which are characterized by operational stagnation and human resource depletion, presents significant challenges to achieving this objective. This study explores the role of award-rated demonstration cooperatives in addressing this issue by utilizing a unique dataset of 1570 cooperatives from a particular city in Guizhou Province. The analysis employs mediation and moderation effect models and identifies two primary mechanisms. First, the policy improves cooperatives’ access to government subsidies and loan facilities, which helps mitigate constraints related to human resources and operational risks. Second, cooperative characteristics, including member size, education levels, and leading entity, positively influence the effectiveness of these policy measures. Conversely, the equity structure shows a dual moderating effect, reducing policy benefits in resource retention while enhancing them in operational improvement. These findings highlight the intricate relationship between policy design and cooperative attributes in addressing structural inefficiencies and provide valuable insights for strengthening cooperative governance and advancing rural development.

1. Introduction

Farmer professional cooperatives are widely regarded as pivotal institutions for driving rural development, enhancing agricultural productivity, and improving farmer incomes globally [1,2,3]. By pooling resources, facilitating market access, and fostering collective action, these cooperatives have the potential to empower rural communities and promote sustainable agricultural practices. However, their performance varies significantly. While some cooperatives thrive and serve as engines of economic growth and social cohesion, others degenerate into so-called “empty shell” cooperatives, existing in name only and failing to deliver meaningful benefits to their members [4,5]. This disparity raises a critical question: why do some farmer professional cooperatives succeed in achieving their objectives while others fail?
Globally, cooperatives in economically advanced regions such as the United States, Europe, and the United Kingdom have benefited from robust legal frameworks, deeply embedded cooperative traditions, and over a century of institutional evolution. These factors have enabled the establishment of sophisticated organizational structures, including vertically integrated marketing channels and farmer-owned processing facilities, which enhance operational efficiency and market resilience [6]. These well-established norms and systems not only stabilize farm incomes but also contribute to sustainable rural development, offering valuable insights for emerging economies seeking to modernize their agricultural sectors [7]. In contrast, cooperatives in less developed settings often struggle with weak governance, limited access to resources, and insufficient member engagement, all of which exacerbate their vulnerability to becoming “empty shells” [8].
In China, farmer professional cooperatives have experienced explosive growth since the enactment of the Law of the People’s Republic of China on Farmer Professional Cooperatives in 2007. The number of registered cooperatives surged from 26,000 in 2007 to 2.234 million by March 20231, affecting over half of the nation’s farming households. This rapid expansion has played a significant role in scaling up agricultural production and advancing rural revitalization. However, it has also outpaced the development of internal governance and operational quality, leading to the proliferation of “empty shell” cooperatives. These cooperatives are characterized by weak operational performance, minimal member participation, and inefficient resource allocation [4]. The probability density plots shown in Figure 1a2 underscore this issue, revealing a right-skewed distribution of cooperative sales in both 2014 and 2022, with the skewness intensifying over time. Similarly, Figure 1b3 highlights disparities in organizational size, demonstrating that smaller cooperatives constitute a disproportionately large segment of the cooperative landscape, further amplifying the “weak getting weaker” phenomenon.
To address these challenges, the Chinese government introduced the demonstration cooperative assessment policy in 2009. By March 2023, 191,000 cooperatives had been designated as demonstration cooperatives, accounting for approximately 8.5% of the total number of cooperatives nationwide5. These demonstration cooperatives aim to serve as models of effective governance, operational efficiency, and economic impact. Existing studies suggest that demonstration cooperatives can enhance member incomes, improve resource utilization, and strengthen organizational capacity [1,9]. However, some research indicates that the performance of these cooperatives may be overstated, with a significant number failing to sustain their status or even being eliminated during cleanup efforts targeting “empty shell” cooperatives [5].
Despite their potential, the mechanisms by which demonstration cooperatives contribute to mitigating the “empty shell” phenomenon remain underexplored. Research has largely focused on the direct effects of policies such as government subsidies and loan facilities on cooperative operations, with limited attention being paid to the transmission paths and moderating factors [4]. For example, while government subsidies and loan facilities are critical for enhancing cooperatives’ financial resilience and operational capacity, their efficacy often depends on internal factors such as governance quality, member education levels, and organizational structure [10,11,12]. As demonstrated in Figure 1a, the ability of cooperatives to leverage these policy supports varies widely, necessitating a deeper examination of the interplay between external policies and internal characteristics.
Existing research on cooperative development and governance primarily builds on cooperative theory and previous studies, often focusing on single-factor analyses to develop qualitative hypotheses and conclusions [13,14]. However, these studies fail to systematically summarize cooperative decision-making patterns and overlook potential interactions between various causes of empty shell cooperatives and their governance measures. This study adopts an empirical approach to clarify the governance mechanisms of “empty shell” cooperatives, addressing gaps in the theoretical analysis of their formation. By capturing the underlying economic logic of cooperative behavior, this research provides valuable theoretical and empirical insights into how demonstration cooperatives can effectively lead and promote high-quality cooperative development.
To explore the governance mechanisms of demonstration cooperatives and their impact on mitigating the “empty shell” phenomenon, this study addresses existing research gaps by conducting an empirical analysis using panel data from 1570 cooperatives in a particular city in Guizhou Province. The dataset, covering the period from 2018 to 2023, is sourced from the CCAD database and survey data. In terms of methodology, this study employs a mediation effect model to examine how a cooperative’s designation as a demonstration cooperative influences its likelihood of becoming an “empty shell” cooperative through government subsidies and loan facilities. Additionally, a moderation effect model is applied to investigate the moderating roles of member size, education attainment, leading entity, and equity structure in the relationship between demonstration cooperative designation and cooperative development. By analyzing these mechanisms, this study aims to identify the underlying dynamics of demonstration cooperatives’ impact on governance and sustainability.
This study aims to examine the leading role of demonstration cooperatives and assess their effectiveness in mitigating the “empty shell” phenomenon among farmer cooperatives. Specifically, it investigates the mechanisms through which demonstration cooperatives influence the formation of empty shell cooperatives. The research focuses on two key questions: (1) How do demonstration cooperative policies impact cooperative operations through government subsidies and loan facilities? (2) How do internal cooperative characteristics, including member size, education attainment, leading entity, and equity structure, moderate the effectiveness of these policies? The findings will provide empirical evidence for policymakers to refine cooperative development policies and contribute to the theoretical understanding of cooperative governance. The visual insights provided in Figure 1a,b underscore the critical need for targeted interventions to enhance cooperative performance and reduce inefficiencies.
The remainder of this paper is structured as follows: Section 2 introduces the conceptual framework, outlining the transmission and moderating mechanisms of demonstration cooperative policies. Section 3 describes the data sources, econometric models, and methodological approach. Section 4 presents the empirical findings, focusing on the roles of government subsidies, loan facilities, and cooperative characteristics in addressing the “empty shell” phenomenon. Finally, Section 5 concludes with policy recommendations, theoretical contributions, and practical implications for strengthening cooperative governance and promoting rural revitalization in China.

2. Conceptual Framework

The implementation of demonstration cooperative policies, while posing potential risks, also generates positive demonstration effects. On the one hand, demonstration cooperatives often dominate access to policy resources, which can lead to path dependence and lock-in effects in their development models [15]. This preferential support may also crowd out the survival space of non-demonstration cooperatives in the region, exacerbating the “empty shell” phenomenon. On the other hand, demonstration cooperatives generate positive spillover effects by encouraging learning and imitation among neighboring cooperatives. From the perspective of imitation behavior theory, there exists a bottom-up tendency to mimic in social structures, which is particularly evident at the organizational level. Cooperatives tend to adopt practices that have proven successful, aligning their strategies with those of demonstration cooperatives [16]. Consequently, cooperatives in proximity to demonstration cooperatives are more likely to engage in active learning and replicate effective business practices. Empirical studies indicate that policies promoting the recognition of farmer cooperatives as national- or provincial-level demonstration cooperatives significantly enhance their growth and development. More importantly, such policies have been found to effectively curb the emergence of “empty shell” cooperatives, reinforcing the sustainability of the cooperative sector [4].
As a government-led commendation and incentive policy, the demonstration cooperatives assessment policy stands out from universal subsidy interventions such as financial or tax relief schemes due to its dual exogenous and endogenous impacts on cooperatives at the micro level. The study of its effect on “empty shell” cooperatives involves two interconnected mechanisms: the exogenous transmission mechanism and the endogenous moderating mechanism. The transmission mechanism comprises pathways of government subsidies and loan facilities, while the moderating mechanism reflects cooperative-specific characteristics, including member size, education level of members, leading entity, and equity structure [4,17], as shown in the conceptual framework in Figure 2.
In order to enrich the conceptual framework, we conducted a supplementary case analysis of farmer professional cooperatives in a particular city in Guizhou Province, identifying eight typical cooperatives (Appendix A). Within these eight cases, each demonstration cooperative exhibits distinct characteristics that transmit or reinforce the impact of the evaluation system on cooperative development, thereby deepening our understanding of the policy mechanisms involved.

2.1. Transmission Mechanism

Demonstration cooperatives directly combat the emergence of “empty shell” cooperatives through their ability to secure government subsidies and loan facilities. Once rated as demonstration cooperatives, they are more likely to receive economic support from governments and other societal institutions [18,19]. This recognition improves their capital structure and production capacity, elevating their overall capital endowment [20] and forming the transmission the foundation of the transmission mechanism. The capital endowment changes can be categorized into two channels:
Government subsidies, which include direct financial support through industrial funds, bonus incentives, and tax benefits [18].
Loan facilities, which enhance cooperatives’ ability to secure loans from financial institutions, leveraging their status as demonstration cooperatives [4,21].
Government subsidies play a vital role in providing demonstration cooperatives with financial resources that enable competitive product pricing, technological innovation, and market expansion. These advantages not only increase the income of cooperative members [22] but also boost farmer participation, improve market adaptability, and ensure operational sustainability [23]. This financial stability helps mitigate challenges such as human resource depletion and operational stagnation, effectively reducing the likelihood of cooperatives becoming “empty shells”.
Loan facilities, on the other hand, improve the credibility of cooperatives in the eyes of financial institutions, increasing their access to loans and enhancing their internal financial liquidity [24,25], and enable cooperatives to access more funds for the welfare of farmers and for income distribution [26]. This will also help demonstration cooperatives to further expand their business and enhance market competitiveness, reduce the risk of becoming “empty shell” cooperatives, and serve as a transmission mechanism for the impacts of the demonstration cooperatives.

2.2. Moderating Mechanism

The changes in the characteristics of demonstration cooperatives are an indirect process compared with the direct effects of government subsidies and loan facilities. Because of government policy support and market recognition, cooperatives that have been evaluated as demonstration cooperatives gradually gain an advantageous position in the industry, which attracts more farmers to join the demonstration cooperatives in order to obtain more resources and benefits, and brings about a modification of the cooperatives’ characteristics, which is not directly caused by demonstration cooperatives, but by the interaction between the labor market and the effects of demonstration cooperatives’ policies, which is a moderating effect mechanism for the effect of demonstration cooperatives.
The member size of cooperatives has a significant impact on the development of cooperatives. As cooperatives flourish, in their ongoing process of vertical and horizontal integration, while the significant growth in the number of members highlights the expansionary power of cooperatives, cooperatives are able to effectively take advantage of economies of scale to enhance the marginal benefits of labor, which, in turn, enhances the level of farmers’ incomes [27], the level of member participation, and the level of skills training of the members, and other internal elements are also interlinked to improve cooperative profitability [28]. A larger scale can help better utilize the potential resource advantages associated with being rated as demonstration cooperatives in the process of leveraging the policy effects of demonstration cooperative rating. Larger cooperatives can more effectively transform and utilize the potential incentives brought by demonstration cooperatives and avoid “empty shell” cooperatives due to their strong ability to integrate resources and resist risks.
The level of education of cooperative members can strengthen the policy effect of demonstration cooperatives, and cooperative members with higher education experience can help to improve the operational vitality and profitability of cooperatives, which has a positive impact on the process of combating the stagnation of operation and “empty shell” cooperatives in demonstration cooperatives. The level of education of cooperative members characterizes the upper limit of cooperative management ability and market sensitivity to a certain extent, which can have a positive impact on cooperative productivity [29]. Higher educational background of cooperative members often implies stronger management ability and market sensitivity, which can help to more effectively introduce and apply modern management experience [20] and operation modes, improve the operational efficiency of cooperatives, and optimize resource allocation [30], which has a direct impact on the daily operation and long-term development of cooperatives.
Leading entity’s organizational capacity and management level are also important factors in the development of cooperatives [4,31]. Cooperatives have more resource utilization capacity and stability when the leading entity is a member of a village cadre, which plays a positive role in promoting the effects of the policies of demonstration cooperatives [32,33,34]. On the one hand, village cadres usually possess higher policy familiarity and resource striving ability, are more precise and efficient in interpreting and communicating government policies, and direct resources and support to flow to cooperatives more efficiently [4,35]; on the other hand, in organizing cooperatives, village cadres tend to be able to obtain financial rewards other than incentives to offset the organizational costs of organizing cooperatives by satisfying personal value attainment or job duties. After being evaluated as demonstration cooperatives, cooperatives led by village cadres are able to respond quickly to policy adjustments, make efficient use of the preferential policies and resources of the demonstration cooperatives, and improve the production and operational efficiency of the cooperatives so as to avoid the cooperatives from becoming empty shells as a result of the leading entity’s games with the ordinary farmers.
The equity structure significantly influences the development and sustainability of agricultural cooperatives. Unlike traditional firms, cooperatives are characterized by equal control rights among members [36,37], and other participant groups use cooperative services in proportion to their benefits. Traditional cooperatives typically employ open membership policies and equitable shareholding structures [38]. Modern cooperative organizations face different risks primarily centered on organizational decision-making and operational conduct [39]. The “one member, one vote” principle is a fundamental feature of cooperatives; however, under credit constraints, this principle may lead to efficiency losses. Although some emerging cooperatives adopt equity structures based on transaction volume, potentially improving decision-making efficiency [40], elite capture—whereby a small group of core members holds the majority of residual decision rights—does not effectively promote the development of smallholder farmers [36]. In extreme cases, such elites may compete with authentic cooperatives for government support, thus crowding out genuine cooperatives and exacerbating the “empty shell” problem [41]. Furthermore, a high degree of concentration may result in “non-proportionality” between decision-making power and financial investment, thereby exerting a negative influence on how demonstration cooperative policies are implemented [36]. Members holding higher shares of capital may leverage the threat of withdrawing funds to secure greater decision-making authority, whereas those with smaller capital contributions might reduce their engagement within the cooperative due to concerns about insufficient safeguarding of their rights. This dynamic can exacerbate internal conflicts and increase the risk of human resource attrition. After a cooperative obtains demonstration status, it gains more financial support and agricultural trading opportunities, incentivizing ordinary farmers to compete for greater decision-making power. Consequently, they may drive agricultural transaction prices in their favor to increase personal income, thereby raising the cooperative’s operating costs, diminishing overall productivity, and heightening the risk of operational stagnation.

3. Data and Method

3.1. Data

We used the field survey data of cooperatives in a city in Guizhou Province and CCAD data. Considering the shortcomings of the “CCAD” database in the scale and business information of cooperatives, we conducted research and data collection based on the scale and business information of cooperatives with the cooperation of cooperatives in a city in Guizhou Province and accurately matched the research data with the “CCAD” database according to the names of the cooperatives. The research data are accurately matched with the CCAD database according to the names of the cooperatives, and a nearly full operational dataset of cooperatives in a city in Guizhou Province was constructed for the period from 2018 to 2023.
The data on the equity structure, operation status, and government policies, in addition to the data on China’s national demonstration cooperatives, used in this paper come from the CCAD database. A list of provincial demonstration cooperatives was compiled from public data, such as those of the regional agricultural and rural departments, while the data on the membership of the cooperatives came from the authors’ research on a city in Guizhou Province, and the macro-area control variables were compiled from the annual reports of the regional statistical offices. Annual report collation was carried out as follows: The initial samples of cooperatives were first screened according to two principles: (1) Delete the samples that are illogically filled out in the annual reports of cooperatives with negative financial indicators such as government financial support fund subsidies, financial loan subsidies, sales volume, tax amount, etc.; this leads to a negative number of members, and the number of farmers among the members is higher than the total number of members. (2) After the screening of the above samples is completed, we matched the data of each sample, used mean value interpolation to supplement the missing values, and finally obtained the balanced panel data of cooperatives for 2018–2023, with a total sample size of 9420 in the region, totaling 1570 cooperatives.
In this study, whether or not cooperatives are “empty shells” due to human resource depletion or stagnation of operation is used as an explanatory variable. When the explanatory variable is whether or not the cooperative is “empty shell”, the variable is discrete. When the main explanatory variable is whether or not the cooperative is a “demonstration cooperative”, the variable is discrete, and the criterion is whether or not the cooperative has been categorized under “provincial demonstration cooperatives” or “national demonstration cooperatives”. This variable is discrete when the cooperative is a “model society”. The demonstration cooperatives variable is based on the selection status of “demonstration cooperatives”, and since the selection of “demonstration cooperatives” is biannual and not standardized, it is suitable for constructing a dummy variable that uses the status of their assessment as an indicator for the assessment of demonstration cooperatives.

3.2. Method

3.2.1. Mediating Effect Model

First, we focus on the mechanism of government subsidies in the assessment of demonstration cooperatives to manage human resource depletion in cooperatives. The government subsidies received by demonstration cooperatives provide material incentives for cooperative members, which help demonstration cooperatives improve labor conditions and attract and retain members; in practice, government subsidies are generally used for cooperatives to carry out skills training and purchase labor tools, which help to improve farmers’ vocational skills and management capabilities and provide incentives for demonstration cooperatives’ members to develop themselves. The synergistic effect of the two improves the ability of the model society to retain existing members and attract new members and reduces the possibility of the “empty shell” caused by human resource depletion problem from arising. Based on this logic, the mediation effect model is constructed as follows:
G o v s u b i t = α 0 + a D e m _ T i t + α 2 C o n t r o l s i t + λ i + μ t + ε i t E m p t y ( φ ) i t = α 0 + c D e m _ T i t + α 2 C o n t r o l s i t + λ i + μ t + ε i t E m p t y ( φ ) i t = α 0 + c D e m _ T i t + b G o v s u b i t + α 2 C o n t r o l s i t + λ i + μ t + ε i t
where, i and t represent cooperatives and years, respectively. Govsubit is the mediating variable, indicated as whether the cooperative receives government subsidies. Empty(φ)it indicates whether the i cooperative became an empty shell cooperative due to the depletion of human resources (Emprty1) or the failure to operate (Empty2) in the t year. Empty(φ)it equal to zero means that the actual number of cooperative participants in the year is zero or the number of transactions occurring is zero. Dem_T is the virtual policy variable of whether the cooperative is approved by the demonstration cooperative. Controlsit represents other control variables and regional control variables that affect the empty shell effect in cooperatives. Control variables include cooperative size control variables including cooperative size (Memnum), human capital (Leader; Edu), operating status (Profit; Subprof; Year), equity structure (Capstr), government support (Govsub; Loanprof), and the regional control variable (Ppincome; Pagri). λ i is an individual fixed effect. μ t is the fixed effect of time. ε i t is a random disturbance item.
Secondly, we focus on loan facilities. We focus on the mechanism of loan facilities in the assessment of demonstration cooperatives in managing human resource depletion in cooperatives. By obtaining loan facilities, demonstration cooperatives are able to expand their production scale or improve technical equipment, enhance production efficiency and product quality, and increase the trust cooperative members have in the cooperative, as well as their dependence on it; at the same time, with the help of loans, cooperatives can implement more income-generating projects or increase farmers’ dividends and benefits, which is conducive to increasing farmers’ satisfaction and loyalty to the cooperative, increasing their willingness to participate, and attracting more farmers to join or stay in the cooperative. This will help to increase farmers’ satisfaction and loyalty to the cooperative, increase their willingness to participate, attract more farmers to join or stay in the cooperative, and avoid the problem of the cooperative becoming an “empty shell” due to human resource depletion. Based on this logic, the mediation effect model is constructed as follows:
L o a n p r o f i t = α 0 + a D e m _ T i t + α 2 C o n t r o l s i t + λ i + μ t + ε i t E m p t y ( φ ) i t = α 0 + c D e m _ T i t + α 2 C o n t r o l s i t + λ i + μ t + ε i t E m p t y ( φ ) i t = α 0 + c D e m _ T i t + b L o a n p r o f i t + α 2 C o n t r o l s i t + λ i + μ t + ε i t
where Loanprofit is the mediating variable, expressed as whether the cooperative has access to loan facilities.

3.2.2. Moderating Effect Model

Unlike the mediating effects of loan facilities and government subsidies, cooperative member size, members’ education level, leading entity, and equity structure play a more important role in the transmission of demonstration cooperatives’ policy incentives to the cooperatives that have been awarded the demonstration cooperatives, and there is a certain degree of correlation with other factors of cooperative development, and the path of action is characterized by complex interactions rather than clear causal associations, so we employ a moderating effect model.
E m p t y ( φ ) i t = α 0 + α 1 D e m _ T i t + α 2 M o d e r a t e ( θ ) i t + α 3 D e m _ T i t × M o d e r a t e ( θ ) i t + α 4 C o n t r o l s i t + λ i + μ t + ε i t
where, Moderate(θ)it is the moderating variable, including Memnum, Edu, Leader, and Capstr. Dem_T*Moderate(θ)it is the cross-multiplier of the dummy variable for demonstration cooperatives with the moderating variable.

4. Results

4.1. Descriptive Results

Table 1 presents descriptive statistics on the “empty shell” cooperatives. The results show that the number of “empty shell” cooperatives with human resource depletion has been increasing every year, with a critical inflection point in 2021 and a sharp increase in 2022. This is mainly due to the fact that many cooperatives were unable to cope with the increased market pressure or policy adjustments during the pandemic in 2021–2022, resulting in a rapid decline in membership and, thus, “empty shells”. On the other hand, the number of “empty shell” cooperatives with stagnation of operation shows a trend of increasing and then decreasing, again with 2021 as the turning point, and the number decreases sharply in 2022. The possible reason for this is that since the implementation of the special “empty shell” cooperative cleanup policy in 2019, many cooperatives expanded blindly before 2021, driven by policy support and market demand, and then fell into difficulties due to poor management or market changes, increasing the number of empty shell cooperatives. After 2022, with market adjustment and policy improvement, the number of shell societies decreased.
Descriptive statistics of other control variables are shown in Table 2. Descriptive statistics of other control variables are shown in Table 2. Since the mean value of the total number of cooperative members is much smaller than its maximum value, and because the mean value of the registered capital of the cooperatives is small, it indicates that the cooperatives’ manpower and capital scale is low overall. The mean value of equity structure is 0.442, indicating that the cooperative holding situation as a whole presents a non-absolute holding situation. The mean value of the leading entity being a village cadre is 0.584, indicating that more than half of the cooperatives in the sample have village cadres as leading entities. It is worth noting that the mean value of the highest education indicator for cooperatives with members with higher education experience—the highest education is college or above—is 0.196, indicating that most cooperatives have members with lower education and a lower level of human capital education.

4.2. Results from Mediating Effect

4.2.1. Government Subsidies

First, we focus on the mechanism of government subsidies in the assessment of demonstration cooperatives to manage human resource depletion in cooperatives. Table 3 shows the results of the mediation effect test for government subsidies. The regression coefficient a of Dem_T of demonstration cooperatives assessment on government subsidies of Govsub is significantly positive, indicating that cooperatives being assessed as demonstration cooperatives may imply an increase in policy priority and social credibility and are more likely to receive government subsidies or support. The regression coefficient b of the mediator variable on the explanatory variables is significantly negative, indicating that there exists a significant negative correlation between demonstration cooperatives’ access to government subsidies and their risk of human resource depletion. After adding the mediator variable to the baseline regression, the regression coefficient c’ of Dem_T is no longer significant, and the Sobel value of the mediation effect model is significantly negative. The regression coefficient of the mediator variable on the explanatory variables b is significantly negative, indicating that there is a significant negative correlation between government subsidies and the risk of human resource depletion in demonstration cooperatives; after adding the mediator variable to the baseline regression, the regression coefficient c’ is no longer significant, and the Sobel value of the mediation model is significantly negative, indicating that government subsidies play a role as a mediator in the evaluation of demonstration cooperatives for managing the “empty shell” cooperative problem caused by the exhaustion of human resources. The evaluation of cooperatives as demonstration cooperatives brings advantages for them to obtain government subsidies, and more government subsidies mean that members of cooperatives are more likely to obtain material incentives, a better working environment, and social recognition, which effectively enhances the willingness of farmers to participate in cooperatives, reduces the risk of cooperatives losing human resources in the future, and is conducive to the management of the problem of cooperatives with “empty shell”.
The results of the study are shown in Table 4. The regression coefficient b of Govsub on Empty2 is significantly negative, indicating that there is a negative correlation between government subsidies and the stagnation of operation of cooperatives and the empty shell problem and that government subsidies can ensure the sustainability of the cooperative’s operation, stimulate its potential to innovate and adapt to the market, and reduce the stagnation of operation due to mismanagement. After adding the mediating variable, the regression coefficient c’ of Dem_T of demonstration cooperatives on the stagnation of operation of cooperatives Empty2 decreases significantly compared with that of the original equation and passes the Sobel test, indicating that government subsidies play an intermediary role in the management of stagnation of operation of cooperatives through the evaluation of demonstration cooperatives and that demonstration cooperatives that have received government subsidies are more able to improve production efficiency and product quality, as well as expand market promotion. Demonstration societies that receive government subsidies are more capable of improving production efficiency and product quality, expanding marketing efforts and sales networks, and thus enhancing market competitiveness, which is conducive to the management of stagnation of operation leading to the problem of “empty shells”.
Government subsidies play an intermediary role in the process of evaluating demonstration cooperatives’ ability to manage “empty shell” cooperatives, which is one of the transmission paths that has been examined. Government subsidies provide cooperatives with the necessary financial support so that they can gain advantages in product pricing, technological innovation, and market expansion, which not only helps to increase the economic returns of cooperative members and enhance their motivation to participate in cooperatives, but also helps to enhance the market adaptability and business continuity of cooperatives, and the two work together to effectively avoid the problem of “ empty shells” caused by human resource depletion and operational stagnation.

4.2.2. Loan Facilities

We also focus on the impact mechanism of loan facilities in the assessment of demonstration cooperatives in managing cooperatives’ human resource depletion. The test results are shown in Table 5. Regarding the regression coefficient a of demonstration cooperative rating the mediator variable, loan facilities, a is significantly positive, indicating that cooperatives being rated as demonstration cooperatives effectively enhance their ability to access capital and promote access to loan facilities. The regression coefficient b of Loanprof is significantly negative, indicating that there is a negative correlation between demonstration cooperatives’ access to loan facilities and the “empty shell” cooperatives’ human resource depletion. In other words, the loan facilities allow the cooperatives to have more resources to enhance the willingness of farmers to participate, strengthen the construction of internal human resources, and effectively reduce the probability of cooperatives facing the empty shell problem due to the loss of farmers. The regression coefficient c’ of Dem_T is no longer significant after adding the mediator variable c’, and the value of Sobel is significantly negative, indicating that there is a significant mediating effect on the ability of demonstration cooperatives to manage the “empty shell” cooperative due to human resource depletion problem and that demonstration cooperatives can help cooperatives to obtain loan facilities, and enhance the development capacity of cooperatives. The model society rating will help cooperatives to obtain loan facilities, enhance the development capacity of cooperatives, increase the possibility of members of the cooperative obtaining more income and benefits, and increase the opportunities for members to obtain education and training, which will, in turn, increase the enthusiasm of farmers to participate and engage in the cooperative and avoid the problem of the cooperative becoming an empty shell due to the loss of members.
Secondly, we focus on the mechanism of the impact of loan facilities in the assessment of demonstration cooperatives to manage cooperatives’ operational stagnation. Obtaining loan facilities means that cooperatives can more easily obtain the essential operating funds, easing the financial pressure that exists in cooperatives in general, helping cooperatives to continue daily operations and respond to sudden business risks in the agricultural market while also enabling them to continue production and services and avoid stagnation due to a lack of funds. While easing the financial pressure on cooperatives, loan facilities provide economic security for cooperatives in expanding their existing operations or exploring new modes of profitability, helping to attract customers and partners, strengthen the market position of cooperatives, and further increase the vitality of their operations, ultimately helping to avoid operational stagnation leading to the problem of “empty shells”.
Table 6 shows the results of loan facilities as a mediating variable, in which the regression coefficient a of Dem_T on Loanprof is positive and passes the significance test, and the assessment of demonstration cooperatives is effective in favor of cooperatives’ access to loan facilities. And the regression coefficient b of Loanprof is significantly negative, which indicates that loan facilities provided by demonstration cooperatives are conducive to the continuous updating of their operation strategies and commercial modes, as well as to the maintenance of their operational vitality and profitability. The regression coefficient b of Loanprof is significantly negative, indicating that the loan facilities brought by the demonstration cooperatives are conducive to the continuous updating of their operation strategies and business models, helping to maintain their operational vitality and profitability and effectively reducing the problem of the empty shell effect caused by the stagnation of operation of the cooperatives. After adding mediating variables into the regression model, the absolute value of the regression coefficient c’ of Dem_T decreases more, and the Sobel value is significant, indicating that the mediating effect of loan facilities in the evaluation of demonstration cooperatives in managing the stagnation of operation of cooperatives passes the Sobel test and exerts a mediating effect. The demonstration cooperatives assessment brings loan facilities to the awarded cooperatives, which contributes to the improvement of the cooperatives’ financial liquidity and the formation of market competitiveness, which increases the demonstration cooperatives’ ability to gain income through their operation activities and reduces the risk of operational stagnation.
In summary, the mediating role of demonstration cooperatives’ loan facilities in demonstration cooperatives’ ratings is another transmission path for demonstration cooperatives’ ratings to combat the “empty shell” cooperative problem. The assessment of demonstration cooperatives enhances the credibility of cooperatives, making them more popular among financial institutions and thus facilitating more loan opportunities. The loan facilities can improve the income and welfare of farmers in demonstration cooperatives, increase access to education and training, effectively enhance farmers’ participation and loyalty, and help to avoid the risk of human resource depletion in cooperatives; stronger liquidity also enables cooperatives to ensure continuity of operations. And it becomes possible for cooperatives to enhance market competitiveness by expanding their business. Stronger financial liquidity also makes it possible for cooperatives to ensure continuity of operations and enhance their market competitiveness by expanding their businesses, thus improving their overall profitability. The synergies between them can effectively respond to and combat the problem of “empty shells” in cooperatives.
In addition, in human resource management, access to loans enhances cooperatives’ financial capacity, enabling them to offer better economic incentives, leading to higher incomes and improved welfare, while also funding training and skill development. These factors strengthen member commitment and participation, reducing the risk of empty shell cooperatives caused by member depletion. Policymakers should optimize financial support mechanisms by encouraging financial institutions to provide low-cost loans to demonstration cooperatives, enhancing their ability to invest in human capital. And in operational stability and market competitiveness, loan facilities alleviate financial constraints that cause operational stagnation while supporting business expansion and innovation. Demonstration cooperatives that access loans can broaden marketing channels, improve product competitiveness, and strengthen market resilience. Governments and financial institutions should refine credit rating systems to facilitate long-term financial partnerships, improving cooperatives’ financing capacity and reducing the risk of empty shell cooperatives forming due to operational stagnation.
Loan facilities enhance both short-term financial stability and long-term competitiveness, significantly lowering the likelihood of empty shell cooperatives. Future policies should refine loan allocation mechanisms to ensure that financial resources are directed toward cooperatives with strong development potential, promoting sustainable growth.

4.3. Result from Moderating Effect

4.3.1. Member Size

The member size of a cooperative is a reflection of its resource integration capacity and risk resilience. An increase in the size of members can help cooperatives improve its ability to translate potential preferential policies for demonstration cooperatives. Larger member size of cooperatives often implies powerful resource integration ability and economies of scale, and these cooperatives can integrate more capital, human resources, and information. It also means stronger bargaining power in raw material procurement and product sales, providing the basis for technological innovation and commercial model innovation. Demonstration cooperatives can better exert the effect of demonstration cooperatives’ evaluation policy on the governance of “empty shell” cooperatives and improve operational efficiency and market competitiveness. When they are assessed as demonstration cooperatives, they will be able to better utilize the effects of the demonstration cooperatives assessment policy on the management of “shell cooperatives” and improve their operational efficiency and market competitiveness.
Since member size is directly related to “empty shells” resulting from human resource depletion in cooperatives, we focus only on the moderating effect of Empty2.
The regression results are shown in Table 7. Larger-member-size cooperatives are more likely to have advantages in resource integration and risk resistance, have stronger market adaptability and flexibility, and may take advantage of the many kinds of supporting and preferential policies provided by the government when they are evaluated as demonstration cooperatives, and they are more likely to make use of these advantages to consolidate their established market position, respond quickly to changes in market demand, optimize the process of the production, processing, and marketing of agricultural products, and avoid the risk of “shelling out” due to the stagnation of operation. With respect to avoiding the risk of stagnant operations leading to “empty shells”, the regression coefficients of Dem_T on operational stagnation in demonstration cooperatives (Empty2) are all significantly negative, and the evaluation of demonstration cooperatives can effectively manage the problem of “empty shell” formation due to the stagnation of operation. The regression coefficients of the cooperative member size Memnum are also significantly negative, which indicates that the larger the size of cooperatives, the greater the ability to utilize resources and resist the risk, and the stronger the stagnation of operation is. The regression coefficient of the cross-multiplier Dem_T*Memnum is also significantly negative, with the same sign as the regression coefficient of the variables of demonstration cooperatives, indicating that the size of cooperatives plays a positive regulating role in the process of evaluating demonstration cooperatives to manage the risk of stagnation of operation and that as the member size of the cooperatives expands, their market adaptability and potential for further development are gradually enhanced so that they can better utilize potential preferential policies and make better use of their potential preferential policies in being evaluated as demonstration cooperatives. As the size of the cooperative expands, its market adaptability and potential for further development gradually increase, and when it is assessed as a demonstration cooperative, it is able to make better use of potential preferential policies, achieve sustained innovation and investment, and give better play to the effects of the policy of assessing demonstration cooperatives to manage “empty shell” cooperatives.
Expanding cooperative member size strengthens resource integration capacity and risk resilience. The findings indicate that demonstration cooperative evaluation enhances policy advantages, improving access to government support and market resources. Cooperatives with a larger member size demonstrate greater market adaptability and operational flexibility, allowing them to utilize policy incentives more effectively. Increased production efficiency, optimized business models, and expanded market presence further reinforce their sustainability. Policymakers should consider member size as a factor in the demonstration cooperative evaluation process, encouraging larger cooperatives to apply for recognition to maximize policy benefits.
Larger cooperatives also have greater access to external funding and skilled labor, improving long-term operational stability and reducing the risk of operational stagnation leading to empty shell cooperatives. Strengthening financial support policies such as low-interest loans or targeted funding programs for demonstration cooperatives can enhance their capital liquidity and market competitiveness. Government efforts to align demonstration cooperative evaluation with financial assistance mechanisms will further promote sustainable cooperative development and improve overall agricultural sector efficiency. Integrating policy incentives with cooperative growth strategies will help mitigate empty shell risks and ensure long-term sectoral stability.

4.3.2. Education Level

The education level of cooperative members characterizes, to a certain extent, the upper limit of the cooperative’s management ability and market sensitivity. Cooperatives with members who have higher education experience have certain advantages in being awarded demonstration cooperatives. First, members with higher education experience are more likely to help cooperatives accept and introduce innovative management experience and operation models. They can help improve the operational efficiency of cooperatives and optimize the allocation of resources. Second, members with higher education experience are more likely to have market research and analysis skills. This helps to assist cooperatives in identifying product and service strategies that meet market demand, consolidate the advantageous position of demonstration cooperatives in market competition, and strengthen the policy effects of demonstration cooperatives’ ratings. Educated members are likely to provide possibilities for the further development of demonstration cooperatives in terms of operational management level, promotion of technological innovation, and development of diversified income sources. This is conducive to strengthening the effectiveness of demonstration cooperatives in combating the stagnation of operation and “empty shell” cooperatives.
The regression results are shown in Table 8. The regression coefficient of cooperative members’ education level Edu is significantly negative, indicating that cooperative members’ higher education experience can alleviate the “empty shell” problem caused by the stagnation of operation. The regression coefficient of the cross-multiplier Dem_T*Edu is significantly negative, with the same sign as the regression coefficient of the demonstration cooperatives evaluation variable, indicating that the educational level of cooperative members can strengthen the policy effect of rating demonstration cooperatives. Cooperative members with higher education experience can help enhance the operational vitality and profitability of cooperatives and have a positive moderating effect on the probability of operational stagnation and “empty shell” cooperative formation in the rating of demonstration cooperatives.
The education level of cooperative members plays a crucial role in management capability and market responsiveness. The findings indicate that cooperatives with higher-educated members are more likely to adopt innovative management models, enhance operational efficiency, and optimize resource allocation. Educated members also possess stronger market research and analytical skills, allowing cooperatives to develop market-driven strategies, strengthen competitive advantages, and reinforce the effectiveness of demonstration cooperative evaluation policies. Policymakers should consider member education levels when evaluating demonstration cooperatives, ensuring that cooperatives with higher management and market capabilities receive proper recognition to maximize policy benefits.
A well-educated workforce improves cooperative governance, fosters technological innovation, and supports diverse revenue streams, reducing the risk of operational stagnation leading to empty shell cooperatives. Targeted training programs, knowledge-sharing platforms, and skill development initiatives can further support demonstration cooperatives in strengthening internal management and adopting advanced business models. Additionally, aligning demonstration cooperative evaluation with human capital investment policies can provide preferential financing options for cooperatives with highly educated members. Enhancing market adaptability and sustainability through education-driven policy support will ensure the long-term effectiveness of demonstration cooperative policies, mitigating the risk of empty shell cooperatives and fostering sustainable growth.

4.3.3. Leading Entity

The leading entity of a cooperative reflects, from a certain point of view, its familiarity with policy and its ability to secure resources. When the leading entity of a cooperative is a village cadre, the cooperative often has a certain competitive advantage. On the one hand, as members or important participants in grassroots self-governing organizations, village cadres have a stronger ability to understand policies. They can effectively disseminate government support policies and resources to cooperatives. On the other hand, reputation and credibility are also important assets that village cadres bring to the cooperative, which can increase the credibility of cooperative members and aid the cooperative’s standing in the market, thus attracting more labor, capital investment, and market trading opportunities. After obtaining demonstration cooperative ratings, cooperatives whose leading entities are communist village cadres are able to comprehend and implement the relevant preferential policies quickly and enhance the market competitiveness of cooperatives through the help of the government, which has become a possible mechanism of action for demonstration cooperative ratings.
First, we focus on the mechanisms underlying leading entities’ influence (Empty1) in demonstration cooperative rating. The regression results are shown in Table 9. The regression coefficient of the leading entity Leader is significantly negative. This shows that there is a negative correlation between cooperatives whose leading entity is a member of a village cadre and human resource depletion. This type of cooperative is relatively less prone to the “empty shell” problem. Combined with the sample interval of 2018 to 2023 in this paper, this result also affirms, to a certain extent, the effectiveness of the implementation of China’s “Special Work Program for Launching the Cleanup of ‘Empty Shell’ Cooperatives of Farmers’ Specialized Cooperatives”, implemented in 2019. The negative impact of “empty shells” on cooperatives whose leading entities are village cadres due to local governments’ fulfillment of targets is no longer statistically significant. Compared with the baseline regression results, the cross-multiplier Dem*Leader coefficient in the moderated effects model is significantly negative. This indicates that there is a moderating effect of the leading entity when considering “empty shell” cooperatives in the process of demonstration cooperative rating to manage cooperatives’ human resource depletion. When cooperatives led by village cadres are rated as demonstration cooperatives, they show stronger attraction to farmers and enhance the governance effect of demonstration cooperative rating.
The next step is to focus on the mechanism of leading entities’ influence on Empty2 in demonstration cooperative rating. Village cadres, as key characters in the connection between the government and administrative villages, have a higher degree of familiarity with policies. The cooperatives led by them tend to show stronger decision-making ability, market adaptability and innovation ability. Faced with the information and resource advantages brought about by demonstration cooperative rating, the cooperatives they lead are able to adjust their production structure and expand or adjust their business scope more quickly. On the other hand, the development of farmers’ specialized cooperatives can become a part of their work responsibilities, and there is incentive compatibility between the objectives of their positions and those of the cooperatives, which is more likely to stimulate the operational vitality and development potential of the cooperatives and reduce the risk of stagnation of operation.
Table 9 shows the results of the moderating effect of the leading entity of the cooperative. This study shows that the regression coefficient of the leading entity Leader is significantly negative, indicating that the leading entity being a member of a village cadre effectively reduces the risk of stagnation of operation leading to the “empty shell” problem. The regression coefficient of the cross-multiplier Dem_T*Leader indicates that cooperatives with village cadres have stronger market decision-making ability and show faster market reaction speed and stronger continuous innovation motivation after being recognized as demonstration cooperatives. This reduces the risk of stagnation of operation leading to “empty shells”.
In summary, leading entities play a positive regulatory role in the process of demonstration cooperative rating to address the problem of “empty shell” cooperatives. On the one hand, the social status and credibility of village cadres can enhance the attractiveness of cooperatives. Being recognized as demonstration cooperatives can further expand their influence and attract more farmers to join them. When facing the threat of human resource depletion, they can provide better working conditions and stable income to retain farmers. On the other hand, the leadership and organizational skills of village cadres enable cooperatives to respond more flexibly to market changes. At the same time, they can better utilize the resource advantages brought by demonstration cooperatives to respond quickly to market demand, innovate products and services, and reduce the likelihood of cooperatives experiencing operational stagnation.

4.3.4. Equity Structure

Now, we turn our focus toward the influence of equity structure (Empty1) in demonstration cooperative rating. For members with high investment, the fact that they pay a huge amount of investment but cannot obtain the corresponding decision-making power may reduce their motivation to invest and their loyalty to the cooperative. In the actual production and operation, members with a high contribution can obtain stronger decision-making power by means of divestment and intimidation, while members with a low contribution cannot obtain the right of “one person, one vote”, which may lead to a decrease in their motivation to participate in the production and operation of the cooperative. When a cooperative is evaluated as a demonstration cooperative, it may bring about a new direction of development and distribution of benefits. An overly centralized equity structure may exacerbate internal conflicts within cooperatives and weaken the effectiveness of demonstration cooperative rating in combating human resource depletion in cooperatives.
As shown in Table 10, the regression coefficient of Capstr is significantly positive, indicating that there is a positive correlation between the concentration of cooperative contributions and the problem of human resource depletion and empty shells. The fact that the largest equity investor in the cooperative owns more than 67% of the shares implies that there is a serious problem of “non-proportionality” in the decision-making power within the cooperative. This has a negative impact on the participation of both higher- and lower-contributing members and increases the risk of human resource depletion in the cooperative. The regression coefficients of the cross-multiplier Dem_T*Capstr indicate that the concentration of contributions has a negative moderating effect on the demonstration cooperative rating of the process of managing human resource depletion in cooperatives. The problem of “non-proportionality” in decision-making power caused by excessive capitalization may exacerbate conflicts among cooperators, reduce farmers’ incentives to participate in cooperative production and management, and eliminate the policy effects of demonstration cooperative rating.
We will now focus on the equity structure mechanisms’ influence (Empty2). On the one hand, the “non-proportionality” of decision-making power associated with the investment structure may not result in the cooperative experiencing operational stagnation. Regardless of which members drop out, the remaining members may feel more motivated to invest in and promote the cooperative because their decision-making power is proportional to their economic inputs. And decision-making in proportion to capital contributions may lead to a more rational distribution of profits, thus attracting more capital investment. On the other hand, the cooperatives may change from an inclusive agricultural cooperative organization to an operation model closer to an enterprise, resulting in the alienation of the cooperative from an agribusiness.
The regression results are shown in Table 10, where the regression coefficient of Capstr is significantly negative. It shows that the higher concentration of investment in the cooperative alleviates the risk of stagnation of operation to a certain extent. The problem of “non-proportionality” of decision-making power within the cooperative may eventually lead to the withdrawal of some members. Reducing the mismatch between decision-making power and contribution ratio among the remaining members makes it easier to implement the cooperative’s decisions and improves the vitality of the cooperative’s production and operation. The regression coefficients of the cross-multiplier Dem_T*Capstr and the coefficient of Dem_T indicate that the concentration of capital contribution plays a positive moderating effect in the mechanism of demonstration cooperative rating. Although cooperatives may face the risk of becoming empty shells due to the loss of staff, the unity of decision-making among the remaining members increases the enthusiasm and efficiency of management. However, in this case, although the cooperative has apparently avoided stagnation of operation, it has essentially been alienated and is no longer a professional farmer cooperative operating under the principle of equality, being without the social responsibility and agricultural development goals that cooperatives should have.
In summary, there is a complex moderating effect of equity structure mechanisms affecting demonstration cooperative rating. On the one hand, the “unstructured” issue of decision-making power caused by the concentration of contributions. After being awarded the demonstration cooperatives, it may exacerbate the power struggle within the cooperatives and reduce the motivation of cooperative members to participate. It may play a negative moderating role in demonstration cooperative rating to combat human resource depletion and “empty shell” cooperatives. On the other hand, the remaining members may adjust their decision-making mode according to the proportion of their contributions, and the dynamic decision-making mode will be gradually rationalized. While the demonstration cooperative rating plays a positive role in managing the stagnation of operation and “empty shell”, the alienation of these cooperatives is based on the withdrawal of some farmers or the concession of their rights, which is contrary to the purpose of farmers’ cooperation and common development emphasized in the Cooperative Law.

5. Conclusions

Due to the imperfect laws and regulations related to cooperatives, the low threshold for establishment, internal operational misconduct, financing difficulties, and other problems, the “empty shell” problem in the context of cooperatives has become one of the problems hindering the development of Chinese agriculture. Building on a mediation effect model and a moderating effect model, this study uses data from 1570 cooperatives in a particular city in Guizhou Province (matched with the CCAD database) to examine how China’s demonstration cooperative rating policy helps mitigate the “empty shell” problem in farmer professional cooperatives. The main findings are as follows:
First, demonstration cooperative rating exerts a positive influence on alleviating both human resource depletion and operational stagnation in cooperatives. As indicated by Li et al. (2024) [4], securing “demonstration” status strengthens cooperatives’ credibility, enhancing their likelihood of obtaining government subsidies and more favorable loan conditions. These two financing channels, in turn, increase farmer participation and promote sustained operations. In particular, government subsidies help cooperatives improve product pricing, foster technological innovation, and stabilize operations. Meanwhile, loan facilities improve the internal financial liquidity of cooperatives, allowing them to expand production, invest in new business endeavors, and minimize the risk of human resource attrition and operational stagnation.
Second, cooperative-specific characteristics—member size, education level, leading entity, and equity (capital contribution) structure—moderate the effects of demonstration policies through different channels. Large-member cooperatives possess stronger resource integration and risk mitigation capacities, thereby better leveraging policy benefits. Higher education levels among members increase the cooperative’s managerial and market-sensing capabilities, reinforcing the governance effects of demonstration cooperatives, which is consistent with the results of Afolabi and Ganiyu (2021) [29]. When the leading entity is a village cadre, a cooperative typically has higher policy familiarity, stronger resource-mobilization capacity, and greater social credibility [32,33,34]. These qualities collectively strengthen cooperatives’ responses to policy incentives [35]. By contrast, capital structures with high concentration can produce “non-proportionality” between financial input and decision-making power [36]. Although, under certain conditions, the concentration of ownership may help avoid operational stagnation, it can also exacerbate conflicts and reduce farmer incentives for participation, thereby offsetting some of the policy’s advantages.
Overall, although demonstration cooperatives are not a cure-all—cooperatives may still struggle with issues like elite capture or leadership rent-seeking [5]—the evidence presented here shows that the demonstration cooperative rating policies meaningfully reduce the incidence of “empty shell” cooperatives. These findings align with broader analyses of how government support mechanisms can improve cooperative resilience and spur rural development [10,12].
The practical implications of this study suggest several key policy directions. Strengthening the pilot demonstration cooperatives policy is essential to enhance governance through cooperative evaluations, reducing resource wastage, safeguarding social credibility, and lowering regulatory costs in agriculture. Expanding financial and policy incentives—especially government subsidies and preferential loans—will further improve cooperative sustainability and operational resilience. Additionally, to address human capital shortfalls, cooperative development efforts should focus on recruiting, retaining, and utilizing individuals with higher education or specialized skills, ensuring long-term organizational stability. Furthermore, establishing robust benefit-sharing mechanisms will sustain member motivation by balancing decision-making power with financial contributions, fostering continued engagement and commitment to cooperative development.
The “empty shell” phenomenon and demonstration cooperative evaluation in Guizhou Province are briefly compared with the national level of cooperative development in Appendix B. China’s demonstration cooperative system is structured across four administrative tiers—national, provincial, municipal, and county. Although this study focuses on how such ratings influence the “empty shell” phenomenon, its scope remains limited to cooperatives in a city in Guizhou Province. Consequently, the findings could reflect local characteristics. Moreover, data constraints restrict the current research to national- and provincial level demonstration cooperatives, leaving city- and county-level contexts underexamined. Lastly, the impact of demonstration cooperative ratings likely depends on broader factors such as management standards, market conditions, and policy enforcement variables not fully explored here. Thus, while these conclusions offer valuable insights into the relationship between demonstration cooperative evaluations and “empty shell” issues, they require further substantiation before attaining broader applicability.
Future studies may expand the sample to broader regions or a nationwide scope, enabling more comprehensive analyses of demonstration cooperative policies in varying local contexts. Researchers could also assess national-, provincial-, municipal-, and county-level demonstration cooperatives separately to investigate how distinct rating criteria influence the likelihood of “empty shell” outcomes. Additionally, in-depth studies of specific channels—such as the role of government subsidies in promoting innovation or market expansion and the effect of preferential loans on financial structures and risk management—would further elucidate the mechanisms at play. Incorporating additional mediating and moderating variables—for instance, cooperative management capacities, local market dynamics, and the intensity of policy implementation—would provide more nuanced, evidence-based guidance for future policy design.

Author Contributions

Investigation, L.S.; Writing—original draft, J.Y., S.L. and L.S.; Writing—review & editing, L.S.; Visualization, L.S.; Supervision, Y.Z. All authors have read and agreed to the published version of the manuscript.

Funding

This research was funded by National Social Science Fund of China, grant number 24BJY018. The APC was also funded by National Social Science Fund of China 24BJY018.

Data Availability Statement

The original contributions presented in this study are included in the article. Further inquiries can be directed to the corresponding author.

Conflicts of Interest

The authors declare that they have no known competing financial interests or personal relationships that could have appeared to influence the work reported in this paper.

Appendix A. Example of a Field Survey Case

In order to enrich this study, we conducted a supplementary case analysis of farmer professional cooperatives in a particular city in Guizhou Province, identifying eight typical cooperatives (Table A1). By promoting collaboration and alliances among key agricultural actors, these cooperatives share resources and risks, achieve economies of scale, and enhance both productivity and competitiveness. After being recognized as demonstration cooperatives, they demonstrated favorable economic and social outcomes, thus bolstering the representativeness of our focus on Guizhou-based cooperatives. Within these eight cases, each demonstration cooperative exhibits distinct characteristics that transmit or reinforce the impact of the evaluation system on cooperative development, thereby deepening our understanding of the policy mechanisms involved.
Table A1. Case analysis of cooperatives in a city in Guizhou Province.
MechanismTypical CasesCase Commentary
Direct Transmission MechanismGovernment SubsidiesAfter being rated as a provincial-level demonstration cooperative, Cooperative A secured multiple government subsidies to fund orchard management across the village. In 2022, its fruit output value reached CNY 7.2 million, and through project coverage and technical services, it supported 550 households, increasing per capita income by CNY 2200.By achieving demonstration cooperative status, cooperatives can secure additional government subsidies, expand their core business operations, and, therefore, increase farmers’ incomes.
Loan FacilitationCooperative B relied on its demonstration cooperative status to successfully obtain loans by pledging independent corporate assets and absorbed CNY 3.16 million in social capital for the establishment of a farm machinery operation center. Its total turnover increased from CNY 14.12 million in 2022 to CNY 21.164 million in 2023.Demonstration cooperative status also enables cooperatives to obtain more loans and attract external capital, resulting in marked improvements in operational performance.
Moderating MechanismMember SizeIn 2022, Cooperative C planted 200 mu (approx. 13.3 hectares) of maize and other crops, with annual operating income amounting to CNY 3.6 million and generating employment for over 1000 individuals. In 2023, the acreage expanded to 650 mu (approx. 43.3 hectares), with an expected output value of CNY 8.35 million, and stable employment rose to 1100.Economies of scale enhance a cooperatives’ capacity for technology diffusion and economic resilience, thereby improving operational performance and driving local employment and income growth for farmers.
Member Education LevelBy introducing agricultural experts and offering substantial technical training, Cooperative D has trained more than 600 individuals over recent years, thereby boosting farmers’ technical capabilities and productivity. An increasing number of migrant workers and university graduates have returned to rural areas, leveraging advantages in drone-based pest control and green prevention methods.Mechanisms for talent attraction and development significantly strengthen a cooperative’s market adaptability, fostering innovation in service provision. Evidently, the rising educational level of members further drives cooperative innovation and improves operational performance.
Leading EntityThe director of Cooperative E worked closely with Village Secretary to mobilize local residents for broader pomelo cultivation, thereby raising local incomes. When F Cooperative was initially set up, top-down policy support and resource integration by the leading entity enabled it to achieve scaled-up operations and notable economic benefits within a short time.When village cadres serve as leading entities, their stronger grasp of policy requirements and communication channels allows for the direct and effective allocation of government support and resources, thus enhancing the cooperative’s operational outcomes.
Equity StructureCooperative G adopts a scheme whereby 90% of total sales are returned to members, with 10% retained as cooperative development funds, thus safeguarding member interests and providing a financial base for long-term growth. Cooperative H follows the model of “leading enterprise + cooperative + farmers”, ensuring that both contributing members and ordinary farmers benefit from its development.A well-structured capital contribution system within the cooperative safeguards members’ interests, alleviates internal conflicts, and provides financial and human resource support for long-term development, thereby enhancing overall operational efficiency.
Data source: summarized and analyzed by the author based on the survey data.

Appendix B

Based on a dataset of cooperatives located in a particular city in Guizhou Province, this paper further examines the demonstration cooperative rating process and the “empty shell” phenomenon.
As shown in Figure A1, between 2018 and 2022, the overall severity of cooperative “empty shell” issues in this city gradually declined. In terms of spatial effects, the degree of “empty shell” problems intensifies from north to south, such that most northern regions experienced a decrease in “empty shell” severity, while some southeastern regions exhibited an increase. Nevertheless, the problem remains serious overall.
Figure A1. Evolutionary distribution of “empty shell” cooperatives in a city in Guizhou Province. Data source: mapped based on survey samples from a city in Guizhou Province matched with the CCAD database. (a) Distribution of “empty shell” severity among cooperatives in 2018. (b) Distribution of “empty shell” severity among cooperatives in 2022.
Land 14 00557 g0a1
Table A1 presents descriptive statistics on the cooperatives recognized as “demonstration cooperatives” across different administrative levels. Both national-level and provincial-level demonstration cooperatives show a steady upward trend in their total numbers over time; however, the two-year incremental increase in the number of national-level demonstration cooperatives shows a gradual slowdown. Overall, significantly fewer cooperatives are granted national-level status than provincial-level status. Within a constant total number of cooperatives, the count of all other cooperatives (i.e., those not recognized as any level of demonstration cooperative) decreases each year, although at a diminishing rate. This indicates that the quota for national-level demonstration cooperatives is more limited and the selection process more stringent, underscoring the rarity and high standards of national-level recognition. Against the backdrop of a stable total number of cooperatives, those not awarded any form of demonstration status are declining in number, albeit more slowly, reflecting a broader shift toward greater standardization and professionalism within the cooperative sector.
Table A2. Descriptive statistics and trends of demonstration cooperatives at various levels.
Year201820192020202120222023
Number of National-Level Demonstration Cooperatives323238383939
Number of Provincial-Level Demonstration Cooperatives2828130130171171
Total Number of Demonstration Cooperatives4242147147188188
Number of Other Cooperatives (Non-Demonstration)152815281423142313821382
Data source: survey samples from Qiannan Prefecture, Guizhou Province, matched with the CCAD database.
As illustrated in Figure A2, between 2018 and 2022, the overall proportion of demonstration cooperatives in a particular city in Guizhou Province steadily increased. Notably, the southern areas exhibited a relatively larger rise in the share of demonstration cooperatives. A comparison of Figure A1 and Figure A2 reveals that, on the whole, demonstration cooperative policies have, to some extent, curbed the escalation of the “empty shell” phenomenon. Nevertheless, certain localities simultaneously exhibit both a high proportion of “empty shell” cooperatives and high concentration of demonstration cooperatives trend in these regions.
Figure A2. Evolutionary distribution of demonstration cooperative shares in a city in Guizhou Province. Data source: compiled and mapped using survey samples from a particular city in Guizhou Province, matched with the CCAD database. (a) Proportion of demonstration cooperatives in 2018. (b) Proportion of demonstration cooperatives in 2022.
Land 14 00557 g0a2
Our comparative analysis of cooperatives in this city (see Appendix B) and nationwide cooperatives (as discussed in the Introduction) reveals notable discrepancies in both sales performance and organizational size. These differences underscore the unique developmental path and achievements of this local cooperative sector, thereby offering valuable insights for enhancing cooperative governance on a broader scale. Furthermore, an in-depth examination of the successful experiences highlights the pivotal role of strong policy support and effective implementation in sustaining the healthy development of cooperatives.

Notes

1
Data source: Ministry of Agriculture and Rural Affairs of the People Republic of China, http://www.moa.gov.cn/govpublic/CWS/202307/t20230720_6432521.htm, accessed on 3 March 2025.
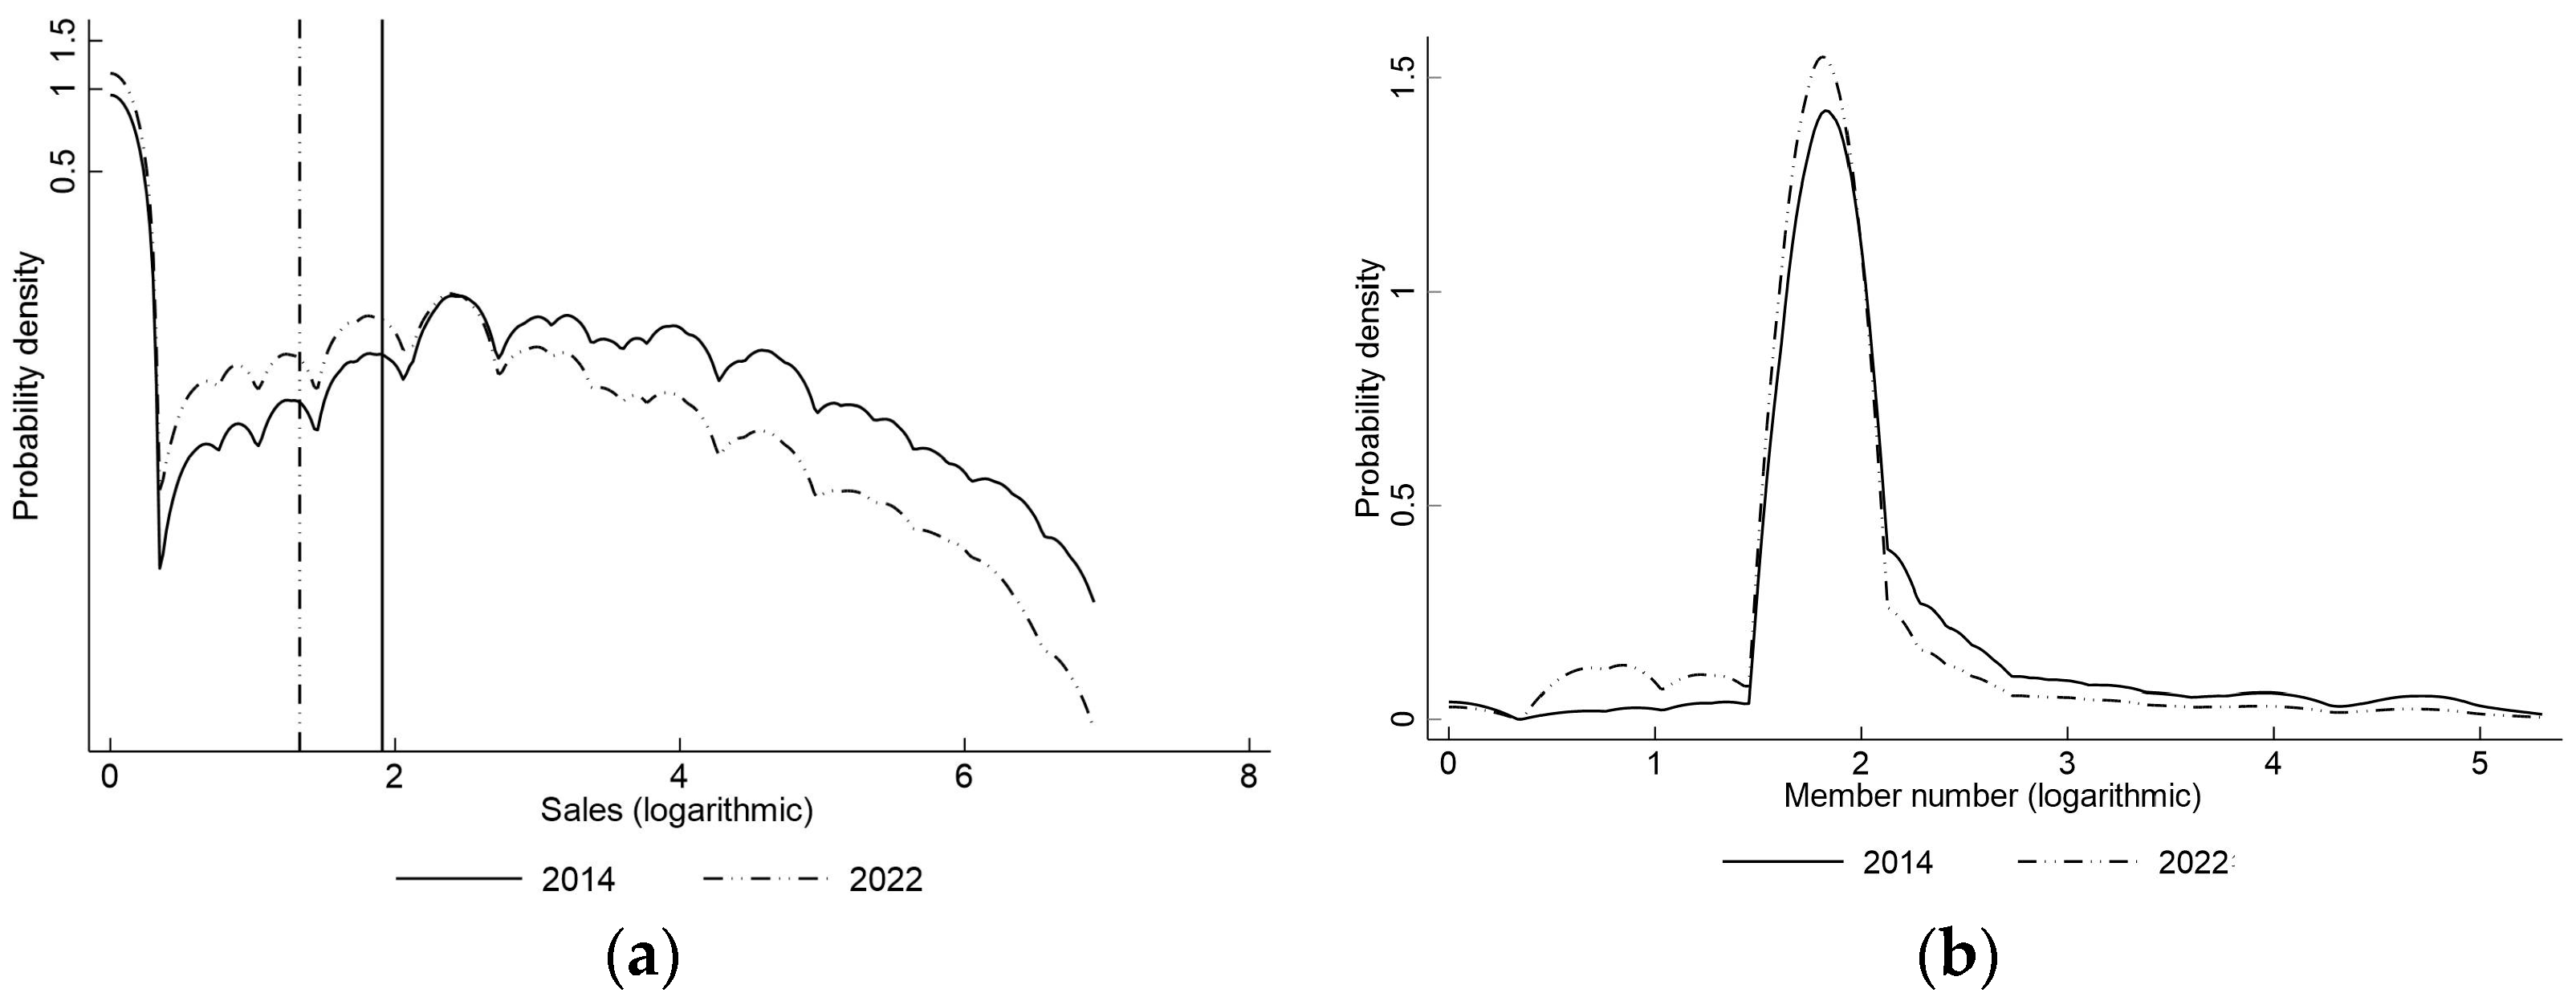
2
Considering the wide range of distribution of cooperative sales data, in order to reveal the trend of cooperative operation performance more significantly, we especially focused on cooperatives with sales in the range of CNY 0–10 million and plotted the probability density of sales (logarithmic value).
3
Considering the large range of cooperative member size, in order to reveal the trend of cooperative organization size more significantly, we especially focused on cooperatives with a member size in the range of 0–200 to draw the probability density map of cooperative organization size.
4
The vertical lines represent the (log) mean of sales.
5
See note 1 above.

References

  1. Chen, A.; Scott, S. Rural development strategies and government roles in the development of farmers’ cooperatives in China. J. Agric. Food Syst. Community Dev. 2014, 4, 35–55. [Google Scholar] [CrossRef]
  2. Mojo, D.; Fischer, C.; Degefa, T. The determinants and economic impacts of membership in coffee farmer cooperatives: Recent evidence from rural Ethiopia. J. Rural Stud. 2017, 50, 84–94. [Google Scholar] [CrossRef]
  3. Wang, M.; He, B.; Zhang, J.; Jin, Y. Analysis of the effect of cooperatives on increasing farmers’ income from the perspective of industry prosperity based on the PSM empirical study in Shennongjia region. Sustainability 2021, 13, 13172. [Google Scholar] [CrossRef]
  4. Li, S.; Zhou, Y.; Li, C. The Impact of Demonstration Cooperatives on the “Empty Shell” of Farmer Professional Cooperatives in China. Land 2024, 13, 950. [Google Scholar] [CrossRef]
  5. Wu, J.; Luo, Y. Analysis the Problem of “Shelling” of Specialized Farmers’ Cooperatives and Its Governing Countermeasures: Take Guizhou Province as an Example. J. Asia Soc. Sci. 2022, 8, 31–48. [Google Scholar] [CrossRef]
  6. Bijman, J.; Iliopoulos, C. Farmers’ cooperatives in the EU: Policies, strategies, and organization. Ann. Public Coop. Econ. 2014, 85, 497–508. [Google Scholar] [CrossRef]
  7. Liang, Q.; Dong, H.; Bailey, A.R.; Hu, W.; Jia, F. Exploring multiple drivers of cooperative governance: A paired case comparison of vegetable growing cooperatives in the UK and China. Int. Food Agribus. Manag. Rev. 2022, 25, 651–670. [Google Scholar] [CrossRef]
  8. Sebhatu, K.T.; Gezahegn, T.W.; Berhanu, T.; Maertens, M.; Van Passel, S.; D’Haese, M. Conflict, fraud, and distrust in Ethiopian agricultural cooperatives. J. Co-Oper. Organ. Manag. 2020, 8, 100106. [Google Scholar] [CrossRef]
  9. Qiu, Y.; Bai, Y.; Wu, J.; Zeng, X.; Zhang, L. Impact of Farmer Cooperatives on Labor Employment: Evidence from Rural China. Land 2024, 13, 2242. [Google Scholar] [CrossRef]
  10. Fulton, M.; Giannakas, K. Organizational commitment in a mixed oligopoly: Agricultural cooperatives and investor-owned firms. Am. J. Agric. Econ. 2001, 83, 1258–1265. [Google Scholar] [CrossRef]
  11. Giagnocavo, C. People-centred businesses: Co-operatives, mutuals and the idea of membership. Can. J. Nonprofit Soc. Econ. Res. 2011, 2. [Google Scholar] [CrossRef]
  12. Valentinov, V. Why are cooperatives important in agriculture? An organizational economics perspective. J. Institutional Econ. 2007, 3, 55–69. [Google Scholar] [CrossRef]
  13. Rey, R.; Tirole, J. Financing and access in cooperatives. Int. J. Ind. Organ. 2007, 25, 1061–1088. [Google Scholar] [CrossRef]
  14. Afanaseva, O.; Elmov, V.; Ivanov, E.; Makushev, A. Factors that facilitate development of small agricultural cooperative farm alliances. In IOP Conference Series: Earth and Environmental Science; IOP Publishing: Bristol, UK, 2021; p. 012045. [Google Scholar]
  15. Arthur, W.B. Competing technologies, increasing returns, and lock-in by historical events. Econ. J. 1989, 99, 116–131. [Google Scholar] [CrossRef]
  16. March, J.G.; Olsen, J.P. The uncertainty of the past: Organizational learning under ambiguity. Eur. J. Political Res. 1975, 3, 147–171. [Google Scholar] [CrossRef]
  17. Liu, G.; Qiao, D.; Liu, Y.; Fu, X. Does Service Utilization Improve Members’ Welfare? Evidence from Citrus Cooperatives in China. Sustainability 2022, 14, 6755. [Google Scholar] [CrossRef]
  18. Minah, M. What is the influence of government programs on farmer organizations and their impacts? Evidence from Zambia. Ann. Public Coop. Econ. 2022, 93, 29–53. [Google Scholar] [CrossRef]
  19. Xin, L.; Wang, Q. An Analysis of the Accessibility of Property Mortgage Loans for Farmer Cooperatives in Heilongjiang Province. Theory Pract. Financ. 2016, 5, 65–68. (In Chinese) [Google Scholar]
  20. Zhang, L.; Chen, Z. Have Farmer Cooperatives Improved Farmers’ Social Capital? An Empirical Analysis Based on Survey Data from 506 Households in Yunnan Province. China Rural Surv. 2021, 1, 106–121. (In Chinese) [Google Scholar]
  21. Guz, N.; Dubrova, M. Financial mechanism of state support for agricultural cooperatives in the Republic of Tatarstan. BIO Web Conf. 2024, 116, 05009. [Google Scholar] [CrossRef]
  22. Alipbeki, O.A.; Zhenskhan, D.; Nukesheva, A.Z.; Asilov, B.U. Assessment of mechanisms for subsidizing agricultural cooperatives. Bull. Turan Univ. 2024, 1, 115–128. (In Kazakh) [Google Scholar] [CrossRef]
  23. Zheng, Y.; Mei, L.; Chen, W. Does government policy matter in the digital transformation of farmers’ cooperatives?—A tripartite evolutionary game analysis. Front. Sustain. Food Syst. 2024, 8, 1398319. [Google Scholar] [CrossRef]
  24. Gurmessa, N.E.; Ndinda, C.; Agwanda, C.; Akiri, M. Partial credit guarantee and financial additionality for smallholders coffee cooperatives: Experience from Ethiopia. Dev. Pract. 2022, 32, 1049–1062. [Google Scholar] [CrossRef]
  25. Hando, H.; Senapathy, M.; Bojago, E. Determinants of member participation in activities of multipurpose primary cooperatives: The case of Kindo Koysha district, southern Ethiopia. Adv. Agric. 2022, 2022, 3569016. [Google Scholar] [CrossRef]
  26. Kehinde, A.D.; Ogundeji, A.A. The simultaneous impact of access to credit and cooperative services on cocoa productivity in South-western Nigeria. Agric. Food Secur. 2022, 11, 11. [Google Scholar] [CrossRef]
  27. Dong, Y.; Mu, Y.; Abler, D. Do farmer professional cooperatives improve technical efficiency and income? Evidence from small vegetable farms in China. J. Agric. Appl. Econ. 2019, 51, 591–605. [Google Scholar] [CrossRef]
  28. Wassie, S.B.; Kusakari, H.; Sumimoto, M. Do Members Commit to Their Cooperatives? An Econometric Analysis of Members’ Commitment in Ethiopia. Jpn. J. Agric. Econ. 2020, 22, 141–146. [Google Scholar]
  29. Afolabi, S.N.; Ganiyu, Y.O. Impact of cooperative membership on rural income generation in Southwest, Nigeria. REVESCO Rev. Estud. Coop. 2021, 138, 140–152. [Google Scholar]
  30. Maini, E.; De Rosa, M.; Vecchio, Y. The role of education in the transition towards sustainable agriculture: A family farm learning perspective. Sustainability 2021, 13, 8099. [Google Scholar] [CrossRef]
  31. Pachoud, C.; Delay, E.; Da Re, R.; Ramanzin, M.; Sturaro, E. A relational approach to studying collective action in dairy cooperatives producing mountain cheeses in the Alps: The case of the Primiero cooperative in the Eastern Italians Alps. Sustainability 2020, 12, 4596. [Google Scholar] [CrossRef]
  32. Chen, W.; Shen, Q. Party Branch-led Cooperatives and Effective Village Governance: A Case Study of W Village in Yantai City. J. Northwest AF Univ. 2022, 22, 10–19. (In Chinese) [Google Scholar]
  33. Meng, F. The Formation, Impact, and Regulation of Rural Large-Scale Farmers Leading Cooperatives. Issues Agric. Econ. 2016, 9, 71–79. [Google Scholar]
  34. Yang, C. Relationship Governance in “Elite-led Cooperatives”: An Empirical Study Based on 35 Elite-led Cooperatives. J. Nanjing Agric. Univ. 2016, 16, 44–53. (In Chinese) [Google Scholar]
  35. Liu, Z.; Qu, J.; Wu, X.; Niu, X.; Feng, S. Improving member satisfaction with cooperatives: The role of participation in governance. Ann. Public Coop. Econ. 2024, 95, 703–722. [Google Scholar] [CrossRef]
  36. Ma, M.; Zhu, H. Efficiency of decisions under membership heterogeneity and government regulations: Insights from farmer cooperatives in China. Econ. Dev. Cult. Chang. 2020, 68, 1009–1040. [Google Scholar] [CrossRef]
  37. Matthias, W. Social benefits of cooperatives-an economic perspective. Z. Für Das Gesamte Genoss. 2023, 73, 232–238. [Google Scholar]
  38. De Moura Costa, D.R.; Chaddad, F.; Furquim de Azevedo, P. The determinants of ownership structure: Evidence from Brazilian agricultural cooperatives. Agribusiness 2013, 29, 62–79. [Google Scholar] [CrossRef]
  39. Zhang, Y.; Huang, Z.H. Identfying risks inherent in farmer cooperatives in China. China Agric. Econ. Rev. 2014, 6, 335–354. [Google Scholar] [CrossRef]
  40. Cook, M.L.; Chaddad, F.R. Redesigning cooperative boundaries: The emergence of new models. Am. J. Agric. Econ. 2004, 86, 1249–1253. [Google Scholar] [CrossRef]
  41. Zhong, Z.; Jiang, W.; Li, Y. Bridging the gap between smallholders and modern agriculture: Full insight into China’s agricultural cooperatives. J. Rural. Stud. 2023, 101, 103037. [Google Scholar] [CrossRef]
Figure 1. Probability density plots of farmer cooperatives’ sales and organizational size in China. (a) Probability density plot of farmer cooperatives’ sales in China4. (b) Probability density plot of farmer cooperatives’ organizational size in China. Data source: Zhejiang University Carter—Enterprise Research China Agriculture-related Database (CCAD).
Land 14 00557 g001
Figure 2. Conceptual framework.
Land 14 00557 g002
Table 1. Number of cooperatives and “empty shell” cooperatives.
Year201820192020202120222023
Total number of cooperatives157015701570157015701570
Human resource depletion “empty shell” cooperatives19162934555554
Stagnation of operation “empty shell” cooperatives1286130713021353973966
Data source: survey sample of a city in Guizhou Province matched with CCAD database.
Table 2. Variable definitions and descriptive statistics.
VariableVariable SymbolsDefinitionMean Standard Error
Empty shell cooperativeEmpty1Cooperative of empty Shell = 1; non-empty shell cooperative = 00.1280.334
Empty2Cooperative of empty Shell = 1; non-shell cooperative = 00.7630.425
Demonstration Cooperative Dem_TProvincial and national demonstration cooperatives = 1; other cooperatives = 00.0800.271
Cooperative scaleMemnumThe logarithm of the total number of cooperative members2.0170.933
RegcapThe logarithm of the registered capital—the initial capital scale (10,000 yuan)4.3752.192
Ownership structureCapstrThe largest shareholder (>66%) has absolute control = 1, and others = 00.4420.497
Human capitalLeaderThe main body of the leader is a village cadre = 1, not = 00.5840.493
EduWhether the member has higher education experience (the highest education is college degree or above) = 1; other = 00.1960.397
Business conditionsProfitThe total surplus of cooperatives (10,000 yuan) is positive = 1; other = 00.8250.380
SubprofThe per capita surplus is greater than the subsistence allowance = 1; other = 00.3690.483
YearYears of operation = year of annual report—year of establishment of the cooperative + 18.0172.270
Government supportGovsubThe logarithm of the government’s financial support fund subsidy (10,000 yuan).0.0620.575
LoanprofThe government’s financial loan support is greater than 0 = 1; others = 00.3480.476
Regional macro variablesPpincomeRural per capita disposable income (yuan) is standardized0.1140.101
PagriProportion of agricultural population = agricultural population/total population0.7420.167
Source: “CCAD”, questionnaire survey, and regional statistical annual report collation.
Table 3. Government subsidy mechanisms of Empty1.
Explanatory VariableEmpty1GovsubEmpty1
Dem_T−0.003 ***0.178 ***−0.004
(0.001)(0.020)(0.005)
Govsub −0.006 *
(0.003)
Cooperative control variablesYesYesYes
Government control variablesYesYesYes
Regional control variablesYesYesYes
Time fixed effectYesYesYes
Individual fixed effectYesYesYes
Cons0.045 ***−0.086 ***0.045 ***
(0.007)(0.029)(0.007)
N942094209420
Sobelcc’a
−0.003 ***−0.0040.178 ***
(0.001)(0.005)(0.020)
bSobel
−0.006 *−0.001 *
(0.003)(0.001)
Note: * and *** indicate significance at the 10% and 1% level, respectively.
Table 4. Government subsidy mechanisms of Empty2.
Explanatory VariableEmpty2GovsubEmpty2
Dem_T−0.172 ***0.178 ***−0.104 ***
(0.020)(0.020)(0.018)
Govsub −0.433 ***
(0.012)
Cooperatives control variablesYesYesYes
Government control variablesYesYesYes
Regional control variablesYesYesYes
Time fixed effectYesYesYes
Individual fixed effectYesYesYes
Cons1.067 ***−0.086 ***1.003 ***
(0.030)(0.029)(0.027)
N942094209420
Sobelcc’a
−0.172 ***−0.104 ***0.178 ***
(0.020)(0.018)(0.020)
bSobel
−0.433 ***−0.077 ***
(0.012)(0.009)
Note: *** indicate significance at the 1% level.
Table 5. Loan facility mechanisms of Empty1.
Explanatory VariableEmpty1LoanfrofEmpty1
Dem_T−0.003 ***0.182 ***−0.005
(0.001)(0.020)(0.005)
Loanprof −0.005 *
(0.003)
Cooperatives control variablesYesYesYes
Government control variablesYesYesYes
Regional control variablesYesYesYes
Time fixed effectYesYesYes
Individual fixed effectYesYesYes
Cons0.045 ***−0.112 ***0.044 ***
(0.007)(0.029)(0.006)
N942094209420
Sobelcc’a
−0.003 ***0.0050.182 ***
(0.001)(0.005)(0.020)
bSobel
−0.005 *−0.001 *
(0.003)(0.001)
Note: * and *** indicate significance at the 10% and 1% level, respectively.
Table 6. Loan facility mechanisms of Empty2.
Explanatory VariableEmpty2LoanfrofEmpty2
Dem_T−0.172 ***0.182 ***−0.093 ***
(0.020)(0.020)(0.018)
Loanprof −0.436 ***
(0.012)
Cooperatives control variablesYesYesYes
Government control variablesYesYesYes
Regional control variablesYesYesYes
Time fixed effectYesYesYes
Individual fixed effectYesYesYes
Cons1.067 ***−0.112 ***1.018 ***
(0.030)(0.029)(0.027)
N942094209420
Sobelcc’a
−0.172 ***−0.093 ***0.182 ***
(0.020)(0.018)(0.020)
bSobel
−0.436 ***−0.079 ***
(0.012)(0.009)
Note: *** indicate significance at the 1% level.
Table 7. Member size mechanisms of Empty2.
Explanatory VariableEmpty2
Dem_T−0.085 **
(0.043)
Memnum−0.085 ***
(0.015)
Dem_T*Memnum−0.082 ***
(0.016)
Cooperatives control variablesYes
Government control variablesYes
Regional control variablesYes
Time fixed effectYes
Individual fixed effectYes
Cons1.012 ***
(0.034)
N9420
Note: ** and *** indicate significance at the 5% and 1% level, respectively.
Table 8. Education level mechanisms of Empty2.
Explanatory VariableEmpty2
Dem_T−0.063 *
(0.034)
Edu−0.300 ***
(0.104)
Dem_T*Edu−0.134 ***
(0.046)
Cooperatives control variablesYes
Government control variablesYes
Regional control variablesYes
Time fixed effectYes
Individual fixed effectYes
Cons0.427 ***
(0.061)
N9420
Note: * and *** indicate significance at the 10% and 1% level, respectively.
Table 9. Leading entity mechanisms.
Explanatory VariableEmpty1Empty2
Dem_T−0.039−0.098 ***
(0.045)(0.031)
Leader−0.163 ***−0.153 ***
(0.012)(0.010)
Dem_T*Leader−0.230 ***−0.148 ***
(0.051)(0.037)
Cooperatives control variablesYesYes
Government control variablesYesYes
Regional control variablesYesYes
Time fixed effectYesYes
Individual fixed effectYesYes
Cons0.394 ***
(0.062)
0.858 ***
(0.007)
N94209420
Note: *** indicate significance at the 1% level.
Table 10. Equity structure mechanisms.
Explanatory VariableEmpty1Empty2
Dem_T−0.004−0.015
(0.019)(0.025)
Capstr0.283 ***−0.132 ***
(0.006)(0.009)
Dem_T*Capstr0.160 ***−0.379 ***
(0.022)(0.031)
Cooperatives control variablesYesYes
Government control variablesYesYes
Regional control variablesYesYes
Time fixed effectYesYes
Individual fixed effectYesYes
Cons0.010 **
(0.005)
0.838 ***
(0.006)
N94209420
Note: ** and *** indicate significance at the 5% and 1% level, respectively.
Disclaimer/Publisher’s Note: The statements, opinions and data contained in all publications are solely those of the individual author(s) and contributor(s) and not of MDPI and/or the editor(s). MDPI and/or the editor(s) disclaim responsibility for any injury to people or property resulting from any ideas, methods, instructions or products referred to in the content.

