
A “Foundation-Function-Structure” Framework for Multiple Scenario Assessment of Land Change-Induced Dynamics in Regional Ecosystem Quality


Abstract
1. Introduction
2. Materials and Methods
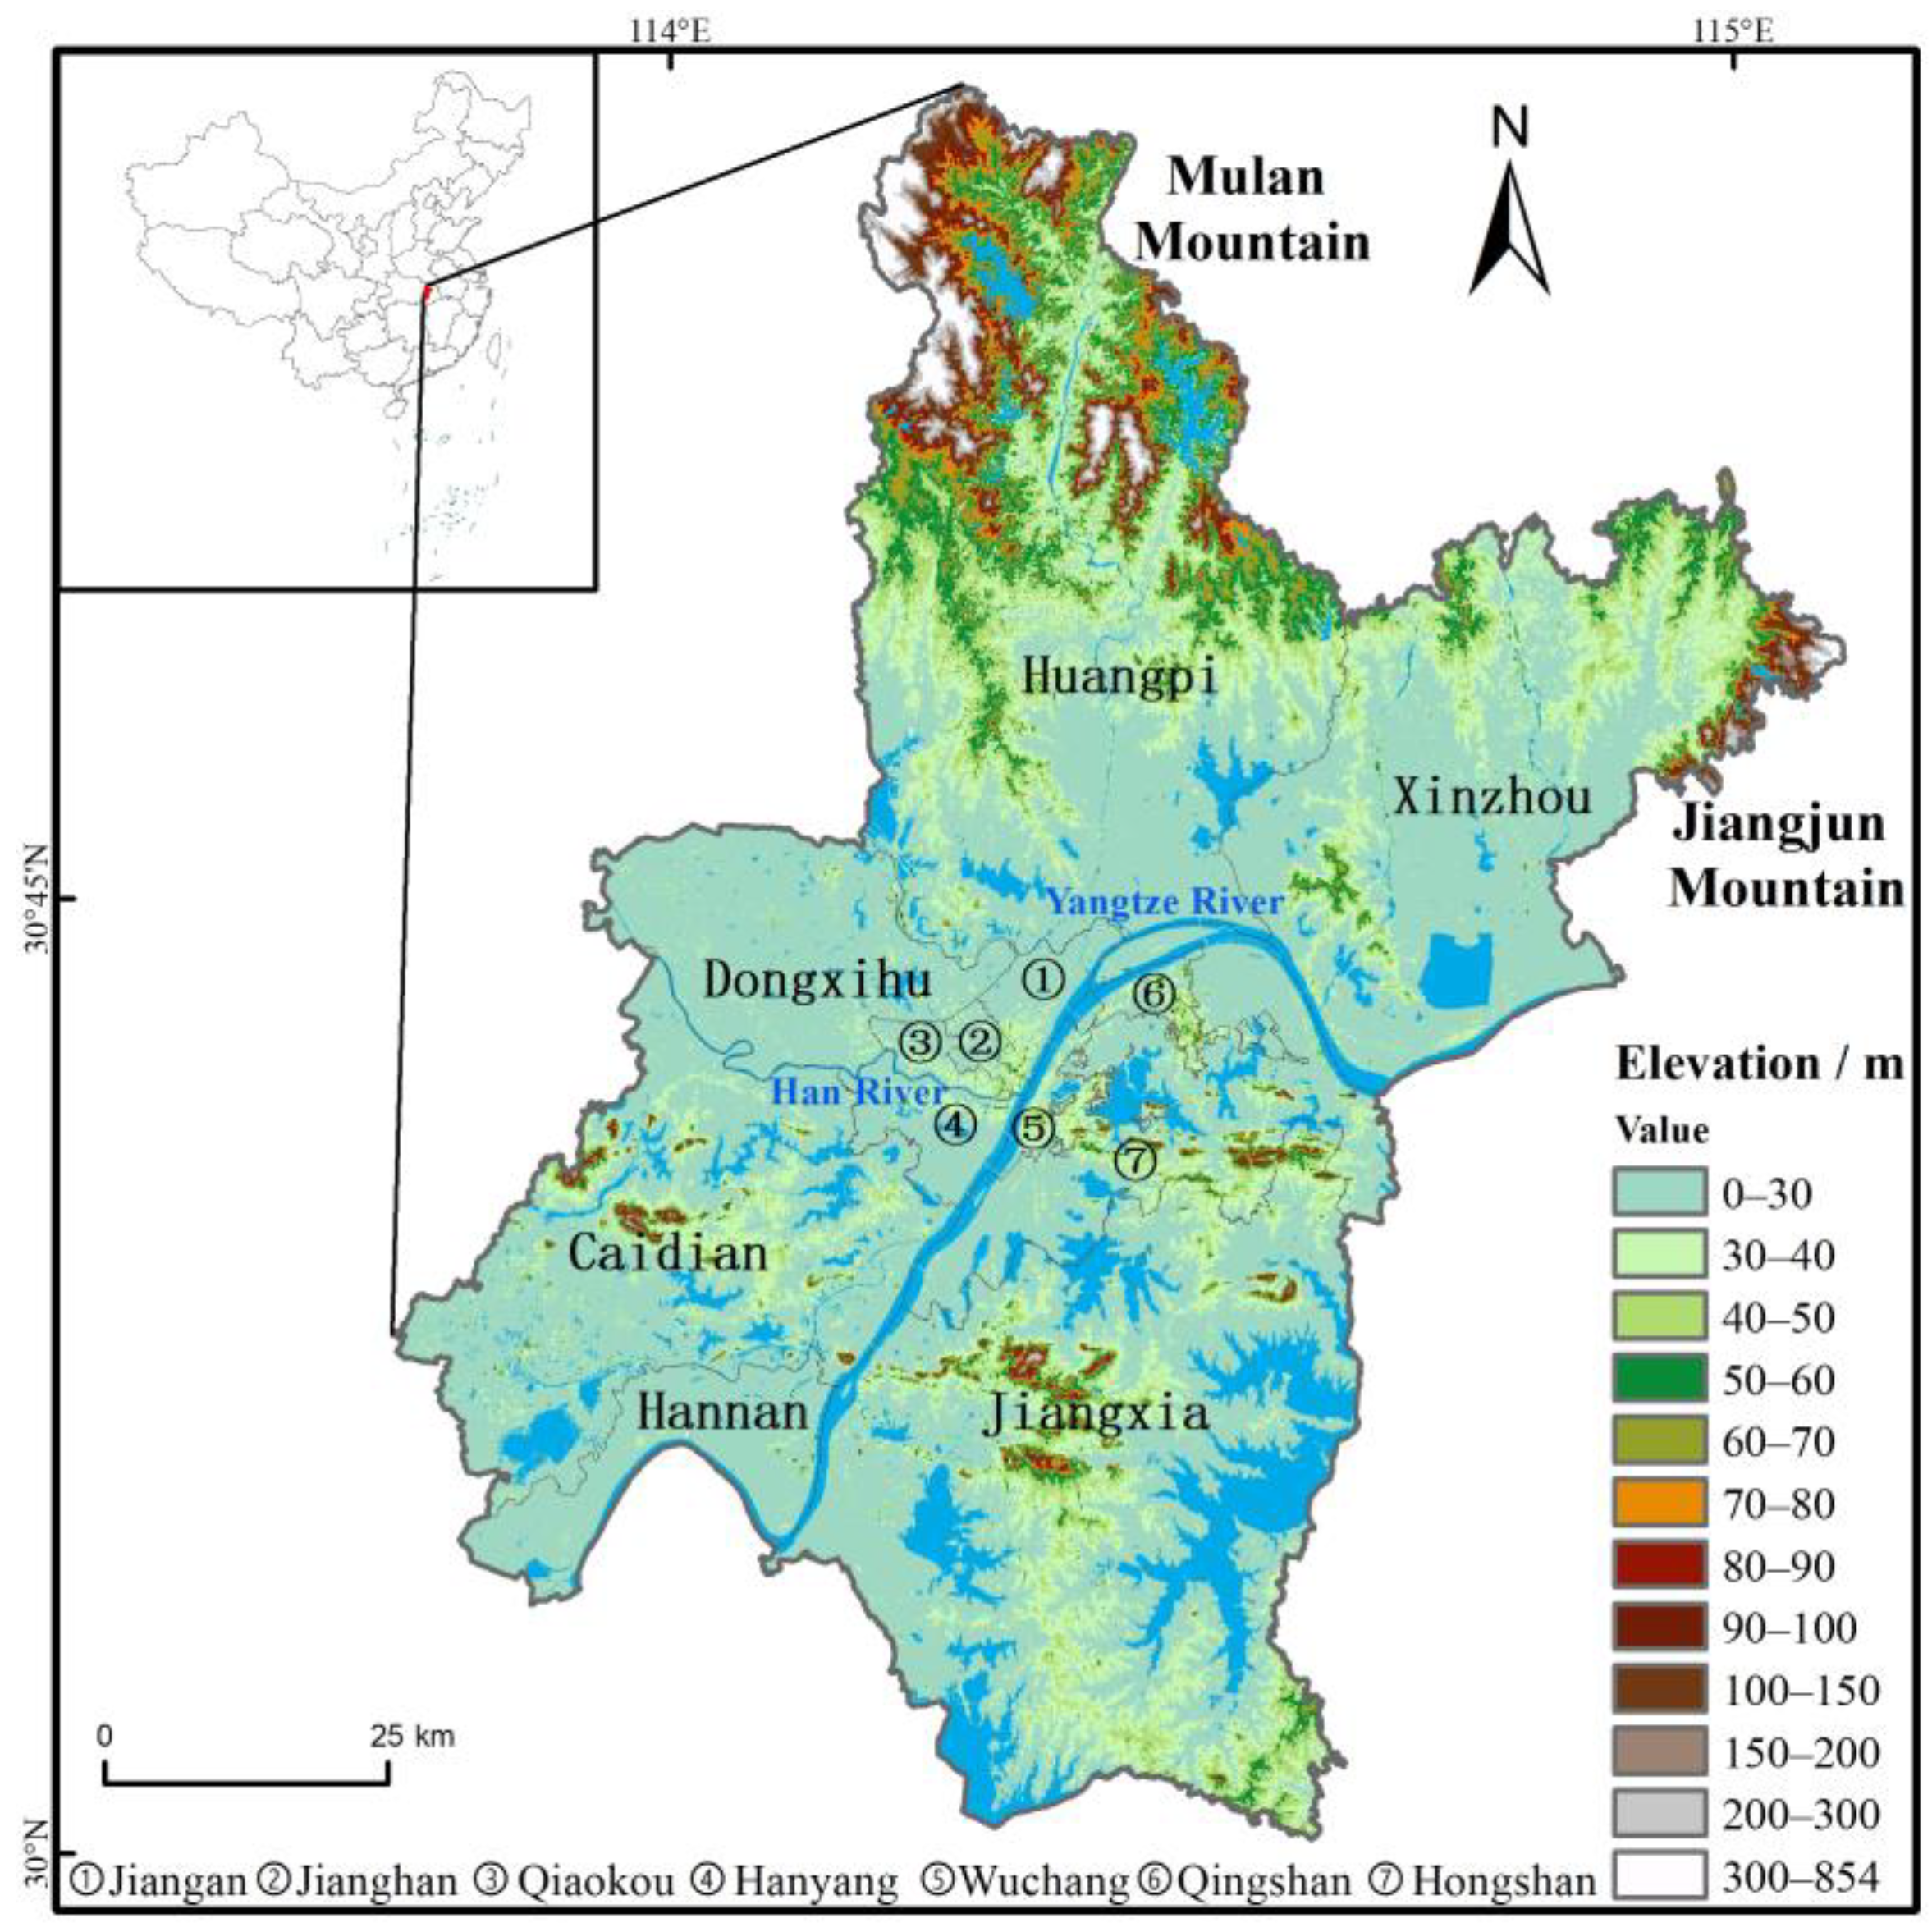
2.1. Study Area
2.2. Data and Preprocessing
2.3. Methodology
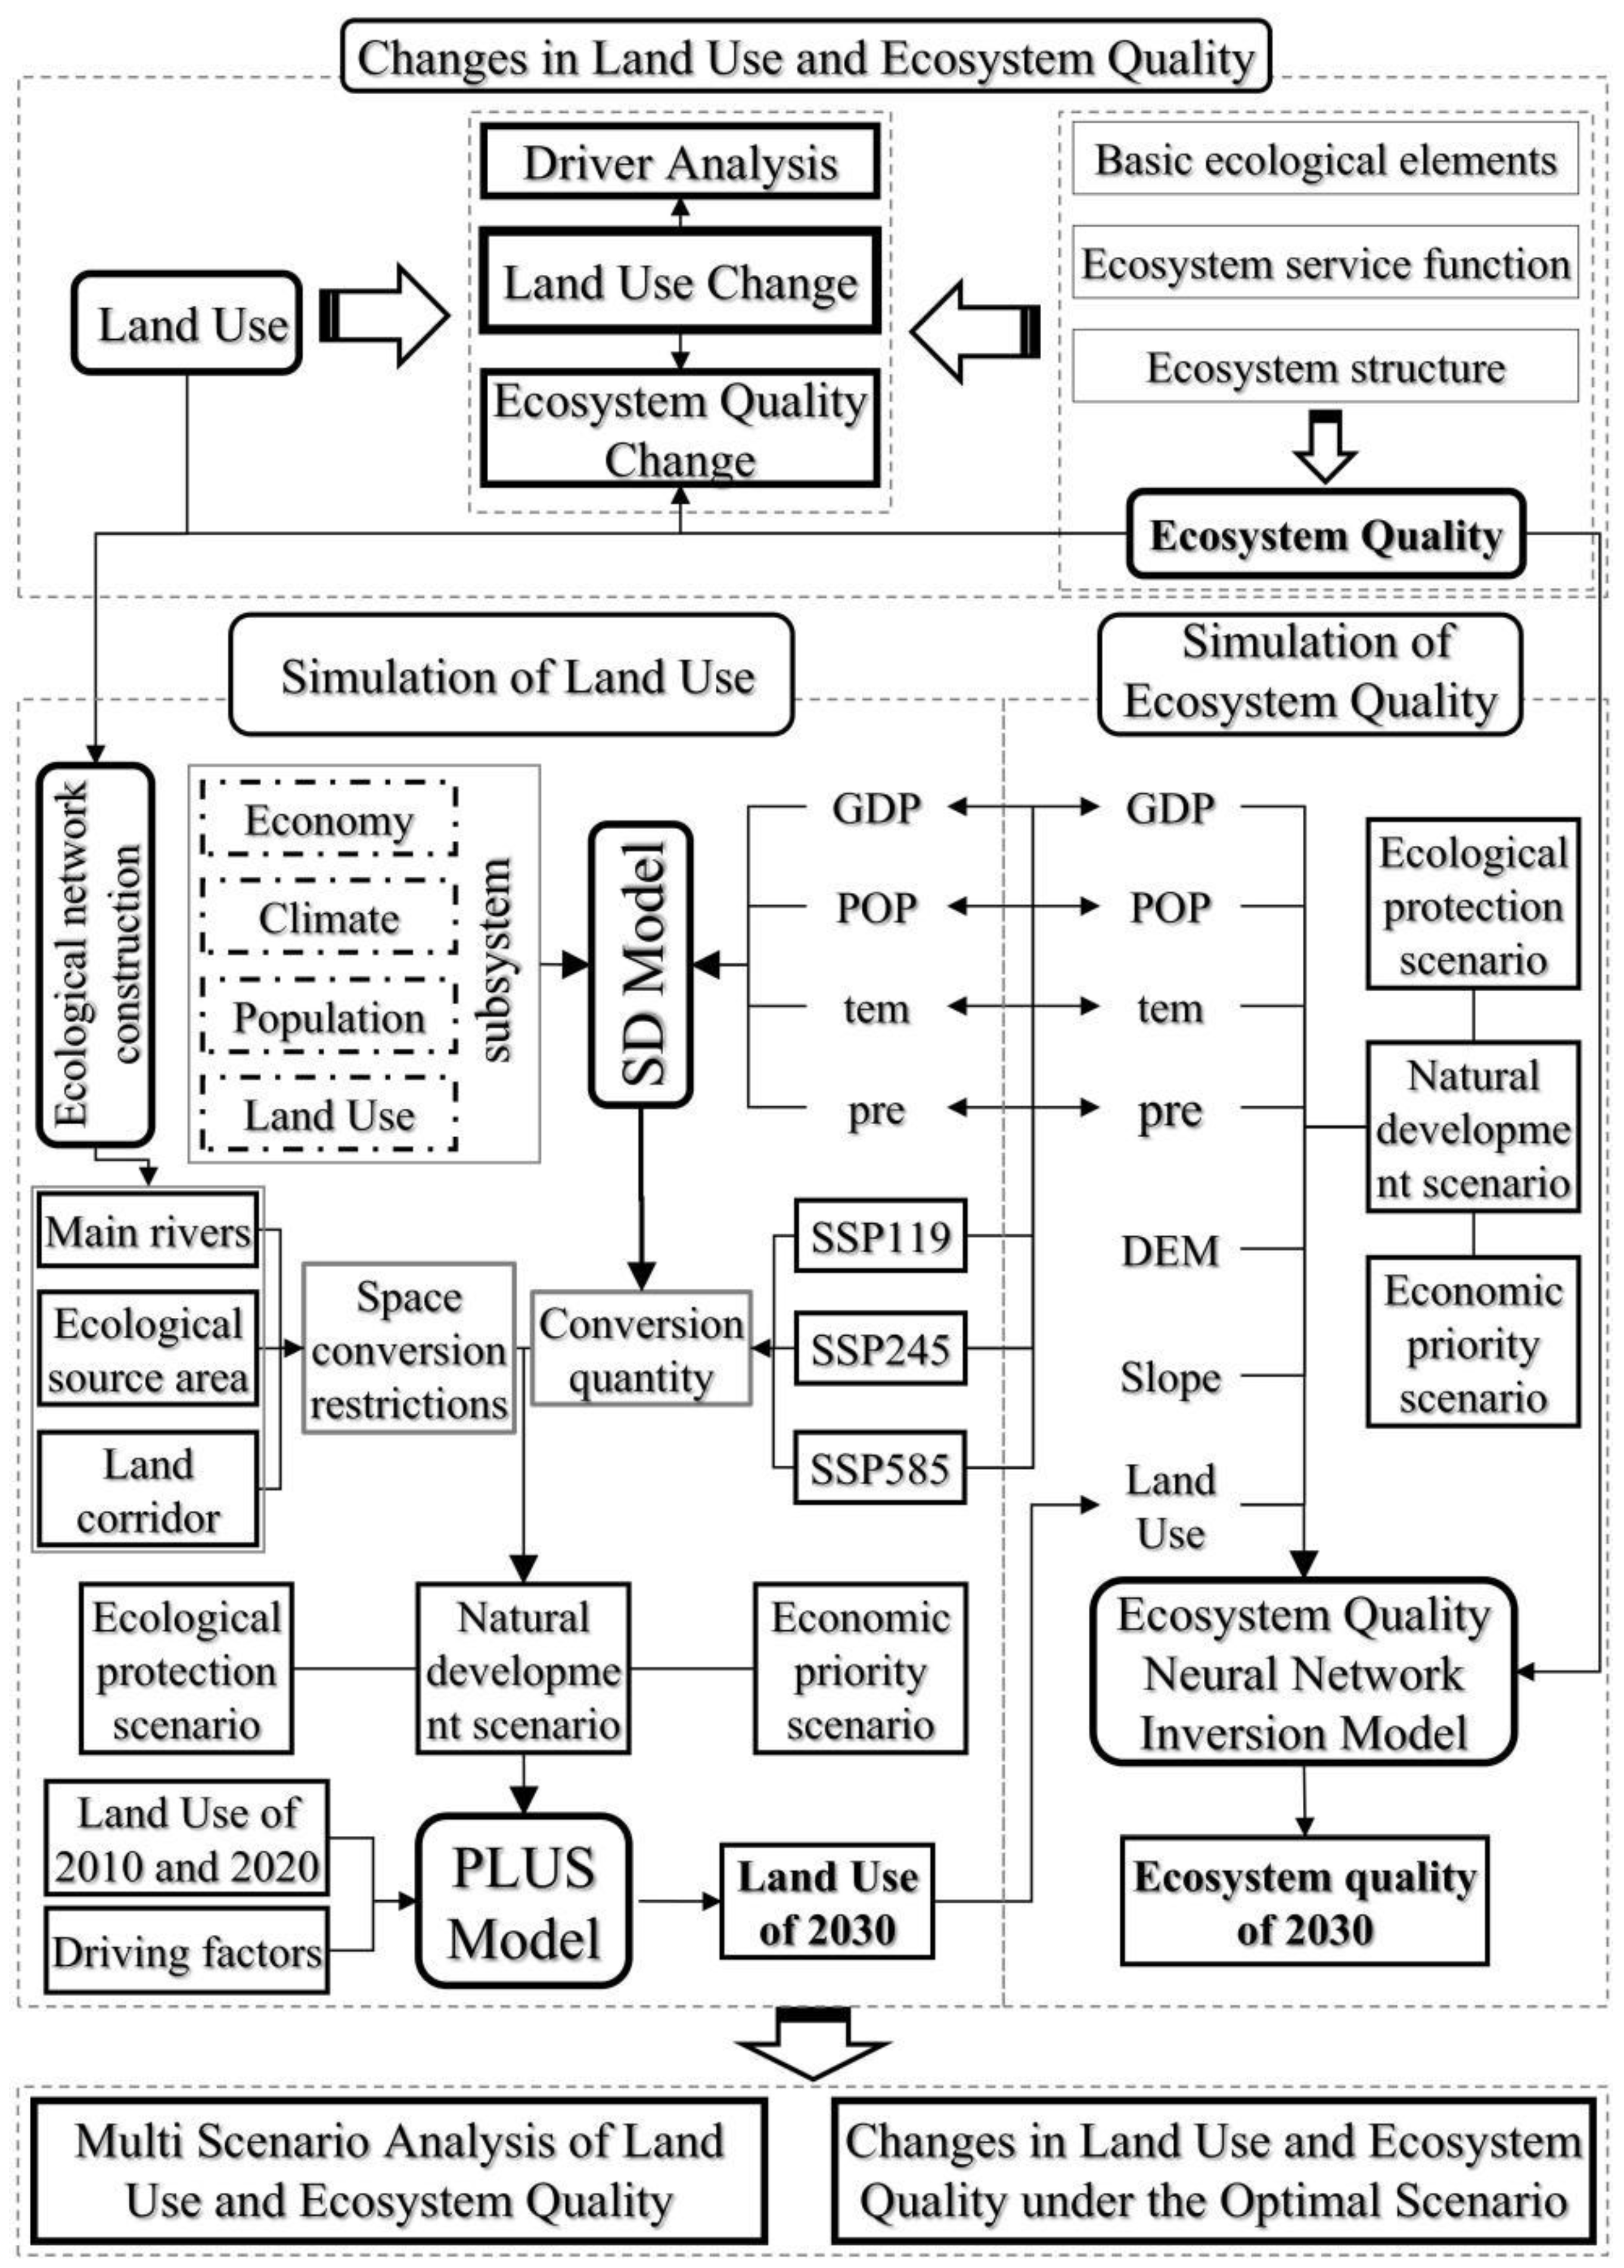
2.3.1. Framework Overview
2.3.2. Assessment of Ecosystem Quality
- (1)
- The “foundation-function-structure” framework for Ecosystem Quality Assessment
- (2)
- Grading system of Ecosystem Quality Change
2.3.3. Land Change Simulation Models
- (1)
- System Dynamics Model for land use quantity simulation
- (2)
- Designation of multiple scenarios based on SSP-RCP pathways
- (3)
- Land change allocation based on the Patch-generating Land Use Simulation Model
2.3.4. Ecosystem Quality Prediction Under Different Scenarios Using Neural Network Model
3. Results and Analysis
3.1. Changes in Land and Ecosystem Quality from 2000 to 2020
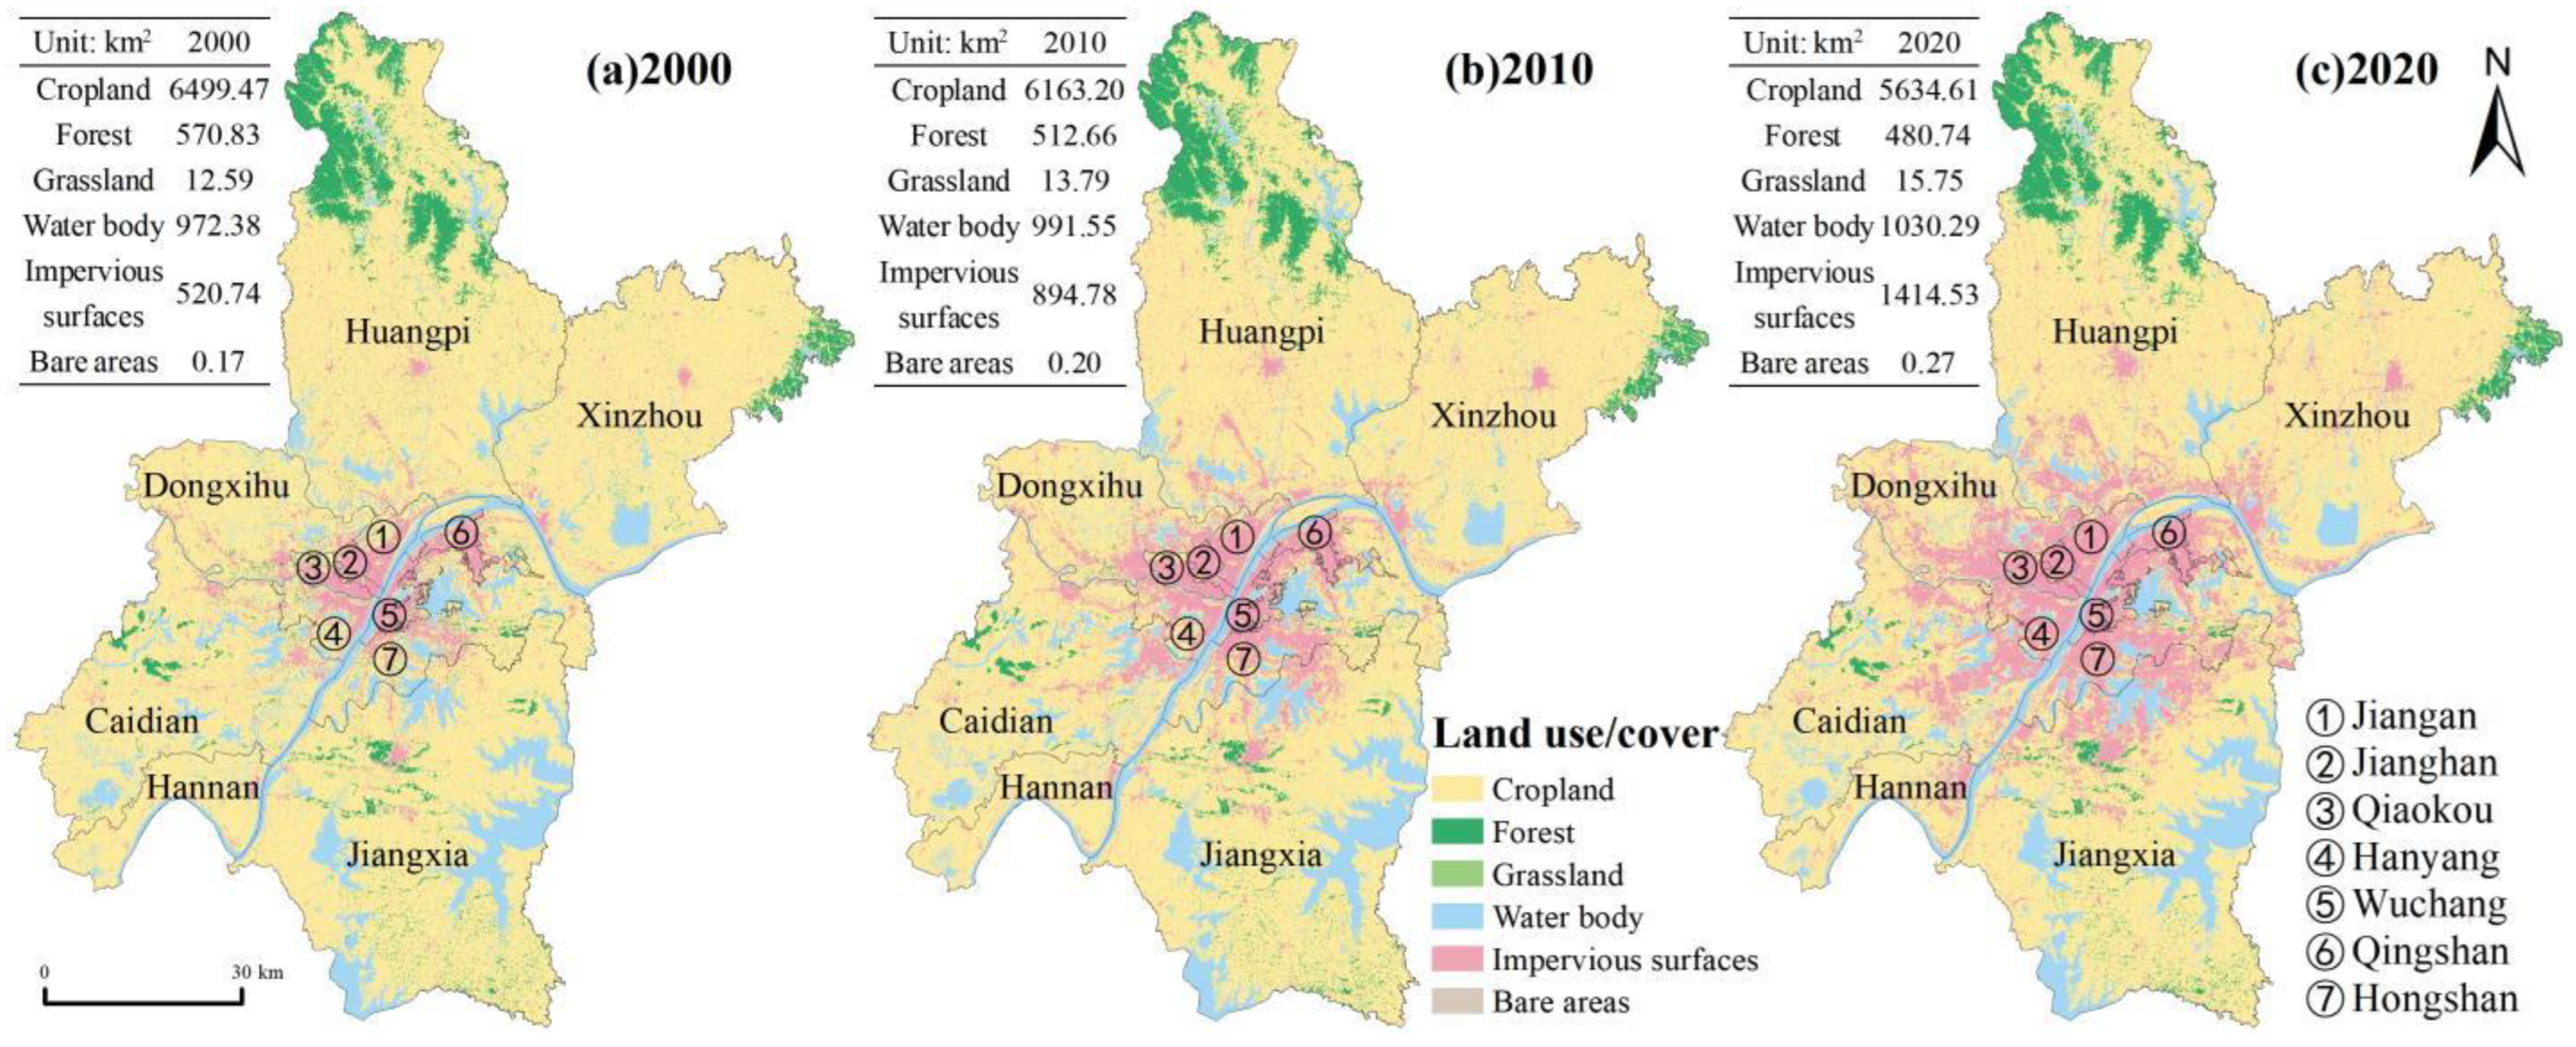
3.1.1. Land Change from 2000 to 2020 in the Study Area
3.1.2. Drivers of Land Changes in the Study Area
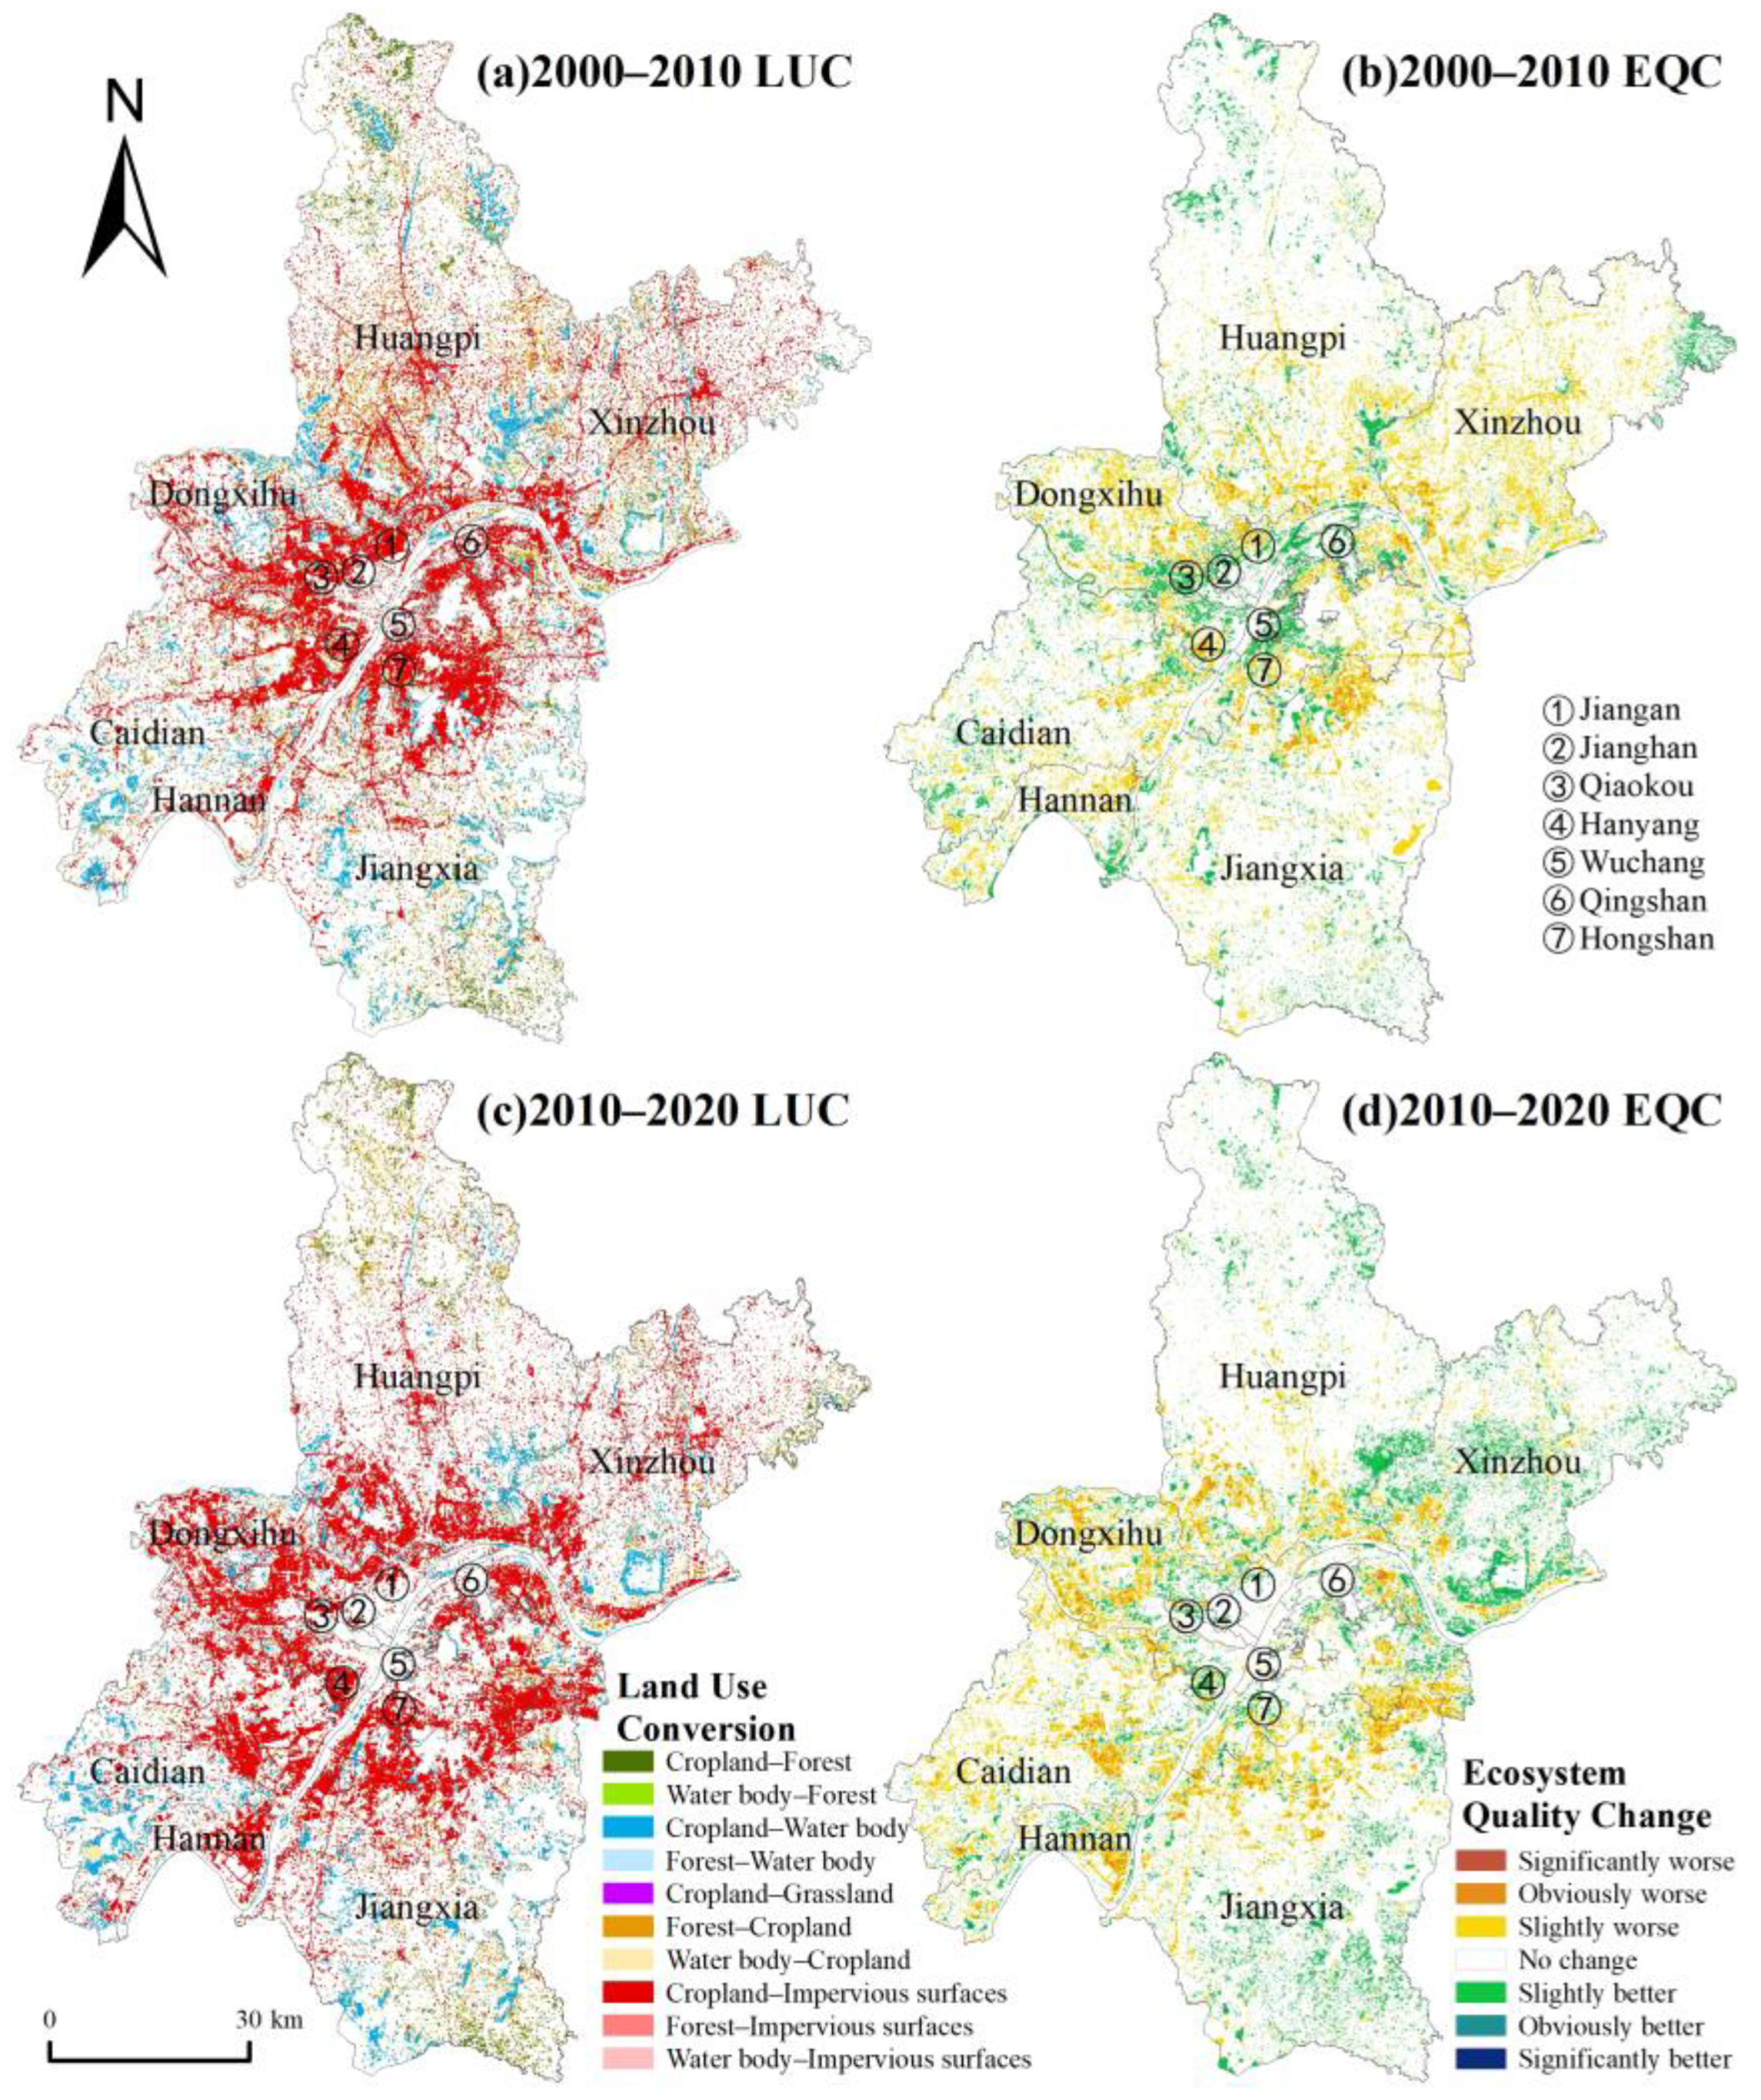
3.1.3. Ecosystem Quality Change from 2000 to 2020 in the Land Change Area
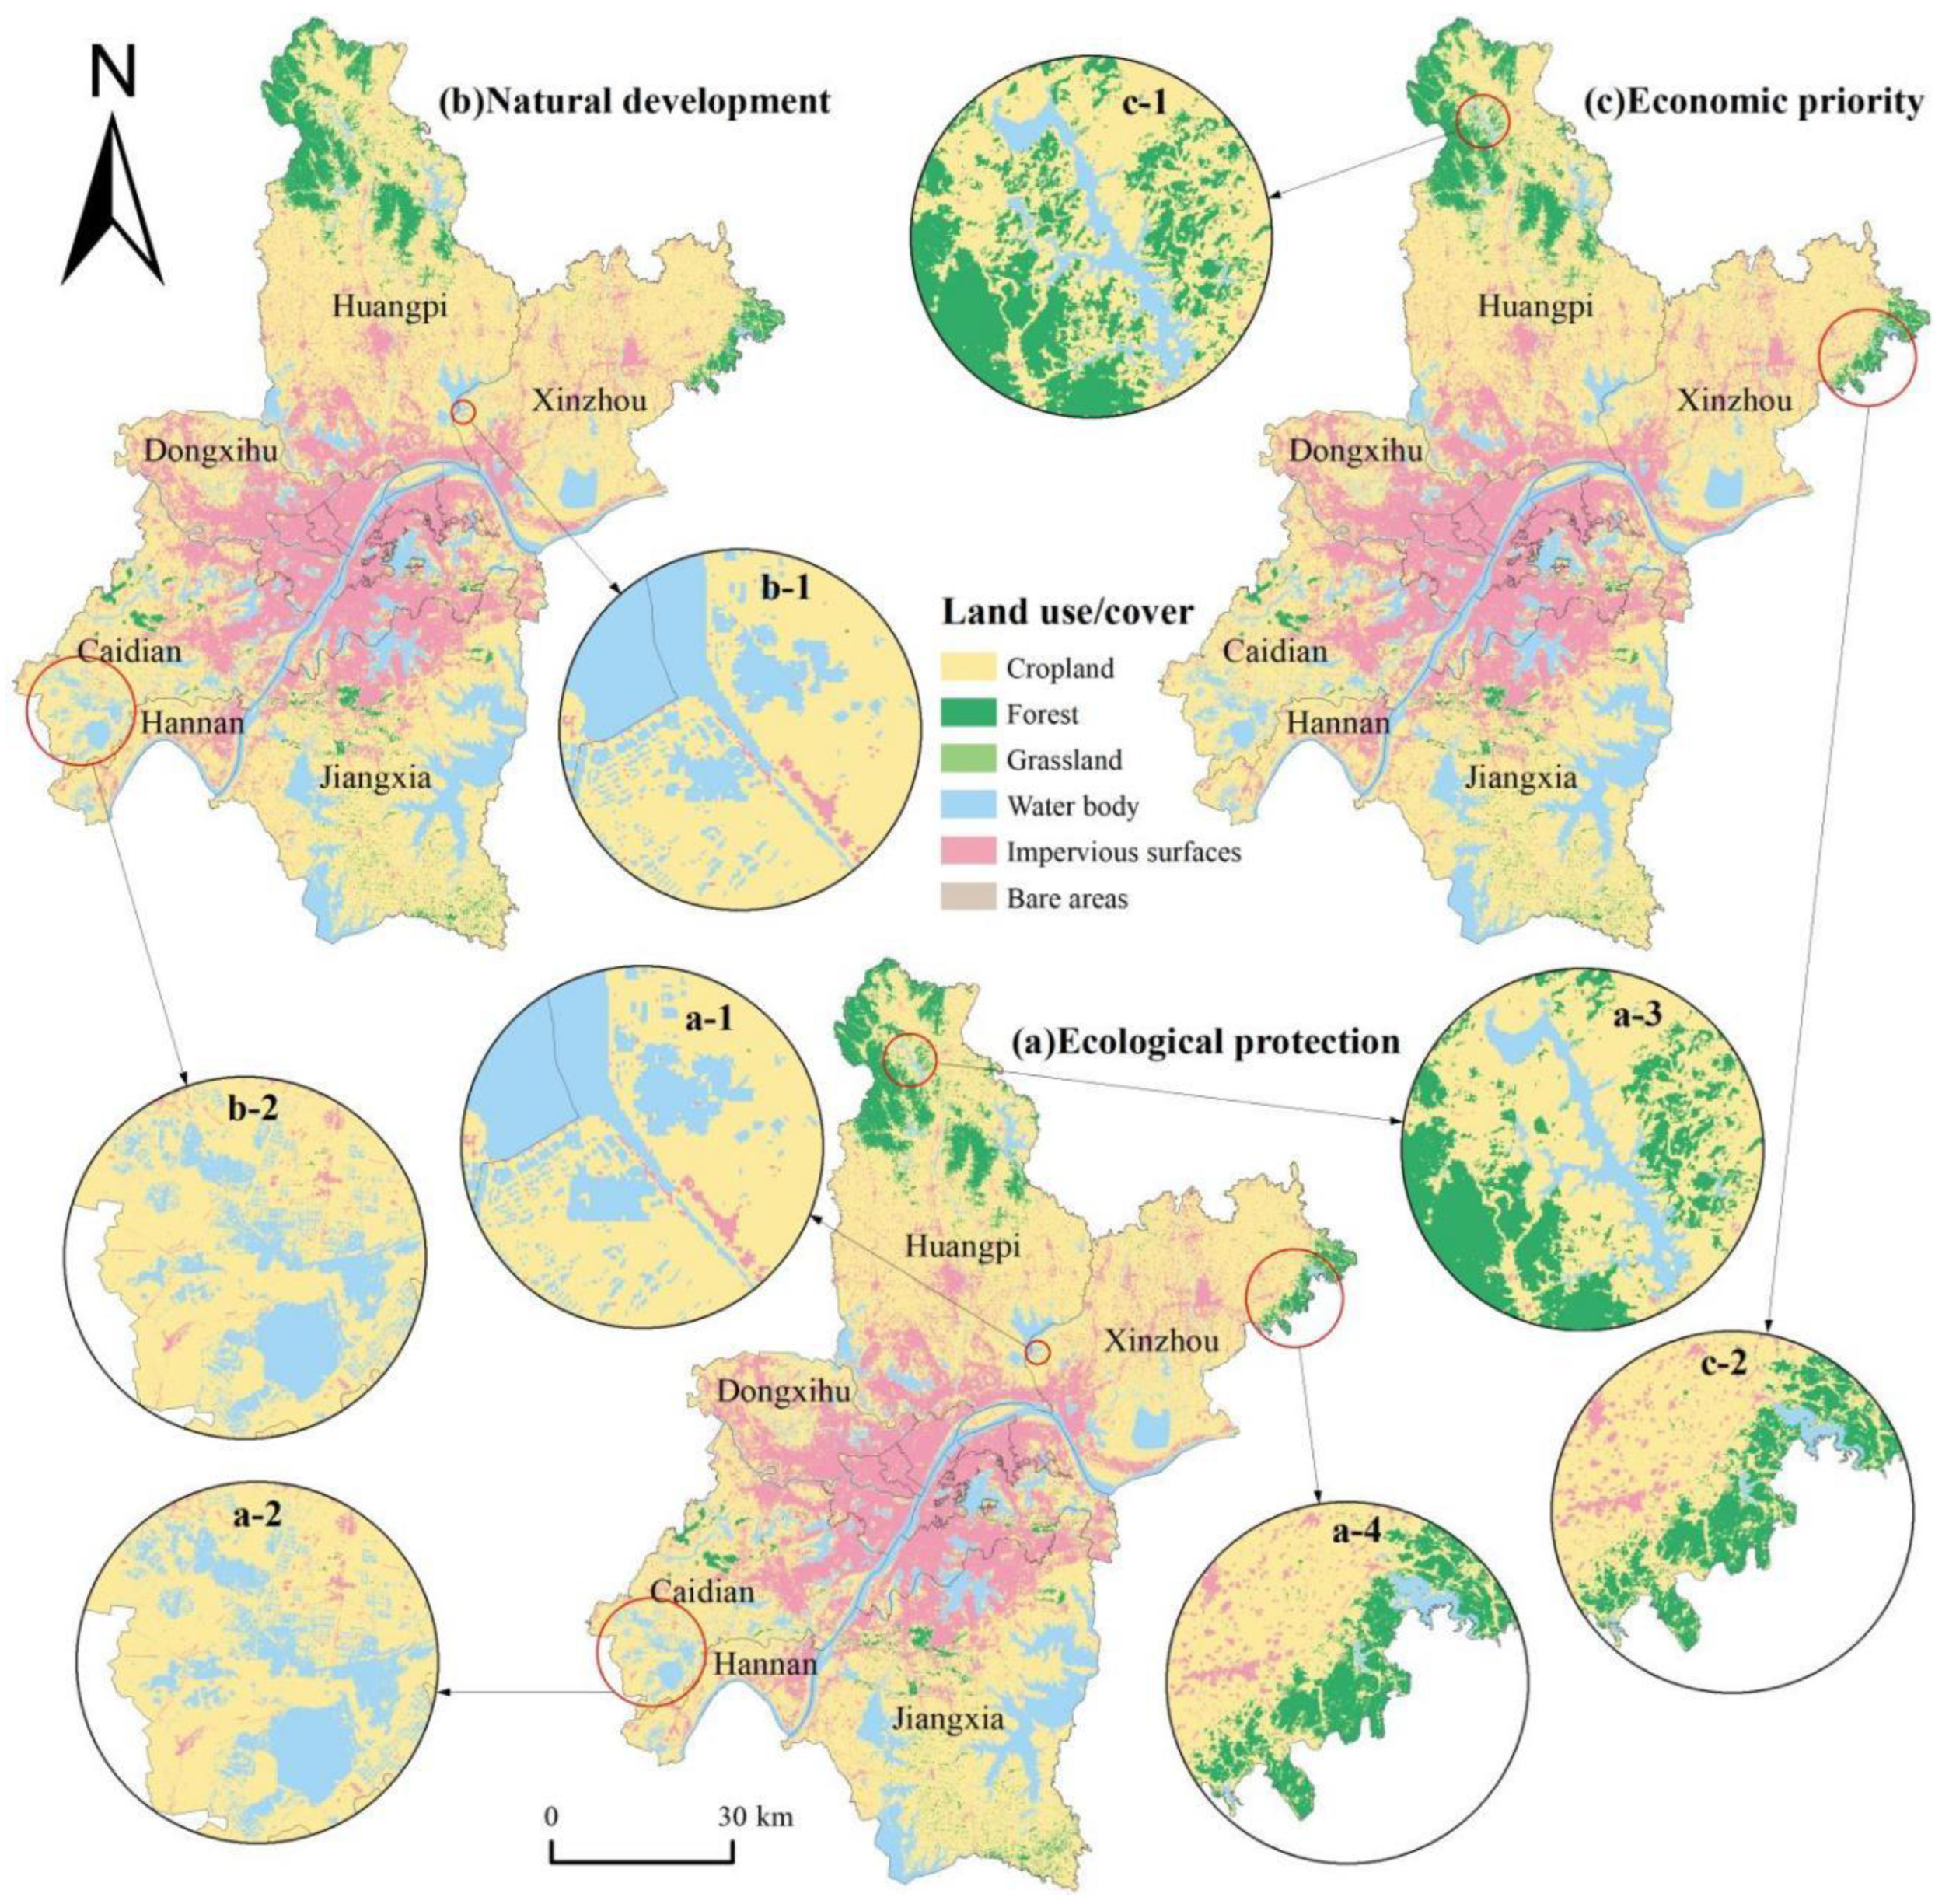
3.2. Simulation of Land Use and Ecosystem Quality Under Different Scenarios
3.2.1. Land Use and Ecosystem Quality Simulation
- (1)
- Land Use Simulation
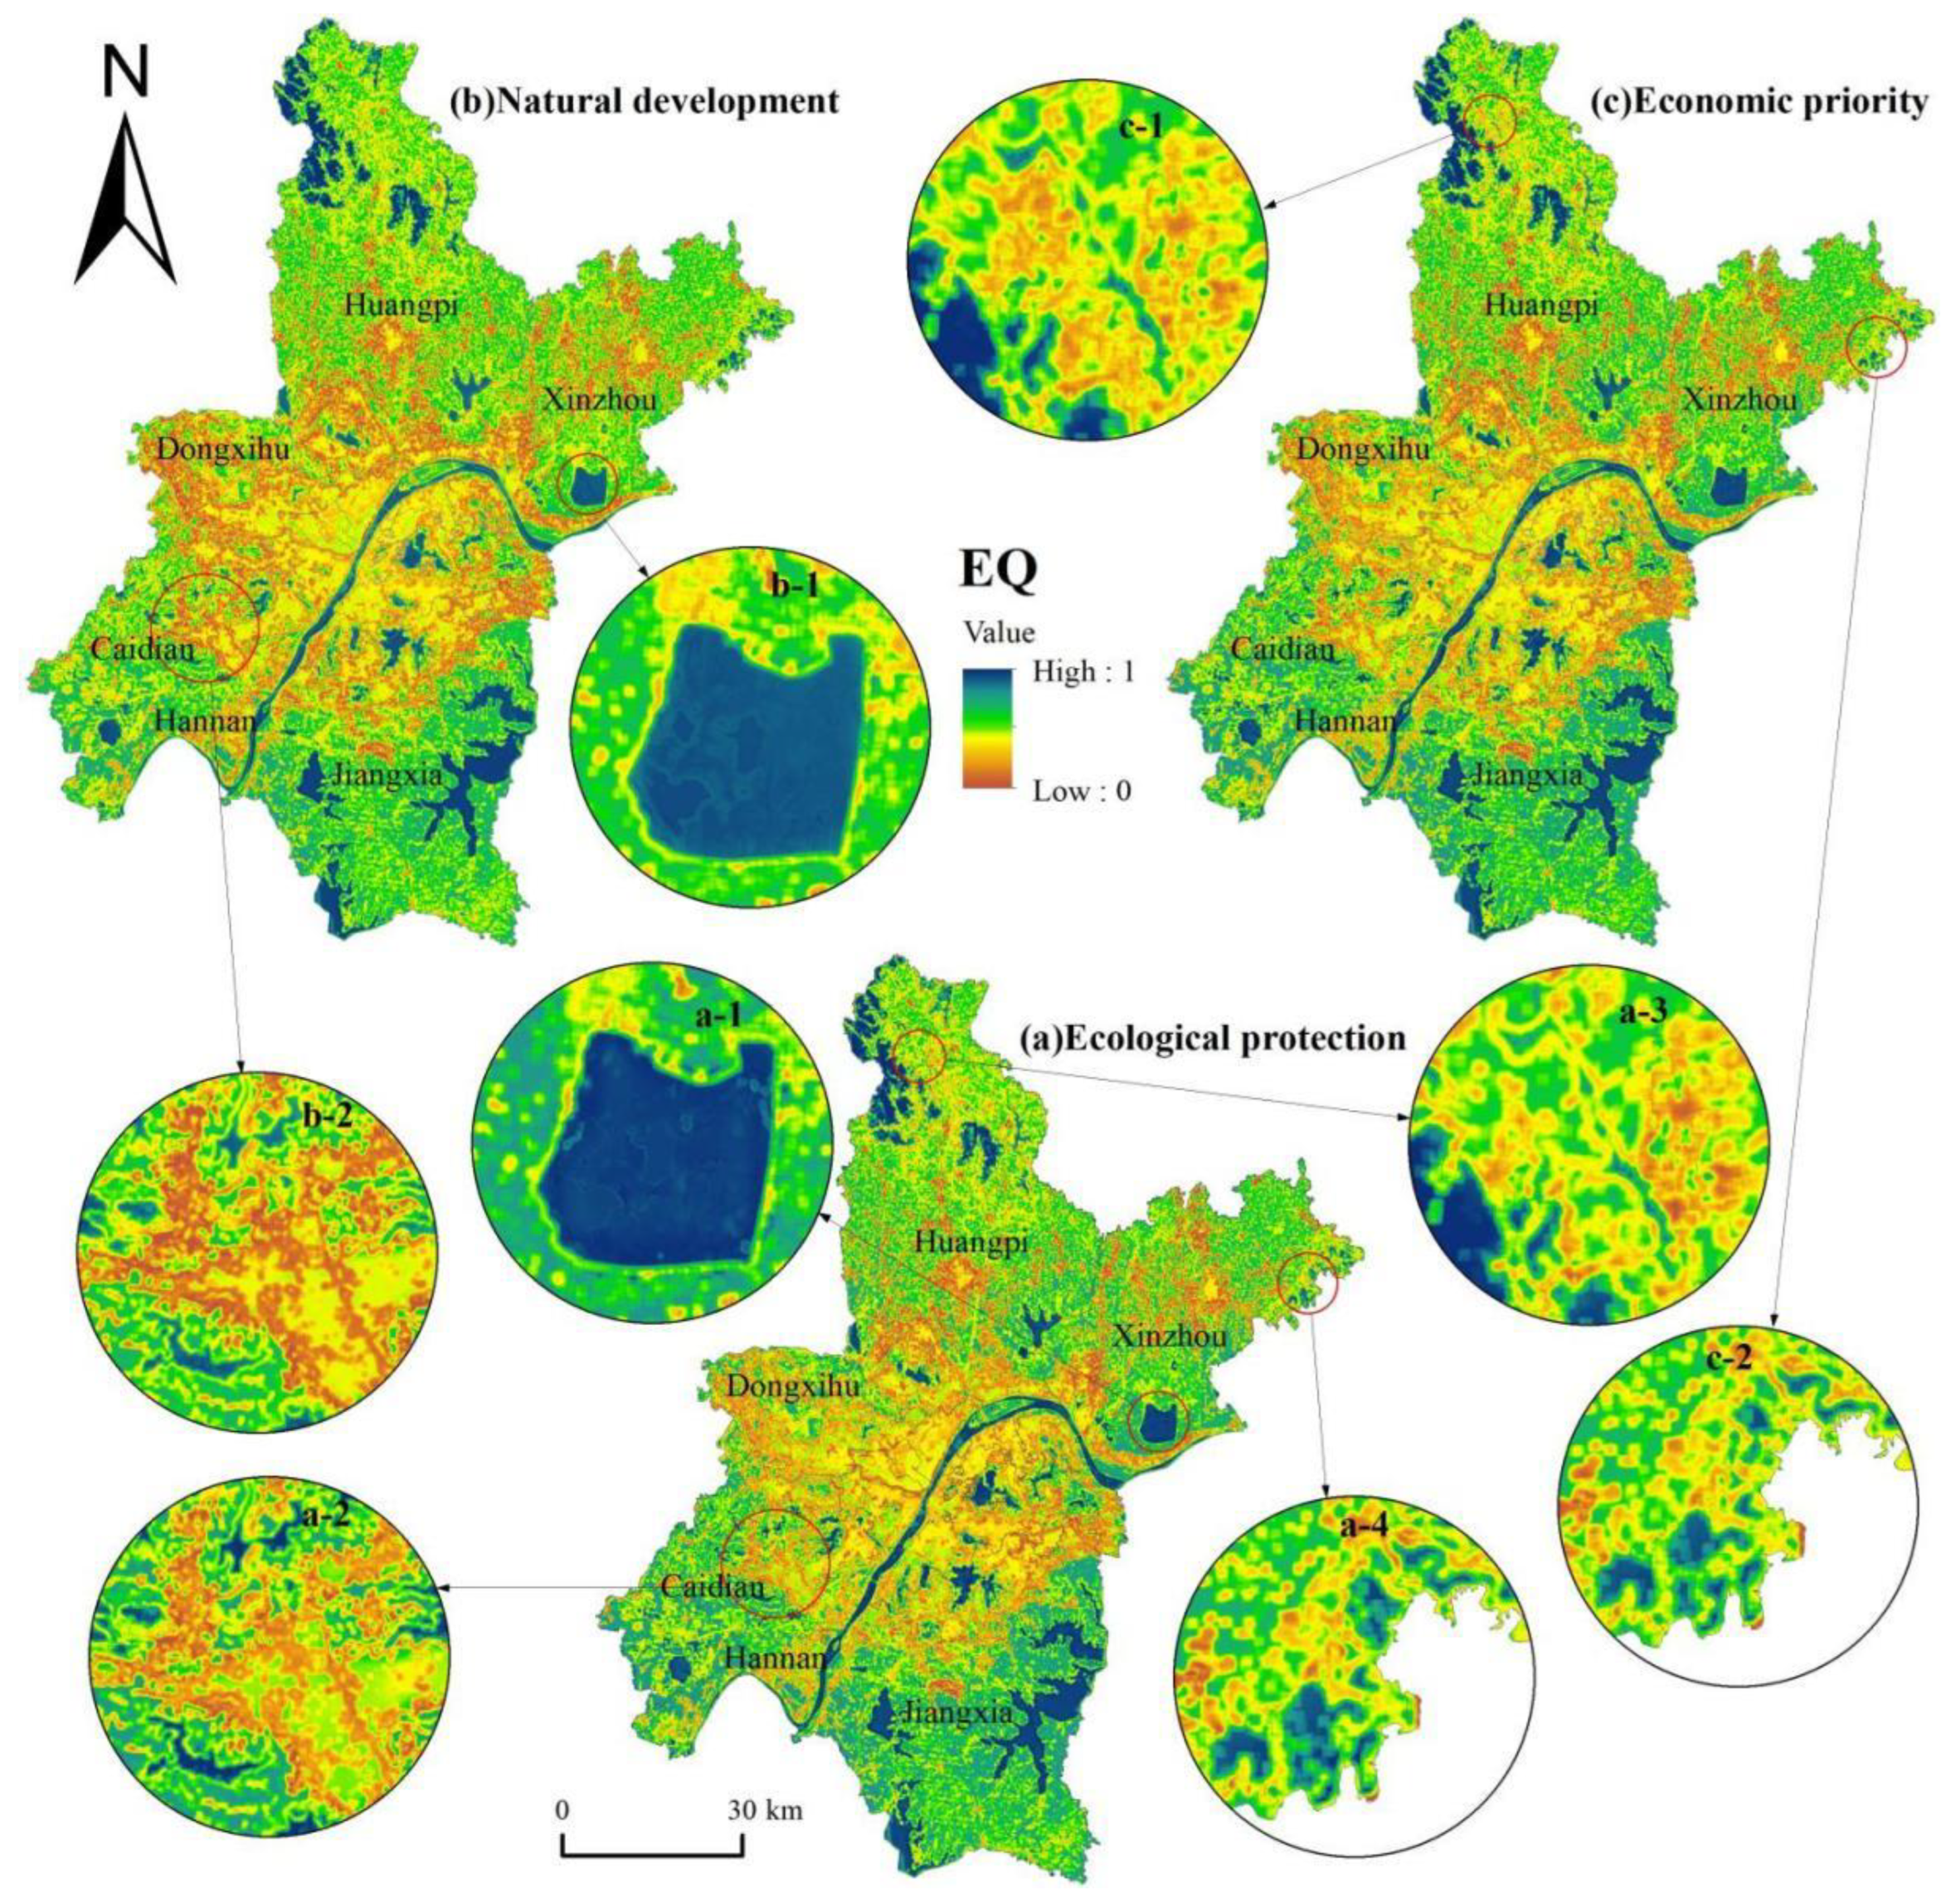
- (2)
- Ecosystem Quality predictions
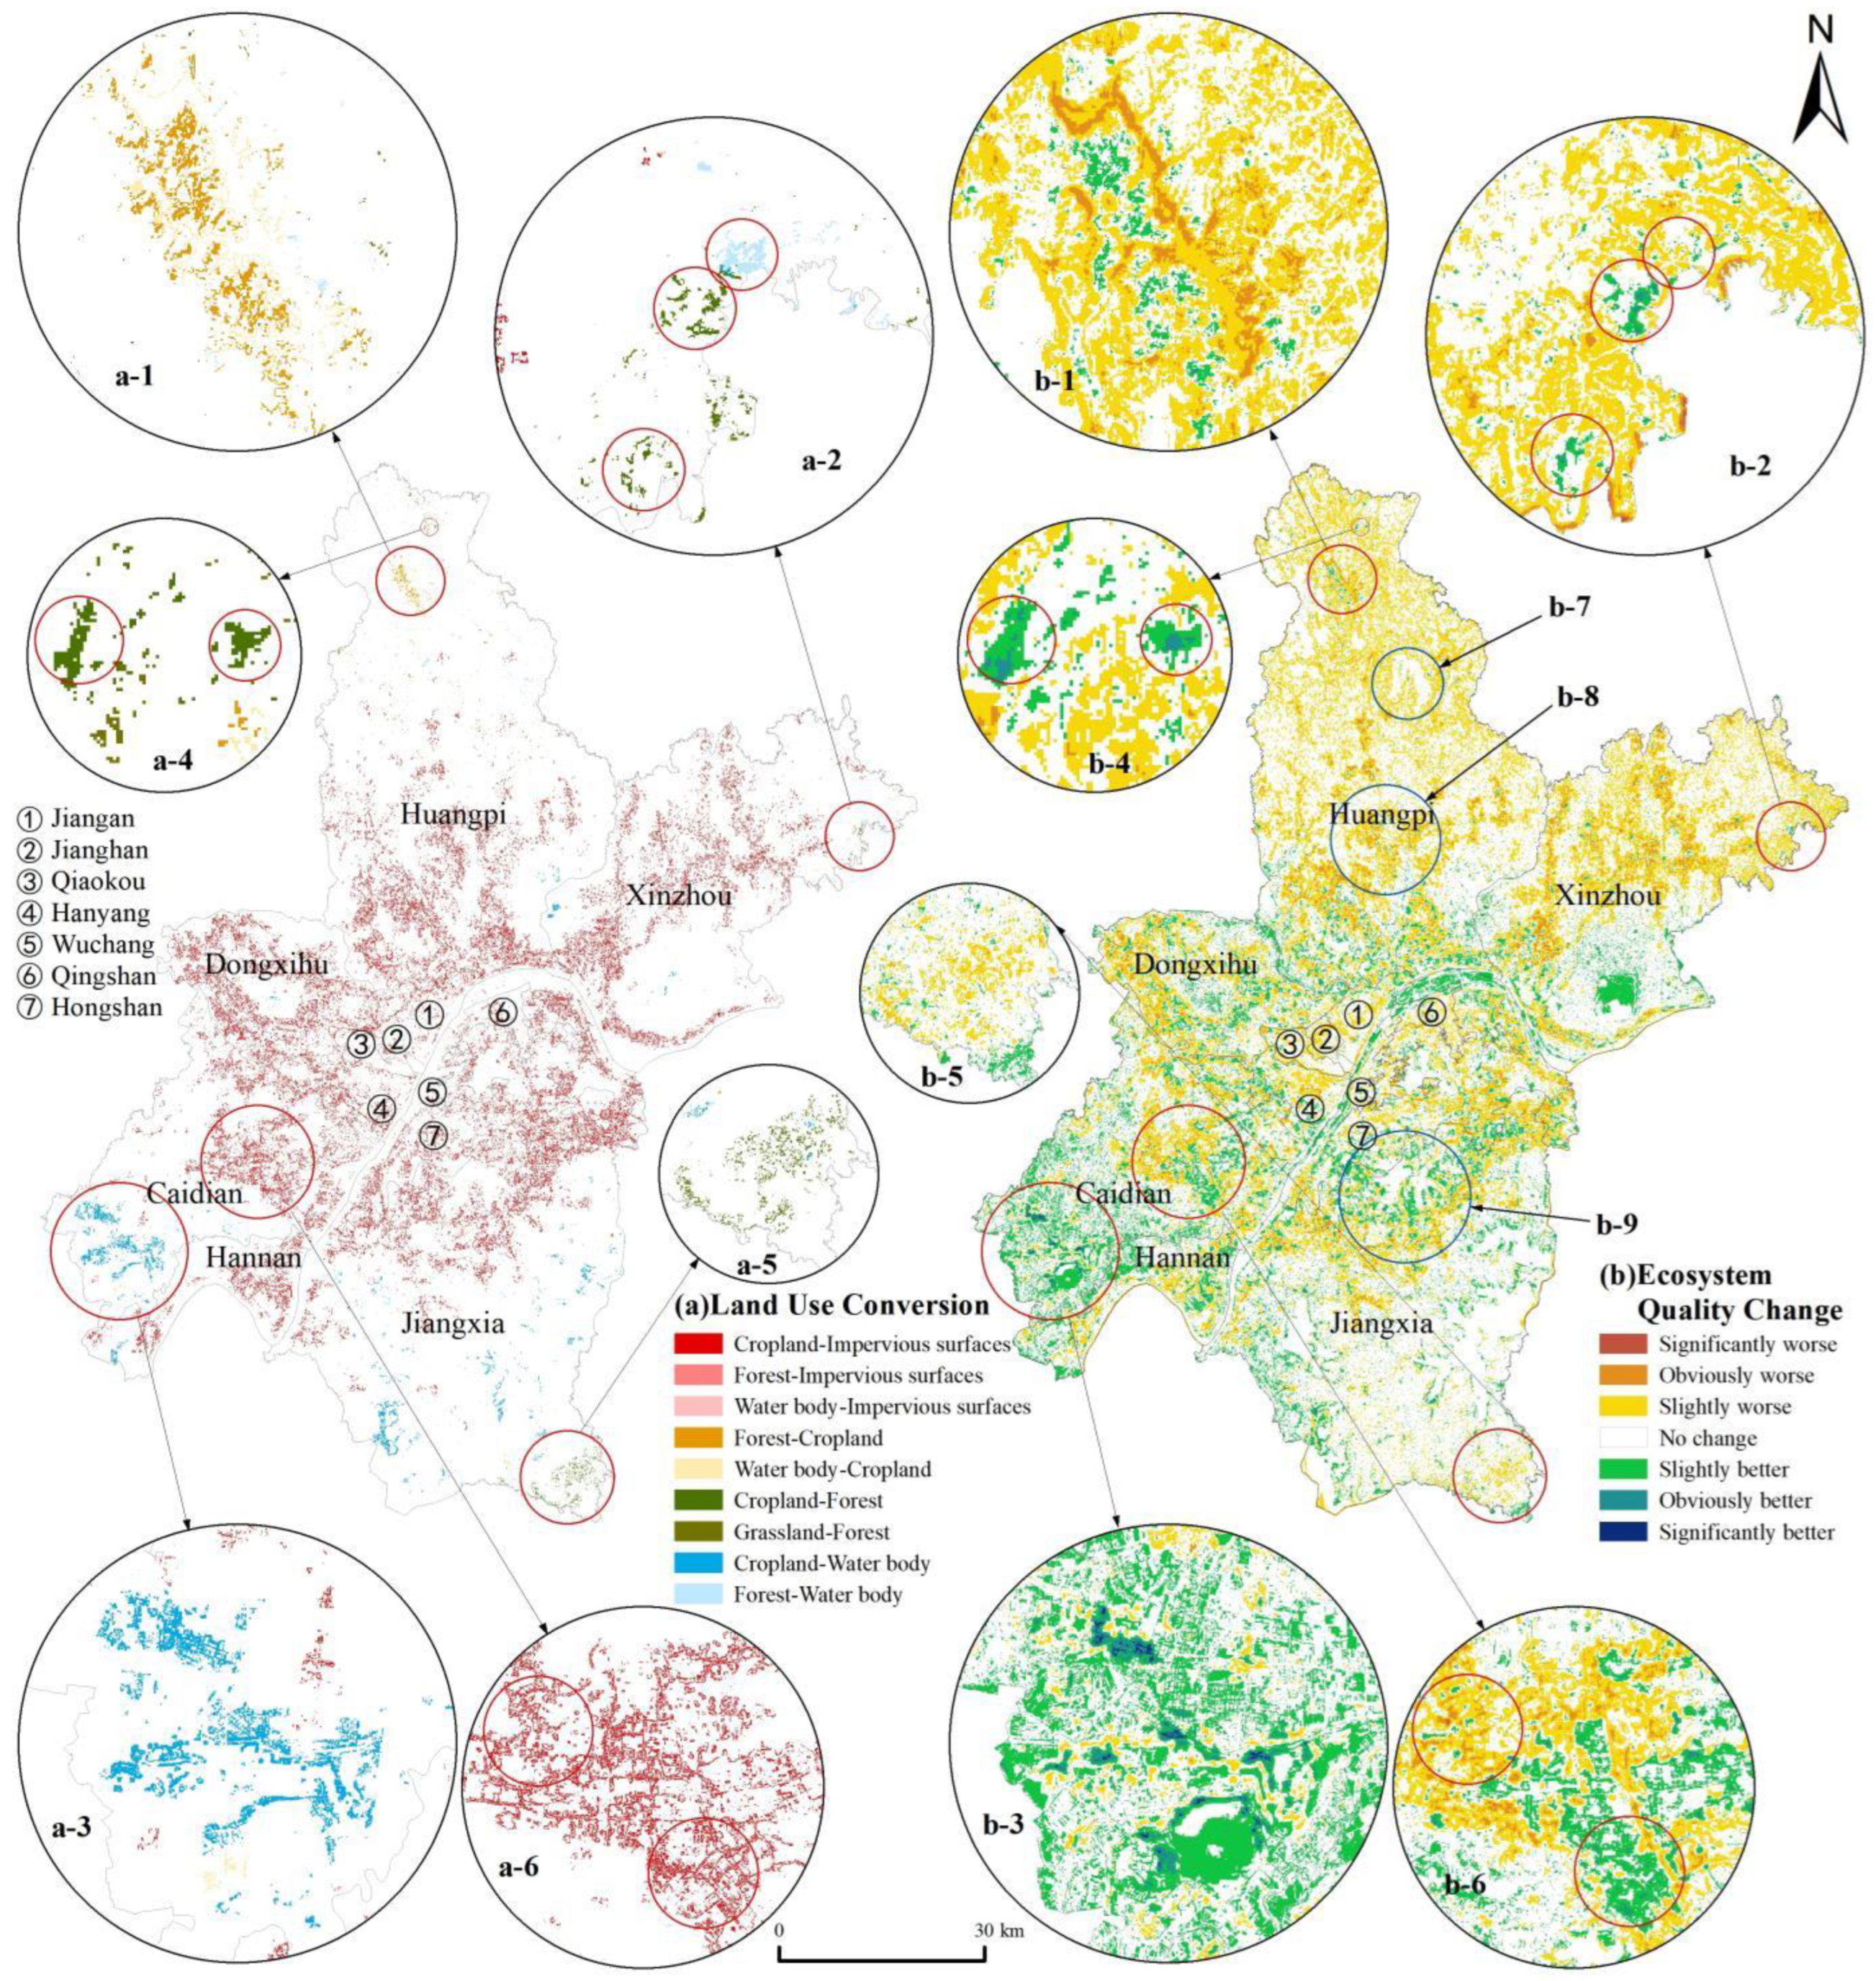
3.2.2. Changes in Land Use and Ecosystem Quality Under Optimal Scenario
4. Discussion
5. Conclusions
Supplementary Materials
Author Contributions
Funding
Data Availability Statement
Conflicts of Interest
References
- Kong, X.; Fu, M.; Zhao, X.; Wang, J.; Jiang, P. Ecological effects of land-use change on two sides of the Hu Huanyong Line in China. Land Use Policy 2022, 113, 105895. [Google Scholar] [CrossRef]
- Song, X.-P.; Hansen, M.C.; Stehman, S.V.; Potapov, P.V.; Tyukavina, A.; Vermote, E.F.; Townshend, J.R. Global land change from 1982 to 2016. Nature 2018, 560, 639–643. [Google Scholar] [CrossRef] [PubMed]
- Firozjaei, M.K.; Fathololoumi, S.; Weng, Q.; Kiavarz, M.; Alavipanah, S.K. Remotely Sensed Urban Surface Ecological Index (RSUSEI): An Analytical Framework for Assessing the Surface Ecological Status in Urban Environments. Remote Sens. 2020, 12, 2029. [Google Scholar] [CrossRef]
- Wu, Z.; Zhu, D.; Xiong, K.; Wang, X. Dynamics of landscape ecological quality based on benefit evaluation coupled with the rocky desertification control in South China Karst. Ecol. Indic. 2022, 138, 108870. [Google Scholar] [CrossRef]
- Hasan, M.; al Ahmed, A.; Islam, A.; Rahman, M. Heavy metal pollution and ecological risk assessment in the surface water from a marine protected area, Swatch of No Ground, north-western part of the Bay of Bengal. Reg. Stud. Mar. Sci. 2022, 52, 102278. [Google Scholar] [CrossRef]
- Nan, B.; Zhai, Y.; Wang, M.; Wang, H.; Cui, B. Ecological Security Assessment, Prediction, and Zoning Management: An Integrated Analytical Framework. Engineering 2024, in press. [CrossRef]
- Kwak, Y.; Chen, S. Integrating seasonal climate variability and spatial accessibility in ecosystem service value assessment for optimized NbS allocation. Urban Clim. 2025, 59, 102314. [Google Scholar] [CrossRef]
- Wang, Q.; Bai, X. Spatiotemporal characteristics of human activity and land use on ecosystem service functions in mountainous areas of Northeast Guizhou, Southwest China. Ecol. Eng. 2025, 212, 107473. [Google Scholar] [CrossRef]
- Bi, X.; Fu, Y.; Wang, P.; Zhang, Y.; Yang, Z.; Hou, F.; Li, B. Ecosystem health assessment based on deep learning in a mountain-basin system in Central Asia’s arid regions, China. Ecol. Indic. 2024, 165, 112148. [Google Scholar] [CrossRef]
- Wang, B.; Oguchi, T.; Liang, X. Evaluating future habitat quality responding to land use change under different city compaction scenarios in Southern China. Cities 2023, 140, 104410. [Google Scholar] [CrossRef]
- Xu, W.; Song, J.; Long, Y.; Mao, R.; Tang, B.; Li, B. Analysis and simulation of the driving mechanism and ecological effects of land cover change in the Weihe River basin, China. J. Environ. Manag. 2023, 344, 118320. [Google Scholar] [CrossRef] [PubMed]
- Kang, L.; Yang, X.; Gao, X.; Zhang, J.; Zhou, J.; Hu, Y.; Chi, H. Landscape ecological risk evaluation and prediction under a wetland conservation scenario in the Sanjiang Plain based on land use/cover change. Ecol. Indic. 2024, 162, 112053. [Google Scholar] [CrossRef]
- Peng, Y.; Cheng, W.; Xu, X.; Song, H. Analysis and prediction of the spatiotemporal characteristics of land-use ecological risk and carbon storage in Wuhan metropolitan area. Ecol. Indic. 2024, 158, 111432. [Google Scholar] [CrossRef]
- Ma, S.; Huang, J.; Wang, X.; Fu, Y. Multi-scenario simulation of low-carbon land use based on the SD-FLUS model in Changsha, China. Land Use Policy 2025, 148, 107418. [Google Scholar] [CrossRef]
- Marey, A.; Wang, L.; Goubran, S.; Gaur, A.; Lu, H.; Leroyer, S.; Belair, S. Forecasting Urban Land Use Dynamics Through Patch-Generating Land Use Simulation and Markov Chain Integration: A Multi-Scenario Predictive Framework. Sustainability 2024, 16, 10255. [Google Scholar] [CrossRef]
- Jiang, X.; Li, B.; Zhao, H.; Zhang, Q.; Song, X.; Zhang, H. Examining the spatial simulation and land-use reorganisation mechanism of agricultural suburban settlements using a cellular-automata and agent-based model: Six settlements in China. Land Use Policy 2022, 120, 106304. [Google Scholar] [CrossRef]
- Zhang, X.; Liu, L.; Zhao, T.; Gao, Y.; Chen, X.; Mi, J. GISD30: Global 30 m impervious-surface dynamic dataset from 1985 to 2020 using time-series Landsat imagery on the Google Earth Engine platform. Earth Syst. Sci. Data 2022, 14, 1831–1856. [Google Scholar] [CrossRef]
- Zhang, X.; Liu, L.; Chen, X.; Gao, Y.; Xie, S.; Mi, J. GLC_FCS30: Global land-cover product with fine classification system at 30 m using time-series Landsat imagery. Earth Syst. Sci. Data 2021, 13, 2753–2776. [Google Scholar] [CrossRef]
- Xu, X. China’s GDP Spatial Distribution Kilometer Grid Data Set. Resource and Environmental Science Data Registration and Publishing System. 2017. Available online: http://www.resdc.cn/ (accessed on 14 March 2022).
- Shouzhang, P. 1-Km Monthly Mean Temperature Dataset for China (1901–2023); National Tibetan Plateau Data; National Tibetan Plateau Data Center: Beijing, China, 2024. [Google Scholar] [CrossRef]
- Shouzhang, P. 1-Km Monthly Precipitation Dataset for China (1901–2023); National Tibetan Plateau Data; National Tibetan Plateau Data Center: Beijing, China, 2024; Available online: https://data.tpdc.ac.cn/ (accessed on 1 November 2022).
- Shouzhang, P. 1-Km Monthly Potential Evapotranspiration Dataset for China (1901–2023); National Tibetan Plateau Data; National Tibetan Plateau Data Center: Beijing, China, 2024. [Google Scholar] [CrossRef]
- Liu, F.; Wu, H.; Zhao, Y.; Li, D.; Yang, J.-L.; Song, X.; Shi, Z.; Zhu, A.-X.; Zhang, G.-L. Mapping high resolution national soil information grids of China. Sci. Bull. 2022, 67, 328–340. [Google Scholar] [CrossRef]
- Liu, F.; Zhang, G.-L.; Song, X.; Li, D.; Zhao, Y.; Yang, J.; Wu, H.; Yang, F. High-resolution and three-dimensional mapping of soil texture of China. Geoderma 2020, 361, 114061. [Google Scholar] [CrossRef]
- Shouzhang, P. 1 Km Multi-Scenario and Multi-Model Monthly Temperature Data for China (2021–2100); National Tibetan Plateau Data; National Tibetan Plateau Data Center: Beijing, China, 2024. [Google Scholar] [CrossRef]
- Shouzhang, P. 1 Km Multi-Scenario and Multi-Model Monthly Precipitation Data for China (2021–2100); National Tibetan Plateau Data; National Tibetan Plateau Data Center: Beijing, China, 2024. [Google Scholar] [CrossRef]
- Wang, T.; Sun, F. Spatially Explicit Global Gross Domestic Product (GDP) Data Set Consistent with the Shared Socioeconomic Pathways. Earth Syst. Sci. Data Discuss. Available online: https://essd.copernicus.org/preprints/essd-2021-10/ (accessed on 12 March 2023).
- Chen, Y.; Li, X.; Huang, K.; Luo, M.; Gao, M. High-resolution gridded population projections for China under the shared socioeconomic pathways. Earth’s Future 2020, 8, e2020EF001491. [Google Scholar] [CrossRef]
- Pan, Y. Spatial-Temporal Evolution of Ecological Quality and Optimization of Ecological Spatial Pattern: A Case Study of Wuhan City. Ph.D. Thesis, China University of Geosciences, Wuhan, China, 2023. [Google Scholar]
- Pan, Y.; Gong, J.; Li, J. Assessment of Remote Sensing Ecological Quality by Introducing Water and Air Quality Indicators: A Case Study of Wuhan, China. Land 2022, 11, 2272. [Google Scholar] [CrossRef]
- Chen, W.; Zhao, X.; Li, J.; Zeng, J. Spatiotemporal evol ution patterns of ecosystem health in the Middle Reaches of the Yangtze River Urban Agglomerations. Acta Ecol. Sin. 2022, 42, 138–149. [Google Scholar]
- Li, J.; Gong, J.; Guldmann, J.-M.; Yang, J. Assessment of Urban Ecological Quality and Spatial Heterogeneity Based on Remote Sensing: A Case Study of the Rapid Urbanization of Wuhan City. Remote Sens. 2021, 13, 4440. [Google Scholar] [CrossRef]


| Data Type | Data Used | Source | Description |
|---|---|---|---|
| Basic spatial data | Administrative boundary lines, transportation networks, river and hydrological networks, major lakes and reservoirs, etc. | Wuhan Municipal Bureau of Natural Resources and Urban Rural Development | Shape file |
| Remote Sensing | ASTER GDEM 30M | https://www.gscloud.cn/ (accessed on 1 November 2022) | Raster |
| Landsat TM | 2000, 2010 /Raster | ||
| Landsat OLI/TIRS | 2020/Raster | ||
| MCD19A2 | https://ladsweb.modaps.eosdis.nasa.gov/ (accessed on 9 August 2022) | 2000, 2010, 2020/Raster | |
| Land use/cover | Global 30-m land-cover dynamic monitoring products from 1985 to 2022 [17,18] | https://data.casearth.cn/ (accessed on 7 December 2021) | |
| Socioeconomic Grid | Spatial distribution of China’s GDP km grid dataset [19] | https://www.resdc.cn/ (accessed on 14 March 2022) | |
| Population Density | https://www.worldpop.org/ (accessed on 14 March 2022) | ||
| Climate Grid | 1901–2021 China 1 km resolution monthly average temperature, precipitation, potential evapotranspiration dataset [20,21,22] | https://data.tpdc.ac.cn/ (accessed on 1 November 2022) | |
| Soil Grid | Basic attribute dataset of China’s high-resolution national soil information grid (90-m soil thickness) [23,24] | http://www.geodata.cn/ (accessed on 1 November 2022) | Raster |
| Soil texture/Bulk density/Organic carbon | https://soilgrids.org/ (accessed on 1 November 2022) | ||
| Climate and socioeconomic grid prediction under the SSP-RCP pathway | A dataset of monthly average temperature and precipitation at 1 km resolution for multiple scenarios and multiple models in China from 2021 to 2100 [25,26] | https://data.tpdc.ac.cn/ (accessed on 12 March 2023) | 2021–2030 /Raster |
| Global gridded GDP data set consistent with the shared socioeconomic pathways [27] | https://zenodo.org/ (accessed on 12 March 2023) | ||
| Mainland China SSP Population Grids [28] | https://figshare.com/ (accessed on 12 March 2023) | ||
| Statistical Data | Wuhan Statistical Yearbook from 2000 to 2020 | Wuhan Municipal Bureau of Statistics | Text |
| Scenarios Parameters (Annual Average Rates) | SSP119 | SSP245 | SSP585 |
|---|---|---|---|
| population change | 1.24 | 1.37 | 1.25 |
| GDP change | 5.60 | 4.68 | 6.36 |
| temperature change | 0.16 | 0.25 | 0.41 |
| precipitation change | 0.93 | 1.73 | 2.22 |
| Scenarios | Cropland | Forest | Grassland | Water Body | Impervious Surfaces | Bare Areas |
|---|---|---|---|---|---|---|
| SSP119 | 5077.80 | 471.89 | 11.28 | 1078.84 | 1936.07 | 0.29 |
| SSP245 | 5128.16 | 462.27 | 11.16 | 1080.45 | 1893.85 | 0.29 |
| SSP585 | 5047.18 | 479.64 | 8.79 | 1078.65 | 1961.63 | 0.29 |
| Ecological Protection | Natural Development | Economic Priority | |
|---|---|---|---|
| Quantity Structure (Table 3) | SSP119 | SSP245 | SSP585 |
| Spatial Baseline | 1. Major rivers; 2. Ecological source areas; 3. Ecological strategic nodes; 4. Ecological land within the range of ecological corridors | 1. Major rivers; 2. Ecological source areas; 3. Ecological strategic nodes | 1. Major rivers; 2. Ecological source areas |
| Explanation | Prioritize ecological protection, comprehensively protect important ecological land, emit low levels of greenhouse gases, and follow a path of sustainable development. It represents an environmentally friendly sustainable development pathway, characterized by low radiative forcing levels, low climate change mitigation pressures, and low social vulnerability, with the lowest carbon emissions. | Primarily focused on natural development, protecting existing source areas and strategic nodes, following a middle path that balances ecological protection and economic priority. It represents a trend development pathway where social, economic, and technological trends do not deviate significantly from historical patterns. It is characterized by medium radiative forcing levels, medium climate change mitigation pressures, and medium social vulnerability, with medium carbon emissions. | Prioritize economic development, limit alterations to major water bodies and ecological source areas, and follow a path primarily based on traditional fossil fuels. It represents a fossil fuel-based, energy-intensive rapid economic development pathway. It is characterized by high radiative forcing levels, high climate change mitigation pressures, and high social vulnerability, with very high carbon emissions. |
| Model | Samples | MSE | R | |||
| Training | 21,434 | 0.0044 | 0.8975 | |||
| Validation | 10,718 | 0.0043 | 0.8986 | |||
| Testing | 10,718 | 0.0044 | 0.8959 | |||
| Mapping | Year | 2000 | 2005 | 2010 | 2015 | 2020 |
| Accuracy/R | 0.8736 | 0.8743 | 0.8884 | 0.9021 | 0.9038 | |
| Unit: km2 | Cropland | Forest | Grassland | Water Body | Impervious Surfaces | Bare Areas | |
|---|---|---|---|---|---|---|---|
| Cropland | 2000–2010 | 6062.36 | 20.57 | 0.95 | 68.11 | 347.47 | 0.02 |
| 2010–2020 | 5576.11 | 14.10 | 1.30 | 68.06 | 503.55 | 0.06 | |
| Forest | 2000–2010 | 57.86 | 490.94 | 0.30 | 3.97 | 17.75 | 0.02 |
| 2010–2020 | 32.16 | 466.43 | 0.66 | 2.60 | 10.80 | - | |
| Grassland | 2000–2010 | 0.05 | 0.01 | 12.47 | 0.00 | 0.05 | - |
| 2010–2020 | 0.02 | - | 13.72 | 0.00 | 0.05 | - | |
| Water body | 2000–2010 | 42.93 | 1.14 | 0.08 | 919.47 | 8.76 | - |
| 2010–2020 | 26.32 | 0.20 | 0.06 | 959.63 | 5.34 | - | |
| Impervious surfaces | 2000–2010 | - | - | - | - | 520.74 | - |
| 2010–2020 | - | - | - | - | 894.78 | - | |
| Bare areas | 2000–2010 | - | - | - | - | - | 0.17 |
| 2010–2020 | - | - | - | - | - | 0.20 | |
| Unit: km2 | Significantly Worse | Obviously Worse | Slightly Worse | No Change | Slightly Better | Obviously Better | Significantly Better | |
|---|---|---|---|---|---|---|---|---|
| C-I | 2000–2010 | 1.77 | 52.65 | 191.71 | 86.68 | 14.52 | 0.16 | - |
| 2010–2020 | 3.62 | 107.01 | 248.53 | 125.36 | 18.91 | 0.10 | - | |
| F-I | 2000–2010 | 0.35 | 5.78 | 8.86 | 2.62 | 0.13 | - | - |
| 2010–2020 | 0.42 | 4.17 | 5.13 | 1.07 | 0.02 | - | - | |
| W-I | 2000–2010 | 0.15 | 2.39 | 4.48 | 1.67 | 0.07 | - | - |
| 2010–2020 | 0.15 | 1.86 | 2.66 | 0.66 | - | - | - | |
| C-F | 2000–2010 | - | - | 0.04 | 3.36 | 14.04 | 2.99 | 0.14 |
| 2010–2020 | - | - | 0.04 | 0.89 | 11.19 | 1.92 | 0.06 | |
| W-F | 2000–2010 | - | - | 0.09 | 0.83 | 0.20 | 0.01 | - |
| C-G | 2010–2020 | - | - | 0.02 | 0.71 | 0.57 | 0.01 | - |
| C-W | 2000–2010 | - | - | 1.00 | 23.77 | 34.34 | 8.44 | 0.57 |
| 2010–2020 | - | 0.10 | 2.21 | 23.43 | 31.65 | 9.73 | 0.94 | |
| F-W | 2000–2010 | - | - | 0.59 | 2.27 | 0.95 | 0.16 | - |
| 2010–2020 | - | - | 0.38 | 1.50 | 0.62 | 0.08 | - | |
| F-C | 2000–2010 | 0.01 | 2.13 | 36.78 | 18.02 | 0.92 | 0.01 | - |
| 2010–2020 | 0.01 | 0.79 | 16.96 | 13.16 | 1.21 | 0.02 | - | |
| W-C | 2000–2010 | 0.03 | 1.77 | 22.44 | 16.31 | 2.36 | 0.01 | - |
| 2010–2020 | 0.13 | 1.04 | 10.38 | 12.26 | 2.50 | 0.01 | - | |
| Unit: km2 | Ecological Protection | Natural Development | Economic Priority |
|---|---|---|---|
| C-I | 515.51 | 474.68 | 541.81 |
| F-I | 2.78 | 2.60 | 1.10 |
| W-I | 3.17 | 1.94 | 4.12 |
| F-C | 4.53 | 4.22 | - |
| W-C | 2.55 | 2.43 | 2.72 |
| C-F | 7.68 | 5.54 | - |
| G-F | 3.61 | 3.78 | - |
| C-W | 41.15 | 33.305 | 48.81 |
| F-W | 6.23 | 6.10 | - |
| Unit: km2 | Significantly Worse | Obviously Worse | Slightly Worse | No Change | Slightly Better | Obviously Better | Significantly Better |
|---|---|---|---|---|---|---|---|
| C-I | 0.12 | 33.93 | 257.56 | 198.99 | 24.44 | 0.46 | - |
| F-I | 0.03 | 0.68 | 1.67 | 0.38 | 0.02 | - | - |
| W-I | - | 0.28 | 2.26 | 0.62 | 0.01 | - | - |
| F-C | - | 0.21 | 2.37 | 1.85 | 0.11 | - | - |
| W-C | - | 0.18 | 1.24 | 0.72 | 0.35 | 0.07 | - |
| C-F | - | 0.04 | 2.56 | 4.07 | 0.80 | 0.20 | - |
| G-F | - | 0.01 | 1.49 | 2.04 | 0.06 | - | - |
| C-W | - | 0.03 | 4.24 | 17.87 | 11.29 | 6.41 | 1.30 |
| F-W | - | 0.65 | 4.69 | 0.85 | 0.03 | - | - |
Disclaimer/Publisher’s Note: The statements, opinions and data contained in all publications are solely those of the individual author(s) and contributor(s) and not of MDPI and/or the editor(s). MDPI and/or the editor(s) disclaim responsibility for any injury to people or property resulting from any ideas, methods, instructions or products referred to in the content. |
© 2025 by the authors. Licensee MDPI, Basel, Switzerland. This article is an open access article distributed under the terms and conditions of the Creative Commons Attribution (CC BY) license (https://creativecommons.org/licenses/by/4.0/).
Share and Cite
Pan, Y.; Gao, J.; Yang, J. A “Foundation-Function-Structure” Framework for Multiple Scenario Assessment of Land Change-Induced Dynamics in Regional Ecosystem Quality. Land 2025, 14, 515. https://doi.org/10.3390/land14030515
Pan Y, Gao J, Yang J. A “Foundation-Function-Structure” Framework for Multiple Scenario Assessment of Land Change-Induced Dynamics in Regional Ecosystem Quality. Land. 2025; 14(3):515. https://doi.org/10.3390/land14030515
Chicago/Turabian StylePan, Yue, Jing Gao, and Jianxin Yang. 2025. "A “Foundation-Function-Structure” Framework for Multiple Scenario Assessment of Land Change-Induced Dynamics in Regional Ecosystem Quality" Land 14, no. 3: 515. https://doi.org/10.3390/land14030515
APA StylePan, Y., Gao, J., & Yang, J. (2025). A “Foundation-Function-Structure” Framework for Multiple Scenario Assessment of Land Change-Induced Dynamics in Regional Ecosystem Quality. Land, 14(3), 515. https://doi.org/10.3390/land14030515