1. Introduction
Changes in the global climate pattern are notable, resulting in an accelerated increase in average global temperatures, compared to what would occur in the absence of human activities that increase the speed of temperature rise, through an economy based on fossil fuels that emits greenhouse gases, especially carbon dioxide [
1]. There are many studies that systematically review the state of the art of global climate change in order to confirm its impact on the most diverse sectors of society such as agriculture, biodiversity, human health, forests, tourism, and the economy [
2,
3]. Climate change caused by human action has changed environmental conditions at a rate greater than the species’ ability to adapt [
4] and this fact makes it urgent to implement actions that can mitigate the causes of accelerated global temperature warming.
Forests play a strategic role in combating climate change and mitigating its causes, as they consist of large volumes of biomass that retain large amounts of carbon. The growth of trees, through the process of photosynthesis, captures atmospheric carbon dioxide (CO
2) and converts it into biomass. In this way, the biomass accumulated in the forest will be greater or lesser, depending on the management model to which it is subjected [
5,
6]. The importance of the forest as a carbon sink has been confirmed over time, as it is responsible for capturing around half of fossil fuel emissions. However, the aging of forest areas, deforestation, and the increase in disturbance regimes have weakened this condition [
7], which once again indicates the relevance of forest area management [
8].
There is evidence that the management and the intensity of the use of Mediterranean Pinus sp. forests impact biodiversity and soil characteristics, and the alternation between managed and unmanaged areas in a mosaic form can be beneficial for certain biodiversity indicators due to the environmental heterogeneity [
9]. Furthermore, thinning does not appear to affect short-term fungal diversity and establishment in Pinus nigra forests [
10]. In turn, Ref. [
11] indicates, in their study, that the initial impact of forest management may stimulate a higher production of spores in some fungal species, but this effect stabilizes after the disturbance and does not impact species diversity, with climatic conditions potentially enhancing or mitigating the initial impact of thinning. In parallel, one study indicated that in mixed forests of Pinus spp. and Quercus spp. in Catalonia, Spain, tree diversity and morphological plant diversity tended to increase in areas that received selective cutting treatments, as the opening of the area created a disturbance that favored the entry of new individuals into the plant community [
12].
In forests of
Pinus nigra and
Pinus sylvestris, changes in wood and carbon production were observed as a function of thinning intensity and frequency. Although synergies between carbon and wood production were identified, more intensive and less frequent thinnings contributed to the reduction in biomass production. At the same time, mushroom and water production over long periods maintain a trade-off relationship with these ecosystem services (wood and carbon). However, it is simulated that climate change under more extreme scenarios will negatively affect these services, reducing their benefits [
13]. Forest management can impact forest development in the face of climate change, especially in conditions of extreme drought, a scenario that is expected to be frequent in the face of global warming, and correct management can mitigate the result in these conditions by making forests more resilient to drought, with managed natural regeneration forests tending to be less susceptible to extreme droughts than planted forests [
14].
The management model influences tree growth, which also directly impacts carbon accumulation in forest biomass, and factors such as wood density and the size of dead wood in the forest directly affect the decomposition rate and the speed of carbon emission or retention capacity [
15,
16]. A naturally regenerating maritime pine forest, without any intervention, tends to have a lower carbon balance than intervened forests, due to high mortality in the initial stages of the population, caused by the high density of trees per hectare and the very fine material that composes them. Their rapid decomposition releases the stored carbon into the atmosphere. In turn, forests with thinning interventions have lower mortality in the initial stages and the removal of trees with larger diameters at more advanced ages enhances the growth of the remaining trees that will retain carbon for longer [
17].
Although, depending on local conditions, the sum of carbon accumulated in the main forest and in the thinning biomass is eventually equivalent to the sum found in maritime pine forests in their natural course at older ages, thinning is shown to be an important practice to reduce the effects of climate change because the reduction in the density of the number of trees makes the forest more resilient to extreme drought scenarios [
6]. Therefore, the choice of more appropriate strategies for forest management must take into account the local factors that affect the dynamics of the carbon cycle. For example, forests in higher latitudes or subjected to colder climates tend to have a lower rate of heterotrophic respiration and this especially affects the carbon stored in the soil, while this activity is more pronounced in places with higher temperatures, emitting higher rates of carbon through this route comparatively [
18].
It is true that the greater the amount and intensity of thinning in coniferous forests, the lower the amount of carbon stored in the remaining forest. However, studies indicate that the amount of carbon in the soil does not change significantly depending on the intensity of thinning, which means that knowledge of the carbon cycle of thinned wood, whether or not removed from the forest for the most diverse uses, must be considered to conclude the impact on the efficiency of capturing and retaining atmospheric carbon [
19,
20].
The impact caused by forest management translates into the ecosystem’s capacity to retain more carbon through photosynthesis and the consequent growth (biomass gain) of trees in the face of carbon emissions. Therefore, it is necessary to consider that the forest, in order to be managed, requires forestry operations for felling trees and the extraction and pre-processing of wood, which are potentially carbon-emitting activities when opting for mechanized means, and this emission will have an impact on the balance and carbon neutrality depending on these factors [
21] and the characteristics of interventions with greater or lesser intensity [
22]. The effect of forest management can influence the carbon balance depending on the time of analysis and the characteristics of the products harvested. In general, when thinning occurs, the carbon balance tends to be negative because a large part of the biomass is extracted from the forest and the destination of the extracted wood, added to the form of exploitation, can indicate positive or negative balances depending on the scenario, but in the long term, the balance is positive in relation to unmanaged forests until there is stabilization and mature forests, despite being areas of carbon accumulation, may not be efficient for capture, leaving the balance zero [
23].
Since science has demonstrated the existence of an impact on the carbon dynamics due to management interventions in forests, it is still unclear how the management of the maritime pine forest in northern Portugal affects the carbon balance. Likewise, the idea that, in the absence of management, the forest behaves as a carbon sink is not yet consolidated. It is also uncertain whether the most commonly used management models, through periodic thinning, positively or negatively alter carbon accumulation. The forest is a dynamic system, as are the biogeochemical cycles involved in its evolution, including the carbon cycle. Determining a pattern of carbon accumulation and emission behavior must consider the local conditions of the studied forest in relation to the atmosphere. This is a complex task that must account for the scientific question of whether, under specific conditions—such as in our case, in the Tâmega Valley in northern Portugal—the forest acts as a carbon sink or source. Additionally, it is essential to assess whether the most common forest management practices have a positive or negative impact on carbon accumulation in biomass. Therefore, the current study aims to compare, in two areas of maritime pine, the potential carbon retention through the carbon balance resulting from the thinning intervention compared to what would occur without intervention in the forest through computer simulations and the analysis of satellite images.
2. Materials and Methods
2.1. Study Area
The study was carried out in two distinct areas, located in the common lands of Granja (lat. 41°40′32″ N and long. 7°37′51″ W) with 11.9 hectares and Torneiros (lat. 41°40′12″ N and long. 7°40′00″ W) with 4.6 hectares, which are 630 m above sea level. In both areas, the landscape found is one of natural regeneration of post-fire maritime pine. The fire that gave rise to natural regeneration occurred in 2016 in Torneiros and Granja, respectively; however, the regeneration of Granja began one year after that of Torneiros given the intensity of the fires in that area. Therefore, the areas were intervened in 2022 at 6 and 7 years of age.
Figure 1 indicates the location of the study areas in Portuguese territory.
2.2. Pre- and Post-Thinning Dendrometric Survey
To obtain the initial data inserted into the simulation model in Modispinaster Capsis 4.2.6 version, it was necessary to perform a pre-operational expedited characterization of the forest in its natural state, prior to any interventions outlined in the forest management plan (PGF). Since the primary objective of the study was to understand the dynamics of carbon accumulation and emission in the forest through simulations, and given the high homogeneity of the areas, high data precision was not a critical factor for the study; to perform the simulations in Modispinaster, an initial scenario was required. This scenario could be composed of variables simulated, for instance, from the 6th National Forest Inventory (IFN6) or another document. However, a more realistic and representative scenario of the maritime pine forests in northern Portugal was chosen, given that the IFN6 data are already 10 years old.
A rapid field survey was conducted to create the initial simulation scenario. Despite being rigorous in terms of measurements, the sample size was limited, which inevitably makes it less precise compared to an inventory with a more robust sampling methodology. Nonetheless, this does not invalidate the results, as the sole purpose of the sampling was to define an initial scenario. Absolute precision in the data is not required since the objective of the simulations is to compare the evolution of two scenarios from a common starting point (one scenario with thinning and another without thinning), assuming that the forest’s ecophysiological response will follow a similar pattern regardless of the initial data precision and any errors would be replicated across all analyzed scenarios and, thus, cancel out, not constituting a source of variation in the comparative results.
Following the forest management operations, data were collected again to characterize the managed area.
For the area characterization, four randomly distributed square plots of 2 × 2 m, or 4 m2, were installed. Data collected from all trees on field sheets included the number of live and dead trees, diameter at breast height (DBH), total height (h), slope, and terrain exposure.
2.3. Interventions in the Forest
As provided for in the forest management plans (PGFs), the study areas basically received two types of intervention, characterized by a first phase in which the total vegetation was removed from continuous strips, interspersed with strips of vegetation that remained standing. The removed strips are the “inter-strips” while the strip of vegetation that remained standing are the “strips”. In a second phase, the operation to reduce tree density was carried out in the strips, where part of the trees was removed up to the density provided for in the management plan. The trees removed were primarily those that were dead, dominated, diseased, and with malformations, successively, and the remaining trees comprised the sample that was inventoried to determine the post-operational scenario.
The forest management operations carried out in the Granja and Torneiros sites involved different types of machinery and techniques adapted to each area. In the Granja area, a New Holland TS 100 tractor equipped with a shredding implement was used for interlane opening, along with a tracked rotary excavator Yanmar Vi080-1 (8t/56 hp) equipped with a shredding head, covering a 5 m strip adjacent to the pathways. Density reduction was performed using a Stihl 211 chainsaw and a scythe. Pruning, bush clearing, and residue shredding were not conducted in this area. In Torneiros, interlane opening was executed using a tracked rotary excavator Yanmar Vi080-1 (8t/56 hp) equipped with a shredding head. Density reduction was carried out using a Stihl 211 chainsaw and a scythe. As in Granja, pruning, bush clearing, and residue shredding were not applied. These operations aimed at forest density management and accessibility improvement, utilizing specialized equipment suited to the specific needs of each site.
The Granja area’s PGF provided for the opening of inter-strips and a reduction in strip density, carried out in 2022, as well as thinning at 15 and 20 years (2031 and 2036). The Torneiros PGF, in addition to the inter-strip opening and density reduction performed in 2022, provided for a thinning at 10 years (2025). Since the Torneiros and Granja areas share significant similarities, they were grouped into a single block for simulation purposes, and the block’s average variables were applied in the MODISPINASTER model. A total of three thinnings (initial opening and two subsequent thinnings) were planned, in accordance with the PGF (between two and three thinnings); however, the exact timing of the thinnings was determined by MODISPINASTER. These moments were identified as those just before the onset of competition among trees, thereby preventing natural mortality.
To open the strips and reduce density, chainsaws and brushcutters were used.
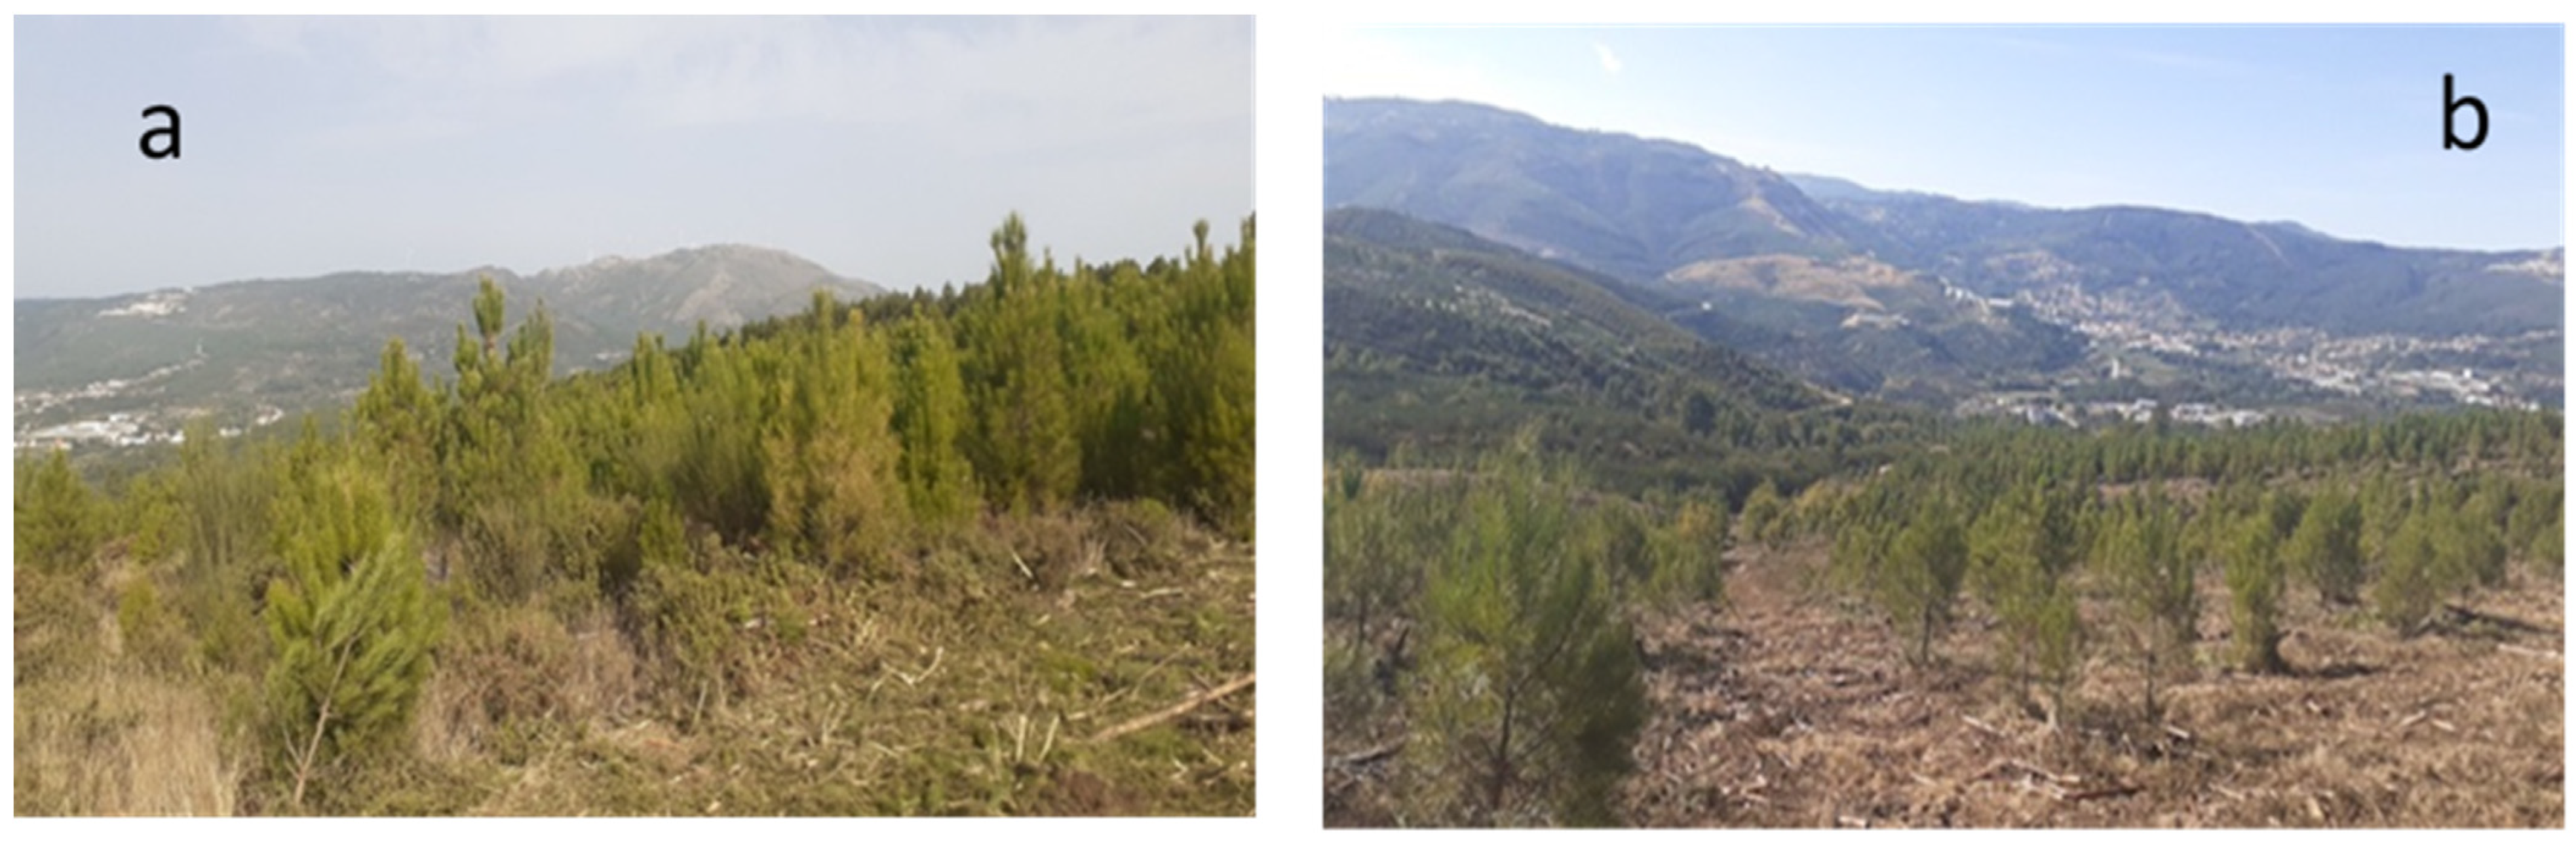
Figure 2 shows the appearance of the area before and after such operations.
2.4. Modispinaster Simulations
To determine the amount of carbon accumulated in the main forest, in thinnings, and in natural mortality in the two areas, the Modispinaster software Capsis 4.2.6 was used [
24] and after introducing terrain and dendrometric data, provided, through equations adjusted for the area, a series of parameters that allowed estimating, each year and over a 45-year cycle, the evolution of dendrometric data, wood biomass, stored carbon, and standing and thinned volumes.
The input data for the simulations of the forest evolution in the Granja and Torneiros areas, for the original condition and after the first thinning, were grouped into a single block and are shown in
Table 1.
To simulate the indicators of the first intervention, real field data were used before and after the first thinning, maintaining the same values for variables such as age, aspect, slope, dominant height, and diameter before and after thinning. The number of trees per hectare changed from 18,750 to a density of 7500 trees per hectare, and the basal area decreased from 19.1 to 6.8 m
2/ha. The subsequent interventions (thinning) were based on/adapted to the Pp1 silvicultural model outlined in the Regional Forest Management Program for Trás-os-Montes and Alto Douro, with a Wilson spacing factor (FW) applied in Modispinaster ranging from 0.21 to 0.16, which recommends thinning at an average interval of 7 years between 15 and 40 years of forest age [
25].
Under average conditions for both areas, the silvicultural model was adapted so that thinnings were performed at the natural mortality threshold, resulting in three thinnings: at 6 years (using real field data), 17 years, and 28 years (using simulated data).
The data used to develop the models inherent to Modispinaster do not account for such high densities and juvenile stages, which may lead to some imprecision in the results. These results are, therefore, general indicators where the knowledge of errors is not critical, and were generated to enable scenario comparisons, where, relative to observed field patterns, there is no demand for high precision.
2.5. Carbon Balance
The carbon dynamics delivered by the Modispinaster simulations pertain solely to the main stem of the tree, and the carbon balance will consider only this part. However, the results of the total carbon accumulation, taking into account all parts of the tree, will also be presented. To calculate the total carbon stored by the trees, the percentages proposed by [
26] were used, which consider that, on average, for pine trees, 69.2% of the carbon is in the trunk, and 30.8% is distributed among other parts of the tree (9.7% in the leaves, 12.4% in the branches, and 8.7% in the roots).
To perform the carbon balance, the carbon emitted into the atmosphere was subtracted from the carbon captured and retained in the tree trunks. It was decided to consider that wood from thinned trees with a diameter at breast height (DBH) equal to or greater than 15 cm is long-cycle wood, meaning it retains carbon storage over longer cycles (over 45 years), due to its use in products with a longer life span, such as posts, furniture, construction, sawmilling, and other applications.
Wood resulting from mortality [
27] and thinnings with a DBH below 15 cm was considered short-cycle wood, as it will be used in products with a shorter life cycle, such as firewood or wood chips for energy, thus releasing stored carbon in a short period (less than 45 years) [
28].
2.6. Analysis of Satellite Images
The verification and comparison of the behavior of the vegetation cover of the intervened areas were carried out through the analysis of the indicator “Normalized Difference Vegetation Index” (NDVI) obtained from images from the Sentinel 2 satellite, with a resolution of 10 m and the capacity to revisit every 5 days, and the information was processed in the “Copernicus Browser” application. The NDVI indicates the density of the vegetation cover and, based on its value, indicates the typology found on the terrain based on the reading of the wavelength emitted by the surface. The NDVI ranges from −1 to 1, where negative values generally represent a surface covered by water, values close to 0, such as −0.1 and 0.1, indicate sand, stone, or snow, values between 0.2 and 0.4 indicate vegetation of shrubs and grasses, and values greater than 0.4 mean that the vegetation cover is composed of temperate or tropical forests (Copernicus Browner).
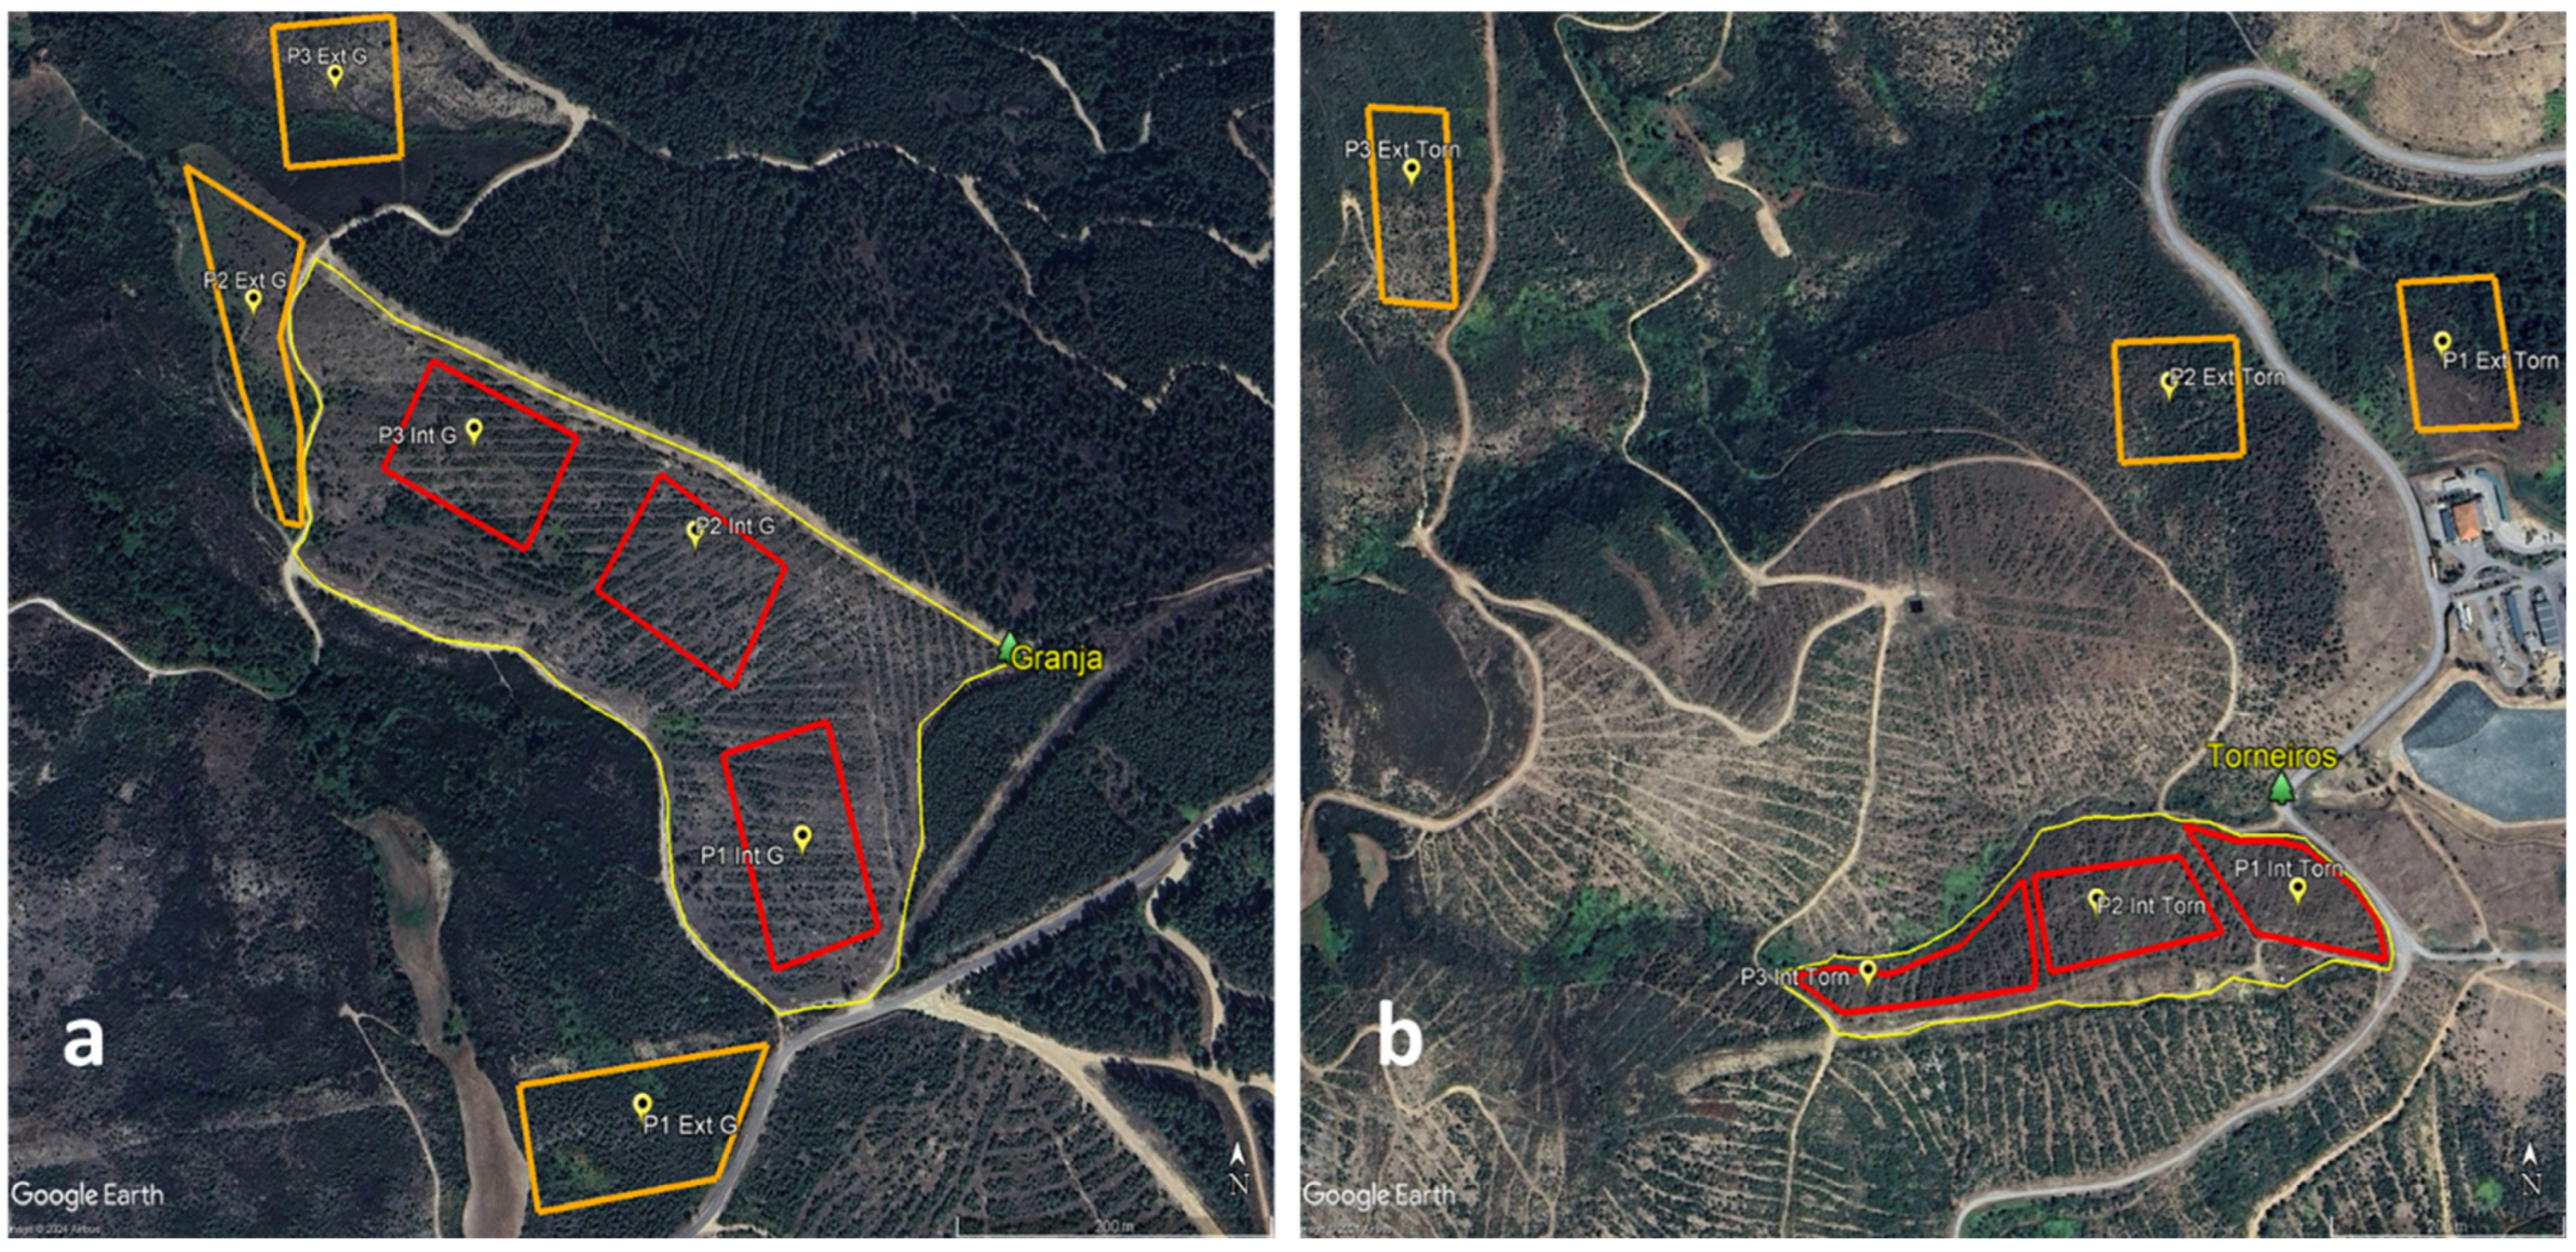
Plots were selected using Copernicus Browser within the boundaries of the intervened areas of Granja and Torneiros, with three plots outside each area. To identify similar vegetation typologies between the internal and external areas before the interventions, the “Historical Images” function of Google Earth Pro was used, which allowed the visualization and selection of areas contiguous to the perimeter of the intervened region with the same typology before the interventions.
Figure 3 illustrates the study areas for the areas of Granja (a) and Torneiros (b).
After separating the plots, the defined plots were replicated in Copernicus Browser, and for each of them, the NDVI dataset was downloaded every 6 days for the period from January 2020 to December 2024, from which all NDVI data were excluded on days when cloud cover was above 50% to avoid distortions in the indicators. The internal and external data of the two areas were grouped and graphs and statistical analysis were prepared using the unpaired t-test using JMP Pro 17 software.
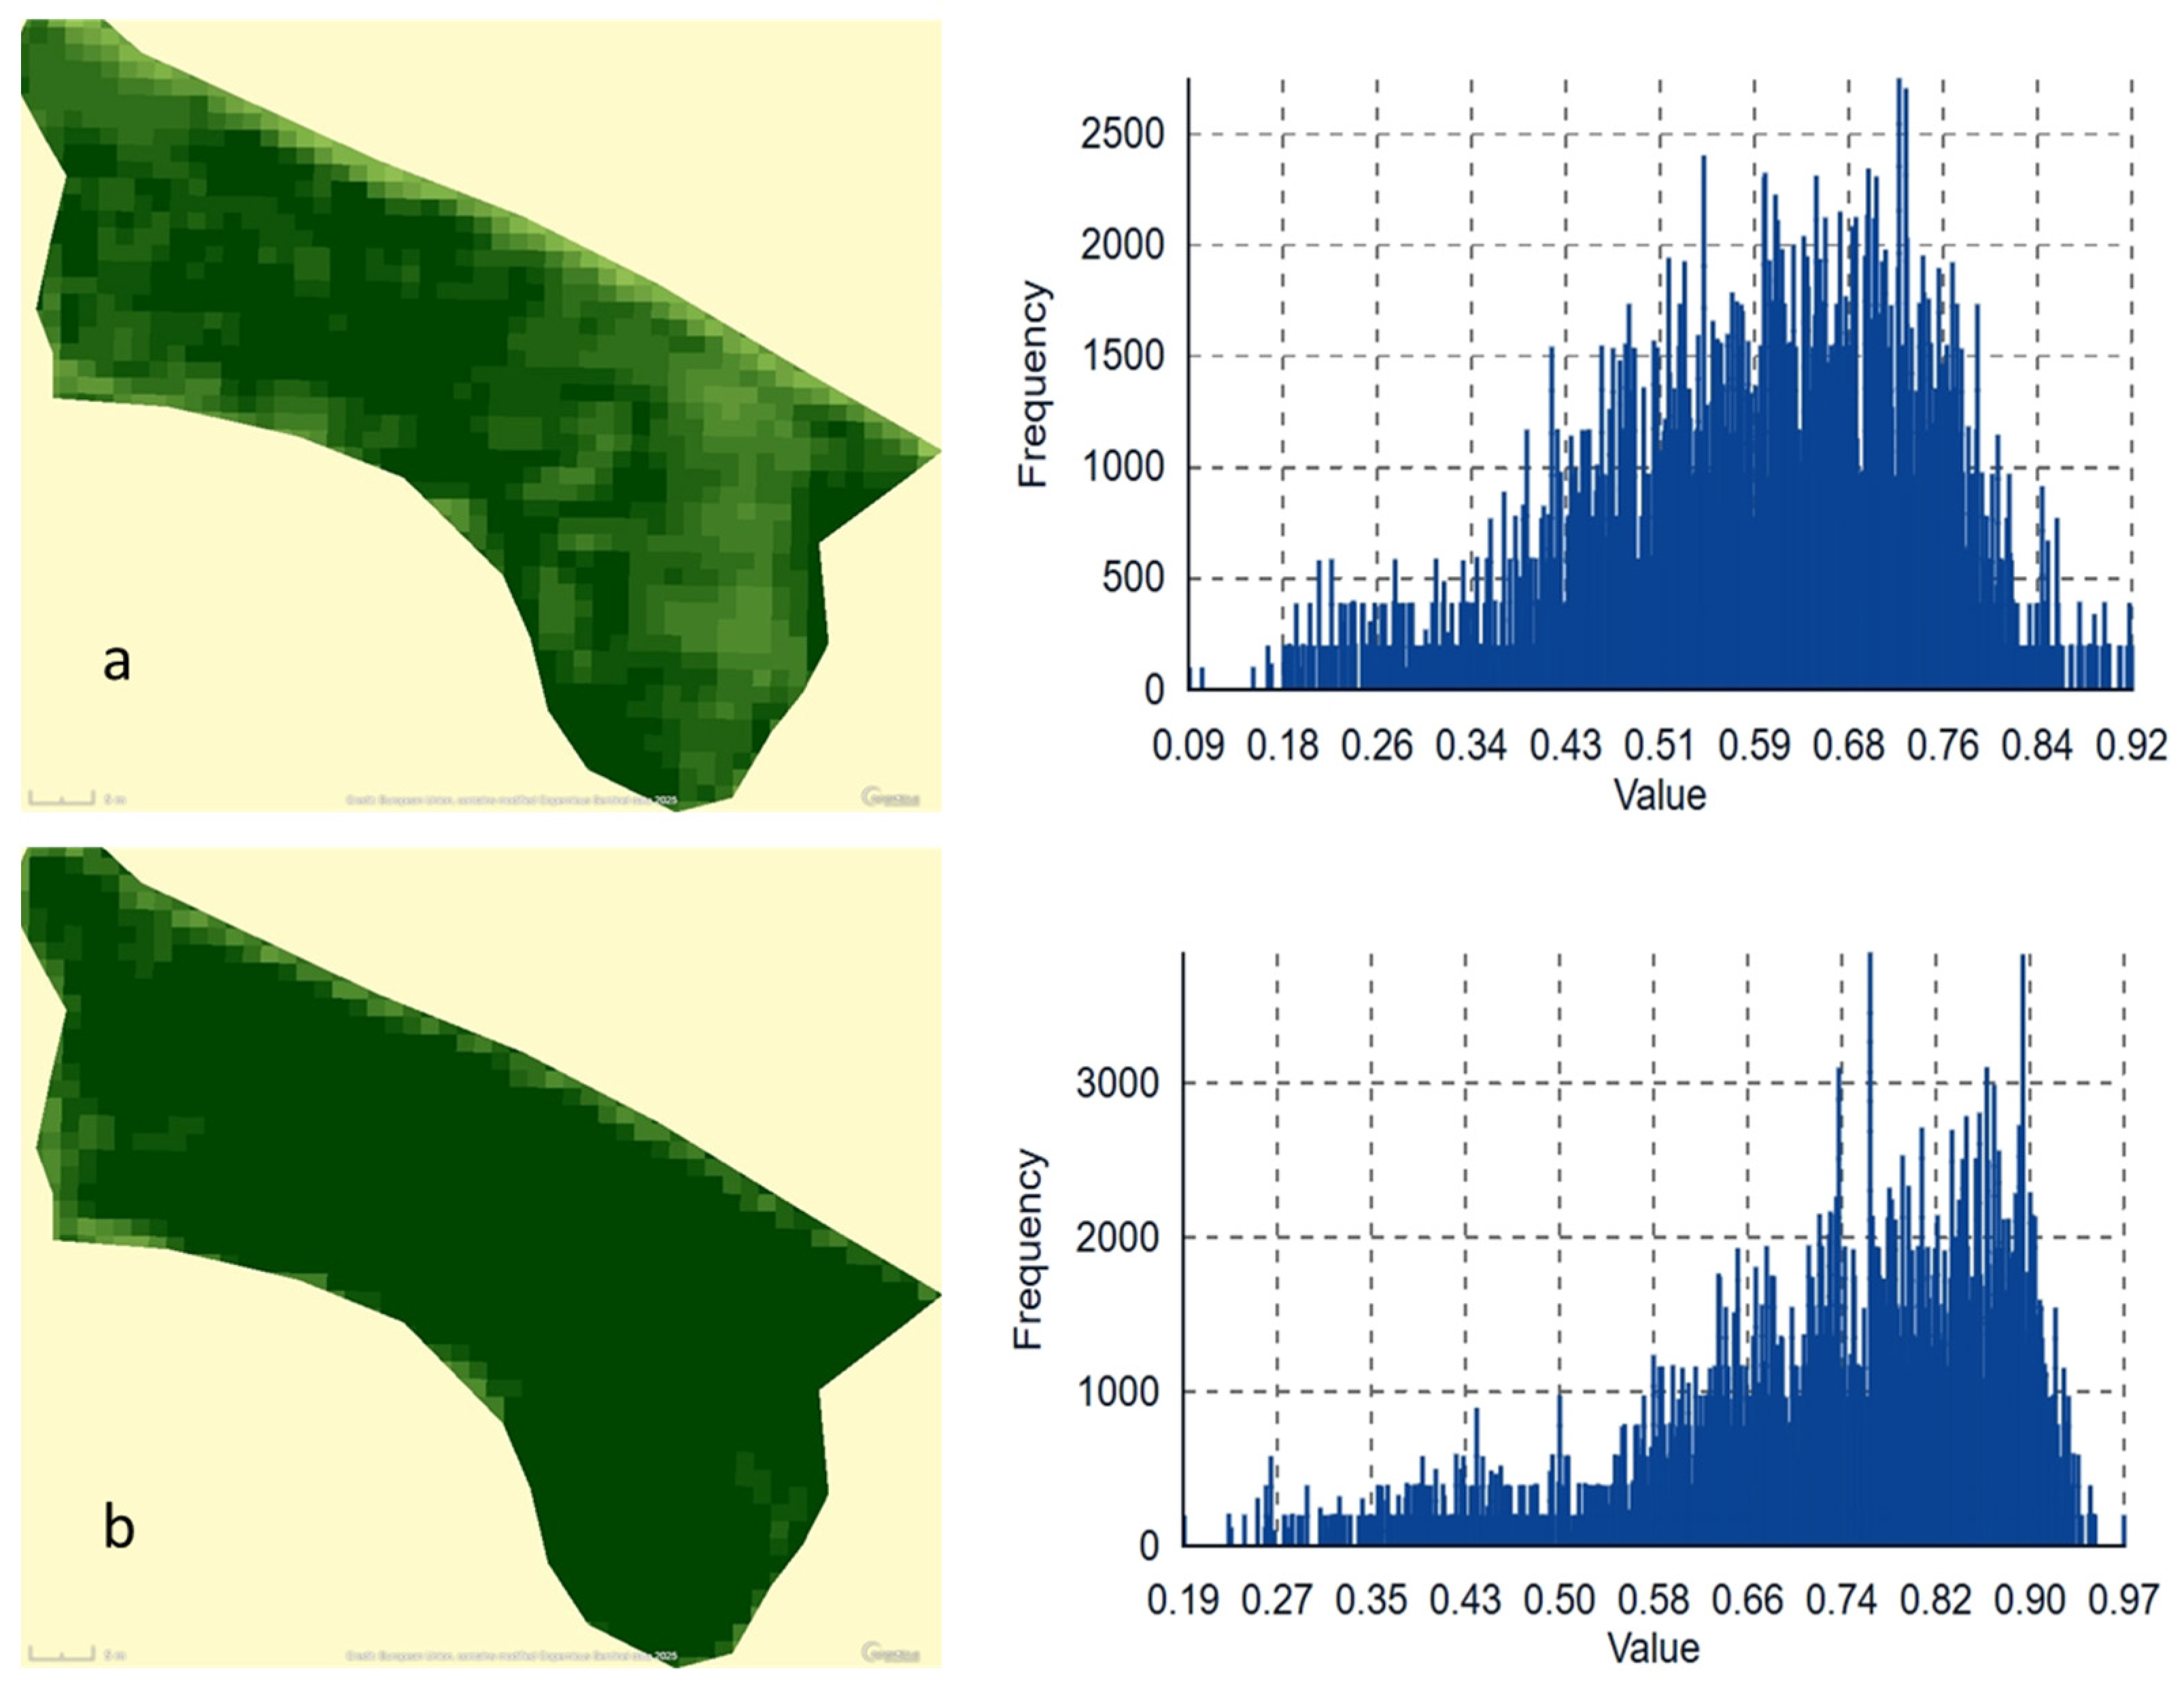
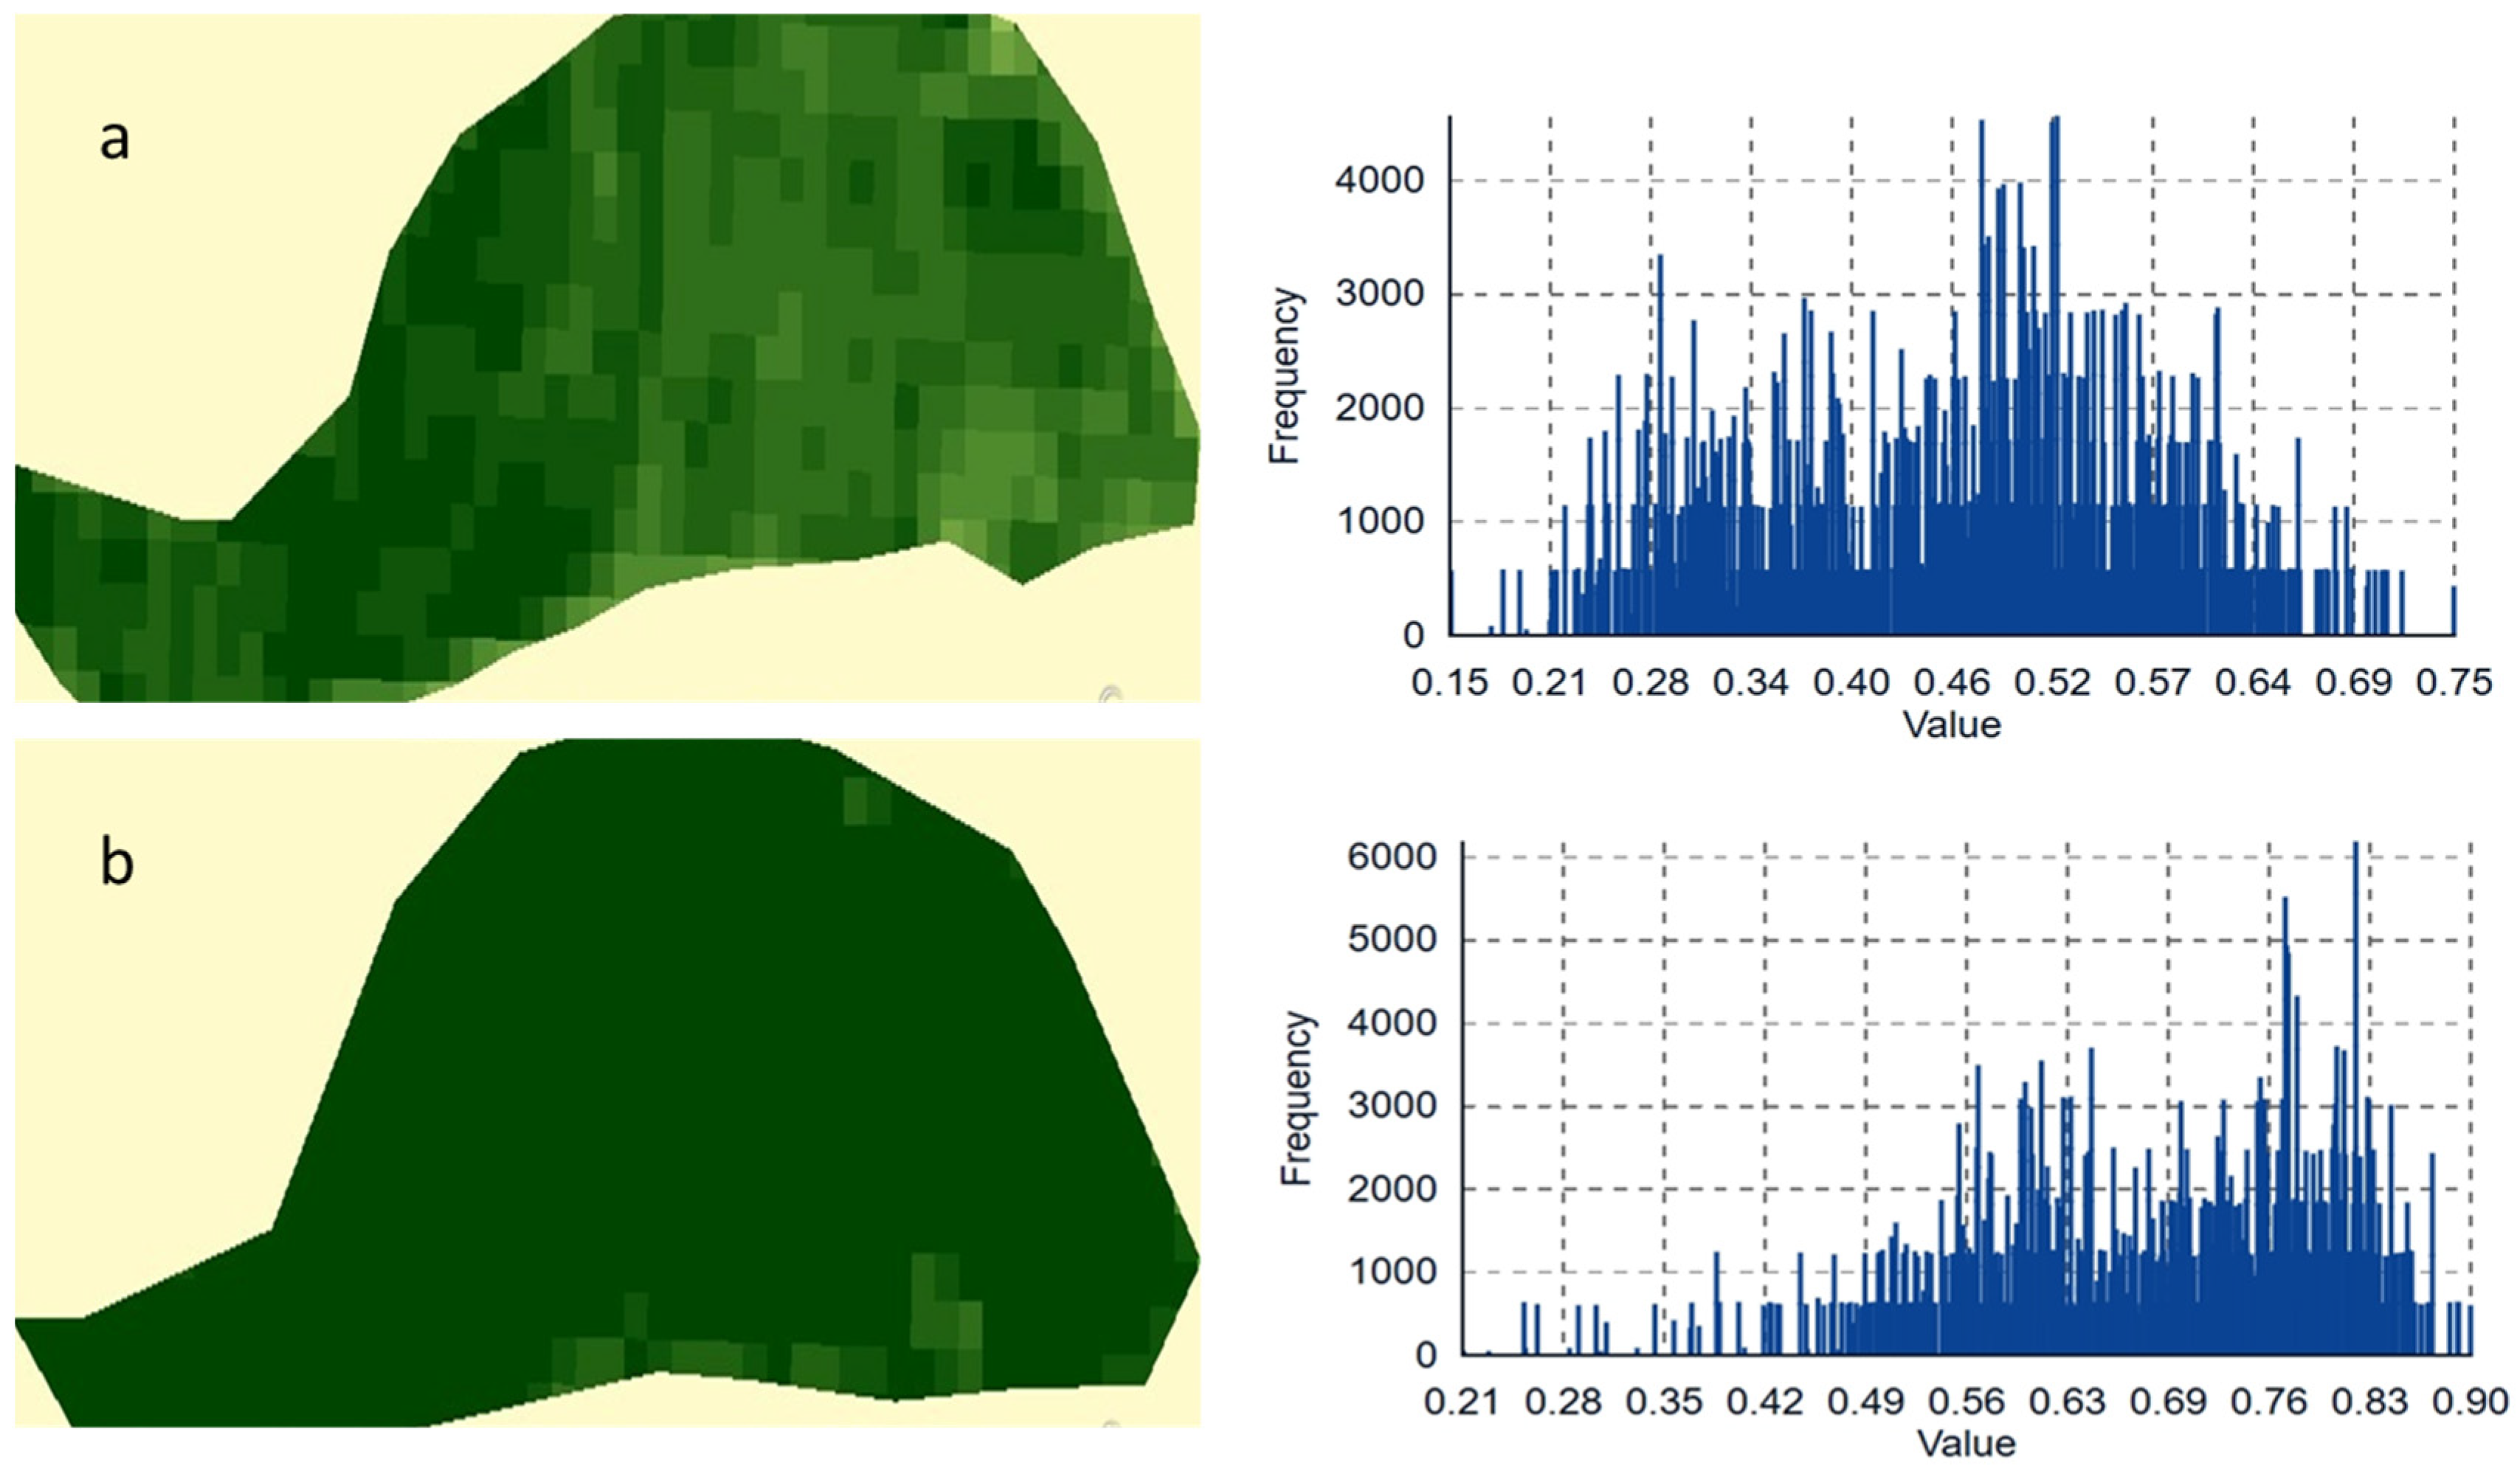
To confirm biomass accumulation in the two areas, images and frequency histograms based on NDVI values were also generated for dates immediately prior to the first thinning (on 9 May 2022) and for current images (18 January 2025), in order to verify whether there was a positive trend in the increase of plant biomass.
3. Results
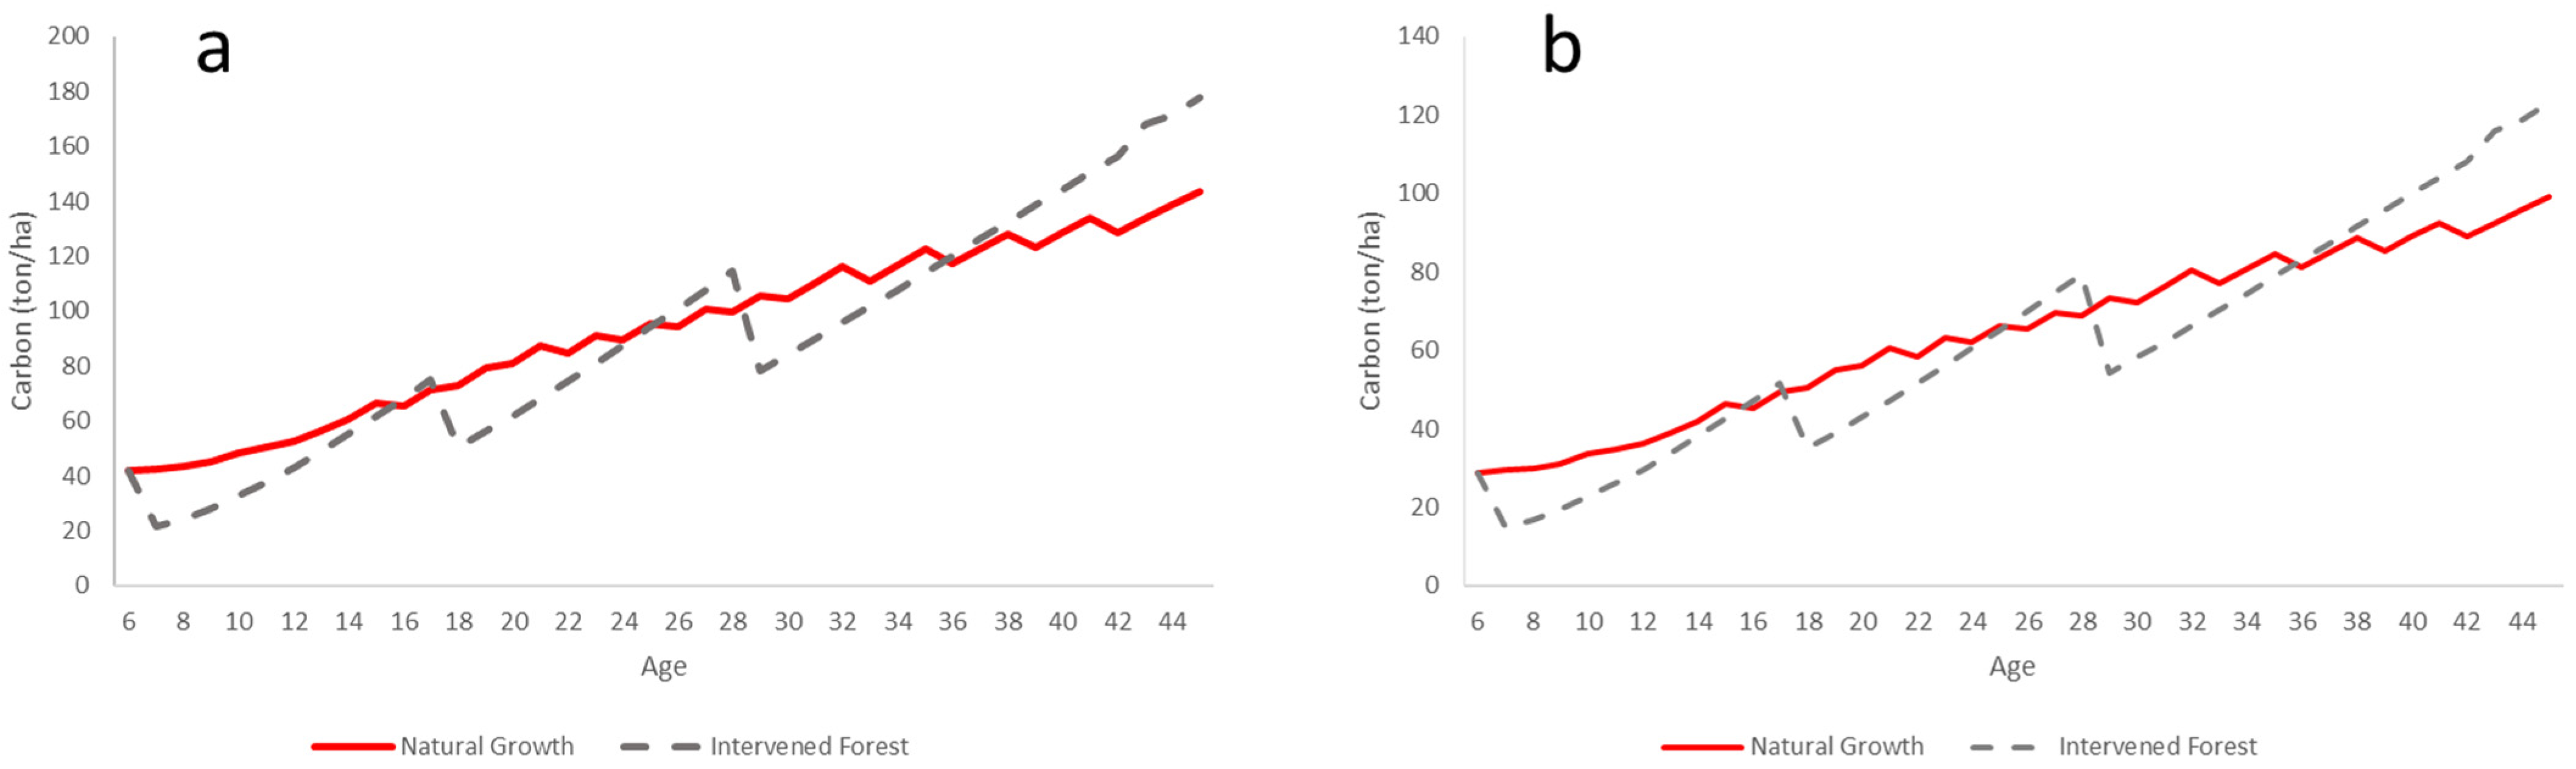
3.1. Total Carbon and Accumulated Carbon Above Ground
The simulation of the evolution of the amount of carbon stored in the living trees of the forest contained in the study area showed an increasing behavior for the scenarios in which the forest grows naturally and for the scenario in which three thinning operations are carried out.
Initially, the natural forest has a greater mass of accumulated carbon, as it does not undergo initial thinning that reduces the carbon in standing trees. At around 24 years of age, the intervened forest surpasses the mass of carbon accumulated in the natural forest, due to the effect of reduced competition for resources, induced by the decrease in tree density. However, at 28 years of age, when it undergoes new thinning, the amount of accumulated carbon is reduced to levels lower than that of the natural forest. At around 36 years of age, the intervened forest once again surpasses the mass of carbon of a natural forest. The cycle ends with approximately 123 tons of accumulated carbon per hectare, compared to 99 tons in the natural forest.
Figure 4a shows the results of carbon accumulation in the simulated scenarios of natural forest and intervened forest with three thinnings.
The total accumulated carbon shown in
Figure 4b can be described with the same indications attributed to the evolution of the carbon mass on the soil, but it also takes into account the carbon accumulated in the leaves, thin branches, and roots not accounted for in the results shown in
Figure 4b. In the scenario of a natural forest, at the end of the cycle, there is an accumulated mass of 143 tons of carbon, and in the intervened forest, 178 tons of carbon.
Figure 4 presents the total carbon results for the scenarios analyzed.
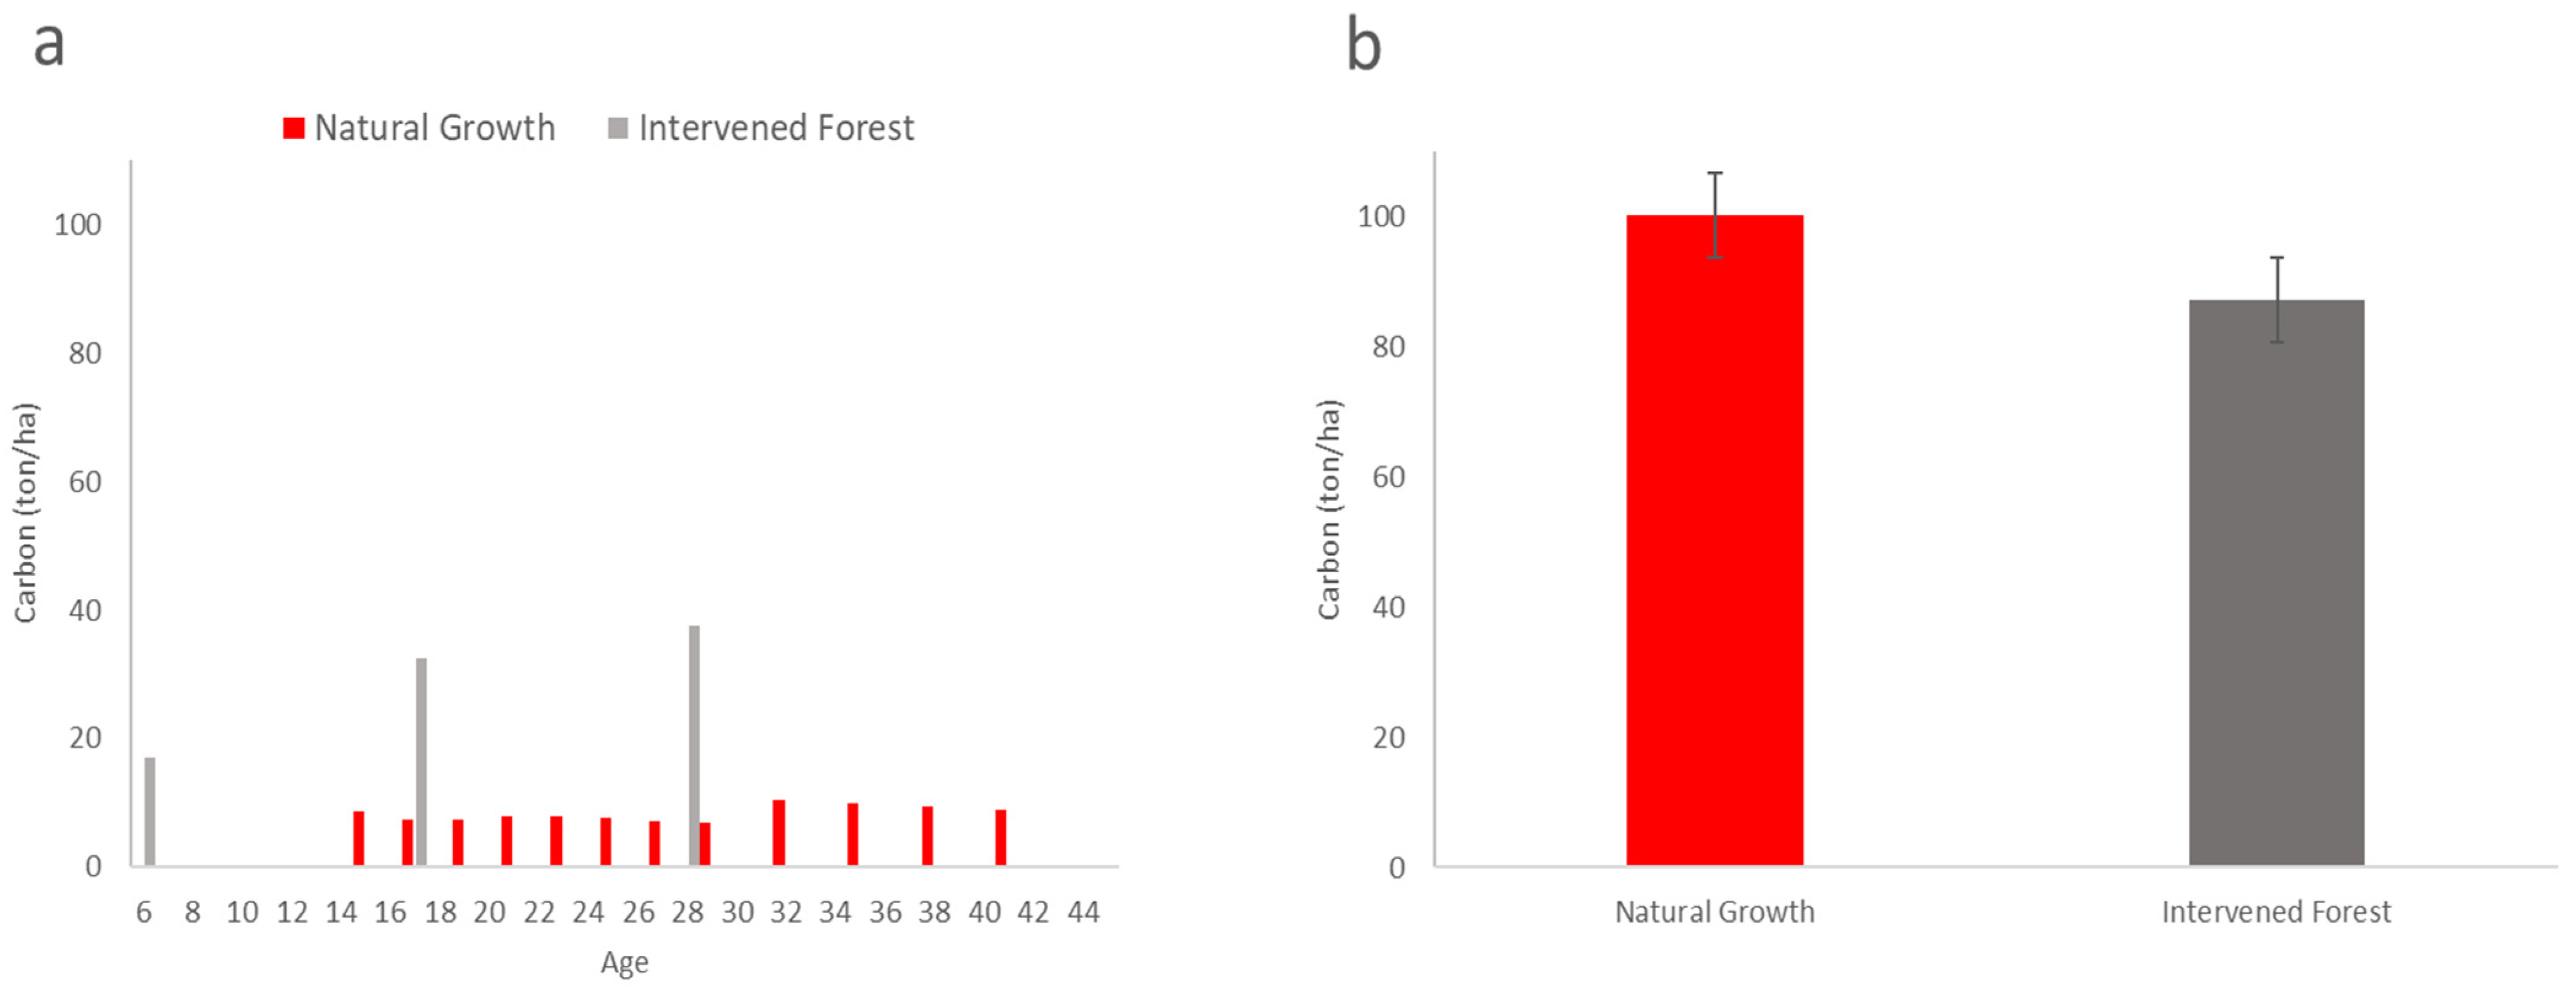
3.2. Total Carbon from Thinning and Mortality
The simulation of the carbon mass in trees extracted from the stand, both by programmed thinning and by mortality, shows more frequent events in the growth of the natural forest. Although thinning does not occur, the simulator predicted successive mortality events from 15 years onwards, with an average interval of two years between them. In the simulation of the intervened forest, the simulator was adjusted so that thinning occurred before the onset of mortality events. Thus, thinning occurred on three occasions, thus avoiding the occurrence of mortality.
The sum of the carbon masses contained in the trees extracted by thinning or dead was greater in the natural forest scenario, with a value of approximately 100 tons compared to the 87 tons accumulated above ground in the intervened forest.
Figure 5 presents the comparative result between the carbon mass in each mortality or thinning event between the two scenarios (a) and the total carbon mass in each simulated scenario (b).
In this figure, the normalized p-value calculated in the comparison between the carbon weight in the natural growth forest and that in the intervened forest was 0.09. Therefore, no statistical difference was observed between the values. However, this comparison should be considered with caution, as the sample is unique and only applies to the specific scenario. Expanding the sample would allow confirmation of this trend in other scenarios.
3.3. Amount of Carbon Accumulated in Thinning and Mortality Trees According to Diameter Class
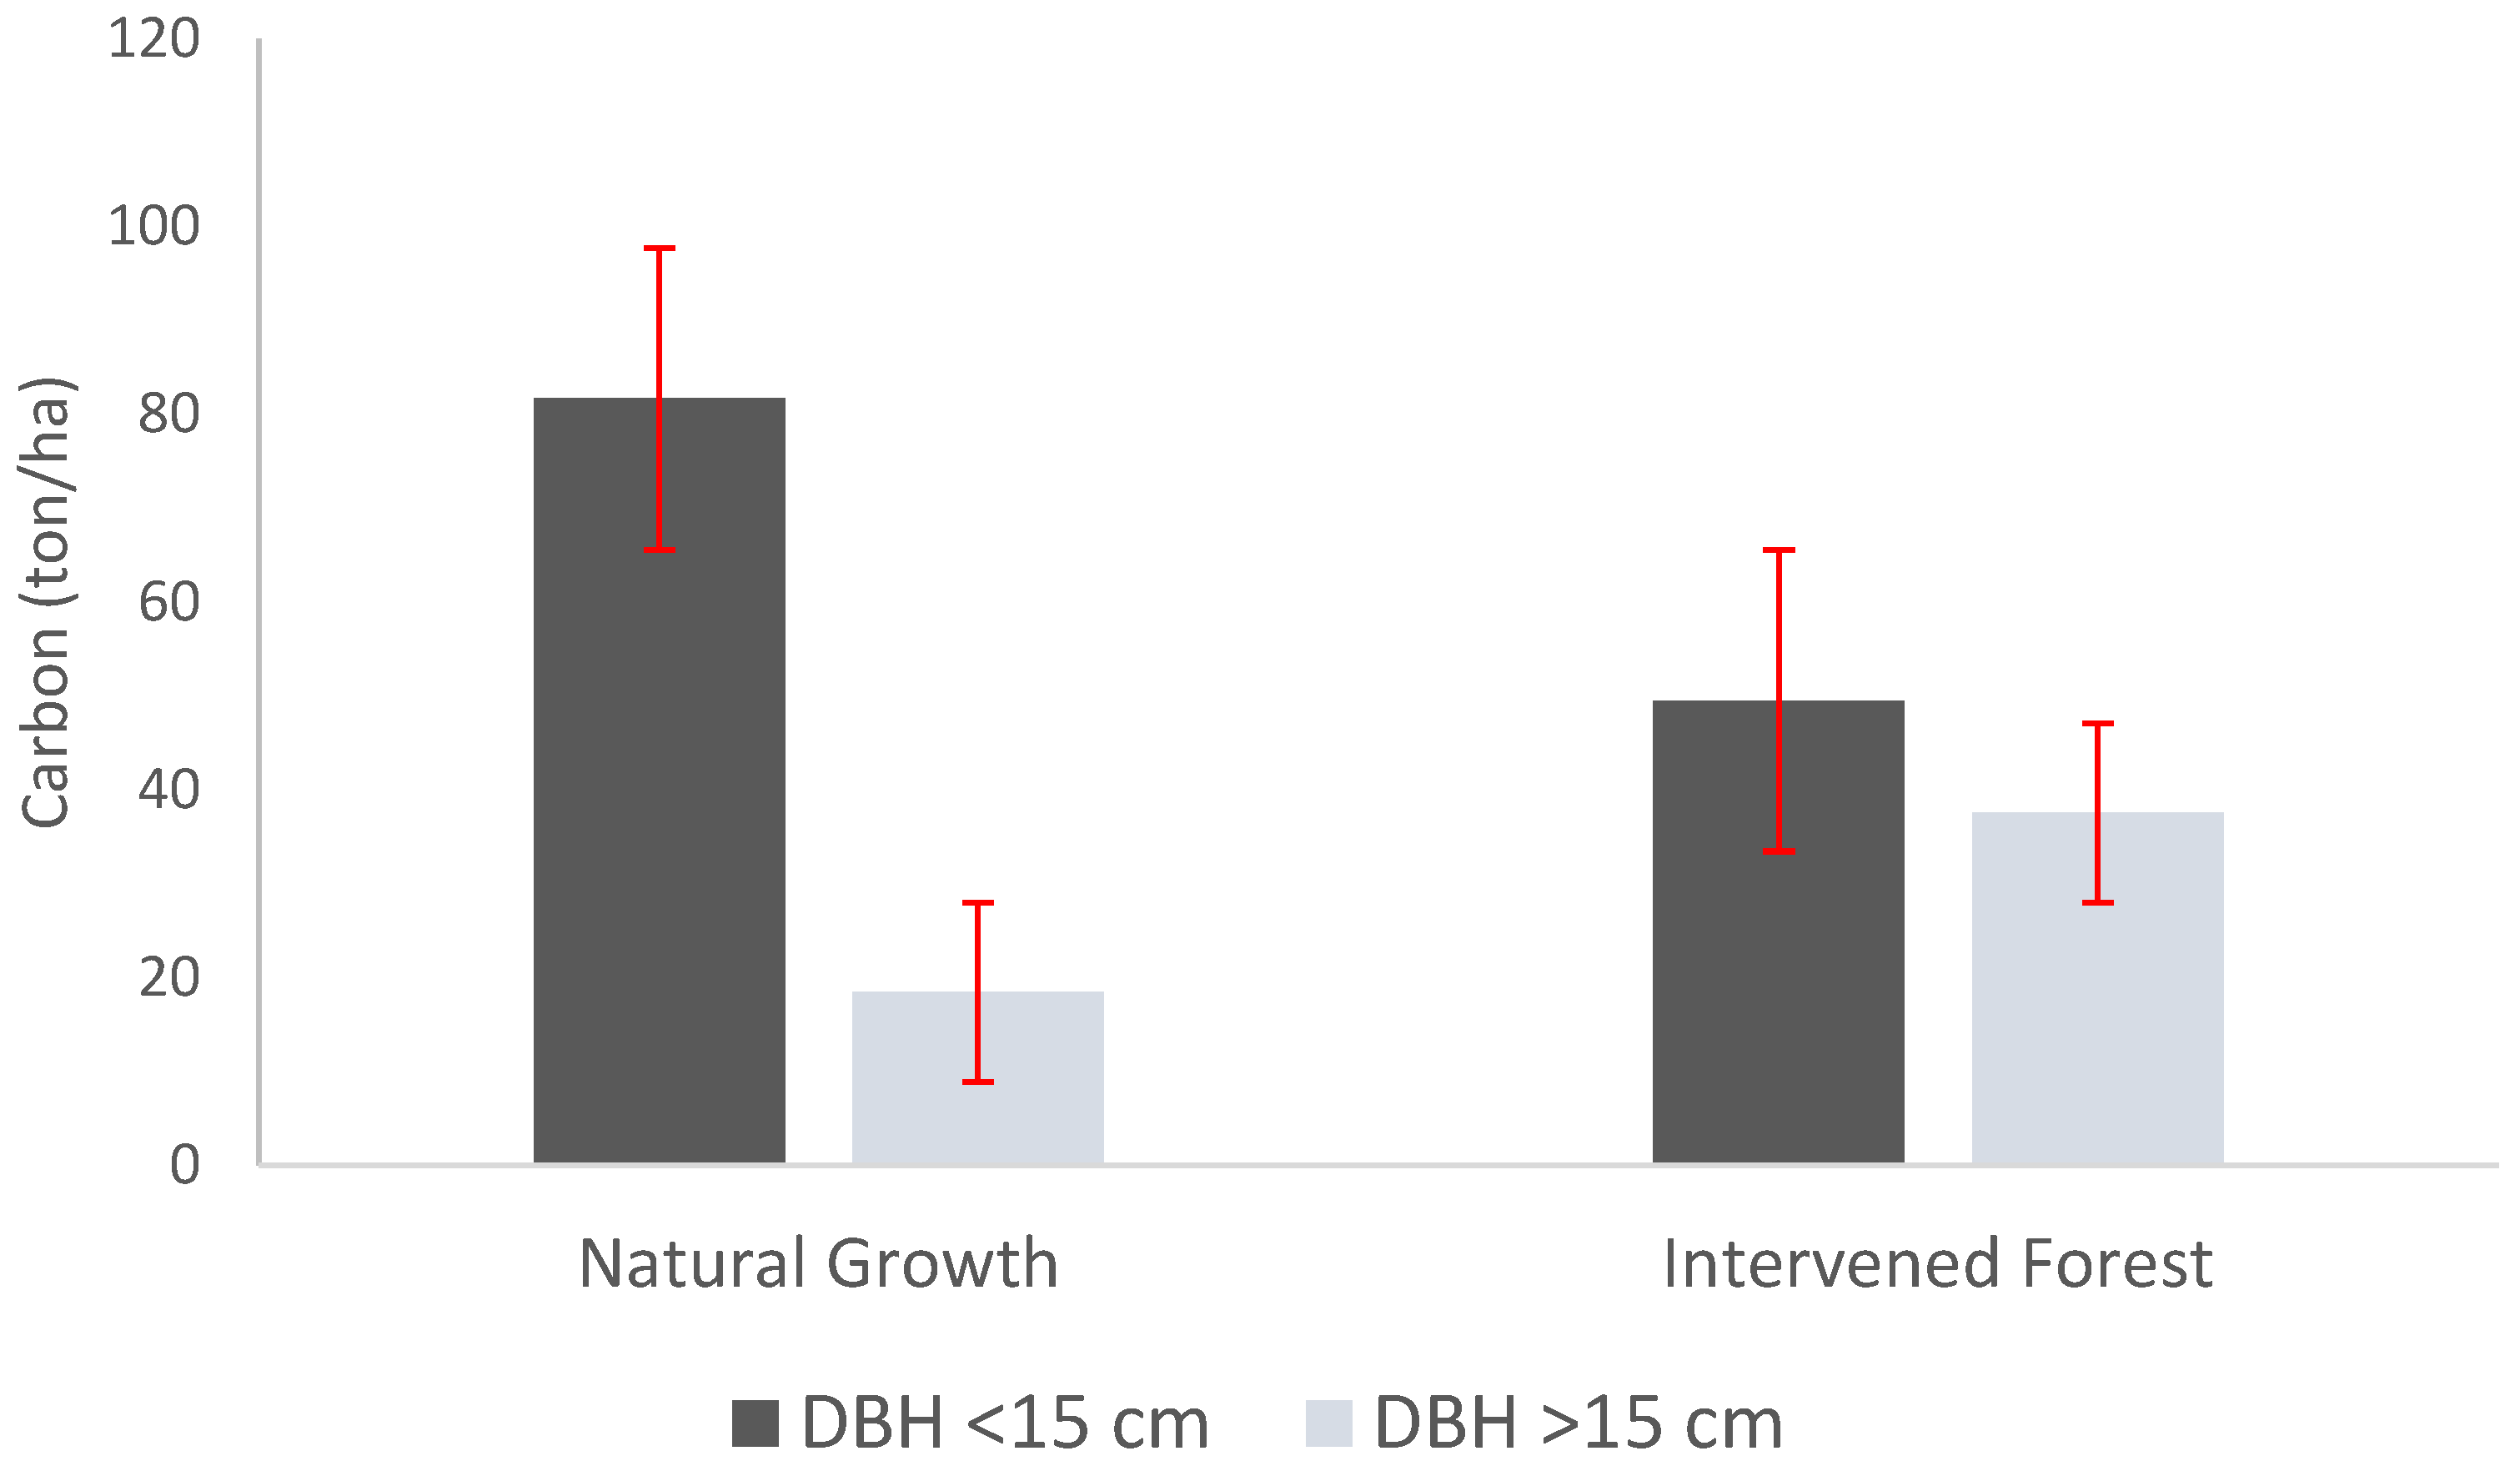
According to the carbon balance methodology defined for this study, the simulations carried out indicated that in the natural forest, 82 tons of carbon (82%) corresponded to the carbon in trees with less than 15 cm in diameter at breast height and 18 tons (18%) corresponded to that existing in trees with DBH greater than 15 cm.
In the intervened forest, the mass of carbon contained in the class of trees with DBH less than 15 cm was approximately 50 tons (57%) and the mass of carbon simulated in trees with DBH greater than 15 cm was approximately 38 tons (43%).
Figure 6 shows the values of accumulated carbon by diameter classes in each scenario.
3.4. Above-Ground Carbon Mass Balance
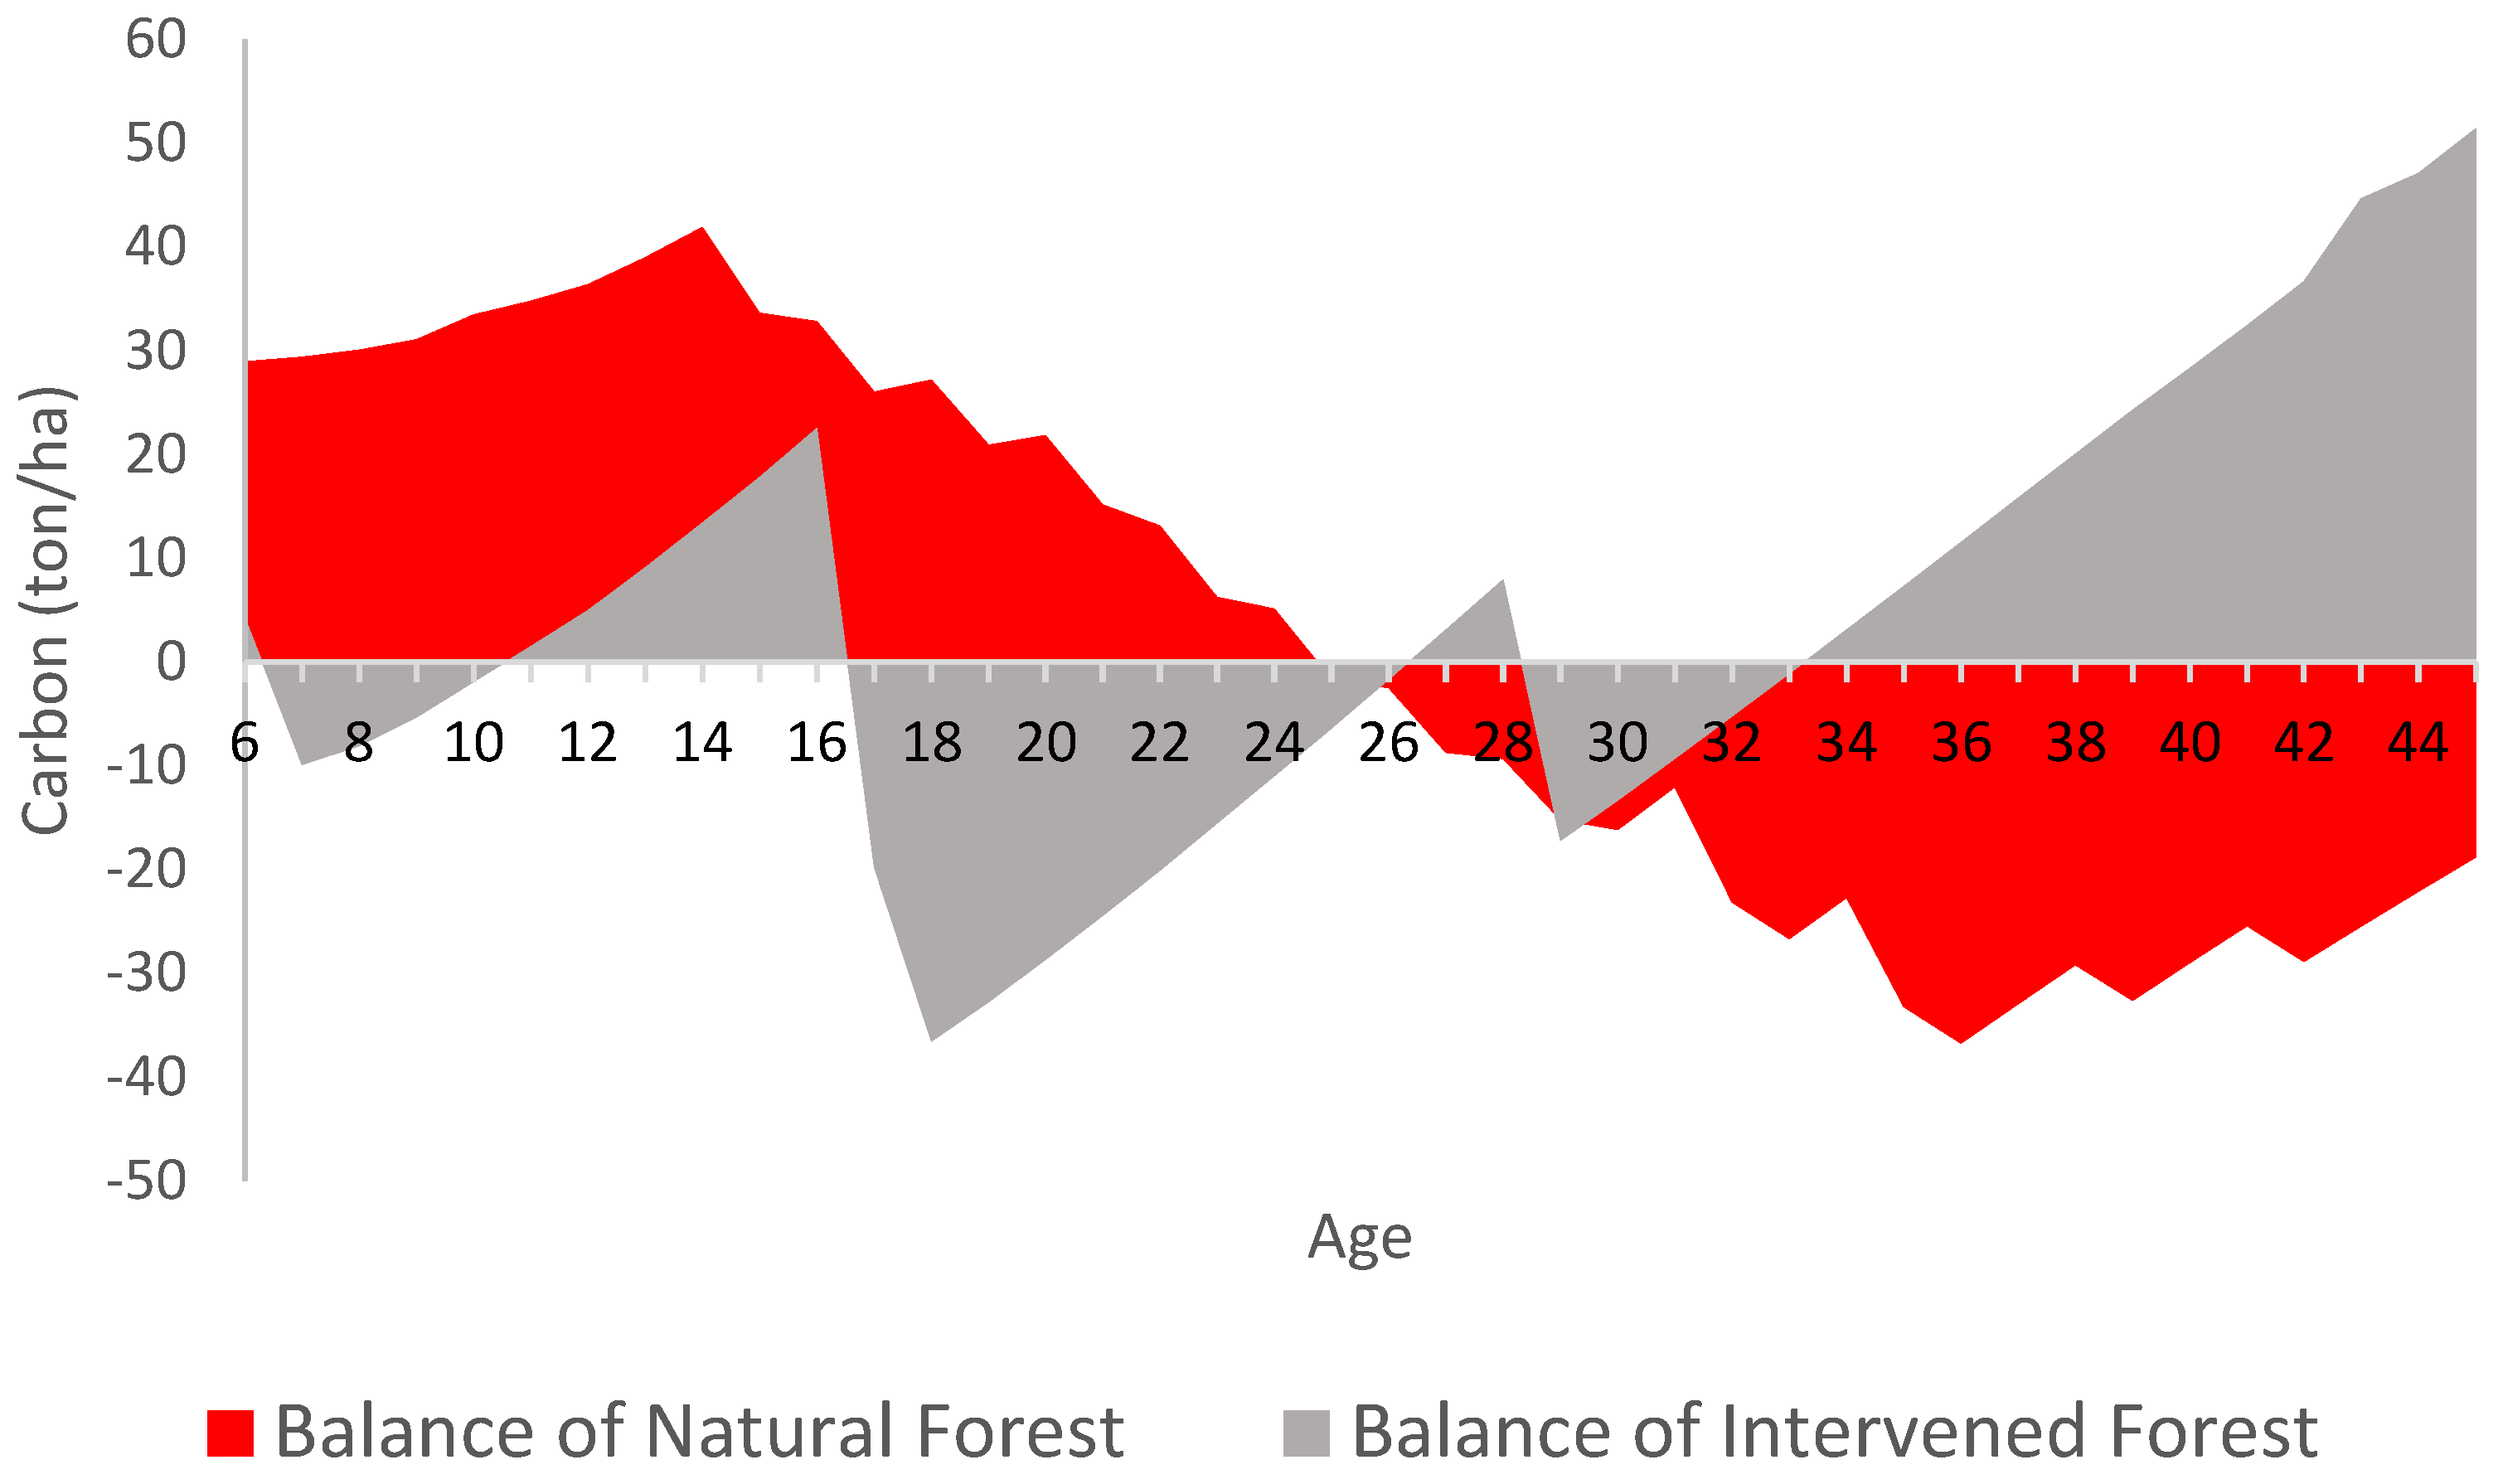
Figure 7 shows a comparison of the carbon balance throughout the cycle of natural forests and intervened forests.
The simulated carbon balances compared indicates that in the natural forest, until around 14 years, the carbon balance is positive and increasing. After 14 years, the natural forest starts to emit more carbon than it captures, and the curve reverses the trend, becoming downward until 25 years. When the amount of carbon emitted is equal to that captured, the downward trend continues until around 36 years. However, when it reaches the maximum negative balance value, the forest goes back to capturing more carbon than it emits, and the balance curve starts to increase again until 45 years. The cycle ends with a negative balance of approximately 19 tons of carbon per hectare.
The forest that underwent intervention starts with a negative carbon balance, since the first thinning had a significant mass of small-diameter wood (DBH). However, due to the positive effect of thinning on the remaining trees, the carbon accumulation rate increased sharply, and the curve remained positive and upward until the second thinning at 17 years. When many small-diameter trees were again extracted, the cycle repeated itself, with a sharp drop in the carbon balance to negative values and, again, strong growth until the age of 26. The forest then once again became carbon surplus, with the balance tending to increase until the age of 28, when another thinning occurred. This thinning had less of an impact on the decrease in the carbon accumulation balance curve, since the trees removed at this time had a larger diameter and were considered long-life carbon storers. Despite this, there is still a decrease given the fraction of thin trees and a subsequent accumulation of carbon up to 45 years, at which point the intervened forest scenario closes the cycle with a mass of approximately 51 tons of captured carbon.
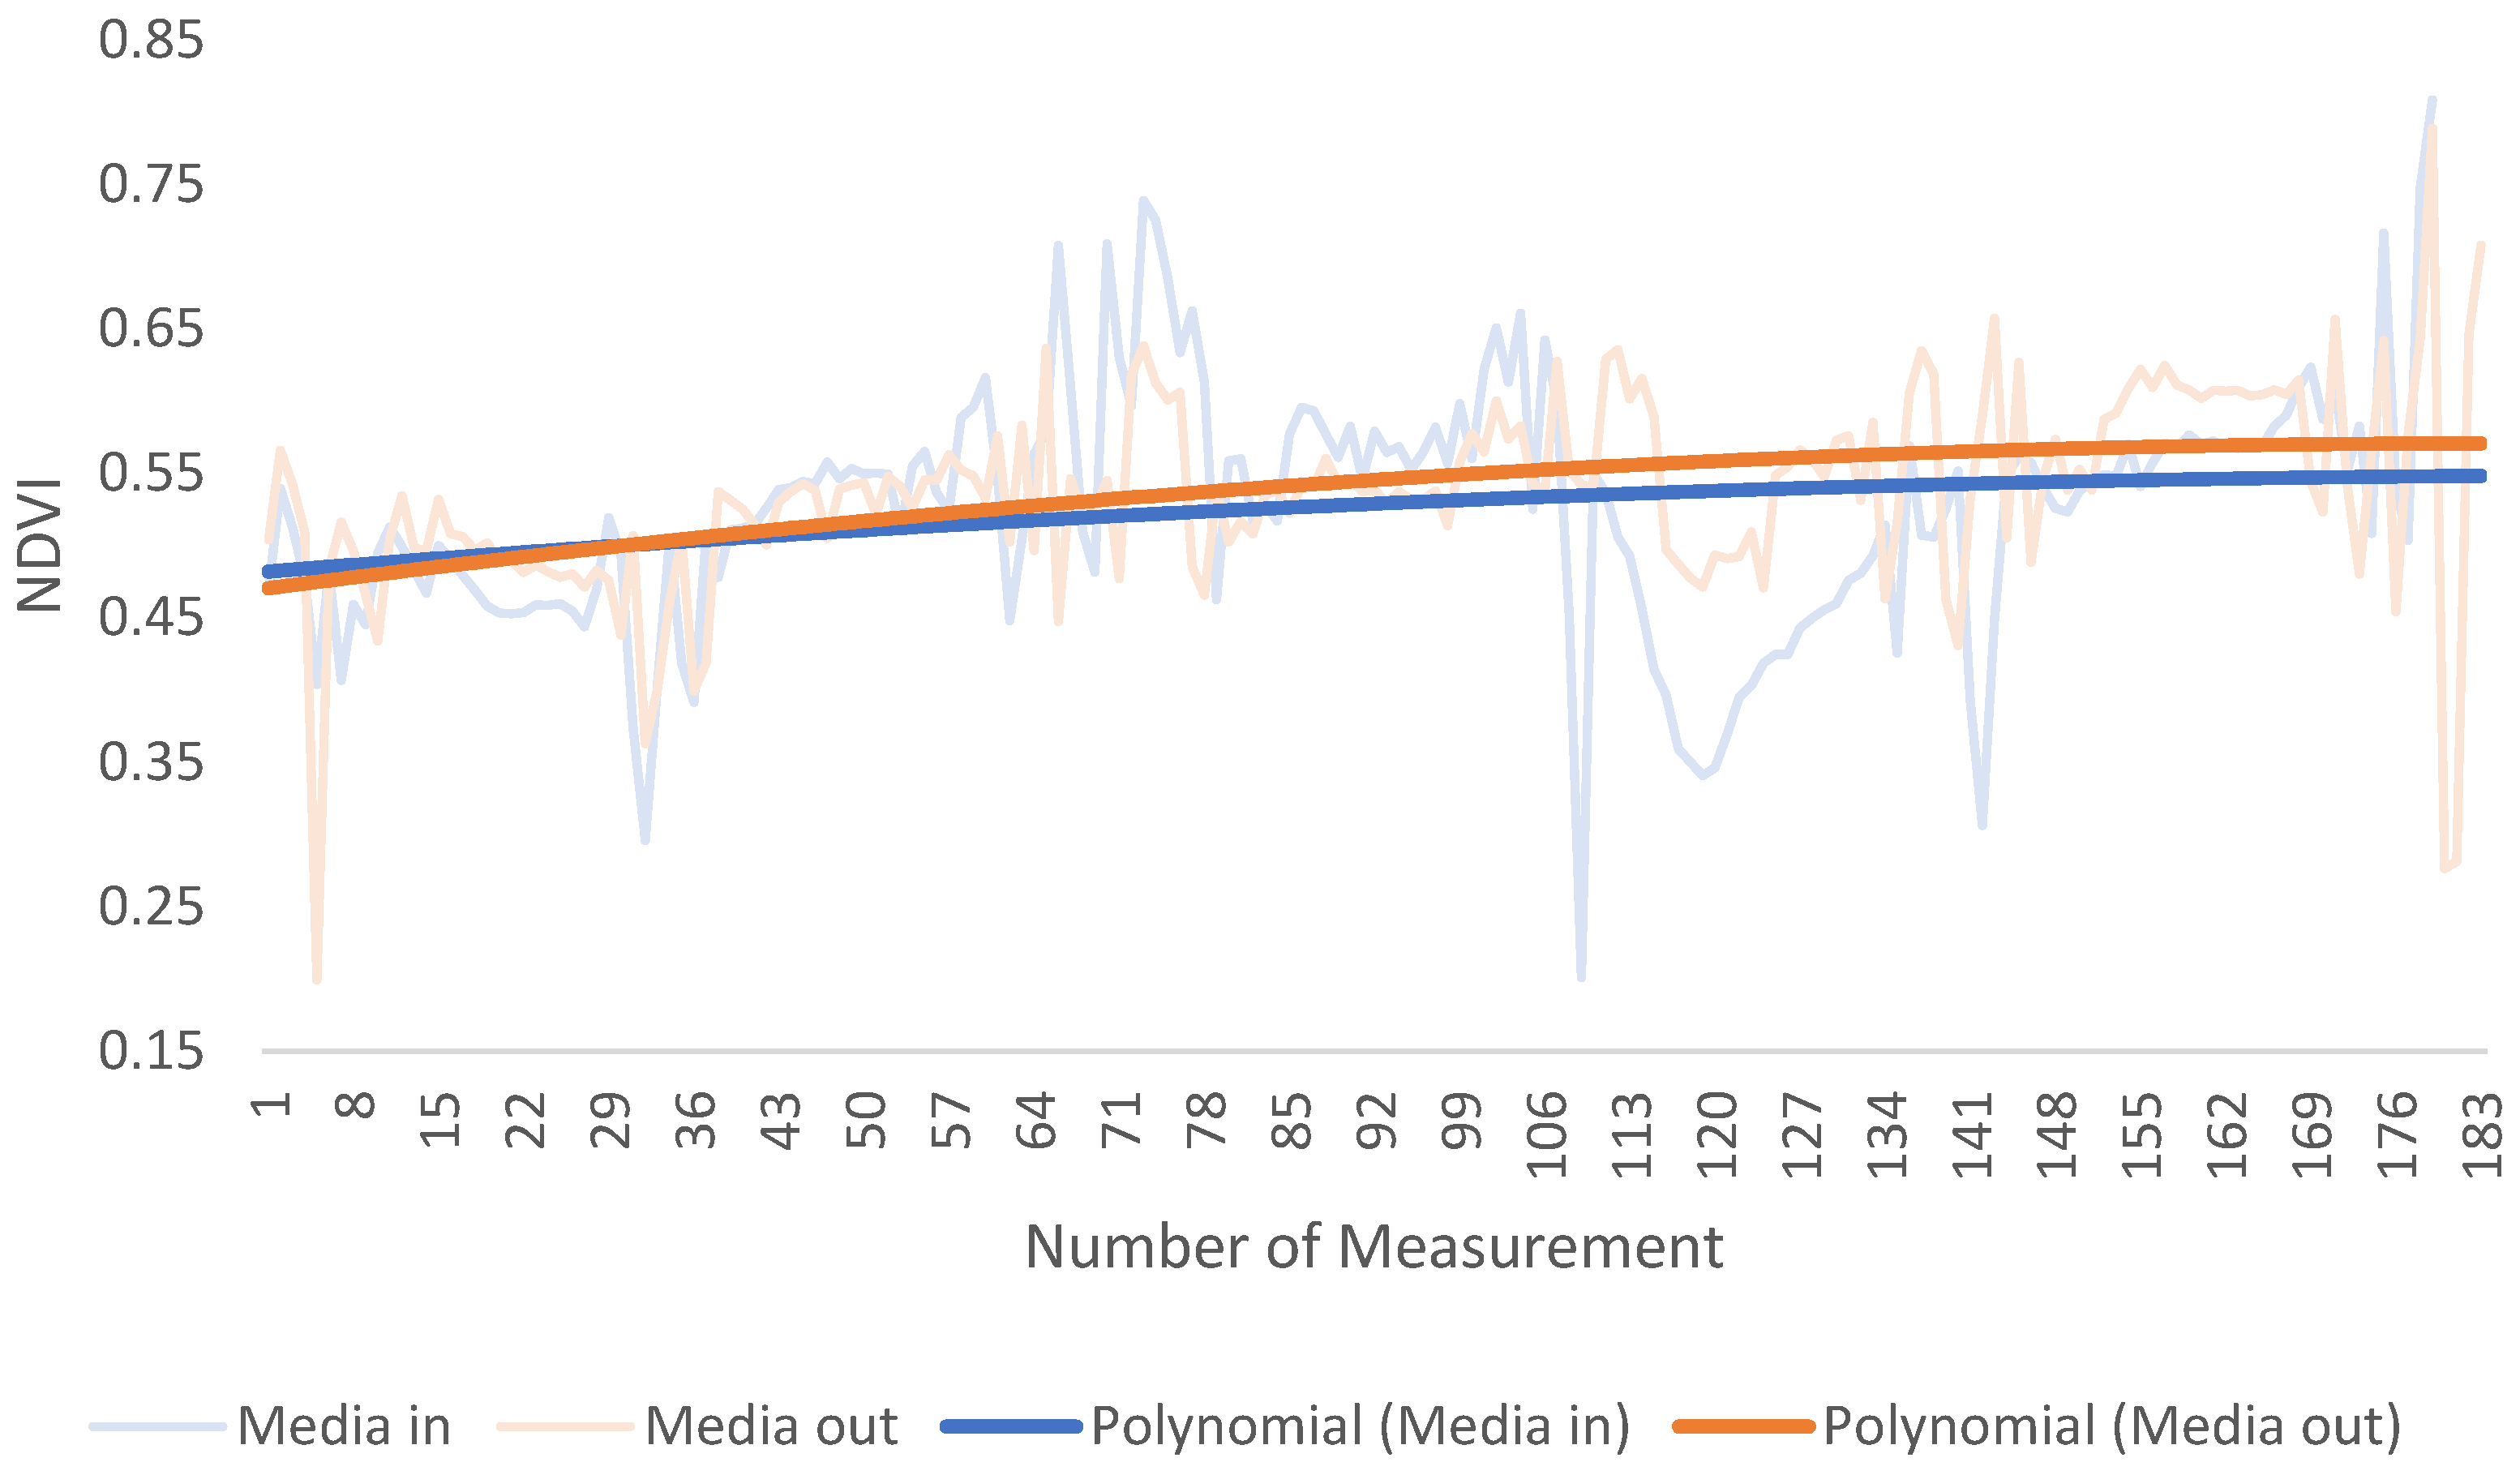
3.5. Vegetation Coverage Analysis
The NDVI indicators for the vegetation cover of the study areas were consolidated and presented in graphical form. As the pattern of the curve presented by the NDVI results for the plots inside and outside the management area fluctuates, it generates a line with significant value fluctuations (faded blue and orange lines), making comparison between them more difficult; then, a polynomial trend line of degree 2 was determined for comparison purposes. The lines represented by the polynomial trend result in stabilized curves (clearer blue and orange lines) that are continuous, describing the growth pattern in both internal and external areas more stably and allowing for a visual comparison of the NDVI evolution.
After excluding days with cloud cover greater than 50%, the number of measurements between January 2020 and December 2024 was 183.
Figure 8 illustrates the NDVI results for the average of the plots inside and outside the managed area.
During the period analyzed, the vegetation density is slightly higher in the areas outside the managed area, and the NDVI values were always above 0.4, corroborating the reality of the terrain that is natural regeneration of maritime pine.
Statistical analysis using the unpaired t-test showed a p-value of 0.0064, therefore indicating a significant difference between the two samples, i.e., the vegetation density in the adjacent unmanaged areas is greater than in the intervention area.
The analysis of the images generated by the Copernicus Browser confirms the accumulation of plant biomass in the studied areas, as evidenced by the darker tones in the more recent images. This observation is also supported by the NDVI distribution and frequency histograms, where in the May 2022 images, the highest frequencies in both cases are found in the range of 0.5 to 0.7. In contrast, in the image obtained in January 2025, the values are concentrated between 0.7 and 0.9, indicating denser vegetation with greater biomass accumulation.
Appendix A shows the evolution of the NDVI within the studied areas and contributes to the understanding of biomass accumulation and, consequently, carbon in the forest, as well as the evolution of the typology present in the field.
4. Discussion
The forest management discussed in this document was limited to a baseline scenario of natural regeneration of maritime pine, which considered the local characteristics of two areas (Baldios de Ganja and Torneiros) in the municipality of Boticas. Therefore, the results presented are specific to this specific study area and even within the limits of this area, conditions such as intensity and pattern of thinning, tree density, climate, fires, diseases, and others may lead to other results. The forest is a living and dynamic organism that responds differently to different external stimuli [
29,
30].
Regarding the carbon balance obtained, it should be emphasized that this was a model based on mathematical simplifications for carbon emission and capture, where capture occurred during photosynthesis and biomass accumulation and emission occurred from the decomposition of biomass caused by thinning and mortality. It is, however, known that during the cycling of dead trees, part of the carbon is incorporated into the soil and can remain there for more or less prolonged periods depending on several factors, including forest management [
31], not necessarily being emitted into the atmosphere in a short cycle.
Soil carbon plays a crucial role in the balance of retention and emission, and a deeper understanding of its dynamics complements the study presented here on aboveground biomass. Factors such as forest management models, edaphic-climatic conditions, and even climate change significantly influence soil dynamics, particularly the rate of heterotrophic respiration, which consumes carbon and tends to be more pronounced in forests located in warmer regions [
18].
Forest management has a significant impact on the carbon balance, as it substantially influences the rate of heterotrophic respiration. In young stands and clear-cut areas, in addition to the dynamics already explored in this article, heterotrophic respiration rates are enhanced. The combination of these factors (stand age, type of management, and heterotrophic respiration rate) tends to result in a negative carbon balance in the forest ecosystems [
32]. The indicators of enzymatic activity, soil organic carbon, and water-holding capacity in Mediterranean forests of
Pinus halepensis are affected by soil characteristics and climate. However, it is also possible to relate the fluctuation of these variables to forest management practices, particularly thinning, which shows a short-term negative effect but contributes to the improvement of these indicators in the long term, especially in poorer soils [
33].
In addition, the life cycle of products transformed from wood thinnings leaves a gap regarding their useful life before being recycled: The paper produced, for example, may be discarded and decomposed in months or may be retained for centuries in a book, since the degradation time will depend on the path followed by the material in its life cycle and the intrinsic characteristics of the material [
34]. The simplification that low-diameter wood has a short life cycle and high-diameter wood has a long-life cycle is a generalization that must be taken into account and requires further investigation in subsequent studies and carbon credit projects.
The forest management of areas with naturally regenerated maritime pine stands promotes carbon accumulation in the main forest throughout the cycle. Studies indicate that, over a forest cycle, thinned and unthinned forests exhibit a similar carbon stock [
35]. However, if the biomass extracted during thinning is considered and added to the carbon stock of the main forest, thinned forests show greater carbon accumulation. In the present study, this dynamic becomes evident, as the thinned forest retains less carbon than an unthinned forest until approximately 34 years, at which point the balance shifts in favor of the thinned forest.
Carbon storage is also favored in managed forests of
Pinus sylvestris, for which studies indicate that the use of soil fertilization and latitude, when analyzed together with thinning, directly interfere with the forest’s biomass accumulation capacity at higher latitudes [
36].
The intervened forest accumulates a greater mass of carbon derived from mortality when compared to the mass of carbon originating from thinning. It is noted that the trees that die in a scenario of natural forest growth have low DBH and, therefore, generally have a short life cycle, while the trees from thinning, especially from the last thinning, have greater DBH and, therefore, are used for products with a longer life cycle. In summary, the greater percentage of wood from dead or thinned trees of small diameter is found in the natural forest compared to the intervened forest, which is unfavorable for carbon stocks.
The balance indicates a higher initial carbon balance for the natural forest. The fact that this scenario does not involve thinning allows for a higher initial accumulation of biomass. However, as the volume of trees increases and the effect of competition imposes continuous mortality rates, at that moment, the thinning intervention creates conditions for the intervened forest to present higher rates of carbon accumulation, so that at the end of the period analyzed (45 years), the intervened forest, for the conditions analyzed, has a positive carbon balance (51 tons) and the natural forest presents a negative balance of −19 tons.
The impact and intensity of the effect on carbon accumulation from thinning are particularly noticeable in the main forest in the initial years after thinning and tend to reduce over time; that is, there is a natural adjustment of the forest that imposes mortality through competition in natural forests, which over the years causes the final results of carbon accumulation in the natural forest to be similar to those of the thinned forest [
37] and knowledge of this behavior can be important in the management of forests with shorter cycles, especially in times where wood technology allows the use of processed wood products that can replace larger solid wood [
38].
Graphical analysis of the evolution of vegetation density as a function of NDVI has been used in conjunction with forest inventory and other data-collection techniques and has proven to be a reliable and low-cost practice for evaluating indicators of biomass evolution in the field [
39,
40]. The graph obtained in this study from the NDVI values provides important information regarding the evolution of the forest and the comparison between thinned and unthinned areas.
The lower biomass density in the natural regeneration area is consistent with the results found in the carbon balance, which also indicates lower carbon values, which are directly related to biomass, for the initial years of post-intervention regeneration, and the tendency is for this advantage to be reversed with the evolution of the forest.
NDVI values above 0.4 and with an increasing trend indicate a healthy and evolving forest; therefore, it is possible to infer that the trend indicated in the carbon balance in which the biomass accumulated in the managed forest will surpass the biomass of the unmanaged forest in more advanced age stages.
Although the present study is representative for the studied area (northern Portugal), studies that assess the behavior of a forest under the application of different management models are always influenced by a large number of variables, such as climate, soil, topography, and tree density, which are reflected in the mathematical models applied to each area. However, given the dynamic nature of these elements, particularly climatic variables, such studies are always limited to reporting local and dynamic results over time. Therefore, the continuation and expansion of this study to a greater number of thinning scenarios and different locations are important for deepening the understanding of the varying responses under different conditions.
5. Final Remarks
Forest management through thinning has a positive impact on the carbon balance at the end of a forest cycle, but the age of natural regeneration must be taken into account, since the study indicates greater carbon accumulation in the younger phases of unthinned natural regeneration and this trend is reversed when tree mortality begins due to competition for abiotic factors.
The carbon balance is influenced by the dimensions and uses of the thinned material, as trees with larger diameters tend to accumulate carbon for longer, while trees with smaller diameters have a shorter life cycle, therefore emitting the accumulated carbon more quickly into the atmosphere, negatively influencing the balance.
Early thinning strategies for drastic density reductions in the initial years of natural regeneration areas of maritime pine can result in lower biomass volumes, thereby reducing carbon emissions to the atmosphere while promoting carbon accumulation in the long-cycle residual biomass.
As a carbon emission mitigation and economic optimization strategy, the use of shorter-lifecycle and smaller-sized biomass in composite products (reconstituted wood) can guide forest management towards shorter rotation cycles. This approach can contribute to long-term carbon retention, mitigating the effects of carbon emissions and enhancing forest resilience to climate change due to its reduced resource demands.
Understanding the growth evolution of a natural regeneration stand of maritime pine can serve as the foundation for determining regional silvicultural models in northern Portugal. When combined with environmental, economic, and social factors, this knowledge can support the creation of public policies that incentivize the forestry sector, promote population settlement in rural areas, and have significant positive implications for strengthening the bioeconomy in inland territories, wildfire prevention, and overall social well-being.
The natural regeneration forests of Pinus pinaster, under the conditions studied in the Tâmega Valley in northern Portugal, excluding soil and roots, despite accumulating carbon throughout their life cycle, do not constitute an effective carbon reservoir. This is because the mortality of abundant small trees, due to competition from the high densities observed in this typology, leads to their degradation, releasing carbon back into the atmosphere. Management through thinning is an effective tool to control mortality, allow for greater tree growth, and capture carbon, thereby achieving a positive carbon balance over the cycle and mitigating the effects of climate change.
The present study indicates an important trend of biomass and carbon accumulation in managed forests greater than in unmanaged forests and points to the forest as an efficient carbon accumulation system. However, periodic analyses must be carried out to confirm the dynamics indicated in the simulations.


