Article

Comparative Evaluation Methods of Comprehensive Soil Fertility in Jiangsu’s Coastal Saline–Alkali Land

1
School of Geomatics, Anhui University of Science and Technology, Huainan 232001, China
2
Changshu National Agro-Ecosystem Observation and Research Station, Institute of Soil Science, Chinese Academy of Sciences, Nanjing 211135, China
3
Jiangsu Cultivated Land Quality and Agro-Environment Protection Station, Nanjing 210029, China
4
The New Zealand Institute for Plant and Food Research Limited, Private Bag 3230, Hamilton 3240, New Zealand
*
Author to whom correspondence should be addressed.
Land 2025, 14(3), 469; https://doi.org/10.3390/land14030469
Submission received: 20 January 2025 / Revised: 11 February 2025 / Accepted: 17 February 2025 / Published: 24 February 2025

Abstract

:
In coastal saline–alkali regions, the intrusion of saline water exacerbates the nutrient depletion in the plow layer, posing a significant challenge to agricultural productivity. Given the limited understanding of soil fertility in these areas and the inconsistent results among different assessment methods, this study aims to develop a more accurate and reliable soil fertility evaluation system. To achieve this objective, 108 topsoil samples were systematically collected from saline–alkali lands in Jiangsu Province. Several key soil fertility indicators, including soil pH, total salinity (TS), soil organic matter (SOM), total nitrogen (TN), total phosphorus (TP), total potassium (TK), alkaline-hydrolyzable nitrogen (AN), available phosphorus (AP), and available potassium (AK), were comprehensively evaluated. Four advanced methods, namely principal component analysis indexing–linear scoring (SQIPCAL), principal component analysis indexing–nonlinear scoring (SQIPCANL), modified Nemerow–linear scoring (SQINemeroL), and modified Nemerow indexing–nonlinear scoring (SQINemeroNL), were employed to conduct a multi-dimensional examination of soil fertility. Additionally, principal component analysis (PCA) was utilized to establish a minimum data set (MDS), which was then compared with the total data set (TDS) for a more precise assessment of soil fertility. Linear scoring methods (SQIPCAL and SQINemeroL) had higher semi-variogram R2 values compared to nonlinear methods. Moreover, under the SQIPCAL and SQINemeroL evaluation methods, a strong correlation was observed between the TDS and MDS, with R2 values reaching 0.63 and 0.65, respectively. Based on these findings, the SQINemeroL method, integrated with MDS, is recommended as an effective approach for soil fertility assessments in coastal saline–alkali regions in Jiangsu Province. This research not only enriches the theoretical understanding of soil fertility in such regions but also provides practical insights for sustainable agricultural management.

1. Introduction

Saline–alkali land is an important reserve of arable land resources in China and plays a crucial role in ensuring national food security [1,2]. Statistics show that China currently possesses approximately 37 million hectares of exploitable saline–alkali land, of which around 6.7 million hectares hold substantial agricultural development potential and prospects for agricultural improvement in the near term. Among these, coastal saline–alkali land represents an important portion, spanning approximately 2.2 million hectares [3,4]. However, factors such as seawater intrusion, rising groundwater levels, and human activities contribute to high soil salinity, low organic matter content, and poor soil fertility in coastal tidal flats, severely impacting crop growth and yield [5,6]. According to statistics, the “Comprehensive Management and Demonstration Agricultural Development Major Project for the Huang-Huai-Hai Plain Drought, Flood, and Alkali Control” launched and implemented in the mid-to-late 1980s achieved significant results, with an increase in grain production of 2.52 × 10¹⁰ kg. This underscores the substantial impact of soil degradation on agriculture [7]. Therefore, the rational and efficient use of coastal tidal-flat saline–alkali farmland is strategically important for safeguarding food security and ensuring a stable food supply in China.
Comprehensive soil fertility assessments evaluate the soil’s capability to supply necessary nutrients for crop growth, reflecting its potential to maintain land productivity [8]. Soil nutrients are crucial for overall soil fertility. For instance, soil salinization and alkalization significantly impact the movement, transformation, and absorption of vital nutrients like nitrogen (N) and phosphorus (P), directly affecting crop growth, yield, and quality [4]. Studies have shown that soil N mineralization is significantly inhibited when soil salinity exceeds 3%, resulting in a reduction in soil available N [9]. Xie et al. [10] reported a strong negative correlation between soil available P content and soil salt concentration in coastal saline–alkali lands. While much research has focused on spatial and temporal variations in specific soil nutrients [11], it is crucial to develop a comprehensive soil fertility index to evaluate the risk of nutrient degradation. Soil organic matter (SOM), which is closely associated with soil fertility, was also included in the soil fertility assessment of this study. Unlike conventional farmlands, saline–alkali soils exhibit high salinity and alkalinity, which substantially diminish nutrient availability [12]. Thus, barrier factors such as total salt (TS) content and pH were incorporated into the soil fertility evaluation.
A comprehensive soil fertility assessment typically involves the following steps: (1) selection of appropriate indicators; (2) standardization of indicators; and (3) application of appropriate methods for calculating soil fertility. However, including numerous indicators increases costs and time requirements. To address this, researchers often streamline the total data set (TDS) of soil quality indicators into a minimum data set (MDS) using appropriate methods to enhance efficiency and reduce workload [13]. Given the differences in dimensions, magnitudes, and functions of different indicators, standardization is necessary to ensure comparability and facilitate comprehensive soil fertility evaluation [14]. Linear functions have been commonly used for normalization in past studies [15,16], particularly in regions with similar climate and soil types. However, some researchers argue that soil quality indices often exhibit nonlinear relationships, requiring nonlinear normalization methods that account for specific parameters of soil and crops in the study area [17]. Linear functions primarily focus on numerical values, whereas nonlinear functions allow for greater adaptability based on local conditions. Several methods are available for comprehensive soil fertility evaluation, including principal component analysis (SQIPCA) [18], the modified Nemerow index method (SQINemero) [19], an analytic hierarchy process [20], cluster analysis [21], and correlation analysis [22]. Selecting an appropriate method is critical for accurately assessing soil fertility on a large scale, particularly in coastal saline–alkali lands.
In summary, the selection of diverse indicators, the application of various index standardization methods, and the utilization of different approaches for calculating comprehensive soil fertility quality indices significantly influence the accuracy of coastal saline–alkali land fertility evaluation outcomes. Therefore, identifying an appropriate combination of methodologies is essential for effective and comprehensive soil quality assessment. Jiangsu’s saline–alkali land accounts for one-third of China’s national coastal saline–alkali land, and its area continues to expand annually [23]. This study focuses on the saline–alkali cultivated lands in the Jiangsu coastal region, employing four distinct soil quality evaluation methods: SQIPCA–linear scoring (SQIPCAL), SQIPCA–nonlinear scoring (SQIPCANL), SQINemero–linear scoring (SQINemeroL), and SQINemero–nonlinear scoring (SQINemeroNL). These methodologies were systematically applied to assess soil quality within the study area. Furthermore, this research investigated the feasibility and effectiveness of MDS in future soil quality evaluations. The findings aim to provide a scientific foundation for comprehensive soil quality assessments, objective evaluations, and mapping of coastal saline–alkali lands, contributing to informed land management and sustainable agricultural practices. We hypothesized that linear scoring offers greater accuracy and practicality compared to nonlinear scoring and that the SQINemeroL developed using the MDS has better adaptability than SQIPCAL calculated by MDS.

2. Materials and Methods
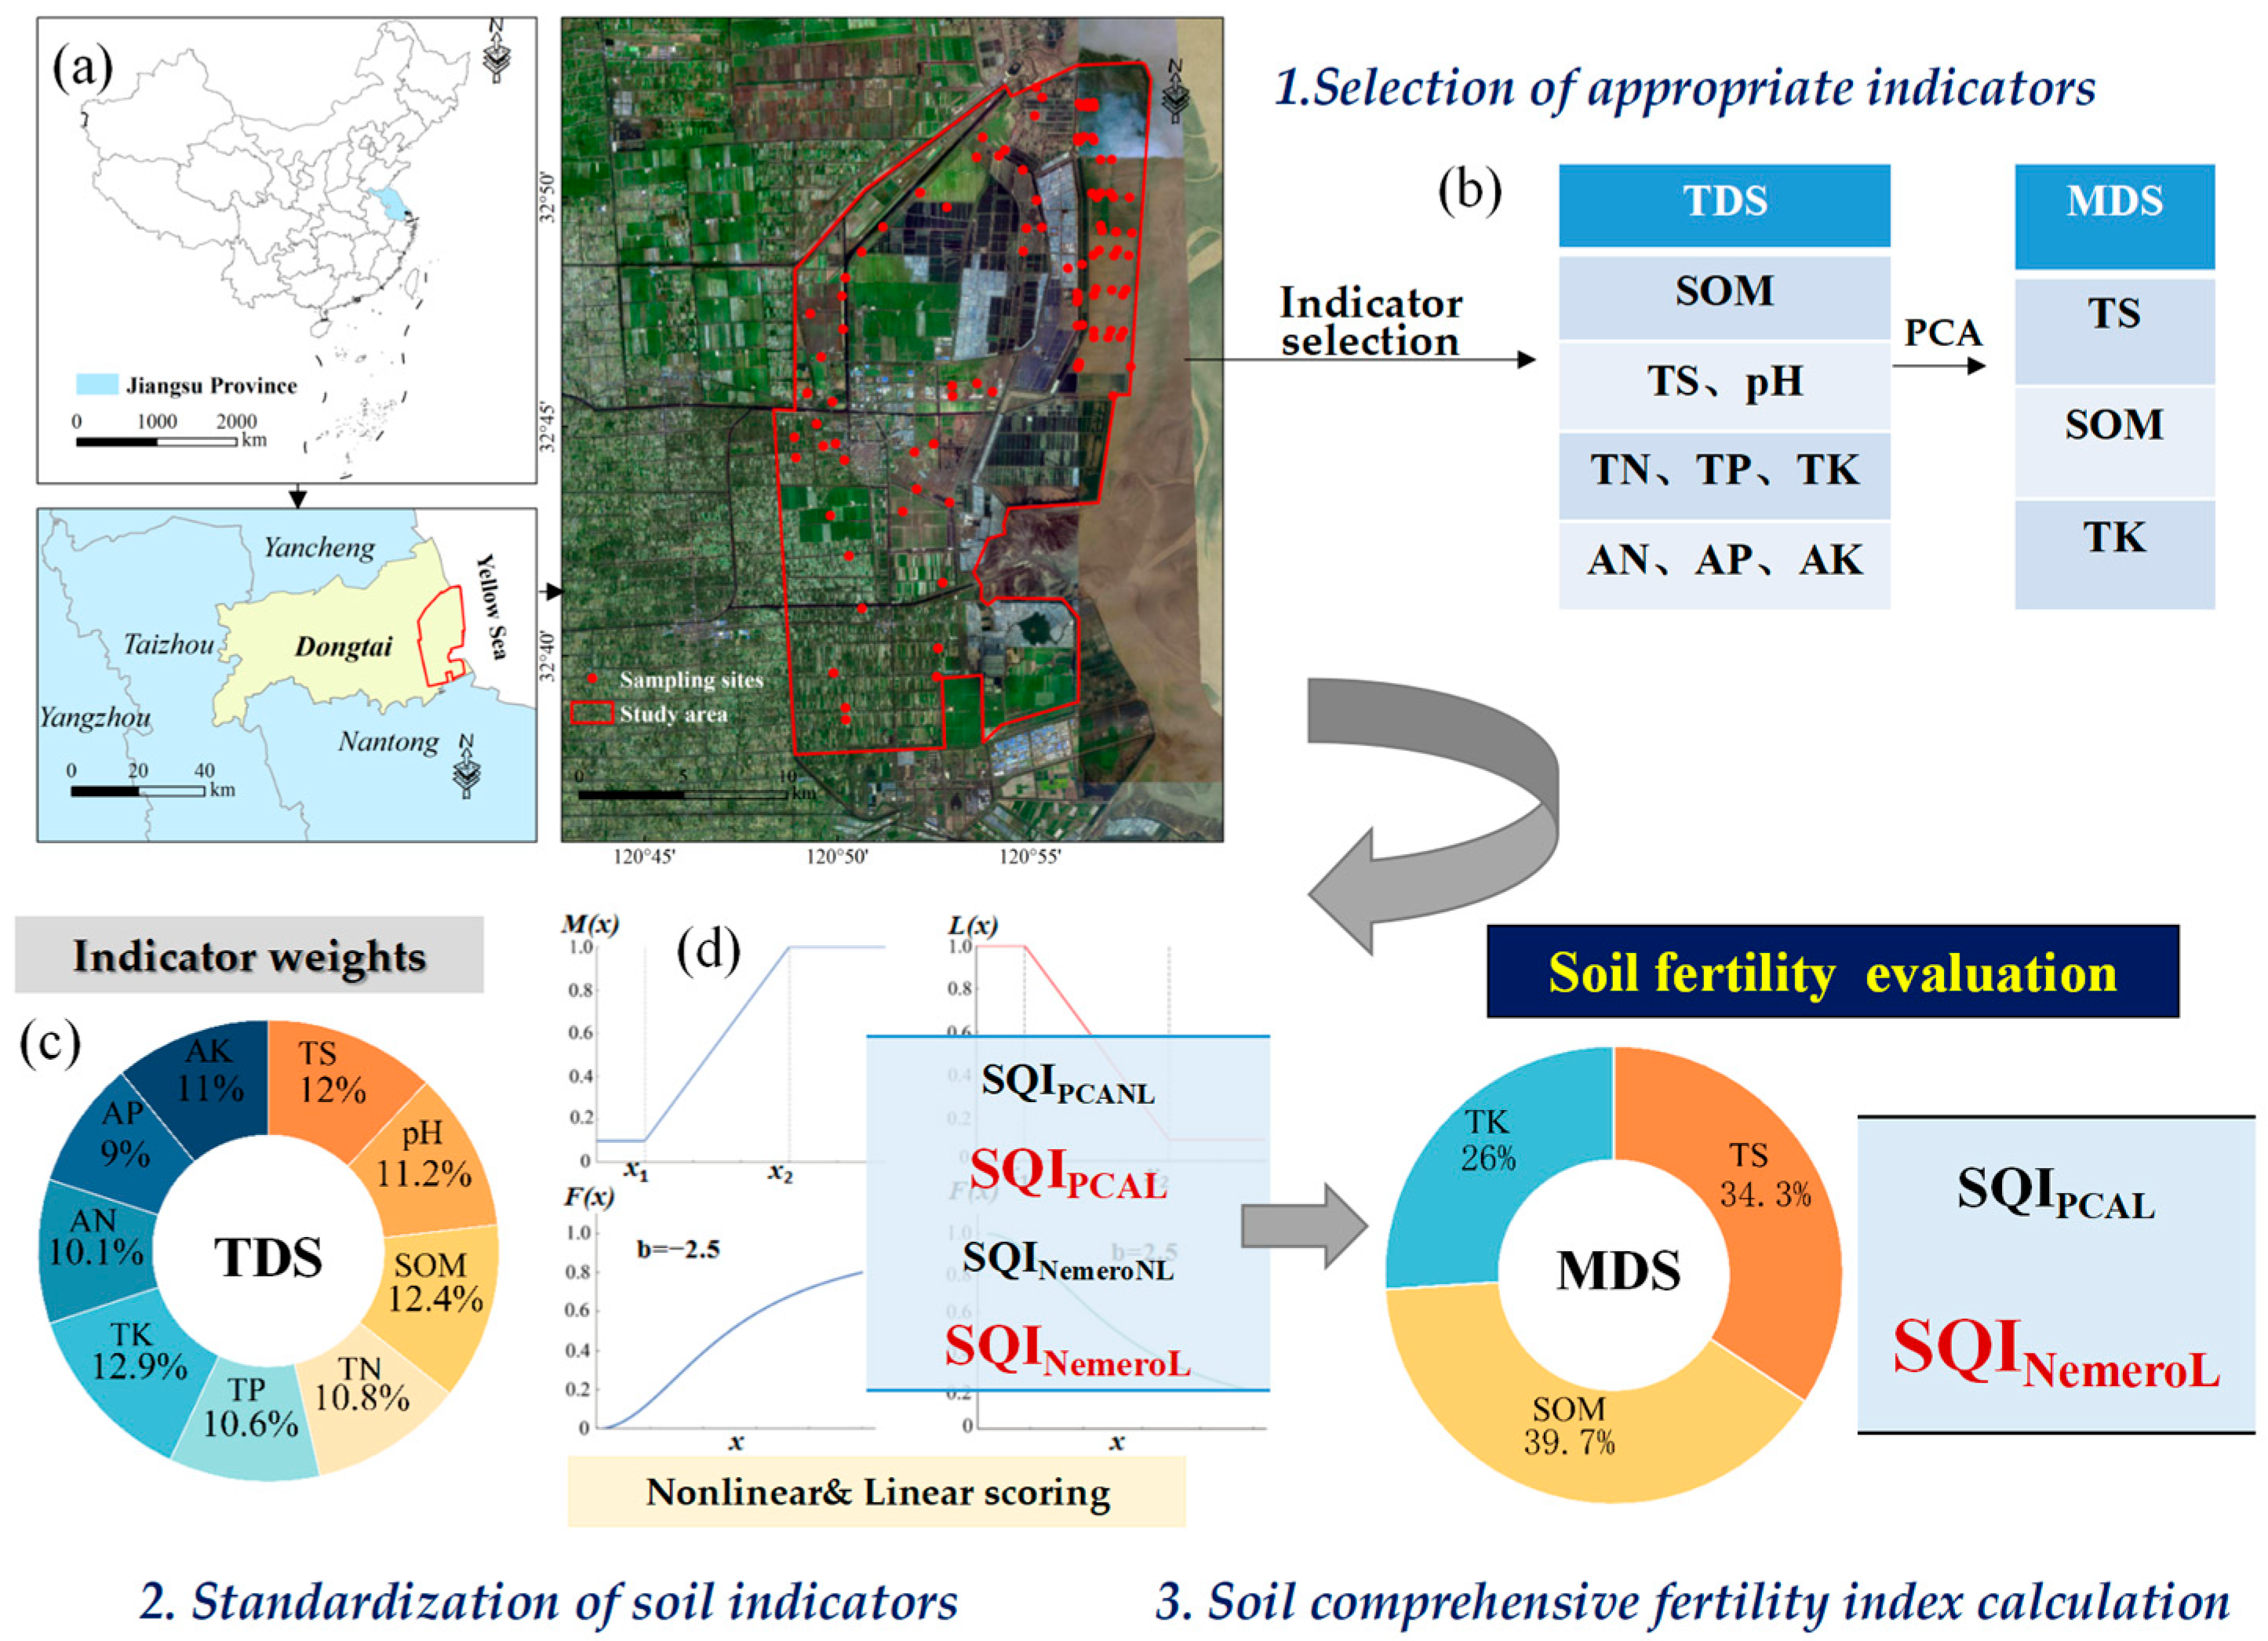
2.1. Study Area

The study area is located in Dongtai City, Yancheng, Jiangsu Province, spanning 32°34′32″–33°01′17″ N and 120°06′12″–120°58′03″ E, with an area of approximately 300 km2. Dongtai City adjoins the Yellow Sea to its east and is adjacent to the coastal economic zone. Its coastline stretches approximately 85 km and provides abundant tidal-flat wetland resources. The terrain is predominantly flat, with an average altitude ranging from 3 to 5 m, characterized mainly by plain landforms. The area experiences a northern subtropical monsoon climate with four distinct seasons, an average annual temperature of 15 °C, and an annual precipitation of approximately 1083 mm. Precipitation is concentrated, with rainfall and temperature occurring in the same season. Groundwater shallower than 100 m in this region is primarily saline. The parent materials for soil formation consist primarily of ancient Lixiahe lagoon sediments and coastal marine deposits. Soil types in the region include fluvo–aquic soil, saline–alkaline soil, sandy soil, etc. The main crops planted are grain and oil crops, such as rice, wheat, barley, and rapeseed. The total nitrogen application rate for wheat is approximately 270 kg/ha, with 60% applied as base fertilizer and 40% as a top dressing. The recommended application rates for P2O5 and K2O are between 108~162 and 135~162 kg/ha, respectively, with phosphorus and potassium (K) fertilizers applied in a ratio of 5:5 of base fertilizer to top dressing.

2.2. Soil Sample Collection and Analysis

Based on local user surveys, records from Dongtai County Annals, and considerations of reclamation years for saline–alkali cultivated land and proximity to the coastline, several townships adjacent to the coastline of Dongtai City were selected for the sampling process. The sampling regions primarily encompass three areas, including Jianggang Town, the coastal economic zone, and the Tiaozini Reclamation Area. We collected a total of 108 samples in May 2024 within the study area based on the rationality and accessibility of the sampling locations, as well as the cultivation history and crops grown (as shown in Figure 1). All cultivated crops during the sampling season were barley. For the soil sampling, an “S”-shaped sampling approach was employed within each saline–alkali cultivated plot, with a sampling depth of 0–20 cm. The collected soil samples were air-dried and sieved, with stones, visible plant residues, and other impurities removed to prepare for the determination of soil indicators.
The determination of soil indicators is briefly described as follows [24,25]: Soil pH was measured in water within a 1:5 soil-to-water paste mixture. The TS was derived by summing up the contents of eight soluble ions. Soil organic carbon (SOC) content was measured using a K2CrO7-H2SO4 oxidation procedure. Total nitrogen (TN) was determined through the Kjeldahl nitrogen determination method. Total phosphorus (TP) was measured using the acid dissolution–molybdenum–antimony anti-colorimetric method. Total potassium (TK) was determined by means of the acid dissolution–atomic absorption method. Alkaline-hydrolyzable nitrogen (AN) was determined by the alkaline hydrolysis diffusion method. Available phosphorus (AP) was measured by the sodium bicarbonate extraction–molybdenum–antimony anti-colorimetric method, and available potassium (AK) was determined through the flame photometer method.

2.3. Comprehensive Soil Fertility Assessment

2.3.1. Selection of Appropriate Indicators

To assess comprehensive soil fertility, a data set comprising nine soil indicators was established. To enhance the efficiency of the evaluation process, an MDS was developed through the integration of principal component analysis (PCA) and Pearson correlation analysis. The methodology employed is delineated as follows: First, principal components with eigenvalues ≥ 1 were extracted, and indicators with load values ≥ 0.5 within these components were grouped accordingly [26]. If an indicator exhibited load values ≥ 0.5 in multiple principal components, it was assigned to the group demonstrating the least correlation with other indicators. Following the grouping process, the normalized value for each indicator was computed individually, and indicators within 10% of the maximum normalized value for each principal component were selected. In cases where multiple indicators were present within a group, further screening was conducted using the Pearson correlation coefficient. If the inter-indicator coefficient was <0.5, all indicators were retained. If the correlation coefficient was ≥0.5, the indicator with the highest normalized value was included in the MDS [27]. A higher normalized value corresponds to a greater comprehensive load value for the principal component, ensuring the retention of more explanatory information regarding the soil. The calculation formula utilized in this process is as follows:
N j k = 1 k u j k 2 λ k
where Njk represents the Norm value of the jth indicator in the first k principal components with eigenvalues ≥ 1; ujk represents the loading of the jth indicator on the kth principal component; λk is the eigenvalue of the kth principal component; and the value of k represents the number of principal components with eigenvalues greater than or equal to 1.

2.3.2. Standardization of Soil Indicators

To account for the variability in units among different soil indicators, it is essential to convert these indicators into dimensionless values to facilitate the assessment of comprehensive soil fertility. This study employed both linear and nonlinear scoring methods to standardize each indicator within a range of 0 to 1.
For linear scoring, three distinct functions are employed based on the sensitivity of soil indicators to comprehensive soil fertility: (1) the “more is better” function M(x), which applies to indicators such as SOM, TN, TP, TK, AN, AP, and AK, all of which positively influence soil fertility; (2) the “less is better” function L(x), which pertains to the TS indicator that negatively affects soil fertility; and (3) the optimal range function, which determines the appropriate scoring function based on whether the pH level is above or below a specified threshold. In this investigation, all measured soil pH values exceeded 7, surpassing the threshold, thereby necessitating the application of the “less is better” function. The specific formula utilized is as follows:
x = 0.1                                                           x x 1 0.1 + 0.9 × x x 1 x 2 x 1                           x 1 < x < x 2 1                                                         x x 2    
L x = 1                                                                x x 1 1 0.9 × x x 1 x 2 x 1                                    x 1 < x < x 2 0.1                                                             x x 2    
where M(x) and L(x) are functions of “the more, the better” and “the less, the better”, respectively, with their values constrained between 0 and 1. In this context, x signifies the measurement value of the indicator. The points x1 and x2 represent the inflection points of the standardization function curve, with their values established based on prior research and the specific conditions of saline–alkali farmland, as shown in Table 1.
For linear scoring, the function formula is as follows:
F x = a 1 + x x 0 b
where F(x) represents the normalized value of the nonlinear function index, with a range of 0 to 1; x denotes the actual measured value of the index; a is the maximum value for index normalization, set to 1; b is the slope of the equation; for indices of the type “the more, the better”, the value is −2.5, and for indices of the type “the less, the better”, the value is 2.5; and x0 is the average value of each index [28].

2.3.3. Comprehensive Soil Fertility Index Calculation

Here, we used the SQIPCA and SQINemero to calculate the comprehensive soil fertility. All methods were performed based on the TDS of indicators at first; then, better indicator transformation methods were applied based on the MDS. The weight of each index of TDS and MDS is determined by the common factor variance proportion of each index in the PCA of the respective data set, as shown in Table 2. The formula is as follows:
S Q I P C A = i = 1 n W i · N i
where SQIPCA is a comprehensive soil fertility index based on PCA; Wi represents the weight value of the ith indicator, determined by the communality variance of the indicators in PCA, with weights being the proportion of each indicator’s communality variance to the sum of all indicators’ communality variances; Ni denotes the standardized value of the indicator; and n indicates the number of indicators involved in the soil fertility assessment.
S Q I N e m e r o = N i m i n 2 + N i m e a n 2 2 × n 1 n
Here, SQINemero is a soil quality index based on the Nemero index method; Nimin and Nimean are the minimum and average values of each index after standardization, respectively; and n is the number of indicators involved in comprehensive soil quality evaluation.

2.4. Data Processing and Analysis

Descriptive statistics, PCA, and Pearson correlation analysis were conducted using Excel 2003 and SPSS version 27.0. The optimal semi-variance function model was fitted with GS + version 9.0. Additionally, ArcGIS version 10.8 and Origin 2021 were employed to perform the necessary mapping tasks, resulting in the generation of a spatial distribution map depicting the comprehensive soil fertility quality of saline–alkali cultivated land. Comprehensive soil fertility quality classification followed the standards established by Gao et al. [29]. It is divided into five grades, which are very poor (0–0.2), poor (0.2–0.4), medium (0.4–0.6), good (0.6–0.8), and excellent (0.8–1).

3. Results

3.1. Variations in Soil Indicators

As shown in Table 3, the coefficient of variation (CV) for these soil indices in coastal beach areas is ranked as follows: TS > AK > AP > SOM > TN > TP > TK > AN > pH. Notably, both AN and pH exhibit weak variation, with CV below 10%, while the other indices, excluding TS, demonstrate moderate variation (10% < CV < 100%) [30]. Based on the soil nutrient grading criteria from the Second National Soil Survey in China [31,32,33], the average concentrations of SOM and TN of 9.56 g/kg and 0.47 g/kg were categorized as level 5 and level 6, indicating deficiency and extreme deficiency, respectively. AN averaged 71.88 mg/kg, placing it in level 4, which is considered appropriate. Furthermore, TP (0.67 g/kg), TK (18.74 g/kg), AP (26.29 mg/kg), and AK (174.08 g/kg) fell between level 2 and level 3, indicating levels ranging from suitable to abundant.

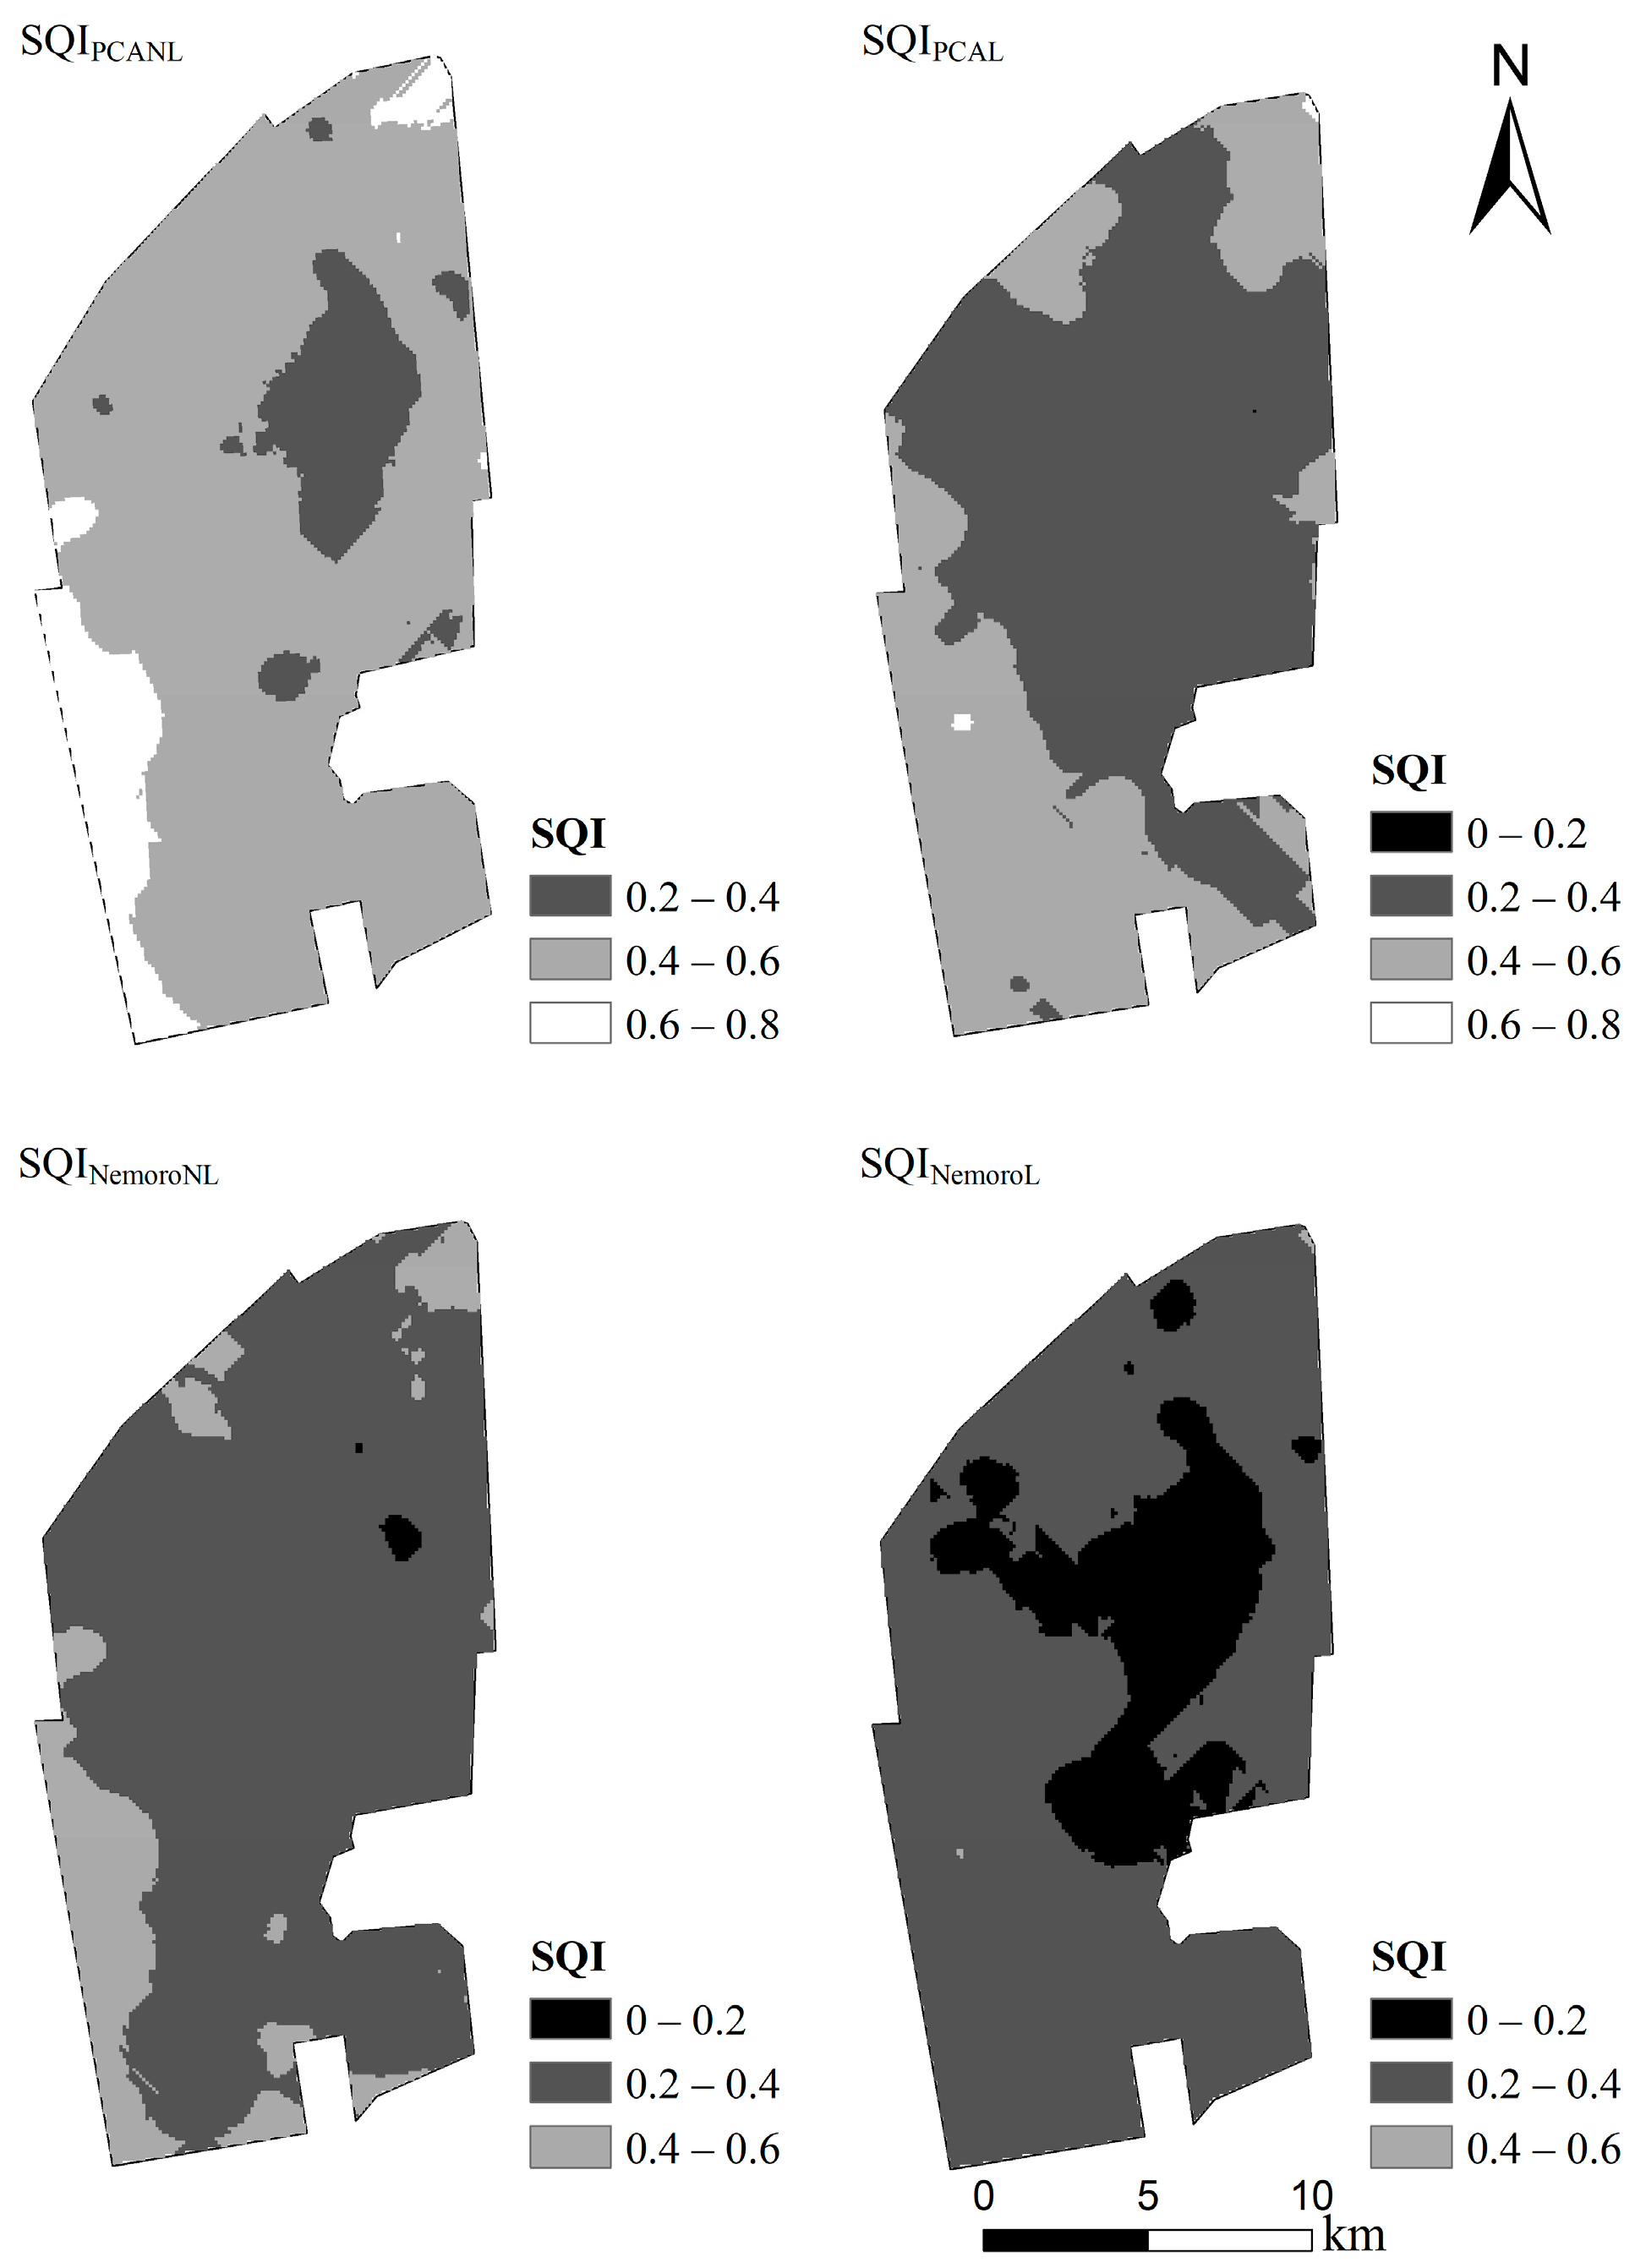
3.2. Comparison of Comprehensive Soil Fertility Evaluation Methods

Table 4 showed a strong correlation among various comprehensive soil fertility assessment methods, with pairwise correlation coefficients exceeding 0.9. Notably, the soil fertility evaluation method using a linear scoring function showed a particularly high correlation coefficient of 0.996. The coefficients of determination, R2, of the optimal semi-variance model for the four methods, namely, SQIPCANL, SQIPCAL, SQINemeroNL, and SQINemeroL, were 0.638, 0.751, 0.683, and 0.745, respectively.
All methods exhibited a consistent spatial variation trend in the soil fertility index, with an increasing pattern from east to west (Figure 2). The SQIPCANL method predominantly classifies soil fertility in the study area as third-class (0.4–0.6), which was marginally higher than the classifications from SQIPCAL, SQINemeroNL, and SQINemeroL, which fell within the fourth-class range (0.2–0.4). Regarding the variability in soil fertility, the prediction range of the SQIPCA differed from the SQINemero. Specifically, the highest classification for SQIPCA is second-class (0.6–0.8), while SQINemero reached a maximum of third-class (0.4–0.6).

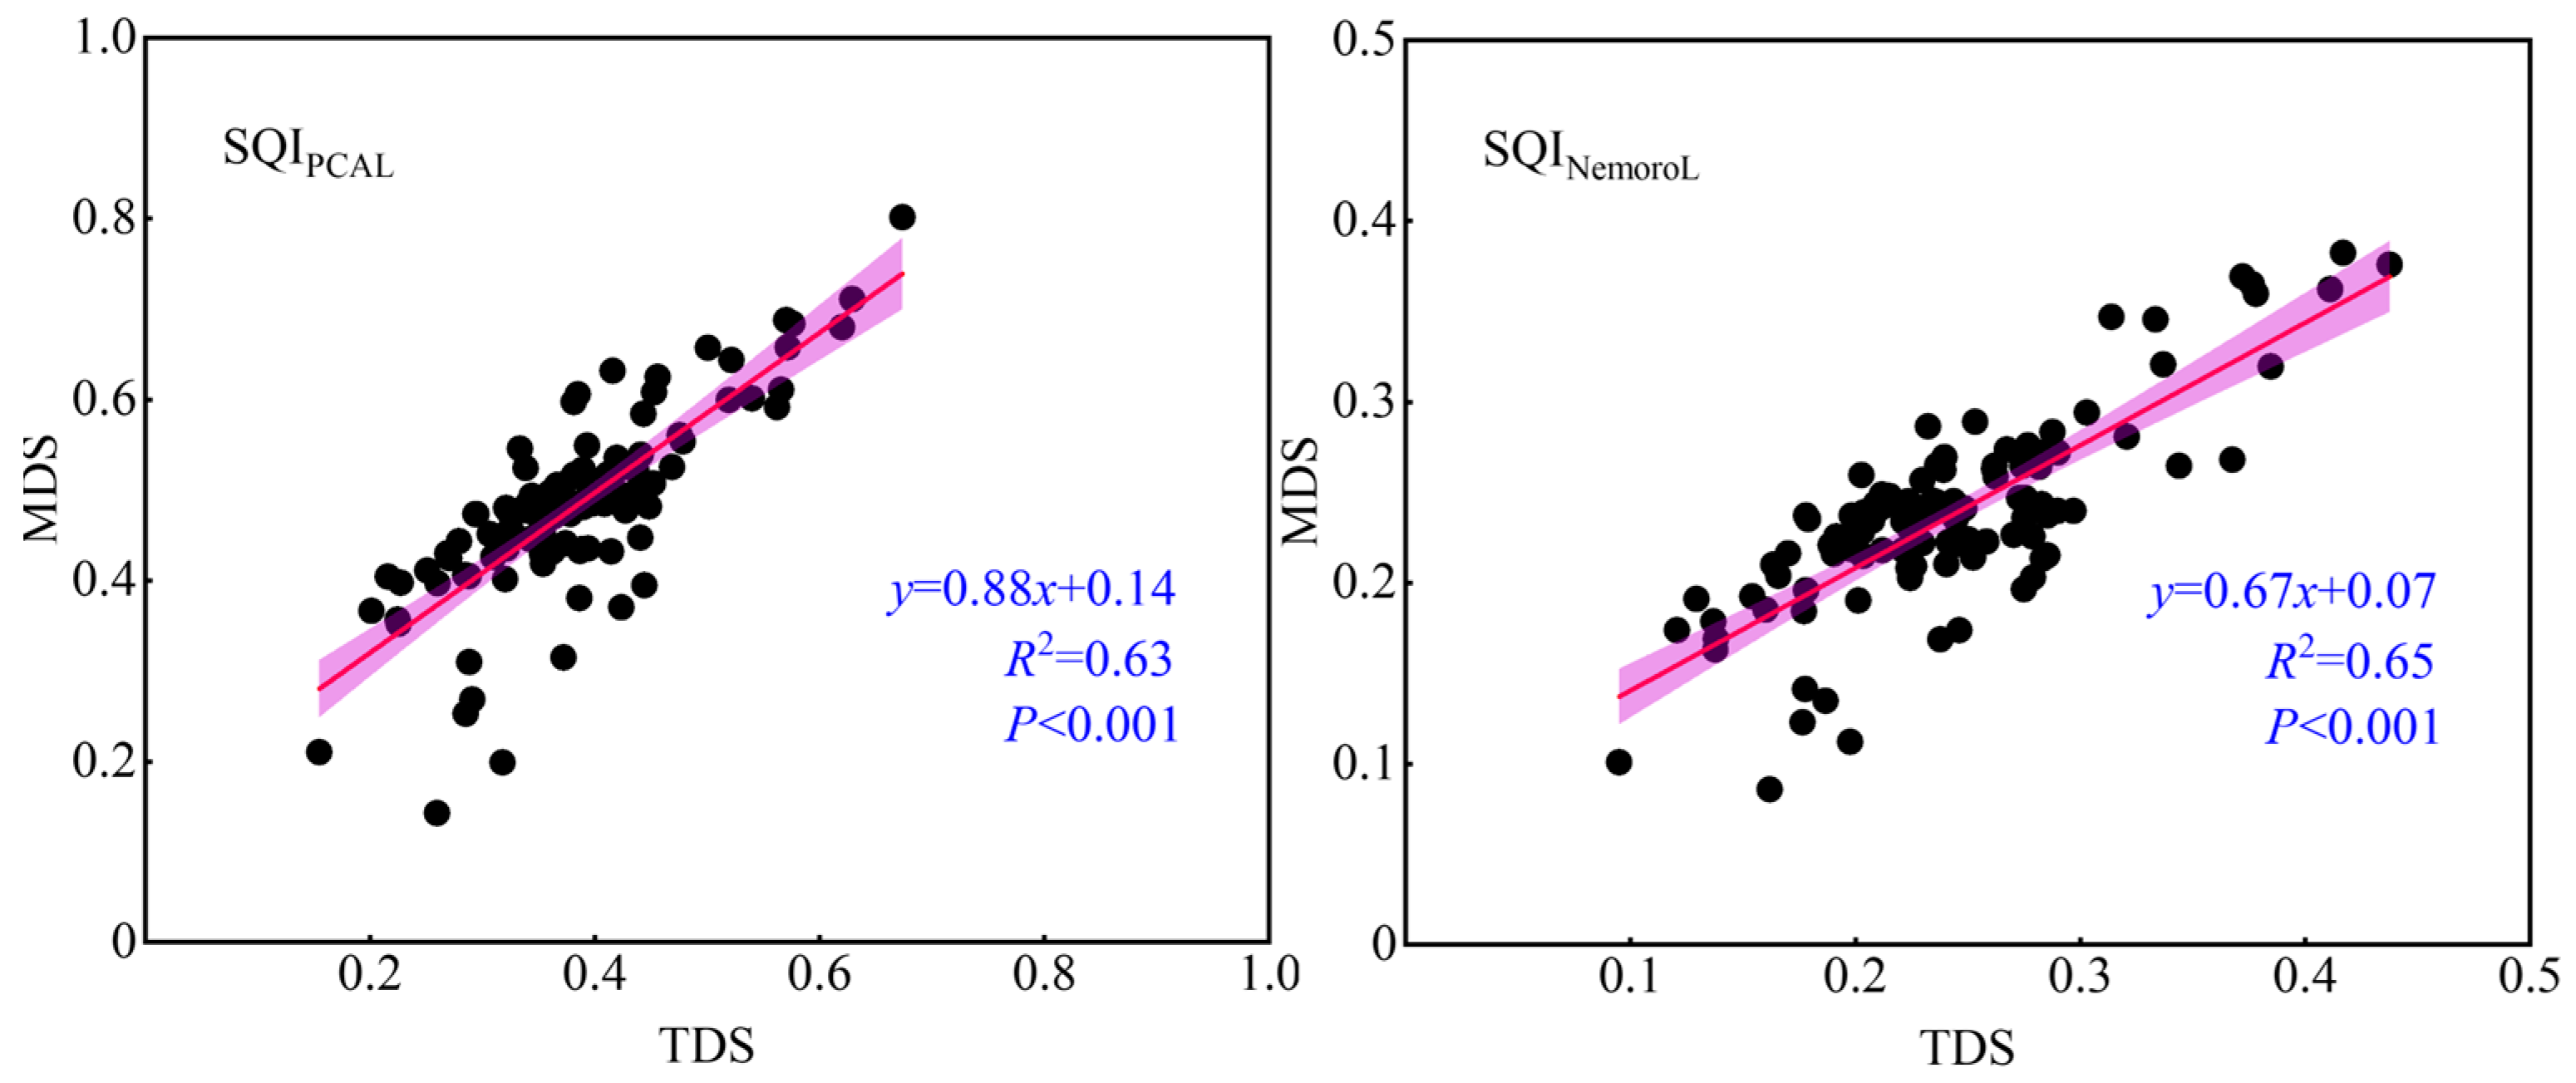
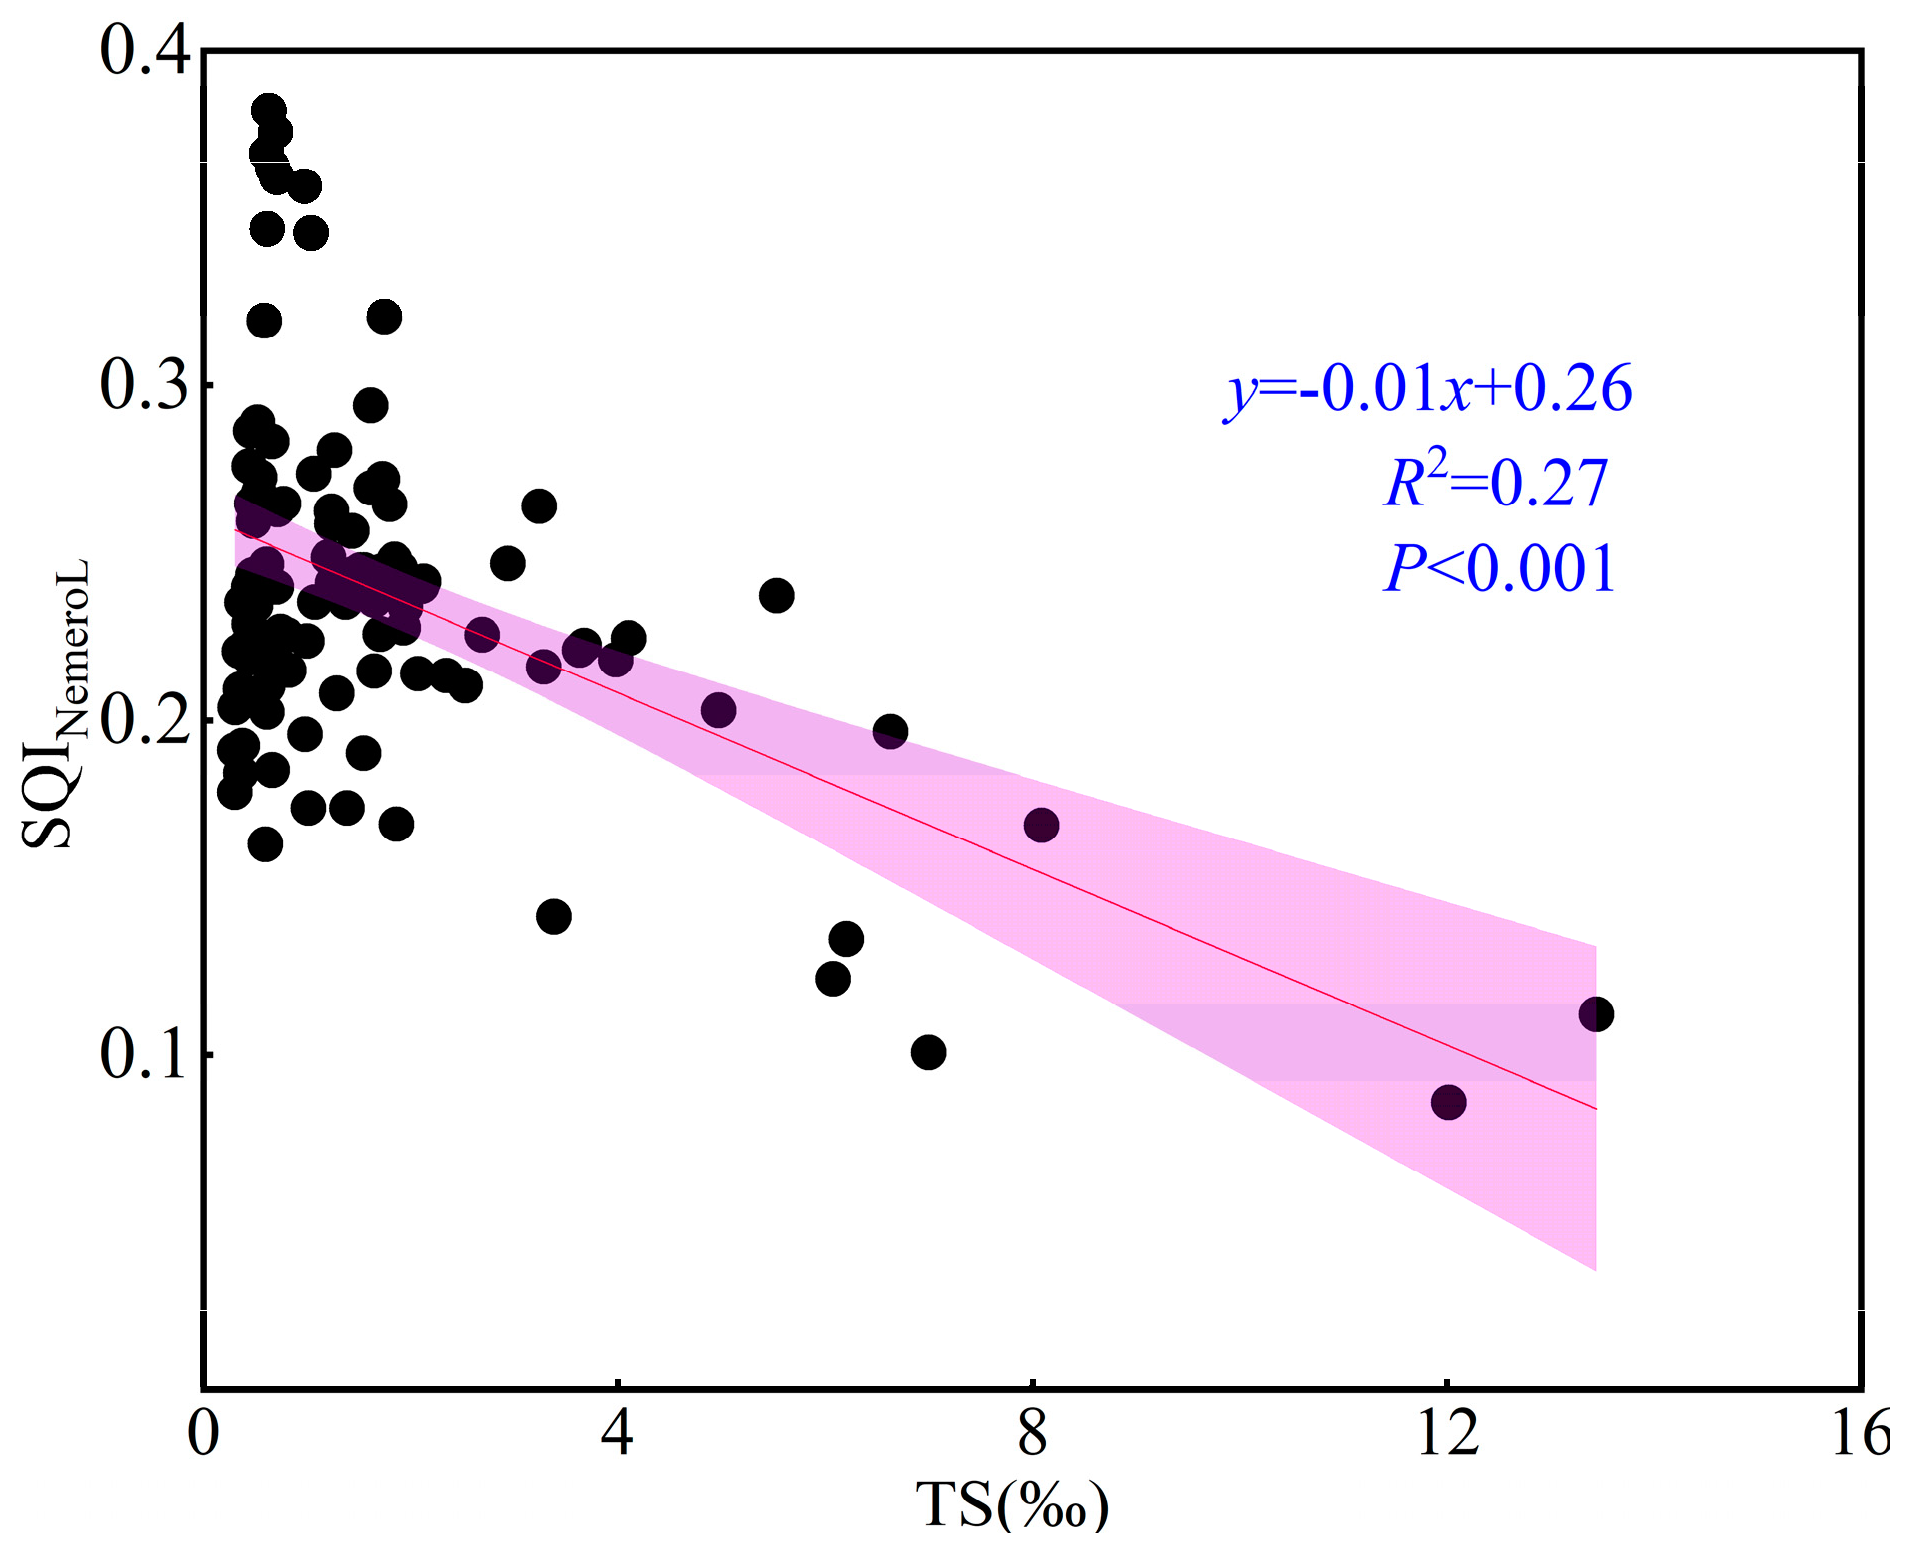
3.3. Applicability of Methods Based on Minimum Data Set

The determination coefficient R2 for SQIPCAL and SQINemeroL surpassed that of the nonlinear methods, SQIPCANL and SQINemeroNL. Furthermore, the correlation coefficient between SQIPCAL and SQINemeroL was the highest among the comparisons, suggesting that these two methods provided precise evaluations and were practically applicable [34]. As a result, our study assessed the applicability of the SQIPCAL and SQINemeroL methodologies using an MDS.
Using the MDS, the spatial distribution of soil fertility derived from both methods (SQIPCAL and SQINemeroL) showed a similar pattern, with soil fertility gradually increasing from east to west (Figure 3). However, SQIPCAL assigned a higher fertility grade than SQINemeroL in the same regions. A comparison of the soil fertility assessments for the TDS and MDS (refer to Figure 2 and Figure 3) revealed that the soil fertility evaluated using the SQINemeroL MDS aligned closely with that derived from the TDS, whereas the soil fertility assessed by the SQIPCAL MDS was slightly higher than that obtained from TDS. Additionally, a strong correlation existed between the TDS and the MDS for both SQIPCAL and SQINemeroL methods (see Figure 4). Specifically, the correlation coefficient for the data evaluated by SQIPCAL was 0.63, whereas for SQINemeroL, it was 0.65. These results indicate that the SQINemeroL method, when applied to the MDS, demonstrates greater accuracy and suitability for soil fertility research in this region.

4. Discussion

Saline–alkali soils present significant challenges to agricultural productivity, particularly in coastal saline–alkali areas, where seawater intrusion exacerbates nutrient depletion in the upper soil layers. Understanding the spatial distribution of comprehensive soil fertility in these regions is crucial for developing effective management strategies and ensuring food security. This study evaluated the applicability of four different methods for assessing comprehensive soil fertility and found that, while overall spatial patterns of soil fertility were consistent across the methods, discrepancies in finer details were observed. The use of an MDS derived from the TDS can reduce economic costs and improve efficiency while maintaining accuracy and applicability for soil fertility research in this region. Notably, if the MDS lacked indicators representing the physical, chemical, and biological properties of the soil in the study area, the SQI’s sensitivity to changes in soil quality may be reduced, leading to inaccurate results [35].
Both linear and nonlinear scoring functions were employed to standardize the soil indices into dimensionless values ranging from 0 to 1. These values were integrated with SQIPCA and the SQINemero to derive a comprehensive soil fertility index. Distribution maps for SQIPCANL, SQIPCAL, SQINemeroNL, and SQINemeroL were generated, classifying comprehensive soil quality into four levels: very poor, poor, moderate, and good. The soil quality in the study area was predominantly moderate to poor. Depending on the evaluation method, 78.19–99.84% of the area fell into this range, with good and poor classifications ranging from 0% to 9.87% and 0 to 21.81%, respectively. While most methods indicated third-grade soil fertility (0.4–0.6), the linear scoring approach demonstrated superior accuracy and correlation, as shown in Table 4, making it more suitable for this context. Raiesi et al. [14] also found that in Western Iran, the linear scoring method outperforms the nonlinear scoring method in converting and standardizing the minimum data set indicators; however, these findings differ from those of Li et al. [36], who conducted their research in the loess plateau mining region, where complex terrain and significant spatial variability favored nonlinear scoring methods. In contrast, the predominance of salt barriers in the coastal saline–alkali areas made linear scoring more effective. The contradictory results between the two scoring methods may stem from the high complexity and site-specific nature of the soil system.
In TDS, the comprehensive soil fertility indexes, including SOM, TN, TP, TK, AN, AP, and AK, are essential for optimal plant growth. Additionally, TS and pH were recognized as limiting factors in this region. However, incorporating a larger number of indicators into the model was associated with increased costs. Utilizing an MDS derived from the comprehensive data set can lead to reduced economic expenditures and improved operational efficiency. PCA is a commonly employed method for dimensionality reduction. In this study, PCA revealed that the eigenvalues of the three principal components exceeded 1; specifically, they were 3.1113, 2.631, and 1.115. Furthermore, the cumulative variance contribution of these components surpassed 76%, indicating that they encapsulate the majority of the information related to comprehensive soil fertility. The absolute values of the factor loadings in each principal component were found to be equal to or greater than 0.5, allowing for the classification of these components into distinct groups.
The first group (PCA1) included pH, TK, AN, AP, and AK; the second group (PCA2) comprised SOM, TN, and TP; and the third group (PCA3) consisted of TS and pH. The CV of soil pH was 3.69%, which fell outside the selection criteria [37]. In the first group, the Norm values of TK, AN, AP, and AK were 1.65, 1.43, 1.35, and 1.50, respectively. Since soil AN exhibited a negative association with other parameters in this group, it was deemed unsuitable for inclusion in the MDS. Factors with higher Norm values were prioritized for the MDS [38]; thus, soil TK was selected as the representative factor for PCA1 (Table 2). The average soil TK, AP, and AK in the coastal saline–alkali regions of Jiangsu were classified as level 3, level 2, and level 2, respectively (Table 3). This indicated that PCA1 primarily represented nutrient-rich portions of coastal saline–alkali land. The abundance of K in these areas can be attributed to two key factors. First, K+ is one of the eight soluble salt ions commonly found in soil and is particularly abundant in saline–alkali regions, especially in chloride-type saline–alkali soils. Second, Nitrospirillum, a bacterium closely associated with K cycling, dominates the microbial community under high-saline conditions, thereby enhancing the release of AP [39]. Research by Mehreen Gul et al. [40] further supported this, showing that increasing NaCl concentrations alter soil K dynamics, promoting the release of non-exchangeable K from soil minerals, thereby increasing AK concentration in soil solutions. The accumulation of soil TP and AP in this region is at suitable levels, which contrasts with findings from Nisha et al. [41] who reported that saline soils are often poor in P. This discrepancy may be due to differences in the study areas. In semi-arid and arid regions, P tends to bind with calcium (Ca2⁺) and magnesium (Mg2⁺) ions in saline–alkali soils, forming less soluble compounds. These compounds are less susceptible to leaching, thereby maintaining adequate TP levels in the soil [42].
In the second group, SOM showed a strong positive correlation with soil TN (p < 0.01); thus, only SOM, which had a higher normalized value, was included in the minimum data set. Our study found that the average levels of SOM, TN, and TP in the coastal saline–alkali regions of Jiangsu were classified as level 5, level 6, and level 3, respectively. This suggested that this group primarily represented nutrient-limited portions of coastal saline–alkali land. Notably, soil N concentrations were significantly lower than those of P and K, indicating that the overall fertility of the soil was largely constrained by the SOM and soil N pools. Under saline–alkali conditions, the accumulation of SOM was restrained due to the adverse effects on microbial residues and secreted organic matter, leading to reduced SOM levels [43]. Previous research reported an average SOM level of 19.80 g/kg across China’s agricultural lands [40]; however, our findings showed an average SOM of only 9.56 g/kg in the studied region (Table 3). Similarly, while the mean TN across China was reported to be 1.05 g/kg [11], our study found a mean TN of 0.47 g/kg (Table 3). This underscores the significance of SOM as the main factor in our comprehensive soil fertility index calculation model (Table 2). The observed reduction in SOM can be attributed to soil salinity, which disrupts soil aggregation and increases the mineralization of active organic carbon. Consequently, total soil salinity, identified as a barrier factor, was also included in the third group of the analysis.
In this study, the MDS was utilized to generate a comprehensive soil fertility distribution map based on the SQIPCAL and SQINemeroL models (Figure 3). Correlation analysis revealed that the R2 for SQIPCAL and SQINemeroL were 0.63 and 0.65, respectively. This discrepancy can be attributed to the differences in model focus: while PCA primarily considers weight ratios, the SQINemeroL model places greater emphasis on limiting factors. SOM emerged as a critical parameter for assessing overall soil fertility, with its importance being more pronounced in the SQINemeroL model compared to the SQIPCAL model. As illustrated in Figure 3, most of the coastal saline–alkali cultivated land was classified within the fourth fertility grade (0.2–0.4), followed by the fifth grade (0–0.2). A general spatial trend indicated that soil fertility increased from east to west. In addition, we have added a linear regression graph of soil salinity and SQINemeroL (Figure 5), which shows that as the salt content increases, the overall soil fertility tends to decline. This observation aligned with the established understanding that soil fertility tended to improve as the distance from the shoreline increased in coastal saline–alkali regions, and Xie et al. also found that the average contents of SOM, TN, and TP increased with distance from the coastline [44]. Consequently, the SQINemeroL model, derived from the MDS, was considered applicable in this context. However, Guo et al. [34] evaluated the comprehensive soil fertility of two typical agricultural counties in the middle and lower reaches of the Yellow River using the same four evaluation methods and concluded that the SQIPCAL method, based on the MDS, is suitable for large-scale soil quality assessment. This discrepancy may arise from variations in soil types and land use, which can lead to inconsistencies in evaluation results. Overall, the SQINemeroL model demonstrated superior accuracy compared to its counterpart, making it a promising tool for future extensive studies in this region. Government decision-making departments can encourage farmers and landowners to adopt sustainable soil management practices by offering tax incentives, subsidies, or rewards based on soil indicators and the spatial distribution of comprehensive soil fertility. This approach will help improve the overall soil fertility of saline–alkali lands and promote environmentally friendly agriculture.
While our study provided valuable insights into the spatial variations in comprehensive soil fertility through various evaluation methods in coastal saline–alkali cultivated lands and established the suitability of the SQINemeroL model with the MDS for fertility assessment, several areas for future research remain. SOM and soil N pools are the main limiting factors in this region. Therefore, comprehensive investigations into nutrient cycling in these unique environments are urgently needed, particularly given the low N utilization rate of fertilizer in saline–alkali soils, which ranges from 14% to 29% as reported by Li et al. [45]. Meanwhile, we can enhance soil fertility by improving farming techniques, crop rotation patterns, and fertilization systems. For example, Song et al. conducted a comprehensive analysis of 86 published studies on saline–alkali land improvement in North China and found that straw returning increased crop yield by 18% and organic matter content by 19% [46]. In addition, future research should focus on developing innovative remote sensing and geostatistical methods to better understand soil fertility changes across larger spatial scales and longer timeframes. These advancements will be instrumental in clarifying soil fertility dynamics and enhancing nutrient pool restoration in coastal saline–alkaline regions.

5. Conclusions

This study investigates the soil nutrients and various soil quality evaluation methods for Jiangsu’s coastal saline–alkali land. It was found that the content of SOM is relatively deficient, which is one of the main limiting factors for soil fertility in coastal saline-alkali land. In the method of calculating the comprehensive soil fertility based on TDS, it was found that the method using a linear function provides better accuracy and applicability compared to the nonlinear function. The comprehensive soil quality calculated using the TDS and MDS methods shows a high correlation. Using MDS can save costs and improve work efficiency. Furthermore, the SQINemeroL based on MDS has high accuracy and can be used for soil quality evaluation in this study area.

Author Contributions

Conceptualization, L.X., Z.W., and S.W.; methodology, L.X., Z.W., S.W., and J.S.; software, Z.W.; validation, L.X., Z.W., W.Q., and Y.C.; formal analysis, L.X., Z.W., Q.G., and W.Q.; investigation, Z.W., Y.C., and J.S.; resources, L.X.; data curation, Z.W.; writing—original draft preparation, Z.W.; writing—review and editing, L.X., S.W., Q.G., and W.Q.; visualization, Z.W. and Y.C.; supervision, L.X. and Y.C.; project administration, L.X.; funding acquisition, L.X. All authors have read and agreed to the published version of the manuscript.

Funding

This research was funded by the National Natural Science Foundation of Jiangsu Province, grant number BK20242107.

Data Availability Statement

The original contributions presented in the study are included in the manuscript; further inquiries can be directed to the corresponding author.

Acknowledgments

We would like to extend special thanks to the major scientific and technological projects of the Chinese academy of sciences, Worksoon ES.T Co., Ltd., Jiangsu Science-test Technology Co., Ltd. (www.science-test.com, accessed on 1 November 2024), and Shiyanjia Lab (www.shiyanjia.com, accessed on 13 November 2024) for providing invaluable assistance with the physical–chemical property analyses [2408170526].

Conflicts of Interest

The authors declare no conflicts of interest.

References

  1. Chen, L.; Zhou, G.; Feng, B.; Wang, C.; Luo, Y.; Li, F.; Shen, C.; Ma, D.; Zhang, C.; Zhang, J. Saline-alkali land reclamation boosts topsoil carbon storage by preferentially accumulating plant-derived carbon. Sci. Bull. 2024, 69, 2948–2958. [Google Scholar] [CrossRef]
  2. Liu, X.; Guo, K.; Feng, X.; Sun, H. Discussion on the agricultural efficient utilization of saline-alkali land resources. Chin. J. Eco-Agric. 2023, 31, 345–353. [Google Scholar]
  3. Wang, G.; Ni, G.; Feng, G.; Burrill Haley, M.; Li, J.; Zhang, J.; Zhang, F. Saline-alkali soil reclamation and utilization in China:progress and prospects. Front. Agric. Sci. Eng. 2024, 11, 216–228. [Google Scholar]
  4. Yang, J.; Yao, R. Management and Efficient Agricultural Utilization of Salt-affected Soil in China. Bull. Chin. Acad. Sci. 2015, 30, 162–170. [Google Scholar]
  5. Han, D.; Currell, M.J. Review of drivers and threats to coastal groundwater quality in China. Sci. Total Environ. 2022, 806, 150913. [Google Scholar] [CrossRef] [PubMed]
  6. Eswar, D.; Karuppusamy, R.; Chellamuthu, S. Drivers of soil salinity and their correlation with climate change. Curr. Opin. Environ. Sustain. 2021, 50, 310–318. [Google Scholar] [CrossRef]
  7. Zhao, Y.; Wang, L.; Zhao, H. Research Status and Prospects of Saline-alkali Land Amelioration in the Coastal Region of China. Chin. Agric. Sci. Bull. 2022, 38, 67–74. [Google Scholar]
  8. Wolf, M.K.; Wiesmeier, M.; Macholdt, J. Importance of soil fertility for climate-resilient cropping systems: The farmer’s perspective. Soil Secur. 2023, 13, 100119. [Google Scholar] [CrossRef]
  9. Reddy, N.; Crohn, D.M. Effects of soil salinity and carbon availability from organic amendments on nitrous oxide emissions. Geoderma 2014, 235–236, 363–371. [Google Scholar] [CrossRef]
  10. Xie, W.; Yang, J.; Gao, S.; Yao, R.; Wang, X. The Effect and Influence Mechanism of Soil Salinity on Phosphorus Availability in Coastal Salt-Affected Soils. Water 2022, 14, 2804. [Google Scholar] [CrossRef]
  11. Deng, X.; Xu, X.; Wang, S. The tempo-spatial changes of soil fertility in farmland of China from the 1980s to the 2010s. Ecol. Indic. 2023, 146, 109913. [Google Scholar] [CrossRef]
  12. Lin, S.; Wei, K.; Wang, Q.; Deng, M.; Su, L.; Shao, F.; Jiang, Z. Spatiotemporal variability of soil physical properties and water, salt, nitrogen, and phosphorus contents for farm level. Can. J. Soil Sci. 2023, 103, 406–427. [Google Scholar] [CrossRef]
  13. Yu, P.; Liu, S.; Zhang, L.; Li, Q.; Zhou, D. Selecting the minimum data set and quantitative soil quality indexing of alkaline soils under different land uses in northeastern China. Sci. Total Environ. 2018, 616–617, 564–571. [Google Scholar] [CrossRef] [PubMed]
  14. Raiesi, F. A minimum data set and soil quality index to quantify the effect of land use conversion on soil quality and degradation in native rangelands of upland arid and semiarid regions. Ecol. Indic. 2017, 75, 307–320. [Google Scholar] [CrossRef]
  15. Swanepoel, P.A.; du Preez, C.C.; Botha, P.R.; Snyman, H.A.; Habig, J. Soil quality characteristics of kikuyu–ryegrass pastures in South Africa. Geoderma 2014, 232–234, 589–599. [Google Scholar] [CrossRef]
  16. Askari, M.S.; Holden, N.M. Quantitative soil quality indexing of temperate arable management systems. Soil Tillage Res. 2015, 150, 57–67. [Google Scholar] [CrossRef]
  17. Liebig, M.A.; Varvel, G.; Doran, J. A Simple Performance-Based Index for Assessing Multiple Agroecosystem Functions. Agron. J. 2001, 93, 313–318. [Google Scholar] [CrossRef]
  18. Sanad, H.; Moussadek, R.; Mouhir, L.; Oueld Lhaj, M.; Dakak, H.; El Azhari, H.; Yachou, H.; Ghanimi, A.; Zouahri, A. Assessment of Soil Spatial Variability in Agricultural Ecosystems Using Multivariate Analysis, Soil Quality Index (SQI), and Geostatistical Approach: A Case Study of the Mnasra Region, Gharb Plain, Morocco. Agronomy 2024, 14, 1112. [Google Scholar] [CrossRef]
  19. Xian, X.; Pang, M.; Zhang, J.; Zhu, M.; Kong, F.; Xi, M. Assessing the effect of potential water and salt intrusion on coastal wetland soil quality: Simulation study. J. Soils Sediments 2019, 19, 2251–2264. [Google Scholar] [CrossRef]
  20. Yang, H.R.; Wang, F.E.; Yu, J.; Huang, K.; Zhang, H.C.; Fu, Z.H. An improved weighted index for the assessment of heavy metal pollution in soils in Zhejiang, China. Environ. Res. 2021, 192, 110246. [Google Scholar] [CrossRef] [PubMed]
  21. Abdel-Fattah, M.K.; Mohamed, E.S.; Wagdi, E.M.; Shahin, S.A.; Aldosari, A.A.; Lasaponara, R.; Alnaimy, M.A. Quantitative Evaluation of Soil Quality Using Principal Component Analysis: The Case Study of El-Fayoum Depression Egypt. Sustainability 2021, 13, 1824. [Google Scholar] [CrossRef]
  22. Bo, Y.; Zhu, Q.; Bao, Y.; Zhao, W.; Zhao, Y.; Zhang, H. A comparative study on three methods of soil quality evaluation of microtopography in the semi-arid Loess Plateau, China. J. Environ. Biol. 2015, 36, 325–330. [Google Scholar] [PubMed]
  23. Liu, L.P.; Long, X.H.; Shao, H.B.; Liu, Z.P.; Tao, Y.; Zhou, Q.S.; Zong, J.Q. Ameliorants improve saline-alkaline soils on a large scale in northern Jiangsu Province, China. Ecol. Eng. 2015, 81, 328–334. [Google Scholar] [CrossRef]
  24. Riley, H.; Pommeresche, R.; Eltun, R.; Hansen, S.; Korsaeth, A. Soil structure, organic matter and earthworm activity in a comparison of cropping systems with contrasting tillage, rotations, fertilizer levels and manure use. Agric. Ecosyst. Environ. 2008, 124, 275–284. [Google Scholar] [CrossRef]
  25. Lu, R. Soil Agrochemical Analysis Methods; China Agricultural Science and Technology Press: Beijing, China, 2000. [Google Scholar]
  26. Li, Y.; Zhao, H.; Liu, J.; Chaonan, C.; Yuxuan, G. A framework for selecting and assessing soil quality indicators for sustainable soil management in waste dumps. Sci. Rep. 2024, 14, 8491. [Google Scholar] [CrossRef]
  27. He, J.; Zhao, J.; Liu, H.; Liu, B.; Kong, F. Evaluation of black soil quality in Sanjiang Plain based on minimum data set: Taking the plain area of Baoqing County in Heilongjiang Province as an example. Geol. Bull. China 2024, 43, 1841–1854. [Google Scholar]
  28. Zhang, C.; Xue, S.; Liu, G.-B.; Song, Z.-L. A comparison of soil qualities of different revegetation types in the Loess Plateau, China. Plant Soil 2011, 347, 163–178. [Google Scholar] [CrossRef]
  29. Gao, M.; Huang, A.; Li, D.; Zhang, Z.; Wang, L.; Zhao, M. Soil Quality Evaluation in a Typical County of Jianghuai Hilly Region Based on GIS. Chin. J. Soil Sci. 2021, 52, 16–24. [Google Scholar]
  30. LEI, Q.; JIANG, H.; WU, S.; FENG, H. Spatial Distribution of Organic Matter and Its Influencing Factors in Northwest China. J. Soil Water Conserv. 2022, 36, 274–279,292. [Google Scholar] [CrossRef]
  31. National Student Survey. The Second National Soil Survey Tentative Specifications; China Agriculture Press: Beijing, China, 1979. [Google Scholar]
  32. Li, Q.; Yue, T.; Fan, Z.; Du, Z.; Chen, C.; Lu, Y. Spatial simulation of topsoil TN at the national scale in China. Geogr. Res. 2010, 29, 1981–1992. [Google Scholar]
  33. Yang, F.; Xu, Y.; Cui, Y.; Meng, Y.; Dong, Y.; Li, R.; Ma, Y. Variation of Soil Organic Matter Content in Croplands of China over the Last Three Decades. Acta Pedol. Sin. 2017, 54, 1047–1056. [Google Scholar]
  34. Guo, L.; Sun, Z.; Ouyang, Z.; Han, D.; Li, F. A comparison of soil quality evaluation methods for Fluvisol along the lower Yellow River. CATENA 2017, 152, 135–143. [Google Scholar] [CrossRef]
  35. Yu, P.; Han, D.; Liu, S.; Wen, X.; Huang, Y.; Jia, H. Soil quality assessment under different land uses in an alpine grassland. Catena 2018, 171, 280–287. [Google Scholar] [CrossRef]
  36. Li, P.; Zhang, X.; Hao, M.; Zhang, Y.; Cui, Y.; Zhu, S. Soil quality evaluation for reclamation of mining area on Loess Plateau based on minimum data set. Trans. Chin. Soc. Agric. Eng. 2019, 35, 265–273. [Google Scholar]
  37. Chen, X.; Zhang, X.; Wei, Y.; Zhang, S.; Cai, C.; Guo, Z.; Wang, J. Assessment of soil quality in a heavily fragmented micro-landscape induced by gully erosion. Geoderma 2023, 431, 116369. [Google Scholar] [CrossRef]
  38. Liu, X.; Wang, Y.; Lu, M.; Sun, Y.; Yang, W.; Zhao, J. Soil quality assessment of alpine grassland in permafrost regions of Tibetan Plateau based on principal component analysis. J. Glaciol. Geocryol. 2018, 40, 469–479. [Google Scholar]
  39. Canfora, L.; Bacci, G.; Pinzari, F.; Lo Papa, G.; Dazzi, C.; Benedetti, A. Salinity and bacterial diversity: To what extent does the concentration of salt affect the bacterial community in a saline soil? PLoS ONE 2014, 9, e106662. [Google Scholar] [CrossRef]
  40. Gul, M.; Wakeel, A.; Saqib, M.; Wahid, A. Effect of NaCl-induced saline sodicity on the interpretation of soil potassium dynamics. Arch. Agron. Soil Sci. 2016, 62, 523–532. [Google Scholar] [CrossRef]
  41. Nisha, R.; Kiran, B.; Kaushik, A.; Kaushik, C.P. Bioremediation of salt affected soils using cyanobacteria in terms of physical structure, nutrient status and microbial activity. Int. J. Environ. Sci. Technol. 2018, 15, 571–580. [Google Scholar] [CrossRef]
  42. Jiang, H.; Qi, P.; Wang, T.; Wang, M.; Chen, M.; Chen, N.; Pan, L.; Chi, X. Isolation and characterization of halotolerant phosphate-solubilizing microorganisms from saline soils. 3 Biotech 2018, 8, 461. [Google Scholar] [CrossRef]
  43. Dong, X.; Wang, J.; Tian, L.; Lou, B.; Zhang, X.; Liu, T.; Liu, X.; Sun, H. Review of relationships between soil aggregates, microorganisms and soil organic matter in salt-affected soil. Chin. J. Eco-Agric. 2023, 31, 364–372. [Google Scholar] [CrossRef]
  44. Xie, X.; Pu, L.; Wang, Q.; Zhu, M.; Wang, X. Response of Soil Enzyme Activities and Their Relationships with Physicochemical Properties to Different Aged Coastal Reclamation Areas, Eastern China. Environmental Science 2018, 39, 1404–1412. [Google Scholar] [CrossRef]
  45. Li, H.; Zhu, W.; Gao, Q.; Liu, Y.; Wang, X.; Xie, W.; Zhang, X.; Yao, R. Interactive effects of attapulgite and nitrogen fertilizers on the nitrogen fertilizer use efficiency and residual levels in saline soil. Plant Soil 2025. [Google Scholar] [CrossRef]
  46. Song, Y.; Gao, M.; Li, Z. Impacts of straw return methods on crop yield, soil organic matter, and salinity in saline-alkali land in North China. Field Crops Res. 2025, 322, 109752. [Google Scholar] [CrossRef]
Figure 1. Process diagram. Soil sampling sites in study area (a). Indicators involved in TDS and MDS (b). The weighting of the indicators in TDS and MDS (c). The function graphs of nonlinear and linear scoring (d).
Land 14 00469 g001
Figure 2. Distribution of comprehensive soil fertility grades with the total data set of indicators. SQIPCANL is the PCA indexing–linear scoring; SQIPCAL is the PCA indexing–nonlinear scoring; SQINemoroNL is the modified Nemero quality indexing–nonlinear scoring; and SQINemoroL is the modified Nemero quality indexing–linear scoring.
Land 14 00469 g002
Figure 3. Distribution of comprehensive soil fertility grades with the minimum data set of indicators. SQIPCAL is the PCA indexing–nonlinear scoring; SQINemeroL is the modified Nemero quality indexing–linear scoring.
Land 14 00469 g003
Figure 4. Relationship between comprehensive soil fertility indices evaluated with the total data set and minimum data set of indicators. SQIPCAL is the PCA indexing–nonlinear scoring; SQINemeroL is the modified Nemero quality indexing–linear scoring.
Land 14 00469 g004
Figure 5. Relationship between comprehensive soil fertility indices evaluated with total salt. SQINemeroL is the modified Nemero quality indexing–linear scoring.
Land 14 00469 g005
Table 1. Threshold of soil index standardization function.
ThresholdTS
(‰)
pHSOM
(g/kg)
TN
(g/kg)
TP
(g/kg)
TK
(g/kg)
AN
(mg/kg)
AP
(mg/kg)
AK
(mg/kg)
x118100.750.41060550
x248.52010.6159010100
Table 2. Weight values of comprehensive soil fertility indicators for total data set and minimum data set.
WeightTS
(‰)
pHSOM
(g/kg)
TN
(g/kg)
TP
(g/kg)
TK
(g/kg)
AN
(mg/kg)
AP
(mg/kg)
AK
(mg/kg)
TDS0.1200.1120.1240.1080.1060.1290.1010.0900.110
MDS0.3430.3970.260
Table 3. Descriptive statistics of soil indicator contents in coastal saline–alkali land.
Indicator MeanRangeCV (%)
TS (‰)1.82 ± 2.160.30~13.45118.68
pH8.40 ± 0.317.54~9.073.69
SOM (g/kg)9.56 ± 5.911.55~36.8961.82
TN (g/kg)0.47 ± 0.250.03~1.4453.19
TP (g/kg)0.67 ± 0.120.37~1.1317.91
TK (g/kg)18.74 ± 2.3815.52~25.0512.70
AN (mg/kg)71.88 ± 5.6715.65~245.437.89
AP (mg/kg)26.29 ± 18.591.65~81.6570.71
AK (mg/kg)174.08 ± 129.7735.05~576.2174.55
Table 4. Correlations between comprehensive soil fertility indices evaluated using four different methods in coastal saline–alkali land.
MethodSQIPCANLSQIPCALSQINemeroNLSQINemeroL
SQIPCANL1
SQIPCAL0.915 **1
SQINemeroNL0.978 **0.932 **1
SQINemeroL0.911 **0.996 **0.940 **1
Note: ‘**’ represents significance at the 1%, respectively.
Disclaimer/Publisher’s Note: The statements, opinions and data contained in all publications are solely those of the individual author(s) and contributor(s) and not of MDPI and/or the editor(s). MDPI and/or the editor(s) disclaim responsibility for any injury to people or property resulting from any ideas, methods, instructions or products referred to in the content.

