
Spatiotemporal Evolution and Obstacle Factor Analysis of Land Ecological Security in the Surrounding Areas of Beijing, China

Abstract
1. Introduction
2. Study Area and Data Sources
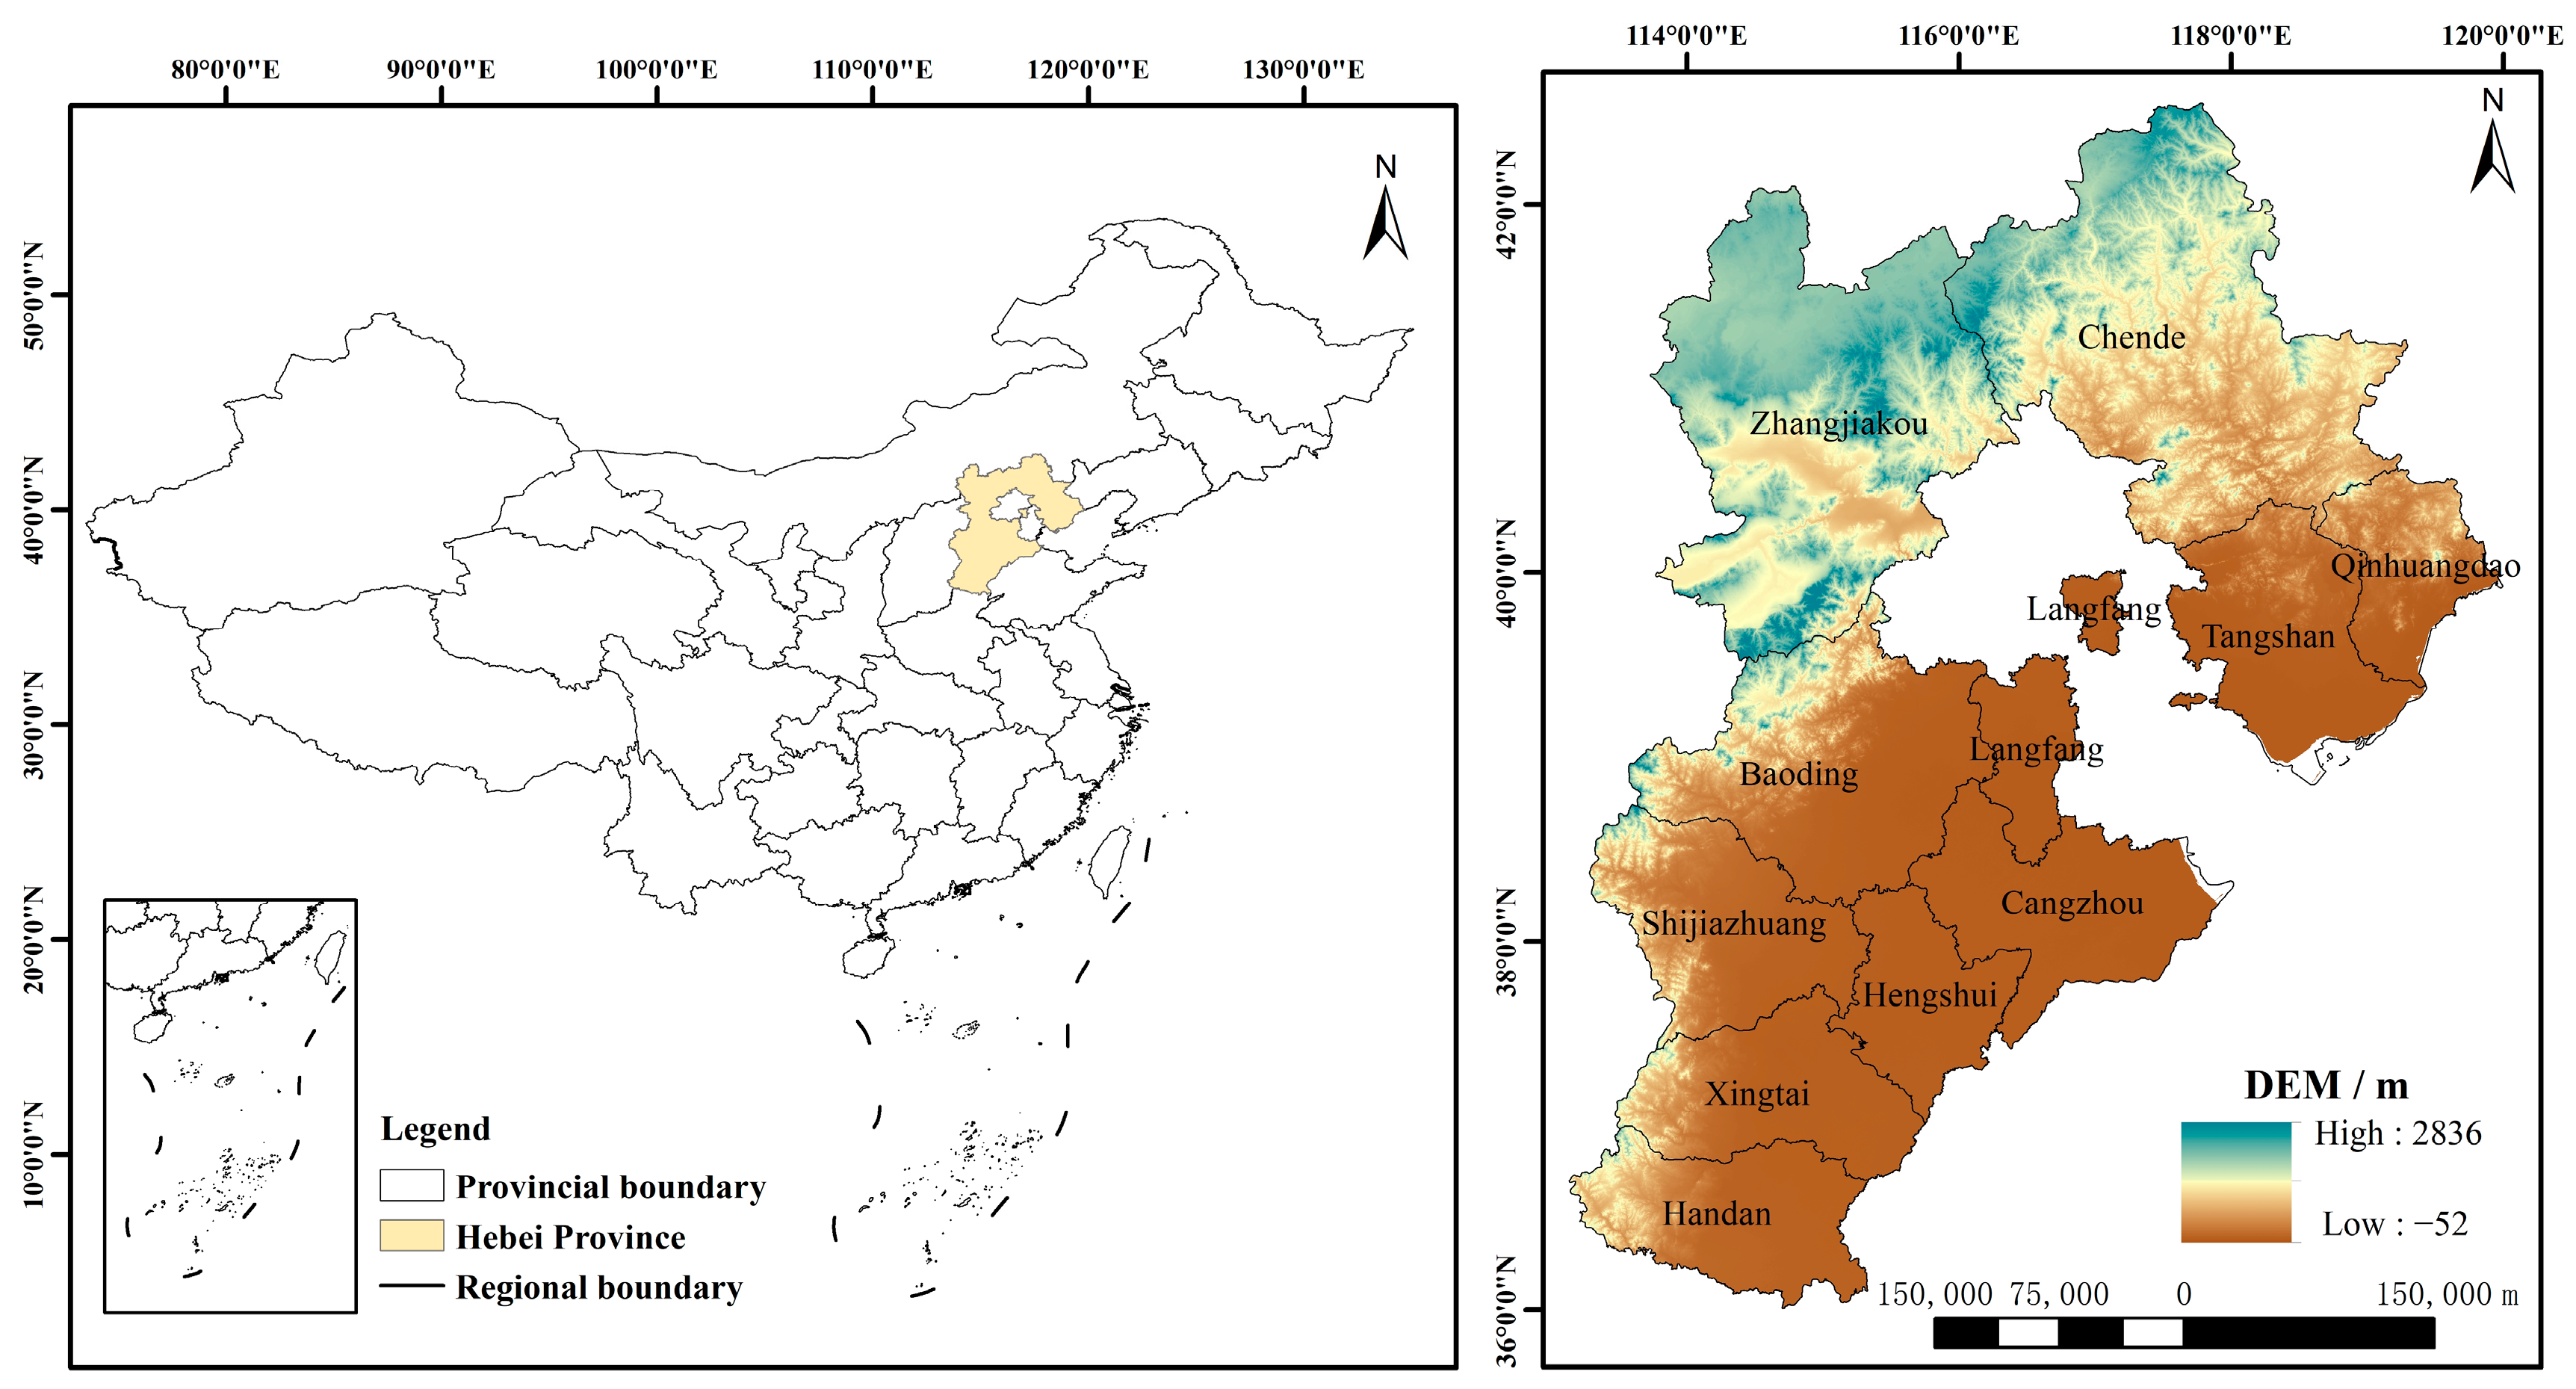
2.1. Study Area
2.2. Data Sources
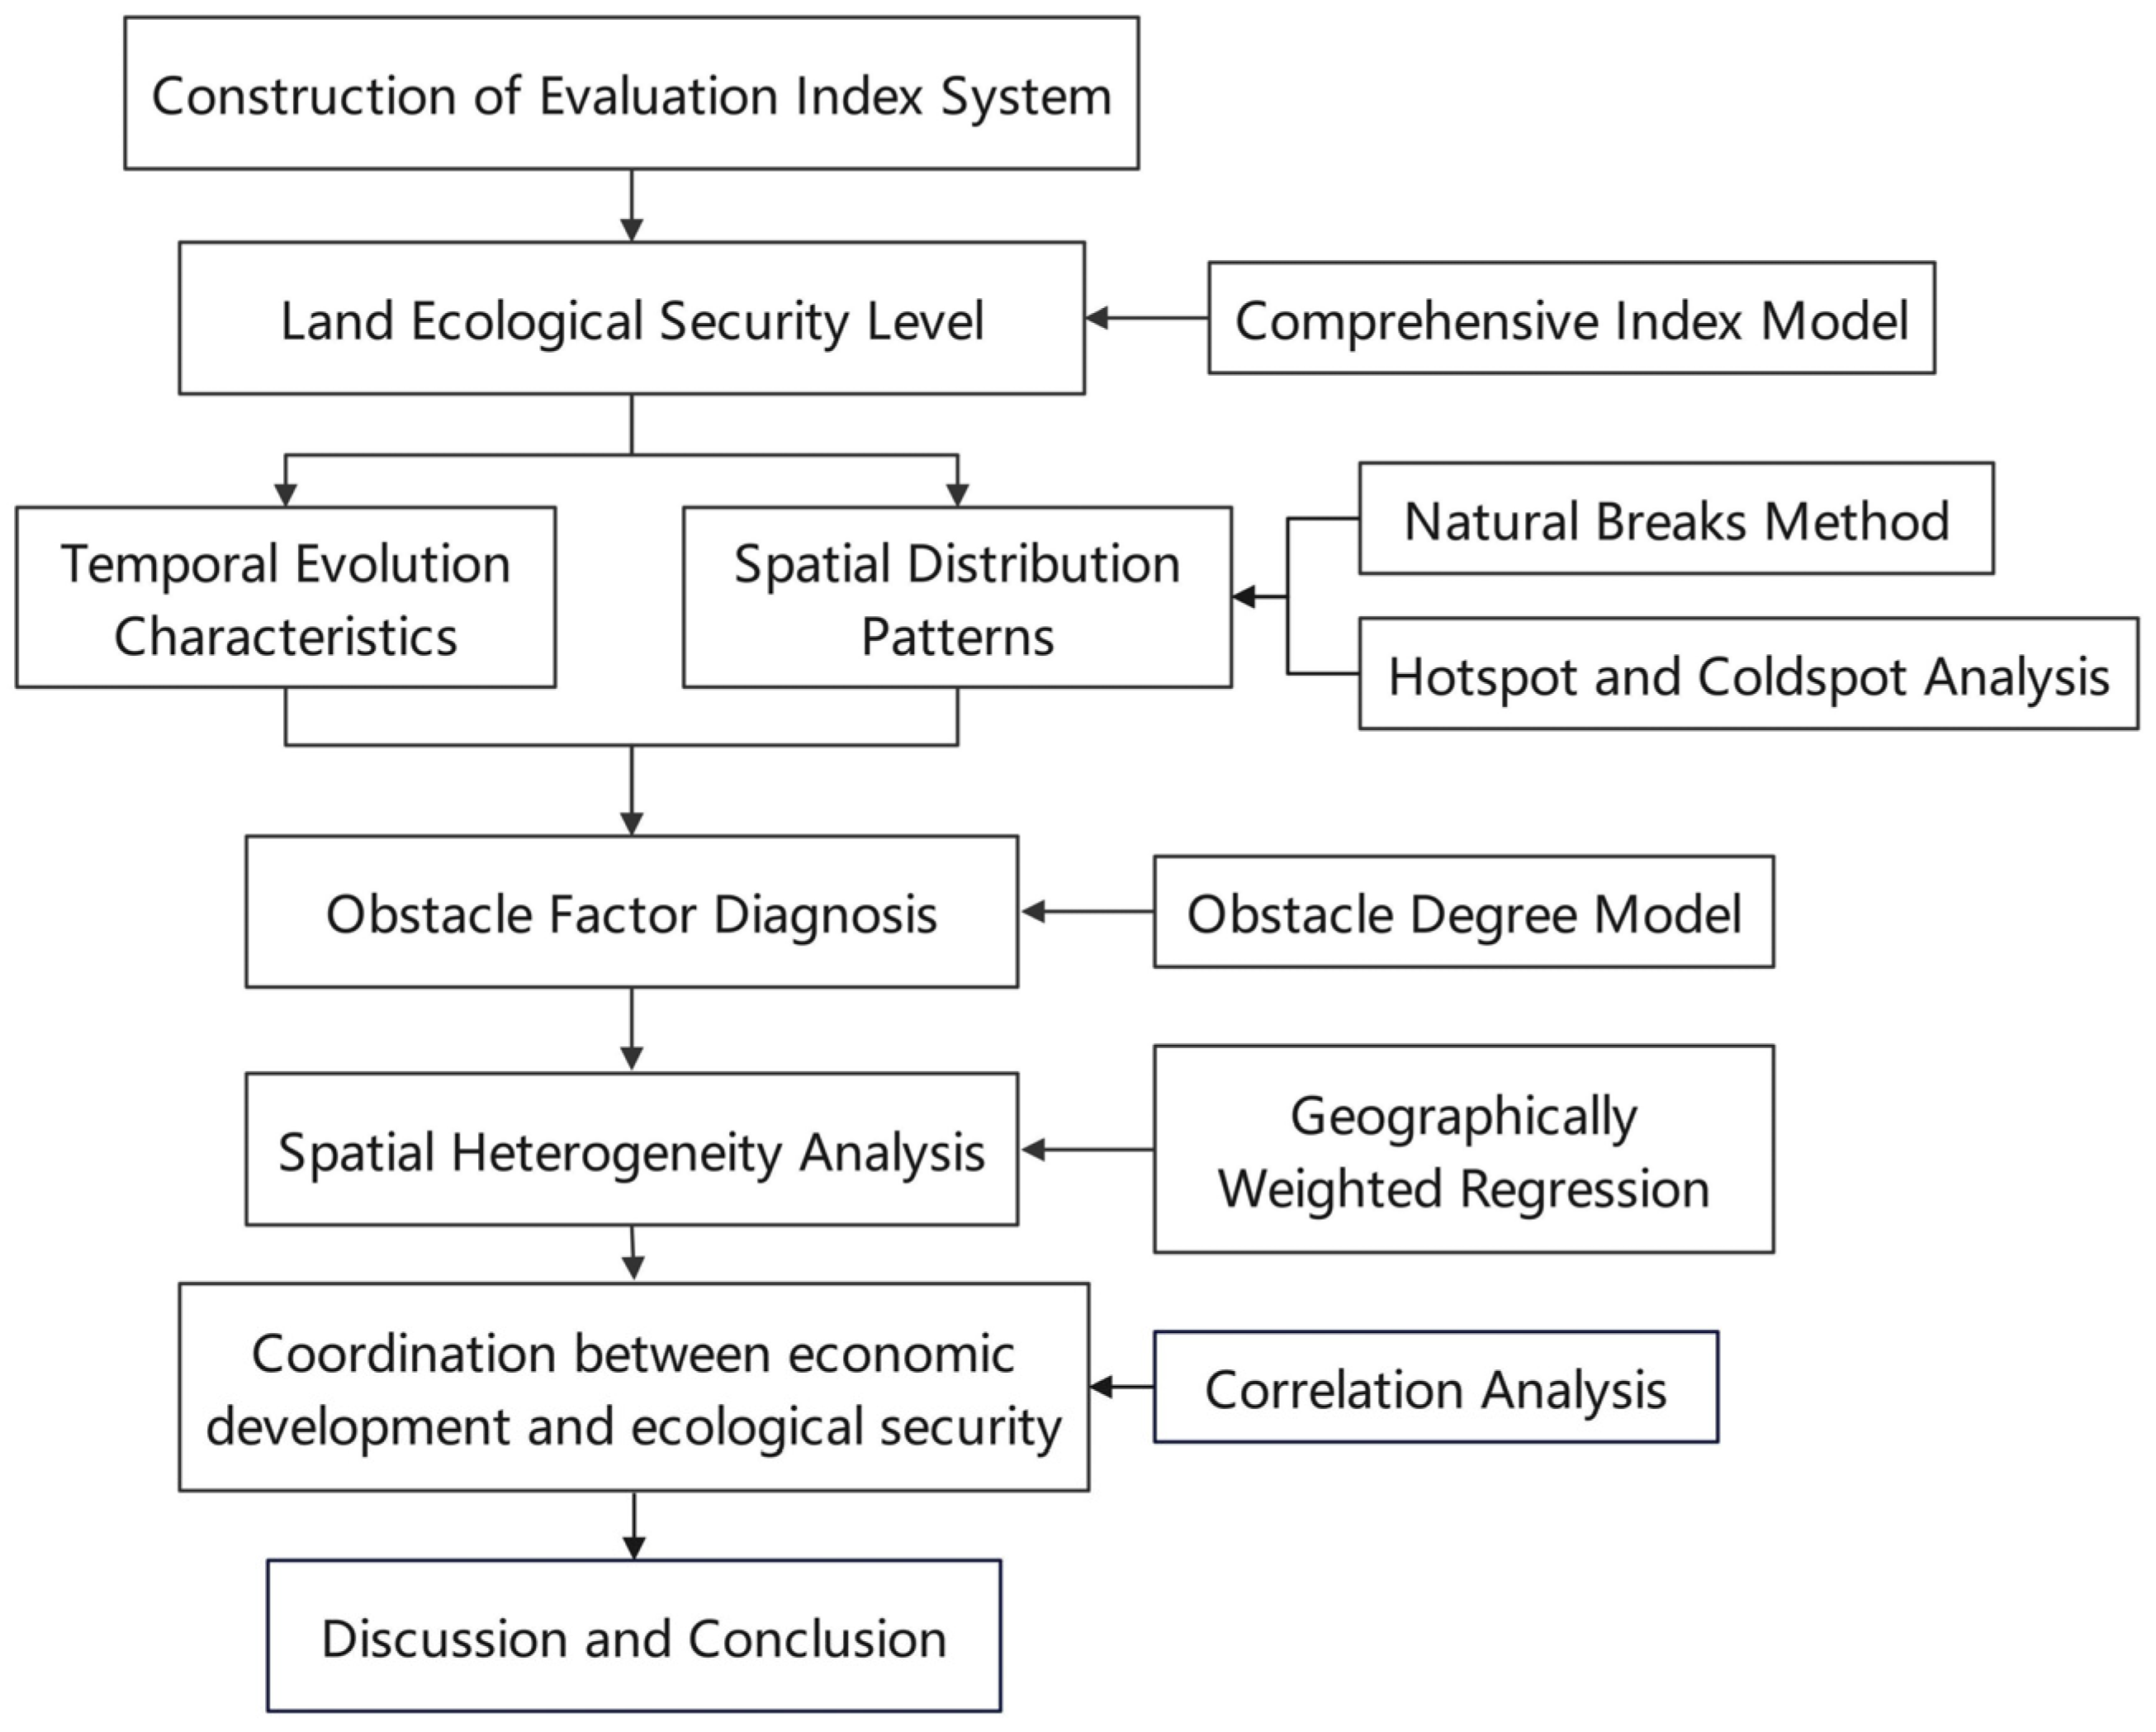
3. Methods
3.1. Construction of Evaluation Index System
3.2. Comprehensive Index Model
3.3. Natural Breaks Method
3.4. Hotspot and Coldspot Analysis
3.5. Obstacle Degree Model
3.6. Geographically Weighted Regression Model
3.7. Correlation Analysis
4. Results
4.1. Temporal Characteristics of Land Ecological Security
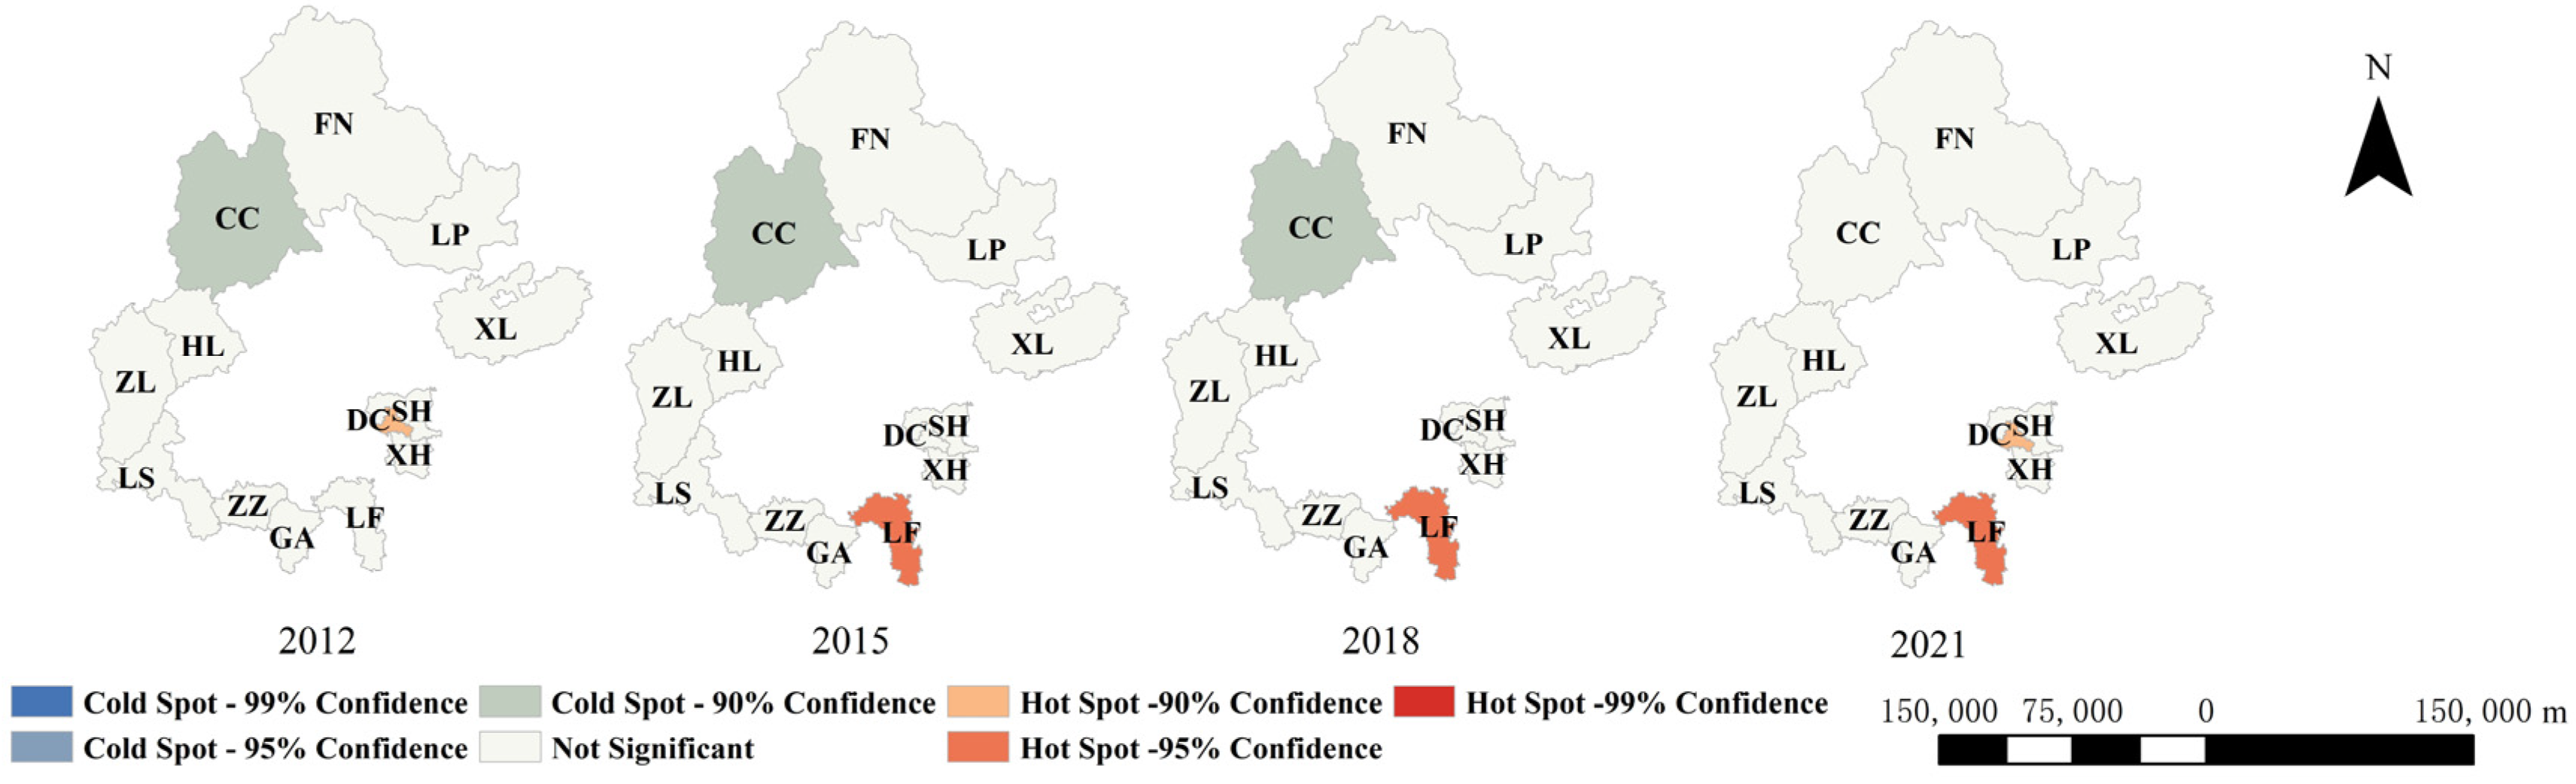
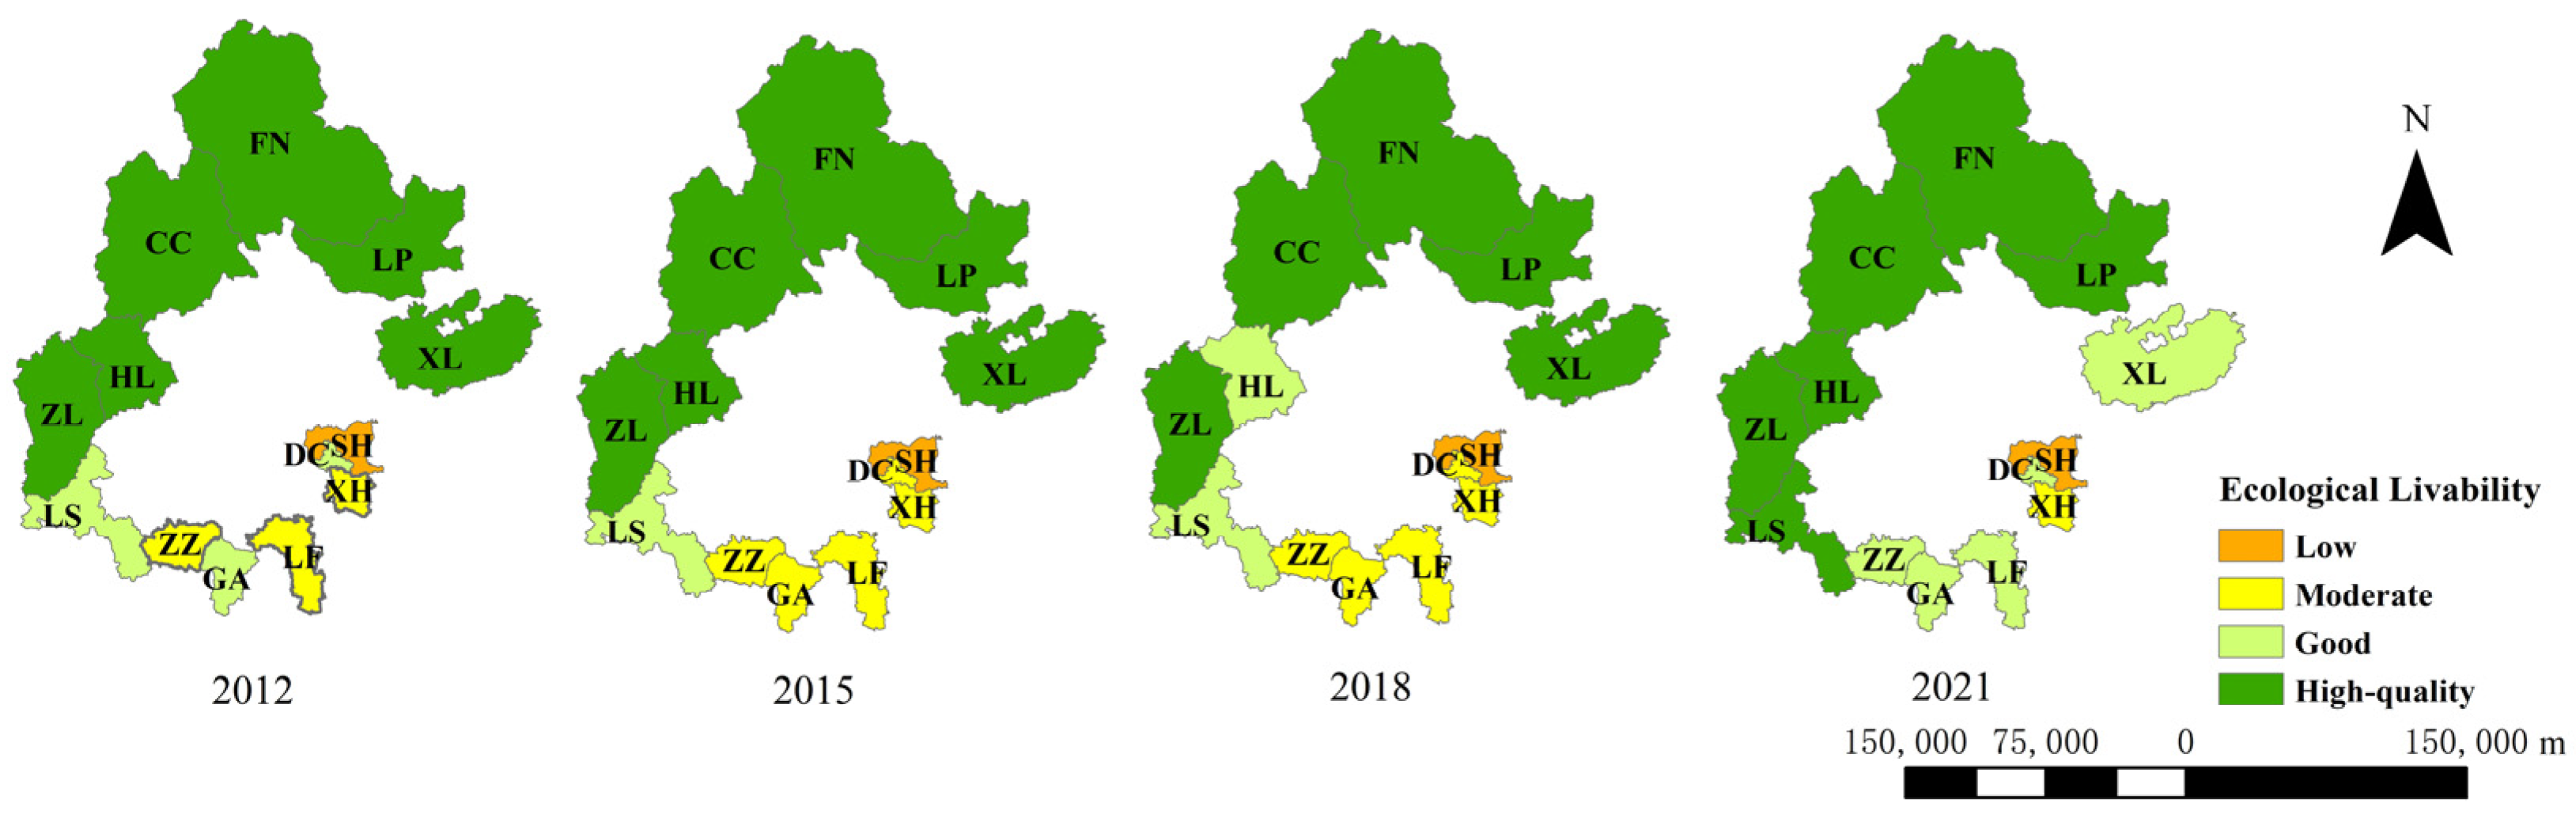
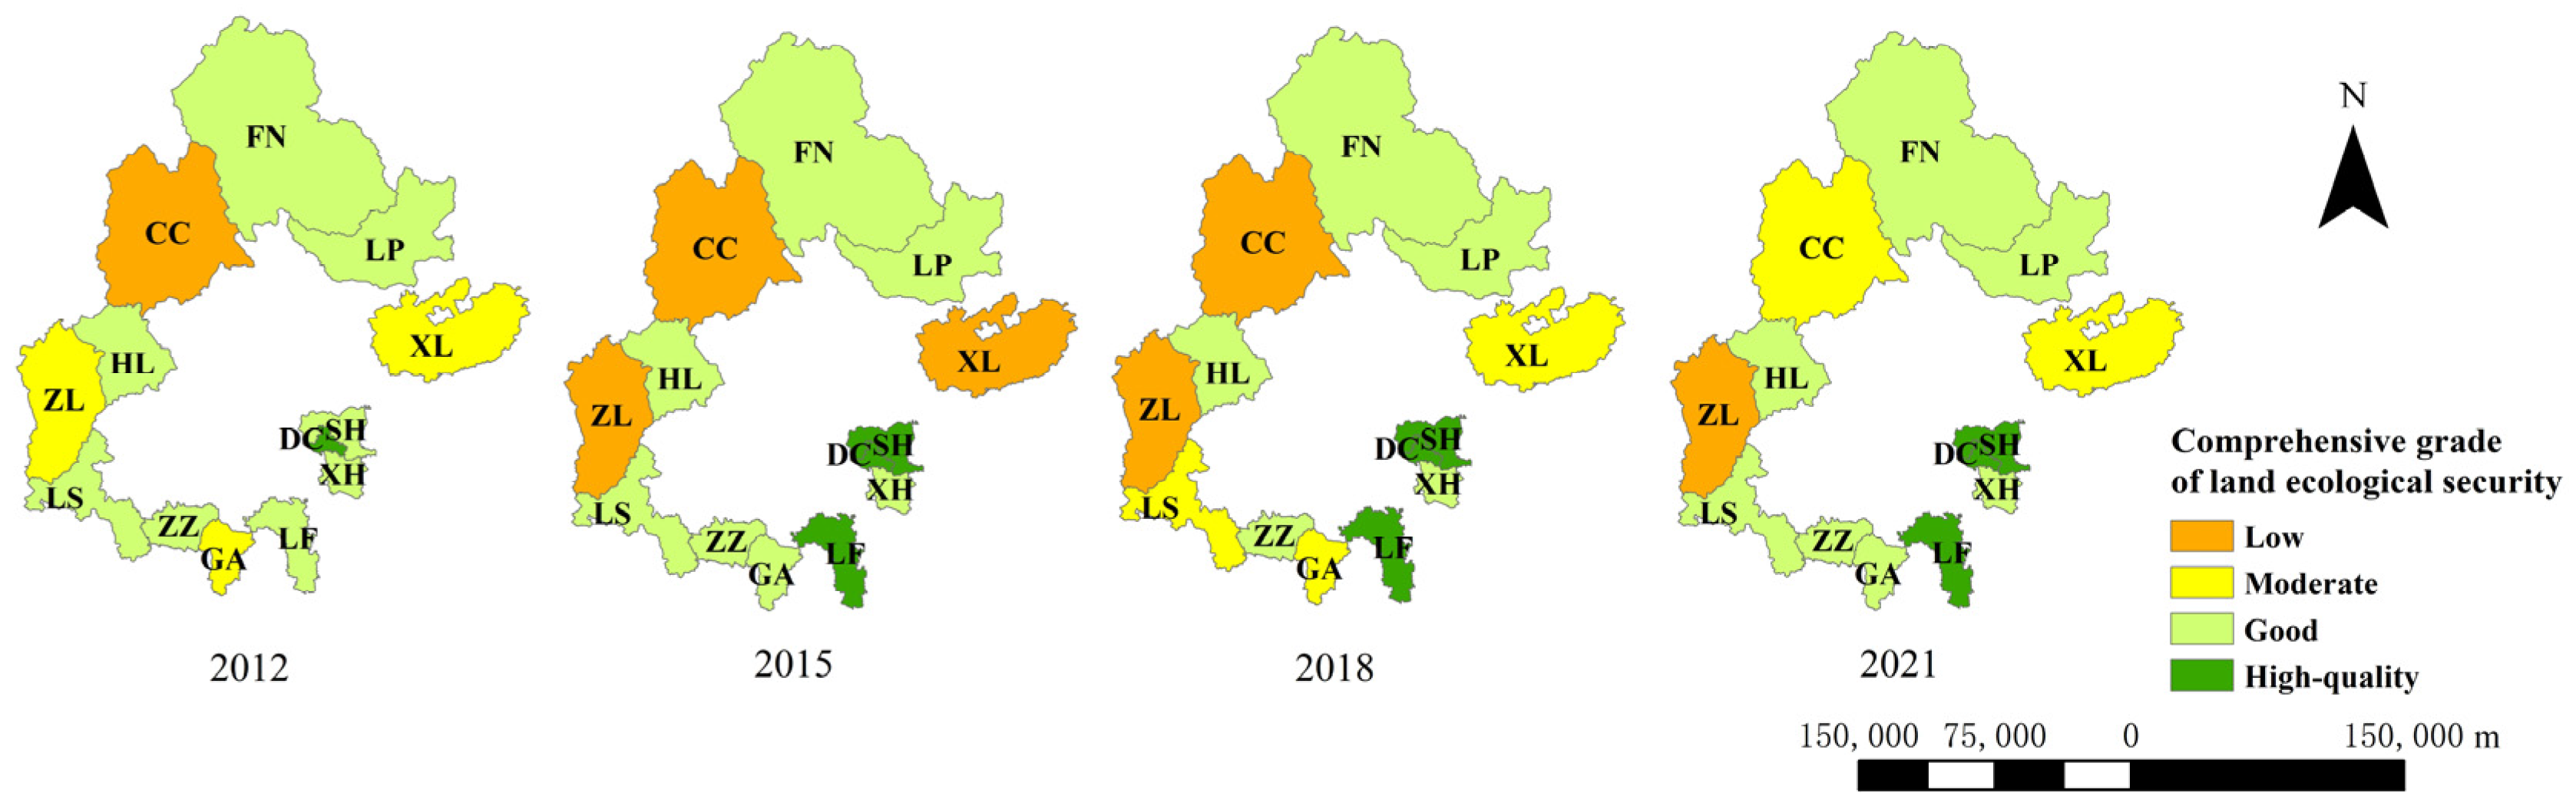
4.2. Spatial Distribution Characteristics of Land Ecological Security
4.3. Spatial Distribution Analysis of Land Ecological Security at Criterion Level


4.4. Obstacle Degree Analysis of Land Ecological Security
4.4.1. Analysis of Criterion-Level Obstacle Factors
4.4.2. Analysis of Indicator-Level Obstacle Factors
4.5. Geographically Weighted Regression Analysis

4.6. Nighttime Light Data and NPP Data Correlation Analysis
5. Discussion
5.1. Interpretation of Main Research Results
5.2. Comparison with Existing Studies
5.3. Countermeasures and Suggestions
5.4. Limitations and Prospects
6. Conclusions
- (1)
- The comprehensive land ecological security index in the Surrounding areas of Beijing exhibited an overall upward trend from 2012 to 2021. The southeastern areas of Beijing and the three northern counties of Langfang experienced relatively rapid growth, maintaining a higher level of land ecological security. In contrast, the western and northern areas of Beijing showed lower levels of land ecological security with slower growth. Land ecological security in the surrounding areas of Beijing demonstrated distinct spatial distribution characteristics, displaying a symmetrical spatial distribution pattern along the north–south axis. High-security areas were mainly concentrated in the Langfang Urban Area, Sanhe City, and Dachang County, whereas low-security areas were predominantly found in Chicheng County and Zhuolu County. Hotspot and coldspot analysis further revealed that the Langfang Urban Area was identified as the primary hotspot, followed by Dachang Hui Autonomous County as a secondary hotspot. Conversely, Chicheng County was classified as a secondary coldspot within the study area, while other regions exhibited no significant clustering patterns.
- (2)
- The main obstacle factors affecting land ecological security in the surrounding areas of Beijing include land economic density, fixed asset investment per unit of land, and GDP growth rate. Eco-economy is the primary obstacle factor, followed by ecological environment, ecological civilization, and ecological livability.
- (3)
- The results of the geographically weighted regression (GWR) analysis show significant spatial heterogeneity in the distribution of different factors. The proportion of secondary industry output to GDP is negatively correlated with land ecological security, while the proportion of tertiary industry output to GDP, fixed asset investment per unit of land, and annual precipitation are positively correlated with land ecological security. The impact of each factor varies significantly across different regions.
Author Contributions
Funding
Data Availability Statement
Conflicts of Interest
References
- Zhang, P.; Wang, Q.; Liu, Y.; Zhang, J. Potential ecological risk assessment based on loss of ecosystem services due to land use and land cover change: A case study of Beijing-Tianjin-Hebei region. Appl. Geogr. 2024, 171, 103389. [Google Scholar]
- Li, L.; Fu, M.; Zhu, Y.; Kang, H.; Wen, H. The current situation and trend of land ecological security evaluation from the perspective of global change. Ecol. Indic. 2024, 167, 112608. [Google Scholar] [CrossRef]
- Yang, C.M.; Xu, X.F.; Zhang, H.; Hu, Y.Y. Study on the characteristics evolution and optimization of rural residential areas in Shanghai based on the function of three living spaces. Resour. Environ. Yangtze Basin 2021, 30, 2392–2404. [Google Scholar]
- Long, H.; Xu, Y.; Zheng, Y.; Chen, K. County-level Urban-Rural Integration Development in the Context of Chinese Modernization. Econ. Geogr. 2023, 43, 12–19. [Google Scholar] [CrossRef]
- Lai, S.; Li, X.; Sha, J.; Jiang, W.; Shifaw, E. Comprehensive evaluation and future trend prediction of ecological security in Fuzhou City: A DIKW framework and multi-model integration analysis. Hum. Ecol. Risk Assess. Int. J. 2024, 1–25. [Google Scholar] [CrossRef]
- Hough, P. Back to the Future: Environmental Security in Nineteenth Century Global Politics. Glob. Secur. Health Sci. Policy 2019, 4, 1–13. [Google Scholar] [CrossRef]
- Häbel, S.; Hakala, E. Policy Coherence for Sustainable Development and Environmental Security: A Case Study of European Union Policies on Renewable Energy. Environ. Policy Gov. 2021, 31, 633–646. [Google Scholar] [CrossRef]
- Lu, X.; Zhang, Y.; Lin, C.; Wu, F. Analysis and comprehensive evaluation of sustainable land use in China: Based on sustainable development goals framework. J. Clean. Prod. 2021, 310, 127205. [Google Scholar] [CrossRef]
- Yu, S.; Yang, L.; Song, Z.; Li, W.; Ye, Y.; Liu, B. Measurement of land ecological security in the middle and lower reaches of the Yangtze River based on the PSR model. Sustainability 2023, 15, 14098. [Google Scholar] [CrossRef]
- Barrière, O. Human Relationship to the Land from a Legal Perspective as a Human and Environmental Security Challenge. In Environmental Change and Human Security in Africa and the Middle East; Springer: Cham, Switzerland, 2017; pp. 259–304. [Google Scholar]
- Peng, W.; Sun, Y.; Liu, C.; Liu, D. Study on urban land ecological security pattern and obstacle factors in the Beijing–Tianjin–Hebei region. Sustainability 2023, 15, 43. [Google Scholar] [CrossRef]
- Zhao, L.; Liu, G.; Xian, C.; Nie, J.; Xiao, Y.; Zhou, Z.; Li, X.; Wang, H. Simulation of land use pattern based on land ecological security: A case study of Guangzhou, China. Int. J. Environ. Res. Public Health 2022, 19, 9281. [Google Scholar] [CrossRef] [PubMed]
- Dos Santos Sá, A.K.D.; Cutrim, M.V.J.; Do Nascimento Feitosa, F.A.; De Jesus Flores-Montes, M.; Cavalcanti, L.F.; Dos Santos Costa, D.; Da Cruz, Q.S. Multiple Stressors Influencing the General Eutrophication Status of Transitional Waters of the Brazilian Tropical Coast: An Approach Utilizing the Pressure, State, and Response (PSR) Framework. J. Sea Res. 2022, 189, 102282. [Google Scholar] [CrossRef]
- Xu, M.; Li, J.; Luan, S. Regional Climate Change Adaptation Based on the PSR Model—Multi-Case Comparative Analysis on a Global Scale. Climate 2023, 11, 155. [Google Scholar] [CrossRef]
- Soltani, M.J.; Motamedvaziri, B.; Mosaffaei, J.; Noroozi, A.A.; Ahmadi, H. Cause and effect analysis of the trend of dust storms using the DPSIR framework in the Hendijan region. Int. J. Environ. Sci. Technol. 2023, 20, 4919–4930. [Google Scholar] [CrossRef]
- Teerakul, B.; Rongsayamanont, C.; Darnsawasdi, R.; Kosolsaksakul, P. A combined DPSIR framework and logical framework approach for sustainable water resources management in the lagoon floodplain. Environ. Nat. Resour. J. 2023, 21, 1–11. [Google Scholar] [CrossRef]
- Agramont, A.; van Cauwenbergh, N.; van Griesven, A.; Craps, M. Integrating spatial and social characteristics in the DPSIR framework for the sustainable management of river basins: Case study of the Katari River Basin, Bolivia. Water Int. 2021, 47, 8–29. [Google Scholar] [CrossRef]
- Moss, E.D.; Evans, D.M.; Atkins, J.P. Investigating the impacts of climate change on ecosystem services in UK agro-ecosystems: An application of the DPSIR framework. Land Use Policy 2021, 105, 105394. [Google Scholar] [CrossRef]
- Manservisi, F.; Banzi, M.; Tonelli, T.; Veronesi, P.; Ricci, S.; Distante, D.; Faralli, S.; Bortone, G. Environmental Complaint Insights through Text Mining Based on the Driver, Pressure, State, Impact, and Response (DPSIR) Framework: Evidence from an Italian Environmental Agency. Reg. Sustain. 2023, 4, 261–281. [Google Scholar] [CrossRef]
- Dong, L.; Longwu, L.; Zhenbo, W.; Liangkan, C.; Faming, Z. Exploration of coupling effects in the Economy–Society–Environment system in urban areas: Case study of the Yangtze River Delta Urban Agglomeration. Ecol. Indic. 2021, 128, 107858. [Google Scholar] [CrossRef]
- Cui, X.; Fang, C.; Liu, H.; Liu, X. Assessing sustainability of urbanization by a coordinated development index for an Urbanization-Resources-Environment complex system: A case study of Jing-Jin-Ji region, China. Ecol. Indic. 2019, 96, 383–391. [Google Scholar] [CrossRef]
- Lin, D.; Hanscom, L.; Murthy, A.; Galli, A.; Evans, M.; Neill, E.; Mancini, M.S.; Martindill, J.; Medouar, F.-Z.; Huang, S.; et al. Ecological footprint accounting for countries: Updates and results of the national footprint accounts, 2012–2018. Resources 2018, 7, 58. [Google Scholar] [CrossRef]
- Galli, A.; Wackernagel, M.; Iha, K.; Lazarus, E.D. Ecological footprint: Implications for biodiversity. Biol. Conserv. 2014, 173, 121–132. [Google Scholar] [CrossRef]
- Borucke, M.; Moore, D.; Cranston, G.; Gracey, K.; Iha, K.; Larson, J.; Lazarus, E.; Morales, J.C.; Wackernagel, M.; Galli, A. Accounting for demand and supply of the biosphere’s regenerative capacity: The national footprint accounts’ underlying methodology and framework. Ecol. Indic. 2013, 24, 518–533. [Google Scholar] [CrossRef]
- Fang, K.; Heijungs, R.; Snoo, G.R. Theoretical exploration for the combination of the ecological, energy, carbon, and water footprints: Overview of a footprint family. Ecol. Indic. 2014, 36, 508–518. [Google Scholar] [CrossRef]
- Mancini, M.S.; Galli, A.; Coscieme, L.; Niccolucci, V.; Lin, D.; Pulselli, F.M.; Bastianoni, S.; Marchettini, N. Exploring Ecosystem Services Assessment through Ecological Footprint Accounting. Ecosyst. Serv. 2018, 30, 228–235. [Google Scholar] [CrossRef]
- Liu, Y.; Li, J.; Yang, Y. Strategic adjustment of land use policy under the economic transformation. Land Use Policy 2018, 74, 5–14. [Google Scholar] [CrossRef]
- Wang, S.; Bai, X.; Zhang, X.; Reis, S.; Chen, D.; Xu, J.; Gu, B. Urbanization can benefit agricultural production with large-scale farming in China. Nat. Food 2021, 2, 183–191. [Google Scholar] [CrossRef]
- Chen, W.; Chi, G.; Li, J. The spatial association of ecosystem services with land use and land cover change at the county level in China, 1995–2015. Sci. Total Environ. 2019, 669, 459–470. [Google Scholar] [CrossRef] [PubMed]
- Zhu, X.X.; Tuia, D.; Mou, L.; Xia, G.-S.; Zhang, L.; Xu, F.; Fraundorfer, F. Deep learning in remote sensing: A comprehensive review and list of resources. IEEE Geosci. Remote Sens. Mag. 2017, 5, 8–36. [Google Scholar] [CrossRef]
- Ma, L.; Liu, Y.; Zhang, X.; Ye, Y.; Yin, G.; Johnson, B.A. Deep learning in remote sensing applications: A meta-analysis and review. ISPRS J. Photogramm. Remote Sens. 2019, 152, 166–177. [Google Scholar] [CrossRef]
- Kussul, N.; Lavreniuk, M.; Skakun, S.; Shelestov, A. Deep learning classification of land cover and crop types using remote sensing data. IEEE Geosci. Remote Sens. Lett. 2017, 14, 778–782. [Google Scholar] [CrossRef]
- Alemohammad, S.H.; Fang, B.; Konings, A.G.; Aires, F.; Green, J.K.; Kolassa, J.; Miralles, D.; Prigent, C.; Gentine, P. Water, Energy, and Carbon with Artificial Neural Networks (WECANN): A Statistically Based Estimate of Global Surface Turbulent Fluxes and Gross Primary Productivity Using Solar-Induced Fluorescence. Biogeosciences 2017, 14, 4101–4124. [Google Scholar] [CrossRef]
- Fotheringham, A.S.; Yang, W.; Kang, W. Multiscale geographically weighted regression (MGWR). Ann. Am. Assoc. Geogr. 2017, 107, 1247–1265. [Google Scholar] [CrossRef]
- Li, Z.; Fotheringham, A.S. Computational improvements to multi-scale geographically weighted regression. Int. J. Geogr. Inf. Sci. 2020, 34, 1378–1397. [Google Scholar] [CrossRef]
- Yu, H.; Fotheringham, A.S.; Li, Z.; Oshan, T.; Kang, W.; Wolf, L.J. Inference in multiscale geographically weighted regression. Geogr. Anal. 2020, 52, 87–106. [Google Scholar] [CrossRef]
- Brunsdon, C.; Fotheringham, A.S.; Charlton, M.E. Geographically weighted regression: A method for exploring spatial nonstationarity. Geogr. Anal. 1996, 28, 281–298. [Google Scholar] [CrossRef]
- Ma, L.; Yang, B.; Feng, Y.; Ju, L. Evaluation of provincial forest ecological security and analysis of the driving factors in China via the GWR model. Sci. Rep. 2024, 14, 14299. [Google Scholar] [CrossRef] [PubMed]
- Ustaoglu, E.; Williams, B. Institutional Settings and Effects on Agricultural Land Conversion: A Global and Spatial Analysis of European Regions. Land 2022, 12, 47. [Google Scholar] [CrossRef]
- Yang, R.; Du, W.; Yang, Z. Spatiotemporal evolution and influencing factors of urban land ecological security in Yunnan Province. Sustainability 2021, 13, 2936. [Google Scholar] [CrossRef]
- Su, Y.; Liu, Y.; Zhou, Y.; Liu, J. Research on the coupling and coordination of land ecological security and high-quality agricultural development in the Han River Basin. Land 2024, 13, 1666. [Google Scholar] [CrossRef]
- Moarrab, Y.; Salehi, E.; Amiri, M.J.; Hovidi, H. Spatial–Temporal Assessment and Modeling of Ecological Security Based on Land-Use/Cover Changes (Case Study: Lavasanat Watershed). Int. J. Environ. Sci. Technol. 2022, 19, 1–16. [Google Scholar] [CrossRef]
- Guo, Y.; He, P.; Chen, P.; Zhang, L. Ecological evaluation of land resources in the Yangtze River Delta region by remote sensing observation. Land 2024, 13, 1155. [Google Scholar] [CrossRef]
- Han, P.; Hu, H.; Jiang, M.; Wang, M. Construction of wetland ecological security pattern in Wuhan metropolitan core area considering wetland ecological risk. Land 2024, 13, 1407. [Google Scholar] [CrossRef]
- Baral, H.; Keenan, R.J.; Fox, J.C.; Stork, N.E.; Kasel, S. Spatial Assessment of Ecosystem Goods and Services in Complex Production Landscapes: A Case Study from South-Eastern Australia. Ecol. Complex. 2013, 13, 35–45. [Google Scholar] [CrossRef]
- Hebei Statistical Yearbook 2012–2021; China Statistics Press: Beijing, China, 2022.
- China County Statistical Yearbook 2012–2021 (County and City Volume); China Statistics Press: Beijing, China, 2022.
- China Forestry and Grassland Statistical Yearbook 2012–2021; China Forestry Press: Beijing, China, 2022.
- China County Urban Construction Statistical Yearbook 2012–2021; China Statistics Press: Beijing, China, 2022.
- National Fundamental Geographic Information System. Available online: https://www.ngcc.cn/ (accessed on 22 August 2024).
- National Earth System Science Data Center. Available online: https://www.geodata.cn/ (accessed on 22 August 2024).
- MODIS Data Products. Available online: https://modis.gsfc.nasa.gov/ (accessed on 22 August 2024).
- Yang, M. (Ed.) Notice on the Issuance of “National Ecological Civilization Construction Pilot Demonstration Area Indicators (Trial)”; China Environmental Yearbook; China Environmental Yearbook Press: Beijing, China, 2014. [Google Scholar]
- Feng, Y.; Yang, Q.; Tong, X.; Chen, L. Evaluating land ecological security and examining its relationships with driving factors using GIS and generalized additive model. Sci. Total Environ. 2018, 633, 1469–1479. [Google Scholar] [CrossRef]
- Wang, N.; Li, S.; Kang, Q.; Wang, Y. Exploring the land ecological security and its spatio-temporal changes in the Yangtze River Economic Belt of China, 2000–2020. Ecol. Indic. 2023, 154, 110645. [Google Scholar] [CrossRef]
- He, N.; Zhou, Y.; Wang, L.; Li, Q.; Zuo, Q.; Liu, J.; Li, M. Spatiotemporal evaluation and analysis of cultivated land ecological security based on the DPSIR model in Enshi autonomous prefecture, China. Ecol. Indic. 2022, 145, 109619. [Google Scholar] [CrossRef]
- Hua, Y.E.; Yan, M.A.; Limin, D. Land ecological security assessment for Bai autonomous prefecture of Dali based using PSR model–with data in 2009 as case. Energy Procedia 2011, 5, 2172–2177. [Google Scholar] [CrossRef]
- Hou, M.; Li, L.; Yu, H.; Jin, R.; Zhu, W. Ecological security evaluation of wetlands in Changbai Mountain area based on DPSIRM model. Ecol. Indic. 2024, 160, 111773. [Google Scholar] [CrossRef]
- Han, Z.; Wu, S.; Liu, J. Land use change and its impact on the quality of the ecological environment in Xinjiang. Sustainability 2024, 16, 10114. [Google Scholar] [CrossRef]
- Xu, H.; Li, Z.; Guo, L.; Liu, Y. The impact of innovative city pilot policy on urban land green use efficiency: A quasi-natural experiment from China. Land 2025, 14, 168. [Google Scholar] [CrossRef]
- Yang, X.J. Research on Differentiated Evaluation Model of Government Performance of Ecological Functional Districts. Ph.D. Dissertation, Xiangtan University, Xiangtan, China, 2018. [Google Scholar]
- Han, D. Discussion on sewage treatment in Heilongjiang Forestry Bureau. For. Sci. Technol. Inf. 2019, 51, 78–81. [Google Scholar]
- Jing, X.; Tao, S.; Hu, H.; Sun, M.; Wang, M. Spatio-temporal evaluation of ecological security of cultivated land in China based on DPSIR-entropy weight TOPSIS model and analysis of obstacle factors. Ecol. Indic. 2024, 166, 112579. [Google Scholar] [CrossRef]
- Lee, C.C.; He, Z.W.; Luo, H.P. Spatio-temporal characteristics of land ecological security and analysis of influencing factors in cities of major grain-producing regions of China. Environ. Impact Assess. Rev. 2024, 104, 107344. [Google Scholar] [CrossRef]
- Cheng, H.; Zhu, L.; Meng, J. Fuzzy evaluation of the ecological security of land resources in mainland China based on the Pressure-State-Response framework. Sci. Total Environ. 2022, 804, 150053. [Google Scholar] [CrossRef] [PubMed]
- Rząsa, K.; Ciski, M. Determination of the level of sustainable development of the cities-a proposal for a method of classifying objects based on natural breaks. Acta Sci. Pol. Adm. Locorum 2021, 20, 215–239. [Google Scholar] [CrossRef]
- Zhang, X.; Ren, W.; Peng, H. Urban land use change simulation and spatial responses of ecosystem service value under multiple scenarios: A case study of Wuhan, China. Ecol. Indic. 2022, 144, 109526. [Google Scholar] [CrossRef]
- Fu, Y.; Shi, X.; He, J.; Yuan, Y.; Qu, L. Identification and optimization strategy of county ecological security pattern: A case study in the Loess Plateau, China. Ecol. Indic. 2020, 112, 106030. [Google Scholar] [CrossRef]
- Basu, T.; Das, A. Urbanization induced changes in land use dynamics and its nexus to ecosystem service values: A spatiotemporal investigation to promote sustainable urban growth. Land Use Policy 2024, 144, 107239. [Google Scholar] [CrossRef]
- Li, S.; Liu, C.; Ge, C.; Yang, J.; Liang, Z.; Li, X.; Cao, X. Ecosystem health assessment using PSR model and obstacle factor diagnosis for Haizhou Bay, China. Ocean Coast. Manag. 2024, 250, 107024. [Google Scholar] [CrossRef]
- Wang, Y.; Feng, Y.; Zuo, J.; Rameezdeen, R. From “Traditional” to “Low carbon” urban land use: Evaluation and obstacle analysis. Sustain. Cities Soc. 2019, 51, 101722. [Google Scholar] [CrossRef]
- Zhang, K.; Shen, J.; He, R.; Fan, B.; Han, H. Dynamic analysis of the coupling coordination relationship between urbanization and water resource security and its obstacle factor. Int. J. Environ. Res. Public Health 2019, 16, 107365. [Google Scholar] [CrossRef] [PubMed]
- Wang, D.; Li, Y.; Yang, X.; Zhang, Z.; Gao, S.; Zhou, Q.; Zhuo, Y.; Wen, X.; Guo, Z. Evaluating urban ecological civilization and its obstacle factors based on integrated model of PSR-EVW-TOPSIS: A case study of 13 cities in Jiangsu Province, China. Ecol. Indic. 2021, 133, 108431. [Google Scholar] [CrossRef]
- Song, S.; Kong, M.; Su, M.; Ma, Y. Study on carbon sink of cropland and influencing factors: A multiscale analysis based on geographical weighted regression model. J. Clean. Prod. 2024, 447, 141455. [Google Scholar] [CrossRef]
- Liu, C.; Wu, X.; Wang, L. Analysis on land ecological security change and affect factors using RS and GWR in the Danjiangkou Reservoir area, China. Appl. Geogr. 2019, 105, 1–14. [Google Scholar] [CrossRef]
- Fan, J.; Wang, D.; Zhao, Y.; Zhou, X.; Cheng, Y.; Xu, F.; Wei, S.; Liu, H. Spatiotemporal geographically weighted regression analysis for runoff variations in the Weihe River Basin. J. Environ. Manag. 2024, 366, 121908. [Google Scholar] [CrossRef] [PubMed]
- Zhang, Y.; Wang, L.; Geng, D.; Ai, Y.; Xia, W.; Bai, X.; Sun, S. A feature selection method based on the Pearson’s correlation and transformed divergence analysis. J. Phys. Conf. Ser. 2019, 1284, 012001. [Google Scholar] [CrossRef]
- Li, L. Research on Land Ecological Security Evaluation in Bohai Rim Region. Ph.D. Dissertation, Hebei University, Baoding, China, 2019. [Google Scholar]
- Wu, C.; Wang, Z. Multi-scenario simulation and evaluation of the impacts of land use change on ecosystem service values in the Chishui River Basin of Guizhou Province, China. Ecol. Indic. 2024, 163, 112078. [Google Scholar] [CrossRef]
- Tang, F.; Wang, L.; Fu, M.; Huang, N.; Li, W.; Song, W.; Nath, B.; Ding, S.; Niu, Z. Spatio-temporal pattern evolution and regulatory zoning of suitability for farmland scale utilization in China based on multi-source data. Ecol. Indic. 2024, 166, 112475. [Google Scholar] [CrossRef]
- Sun, C.; Wang, X.; Zhang, Y. Ecological health assessment of an arid basin using the DPSIRM model and TOPSIS—A case study of the Shiyang River basin. Ecol. Indic. 2024, 161, 111973. [Google Scholar] [CrossRef]
- Wang, G.; Peng, W.; Zhang, L.; Zhang, J. Quantifying the impacts of natural and human factors on changes in NPP using an optimal parameters-based geographical detector. Ecol. Indic. 2023, 155, 111018. [Google Scholar] [CrossRef]
- Zhang, J.; Wang, J.; Chen, Y.; Huang, S.; Liang, B. Spatiotemporal variation and prediction of NPP in Beijing-Tianjin-Hebei region by coupling PLUS and CASA models. Ecol. Inform. 2024, 81, 102620. [Google Scholar] [CrossRef]
- Liu, T.; Wang, H.Z.; Wang, H.Z.; Xu, H. The spatiotemporal evolution of ecological security in China based on the ecological footprint model with localization of parameters. Ecol. Indic. 2021, 126, 107636. [Google Scholar] [CrossRef]
- Guo, D.; Wang, D.; Zhong, X.; Yang, Y.; Jiang, L. Spatiotemporal changes of land ecological security and its obstacle indicators diagnosis in the Beijing–Tianjin–Hebei Region. Land 2021, 10, 706. [Google Scholar] [CrossRef]


| Goal Layer | Criterion Layer | Indicator Layer | Weight | Indicator Explanation | Security Trend |
|---|---|---|---|---|---|
| Land Ecological Security Evaluation A | Ecological environment conditions (B1) 0.1494 | Per Capita Green Area (C1) | 0.0336 | Green space area per permanent resident (hectares/10,000 people) | + |
| Area of Planted Forests (C2) | 0.0582 | Hectare | + | ||
| Sewage Discharge Volume (C3) | 0.0256 | 100 million cubic meters | - | ||
| Fertilizer Usage (C4) | 0.0320 | Pure amount, ton | - | ||
| Eco-economy (B2) 0.4762 | GDP Growth Rate (C5) | 0.0506 | (Current GDP—Previous GDP)/Previous GDP (%) | + | |
| Per Capita GDP (C6) | 0.0722 | Total GDP per permanent resident (10,000 yuan/person) | + | ||
| Secondary Industry as % of GDP (C7) | 0.0470 | Secondary industry output value/Total GDP (%) | - | ||
| Third Industry as % of GDP (C8) | 0.0693 | Tertiary industry output value/Total GDP (%) | + | ||
| Fixed Asset Investment per Land Unit (C9) | 0.1192 | Total fixed asset investment/Administrative area (100 million yuan/square kilometer) | + | ||
| Land Economic Density (C10) | 0.1179 | Total GDP/Administrative area (100 million yuan/square kilometer) | + | ||
| Ecological livability (B3) 0.1508 | Natural Population Growth Rate (C11) | 0.0226 | Birth rate—Death rate (%) | - | |
| Population Density (C12) | 0.0435 | Permanent residents/Administrative area (10,000 people/square kilometer) | - | ||
| Urbanization Rate (C13) | 0.0450 | Urban permanent residents/(Urban permanent residents + Rural permanent residents) (%) | - | ||
| Green Coverage Rate in Built-up Areas (C14) | 0.0397 | % | + | ||
| Ecological civilization development (B4) 0.2236 | Annual Precipitation (C15) | 0.0608 | Millimeter | + | |
| Sewage Treatment Rate (C16) | 0.0322 | % | + | ||
| Harmless Treatment Rate of Domestic Waste (C17) | 0.1306 | % | + |
| Year | Obstacle Degree (%) | |||
|---|---|---|---|---|
| Ecological Environment Conditions | Eco-Economy | Ecological Livability | Ecological Civilization Development | |
| 2012 | 7.68 | 78.76 | 5.31 | 8.25 |
| 2015 | 7.64 | 76.33 | 7.37 | 8.66 |
| 2018 | 7.37 | 77.65 | 6.97 | 8.01 |
| 2021 | 9.13 | 80.26 | 6.73 | 3.88 |
| Average Data | 7.96 | 78.25 | 6.60 | 7.19 |
| County | Main Obstacles in 2012 (%) | Main Obstacles in 2021 (%) | ||||||||
|---|---|---|---|---|---|---|---|---|---|---|
| 1 | 2 | 3 | 4 | 5 | 1 | 2 | 3 | 4 | 5 | |
| Laishui | C9 | C10 | C6 | C15 | C2 | C9 | C10 | C6 | C8 | C2 |
| 29.89 | 29.34 | 18.46 | 5.79 | 3.65 | 28.75 | 27.22 | 17.53 | 6.10 | 3.84 | |
| Zhuozhou | C9 | C10 | C6 | C15 | C7 | C9 | C10 | C6 | C5 | C7 |
| 28.47 | 19.25 | 13.98 | 7.90 | 5.14 | 29.22 | 16.54 | 13.05 | 9.14 | 5.65 | |
| Huailai | C9 | C10 | C6 | C15 | C17 | C9 | C10 | C6 | C5 | C15 |
| 32.25 | 29.94 | 13.54 | 7.24 | 4.10 | 27.39 | 26.97 | 15.45 | 7.73 | 7.01 | |
| Zhuolu | C9 | C10 | C6 | C8 | C15 | C10 | C9 | C6 | C8 | C15 |
| 26.36 | 25.71 | 13.60 | 7.66 | 5.95 | 24.89 | 24.66 | 15.39 | 6.80 | 6.16 | |
| Chicheng | C9 | C10 | C8 | C6 | C5 | C9 | C10 | C6 | C8 | C5 |
| 22.88 | 22.52 | 13.30 | 10.40 | 9.71 | 24.56 | 24.41 | 14.58 | 11.18 | 10.48 | |
| Xinglong | C9 | C10 | C8 | C6 | C7 | C9 | C10 | C8 | C6 | C7 |
| 24.58 | 24.01 | 12.52 | 11.55 | 7.98 | 25.65 | 24.86 | 12.65 | 12.36 | 8.12 | |
| Luanping | C9 | C10 | C8 | C7 | C6 | C9 | C10 | C8 | C7 | C6 |
| 26.50 | 25.40 | 14.34 | 10.11 | 8.30 | 27.01 | 25.74 | 15.91 | 10.79 | 7.90 | |
| Fengning | C9 | C10 | C6 | C8 | C7 | C9 | C10 | C8 | C6 | C7 |
| 26.76 | 26.50 | 13.44 | 11.67 | 5.97 | 25.44 | 25.07 | 12.98 | 12.79 | 6.93 | |
| Gu’an | C9 | C10 | C6 | C8 | C7 | C9 | C10 | C6 | C5 | C8 |
| 25.01 | 21.92 | 14.12 | 13.34 | 5.10 | 29.19 | 15.99 | 11.90 | 11.66 | 5.90 | |
| Xianghe | C9 | C10 | C8 | C6 | C7 | C9 | C10 | C6 | C5 | C8 |
| 25.01 | 16.55 | 12.18 | 10.09 | 9.15 | 29.39 | 15.00 | 13.83 | 6.64 | 6.57 | |
| Dachang | C9 | C8 | C10 | C7 | C5 | C9 | C5 | C2 | C7 | C12 |
| 24.88 | 17.12 | 13.92 | 12.26 | 6.89 | 45.86 | 23.29 | 8.57 | 5.05 | 4.87 | |
| Sanhe | C9 | C8 | C7 | C5 | C2 | C9 | C6 | C7 | C5 | C2 |
| 27.83 | 16.57 | 15.74 | 8.93 | 5.98 | 30.12 | 14.97 | 9.50 | 8.54 | 6.68 | |
| Langfang Urban Area | C10 | C17 | C6 | C7 | C5 | C5 | C7 | C2 | C10 | C6 |
| 21.64 | 18.66 | 14.66 | 8.73 | 8.68 | 23.29 | 14.80 | 11.70 | 10.78 | 9.21 | |
| Year | Correlation Coefficients |
|---|---|
| 2012 | −0.4821 |
| 2015 | −0.5358 |
| 2018 | −0.5484 |
| 2021 | −0.5725 |
Disclaimer/Publisher’s Note: The statements, opinions and data contained in all publications are solely those of the individual author(s) and contributor(s) and not of MDPI and/or the editor(s). MDPI and/or the editor(s) disclaim responsibility for any injury to people or property resulting from any ideas, methods, instructions or products referred to in the content. |
© 2025 by the authors. Licensee MDPI, Basel, Switzerland. This article is an open access article distributed under the terms and conditions of the Creative Commons Attribution (CC BY) license (https://creativecommons.org/licenses/by/4.0/).
Share and Cite
Wang, Y.; Yang, J. Spatiotemporal Evolution and Obstacle Factor Analysis of Land Ecological Security in the Surrounding Areas of Beijing, China. Land 2025, 14, 457. https://doi.org/10.3390/land14030457
Wang Y, Yang J. Spatiotemporal Evolution and Obstacle Factor Analysis of Land Ecological Security in the Surrounding Areas of Beijing, China. Land. 2025; 14(3):457. https://doi.org/10.3390/land14030457
Chicago/Turabian StyleWang, Yutong, and Jianyu Yang. 2025. "Spatiotemporal Evolution and Obstacle Factor Analysis of Land Ecological Security in the Surrounding Areas of Beijing, China" Land 14, no. 3: 457. https://doi.org/10.3390/land14030457
APA StyleWang, Y., & Yang, J. (2025). Spatiotemporal Evolution and Obstacle Factor Analysis of Land Ecological Security in the Surrounding Areas of Beijing, China. Land, 14(3), 457. https://doi.org/10.3390/land14030457