Article

Study on the Probability of Meteorological-to-Hydrological Drought Propagation Based on a Bayesian Network

by
Xiangyang Zhang
1,
Huiliang Wang
1,
Zhilei Yu
1,*,
Dengming Yan
2,
Ruxue Liu
3,
Simin Liu
4,
Yujia Zhu
1,5,
Yifan Chen
6 and
Zening Wu
1
1
School of Water Conservancy and Transportation, Zhengzhou University, Zhengzhou 450001, China
2
Yellow River Engineering Consulting Co., Ltd., Zhengzhou 450003, China
3
Yellow River Conservancy Commission Hydrology and Water Resources Bureau of Henen, Zhengzhou 450003, China
4
China National Forestry-Grassland Development Research Center, Beijing 100714, China
5
Yanqing Water Authority of Beijing, Beijing 102100, China
6
Yellow River Conservancy Technical Institute, North China University of Water Resources and Electric Power, Kaifeng 475004, China
*
Author to whom correspondence should be addressed.
Land 2025, 14(3), 445; https://doi.org/10.3390/land14030445
Submission received: 16 January 2025 / Revised: 13 February 2025 / Accepted: 18 February 2025 / Published: 20 February 2025

Abstract

:
With accelerating climate change, droughts have increased in frequency and exerted a substantial influence on socioeconomic factors. Under conditions of insufficient precipitation and high temperatures, meteorological droughts have the potential to develop into more intense hydrological droughts, and the independent impact of temperature factors on drought propagation has not been considered separately. This study constructed a Standardized Temperature Index (STI) and, combined with time-series datasets of standardized indices of precipitation and runoff (SPI and SRI), based on Bayesian network principles, analyzed the probabilistic characteristics of drought propagation from meteorology to hydrology due to the influence of single or dual factors in the Yiluo River Basin (1961–2020). It also explored the transmission mechanisms of temperature and precipitation that drive and affect meteorological and hydrological drought. The results showed that propagation of meteorological to hydrological droughts increased with rising temperatures, and the propagation probability to severe and extreme hydrological drought increased by approximately 5%. Under the most adverse circumstances (high temperature and precipitation shortage scenarios), the likelihood of meteorological droughts progressing into intense hydrological drought events rose to 80%. Increasing temperature is expected to lead to more severe hydrological droughts. This study offers a theoretical foundation for drought prevention and mitigation.

1. Introduction

The effective forecasting, mitigation, and management of drought are complicated due to its complex origins, prolonged durations, extensive geographical coverage, and multifaceted repercussions. Droughts exert significant impacts on ecological systems and socioeconomic development, often through protracted recovery [1,2], and thus cause extensive economic damage [3,4,5]. Conventional research asserts that meteorological droughts characterized by insufficient precipitation typically serve as the initial stage, followed by propagation into hydrological droughts characterized by reduced runoff, agricultural droughts characterized by crop yield reduction, and ecological droughts characterized by ecological environment damage, leading to greater societal and economic losses. The process by which water deficit signals are transmitted through various types of drought is often termed “drought propagation” [6,7]. Examining the transmission of meteorological droughts to other drought types is essential for improving drought prediction and early warning.
The Standardized Precipitation Index (SPI) and the Standardized Runoff Index (SRI), representing meteorological drought and hydrological drought, respectively, have been used in the field of drought propagation to examine the direct relationship between precipitation and runoff. These indicators are used to analyze the correlation and propagation of different drought types. For example, Zhou et al. constructed a new transfer index based on the SPI and SRI and developed a novel system for evaluating drought response times [8]. Zhang et al. evaluated the propagation risk and evolution relationship of meteorological and hydrological drought in the Luan River Basin [9]. Drawing upon precipitation and runoff data acquired from hydrological models, Wu et al. conducted a comprehensive analysis of drought characteristics worldwide and determined that, under global warming, certain regions will experience mitigated drought conditions due to increased precipitation but most areas will face exacerbated drought [10]. Wossenyeleh et al. utilized the SPI and SGI to characterize meteorological and groundwater drought, investigating the transmission dynamics from meteorological to groundwater drought [11]. These studies have significantly advanced the understanding of drought propagation in specific river basins. It is understood that hydrological drought typically follows a period of meteorological drought, with discernible seasonal variations in lag time and propagation thresholds. However, the direct influence of temperature on drought propagation has not yet been thoroughly examined.
An increasing body of research highlights the significant impact of temperature on the propagation of drought. Therefore, some researchers have incorporated potential evapotranspiration into the study of drought propagation using the SPEI (Standardized Precipitation Evapotranspiration Index). For instance, Bevacqua et al. utilized the SPEI to characterize meteorological drought and the SSI (Standardized Streamflow Index) to characterize hydrological drought and investigated the time frame for drought propagation and the recovery period [12]; Zheng et al. examined the spatiotemporal distribution of meteorological drought and hydrological drought based on the SPEI and SRI, analyzing their correlation and propagation mechanism [13]; Gu et al. proposed the concept of the drought risk propagation ratio based on the calculation of the SPEI and SRI, which could monitor the drought propagation process and reveal related risk transfer [14]; Shi et al. used the SPEI and SRI, analyzing the development trend of global long-term meteorological and hydrological drought and their response relationship [15]. The above study considered the influence of temperature in drought research by constructing a comprehensive drought index and other methods, but it did not independently explore temperature variables, lacking a comparison of drought propagation when considering temperature factors separately and when considering various factors comprehensively. The studies specifically examined the impact of temperature on drought propagation and explored the drought transition from meteorology to hydrology, considering the combined effects of temperature and precipitation.
Currently, the development of drought indices typically involves comprehensive consideration of various driving and influencing factors. However, temperature factors have not been considered separately, and research on the independent influence of temperature on drought propagation is insufficient. Global warming is projected to lead to an increase in both the frequency and severity of droughts [2,16,17,18]. Thus, it is advantageous to capture the direct influence of temperature on drought by directly integrating temperature in the formulation of a drought index. The aims of this study were to a) construct a Standardized Temperature Index (STI) with monthly mean temperature as the primary variable that will characterize meteorological drought induced by elevated temperatures and b) assess the probability of drought propagation from meteorology to hydrology due to the influence of singular or dual factors. This study uses the STI to quantify the impact of temperature factors on drought. By constructing a Bayesian network connecting the STI, SPI, and SRI, we examined the influence of temperature and precipitation on drought propagation and assessed drought propagation probability from meteorology to hydrology under the combined effects of both factors. This study aimed to address the current research gap in drought propagation, which often lacks specific consideration of temperature factors. Figure 1 provides the Research Method Roadmap for this study.

2. Study Area Profile and Data Sources

The Yiluo River, an important tributary of the Yellow River, flows through the provinces of Shanxi and Henan, encompassing a basin area of 18,881 km2. It is primarily formed by the Luo and Yi Rivers, with the main stream stretching 446.9 km, while the Yihe River branch extends for 264.8 km. The annual average runoff amounts to 3.51 billion m3 [19]. The hydrological control station is Heishiguan station, which regulates a drainage area of 18,563 km2 [20]. The annual average temperature of this basin is 10 to 13 °C. The monthly mean temperature is from 17 to 20 °C in the hottest month and 5 to 7 °C in the coldest month [21]. Driven by the East Asian summer monsoon, the precipitation demonstrates pronounced seasonal variability. The majority of the total annual precipitation (60%) occurs during the flood season, spanning from July to October. Consequently, the risk of flooding is high during summer, whereas droughts are more likely to occur in other seasons [20,22]. The temperature has gradually increased in recent years in the Yiluo River Basin, while precipitation has decreased slightly [23]. Consequently, it is of practical significance to investigate the influences of temperature and precipitation on the emergence and spread of droughts within the basin. The geographical locations are shown in Figure 2.
The precipitation data utilized in this study were derived from three meteorological stations within the Yiluo River Basin: Lushi, Luanchuan, and Mengjin, encompassing daily precipitation records spanning the period from 1961 to 2020. The data were sourced from the National Meteorological Center (https://www.cma.gov.cn/, accessed on 30 December 2023). Temperature data were collected from both the basic meteorological stations (Lushi Station, Luanchuan Station, Mengjin Station) and general stations (Gongyi Station, Yanshi Station, Yichuan Station, Xin’an Station, Yiyang Station, Songxian Station, Luoning Station, Mianchi Station, Luonan Station). These data included monthly temperature records spanning 1961–2020, sourced from the GPRChinaTemp1km Grid dataset [24]. Runoff data for the Yiluo River Basin were collected from the hydrological control station, the Heishiguan station. This dataset comprised monthly runoff records from 1961 to 2020.

3. Research Method

3.1. Construction of Drought Index

The SPI, developed by McKee et al., has been recognized by the World Meteorological Organization as a reliable tool for evaluating meteorological drought [25]. This index offers the advantages of multi-timescale computations, straightforward calculations, and readily accessible data, making it a widely used tool in drought research [26,27,28].
In this study, following the construction concept of the SPI, the STI was developed to characterize the basin’s overall temperature. The primary construction approach is as follows: presuming that the average temperature during a specific period represents a random variable x, and the function f(x) represents the probability distribution function that provides the best fit, then for the average temperature x0, the probability of random event xx0 is given by
F x x 0 = 0 x 0 f x d x
The probability value obtained from Equation (1) was substituted into the standardized normal distribution function as follows:
F x x 0 = 1 2 π 0 x 0 e z 2 2 d z
From Equation (1) to Equation (2) is the process of standardizing the original distribution, and the probability value derived from Equation (1) is taken into the standardized normal distribution function of Equation (2). Here, a new variable z is introduced in Equation (2), and the z value obtained by the normal distribution inverse operation is the drought index value.
Based on Equation (2), the z (STI) value can be obtained by applying the inverse operation of the standard normal distribution. To meet algorithmic requirements and enhance the resilience of the model to outliers, the STI was discretized in this study. This study employed the widely used equal-frequency discretization method, a technique commonly used by statisticians for data analysis [29,30]. This approach involved segmenting data intervals based on the frequency distribution of the data, resulting in a uniform data distribution and more effective representation of different temperature levels. In previous studies, several scholars adopted similar methodologies for drought categorization [31]. Accordingly, this study refers to the aforementioned research and categorizes the STI by employing an equal frequency discretization approach based on the empirical CDF of the STI, as illustrated in Figure 3. Consequently, the STI was divided into three categories representing low, moderate, and high temperatures within the basin. Here, a low temperature condition (STI lower than −0.62) benefits the ecosystem. It slows down organisms’ metabolic rates, conserves resources, and reduces evaporation. A moderate temperature condition (−0.62 ≤ STI ≤ 0.69) is a transition phase. The rising temperature compared to the low-temperature state can accelerate evaporation, causing water stress on plants and soil. Prolonged moderate-temperature conditions may disrupt the ecosystem balance and biodiversity. A high temperature condition (STI greater than 0.69) is highly threatening. It causes rapid evaporation, leading to water shortages and increased drought risks. High temperatures can also degrade soil structure and disrupt the ecological environment. In summary, an STI lower than −0.62 indicates low temperature; −0.62 ≤ STI ≤ 0.69 indicates moderate temperature; and an STI greater than 0.69 indicates high temperature.
The SRI calculated using runoff is a concrete reference for construction based on the calculation idea of the SPI [32,33]. In the present study, the SPI, STI, and SRI were employed to characterize the overall precipitation, temperature, and runoff in the basin, respectively. The division of drought levels based on the SPI and SRI is shown in Table 1.
In the calculation of the drought index, due to uncertainty regarding the optimal distribution function for the original data, an initial distribution function fitting optimization was performed on the original data. Ten distribution functions (Normal, Exponential, Gamma, Generalized pareto (GP), Extreme value, Weibull, Generalized extreme value (GEV), Loglogistic, Lognormal, Stable) were chosen to fit the normalized precipitation, temperature, and runoff data. The Akaike Information Criterion (AIC)/Bayesian Information Criterion (BIC) and Kolmogorov–Smirnov (K–S) tests are commonly used statistical methods for examining the goodness of fit of data [34,35,36]. By using these methods, we can find the most suitable probability distribution functions for precipitation, temperature, and runoff data, which can reflect the characteristics of the data most accurately. This also provides us with sufficient reasons to select the most appropriate distribution functions to fit these respective data and proceed with the next-step calculations.

3.2. Meteorological and Hydrological Drought Identification

The run theory proposed by Yevjevivich [37] is frequently employed to identify disaster events. When the drought index falls below a predefined threshold, which is generally set at −0.5, and the duration surpasses a certain threshold length, drought events occur. Currently, this approach is widely utilized to identify drought events, enabling the characterization of aspects such as start times, end times, severity, and intensity of drought events [38,39,40]. Hence, our method employs run theory, utilizing the SPI, STI, and SRI independently to delineate three distinct drought scenarios. These three different drought scenarios are expressed as a low-precipitation meteorological drought (L-PMD) scenario, a high-temperature meteorological drought (H-TMD) scenario, and a low-runoff hydrological drought (L-RMD) scenario.

3.3. Meteorological Drought and Hydrological Drought Matching

Before examining drought propagation, it is crucial to synchronize meteorological and hydrological drought events. The synchronicity of meteorological drought and hydrological drought can lead to adverse conditions such as accelerated drought propagation and increased drought intensity and duration. Currently, various matching methods have been proposed to align these events [41,42]. Meteorological and hydrological drought events exhibit one-to-one or one-to-many correspondence. This suggests that if another type of drought occurs during a drought event, or if the time gap between meteorological drought and hydrological drought is less than one month, these events are considered to be matched, indicating the spread of meteorological to hydrological drought. If the time interval is greater than one month, it does not conform to the normal pattern of rapid spread of drought, which may indicate that there are other special factors at play. In most conventional cases, the correlation between the two is relatively close within a month, which is more in line with the normal response law of hydrological systems to meteorological drought and is also more conducive to accurately grasping the development and propagation trends of drought.

3.4. Propagation Probability of Meteorological to Hydrological Drought Based on Bayesian Networks

Bayesian networks, introduced by Pearl (1988), have gained prominence in recent years as a focal point of research. Bayesian networks represent the conditional probability relationships among different random variables using probability network diagrams. The connections between any two or three variables can be established using the Bayesian formulas in Equations (3) and (4). Bayesian networks offer an intuitive means of visualizing probabilistic relationships between events, which is defined as the probability of drought propagation in this context. Bayesian networks effectively convey the propagation probability characteristics of meteorological and hydrological droughts. For the detailed analysis process utilizing Bayesian networks, reference can be found in previous research [43,44].
P Z z X x = P Z z , X x P X x
P Z z X x , Y y = P Z z , X x , Y y P X x , Y y
A Bayesian network was developed using the values of the drought indices and severity for each of the three drought types. Circular nodes denote random variables, while arrows signify conditional dependencies. Precipitation shortage (SPI) and drought severity, as well as abnormally high temperature (STI) and drought severity, are considered conditions, whereas hydrological drought severity (SRI) serves as the outcome. Following the Bayesian network calculation process, the posterior distribution of the hydrological drought severity (SRI) was derived. This distribution represents the probability of hydrological drought occurrence under different temperature and precipitation conditions after correcting for the sample information. Netica software (Version 5.18) was employed for the Bayesian network calculations in this study.

3.5. Heuristic Segmentation

Galvan (2001) proposed a heuristic segmentation method, referred to as the BG algorithm, which is capable of evaluating the stationarity of a sequence, identifying mutation points, and dividing non-stationary sequences into distinct stationary subsequences. When compared with other similar tests, such as the moving t-test, which is sensitive to data distribution, and the LePage test, which requires more complex calculations, the BG algorithm, with its simple implementation and high-accuracy results, is evidently more practical and objective [45]. It can effectively identify mutations and can precisely segment data even when noise exists, and its performance remains stable regardless of the time-series length [46]. This study employed the BG algorithm to assess the mutability of the research sequence and investigate alterations in hydrological drought before and after the mutation. The detailed procedure of this algorithm can be found in the relevant literature [22].

4. Results

4.1. Propagation Probability of Meteorological to Hydrological Drought Based on the Drought Index

Since the drought index is derived from continuous sequence data, it reflects the overall hydrological conditions, encompassing both drought and wetness; that is, it assesses and classifies the drought and wetness conditions of the watershed from a holistic perspective. Therefore, from the perspective of the drought index, the probability of the occurrence of hydrological drought at different levels under different precipitation and temperature conditions from a macroscopic and holistic perspective explains the influence of precipitation and temperature factors on the process of drought propagation.

4.1.1. Calculation and Monthly Variation of the Drought Index

First, distribution functions were fitted to the runoff, temperature, and precipitation data. Figure 4 shows the fitting results, and the goodness of fit evaluated using the AIC (Akaike Information Criterion) and BIC (Bayesian Information Criterion) is listed in Table 2. According to the fitting results, Gamma, GP, and Stable distributions were selected for the distributions of precipitation, temperature, and runoff, respectively. We further used the K–S (Kolmogorov–Smirnov) test to determine whether the data samples obey the selected distribution function. The test results showed that the critical value D (720, 0.05) = 0.0506 was obtained according to the sample number and significance level, while the test statistic D based on precipitation, temperature, and runoff data was 0.0251, 0.0356, and 0.0278, respectively, all of which were lower than the critical value of 0.0506. At a 0.05 significance level, the results indicate that all three data satisfy the null hypothesis, which is subject to the chosen distribution function. After applying the AIC/BIC information criteria and the K–S test, the results show that the Gamma distribution performs best in fitting the precipitation data. Since precipitation data usually exhibit non-negative and skewed distribution characteristics, the Gamma distribution can well match these properties. For the temperature data, the GP distribution stands out among many candidate distributions. It has significant advantages in simulating extreme values in temperature data, and extreme values are crucial for temperature analysis. In the processing of the runoff data, the Stable distribution shows a high degree of matching with the characteristics of the runoff data through testing. Due to the heavy-tailed distribution and complex statistical characteristics often presented in runoff data, the unique properties of the Stable distribution make it an ideal choice for describing runoff data.
To achieve a more precise identification of drought events and explore short-term changes in drought conditions, all the indices employed in this study were computed on a monthly timescale. The calculation results are presented in Figure 5. The SPI and STI exhibited relatively substantial periodic fluctuations, with the STI exhibiting a more pronounced trend. These patterns align with the climatic characteristics of the temperate monsoon climate in the basin, which is characterized by four distinct seasons and uneven precipitation distribution throughout the year. Figure 5 demonstrates an intensified hydrological drought situation after 2000, suggesting abrupt changes in the meteorological conditions during that period. Figure 6 shows the data distribution and probability density of the three drought indices. The distributions of the SPI and STI are concentrated within the range of 3 to −3. Both the SPI and SRI exhibit relatively concentrated distributions, yet the SRI has larger extreme values. Meteorological drought and hydrological drought are mostly mild situations; however, under the combined influence of temperature and precipitation, more severe hydrological droughts may occur.

4.1.2. Probability of Hydrological Drought Under a Single Factor

In the univariate analysis, the influences of temperature and precipitation on hydrological drought were analyzed separately. The probabilities of hydrological drought occurrence at all levels were determined under varying precipitation and temperature conditions. The results, shown in Figure 7a, demonstrated that when considering precipitation alone, as the precipitation shortage deepens, the meteorological drought caused by the precipitation shortage becomes increasingly severe, causing a significant increase in the probability of propagation. With the aggravation of meteorological drought, the chances of having no hydrological drought or light hydrological drought showed a downward tendency. By contrast, the probabilities for middle, severe, and extreme hydrological drought situations increased. The probability of severe hydrological drought was very similar to that of extreme hydrological drought and gradually increased by 2–4% for each level of meteorological drought severity. When considering temperature alone, as depicted in Figure 7b, the probabilities of various levels of hydrological drought under low-, moderate-, and high-temperature conditions were as follows: extreme ≈ severe < middle < light < no. Under moderate-temperature conditions, the blue line indicating “No hydrological drought” was observed to be approximately 63%. This means that the probability of hydrological drought occurrence under such conditions was relatively the lowest, at approximately 37%. The probability of hydrological drought increased under low- and high-temperature conditions but was higher under low temperatures (approximately 47%) than high temperatures (42%). However, as the temperature increased, the probability of severe and extreme hydrological drought increased, with high temperatures leading to an increase in the probability of approximately 5% compared to low temperatures. This suggests that increased temperatures facilitate the propagation of meteorological droughts to more severe hydrological drought levels [47].

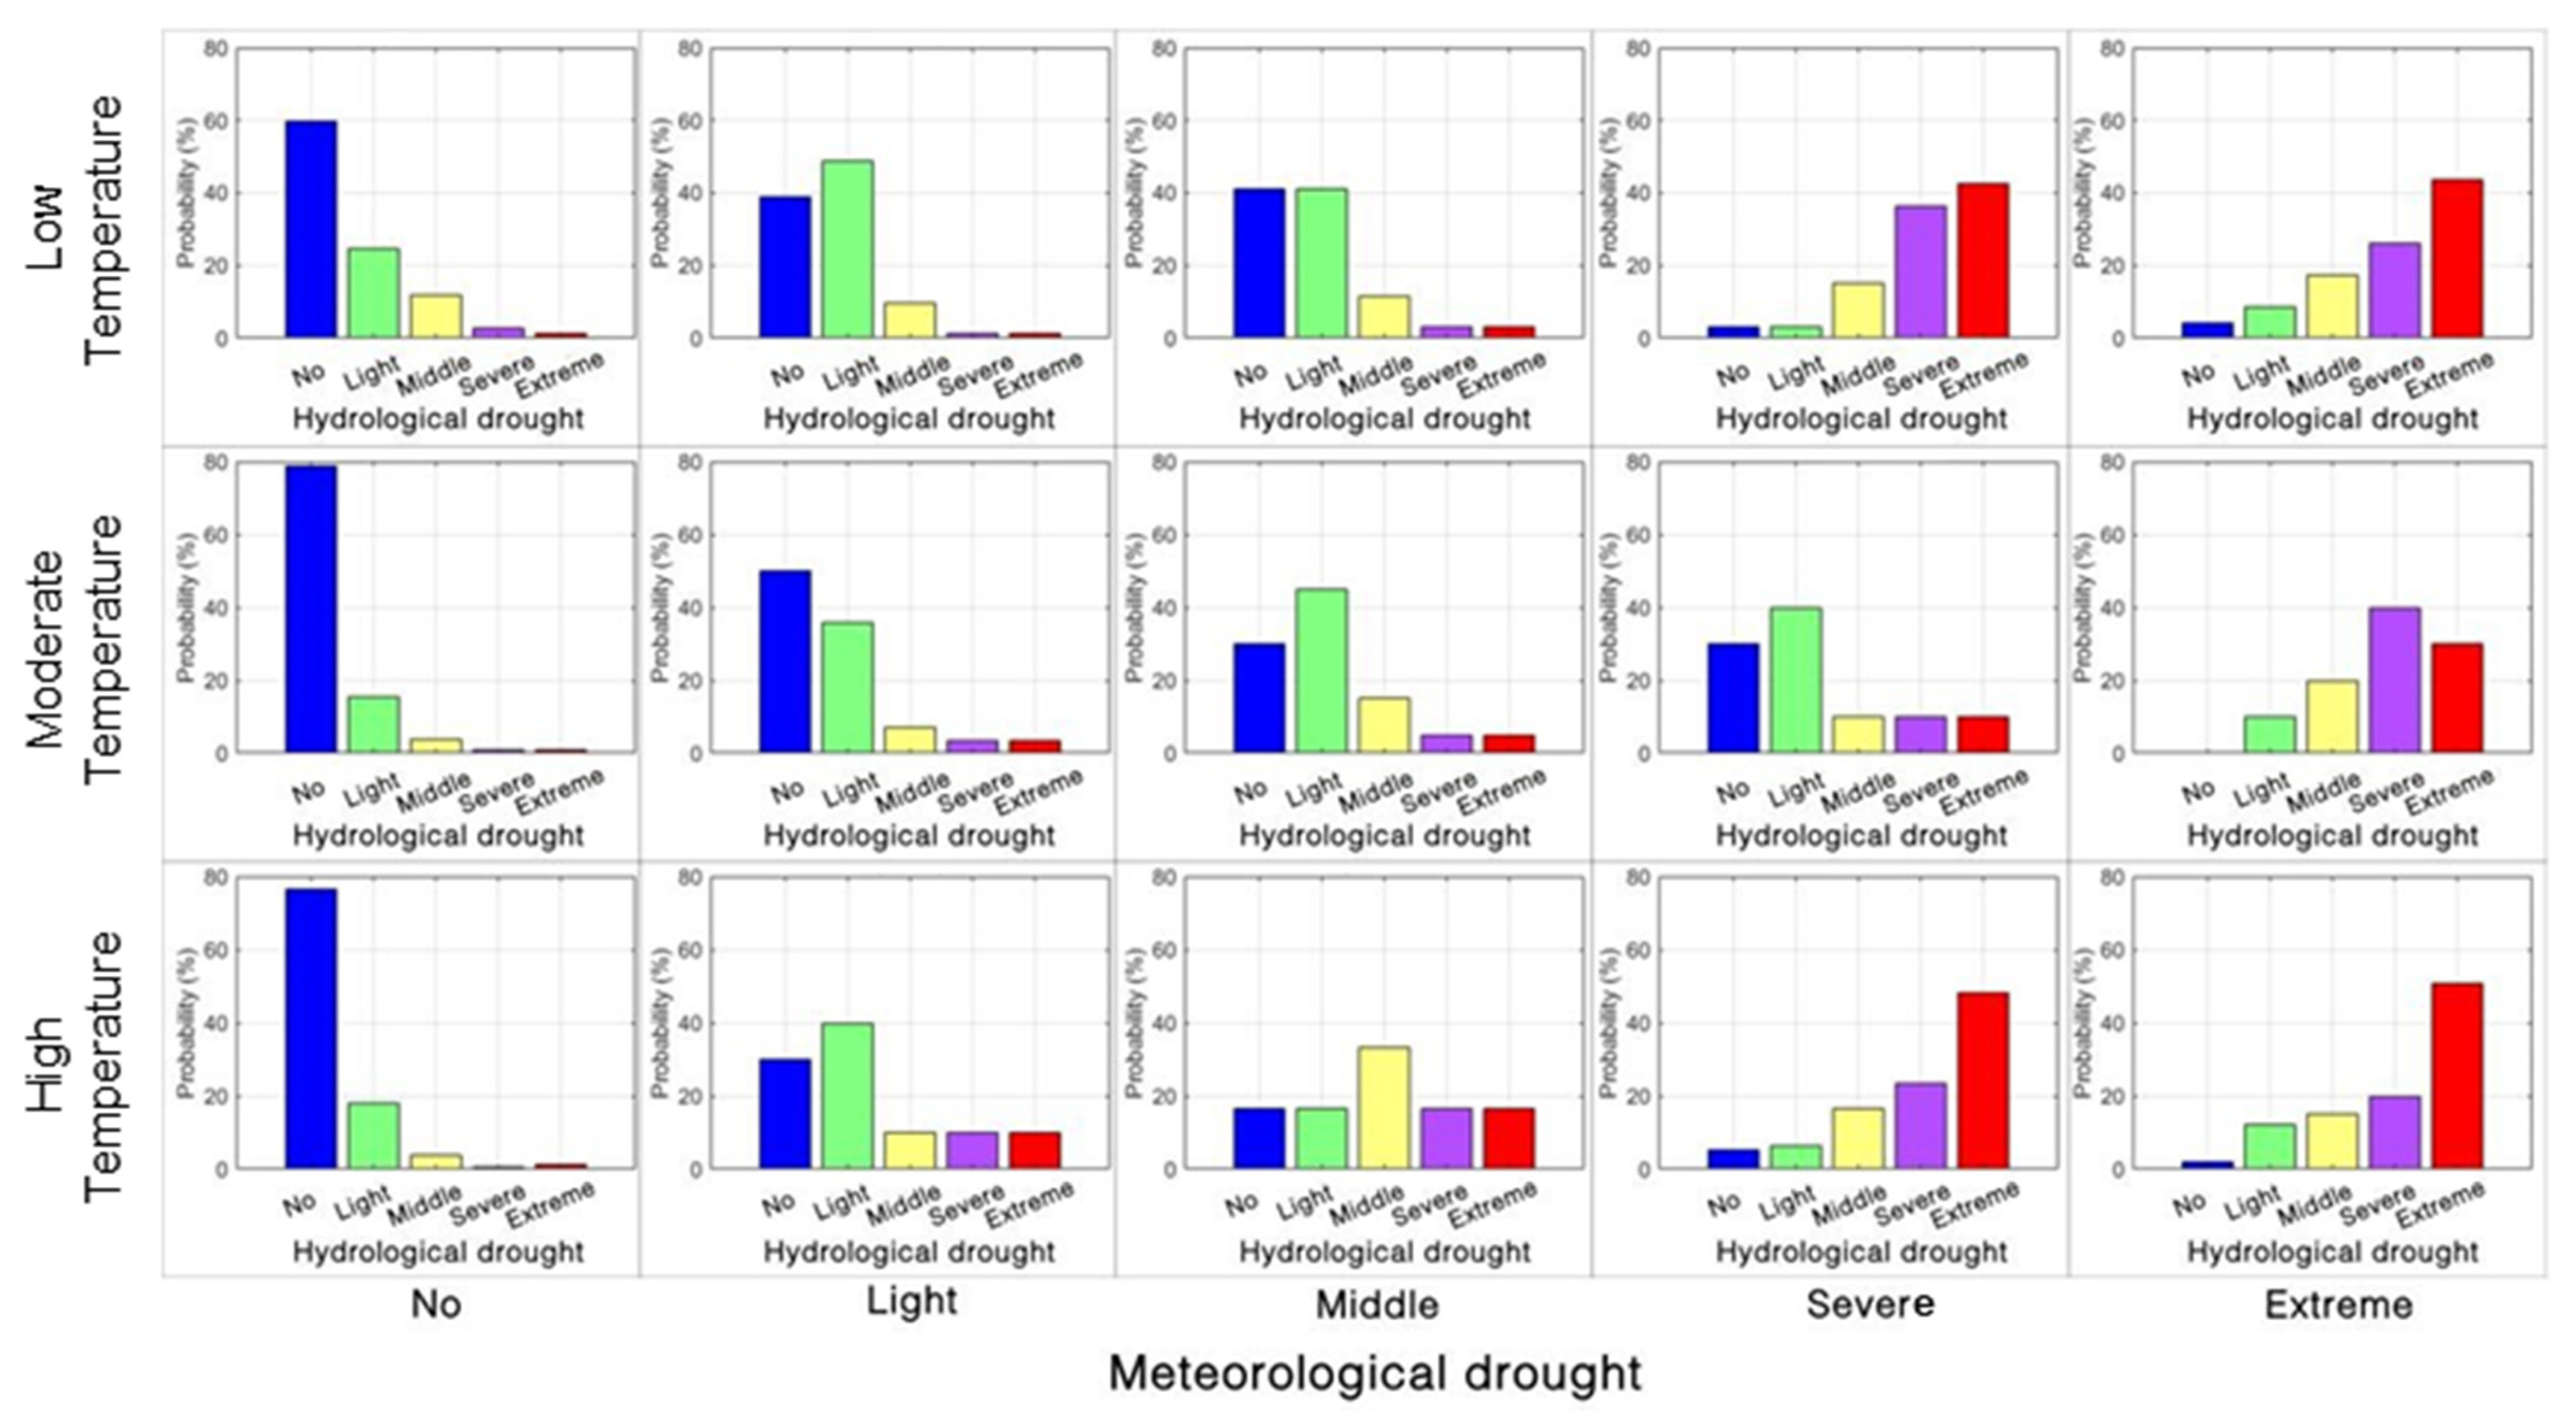
4.1.3. Probability of Hydrological Drought Under the Influence of Two Factors

This study demonstrates the influence of precipitation and temperature on the probability of hydrological drought. Figure 8 shows the 15 conditions determined by various combinations of precipitation deficiency (no, light, middle, severe, and extreme) and temperature (low, moderate, and high). Under the combined influence of extreme precipitation deficiency and high temperatures, the probability of extreme hydrological drought was the highest, at approximately 46%. When precipitation was normal, temperature had a minimal impact on the probability of drought across all levels. However, during periods of precipitation scarcity, the likelihood of hydrological drought significantly increased, particularly under high-temperature conditions. For instance, in the case of severe precipitation deficiency, the probability of meteorological drought leading to extreme hydrological drought was approximately 5% higher under high temperatures than low temperatures. Furthermore, under the condition of middle meteorological drought, the probability of light hydrological drought significantly reduced from approximately 44% to 20%. This suggests that high temperatures worsen the impact of insufficient precipitation on hydrological droughts, significantly extending the duration and severity of drought events.

4.2. Propagation Probability of Meteorological to Hydrological Drought Based on Characteristics of Drought Events

Drought characteristics derived from drought indices and run theory can represent specific drought events in a basin. Focusing on these specific features of drought events, we examined the probability of hydrological droughts under various precipitation and temperature conditions from a localized perspective. This allowed us to elucidate the transmission probability of a low-precipitation meteorological drought (L-PMD) scenario and a high-temperature meteorological drought (H-TMD) scenario to hydrological drought events. Drought severity was determined by accumulating drought index values that remained below a predetermined threshold throughout the complete drought event, that is, the sum of the drought index values in a drought event. Different drought indices, such as the Standardized Precipitation Index (SPI) and the Standardized Runoff Index (SRI), are commonly used to quantify drought conditions. The SPI mainly focuses on precipitation anomalies, while the SRI is specifically designed to assess hydrological droughts by analyzing runoff data. By summing up the index values during a drought event, we can capture the overall intensity and duration of the drought. For instance, if the SRI values for each month of a drought event are −1, −1.5, −2, etc., the sum of these values will give us an indication of how severe the drought was over the entire period. Consequently, this study employed drought severity as a variable to quantify drought events and used the equal-frequency discrete method for drought severity classification [29,30]. The reclassified drought grades in Table 3 provide a more precise representation of the specific drought events.

4.2.1. Identification of Drought Events and Their Characteristics

Drought events were identified using run theory and drought characteristics were quantified based on drought index calculations. The annual distribution of meteorological drought events is presented in Table 4 and Table 5, representing the L-PMD scenario and H-TMD scenario, respectively. It can be observed that meteorological droughts caused by precipitation deficiency were primarily concentrated in the autumn and winter seasons, with drought events of longer duration and higher severity occurring mainly in October, November, and December, while drought events resulting from high temperatures were predominantly concentrated in summer, particularly in early May.
The distribution of the L-RMD scenario is presented in Table 6. Unlike meteorological drought events, hydrological drought events occurred in every season but were primarily concentrated in autumn and winter, exhibiting seasonal characteristics likely linked to the basin’s climatic features. Furthermore, the periods of severe hydrological drought events were concentrated in June, October, and November, which aligned with the frequency of severe meteorological drought events. It can be inferred that the severe hydrological drought events in June were propagated by an H-TMD scenario, whereas those in October and November were caused by an L-PMD scenario.
According to Table 4, Table 5 and Table 6, hydrological drought events demonstrated higher drought severity values and were more extreme than meteorological drought events. The impact of high temperatures cannot be ignored among the two main driving factors, precipitation and temperature, as high temperatures can trigger more severe hydrological drought events. For instance, the average severity of hydrological drought events in June and November was −5.17 and −5.68, respectively, which was higher than that of all other months, but according to the results of Welch’s t-test, as shown in Table 7, at a significance level of 0.05, the mean drought severity in June was not significantly different from other months, while the mean drought severity in November was significantly different from other months.

4.2.2. Probability of Monotype Meteorological Drought Scenario Propagation to Hydrological Drought Events

During the drought-matching process, hydrological drought is spread from four scenarios: an L-PMD scenario, an H-TMD scenario, both, or neither. The number of transmissions to hydrological drought were 29, 11, 13, and 1, respectively. Using Bayesian networks and matching the results of drought events, we extracted the characteristics of each event and calculated the probability of transmission of meteorological drought scenarios in two single types to hydrological droughts. When only the L-PMD scenario was considered, the probability of propagation to light hydrological drought events decreased by approximately 30% as the degree of the L-PMD scenario increased from light to severe, as shown in Figure 9a. Simultaneously, the probability of the propagation to severe hydrological drought events increased to 52%. As shown in Figure 9b, when the H-TMD scenario was the only factor considered, the probability of middle H-TMD scenario events propagating to light hydrological drought events was the highest, approaching 54%. In contrast, under light H-TMD scenario events, the probabilities of propagating into severe and middle hydrological drought events were relatively high, at approximately 37% and 50%, respectively. Moreover, the probability of severe H-TMD scenario events propagating to severe hydrological drought events was the highest, about 47%, which is about 10% and 33% higher than for light and middle temperature conditions, respectively. In summary, the probability of severe L-PMD scenario and H-TMD scenario events propagating into severe hydrological drought events was high.

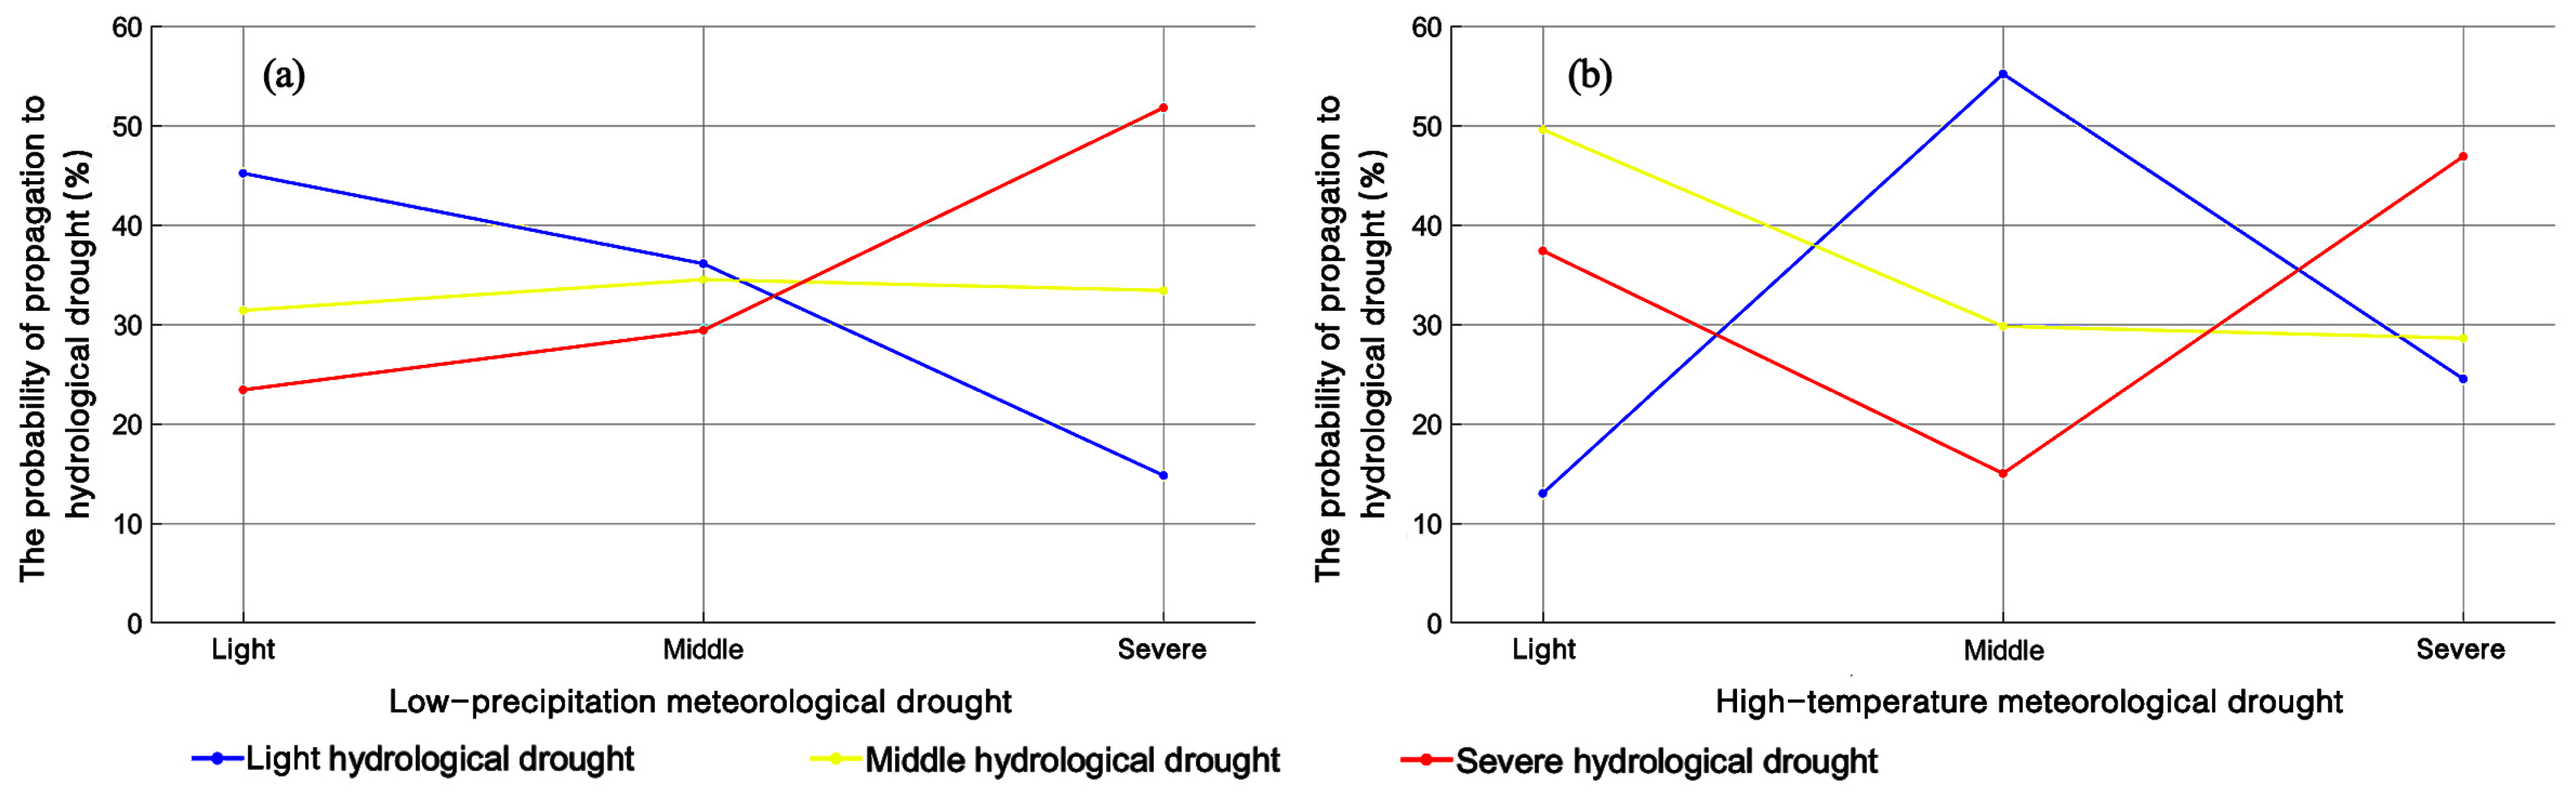
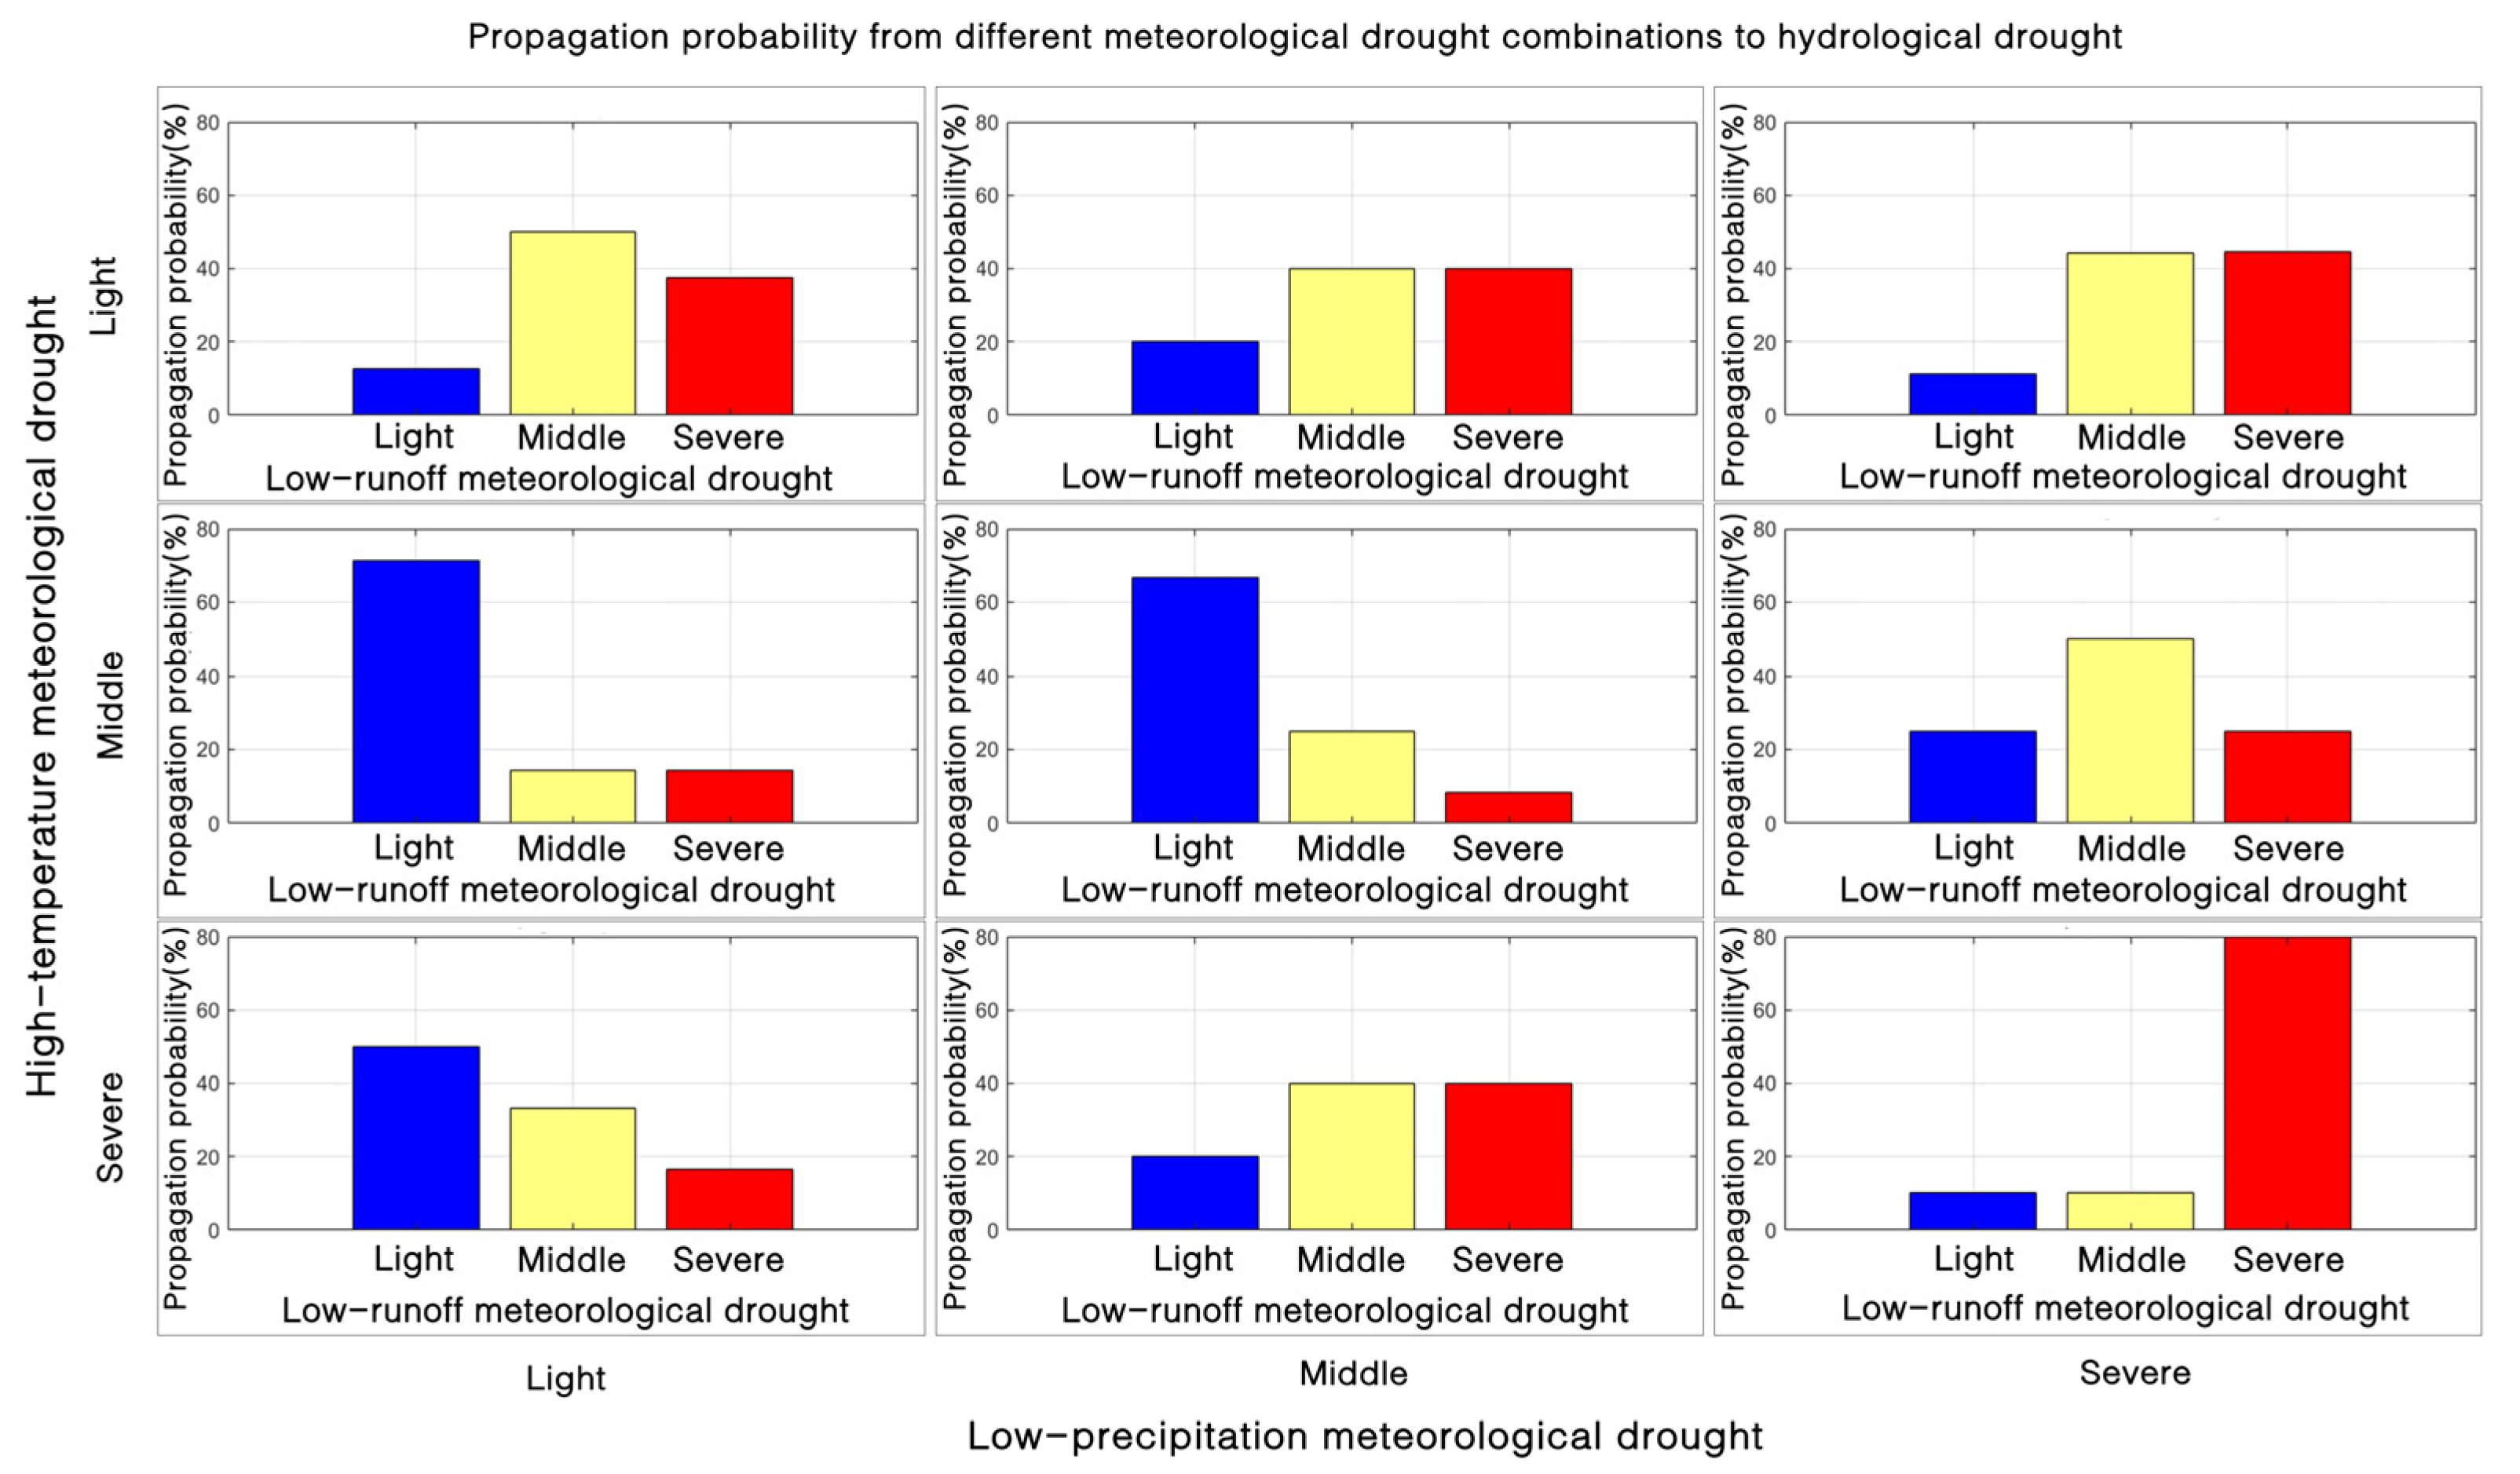
4.2.3. Probability of Dual-Type Meteorological Drought Scenario Propagation to Hydrological Drought Events

The probability of the propagation of low-precipitation and high-temperature combined meteorological drought scenario to hydrological drought events was analyzed, and the results are shown in Figure 10. The combined analysis of L-PMD (light, middle, and severe) and H-TMD (light, middle, and severe) scenarios resulted in nine possible combinations. The probability of middle L-PMD and H-TMD combined scenario events propagating to severe hydrological drought events was the lowest, about 7%. However, the probability of severe L-PMD and H-TMD combined scenario events propagating to severe hydrological drought events was the highest, about 80%. Under light L-PMD scenario events, the probability of middle and severe H-TMD scenario events propagating to severe hydrological drought events at all levels did not change much. However, under severe L-PMD scenario events, the probability of severe H-TMD scenario events propagating to severe hydrological drought events was about 55% higher than that for middle H-TMD scenario events. This aligns with previous calculations based on drought indices. This suggests that the primary cause of severe hydrological drought events was a combination of precipitation and temperature anomalies. The enhancing effect of high temperatures on hydrological drought was likely to occur following precipitation shortages, thereby exacerbating the hydrological drought situation, particularly in severe cases.

4.3. Hydrologic Drought Under Non-Stationary Meteorological Conditions

Global warming and climate change are on a continuous rise. This makes it extremely urgent to evaluate how changing meteorological conditions impact hydrological drought [48], especially considering the non-stationary nature of meteorological patterns. A significant number of studies have evaluated the impact of climate change on droughts and their propagation, via multi-model ensemble predictions and international coupled-model comparison programs. Most research outcomes indicate that drought conditions may intensify in the future [49,50]. Hence, this study employed a heuristic segmentation algorithm (the BG algorithm) to conduct abrupt change tests on meteorological factors (precipitation and temperature) [51]. Subsequently, the characteristics of hydrological drought before and after these abrupt changes were compared.

4.3.1. Meteorological Factors Abrupt Changes Test

The BG algorithm was employed to assess abrupt changes in the meteorological conditions. Annual average precipitation data spanning 1961 to 2020 were utilized for precipitation analysis, whereas annual average temperature data from 1961 to 2020 were used for temperature analysis. To ensure the robustness of the segmentation process, this study employed a statistical significance level of 0.05 and set a minimum segmentation scale of 10 years. The segmentation results are shown in Figure 11. The results indicate that despite cyclical fluctuations in precipitation within the basin over the past 60 years, with some notable deviations from the mean value in certain years, precipitation has generally maintained a stable long-term pattern without experiencing prolonged abrupt changes. In contrast, the annual average temperature within the basin exhibited an abrupt change around 1998, resulting in an overall temperature increase of approximately 0.6 °C post-1998 compared to the pre-1998 level. The detected abrupt change around 1998 is closely related to global climate trends. A strong El Niño event occurred that year, pushing the global average temperature to a new high at that time [52,53]. This abrupt change is consistent with the global warming trend, highlighting the sensitivity of the climate system under the combined effects of human activities and natural factors. Therefore, the alterations observed before and after the abrupt point in hydrological drought conditions may be primarily attributed to the influence of temperature factors.

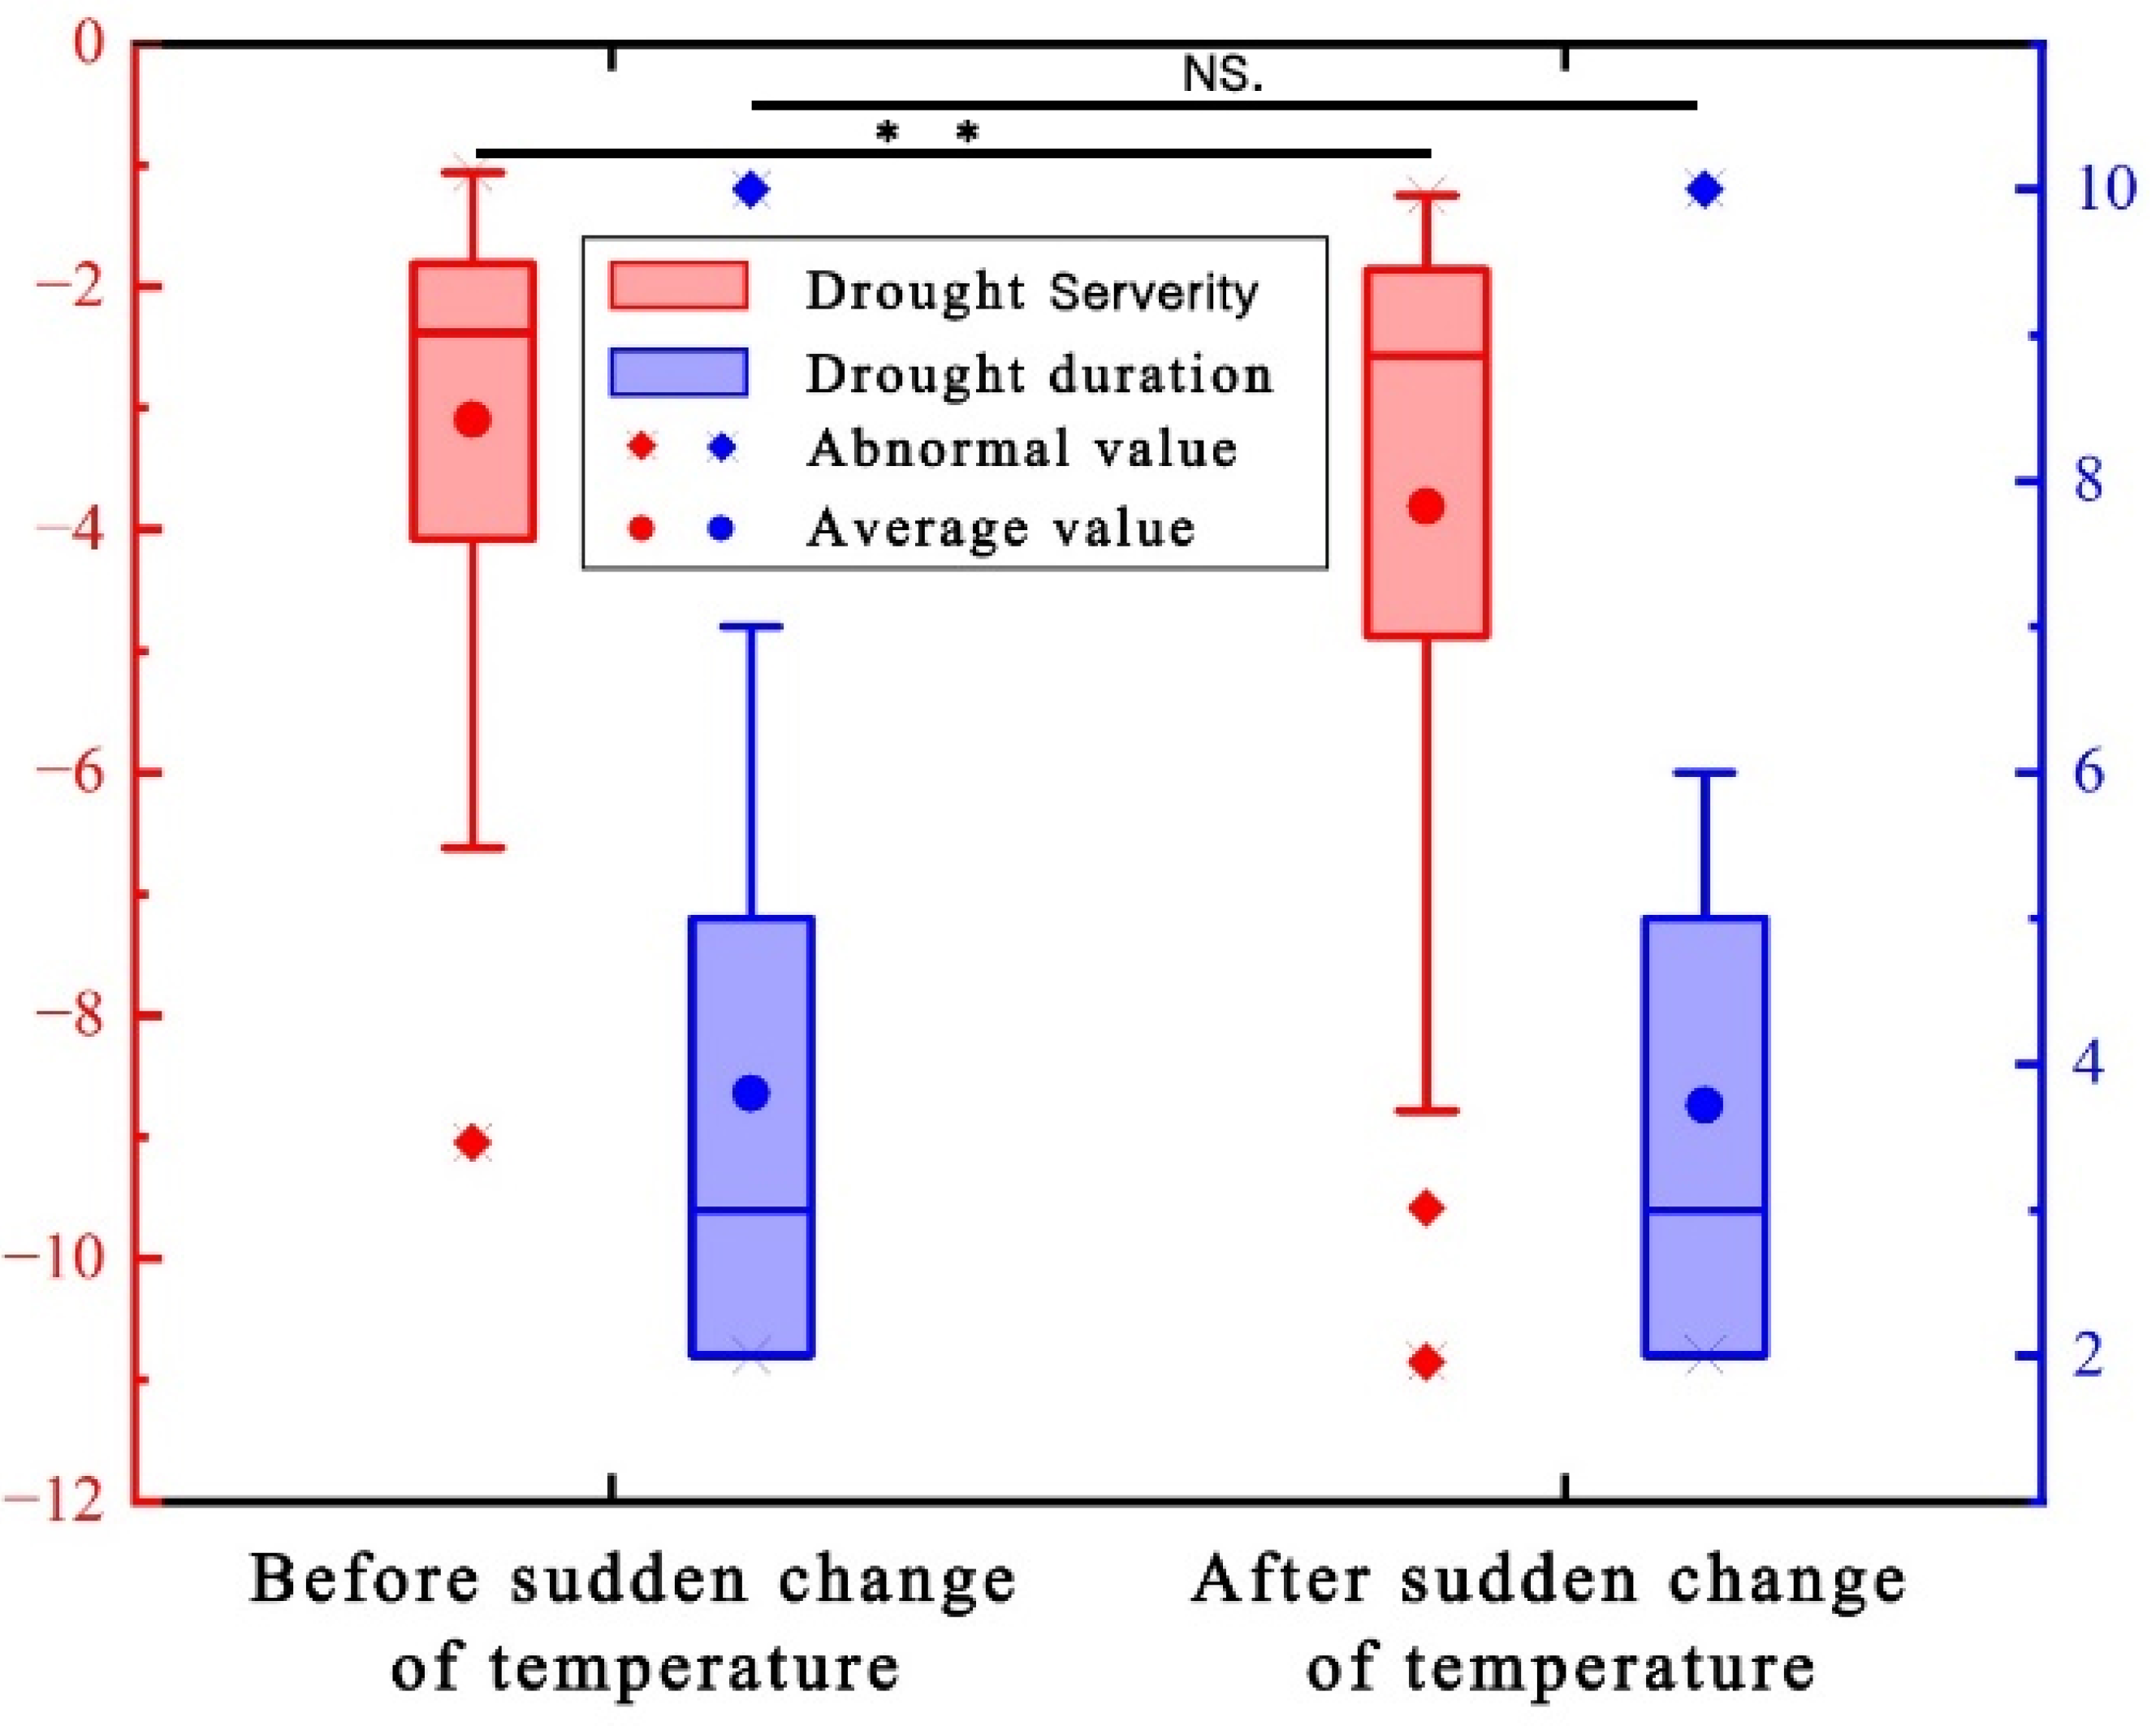
4.3.2. Hydrological Drought Characteristics Before and After Abrupt Changes in Meteorological Conditions

In this study, nodes representing abrupt changes in meteorological conditions were utilized to examine the hydrological drought conditions both prior to and following these abrupt changes in meteorological parameters. Table 8 presents the frequencies of hydrological drought events before and after the abrupt changes in meteorological conditions, highlighting a noticeable increase in the frequency of hydrological drought events triggered by high temperatures. Furthermore, the combination of precipitation deficits and abrupt changes in high temperatures increases the incidence of hydrological drought events. Figure 12 illustrates the alterations in specific hydrological drought event characteristics (drought severity and duration) before and after the abrupt climate change. The abrupt temperature change led to an increase in the average hydrological drought severity of 0.78. This suggests that although the duration of hydrological droughts may not change significantly, increasing temperatures may increase their severity. The lower limit of drought severity was lower after the mutation, and more possible outliers could be present, while the upper limit of drought duration was also lower after the mutation. These observations underscore the influence of temperature change on the occurrence of hydrological droughts. With the ongoing intensification of global warming, temperature plays a pivotal role in the initiation and propagation of droughts [47,54].

5. Discussion

5.1. Rationality and Applicability of the STI

Under the situation of climate alterations and global temperature increase, recognizing the role of temperature in the propagation of drought and quantifying its impact on drought facilitates a deeper understanding of the mechanism behind meteorological-to-hydrological drought propagation. Numerous scholars have identified the seasonal traits of drought propagation and examined the correlation between temperature and drought propagation [55,56]. Their findings indicate that temperature significantly impacts drought propagation. Consequently, this study constructed an STI to characterize the temperature status of the basin and identify drought events represented by high-temperature conditions. In real-world applications, the STI’s accurate identification of temperature-related drought events holds great promise. It can offer timely alerts for early warning systems, allowing local authorities to implement water conservation and emergency resource allocation. In resource management, understanding the temperature–drought relationship helps optimize water use for various sectors, and in climate adaptation, the insights from this study can guide the selection of drought-resistant crops and water system design.
In contrast to the SPEI or the Palmer Drought Severity Index (PDSI), which have been used in many studies, the use of the STI allows precipitation and temperature variables to be considered separately and the role of temperature factors in the process of meteorological and hydrological drought propagation to be analyzed quantitatively. Because the construction method of the STI refers to the SPI, the STI has the same advantages as the SPI, such as low data demand, simple calculation, and multiple timescales. Therefore, it can be applied to other river basins. The STI accurately identified the temperature conditions of the basin from the drought event identification results. The characteristic of the STI lies in analyzing the impact of temperature alone as a variable on meteorological drought and on the transmission from meteorological to hydrological drought. Consequently, compared with indices such as the SPEI and PDSI, the STI is more sensitive to the influence of temperature factors, enabling a clearer identification of the role of temperature factors in drought. Therefore, it is accurate and reasonable to use the STI to identify high-temperature events.

5.2. Importance of Temperature Factors

It is generally agreed that a lack of adequate precipitation increases the probability of hydrological droughts. The findings of the present study indicate that high temperatures also increase the probability of hydrological droughts. In particular, under conditions of insufficient precipitation, high temperatures significantly increase the probability of severe and extreme hydrological droughts [57]. This increases the risk of hydrological drought. For instance, in a study [58] on drought in southwest North America in the mid-12th century under abnormally high-temperature conditions, according to paleoclimatic evidence, the severity and duration of 12th-century droughts far exceeded those of subsequent droughts due to high-temperature conditions. Ultimately, this will have a serious adverse impact on agriculture, society, and the economy, which cannot be ignored. However, temperature variations did not significantly influence the occurrence of hydrological drought in the basin when precipitation and relative humidity levels were adequate. In addition, based on the impact of precipitation and temperature on the drought propagation probability characteristics, drought was more affected by precipitation, which is similar to the findings of previous research. However, the effects of high temperatures, exacerbated by global warming, on drought cannot be ignored [59]. We believe that during the transition from meteorological to hydrological drought, precipitation deficit was the primary factor, while elevated temperatures may exacerbate the intensity of hydrological droughts driven by precipitation deficiency. This finding has been corroborated by previous research [10,60]. In addition, some studies have suggested that an increase in temperature could lead to faster propagation of drought [61]. Currently, in the context of climate change and the corresponding intensification of the water cycle, sudden droughts have occurred, which can be divided into two types: high-temperature-driven and low-precipitation-driven. Studies on the two types of sudden droughts in China have shown that high-temperature-driven droughts mostly occur in southern China, whereas low-precipitation-driven droughts mostly occur in northern China [62]. The present study found that precipitation in the studied basin has remained at a relatively stable level for a long time, whereas the temperature suddenly increased, which was followed by increased frequency and intensity of compound droughts. [2] suggested that if greenhouse gas emissions are actively reduced, the risk of drought will be reduced. Therefore, in future drought research, more attention should be paid to temperature.

5.3. Research Limitations and Prospects

This study had certain limitations. The discretization of time-series data using equal-frequency binning may introduce a reduction in calculation accuracy, making it challenging to precisely quantify the impact of variations in precipitation and temperature. For instance, it is challenging to determine the exact increase in the probability of hydrological drought when the temperature rises by 1 °C. In addition, the limitation of this method is that it may overlook some outliers, such as extremely large or small values. However, in the analysis of meteorological and hydrological data, these outliers generally need to be removed to prevent them from affecting the overall characteristics of the data. Therefore, the limitation of this method has a relatively small impact on this study. Furthermore, this study focused solely on precipitation and temperature as the dominant factors in the meteorological-to-hydrological drought propagation process, overlooking other potential influencing factors such as human activities, land surface conditions, and remote correlations [18,63,64]. These potential influencing factors also have a certain impact on the research variables. For example, land-use change alters the underlying surface, affecting the water cycle and runoff. Changes in evapotranspiration, influenced by climate and vegetation, modify the water budget. Human water resource management regulates water resources through projects and policies. All of these interact with precipitation and temperature, jointly influencing the propagation from meteorological to hydrological droughts. Furthermore, while some scholars have studied the effects of temperature-related factors, such as elevation, radiation, and sunshine hours, on drought [35,65], this study did not delve into detailed discussions on these factors owing to space constraints. However, it can be speculated that factors positively correlated with temperature may exhibit similar patterns, and vice versa. Considering the impacts of more influencing factors on drought propagation is conducive to the accuracy and authenticity of the research, and it is the main content that we need to study in depth in the future. Hence, specific quantitative research on this topic requires further data analysis, potentially yielding intriguing results. Meanwhile, this study only considered the monthly time scale and the Yiluo River Basin in terms of the spatial scale. Greater spatial refinement and temporal diversification are conducive to improving the model accuracy and enhancing the rationality and comprehensiveness of the method. In addition, the characteristics of the Yiluo River Basin may have influenced the findings. However, the research methods employed in this study, such as constructing standardized indices [25], applying Bayesian network principles [43,44], and using the run theory [37], are well established and have been validated in numerous previous studies. This makes it possible to apply the research concepts to diverse river basins. Moreover, new methods can be developed in the next stage for comparative research. When discretizing continuous data, information loss generates uncertainty, which directly influences the calculation of propagation probabilities. If the discrete bins are too wide, the true data relationships are distorted, biasing the probability calculations. Conversely, overly narrow bins make the results overly sensitive and unstable. These inaccuracies in probability calculations reduce the predictive and explanatory power of models. For instance, in drought prediction, it may lead to misjudgments about the likelihood and severity of droughts, undermining the effectiveness of relevant strategies. To address these issues, future research should utilize continuous data for calculations and conduct multivariate analyses. This approach can provide a deeper understanding of the propagation from meteorological to hydrological droughts, enhancing the accuracy of models and contributing to more effective drought-prevention strategies. Moreover, drought propagation results from the propagation of water loss signals within the hydrological cycle and involves feedback effects within the cycle. For example, inadequate precipitation may lead to reduced surface water content, which, in turn, can result in reduced evaporation. The reduced evaporation in the feedback loop may further decrease precipitation. Some scholars [66] have argued that due to land–air feedback, self-propagating droughts are more likely to occur in arid regions, potentially exacerbating future droughts. While the influence of feedback effects on drought development and propagation is being increasingly considered in current research, there remains a gap in the quantitative analysis of the mechanisms behind these feedback effects, which should be addressed in future investigations. Meanwhile, future research could expand the scope by applying the method in different regions or incorporating new variables. This will likely enhance the study’s comprehensiveness and practical value. For example, the main approach of this study was to use Bayesian networks to establish the relationships among meteorological droughts caused by precipitation deficiency, meteorological droughts caused by abnormal temperatures, and hydrological droughts resulting from runoff deficiency. In other regions, especially those with longer time-series and more diverse and accurate data such as measured data and remote-sensing data, Bayesian networks with more dimensions can be constructed. This would be more conducive to exploring the natural and human factors influencing hydrological droughts in those regions. A concept similar to contribution rate can be proposed to represent the role of each factor in the occurrence of hydrological droughts. This will contribute to better guiding people on how to prevent the occurrence of hydrological droughts.

6. Conclusions

This study constructed a Standardized Temperature Index (STI). Based on Bayesian networks, the STI, SPI, and SRI were combined to quantify and consider the impact of precipitation and temperature on the characteristics of meteorological-to-hydrological drought propagation. The primary results were as follows:
(1)
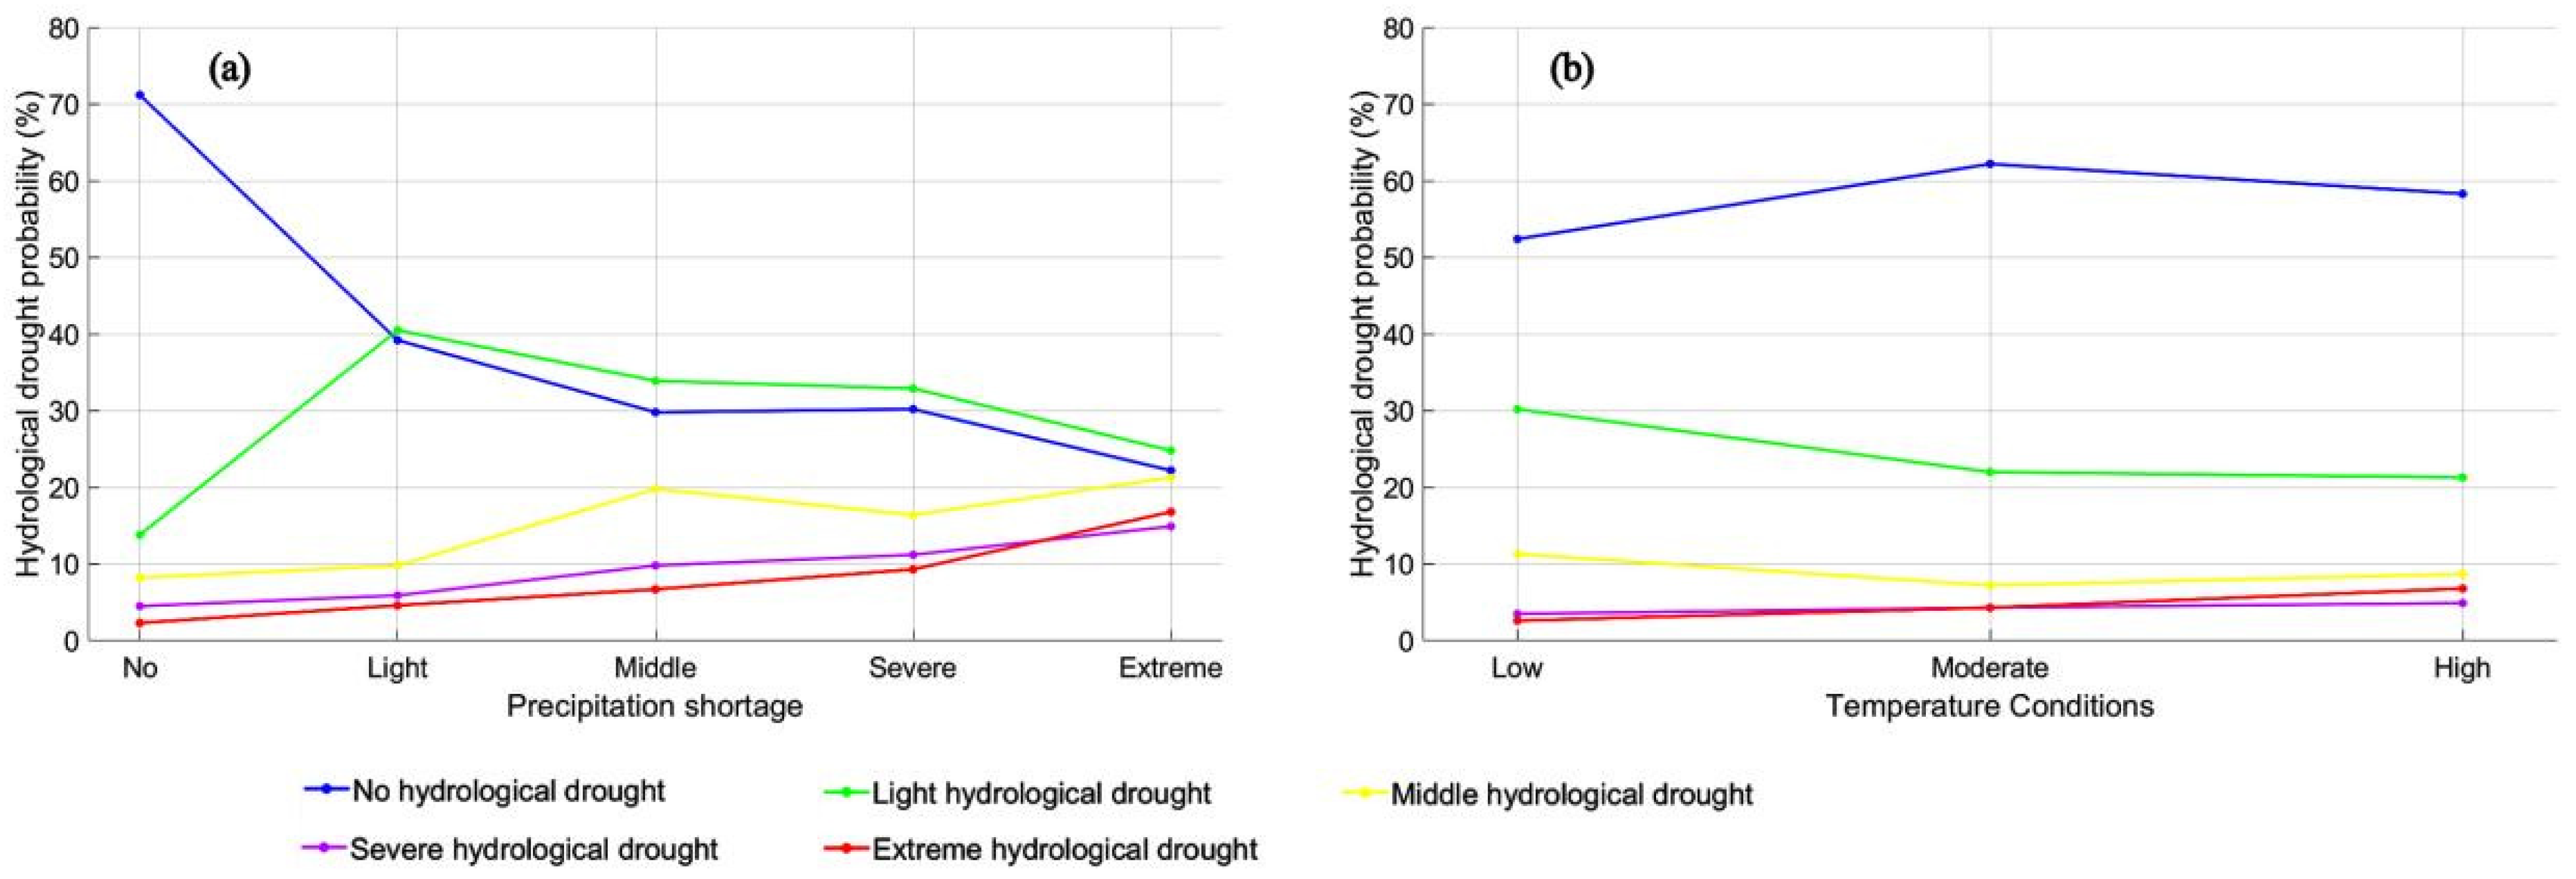
The probability of hydrological drought gradually increased as precipitation deficiency intensified, and the probability of light hydrological droughts diminished, whereas that of severe and extreme hydrological droughts increased by almost 10%. Rising temperature increased the probability of meteorological-to-severe/extreme-hydrological drought propagation by about 5%. Under the combined influence of extreme precipitation deficiency and high temperatures, the probability of meteorological droughts propagating into extreme hydrological droughts reached 46%.
(2)
The probability of a meteorological drought event propagating into a severe hydrological drought event increased with increasing of the level of the L-PMD scenario, hitting 52% under severe L-PMD scenarios. The drought propagation probability was lowest in middle H-TMD scenarios but rose when H-TMD scenarios were light or severe. Severe hydrological droughts were more common in severe H-TMD scenarios, making up about 47% of all droughts. Under the combined impact of severe L-PMD and H-TMD scenarios, the propagation probability to severe hydrological droughts surged to 80%.
(3)
Around 1998, the mean annual temperature abruptly rose by about 0.6 °C. After this abrupt change, hydrological droughts due to low precipitation and high temperatures became more frequent, with the average intensity increased by around 0.78.

Author Contributions

X.Z.: investigation, methodology, writing—original draft; H.W. and Z.W.: funding acquisition, project administration, supervision, conceptualization; Z.Y.: resources, validation, visualization; D.Y.: formal analysis, software; R.L. and Y.C.: data curation; S.L. and Y.Z.: writing—review and editing. All authors have read and agreed to the published version of the manuscript.

Funding

This research was funded by the National Science and Technology Major Project of the Ministry of Science and Technology of China (2023YFC3208605), the National Natural Science Foundation of China (52479029, 52109038, 52279028, 52209038), the Key Technologies Research and Development Program of China (2021YFC3000204), and Major Scientific and Technological Projects of Henan Province, China (201300311400).

Data Availability Statement

The datasets for precipitation and stream flow data from 1961 to 2020 for this study can be found at http://data.cma.cn/, http://www.nmic.cn/ (accessed on 30 December 2023) and https://doi.org/10.5194/essd-2021-267, and in the Hydrologic Yearbook of China.

Conflicts of Interest

Dengming Yan is employed by Yellow River Engineering Consulting Co., Ltd. The authors declare no conflicts of interest.

References

  1. Peterson, T.J.; Saft, M.; Peel, M.C.; John, A. Watersheds may not recover from drought. Science 2021, 372, 745–749. [Google Scholar] [CrossRef]
  2. Ault, T.R. On the essentials of drought in a changing climate. Science 2020, 368, 256–260. [Google Scholar] [CrossRef] [PubMed]
  3. Phillips, O.L.; Aragão, L.E.O.C.; Lewis, S.L.; Fisher, J.B.; Lloyd, J.; López-González, G.; Malhi, Y.; Monteagudo, A.; Peacock, J.; Quesada, C.A.; et al. Drought Sensitivity of the Amazon Rainforest. Science 2009, 323, 1344–1347. [Google Scholar] [CrossRef] [PubMed]
  4. Wang, C.; Linderholm, H.W.; Song, Y.; Wang, F.; Liu, Y.; Tian, J.; Xu, J.; Song, Y.; Ren, G. Impacts of Drought on Maize and Soybean Production in Northeast China During the Past Five Decades. Int. J. Environ. Res. Public Health 2020, 17, 10. [Google Scholar] [CrossRef] [PubMed]
  5. Zhang, X.; Wu, Z.; Wang, H.; He, C.; Zhang, F.; Zhou, Y. Urban meteorological drought comprehensive index based on a composite fuzzy matter element-moment estimation weighting model. iScience 2024, 27, 110798. [Google Scholar] [CrossRef] [PubMed]
  6. Li, Q.; Ye, A.; Zhang, Y.; Zhou, J. The Peer-To-Peer Type Propagation From Meteorological Drought to Soil Moisture Drought Occurs in Areas With Strong Land-Atmosphere Interaction. Water Resour. Res. 2022, 58, 14. [Google Scholar] [CrossRef]
  7. Tian, F.; Yang, J.; Liu, L.; Wu, J. Progress of research on the conception, characteristic, and influencing factors of drought propagation from the perspective of geographic sciences. Prog. Geogr. 2022, 41, 173–184. [Google Scholar] [CrossRef]
  8. Zhou, Z.; Shi, H.; Fu, Q.; Ding, Y.; Li, T.; Liu, S. Investigating the Propagation From Meteorological to Hydrological Drought by Introducing the Nonlinear Dependence With Directed Information Transfer Index. Water Resour. Res. 2021, 57, 21. [Google Scholar] [CrossRef]
  9. Zhang, X.; Xu, Y.; Hao, F.H.; Hao, Z.C. Characteristics and risk analysis of drought propagation from meteorological drought to hydrological drought in Luanhe River Basin. J. Hydraul. Eng. 2022, 53, 165–175. [Google Scholar]
  10. Wu, G.; Chen, J.; Shi, X.; Kim, J.; Xia, J.; Zhang, L. Impacts of Global Climate Warming on Meteorological and Hydrological Droughts and Their Propagations. Earths Future 2022, 10, 24. [Google Scholar] [CrossRef]
  11. Wossenyeleh, B.K.; Kasa, A.S.; Verbeiren, B.; Huysmans, M. Drought propagation in the hydrological cycle in a semiarid region: A case study in the Bilate catchment, Ethiopia. Hydrogeol. J. 2022, 30, 751–766. [Google Scholar] [CrossRef]
  12. Bevacqua, A.G.; Chaffe, P.L.; Chagas, V.B.; AghaKouchak, A. Spatial and temporal patterns of propagation from meteorological to hydrological droughts in Brazil. J. Hydrol. 2021, 603, 9. [Google Scholar] [CrossRef]
  13. Zheng, L.; Liu, Y.; Ren, L.; Zhu, Y.; Yin, H.; Yuan, F.; Zhang, L. Spatio-temporal characteristics and propagation relationship of meteorological drought and hydrological drought in the Yellow River Basin. Water Resour. Prot. 2022, 38, 87. [Google Scholar]
  14. Gu, L.; Chen, J.; Yin, J.; Xu, C.-Y.; Chen, H. Drought hazard transferability from meteorological to hydrological propagation. J. Hydrol. 2020, 585, 18. [Google Scholar] [CrossRef]
  15. Shi, H.; Zhou, Z.; Liu, L.; Liu, S. A global perspective on propagation from meteorological drought to hydrological drought during 1902–2014. Atmos. Res. 2022, 280, 10. [Google Scholar] [CrossRef]
  16. Sheffield, J.; Wood, E.F. Projected changes in drought occurrence under future global warming from multi-model, multi-scenario, IPCC AR4 simulations. Clim. Dyn. 2008, 31, 79–105. [Google Scholar] [CrossRef]
  17. Murray, V.; Ebi, K.L. IPCC Special Report on Managing the Risks of Extreme Events and Disasters to Advance Climate Change Adaptation (SREX). J. Epidemiol. Community Health 2012, 66, 759–760. [Google Scholar] [CrossRef]
  18. Zhang, X.; Hao, Z.; Singh, V.P.; Zhang, Y.; Feng, S.; Xu, Y.; Hao, F. Drought propagation under global warming: Characteristics, approaches, processes, and controlling factors. Sci. Total Environ. 2022, 838, 19. [Google Scholar] [CrossRef] [PubMed]
  19. Zhang, X.; Chen, P.; Han, Y.; Chang, X.; Dai, S. Quantitative analysis of self-purification capacity of non-point source pollutants in watersheds based on SWAT model. Ecol. Indic. 2022, 143, 12. [Google Scholar] [CrossRef]
  20. He, R.M.; Wang, G.Q.; Zhang, J.Y. Impacts of Environmental Change on Runoff in the Yiluohe River Basin of the Middle Yellow River. Res. Soil Water Conserv. 2007, 14, 297. [Google Scholar]
  21. Liu, X.; Dai, X.; Zhong, Y.; Li, J.; Wang, P. Analysis of changes in the relationship between precipitation and streamflow in the Yiluo River, China. Theor. Appl. Climatol. 2013, 114, 183–191. [Google Scholar] [CrossRef]
  22. Wang, H.; Zhu, Y.; Qin, T.; Zhang, X. Study on the propagation probability characteristics and prediction model of meteorological drought to hydrological drought in basin based on copula function. Front. Earth Sci. 2022, 10, 961871. [Google Scholar] [CrossRef]
  23. Liu, Q.; Yang, Z.; Cui, B.; Sun, T. Temporal trends of hydro-climatic variables and runoff response to climatic variability and vegetation changes in the Yiluo River basin, China. Hydrol. Process. 2009, 23, 3030–3039. [Google Scholar] [CrossRef]
  24. He, Q.; Wang, M.; Liu, K.; Li, K.; Jiang, Z. GPRChinaTemp1km: A high-resolution monthly air temperature dataset for China (1951–2020) based on machine learning. Earth Syst. Sci. Data Discuss 2021, 2021, 1–29. [Google Scholar] [CrossRef]
  25. McKee, T.B.; Doesken, N.J.; Kleist, J. The Relationship of Drought Frequency and Duration to Time Scales. In Proceedings of the Eighth Conference on Applied Climatology, Anaheim, CA, USA, 17–22 January 1993. [Google Scholar]
  26. Sorí, R.; Gimeno-Sotelo, L.; Nieto, R.; Liberato, M.L.; Stojanovic, M.; Pérez-Alarcón, A.; Fernández-Alvarez, J.C.; Gimeno, L. Oceanic and terrestrial origin of precipitation over 50 major world river basins: Implications for the occurrence of drought. Sci. Total Environ. 2023, 859, 160288. [Google Scholar] [CrossRef] [PubMed]
  27. Qiu, J.; Shen, Z.; Xie, H. Drought impacts on hydrology and water quality under climate change. Sci. Total Environ. 2023, 858, 159854. [Google Scholar] [CrossRef] [PubMed]
  28. Dabanlı, İ.; Mishra, A.K.; Şen, Z. Long-term spatio-temporal drought variability in Turkey. J. Hydrol. 2017, 552, 779–792. [Google Scholar] [CrossRef]
  29. Boulle, M. Optimal bin number for equal frequency discretizations in supervized learning. Intell. Data Anal. 2005, 9, 175–188. [Google Scholar] [CrossRef]
  30. Cao, F.; Ge, Y.; Wang, J. Spatial data discretization methods for geocomputation. Int. J. Appl. Earth Obs. Geoinf. 2014, 26, 432–440. [Google Scholar] [CrossRef]
  31. Zhou, Z.; Tu, X.; Wang, T.; Singh, V.P.; Chen, X.; Lin, K. Bivariate socioeconomic drought assessment based on a hybrid framework and impact of human activities. J. Clean. Prod. 2023, 409, 137150. [Google Scholar] [CrossRef]
  32. Niu, J.; Chen, J.; Sun, L. Exploration of drought evolution using numerical simulations over the Xijiang (West River) basin in South China. J. Hydrol. 2015, 526, 68–77. [Google Scholar] [CrossRef]
  33. Shukla, S.; Wood, A.W. Use of a standardized runoff index for characterizing hydrologic drought. Geophys. Res. Lett. 2008, 35, 7. [Google Scholar] [CrossRef]
  34. Rosenthal, R. An Application of the Kolmogorov-Smirnov Test for Normality with Estimated Mean and Variance. Psychol. Rep. 1968, 22, 570. [Google Scholar] [CrossRef]
  35. Wang, L.; Yu, H.; Yang, M.; Yang, R.; Gao, R.; Wang, Y. A drought index: The standardized precipitation evapotranspiration runoff index. J. Hydrol. 2019, 571, 651–668. [Google Scholar] [CrossRef]
  36. Burnham, K.P.; Anderson, D.R. Multimodel Inference:Understanding AIC and BIC in Model Selection. Sociol. Methods Res. 2004, 33, 261–304. [Google Scholar] [CrossRef]
  37. Yevjevich, V.M. An objective approach to definitions and investigations of continental hydrologic droughts. J. Hydrol. 1969, 7, 353. [Google Scholar] [CrossRef]
  38. Yang, M.; He, Z.; Zhang, L.; Pi, G.; You, M. Propagation Process of Meteorological Drought to Hydrological Drought in Different Time Scales. J. Soil Water Conserv. 2021, 35, 350–360. [Google Scholar]
  39. Wu, J.; Chen, X.; Yao, H.; Zhang, D. Multi-timescale assessment of propagation thresholds from meteorological to hydrological drought. Sci. Total Env. 2021, 765, 144232. [Google Scholar] [CrossRef] [PubMed]
  40. Wu, J.; Yao, H.; Chen, X.; Wang, G.; Bai, X.; Zhang, D. A framework for assessing compound drought events from a drought propagation perspective. J. Hydrol. 2022, 604, 12. [Google Scholar] [CrossRef]
  41. Guo, Y.; Huang, S.; Huang, Q.; Leng, G.; Fang, W.; Wang, L.; Wang, H. Propagation thresholds of meteorological drought for triggering hydrological drought at various levels. Sci. Total Environ. 2020, 712, 136502. [Google Scholar] [CrossRef] [PubMed]
  42. Liu, Y.; Huang, S.; Guo, Y.; Liu, Y.; Li, Z.; Huang, Q. Propagation threshold of meteorological drought to different levels of hydrological drought.A case study of Qinhe River basin. J. Hydroelectr. Eng. 2022, 41, 9–19. [Google Scholar]
  43. Wang, Z.; Huang, S.; Huang, Q.; Duan, W.; Leng, G.; Guo, Y.; Zheng, X.; Nie, M.; Han, Z.; Dong, H.; et al. Seasonal Propagation Characteristics from Meteorological to Hydrological Drought and Their Dynamics in the Headstreams of the Tarim River Basin. J. Hydrometeorol. 2022, 23, 1487–1506. [Google Scholar] [CrossRef]
  44. Sattar, M.N.; Lee, J.-Y.; Shin, J.-Y.; Kim, T.-W. Probabilistic Characteristics of Drought Propagation from Meteorological to Hydrological Drought in South Korea. Water Resour. Manag. 2019, 33, 2439–2452. [Google Scholar] [CrossRef]
  45. Liu, X.; Jia, C.; Chai, Y. A catastrophe identification method for rainfall time series coupled sequential Mann-Kendall algorithm and Bernaola Galvan algorithm: A case study of the Qinglong River watershed, China. Water Supply 2023, 23, 3205–3220. [Google Scholar] [CrossRef]
  46. Zhang, J.; Lan, Y.; Chen, X.; Tan, Y.; Wu, T.; Lyu, S.; Zhou, Y.; Zhang, Y.; Cheng, L.; Chen, Y.; et al. Baseflow characteristics and drivers in headwater catchment of the Yellow River, Tibetan Plateau. J. Hydrol. Reg. Stud. 2024, 56, 101991. [Google Scholar] [CrossRef]
  47. Teuling, A.J. A hot future for European droughts. Nat. Clim. Change 2018, 8, 364–365. [Google Scholar] [CrossRef]
  48. Milly, P.C.D.; Betancourt, J.; Falkenmark, M.; Hirsch, R.M.; Kundzewicz, Z.W.; Lettenmaier, D.P.; Stouffer, R.J. Climate change—Stationarity is dead: Whither water management? Science 2008, 319, 573–574. [Google Scholar] [CrossRef]
  49. Ukkola, A.M.; De Kauwe, M.G.; Roderick, M.L.; Abramowitz, G.; Pitman, A.J. Robust Future Changes in Meteorological Drought in CMIP6 Projections Despite Uncertainty in Precipitation. Geophys. Res. Lett. 2020, 47, 9. [Google Scholar] [CrossRef]
  50. Depsky, N.; Pons, D. Meteorological droughts are projected to worsen in Central America’s dry corridor throughout the 21st century. Environ. Res. Lett. 2021, 16, 14. [Google Scholar] [CrossRef]
  51. Bernaola-Galván, P.; Ivanov, P.C.; Amaral, L.A.N.; Stanley, H.E. Scale invariance in the nonstationarity of human heart rate. Phys. Rev. Lett. 2001, 87, 168105. [Google Scholar] [CrossRef] [PubMed]
  52. Hansen, J.; Sato, M.; Ruedy, R.; Lo, K.; Lea, D.W.; Medina-Elizade, M. Global temperature change. Proc. Natl. Acad. Sci. USA 2006, 103, 14288–14293. [Google Scholar] [CrossRef] [PubMed]
  53. da Silva, D.R.; Crespi, M.S.; Capela, J.M.V.; Khan, M.A.; Khan, S.; Khan, M.M.; Ye, J.-S.; Gong, Y.-H.; Zhang, F.; Ren, J.; et al. GISS analysis of surface temperature change. J. Geophys. Res. Atmos. 1999, 104, 30997–31022. [Google Scholar] [CrossRef]
  54. Zhang, J.; Wu, R.; Jia, X.; Zhang, Y. Contribution of precipitation and temperature to multiscale drought variations over Asia: Dependence on the time scale. Int. J. Climatol. 2022, 42, 8804–8821. [Google Scholar] [CrossRef]
  55. Bateni, M.M.; Behmanesh, J.; De Michele, C.; Bazrafshan, J.; Rezaie, H. Composite Agrometeorological Drought Index Accounting for Seasonality and Autocorrelation. J. Hydrol. Eng. 2018, 23, 6. [Google Scholar] [CrossRef]
  56. Bhardwaj, K.; Shah, D.; Aadhar, S.; Mishra, V. Propagation of Meteorological to Hydrological Droughts in India. J. Geophys. Res.-Atmos. 2020, 125, 22. [Google Scholar] [CrossRef]
  57. Shukla, S.; Safeeq, M.; AghaKouchak, A.; Guan, K.; Funk, C. Temperature impacts on the water year 2014 drought in California. Geophys. Res. Lett. 2015, 42, 4384–4393. [Google Scholar] [CrossRef]
  58. Woodhouse, C.A.; Meko, D.M.; MacDonald, G.M.; Stahle, D.W.; Cook, E.R. A 1,200-year perspective of 21st century drought in southwestern North America. Proc. Natl. Acad. Sci. USA 2010, 107, 21283–21288. [Google Scholar] [CrossRef]
  59. Rahmani, F.; Fattahi, M.H. A multifractal cross-correlation investigation into sensitivity and dependence of meteorological and hydrological droughts on precipitation and temperature. Nat. Hazards 2021, 109, 2197–2219. [Google Scholar] [CrossRef]
  60. Easterling, D.R.; Wallis, T.W.R.; Lawrimore, J.H.; Heim, R.R. Effects of temperature and precipitation trends on US drought. Geophys. Res. Lett. 2007, 34, 4. [Google Scholar] [CrossRef]
  61. Liu, Y.; Huang, S.; Fang, W.; Ma, L.; Zheng, X.; Huang, Q. Propagation and dynamic change of meteorological drought to hydrological drought in different seasons. J. Hydraul. Eng. 2021, 52, 93–102. [Google Scholar]
  62. Wang, L.; Yuan, X. Two Types of Flash Drought and Their Connections with Seasonal Drought. Adv. Atmos. Sci. 2018, 35, 1478–1490. [Google Scholar] [CrossRef]
  63. Han, Z.; Huang, S.; Huang, Q.; Leng, G.; Wang, H.; Bai, Q.; Zhao, J.; Ma, L.; Wang, L.; Du, M. Propagation dynamics from meteorological to groundwater drought and their possible influence factors. J. Hydrol. 2019, 578, 124102. [Google Scholar] [CrossRef]
  64. Yang, F.; Duan, X.; Guo, Q.; Lu, S.; Hsu, K. The spatiotemporal variations and propagation of droughts in Plateau Mountains of China. Sci. Total Environ. 2022, 805, 13. [Google Scholar] [CrossRef] [PubMed]
  65. Liu, X.; Zhu, Z.; Liu, X.; Yu, M. Thresholds of key disaster-inducing factors and drought simulation in the Xilinguole Grassland. Ecol. Inform. 2021, 64, 101380. [Google Scholar] [CrossRef]
  66. Schumacher, D.L.; Keune, J.; Dirmeyer, P.; Miralles, D.G. Drought self-propagation in drylands due to land-atmosphere feedbacks. Nat. Geosci. 2022, 15, 262–268. [Google Scholar] [CrossRef]
Figure 1. Research Method Roadmap.
Land 14 00445 g001
Figure 2. Geographical location map of the Yiluo River Basin.
Land 14 00445 g002
Figure 3. Categorization of the Standardized Temperature Index (STI) based on empirical CDF.
Land 14 00445 g003
Figure 4. Distribution function fitting of the precipitation, temperature, and runoff data.
Land 14 00445 g004
Figure 5. Changes of the SPI, STI, and SRI at a monthly scale.
Land 14 00445 g005
Figure 6. Distribution and probability density of the SPI, STI, and SRI at a monthly scale.
Land 14 00445 g006
Figure 7. (a,b) Probability of hydrological drought occurrence under different precipitation or temperature conditions. Notes: Subfigure (a) shows the impact of severe precipitation shortage on the propagation of hydrological drought; Subfigure (b) shows the impact of different temperature conditions on the propagation of hydrological drought.
Land 14 00445 g007
Figure 8. Probability of hydrological drought at all levels under different precipitation and temperature conditions. Notes: The occurrence probability of different grades of hydrological drought under different meteorological conditions is shown in the figure. Meteorological conditions are indicated at the top of the figure, such as “Low-No” indicating low temperatures and no shortage of precipitation. The y-axis indicates the probability of hydrological drought, and the x-axis indicates the hydrological drought level.
Land 14 00445 g008
Figure 9. (a,b) When drought events occur, the probability of different meteorological drought events propagating to hydrological drought events. Notes: Subfigure (a) shows the probability of low-precipitation meteorological drought scenarios propagation to hydrological drought events; Subgraph (b) shows the probability of high-temperature meteorological drought scenarios propagation to hydrological drought events.
Land 14 00445 g009
Figure 10. Probability of hydrologic drought under different precipitation and temperature conditions when a drought event occurs.
Land 14 00445 g010
Figure 11. Abrupt changes test of precipitation and temperature series data.
Land 14 00445 g011
Figure 12. Changes in hydrological drought characteristics before and after an abrupt change in meteorological conditions. Notes: The symbol “**” indicates meeting the 0.05 significance level, while “NS.” means not significant.
Land 14 00445 g012
Table 1. Drought grade classification.
SPI or SRI ValueDrought Grade
SPI or SRI > −0.5No drought
−1.0 < SPI or SRI ≤ −0.5Light drought
−1.5 < SPI or SRI ≤ −1.0Middle drought
−2.0 < SPI or SRI ≤ −1.5Severe drought
SPI or SRI ≤ −2.0Extreme drought
Table 2. Original data distribution goodness of fit.
PrecipitationTemperatureRunoff
AICBICAICBICAICBIC
Normal−418.21−409.05268.74277.90−883.17−874.01
Lognormal−588.04−578.88742.47751.62−1730.18−1721.02
Exponential−1003.87−999.29574.09578.67−1709.82−1705.24
Gamma−1045.34−1036.18356.49365.65−1759.14−1749.98
Weibull−1026.64−1017.48273.06282.22−1723.17−1714.01
Extreme value−27.14−17.99265.39274.54−106.92−97.76
GEV−834.39−820.65169.14182.88−1976.98−1963.24
GP−1000.08−986.34−9.464.28−1715.21−1701.47
Loglogistic−837.86−828.70497.25506.41−1932.86−1923.70
Stable−771.21−752.90272.76291.08−1981.20−1962.89
Table 3. Drought severity according to the SPI, STI, and SRI.
Drought Severity_SPIDrought Severity_SRIDrought Severity_STIDrought Events Grade
0~−2.590~−1.980~−1.51Light Drought Event
−2.59~−4.25−1.98~−3.72−1.51~−4.75Middle Drought Event
−4.25~−∞−3.72~−∞−4.75~−∞Severe Drought Event
Table 4. Meteorological drought events caused by a lack of precipitation.
Starting MonthNumber of DroughtsAverage Drought Duration
(Month)
Average Drought SeverityAverage Drought Intensity
152.40−2.97−1.23
222.00−1.71−0.85
312.00−1.60−0.80
1034.33−4.99−1.15
11193.42−3.90−1.15
12303.10−3.95−1.31
Table 5. Meteorological drought events caused by unusually high temperatures.
Starting MonthNumber of DroughtsAverage Drought Duration
(Month)
Average Drought SeverityAverage Drought Intensity
5564.95−5.07−1.03
644.00−4.33−1.08
Table 6. Hydrological drought events caused by reduced runoff.
Starting MonthNumber of DroughtsAverage Drought Duration
(Month)
Average Drought SeverityAverage Drought Intensity
1133.15−3.07−0.90
233.00−2.41−0.72
453.00−2.17−0.72
542.00−1.35−0.67
635.67−5.17−0.93
922.00−1.28−0.64
1045.00−4.93−0.99
1185.25−5.68−1.09
12133.92−3.18−0.79
Table 7. Welch’s t-test results for Table 7 of average drought severity.
p-ValueFebruaryAprilMayJuneSeptemberOctoberNovemberDecember
January0.6660.2030.0240.3950.0180.0230.0450.899
February 0.8660.4810.3070.4570.1710.0950.611
April 0.0070.2620.0030.0010.0090.113
May 0.1870.7140.0000.0030.009
June 0.1830.9130.8290.416
September 0.0020.0030.007
October 0.4850.020
November 0.048
Table 8. Causes of hydrological drought change before and after the abrupt change in meteorological conditions.
CausesNumberFrequency
BeforeAfterBeforeAfter
Lack of precipitation2090.690.36
High temperature560.170.24
High temperature and lack of precipitation490.140.36
Other reasons010.000.04
Disclaimer/Publisher’s Note: The statements, opinions and data contained in all publications are solely those of the individual author(s) and contributor(s) and not of MDPI and/or the editor(s). MDPI and/or the editor(s) disclaim responsibility for any injury to people or property resulting from any ideas, methods, instructions or products referred to in the content.

