Article

Research on the Value of County-Level Ecosystem Services in Highly Mountainous Canyon Areas Based on Land Use Change: Analysis of Spatiotemporal Evolution Characteristics and Spatial Stability

1
School of Architecture, Chang’an University, Xi’an 710061, China
2
Xi’an International Science and Technology Cooperation Base: International Joint Research Center for Green Urban Rural and Land Space Smart Construction Technology Innovation, Xi’an 710000, China
3
Key Areas: Construction of Virtual Teaching and Research Room for Land and Space Planning Major, Xi’an 710000, China
4
Department of Landscape Architecture, College of Landscape Architecture & Arts, Northwest A&F University, Yangling 712100, China
*
Author to whom correspondence should be addressed.
Land 2025, 14(2), 398; https://doi.org/10.3390/land14020398
Submission received: 24 January 2025 / Revised: 8 February 2025 / Accepted: 10 February 2025 / Published: 14 February 2025

Abstract

:
Human activities and climate change have accelerated land use and land cover change (LUCC) globally, diminishing the ecosystem service value (ESV) in ecologically fragile areas such as highly mountainous canyons and disrupting the human–nature balance. However, existing research lacks analysis on the impact of land use changes on ecosystem service value in typical counties with highly mountainous canyon regions. Therefore, we aim to address this gap by analyzing land use changes and their driving factors in Chayu County using multi-year land use data, calculating the ecosystem service value (ESV) for different periods, and estimating its spatial correlation and stability. The results showed the following: (1) Forestland and grassland were the predominant land-use types, with notable conversions between grassland and water bodies, grassland and unused land, and water bodies and unused land. (2) The total ESV increased steadily from 2003 to 2023, with higher values in the north and west and lower values in the central east. Forestland and water areas were the primary contributors to ESV changes, and ESV sensitivity to LUCC steadily increased from 0.46% to 2.49%. (3) Moran’s I ESV shows an overall increase, with a heightened correlation and enhanced stability. Spatially, the ESV exhibited a general high–high and low–low clustering pattern, with localized high–low and low–high clusters. These changes, driven by natural resource endowments and climate change, provide essential support for ecological protection and sustainable development in highly mountainous canyons and similar regions.

1. Introduction

Ecosystem services encompass the tangible material products and intangible benefits ecosystems provide to support human survival, health, and well-being [1,2,3]. However, over the past century, global climate change [4,5], environmental pollution [6], ecological degradation [7], resource depletion [8], and land use/cover change (LUCC) [9] have significantly impacted ecosystem functions, altering the level of ecosystem services. The Millennium Ecosystem Assessment showed over 60% of ecosystems worldwide are degraded or degrading [10]. Consequently, ecosystem service research has become a popular topic in ecology and related disciplines [11].
The study of LUCC is a common concern in academia [12], and numerous studies have shown that LUCC impacts ecosystem products and services by affecting ecosystem patterns and processes [13], making it a key factor influencing ecosystem services [14,15,16]. The effect of dynamic LUCC on the ecosystem service value (ESV) varies across different periods and regions [17], introducing instability. Additionally, these changes can influence ecological processes such as energy exchange [18], water resource balance [19], and biogeochemical cycles [20], further altering the ESV and contributing to ecological degradation [21]. Therefore, assessing variations in the ESV in response to different land use types over time is crucial for regional ecosystem restoration and conservation efforts.
Research on ecosystem services internationally began in the 1970s [22]. In 1997, Daily and Costanza advanced the concept and theoretical framework of ecosystem services, introducing quantitative indicators that sparked global research on ecosystem services [23,24,25]. Subsequently, scholars have used remote sensing technology to explore the interactions between LUCC and the ESV [20,26,27], while interdisciplinary research has focused on how the ESV responds to LUCC based on the natural environment and human activities [17,28]. Recent studies have explored the dominant influence of LUCC on ESV at the watershed scale [29,30] and the coordinated response between the ESV and LUCC driven by urbanization [31]. However, existing research has largely focused on macroscales, with limited attention paid to microscales. Studies specifically targeting typical ecologically vulnerable areas, such as highly mountainous canyon regions, are lacking, and very few analyses have been conducted at the county level regarding LUCC-ESV responses and stability. Consequently, there is insufficient quantitative data to support ecological protection and planning management in these areas.
Highly mountainous canyon regions are important ecological security barriers in various countries, vital for national ecological stability and regional development [32]. Chayu County exhibits various typical characteristics of highly mountain canyon regions. There is still significant potential for exploration and improvement in ecological protection and management in this area. Based on the coupling mechanism of temporal changes and spatial evolution, we used land use data from Chayu County from 2003 to 2023. Through geographic information system spatial analysis, ESV assessment models, and spatial autocorrelation models, we quantitatively analyzed LUCC and its driving factors. We calculated the ESV for different time intervals, assessed its sensitivity to LUCC during various periods, and assessed the spatial correlation and stability of the ESV. The findings offer valuable insights for ecological planning and management, environmental protection, and realizing ecological product value in highly mountainous canyon regions.

2. Overview of the Study Area

Chayu County, situated in the southeastern Qinghai–Tibet Plateau, is under the jurisdiction of Nyingchi City in the Tibet Autonomous Region of China. It borders Yunnan Province to the east, Changdu’s Zuogong County to the north, Metok County to the west, and shares boundaries with India and Myanmar to the south. The county administers three towns and three townships, covering 31,520 km2 (Figure 1). Its diverse topography includes high plateaus, mountains, canyons, hilly terrain, river valleys, and meadows. The county’s terrain is characterized by high northwest and low southeast elevations with a steep gradient. The region’s complex terrain; significant altitude and temperature variations; and poor vegetation contribute to its ecological fragility, making it a representative alpine canyon region for research.

3. Materials and Methods

This study aimed to assess changes in and the stability of the ESV within the region through LUCC analysis, thereby strengthening the collaborative management and coordinated development of regional, ecological, and environmental construction planning. Figure 2 illustrates the research framework.

3.1. Data Sources

This study primarily utilized land use, administrative boundaries, statistical yearbooks, and grain production data. The China Multi-Period Land Use Remote Sensing Monitoring Dataset (CNLUCC), made available by the Resource and Environmental Science Data Center of the Chinese Academy of Sciences (http://www.resdc.cn, accessed on 9 February 2025), provided the land use data for 2003, 2008, 2013, 2018, and 2023 with a spatial resolution of 30 m. Land use types were divided into six types: cultivated land, forest land, grassland, water area, construction land, and unused land. The administrative division data were sourced from the National Fundamental Geographic Data Center (www.ngcc.cn/ngcc, accessed on 9 February 2025). Data on the sown area and crop yield were derived from statistical yearbooks, including nearly 20 years of the “China Statistical Yearbook”, the “Linzhi City Statistical Yearbook”, the “Annual Report on Government Work Information Disclosure of Chayu County”, and other publicly available government reports.

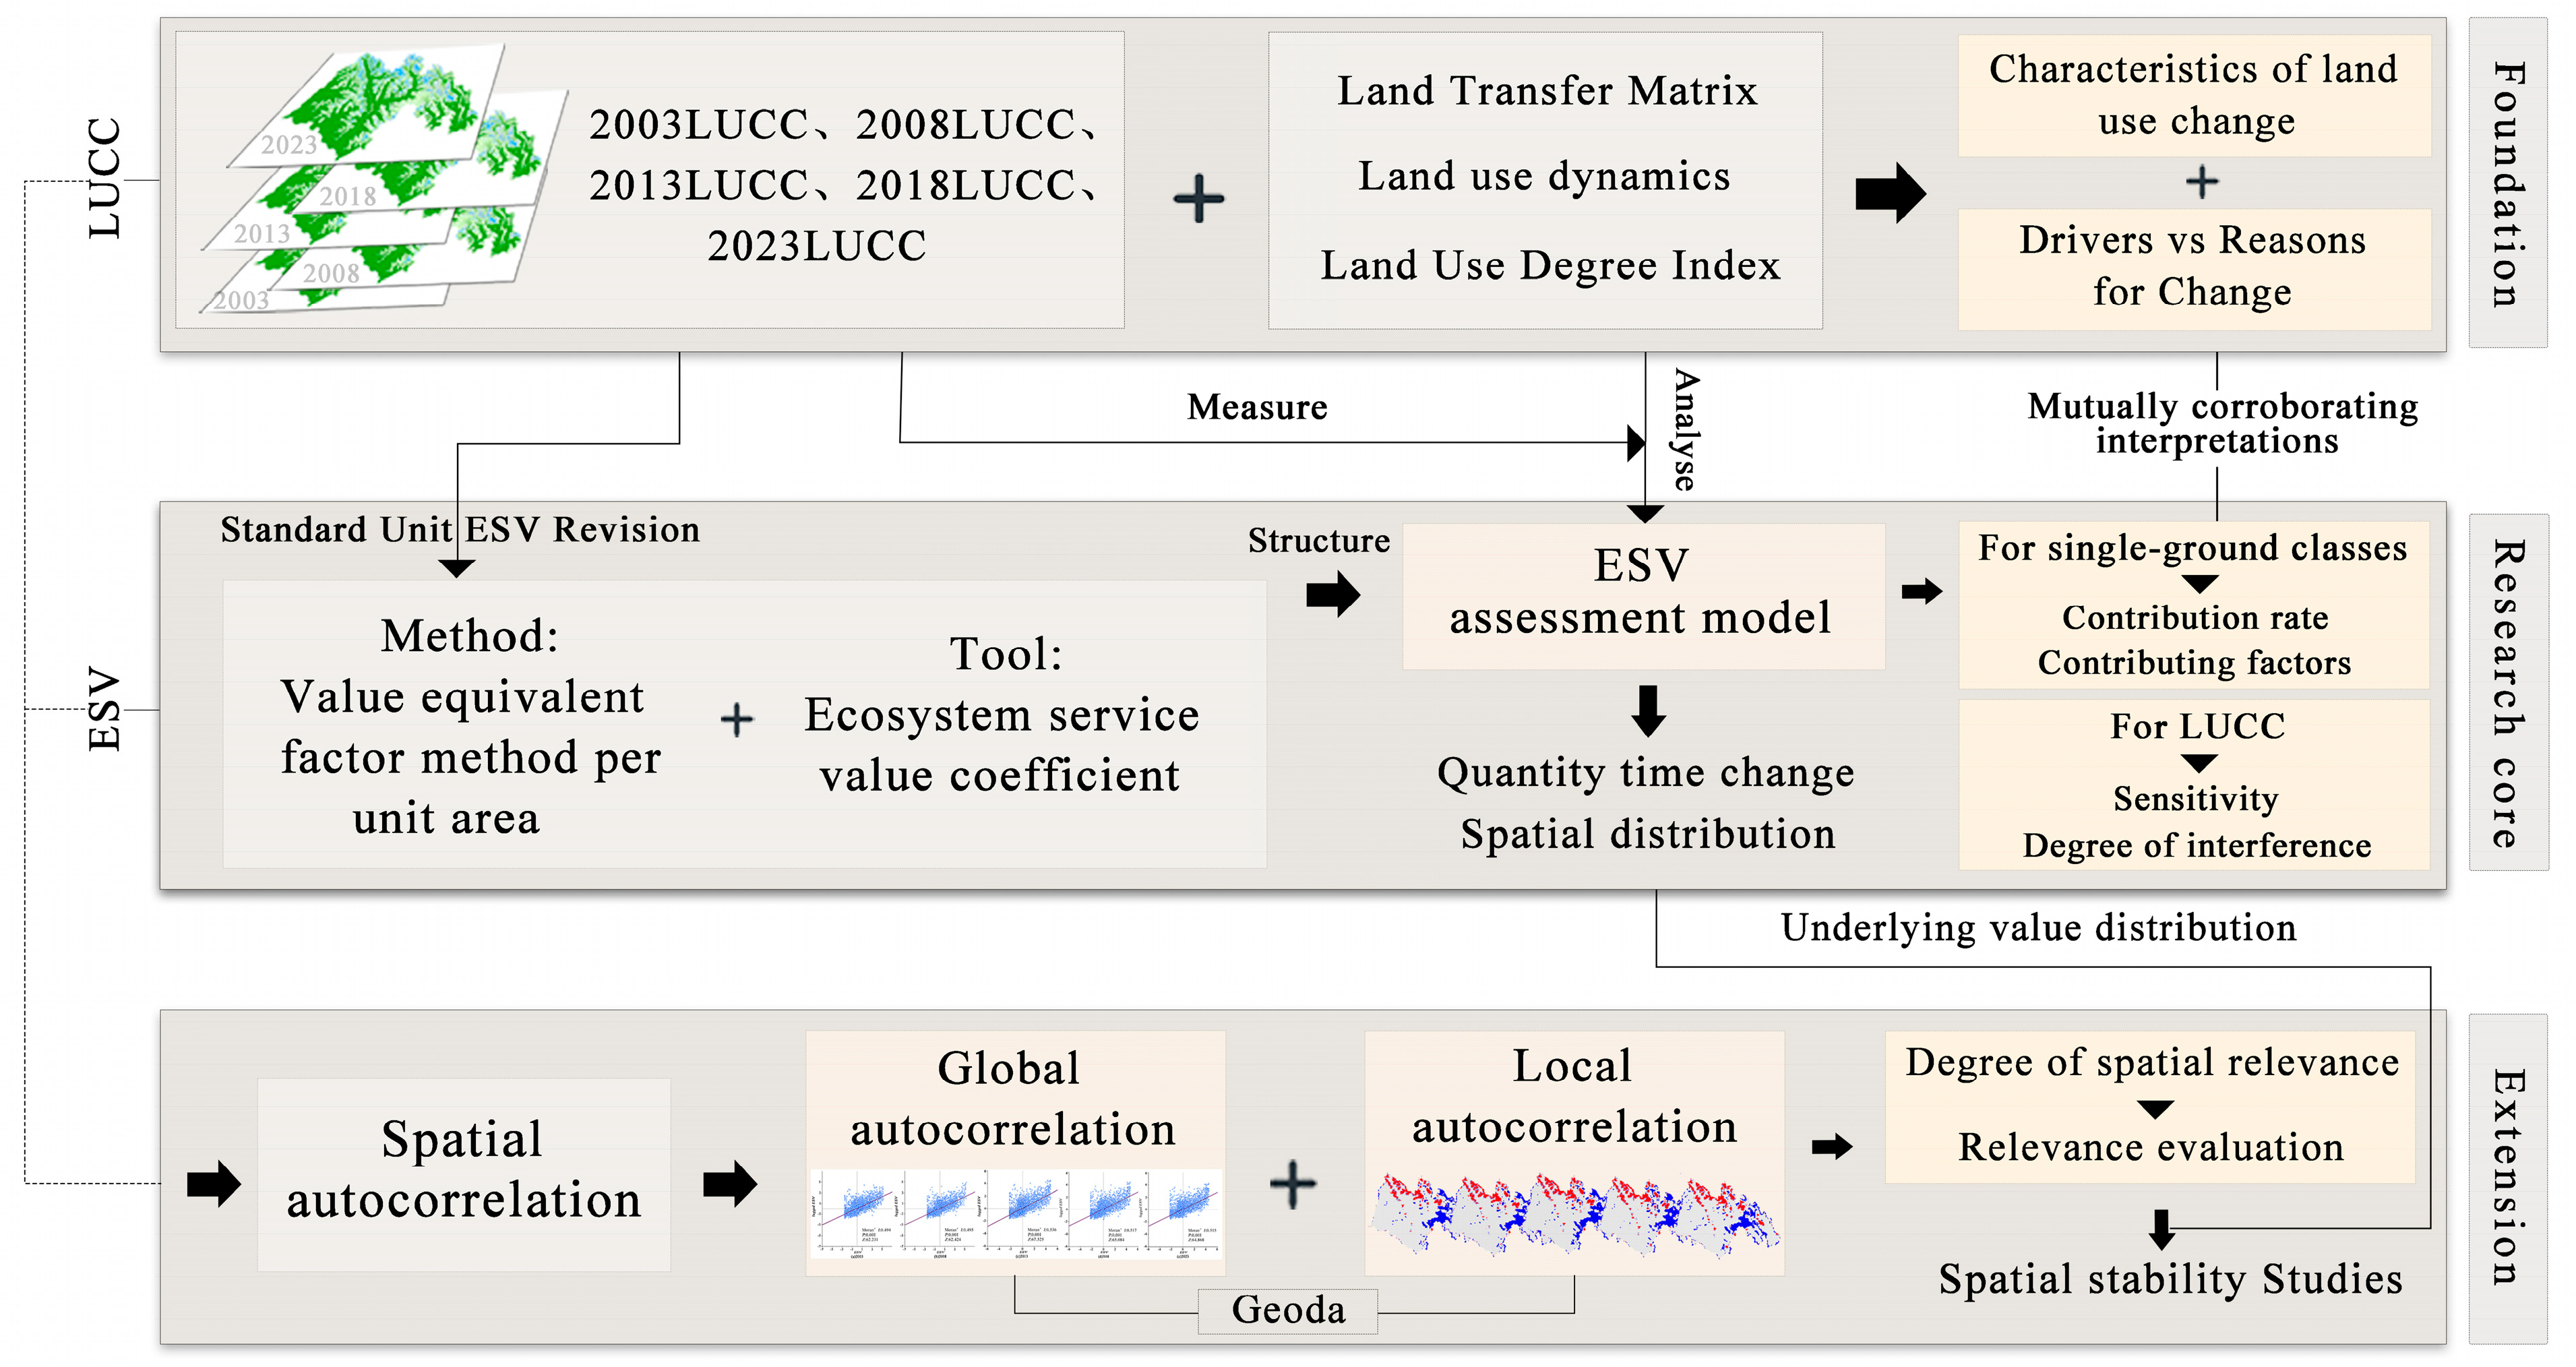
3.2. Research Method

3.2.1. Temporal and Spatial Evolution of Land-Use

(1) Spatiotemporal land change using a transfer matrix
The conversion between various land use categories is depicted by the land use transition matrix, which was obtained using the Markov model [33]. Python was employed for format conversion and information extraction, enabling a quantitative analysis of the land use transition matrix.
t ij = K 11 K 12 K 1 n K 21 K 22 K 2 n K n 1 K n 2 K nn
where tij represents the area of type i land at the beginning that has transitioned to type j at the end, and n is the total number of land use types.
(2) Change rate: land-use dynamics
The single LUCC dynamic rate measures the proportion of a specific land type’s area that transitions to other land types during a study period relative to its initial area, reflecting its rate of change [34].
K = U j U i U i × 1 T × 100 %
where K represents the dynamic rate of change in a specific land type within a specific period, Uj is the land type area at the end of that period (km2), Ui is the land type area at the beginning of the period (km2), and T refers to the study period.
The comprehensive LUCC dynamic rate expresses the overall degree of land use change within a region, calculated as the ratio of total land type changes to twice the total regional land area.
K = i = 1 n Δ U i j 2 i = 1 n U i × 1 T × 100 %
where K is the comprehensive LUCC dynamic rate, Ui is the initial area of a specific land type, ΔUi−j is the absolute change in the land type i area, and T is the research period.
(3) Change degree: Land Use Index: Land use index
Siyuan et al. developed a comprehensive method to analyze land use intensity from an ecological perspective. They categorized different land use types into four levels: unused land; forest, grassland, and water land; agricultural land; and urban land [35]. They established grading indices (Table 1) and used the land use degree index to characterize the land use degree in the region.
M = i = 1 n A i × C C i × 100 %
where M is the comprehensive land use index; Ai is the grading index for the ith level of land use; C is a specific land type area; and Ci represents the total regional land area.

3.2.2. Ecosystem Service Value (ESV)

(1) Ecosystem service value assessment model
To estimate the ESV, this study used a modified version of the Gaodi et al. unit area equivalent factor approach. This approach constructs value equivalents for different ecosystem services based on quantifiable standards and combines these with ecosystem area distribution to assess the ESV.
First, the ratio of the unit area yield of farmland grain in the study area for 2023 (4343.09 kg·hm−2) to the corresponding national unit area yield of farmland grain (5845.30 kg·hm−2) is selected as the revision coefficient (0.7430). This coefficient is used to revise the value of the standard unit ESV equivalent factor calculated by Xie Gaodi et al., which is 3406.5 CNY·hm−2, resulting in a standard equivalent of 2531.03 CNY·hm−2 for Chayu County. Subsequently, this value was used to adjust the unit area ESV equivalent table revised by Gaodi et al. [36], enabling the calculation of the unit area ESV coefficient for Chayu County (Table 2). The ESV coefficient (VES) is calculated as
V E S i = j = 1 6 ( A i j V j )
V E S if = j = 1 6 ( A i j V j f )
In Equations (5) and (6), VESi represents the ESV for the i-th period within the research area in CNY, Aij denotes the area (in hm2) of the j-th land type during the i-th period, Vj is the ESV coefficient (in yuan·hm−2) for the j-th land use type, VESif refers to the ESV for the f-th service in the i-th period in CNY, and Vjf is the value coefficient for the f-th ecosystem service function of the j-th land use type in CNY·hm−2.
(2) Ecological contribution ratio
The percentage change in the ESV of a particular land type during a given time period in relation to the overall change in the ESV is known as the ecological contribution rate. This can be used to explain the main factors that influence ESV changes. The formula is as follows [37].
Q i = Δ V E S t t = 1 6 Δ V E S t × 100 %
where Qi is the ecological service contribution rate (%) of the i-th land use type; ΔVESt is the variation in the ecosystem service value for the t-th ecosystem service (in CNY).
(3) Sensitivity analysis of ESV to LUCC
To further analyze the sensitivity of the ESV to LUCC, an elasticity analysis model was introduced to measure the sensitivity of the ESV to LUCC [38]. The formula is as follows:
S = V E S y V E S x V E S x × 1 K × 1 T × 100 %
where S is the sensitivity index (%) of the ESV to land use changes; VESx and VESy denote the ESV (in CNY) at the beginning and end of the research period, respectively; K is the comprehensive LUCC dynamic rate (%); and T is the time interval of the land use data (in this research, it was 5, indicating a 5-year period).

3.2.3. Spatial Autocorrelation Analysis

Spatial autocorrelation methods are commonly employed to measure the spatial distribution of a particular attribute, as well as its degree of correlation in neighboring areas. These methods can be used to express the variability and interrelatedness of certain spatial phenomena [39,40]. Global spatial autocorrelation analyzes overall spatial correlation trends in the ESV of Chayu County via Moran’s I index (Equation (9)). A given attribute’s local spatial correlation properties are reflected in its local spatial autocorrelation. High–low or low–high clustering is indicated by a Moran’s I index value less than 0; high–high or low–low clustering is indicated by a value larger than 0 (Equation (10)).
I = n i = 1 n j = 1 n w i j x i x ¯ x j x ¯ i = 1 n j = 1 n w i j i = 1 n x i x ¯ 2
I i = x i x ¯ m 0 j = 1 n w i j x j x ¯
m 0 = i = 1 n x i x ¯ 2 / n
In Equations (9) and (11), n represents the total number of grid cells, wij denotes the spatial weight matrix; xi and xj refer to the ESV of the ith and jth grid cells, respectively; x is the average ESV; and m0 represents the variance.

4. Results

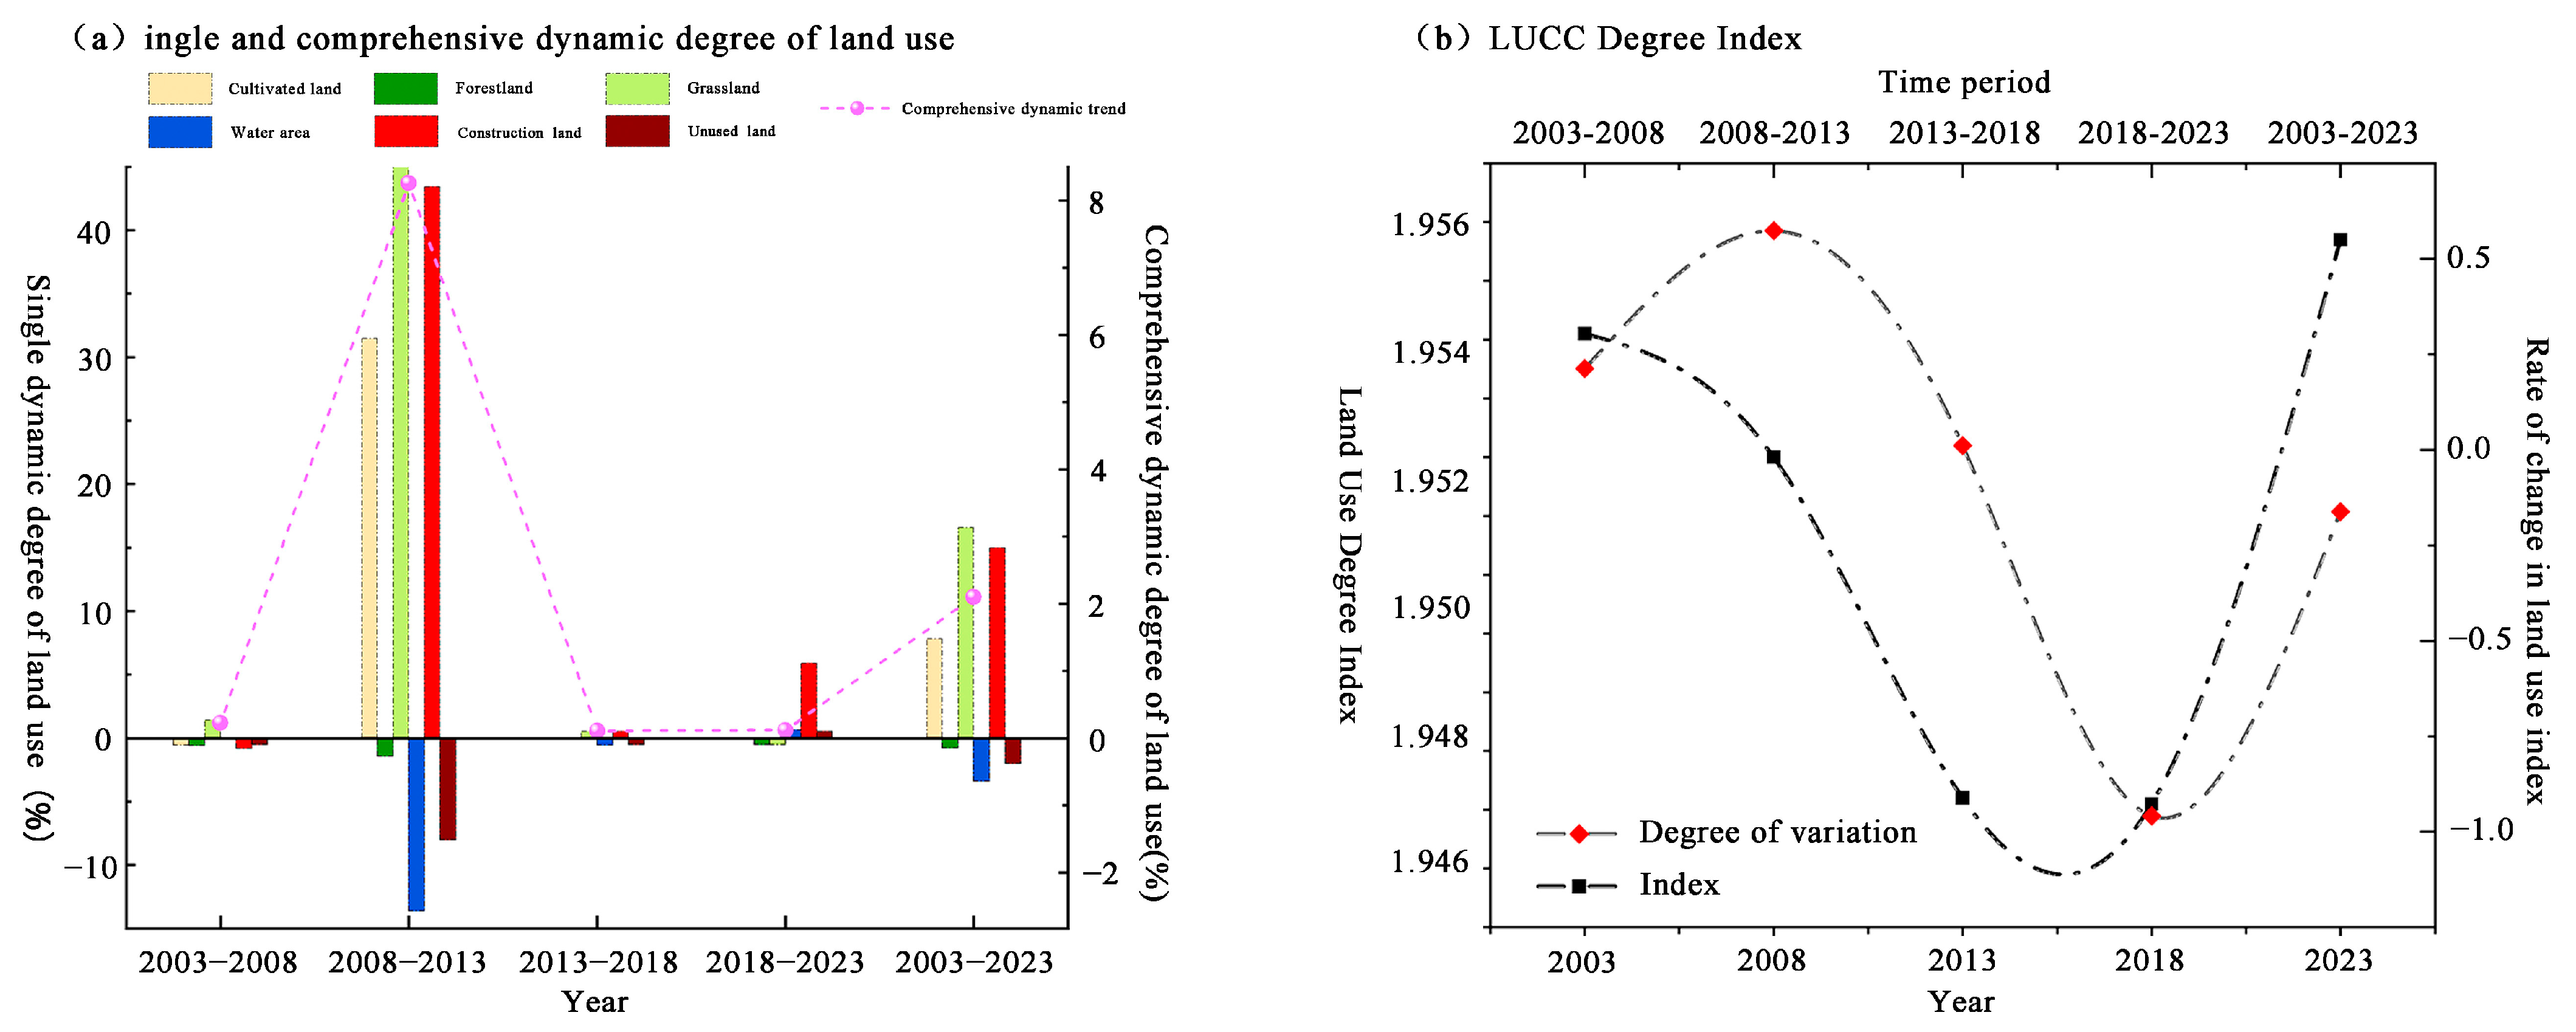
4.1. Analysis of Spatial and Temporal Changes in Land-Use Types

Figure 3a shows the spatial distribution of land-use types in Chayu County from 2003 to 2023 at 5-year intervals. In Chayu County, the two main land use categories were forestland and grassland, accounting for over 85% of the total area. Forestland had the highest proportion, consistently exceeding 15,000 km2 annually, representing over 48% of the total area. Cultivated land and construction land were concentrated in the lower-lying river valley basins, whereas forestland, grassland, water area, and unused land were interspersed across mountainous, plateau, and canyon regions. This reflects significant geomorphological and topographical regional differences in the land use’s spatial distribution in Chayu County, China. By 2023, compared to 2003, the overall areas of cultivated land, forestland, water area, and construction land in Chayu County had increased, whereas the grassland areas and unused land had decreased. These changes were driven by human activities, climate change, and policy impacts. Global climate change primarily influenced the increase in water bodies, whereas human activities and policy guidelines were closely associated with changes in cultivated land, forestland, grassland, construction land, and unused land within the region [41].
From 2003 to 2023, the main land use conversion in Chayu County involved grassland and water area; grassland and unused land; and water area and unused land. Over this 20-year period, grassland area continually decreased, primarily converting into unused land. This decline is closely related to decreased vegetation yield and quality in the eastern plateau region of the county, coupled with the poor soil conditions in the alpine region, which hinder vegetation growth and contribute to ongoing grassland degradation. Unused land primarily transitions to water areas, mainly due to climate change and increased rainfall. In addition, the areas of cultivated land and forests have remained fairly consistent over the past two decades. The stability of cultivated land can be ascribed to the small base area of cultivated land in the region and the limited cultivable wastelands in the river valley basins. Forestland stability is partly supported by a forest economy and ecological restoration projects, especially since 2010, when afforestation projects were actively implemented in Chayu County.
The comprehensive index of land use dynamics and degree reflects the regional differences in the intensity and land use change rate (Figure 4). From 2003 to 2023, the single LUCC dynamic rate of cultivated land, forestland, water area, and construction land in Chayu County displayed a fluctuating upward trend, with an overall increase in area. In contrast, the rates for grassland and unused land declined, leading to an overall decrease in area. The comprehensive LUCC dynamic rate also increased, driven by climate change and the implementation of ecological restoration projects in Chayu County in 2010. Additionally, over the past 20 years, the land use intensity index in Chayu County has remained between 1.94 and 1.95, reflecting low and stable development intensity due to natural ecological constraints on excessive land use.

4.2. Analysis of Spatiotemporal Changes in the ESV

4.2.1. ESV Time Variation Analysis

From 2003 to 2023, Chayu County’s ESV increased from CNY 169.127 billion to CNY 175.686 billion, representing a 3.88% growth rate (Figure 5a). Apart from a slight decline in the ESV from 2008 to 2013, the total ESV increased during the other periods owing to the consistently high proportion of forestland in Chayu County and the rapid expansion of water areas. Furthermore, in land use types, the ESVs of cultivated land and water areas increased by 50% and 16.89%, respectively, over the past 20 years, while that of forestland steadily increased by 1.53% during the same period. In contrast, the ESVs of grassland and unused land continuously decreased by 5.86% and 1.39%, respectively, over 20 years, primarily reflecting how the rise in the area of important ecological land types, like forestland and water area, has ensured a continuous rise in the total ESV. Notably, although the ESV of grassland is decreasing, the trend has gradually weakened. As the ecological protection measures for grasslands have been implemented since the commencement of the national western development strategy, the ESV of grasslands is expected to change from loss to profit, positively impacting the overall ESV in the future.
From 2003 to 2023, the ESVs of various services in Chayu County varied (Figure 5b). The values for provision, regulation, support, and cultural services increased, with regulation services having the highest value (66.41% of the total ESV), with the exception of soil conservation and aesthetic landscape, which showed a continuous decrease and increase, respectively, while the other individual ESVs exhibited fluctuating changes. Notably, the ESVs for hydrological regulation and climatic conditions accounted for a relatively high proportion. The contributions of gas regulation, environmental purification, soil conservation, biodiversity, and aesthetic landscapes to the total ESV were moderate. In contrast, food production, raw material production, water resource supply, and nutrient cycling maintenance had relatively low proportions, with nutrient cycling maintenance being the lowest at 0.60%. In summary, regulatory services, especially hydrological regulation, are the primary contributors to the ecosystem in Chayu County. Therefore, maintaining and expanding the water area is of significant importance for sustaining hydrological regulation and overall ESV.

4.2.2. ESV Spatial Variation Analysis

Between 2003 and 2023, the overall ESV in Chayu County exhibited spatial variation, with higher values in the northern and western regions and lower values in the central eastern areas (Figure 6). The high-value ESV areas (CNY 0.1383–0.2524 billion) were primarily situated in the northern part of Shangchayu Town and the northwestern part of the Chawalong, Gula, and Guyu Townships, closely related to the mountainous terrain and numerous rivers in these regions. Medium-value ESV areas (CNY 0.1009–0.1383 billion) were primarily found in the western part of Shangchayu Town, the southeastern part of Chawalong Township, and Xiachayu Town, which correlates significantly with the large forested areas in these locations. The low-value ESV areas (CNY 0–0.1009 billion) were mainly distributed in Zhuwagen Town and Gula Township, where a significant amount of unused land has greatly affected the ESV output in these regions.

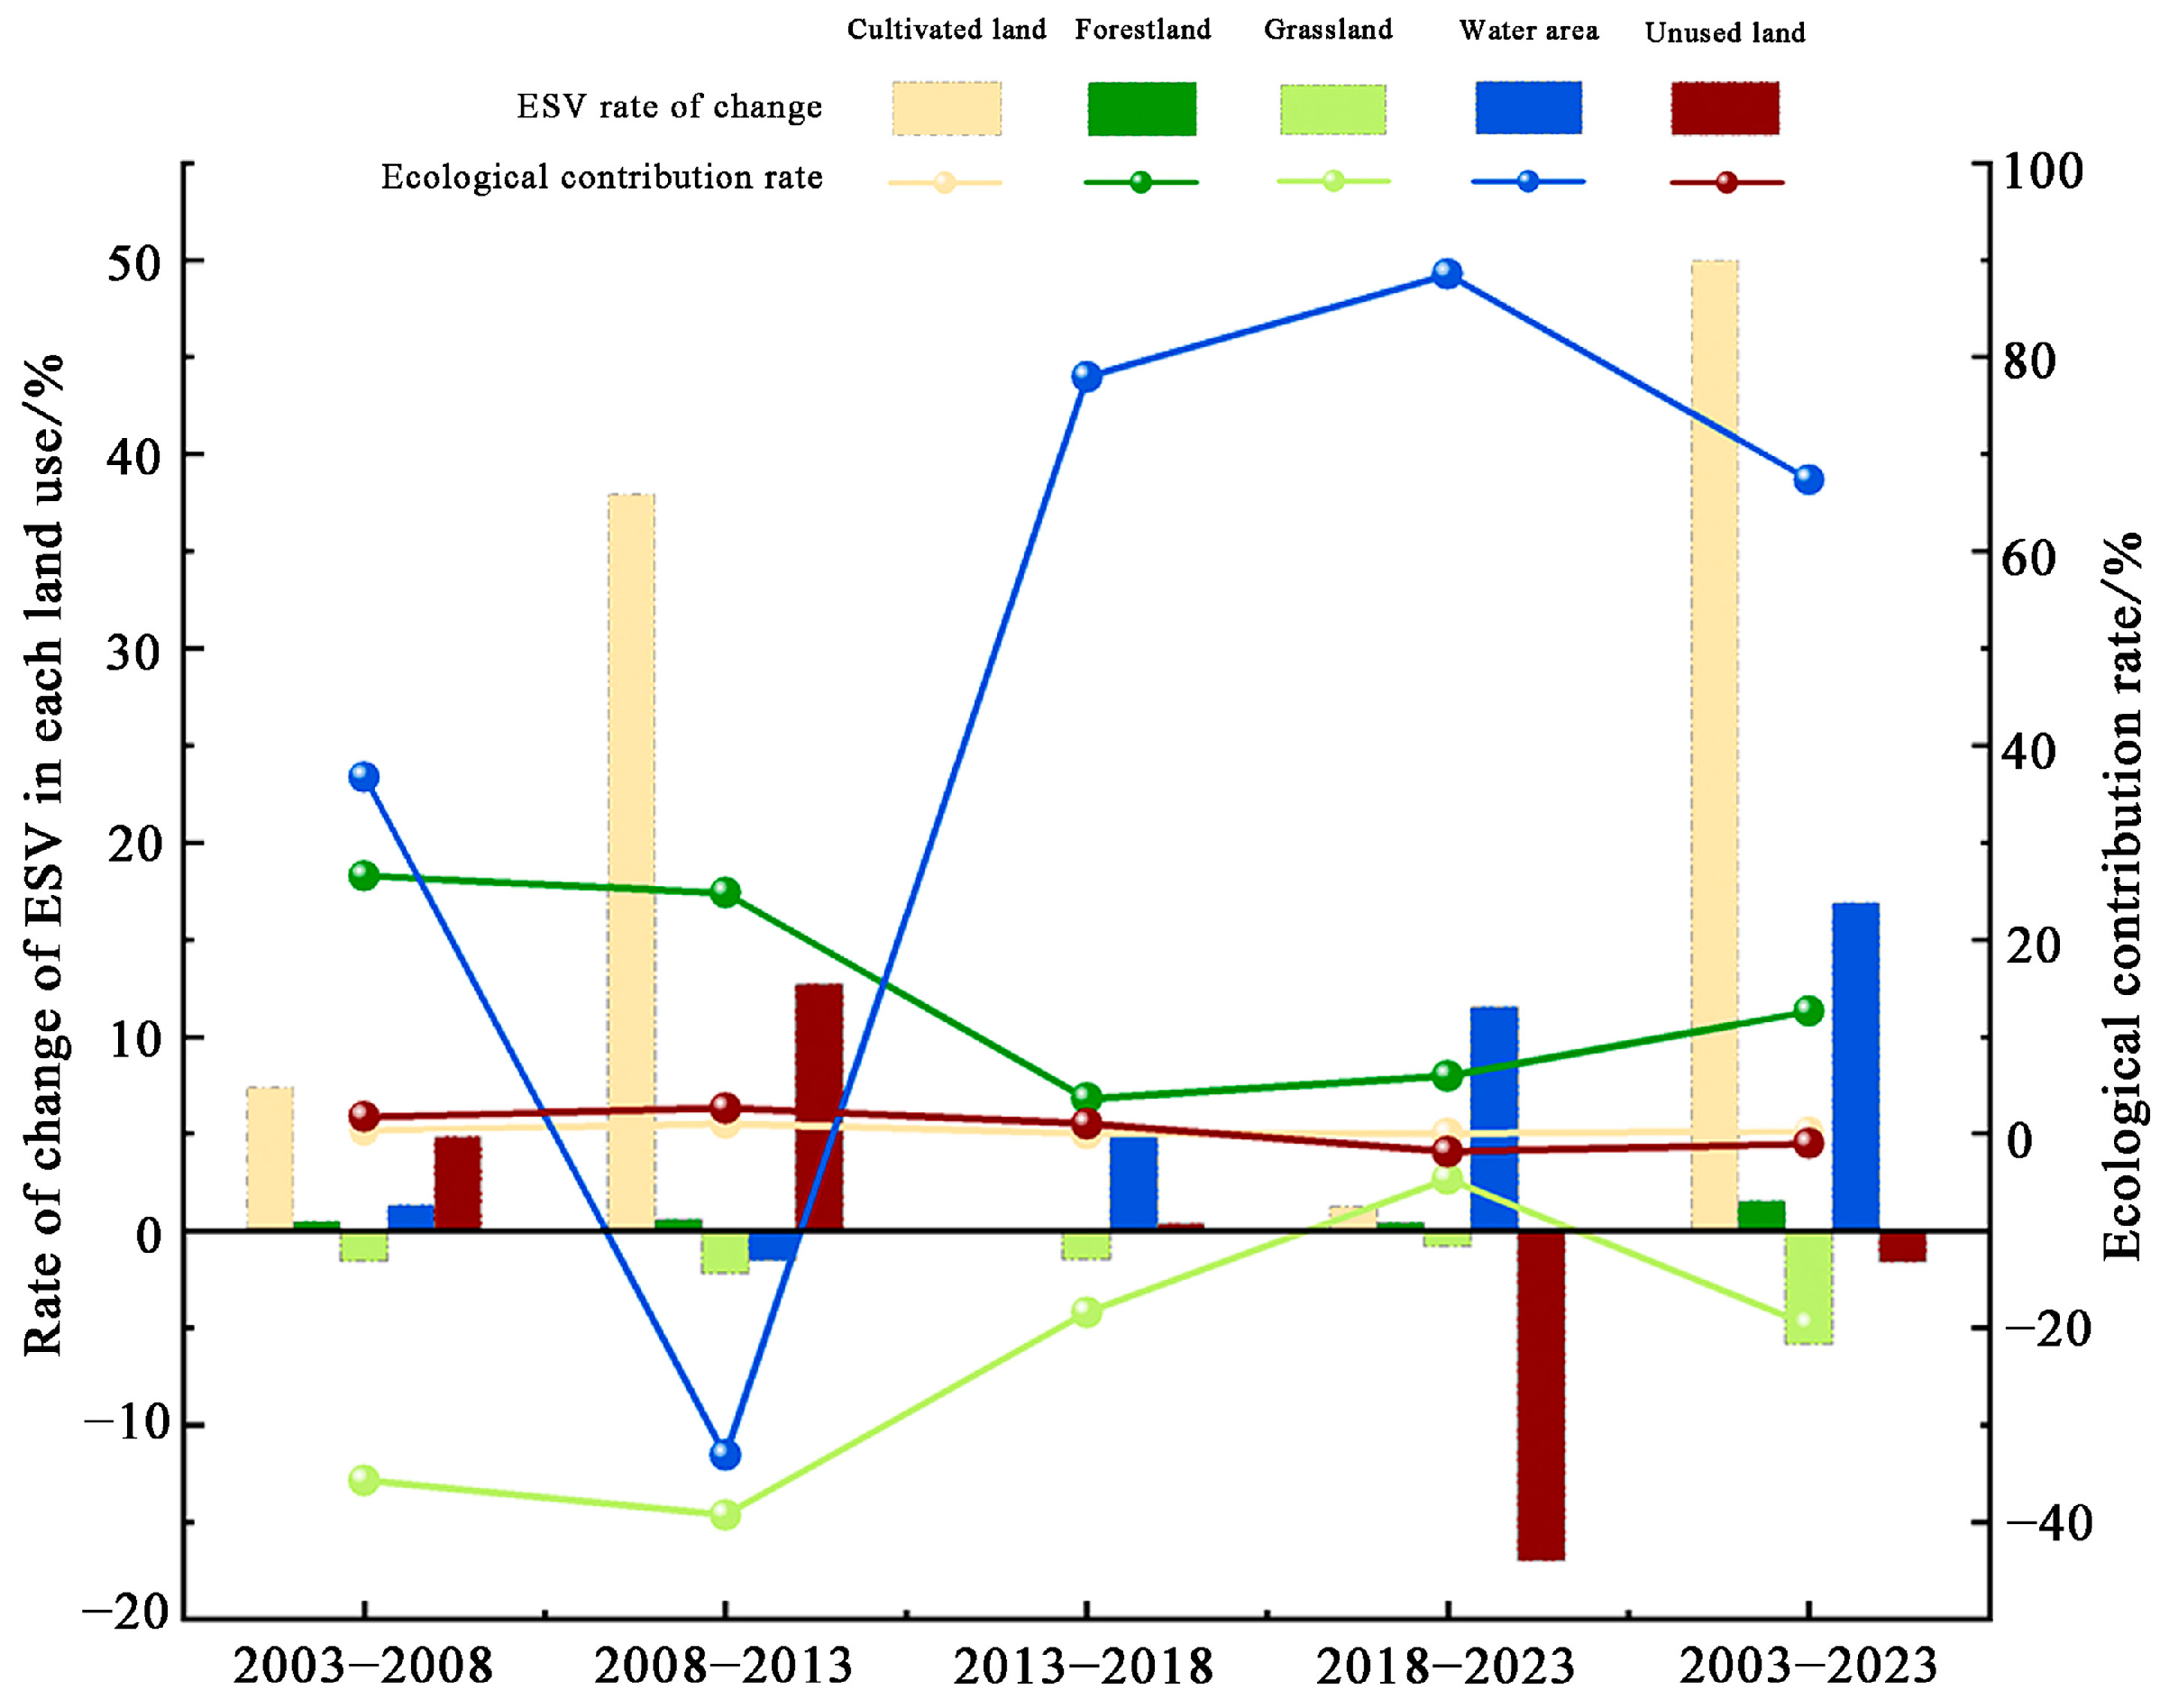
4.2.3. Analysis of the Ecological Contribution Rates of Various Land Uses

From 2003 to 2023, the ecological contribution rates of various land use types were associated with land use variations, with significant changes in forestland, grassland, and water areas, resulting in a substantial contribution to changes in the ESV (Figure 7). Specifically, the water area had the highest ecological contribution rate, averaging 47.50%, followed by cultivated land (1.61%), forestland (14.71%), grassland (−23.55%), and unused land (2.31%). The combined ecological contribution rates of forest and water areas reached 62.21%, indicating that these two land-use types significantly contributed to the ESV changes in Chayu County over the past two decades. In conclusion, maintaining the stability of forestland and water areas and reducing grassland loss are key factors in sustaining the ESV of this region.

4.2.4. Ecological Sensitivity Analysis of Various Land Uses

The elasticity of the ESV in response to LUCC, also known as the sensitivity index of ESV to dynamic changes in land use, measures the impact of land use activities on ESV. The sensitivity indices of the total ESV to the LUCC for the 5-year period from 2003 to 2023 were 0.46, 0.55, 2.02, and 2.49 (Figure 8b). This indicates that a 1% change in the overall dynamic degree of land use during these periods resulted in changes in the total ESV of 0.46%, 0.55%, 2.02%, and 2.49%, respectively. From 2003 to 2023, the sensitivity of supply, regulation, support, and cultural services to land use in Chayu County increased. This indicates that the degree of disturbance caused by spatiotemporal changes in land use activities in these four major categories of ecosystem services is gradually increasing. Among the individual ecosystem services, the sensitivity of 11 factors to land use fluctuated upwards (Figure 8d), suggesting that land activities intensified disturbances across ecosystem sub-services. In summary, the sensitivity of the ESV to land use in Chayu County is generally increasing, and LUCC will continue to significantly impact ESV changes.

4.3. Spatial Autocorrelation Analysis of ESV

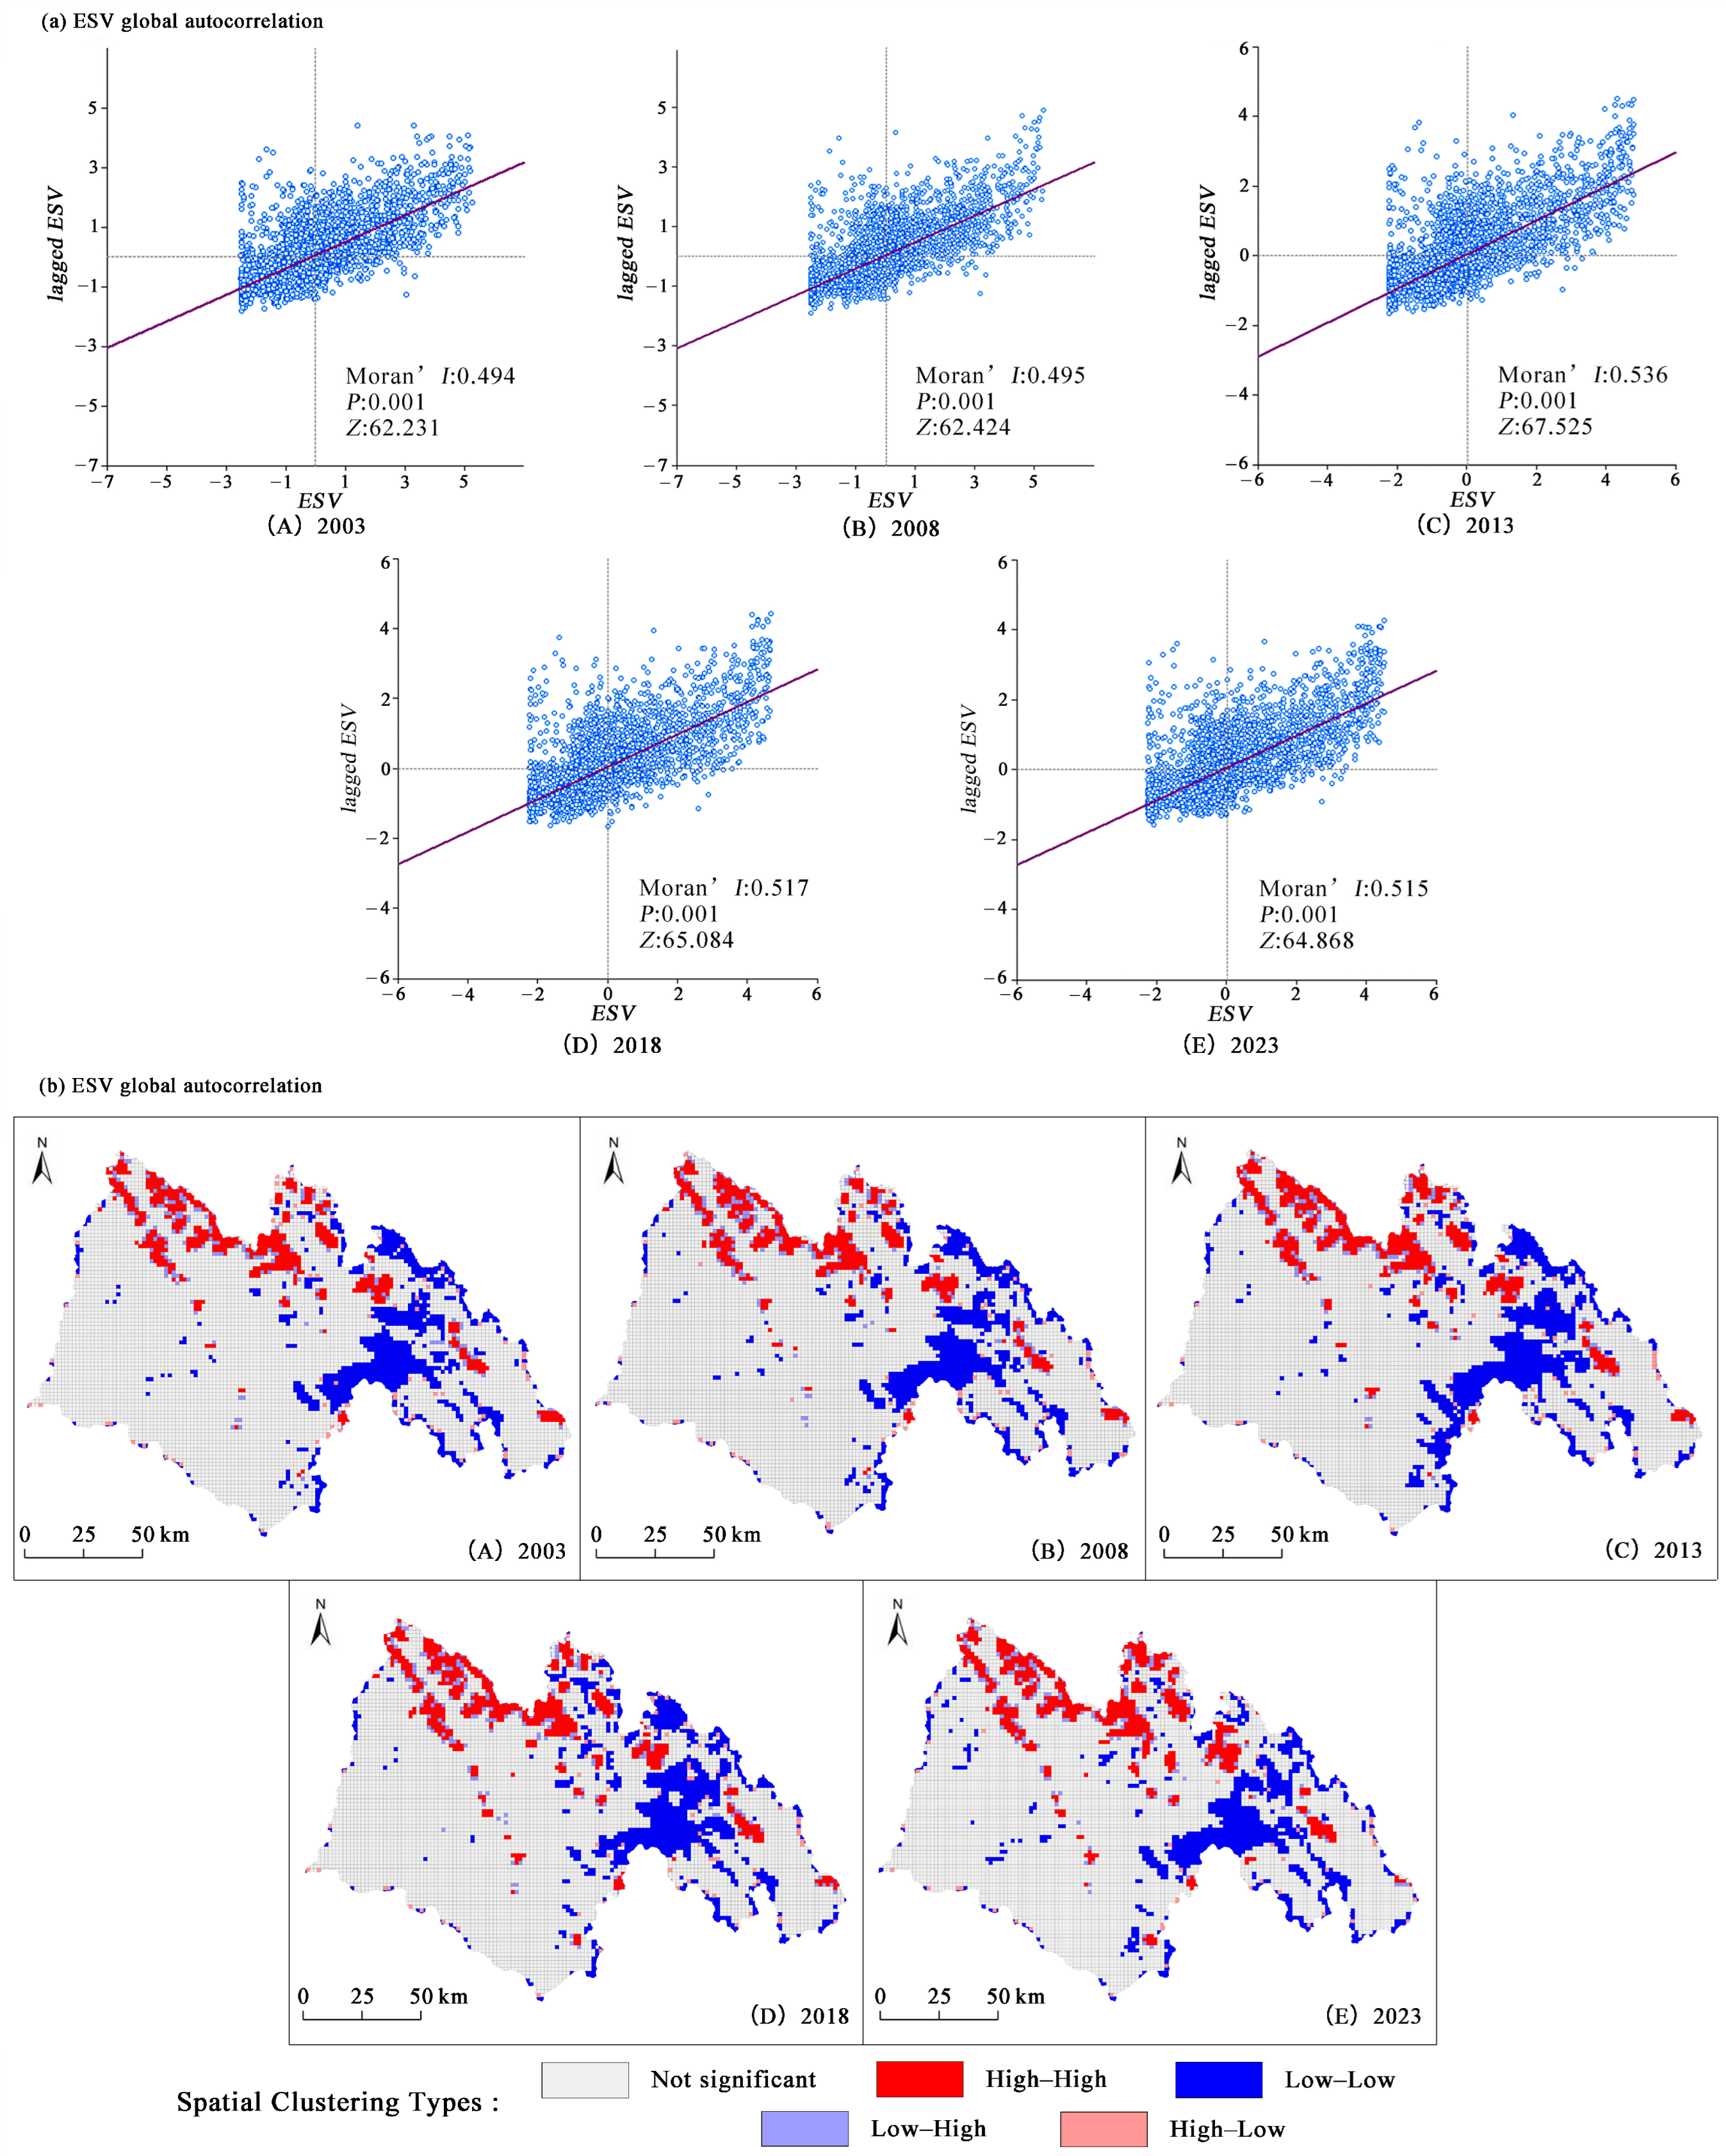
4.3.1. Global Spatial Autocorrelation Analysis of ESV

According to calculations using the Geoda1.18.0 software, the global Moran’s I values for the ESV in Chayu County from 2003 to 2023 were all greater than 0, with p-values less than 0.001. This indicates a remarkably positive spatial association for the ESV across Chayu County (Figure 9a). Moran’s I value increased from 2003 to 2013 and then decreased from 2013 to 2023; however, the overall trend was an increase. This indicates that while the spatial correlation of the ESV has fluctuated over the past 20 years, it has become more concentrated and strengthened, largely because of ongoing ecological restoration projects in Chayu County that have increased forestland and water areas, improving the ecological environment.

4.3.2. Local Spatial Autocorrelation Analysis of the ESV

From 2003 to 2023, Chayu County exhibited significant high–high- and low–low-value clustering areas for the ESV, indicating a strong positive correlation and spatial clustering pattern (Figure 9b). During the five periods, the spatial distributions of the high–high- and low–low-value clustering areas for the ESV were generally consistent. High–high clusters mainly focused on the northern part of Shangchayu Town, Guyu Township, and northwestern Gula Township, with an area increase of 9.2%, indicating significant growth. This is closely related to the intensification of global warming [42,43]; the significant rise in temperatures in the Tibet Plateau where Chayu County is located; and the substantial increase in precipitation and water volume caused by the melting of ice and snow, leading to a significant increase in the total ESV of the water area. Conversely, low–low-value clustering areas were primarily found in Zhuwagen Town and the southern part of Gula Township, with an area decrease of 0.19%. These regions are characterized by a large area of unused land and harsh natural environments, highlighting the need for targeted environmental protection policies to mitigate ESV losses caused by land use changes in these areas.

5. Discussion

5.1. The Dynamic Response of ESV to the LUCC

Changes in the ESV depend on the scale and direction of LUCC [44]. Therefore, when the rate of land use change is relatively stable, transfer direction and spatial location changes are key factors influencing ESV variation. An analysis of LUCC and ESV changes in Chayu County from 2003 to 2023 (Figure 3a and Figure 5a) shows that the rapid expansion of water areas and the continuous increase in forest area are the primary reasons for the rise in the ESV.
This is closely related to the policies implemented in China to improve the ecological environment and prevent soil erosion and desertification, such as the “Grain for Green” programs and various ecological restoration projects [45]. Specifically, the “Grain for Green” policy, which has been continuously implemented in the Tibetan Plateau since 2003, has led to a sustained increase in forestland area. However, extreme natural factors (deteriorating water and soil conditions and severe toxic weed infestations) and human activities (such as land clearing and overgrazing) in Chayu County have led to grassland degradation, resulting in a decrease in grassland area. Nevertheless, over the 20-year period, the rate of grassland area reduction gradually decreased, indicating that the ecological restoration efforts in Chayu County are yielding positive results against the backdrop of ecological civilization construction in China. On a broader regional scale, this further confirms that the land use and land cover structure in the highly mountainous canyon region where Chayu County is located is becoming increasingly stable, with overall improvements in land cover conditions and the regional ecological environment.

5.2. Stability Analysis of the ESVs

In this study, a 2 km × 2 km grid was used to analyze the spatial distribution and correlation of the ESV [46], enabling a quantitative analysis of ESV spatial heterogeneity and a detailed expression of land use spatial information. This approach highlights land-type patterns, compatibility, and stability, revealing that the ESV in Chayu County predominantly exhibits a “high–high” and “low–low” clustering pattern (Figure 9b). High–high-value aggregation areas are widely distributed in the northern part of the county, particularly in regions with dense water bodies, benefiting from the valley topography of the highly mountainous canyon region, which maintains ecosystem integrity. Conversely, the low–low-value aggregation areas were primarily located in the southern parts of ZhuwaGen Town and Gula Township, where high altitudes, low temperatures, and erosion in the highly mountainous canyon region have led to increased natural loss rates. Owing to its complex natural and topographical background, Chayu County embodies the typical characteristics of a highly mountainous canyon region. Following an overall stability analysis of the ESV within the county through spatial autocorrelation, this study provides insights for formulating differentiated ecosystem compensation policies suitable for Chayu County and offers important implications for ecological protection in highly mountainous canyon regions under the implementation of sustainable development strategies in China.

5.3. Policy Impact and Regional Environmental Management

Rapid urbanization has accelerated changes in land use; however, this process may lead to serious negative socio-ecological effects [47,48]. Existing land use planning and policies often overlook the negative effects of LUCC on the ESV [49]. Therefore, under the strategic framework of “ecological protection and development”, policymakers must incorporate ecosystem services into land use policy formulation and ecological protection decisions while promoting economic development with a focus on strengthening ecological and environmental protection [50,51,52]. For Chayu County and the similar highly mountainous canyon region, continuous focus on forests and water bodies protection is essential. This can be realized by strictly controlling the ecological protection of red lines in the area, establishing nature reserves, and enacting laws for protecting water sources and forests. Such measures will ensure a sustained increase in the overall ESV of the region and enhance the positive impact of ecosystems on human development and well-being.

5.4. Research Shortcomings and Prospects

This study employed the unit area value equivalent factor approach developed by Xie et al. to compute the ESV of Chayu County in a highly mountainous canyon region. Although this method is widely used in ESV-related research, its approach of simplifying the ESV into a monetary quantification oversimplifies actual ecological processes and does not adequately account for the complex relationships between LUCC and ecosystems. The ESV results from the interaction and mutual influence of multiple factors, including human activities, natural resource endowments, and socioeconomic conditions, within specific temporal and spatial contexts, exhibit a complex nonlinear relationship. Future research could enhance the accuracy of ESV assessments by incorporating field observations and questionnaire surveys [53], thereby comprehensively considering the relationship between LUCC and the ESV from the human–environment perspective.

6. Conclusions

This study, building on land use data and a modified ESV assessment model, analyzes the spatiotemporal variations in land use, ESV changes, the sensitivity of the ESV to LUCC, and the spatial autocorrelation of the ESV in Chayu County from 2003 to 2023. It examines the dynamic response and stability of the ESV to LUCC in Chayu County.
The following are the key findings.
  • Forestland and grassland are the main land use types in Chayu County. From 2003 to 2023, land use changes, driven by climate change and human activities in the highly mountainous canyon region, were mainly caused by the mutual transformation between grassland and water area; grassland and unused land; and water area and unused land. The period from 2018 to 2023 saw the greatest changes in land use types compared to other periods. The expansion of forestland and water areas during this time is an important indicator of effective ecological and environmental protection efforts in Chayu County in recent years.
  • From 2003 to 2023, the overall ESV of Chayu County increased from CNY 169.127 billion in 2003 to CNY 175.686 billion in 2023, with higher values in the northern and western regions and lower values in the central eastern areas. Forestland and water areas were key contributors to the total ESV in Chayu County and essential for maintaining hydrological and climatic regulation. Furthermore, from 2003 to 2023, the sensitivity of Chayu County’s ESV to land use changes revealed a continuous upward trend, with LUCC being a major driver of ESV gains and losses.
  • Moran’s I values for Chayu County from 2003 to 2023 across the five periods were 0.494, 0.495, 0.536, 0.517, and 0.515, indicating an overall increasing trend with heightened correlation and enhanced stability. The spatial pattern primarily exhibited high–high and low–low clustering. This is mainly attributable to the unique and complex terrain and landforms of the highly mountainous canyon areas, which have a significant impact on factors such as water bodies, soil types, and vegetation distribution. This results in the regional differentiation of the ecosystem, leading to a marked difference in the spatial distribution of high and low ESVs.
These findings provide theoretical support for optimizing the land use structure in Chayu County and similar highly mountainous canyon regions. This approach facilitates the formulation and implementation of land management, ecological restoration, and conservation policies tailored to local conditions. Furthermore, achieving the sustainable development of land resources and promoting ecological civilization are essential.

Author Contributions

Conceptualization, L.Z. and K.Y.; methodology, L.Z., K.Y. and Y.Z.; formal analysis, K.Y., Y.Z. and X.W.; data curation, J.W. and W.Y.; writing—original draft preparation, L.Z.; writing—review and editing, L.Z., K.Y. and Y.Z.; visualization, L.Z. and J.W.; supervision, K.Y., Y.Z. and X.W.; funding acquisition, K.Y. All authors have read and agreed to the published version of the manuscript.

Funding

This study was funded by the National Natural Science Foundation of China (52278047), the Fundamental Research Funds for the Central Universities (300102414501), the Key Research Projects of the Shaanxi Provincial Government Research Office in 2024 (2024HZ1186), and the 2024 Shaanxi Provincial Communist Youth League and Youth Work Research Project (2024HZ1236).

Data Availability Statement

The data are available from the corresponding author and can be shared upon reasonable request.

Acknowledgments

The authors would like to thank the editors and reviewers for their constructive comments on this research. Thanks also go to members of the research team and everyone who helped us during the survey. All authors agree with the content of this section.

Conflicts of Interest

The authors declare no conflicts of interest.

Abbreviations

The following abbreviations are used in this manuscript:
CNLUCCChina Multi-Period Land Use Remote Sensing Monitoring Dataset
ESVEcosystem service value
LUCCLand use and land cover change
VESESV coefficient

References

  1. Faber, J.H.; van Wensem, J.V. Elaborations on the use of the ecosystem services concept for application in ecological risk assessment for soils. Sci. Total Environ. 2012, 415, 3–8. [Google Scholar] [CrossRef]
  2. Gómez-Baggethun, E.; Barton, D.N. Classifying and valuing ecosystem services for urban planning. Ecol. Econ. 2013, 86, 235–245. [Google Scholar] [CrossRef]
  3. Turner, K.G.; Anderson, S.; Gonzales-Chang, M.; Costanza, R.; Courville, S.; Dalgaard, T.; Dominati, E.; Kubiszewski, I.; Ogilvy, S.; Porfirio, L.; et al. A review of methods, data, and models to assess changes in the value of ecosystem services from land degradation and restoration. Ecol. Model. 2016, 319, 190–207. [Google Scholar] [CrossRef]
  4. Boone, R.B.; Conant, R.T.; Sircely, J.; Thornton, P.K.; Herrero, M. Climate change impacts on selected global rangeland ecosystem services. Glob. Chang. Biol. 2018, 24, 1382–1393. [Google Scholar] [CrossRef] [PubMed]
  5. Zhou, T.T.; Jia, W.X.; Liang, Y.; Hong, B.; Wang, K. Urban park’s vertical canopy structure and its varied cooling effect under continuous warming climate. Urban Clim. 2024, 53, 101819. [Google Scholar] [CrossRef]
  6. Escobedo, F.J.; Kroeger, T.; Wagner, J.E. Urban forests and pollution mitigation: Analyzing ecosystem services and disservices. Environ. Pollut. 2011, 159, 2078–2087. [Google Scholar] [CrossRef]
  7. Bussmann, R.W. Destruction and management of Mount Kenya’s forests. Ambio 1996, 25, 314–317. [Google Scholar]
  8. de Araujo Barbosa, C.C.; Atkinson, P.M.; Dearing, J.A. Extravagance in the commons: Resource exploitation and the frontiers of ecosystem service depletion in the Amazon estuary. Sci. Total Environ. 2016, 550, 6–16. [Google Scholar] [CrossRef]
  9. Dadashpoor, H.; Azizi, P.; Moghadasi, M. Land use change, urbanization, and change in landscape pattern in a metropolitan area. Sci. Total Environ. 2019, 655, 707–719. [Google Scholar] [CrossRef]
  10. Deng, X.Z.; Gibson, J. Sustainable land use management for improving land ecoefficiency: A case study of Hebei. China Ann. Oper. Res. 2020, 290, 265–277. [Google Scholar] [CrossRef]
  11. Fu, B.J.; Zhou, G.Y.; Bai, Y.F.; Song, C.C.; Liu, J.Y.; Zhang, H.Y.; Lü, Y.H.; Zheng, H.; Xie, G.D. The mainterrestrial ecosystem services and ecological security in China. Adv. Earth Sci. 2009, 24, 571–576. (In Chinese) [Google Scholar]
  12. Jing, W.L.; Yu, K.H.; Wu, L.; Luo, P.P. Potential Land Use Conflict Identification Based on Improved Multi-Objective Suitability Evaluation. Remote Sens. 2021, 13, 2416. [Google Scholar] [CrossRef]
  13. Li, Y.F.; Zhan, J.Y.; Liu, Y.; Zhang, F.; Zhang, M.L. Response of ecosystem services to land use and cover change: A case study in Chengdu City. Resour. Conserv. Recycl. 2018, 132, 291–300. [Google Scholar] [CrossRef]
  14. Talukdar, S.; Singha, P.; Mahato, S.; Praveen, B.; Rahman, A. Dynamics of ecosystem services (ESs) in response to land use land cover (LU/LC) changes in the lower Gangetic plain of India. Ecol. Indic. 2020, 112, 106121. [Google Scholar] [CrossRef]
  15. Turner, B.L.; Lambin, E.F.; Reenberg, A. The emergence of land change science for global environmental change and sustainability. Proc. Natl. Acad. Sci. USA 2007, 104, 20666–20671. [Google Scholar] [CrossRef]
  16. Wang, M.; Sun, X. Potential impact of land use change on ecosystem services in China. Environ. Monit. Assess. 2016, 188, 248. [Google Scholar] [CrossRef]
  17. Tolessa, T.; Senbeta, F.; Kidane, M. The impact of land use/land cover change on ecosystem services in the central highlands of Ethiopia. Ecosyst. Serv. 2017, 23, 47–54. [Google Scholar] [CrossRef]
  18. Lu, X.; Shi, Y.Y.; Chen, C.L.; Yu, M. Monitoring cropland transition and its impact on ecosystem services value in developed regions of China: A case study of Jiangsu Province. Land Use Policy 2017, 69, 25–40. [Google Scholar] [CrossRef]
  19. Hu, X.S.; Hong, W.; Qiu, R.Z.; Hong, T.; Chen, C.; Wu, C. Geographic variations of ecosystem service intensity in Fuzhou City, China. Sci. Total Environ. 2015, 512–513, 215–226. [Google Scholar] [CrossRef]
  20. Song, W.; Deng, X.Z. Land-use/land-cover change and eco-system service provision in China. Sci. Total Environ. 2017, 576, 705–719. [Google Scholar] [CrossRef]
  21. Kindu, M.; Schneider, T.; Teketay, D.; Knoke, T. Changes of ecosystem service values in response to land use/land cover dynamics in Munessa–Shashemene landscape of the Ethiopian Highlands. Sci. Total Environ. 2016, 547, 137–147. [Google Scholar] [CrossRef]
  22. Wilson, C.L.; Matthews, W.H. Mans Impact on the Global Environment: Assessment and Recommendations for Action. In Report of the Study of Critical Environment Problems (SCEP); MIT Press: Cambridge, MA, USA, 1970; p. 319. [Google Scholar]
  23. Daily, G.C.; Söderqvist, T.; Aniyar, S.; Arrow, K.; Dasgupta, P.; Ehrlich, P.R.; Folke, C.; Jansson, A.; Jansson, B.O.; Kautsky, N.; et al. The value of nature and the nature of value. Science 2000, 289, 395–396. [Google Scholar] [CrossRef]
  24. Obst, C.; Edens, B.; Hein, L. Ecosystem services: Accounting standards. Science 2013, 342, 420. [Google Scholar] [CrossRef]
  25. Xie, G.D.; Zhang, C.X.; Zhang, C.S.; Xiao, Y.; Lu, C.X. The value of ecosystem services in China. Resour. Sci. 2015, 37, 1740–1746. [Google Scholar]
  26. Li, G.; Fang, C.; Wang, S. Exploring spatiotemporal changes in ecosystem service values and hotspots in China. Sci. Total Environ. 2016, 545–546, 609–620. [Google Scholar] [CrossRef]
  27. Ouyang, X.; He, Q.Y.; Zhu, X. Simulation of impacts of urban agglomeration land use change on ecosystem services value under Multi-Scenarios: Case study in Changsha-Zhuzhou-Xiangtan Urban Agglomeration. Econ. Geogr. 2020, 40, 93–102. [Google Scholar]
  28. Fei, L.; Shuwen, Z.; Jiuchun, Y.; Liping, C.; Haijuan, Y.; Kun, B. Effects of land use change on ecosystem services value in West Jilin since the reform and opening of China. Ecosyst. Serv. 2018, 31, 12–20. [Google Scholar] [CrossRef]
  29. Zhang, J.; Liu, Z.L.; Shi, Y.; Zou, Z.Y. Spatial response of ecosystem service value to urbanization in fragile vegetation areas based on terrain gradient. Int. J. Environ. Res. Public Health 2022, 19, 15286. [Google Scholar] [CrossRef]
  30. Yang, J.; Xie, B.P.; Zhang, D.G. Spatial-temporal evolution of ESV and its response to land use change in the Yellow River Basin. China Sci. Rep. 2022, 12, 13103. [Google Scholar] [CrossRef]
  31. Cui, X.F.; Liu, C.C.; Shan, L.; Lin, J.Q.; Zhang, J.; Jiang, Y.H.; Zhang, G.H. Spatialtemporal responses of ecosystem services to land use transformation driven by rapid urbanization: A case study of Hubei Province, China. Int. J. Environ. Res. Public Health 2021, 19, 178. [Google Scholar] [CrossRef]
  32. Chen, G.J. Some theoretical and strategic considerations on the construction of ecological barrier in the upper reaches of Yangtze River. Decis.-Mak. Consult. 2016, 3, 8–9+12. [Google Scholar]
  33. Liu, W.R.; Chen, C.B.; Luo, G.P.; He, H.L. Change processes and trends of land use/cover in the Balkhash Lake basin. Arid. Zone Res. 2021, 38, 1452–1463. [Google Scholar] [CrossRef]
  34. Li, C.A.; Liu, L.; Qu, B.; Nie, C.M.; Ning, L.L.; Li, Y.L.; Wang, H.; Liu, X.Y.; Yang, S.H. Temporal and spatial changes of land use/cover and its driving factors in Anhui Province. J. Nanjing For. Univ. 2023, 47, 213–223. [Google Scholar] [CrossRef]
  35. Ma, S.Z.; Shi, M.C.; Yang, G.S.; Xu, X.T.; Yin, J. Spatial and temporal dynamic change analysis of land use based on GIS: A case study of reclamation area in Tarim Basin. Res. Soil Water Conserv. 2013, 20, 177–181. [Google Scholar]
  36. Zhu, L.N.; Zhao, M.D.; Li, Y.F.; Fan, Y.; Wang, J. The Space-time Relationship beteen the Ecosystem Service Value and the Human Activity Intensity in Xi’an Metropolitan Area. J. Ecol. Rural Environ. 2024, 40, 325–334. [Google Scholar] [CrossRef]
  37. Ma, W.B.; Yang, F.; Wang, N.; Zhao, L.J.; Tan, K.; Zhang, X.F.; Zhang, L.J.; Li, H.D. Study on the spatial-temporal evolution and driving factors of ecosystem service value in the Yangtze River Delta urban agglomeration. J. Ecol. Rural Environ. 2022, 38, 1365–1376. [Google Scholar] [CrossRef]
  38. Chen, W.X.; Li, J.F.; Zhu, L.J. Spatial differentiation of ecosystem service value in the middle reaches of Yangtze River and sensitivity analysis. J. Nat. Resour. 2019, 34, 325–337. [Google Scholar] [CrossRef]
  39. Jia, Z.H.; Gu, G.F. Temporal and spatial evolution of population distribution in Northeast China and its influencing factors. Econ. Geogr. 2016, 36, 60–68. [Google Scholar] [CrossRef]
  40. Ka, S.M.; Yang, S.T.; Si, M.Y. Effects of land use change on ecosystem service value in Ebi Lake Basin, Xinjiang. Trans. Chin. Soc. Agric. Eng. 2019, 35, 260–269. [Google Scholar] [CrossRef]
  41. Du, M.Y.; Shu, M.Y.; Cai, J.G. Temporal and spatial changes of land use and landscape pattern in Qingshan Lake region, Lin’an District. Shaanxi For. Sci. Technol. 2021, 49, 28–34. [Google Scholar] [CrossRef]
  42. Yu, K.J. Climate Design for One Planet. Landsc. Archit. Front. 2024, 12, 4–7. [Google Scholar] [CrossRef]
  43. Gao, Y.J.; Zhao, J.Y.; Yu, K.H. Effects of block morphology on the surface thermal environment and the corresponding planning strategy using the geographically weighted regression model. Build. Environ. 2022, 216, 109037. [Google Scholar] [CrossRef]
  44. Han, Z.; Song, W.; Deng, X.Z. Responses of ecosystem service to land use change in Qinghai Province. Energies 2016, 9, 303. [Google Scholar] [CrossRef]
  45. Zhang, Q.W.; Yang, Y.; Yuan, Y.; Han, J.Y.; Li, D.H. Research on the Territorial Ecological Restoration of Counties for the Increase of Carbon Sinks—A Case Study of Wensu County, Xinjiang Uygur Autonomous Region, China. Landsc. Archit. Front. 2024, 12, 10–26. [Google Scholar] [CrossRef]
  46. Zhou, D.Y.; Wang, J.; Zhou, F.J. Evaluation of land use change and ecosystem service value based on multi-scenario analysis of PLUS model. J. Gansu Agric. Univ. 2023, 58, 198–209. [Google Scholar] [CrossRef]
  47. Long, H.; Liu, Y.; Hou, X.; Li, T.; Li, Y. Effects of land use transitions due to rapid urbanization on ecosystem services: Implications for urban planning in the new developing area of China. Habitat Int. 2014, 44, 536–544. [Google Scholar] [CrossRef]
  48. Wang, Z.; Wang, H.Y.; Qin, F.; Han, Z.; Miao, C. Mapping an urban boundary based on Multi-Temporal Sentinel-2 and POI Data: A case study of Zhengzhou City. Remote Sens. 2020, 12, 4103. [Google Scholar] [CrossRef]
  49. Du, X.; Huang, Z. Ecological and environmental effects of land use change in rapid urbanization: The case of Hangzhou, China. Ecol. Indic. 2017, 81, 243–251. [Google Scholar] [CrossRef]
  50. Lian, X. Review on advanced practice of provincial spatial planning: Case of a western, less developed province. Int. Rev. Spat. Plan. Sustain. Dev. 2018, 6, 185–202. [Google Scholar] [CrossRef]
  51. Vialatte, A.; Barnaud, C.; Blanco, J.; Ouin, A.; Choisis, J.-P.; Andrieu, E.; Sheeren, D.; Ladet, S.; Deconchat, M.; Cĺement, F.; et al. A conceptual framework for the governance of multiple ecosystem services in agricultural landscapes. Landsc. Ecol. 2019, 34, 1653–1673. [Google Scholar] [CrossRef]
  52. Yu, K.H.; Zhang, Y.; Li, D.N.; Montenegro-Marin, C.E.; Kumar, P.M. Environmental planning based on reduce, reuse, recycle and recover using artificial intelligence. Environ. Impact Assess. Rev. 2021, 86, 106492. [Google Scholar] [CrossRef]
  53. Xiao, Y.; Huang, M.; Xie, G.; Zhen, L. Evaluating the impacts of land use change on ecosystem service values under multiple scenarios in the Hunshandake region of China. Sci. Total Environ. 2022, 850, 158067. [Google Scholar] [CrossRef] [PubMed]
Figure 1. Location overview map of Chayu County.
Land 14 00398 g001
Figure 2. Research framework.
Land 14 00398 g002
Figure 3. Land use spatial distribution and area conversion map, 2003–2023.
Land 14 00398 g003
Figure 4. Map of land use dynamics and degree index from 2003 to 2023.
Land 14 00398 g004
Figure 5. Time evolution diagram of ESV from 2003 to 2023.
Land 14 00398 g005
Figure 6. ESV spatial distribution map from 2003 to 2023.
Land 14 00398 g006
Figure 7. Contribution rates of various land use types to ESV changes.
Land 14 00398 g007
Figure 8. (ad) ESV change rate chart and ESV sensitivity index chart for various systems/factors.
Land 14 00398 g008
Figure 9. Moran’s I scatter plot and LISA plot of ESV in Chayu County.
Land 14 00398 g009
Table 1. Grading of land use intensity.
TypeUnutilized Prefecture LevelForest, Grass, and Water Use Land LevelAgricultural Land LevelConstruction Land Settlement Level
Land use typeUnused landForestland, grassland, water areaCultivated landConstruction land and residential areas
Graded index1234
Table 2. The ESV coefficients for various types in Chayu County, CNY·hm−2.
Type of Ecosystem ServiceEquivalent Value of Ecosystem Services per Unit Area
Primary ClassificationSecondary
Classification
Cultivated
Land
Forest
Land
Grass
Land
Water
Area
Construction
Land
Unused
Land
Provisioning
services
Food production2796.79639.09590.491105.050.0012.66
Material production620.101468.00868.90615.800.0037.97
Water resources supply−3302.99759.31480.9010,984.670.0025.31
Regulating
services
Gas regulation2252.624827.943053.942404.480.00164.52
Climate regulation1176.9314,445.858073.995424.000.00126.55
Purify the environment341.695644.202665.177853.790.00518.86
Hydro logical regulation3783.899453.405914.00112,715.120.00303.72
Supporting
services
Soil conservation1316.145878.323720.612733.510.00189.83
Maintain nutrient cycling392.31449.26286.77210.830.0012.66
Biodiversity430.285353.133383.238799.630.00177.17
Cultural
services
Aesthetic landscape189.839390.121493.315661.150.0075.93
total9997.5758,308.6030,531.31158,508.030.001645.17
Disclaimer/Publisher’s Note: The statements, opinions and data contained in all publications are solely those of the individual author(s) and contributor(s) and not of MDPI and/or the editor(s). MDPI and/or the editor(s) disclaim responsibility for any injury to people or property resulting from any ideas, methods, instructions or products referred to in the content.

