1. Introduction
Since China initiated its reform and opening-up policies, urbanization has rapidly progressed, leading to the formation of a unique dualistic space with both urban and rural characteristics in the transitional area between city and countryside: the urban–rural fringe. Synthesizing the views of scholars, the urban–rural fringe is a highly dynamic, complex, and heterogeneous physical region formed by the interaction and interpenetration of urban and rural territorial systems [
1,
2], The central manifestation of its locational characteristics is ‘transitory’. There is a clear gradient of change between urban and rural elements, along with frequent flows of energy and materials within the region, embodying a paradoxical duality [
3]. In the new urbanization period, there is a trend towards the integration and coordinated development of urban and rural elements, as urban resources increasingly suburbanize. The urban–rural fringe is increasingly becoming the frontline for urban–rural restructuring and factor connectivity, highlighting its importance in strategic development importance. Therefore, the study of urban–rural fringe has an important role in the layout of urban development, urban–rural industrial transformation, and urban–rural integrated development. Although the urban–rural fringe is a complex and chaotic system [
4], it comprises a multitude of elements that fluctuate between urban and rural characteristics, interpenetrating and intermingling to manifest a diverse array of attributes. This diversity also provides a theoretical basis for identifying the urban–rural fringe [
4].
The development and evolution of urban–rural fringes are closely linked to urbanization, which significantly shapes their structure. The expanding of urban–rural fringes leads to shift in the industrial and economic structure of the outer regions, altering land use types, landscape structures, and the territorial extent of urban–rural fringes [
5,
6]. At the societal level, urbanization influences the distribution of urban–rural fringe structures through changes in population mobility patterns and the formulation of urban development plans and land use policies [
7,
8]. Given the dynamic nature of urbanization, research on urban–rural fringes should transition from static to dynamic approaches, which is the starting point of this study.
In the context of global urbanization research, European scholars have recently focused on the impact of urban expansion on environmental and social sustainability in urban–rural fringes. Hungarian scholars have demonstrated that urban expansion in post-socialist cities has led to the decentralization of population, capital, and activities [
9]. Additionally, European scholars have explored the mitigating effects of green belts on urban sprawl [
10]. In contrast, China’s urbanization has been rapid and unevenly developed, particularly between the east and the west. The majority of urbanization occurred between 1978 and 2015, during which the number of cities more than tripled from 193 to 650, positioning China as one of the most urbanized countries in the world [
11]. Particularly after China’s 10th Five-Year Plan, the flexible transformation of China’s urban and rural household registration system intensified population mobility between urban and rural areas. A large number of people moved to the urban fringes, contributing to China’s urbanization process and integrated urban–rural development strategy. Although land in China is strictly classified as state-owned or collectively owned, the accumulation of large amounts of capital both within and outside cities—supported by China’s public policies and socioeconomic development—led to the expropriation of some land and its transformation into state-owned land. Meanwhile, China’s real estate sector experienced dramatic expansion, marked by significant growth in the construction of urban infrastructures and housing [
12]. These factors collectively provide the basis for the development of China’s urban–rural fringe.
China’s rapid urbanization presents several challenges. Socioeconomic imbalances have led to polarized levels of urbanization, with rapid expansion of large cities or urban agglomerations in the eastern part of the country, while cities in the west are relatively smaller and less developed. The disparity between large, medium, and small cities is a distinguishing feature of China’s rapid urbanization. To address these imbalances, several development policies have been introduced, aimed at promoting coordinated and sustainable urban agglomerations to improve inter-regional economic equality and curb the sprawl of large cities [
13,
14]. Urban–rural fringes offer potential solutions for improving the urban structure due to their unique geographic space. These areas often lose their distinct urban or rural identities, exhibit ambiguities, and eventually undergo urbanization [
14,
15], which may prompt efforts to curb uneven urbanization in these areas. Some scholars consider urban–rural fringes to be buffer zones within the urbanization process [
16], viewing these areas as having a protective role against urbanization’s encroachment. However, the siphoning effect of large cities makes many current policies insufficient to prevent the urbanization-driven erosion of peripheral land. Without alternatives to unchecked urban expansion, urban–rural fringes are likely to integrate into urban land use over the long term [
17]. Consequently, there is a pressing need for research into the identification of urban–rural fringes in large cities, with a view to adopting appropriate policies for planning and utilization [
18,
19].
Identifying the extent of the urban–rural fringe is fundamental to this study’s premise and focus. In the early stages of research, constrained by technical and data limitations, most studies concentrated on the qualitative delineation of urban–rural fringes. Some foreign scholars view urban areas, urban–rural fringes, and villages as forming an idealized “concentric circle” structure, The urban–rural fringe is situated within a radius of 50 to 150 km from the periphery of the urbanized zone [
20,
21,
22]. Most qualitative studies rely on scholars’ experience and subjective judgments, leading to inherently limited identification results. As research advances, scholars increasingly adopt quantitative methods for identifying urban–rural fringes [
23]. In the early stages of this research area, Chinese scholars tried to delineate urban–rural fringes quantitatively, introducing population density, regional economics, and land use indicators [
24]. However, the identification results are frequently insufficiently detailed for precise delineation. Advancements in remote sensing technology have enabled scholars to primarily use remote sensing image data, combined with geographic models like land use information entropy, impervious surface index, nighttime lighting index, and socioeconomic indicators, for the quantitative delineation of urban–rural fringes [
25,
26,
27,
28]. The selected methods mainly use the Natural Breaks method, catastrophe theory, threshold method, and other geographic information technologies [
13,
14]. These result in more intuitive and precise identifications. Other scholars have used diverse techniques, such as landscape pattern indices, land use degrees, construction land data, wavelet transforms, and other methods, to identify urban–rural fringe areas based on their inherent heterogeneity [
29]. Scholars using such methods have attempted to identify the urban–rural fringe. However, the urban–rural fringe is influenced by a variety of factors, and the results obtained are often one-dimensional. Some scholars have also tried to delineate urban–rural fringes using higher-accuracy remote sensing data or by integrating data from multiple sources. While the results for urban–rural fringes in a single year are improved, it remains challenging to capture the dynamic development patterns of these fringes over time [
30]. With the rise of the Internet and the concurrent growth of big data, scholars have developed innovative methodologies for using POI data, cell phone signaling data, and other digital information. These methodologies employ a range of sophisticated techniques, including deep learning algorithms, k-means unsupervised classification, Getis-Ord Gi* analysis, and other computer-based processes [
31,
32,
33], By abandoning the traditional “concentric circle” model and delineating urban–rural fringes at a finer scale, scholars can enhance the accuracy of the urban–rural fringe scope. For example, algorithmic models such as the Random Forest Model and the Decision Tree Model are beginning to be applied. A team from Wuhan University, for instance, constructed a spatial identification method for urban–rural integration using an NPP and POI fusion model. This method achieves higher accuracy and timeliness by integrating POI and night lighting data [
34]. Such models have the benefit of combining different types of multi-source data to provide a more detailed range of intersecting zones. However, the results are often too granular to serve as methodological innovations for further planning and construction of urban development [
35,
36].
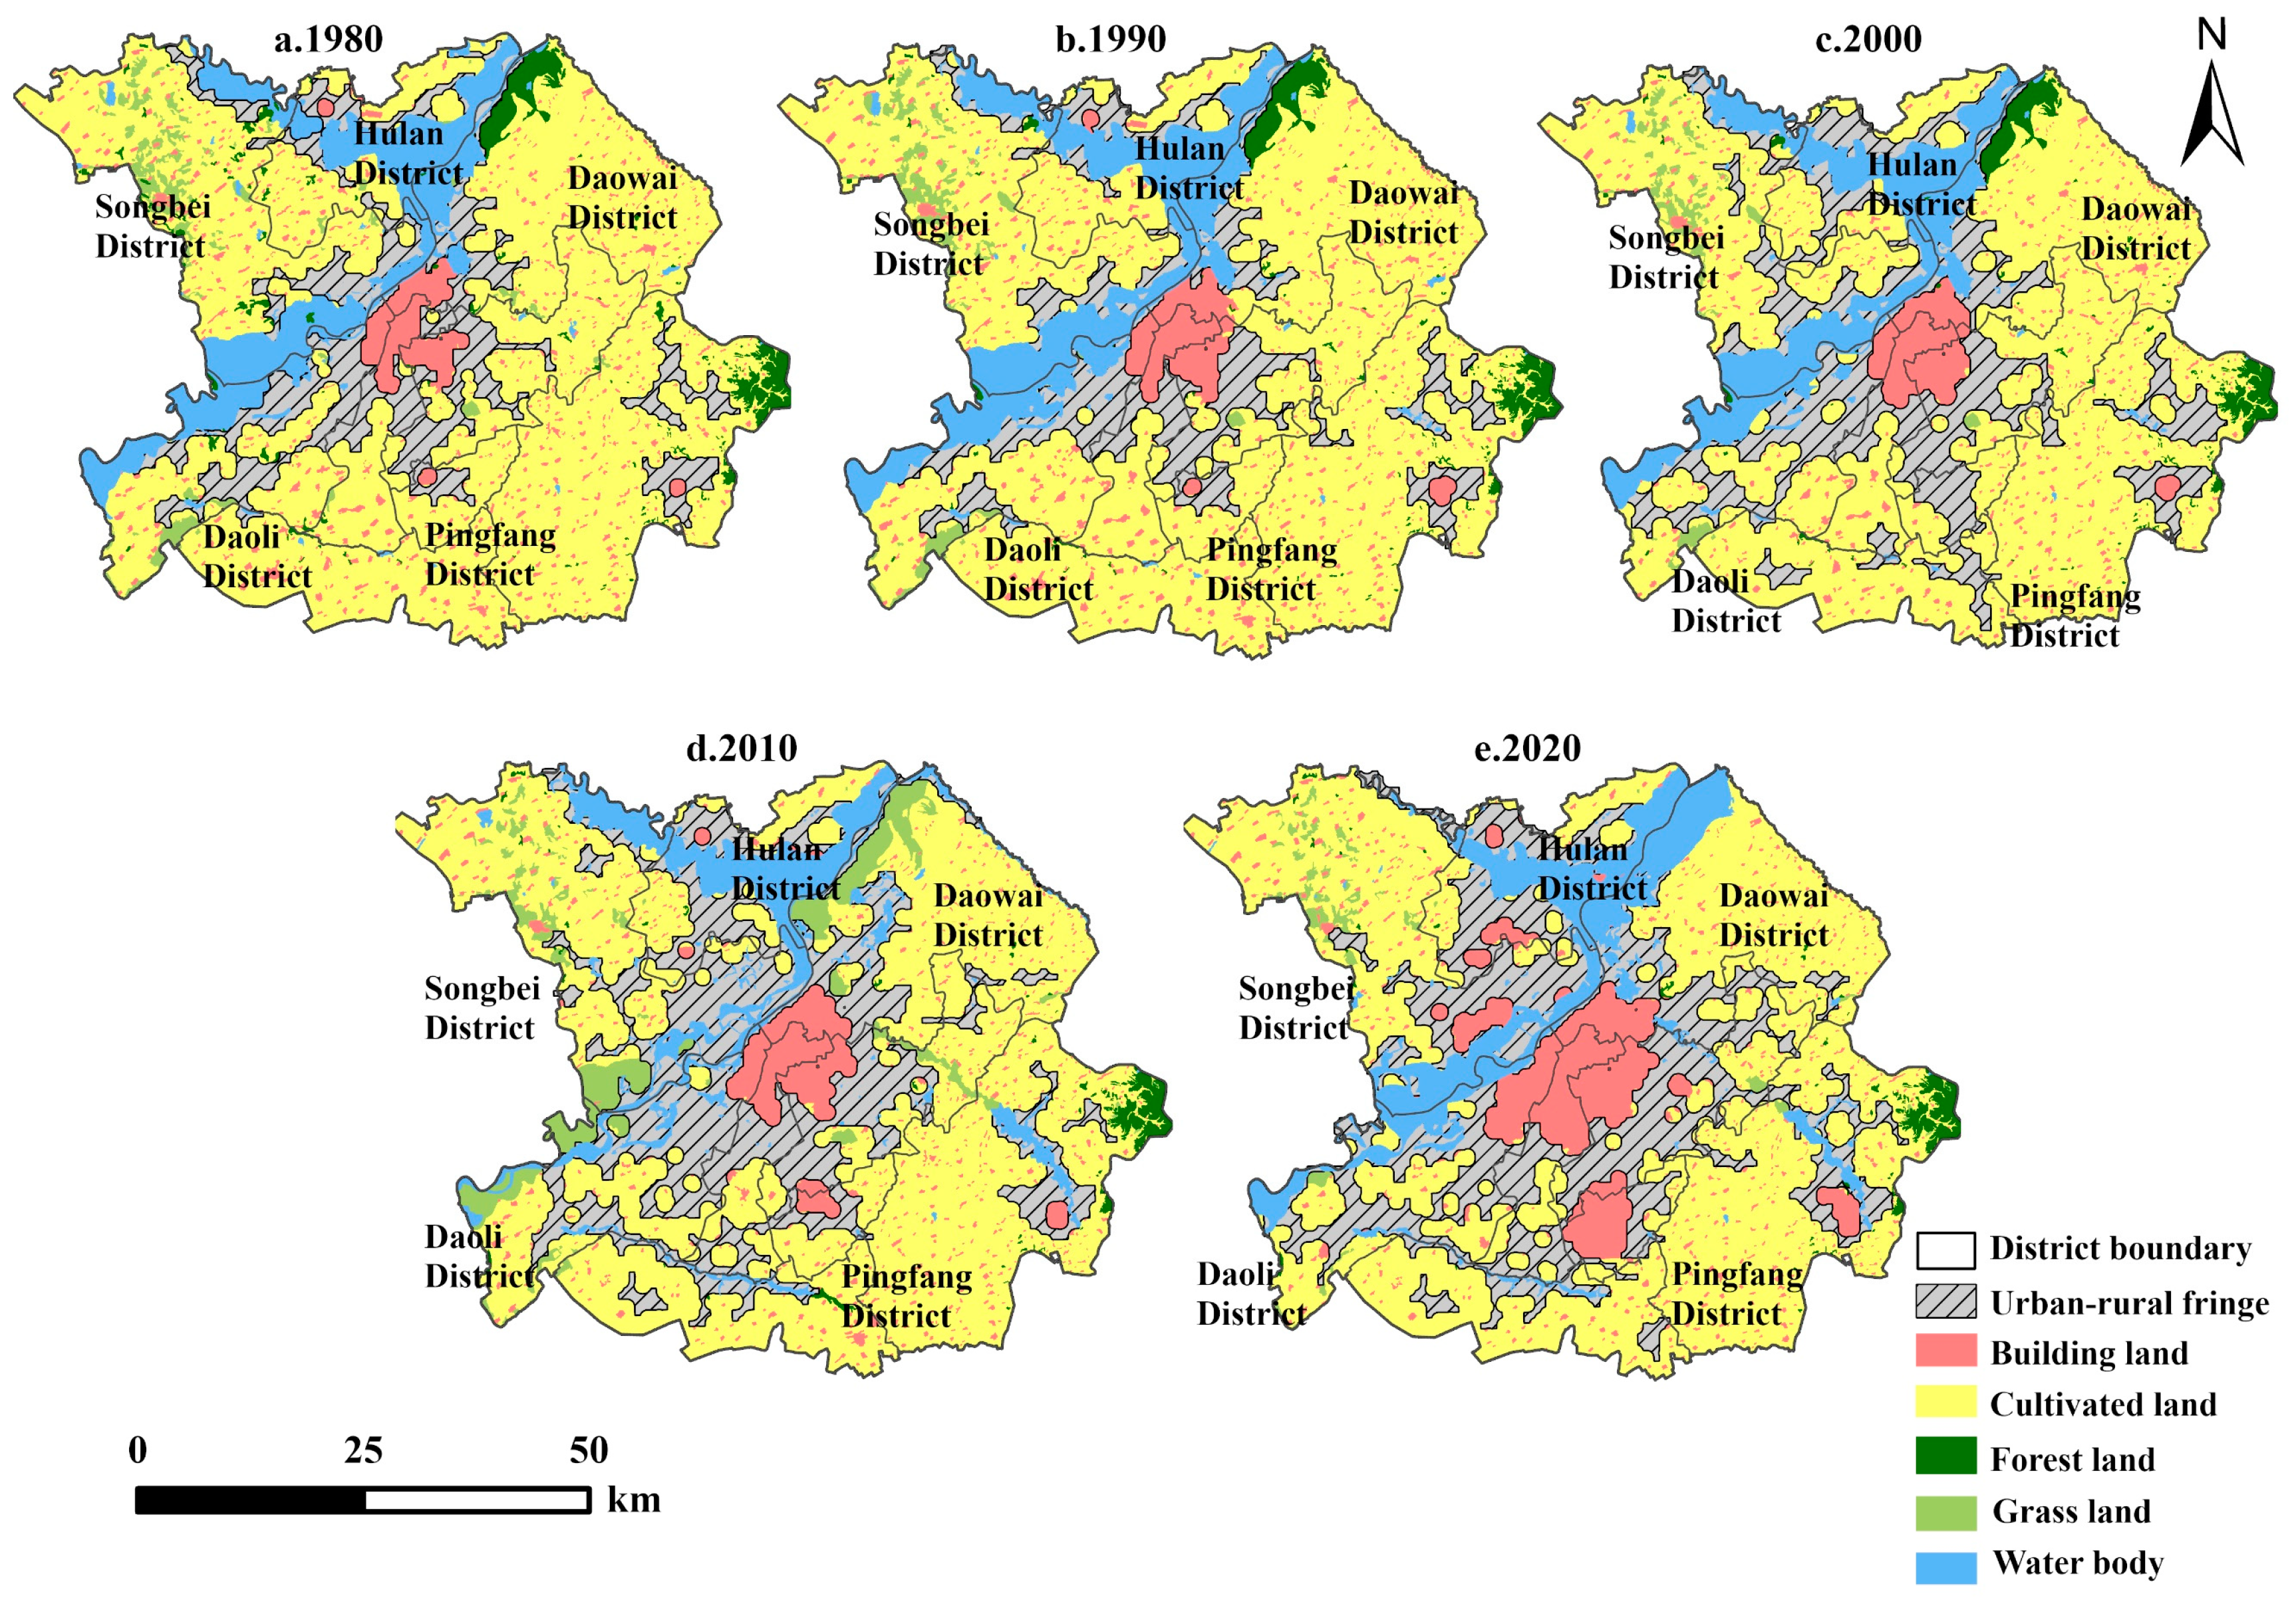
The development of urban–rural fringes during urbanization is complex and varied; however, most studies have used diverse indicator systems to identify these areas in a single period, neglecting their development and evolution. The study of the dynamics of urban–rural fringe can provide theoretical support for the urban expansion mode and urban–rural integrated development. Furthermore, it can offer directional suggestions for national territory spatial planning. The research can provide theoretical reference for formulating functional zoning policy of urban–rural fringe, optimizing urban development pattern and restraining urban sprawl. Considering the challenges of integrating socioeconomic data into long-term urban development research, this paper uses land use data (LUCC) from the period of economic reform to develop an information entropy model for identifying urban–rural fringe evolution in Harbin City from 1980 to 2020.
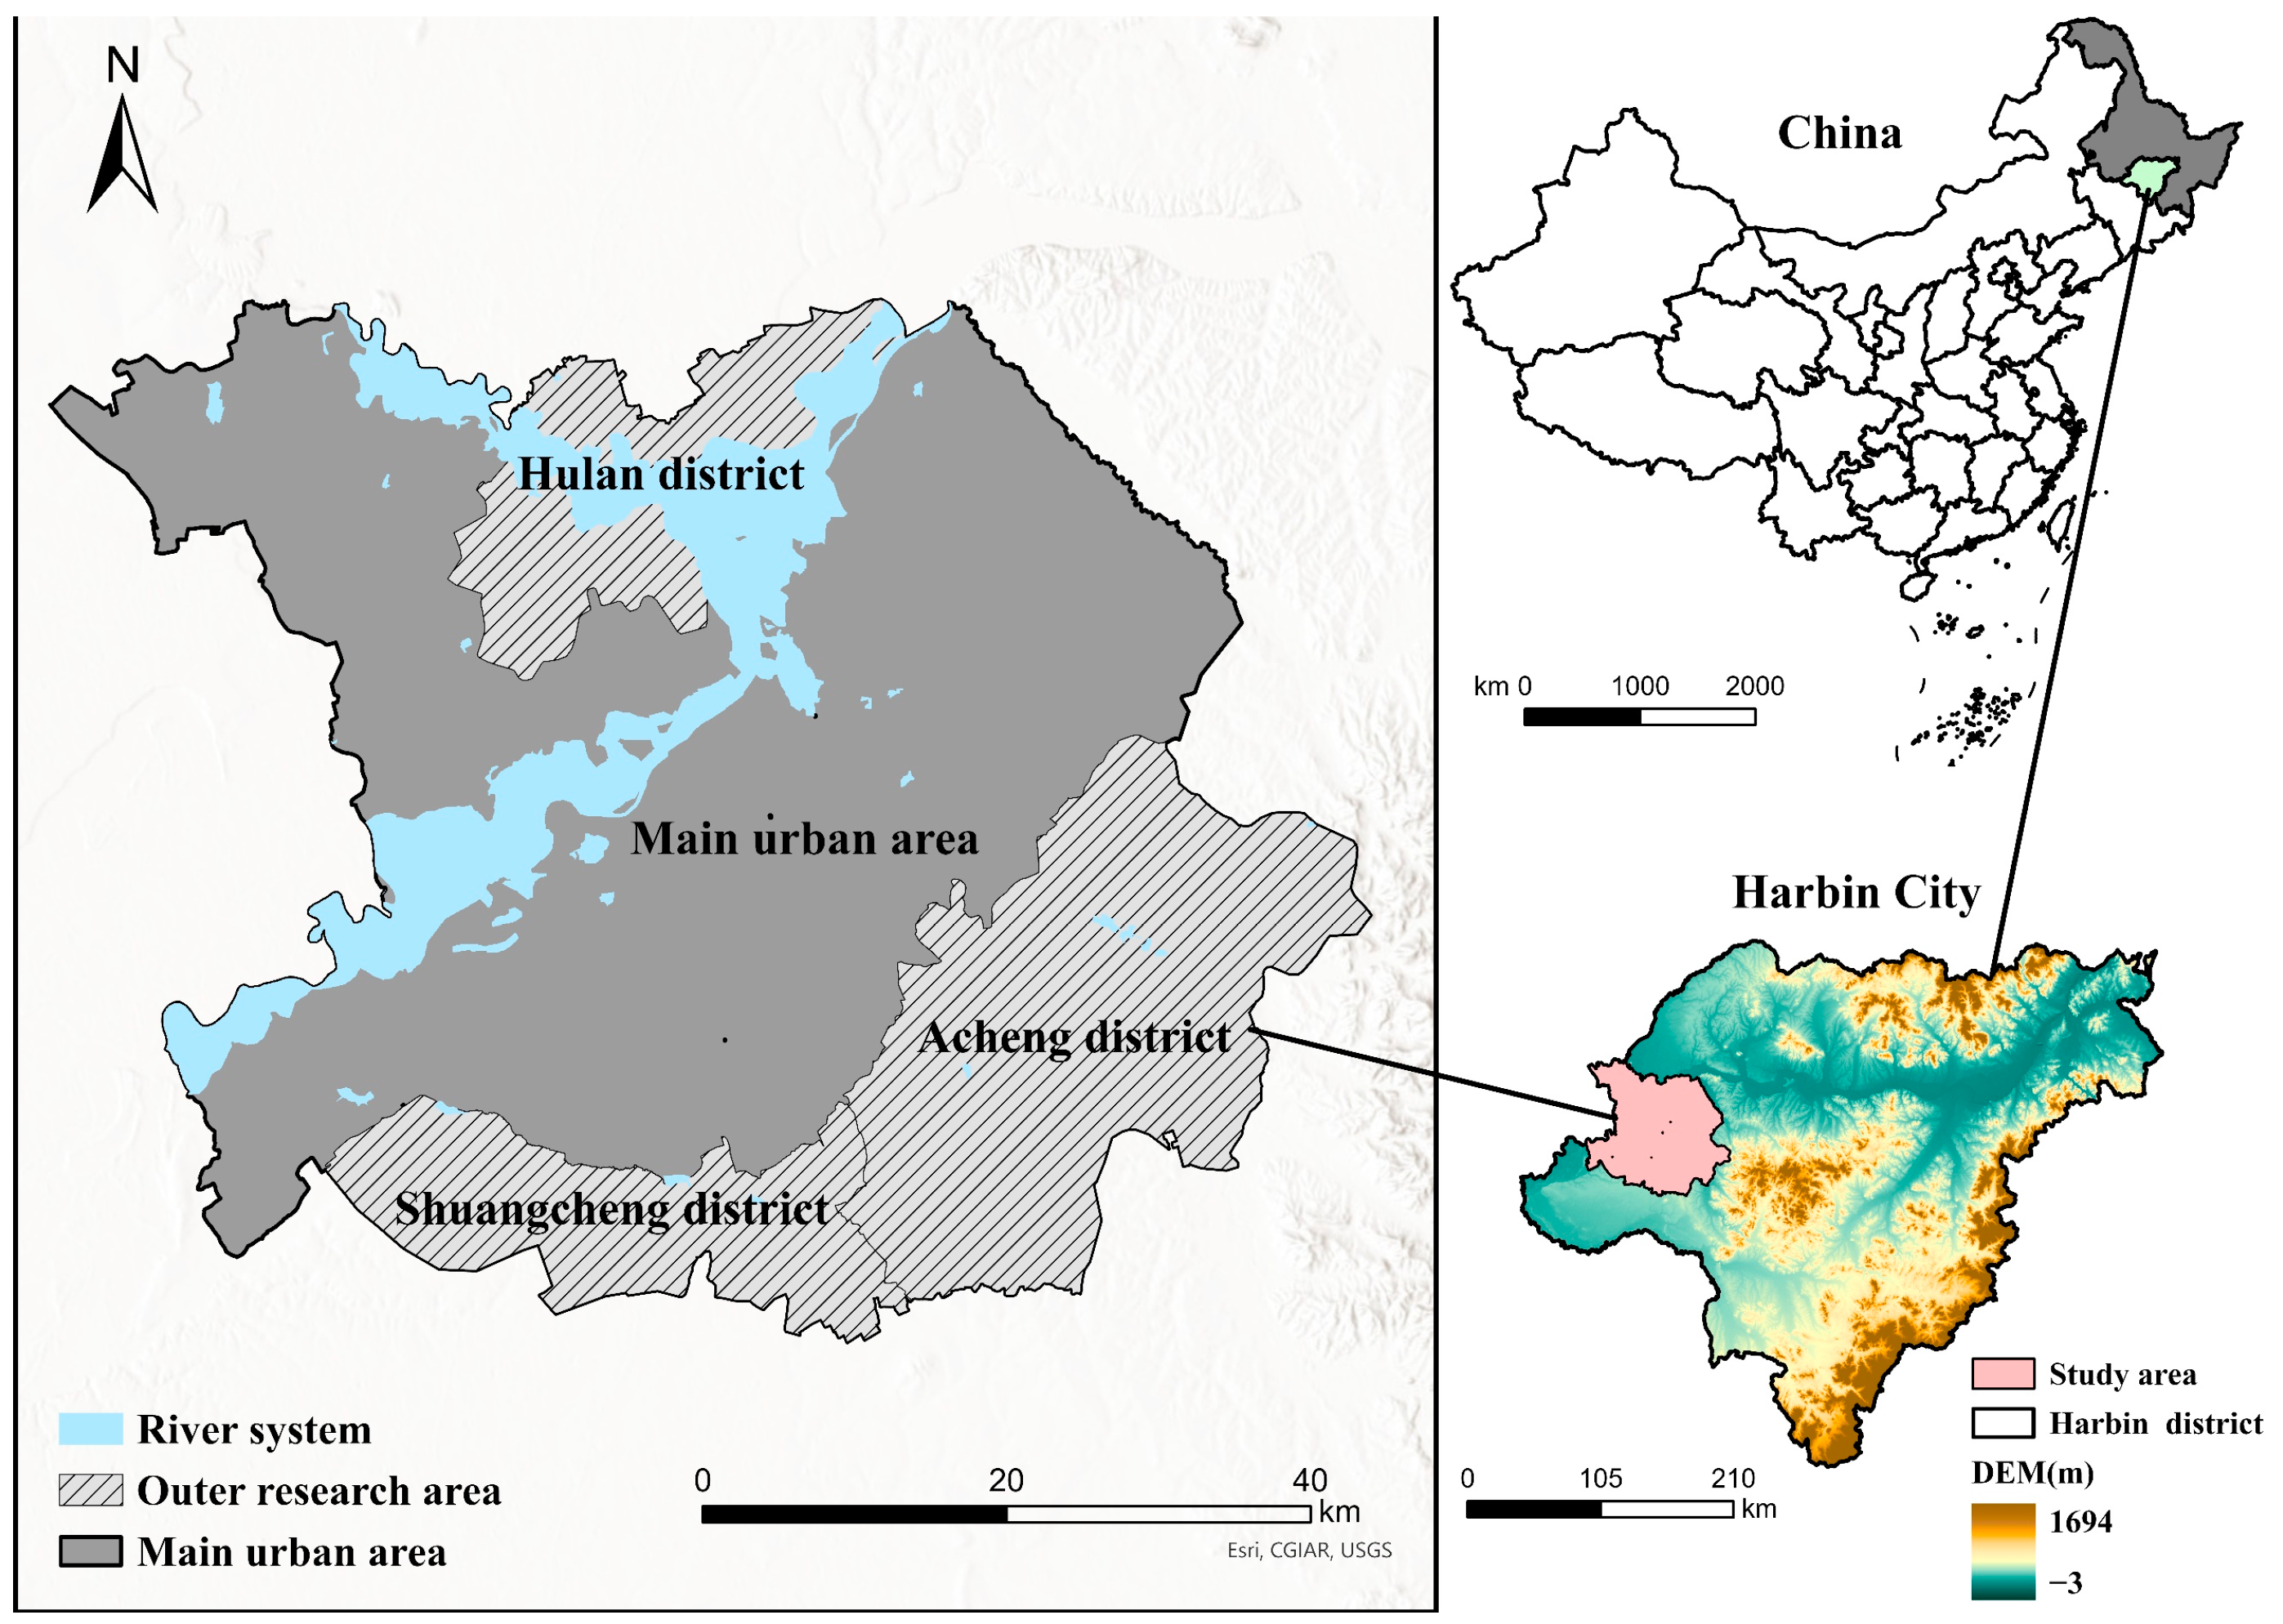
In the early years after the country’s founding, Harbin served as a key hub for agriculture, industry, and other sectors, achieving initial urbanization. After the reform and opening up, China’s economy developed rapidly, and Harbin City went through a significant urbanization and industrial transformation. Its dependence on the Songhua River basin includes a vast expanse of villages and agricultural land encircling the urbanized area. This makes it a crucial hub for the revitalization of rural communities and the assurance of food security. However, the haphazard expansion of the city scale has led to severe compression between the built-up area and the countryside, causing drastic spatial changes and increasingly prominent contradictions in urban–rural relationships. Simultaneously, the old industrial base has experienced a series of changes, including periods of growth and decline. This is exemplified by the diverse development types in the northeast region, illustrating the typical contradictions faced by cities in similar situations. Harbin, as a study city on the urban–rural fringe, is a representative city with diverse land use types. Urbanization in Harbin is not a one-step process; it involves ups and downs and fluctuations in different phases. The complexity of its urban development situation is comparable to that of the vast majority of other medium-sized and large cities in China. Conducting this study to identify the long-term trajectory of Harbin’s urban–rural fringe development holds significant practical importance. This research will offer a scientific foundation for improving the management and control of Harbin’s urban–rural fringe and guide the evolution and development of urban–rural fringe areas in large-scale cities throughout the whole of China’s northeast region. The technical route of the whole article is presented in the form of the following figure (
Figure 1).
4. Results and Analysis
4.1. Characterisation of the Evolution of Land Use Information Entropy
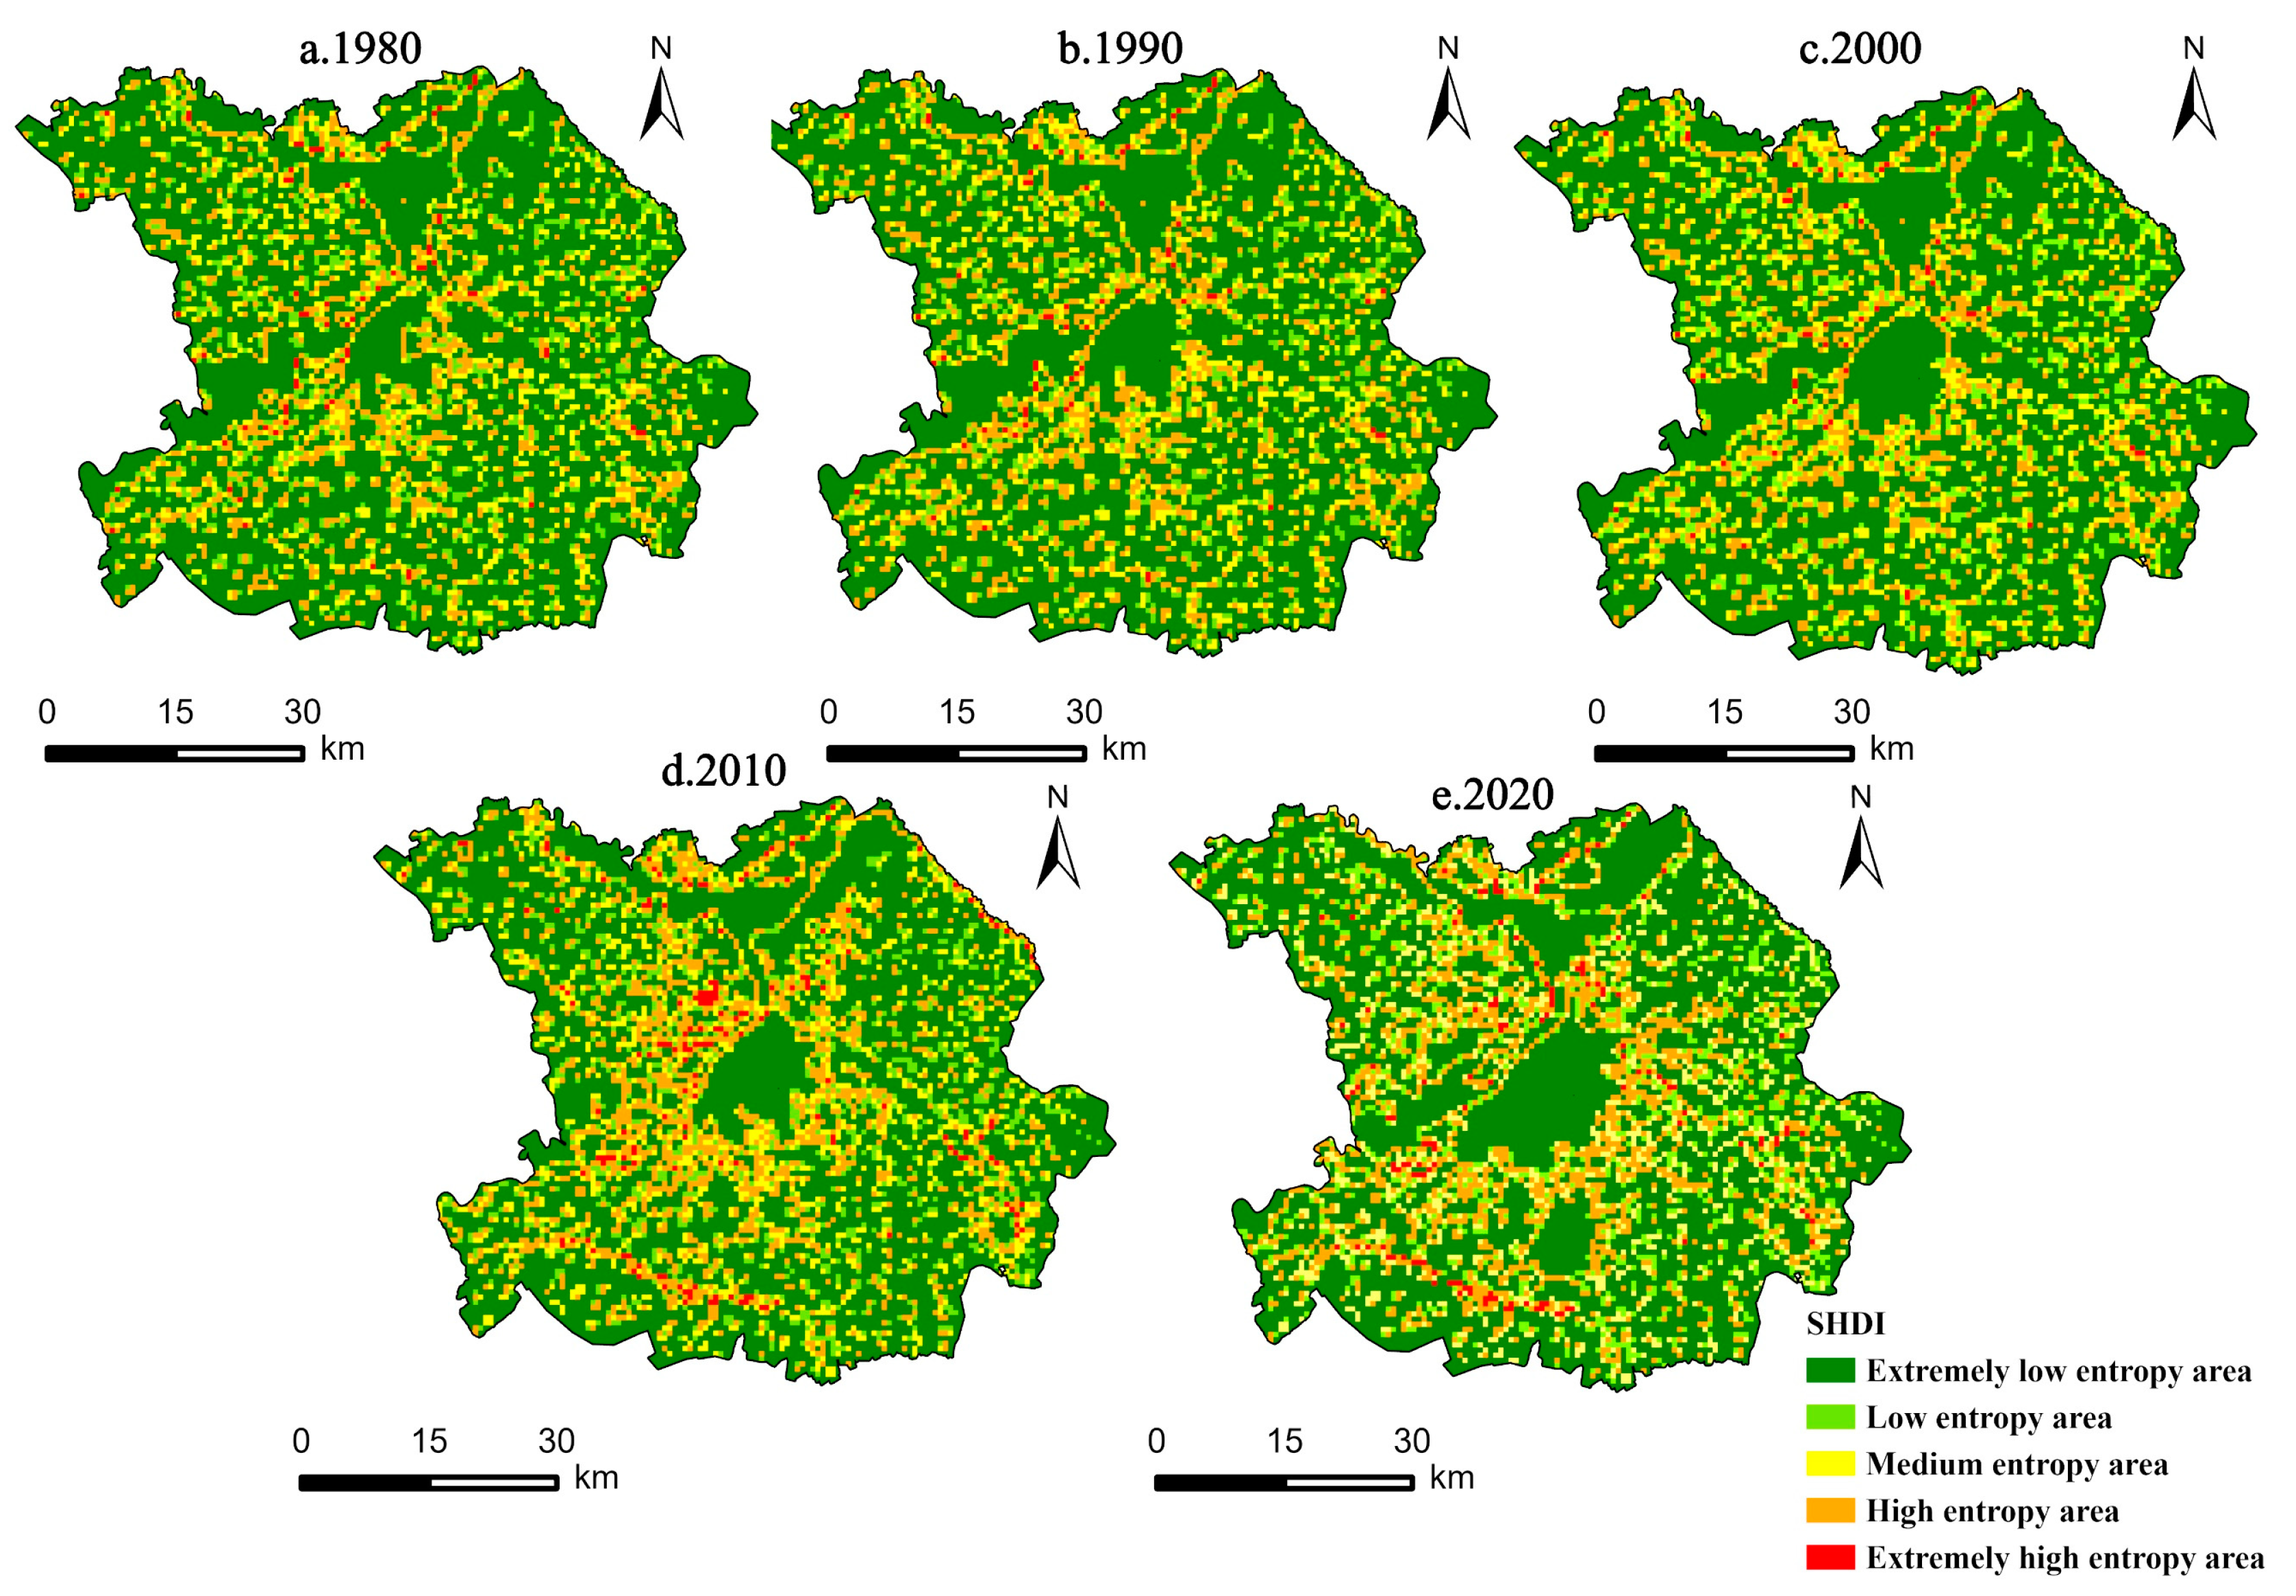
The entropy values for each grid was calculated to visualize the changes in land use information entropy from 1980 to 2020 (
Figure 5). The Jenks Natural Breaks method was used in ArcGIS Pro to categorize the entropy values into five classes: extremely low (0.00–0.12), low (0.12–0.34), medium (0.34–0.54), high (0.54–0.79), and extremely high (0.79–1.10). Grids with a single land use type have an entropy value of 0. In Harbin’s central region, a large, uniform area of low entropy value can be observed, indicating a predominance of urban built-up areas with a single land use type. The area has undergone a continuous expansion and outward spread from 1980 to 2020, reflecting a tangible manifestation of the expansion and developing urbanization. High and extremely high entropy value areas, located at the urban periphery, rapidly expand with the advancement of urbanization. These areas increase in extent, radially infiltrate traditional rural areas, and transition from a scattered distribution to a concentric arrangement around the central urban area. The entropy characteristics of land use information in urban and rural areas are increasingly pronounced.
Land use information entropy values in Harbin’s rural areas are strikingly low. From the urban center outwards to the traditional rural areas, peripheral land use information entropy values demonstrate a circular low–high–low floating fluctuation pattern, with the high values concentrated at the city’s periphery and extending outwards as urbanization progresses. Conversely, the inner-city area is gradually diminished urban expansion, indicating that the urban–rural interface is influenced by multi-dimensional land change drivers and a complex land use system.
4.2. Spatial and Temporal Characterization of the Evolution of Urban–Rural Fringes
By integrating land use structure entropy with the central gravitational agglomeration method and overlaying it on annual watershed data, we obtained the urban–rural fringe evolution in Harbin City from 1980 to 2020. This process reveals the developmental patterns of the urban–rural fringe in a key northeastern Chinese city (
Figure 6).
Over the past four decades, the extent of the urban–rural fringe in Harbin City has increased, with the area continuing to expand. The urban–rural fringe of Harbin is characterized by a ring-shaped configuration surrounding the city’s built-up area. This ring extends outwards, including the Songhua River basin, the Harbin City circle, and rural areas at the urban–rural interface. From 1980 to 2020, the area of the urban–rural fringe exhibited the following changes: 584.25 km2 (1980), 589.85 km2 (1990), 858.75 km2 (2000), 1014.04 km2 (2010), and 1037.3 km2 (2020). To verify the accuracy of the results, field surveys were conducted, and satellite maps of Harbin from 1980 to 2020 were compared. It was found that the urban–rural fringe areas obtained from the study conformed to the characteristics of transitional and complex geographical distribution, confirming that the results have practical significance.
Between 1980 and 1990, the combined growth of township and village enterprises and urban reforms enhanced the transitional characteristics of the urban–rural fringes. The urban–rural fringe extended irregularly from the ribbon at the edge of the core built-up area to the countryside, resulting in an increase of 5.6 km2 in the area of the urban–rural fringe. However, the increase was relatively small, and insufficient penetration and imbalanced interaction between urban and rural elements persisted. The spatial distribution evolution over the decade indicates that the urban–rural fringe is located in Harbin’s outer metropolitan areas. Its spatial distribution includes the Songbei District north of the Songhua River Basin, extending south to the Pingfang District, partially reaching the Daoli District to the west, and the western Songhua River Basin. Over the past decade, Harbin’s urban–rural fringe has undergone relatively slow, gradual development, characterized by minimal area changes and irregular sporadic growth. The shape of the urban–rural fringe has constantly evolved, showing a tendency towards regularity and the emergence of semi-urbanization.
The subsequent two decades were characterized by comprehensive urbanization, accompanied by city-scale expansion and accelerated urban–rural fringe growth, resulting in a net area increase of 424.19 km2. From 1990 to 2000, the urban–rural fringe initially expanded from the interior to the periphery in the southern cottage area’s irregularly distributed spatial pattern, aligning with the area’s expansion. The Pingfang District emerged as a hub for integrating urban and rural systems in Harbin’s southern region, promoting the collaborative growth of neighboring urban and rural components. From 2000 to 2010, the spatial pattern of the urban–rural fringe exhibited a notable expansion, with a discernible divergence between urban and rural systems. The spatial distribution extended to Harbin’s southwestern Daoli District, the southern Nangang District, and along the Songhua River’s downstream basin to the entire Qunli New Area, reaching the northern Hulan District via the Harbin Bypass Highway. By 2010, the eastern urban–rural fringe had expanded to encompass the entirety of Songbei District and its subordinate streets. The spatial expansion trend of the eastern urban–rural fringe is not significant. At this juncture, the expansion range and changing rate of the area are at their zenith, with the urban–rural fringe undergoing a particularly pronounced expansion.
From 2010 to 2020, the urban–rural fringe area in Harbin increased slightly by 23.26 km2. During this period, the expansion of Harbin’s urban built-up area was significantly influenced by urban infrastructure and real estate development. This led to a significant expansion of the urban–rural fringe’s spatial scope, expanding outward in tandem with the city’s growth. Additionally, the entropy value in the inner countryside areas surrounding the city increased compared to the previous period. The increase corresponded with a significant expansion of the urban–rural fringe into the rural hinterland. Furthermore, the expansion of the urban–rural interlaced zone into the rural hinterland was especially notable. The urban–rural fringe is subjected to pressure from the expansion of the Harbin urban built-up area, resulting in a reduction in the encroachment area. This phase is marked by the reconfiguration of the internal spatial patterns within urban and rural areas. Consequently, the entropy value in the previously urban–rural fringe areas, including central Daoli District, northern Pingfang District, and parts of southern Songbei District, has decreased. This evolution is accompanied by the establishment of new urban–rural fringe boundaries along the aforementioned streets, marking the transition to built-up urban areas. Additionally, the spatial scope extends to the eastern part of Daowai District. The region is experiencing gradual urbanization, increasingly encroaching tendency upon rural spaces. During this period, while the urban–rural fringe area increased, the rate of external expansion slowed. By 2020, the external extent of the urban–rural fringe had stabilized. The development pattern of urban–rural fringes shifted towards reconstructing their internal spatial patterns, highlighting significant geographic proximity. This shift was marked by active interactions between urban and rural elements. Overall, the urban–rural fringe’s external expansion proceeded at a slower pace. In comparison to the period between 2000 and 2010, the urban–rural fringe pattern has undergone a shift in development, moving from external expansion to internal restructuring.
In conclusion, Harbin’s urban–rural fringes’ 40-year spatial and temporal characteristics evolution can be succinctly summarized into three phases: ‘low-speed spreading—rapid expansion—internal restructuring’.
4.3. Scale Analysis of the Evolution of Urban–Rural Fringes
The urban–rural fringe is an open and complex system, and due to its dynamic characteristics, we further analyze its evolution based on the above research. This analysis also examines the scale evolution of the urban–rural fringe area. The superposition method was used to analyze changes in the urban–rural fringe over a decade. It is assumed that the base year of the study is year t. The urban–rural fringe areas in year t and year t + 10 are superimposed, and the area that is urban–rural fringe in both year t and year t + 10 is defined as a “stable urban–rural fringe”. The area not classified as urban–rural fringe in year t but becomes so in year t + 10 is termed “expanded urban–rural fringe”. The area that is urban–rural fringe in year t but ceases to be in year t + 10 is termed “degraded urban–rural fringe” [
28].
Regarding the spatial evolution of Harbin’s urban–rural fringe types (
Figure 7), the distribution area of each type is continuously changing and reconfiguring. As can be observed from the specific data presented in
Table 1, From 1980 to 1990, the urban–rural fringe remained stable, exhibiting a fine distribution along the Harbin main urban and Acheng district’s peripheral area. The total area was 499.35 km
2. The expansion of the urban–rural fringe area reached a minimum of 90.51 km
2, with a rate of change of 0.56 km
2/a This figure reached its lowest level at 56 km
2, indicating insignificant spatial change and growth rates for Harbin’s urban–rural fringe from 1980 to 1990. During this period, various urban and rural elements and capitals were accumulating, with a lack of spatial correlation and interaction. Additionally, large-scale urbanization had not yet commenced. From 1990 to 2000, the expanded urban–rural fringe area in Harbin significantly increased to 300.85 km
2. This expansion was spread across the city’s periphery, peaking at 33.78% of the total area. The degraded urban–rural fringe area was 31.95 km
2, accounting for 3.59% of the total and the lowest value observed during the development process. The urban–rural fringe’s change rate was 26.86 km
2/a, which is nearly 48 times higher than that of the 1980–1990 period. This indicates that the urban–rural fringe has undergone a significant transformation in the distribution of urban and rural elements over the past decade, characterized by an increase in urban construction activities, low-density development of urban and rural elements in the outer space, and Harbin’s transition into a more urbanized environment. From 2000 to 2010, the stable urban–rural fringe’s spatial distribution was concentrated around built-up areas, reaching a peak at 436.01 km
2. The area of degraded urban–rural fringe increased to 281.73 km
2, representing 21.68% of the total, and was distributed along the outer edge of the urban–rural fringe. The rate of change of the urban–rural fringe declined to 18.08% and 15.53 km
2/a, and the space of the urban–rural fringe expanded significantly, entering the stage of rapid urbanization. From 2010 to 2020, the expanded urban–rural fringe’s spatial distribution became scattered and diffuse, with its proportion declining to 26.77%. Simultaneously, the degraded urban–rural fringe area peaked at 347.43 km
2. The inner edge of the urban–rural fringe shows a circular distribution. The rate of change for the urban–rural fringe decreased to 2.33 km
2/a. It is evident that Harbin’s urban expansion pace slowed during this period. Interaction between urban and rural areas diminished, while the inner urban–rural fringe experienced intensive development. The capital was released significantly, leading to a reconfiguration of the previous imbalance in the urban–rural relationship within the fringe. This led to a shift towards harmonious and unified development. The focus of urban–rural fringe development transitioned from prioritizing speed to a balanced approach, considering quality as well as speed. The emphasis on urban–rural cross-border development has transitioned from speed to quality.
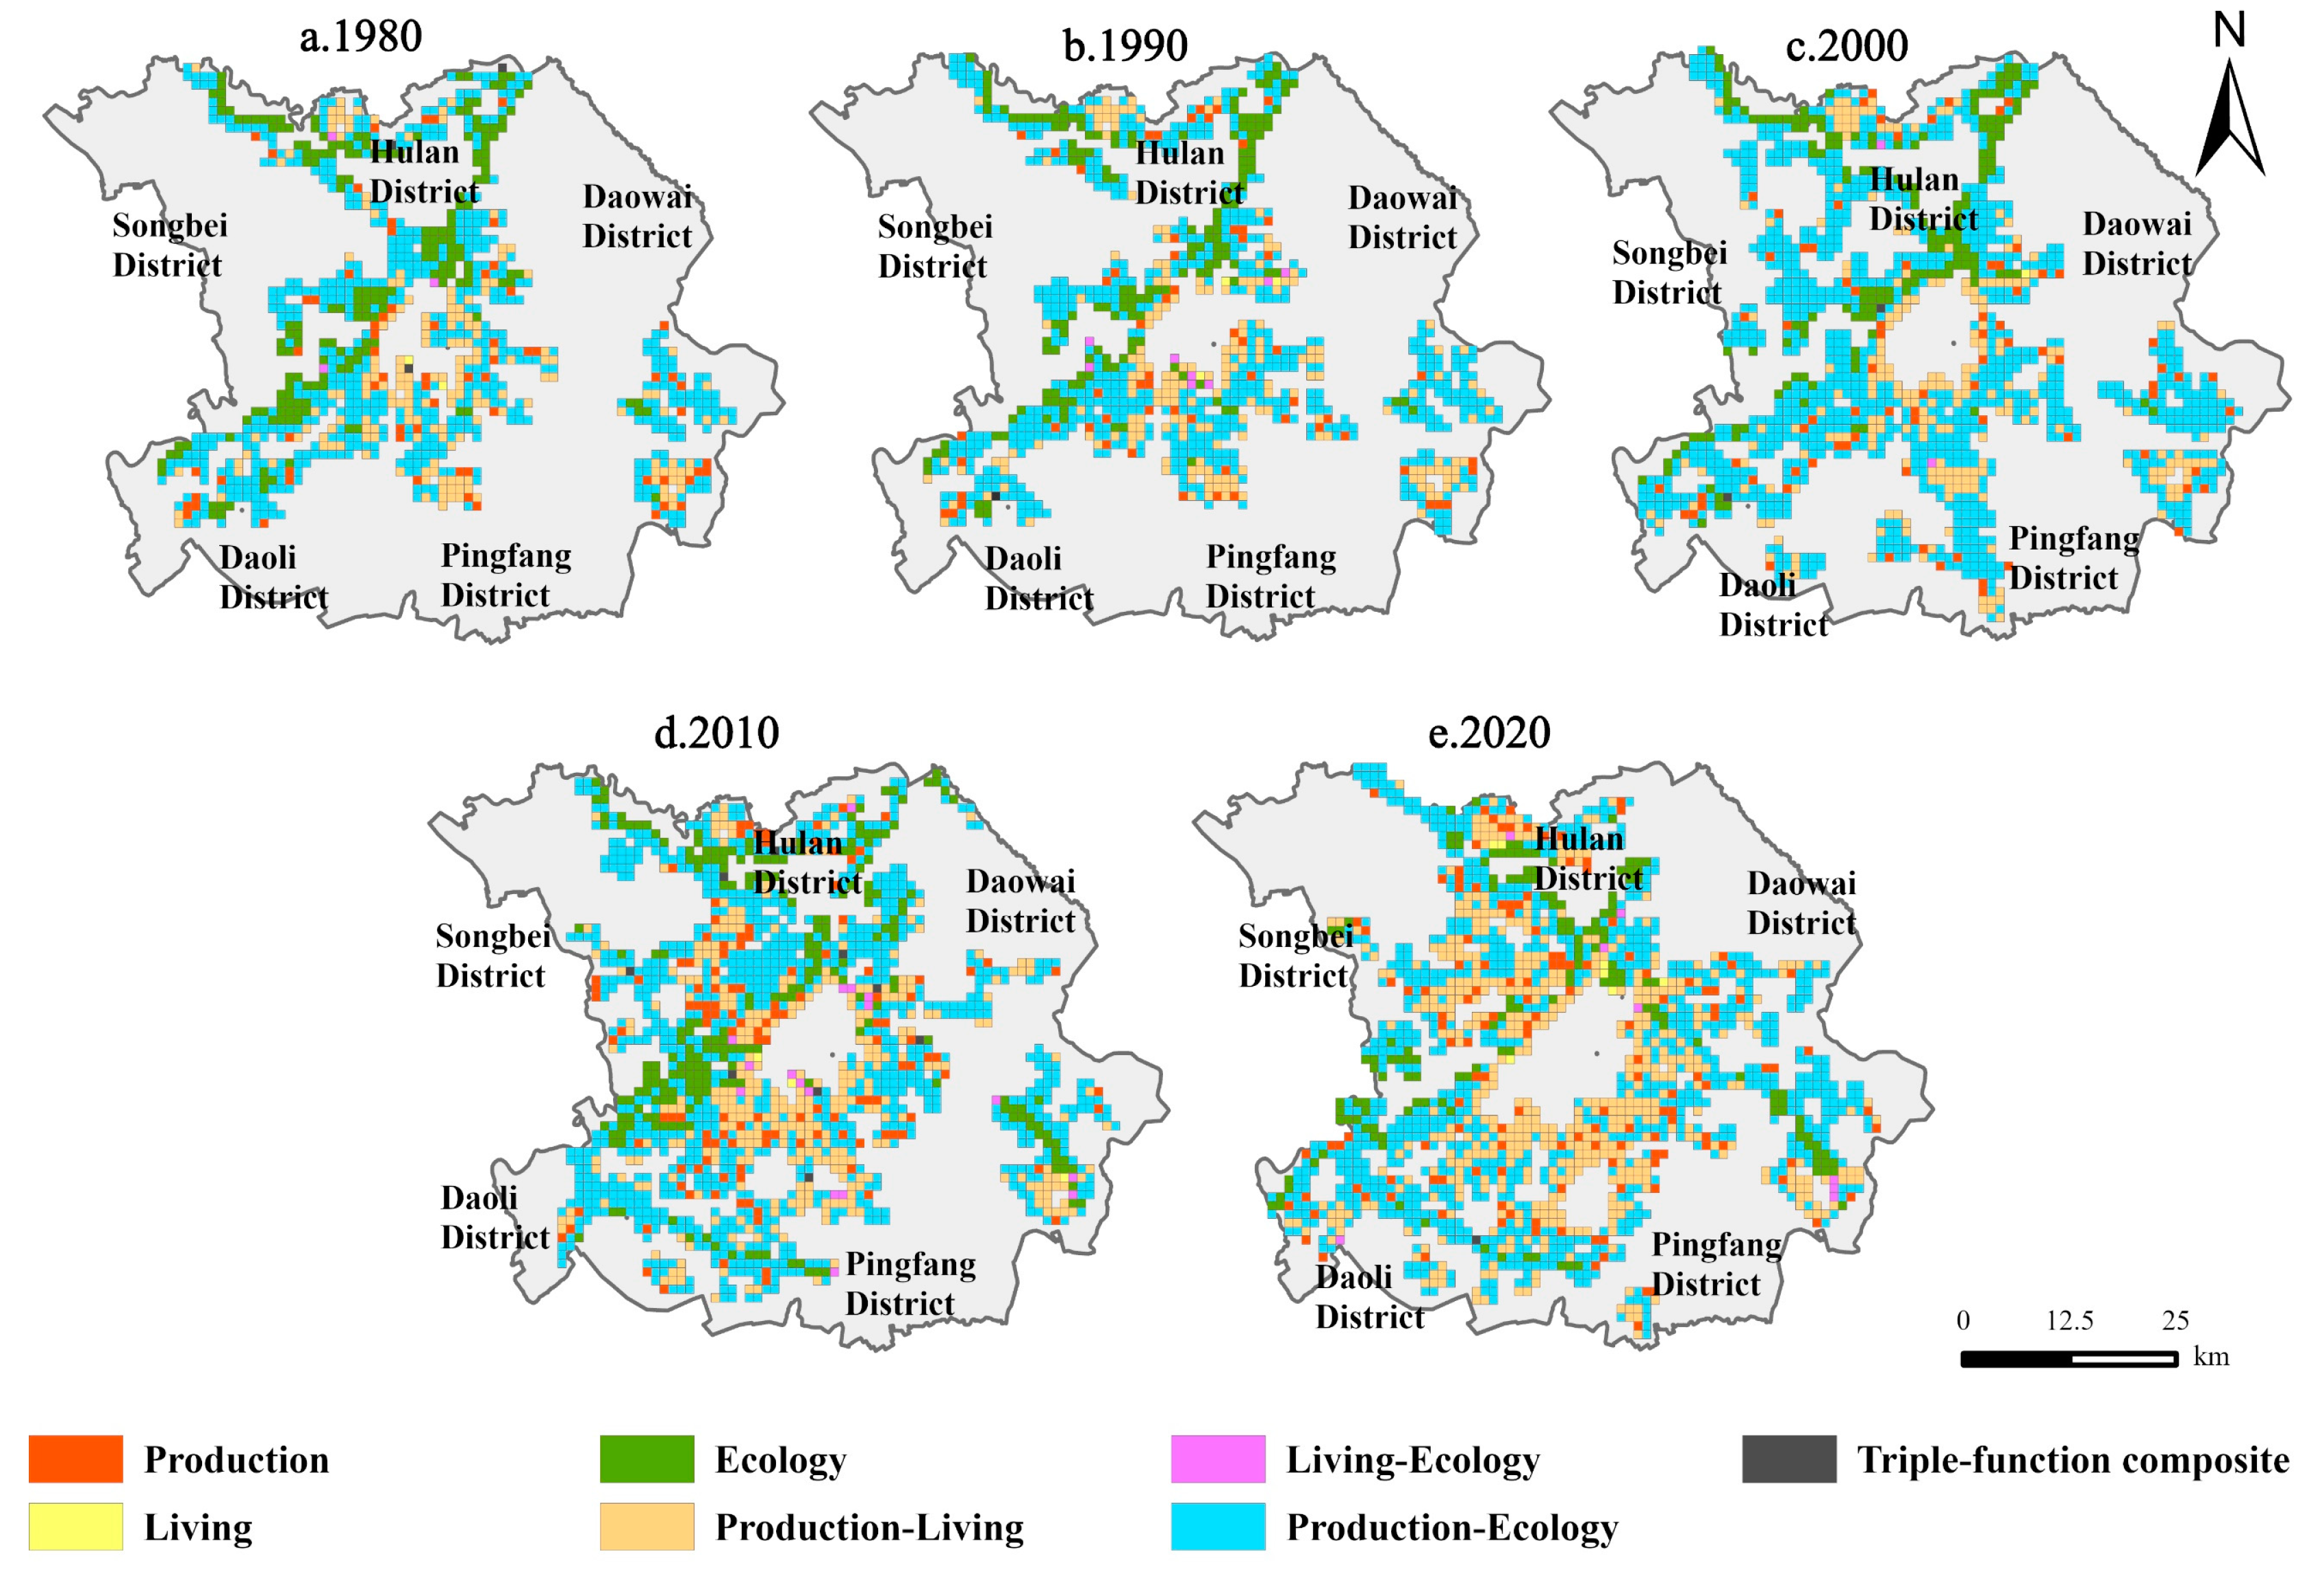
4.4. Analysis of the Functional Evolution of Urban–Rural Fringes
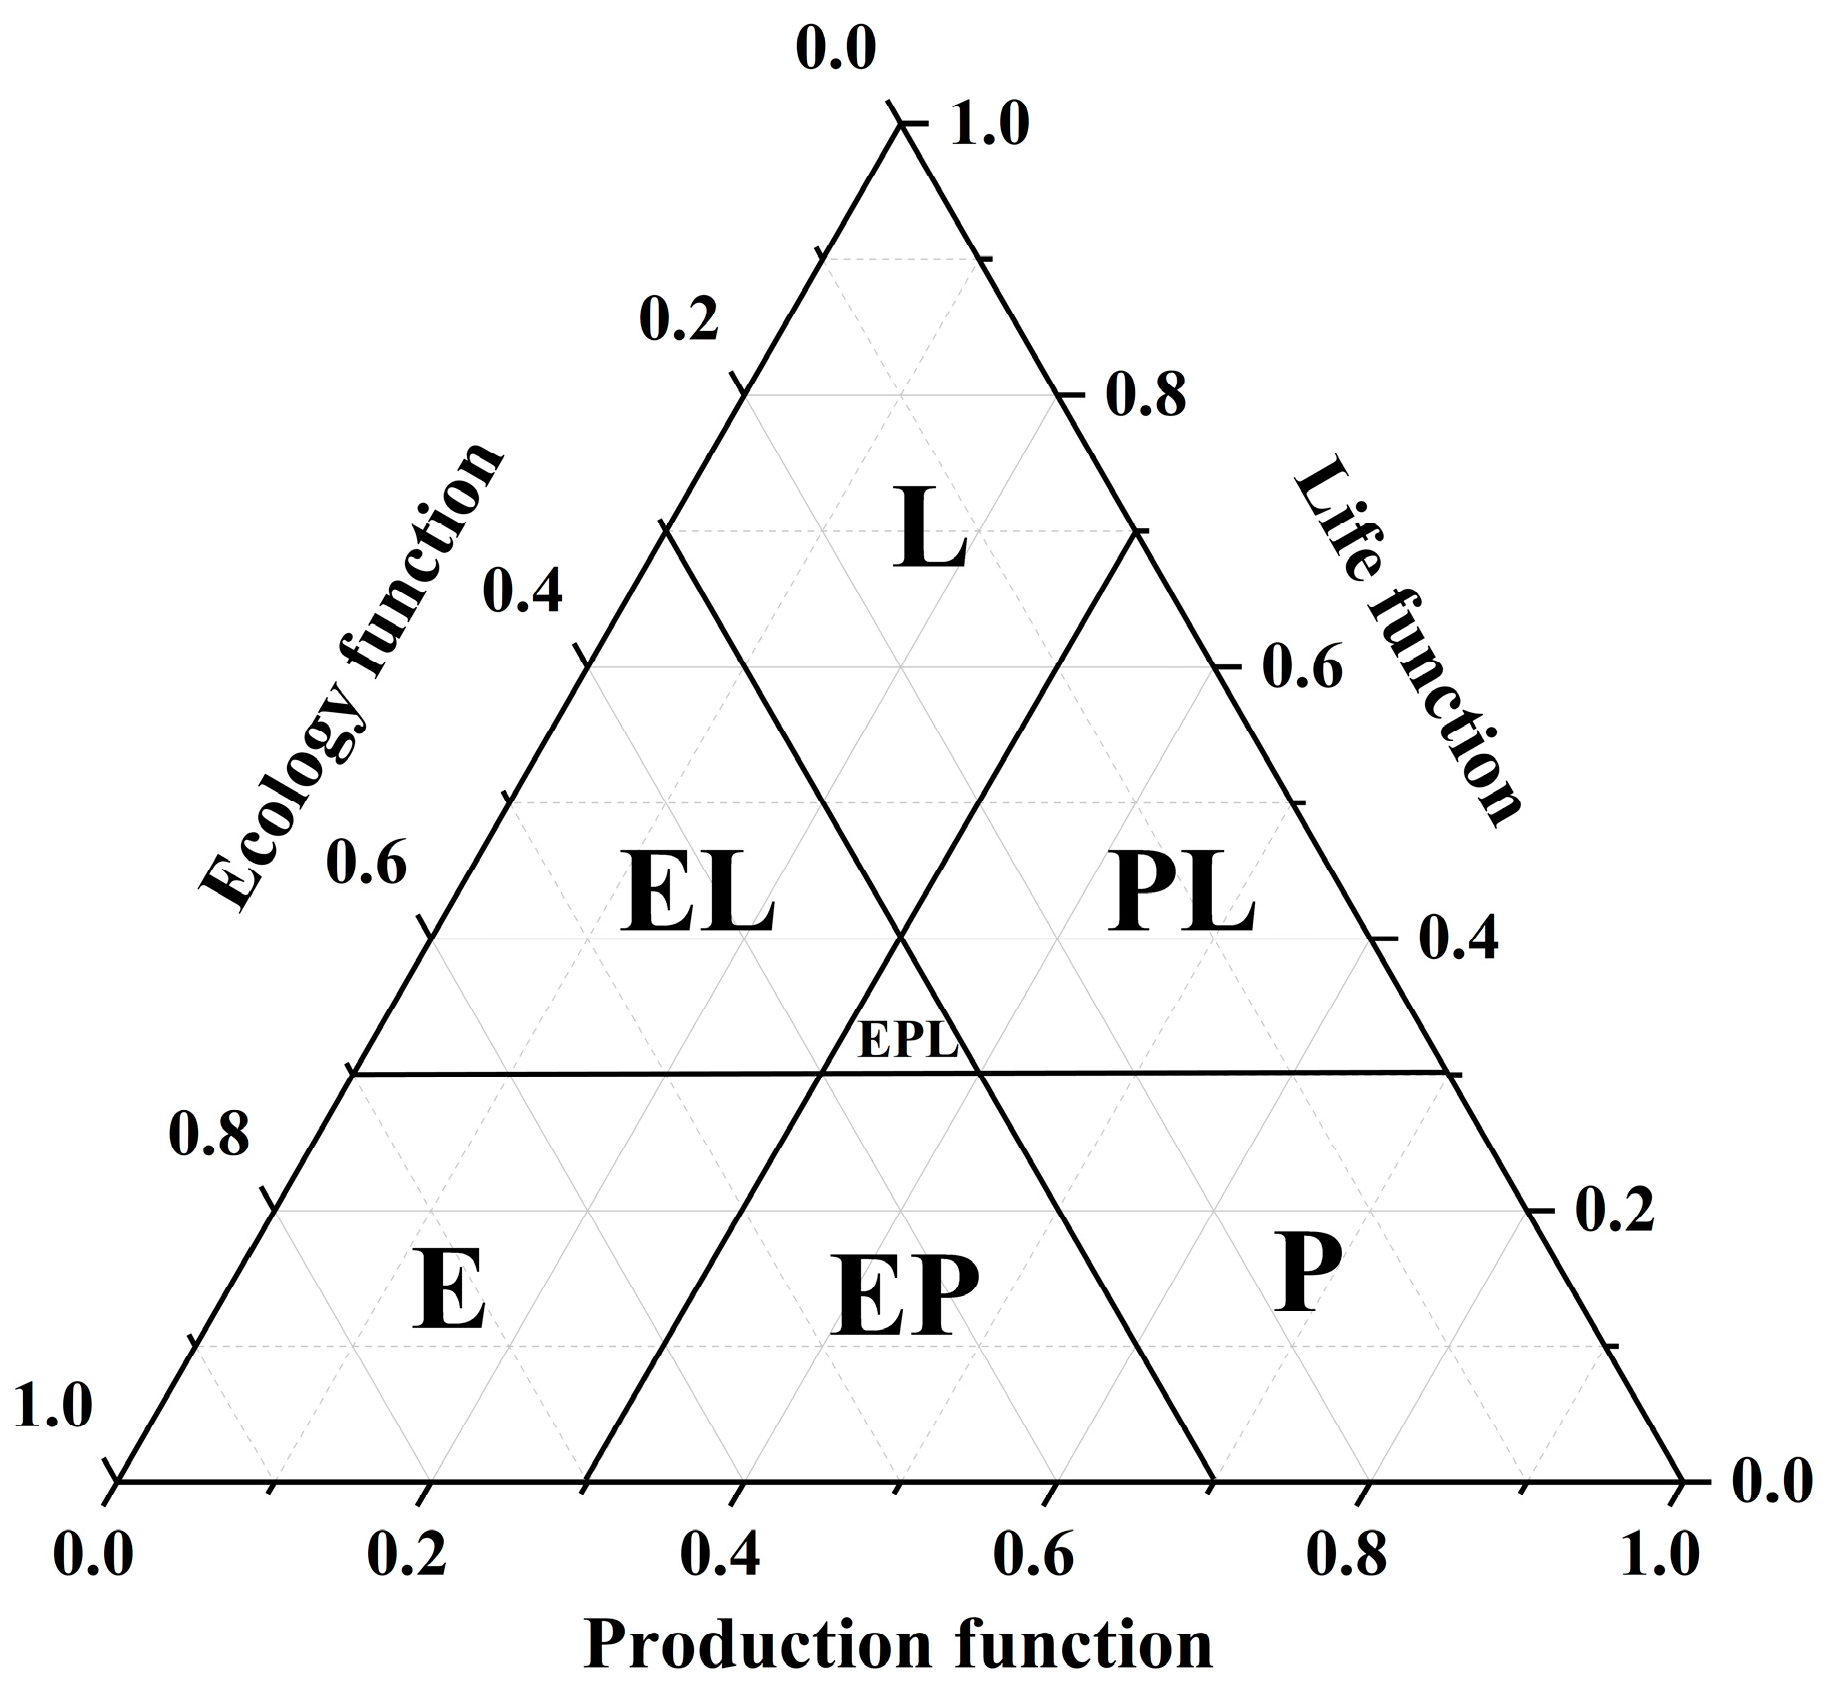
The functional pattern of the urban–rural fringe can be visualized through the analysis of grid units’ distribution in the functional triangle diagram. The evolution of the functional positioning of the urban–rural fringe in Harbin is illustrated in
Figure 8. The results demonstrate a gradual decline in the proportion of the urban–rural fringe population occupying a single functional position, from 26.2% in 1980 to 18.4% in 2020. This indicates a rising degree of functional diversity within the urban–rural fringe. Overall, the proportion of living and living–ecology composite functional units remains low, peaking at only 1.2% throughout the cycle. The production–ecology composite function is the dominant force, with its share fluctuating between 50.5% and 65.6%. It is primarily distributed in the outer layer of the urban–rural fringe. The proportion of production–life composite functions increases from 19.4% to 30.5%, indicating that urban functions in the urban–rural fringe are becoming increasingly prominent in the development process and expanding their proportion. Changes in the remaining single functions are relatively consistent.
With regard to the spatial pattern, in 1980 the proportion of single ecology function was 19.4%, representing the peak of the entire cycle. The stable distribution was primarily in the Songhua and Ashu River basins, with other functions showing irregular patterns across the intertwined zones. In 1990, the distribution of functions remained largely stable, with the production–ecology function accounting for 56.6% of the total. The expansion of the urban–rural fringes in 2000, accompanied by the expansion of the scope of the production–ecology function, reached a peak of 65.6%. The spatial distribution was in Daoli, Songbei, and Hulan districts, reflecting Harbin’s active agricultural production during the early urbanization stage. The production–ecology function peaked at 65.6% and its spatial distribution was outside the urban–rural fringe in Daoli, Songbei, and Hulan districts, reflecting the active nature of agricultural-type production in the early stage of urbanization in Harbin. Furthermore, the production–living function attains a minimum value of 16.1% at this stage, exhibiting a fine distribution along the urban–rural fringe. In 2010, the single production function reached a peak value of 8.9%, with a scattered distribution in the Songbei and Hulan districts, which are characterized by intensive development and construction in the city. The production-living composite function’s proportion rose to 20%, extending to the central Nangang and Daoli districts, featuring a clustered distribution. The single ecology function is concentrated in the lower reaches of the Songhua River basin in Daoli District. Due to wetland development and protection in Daoli District, the ecology function’s proportion increased to 15.4%. In 2020, the urbanization scale expanded, resulting in the vigorous development of new development zones, high-tech industrial parks, and urban–rural fringe production-living functions in Songbei, Hulan, and Pingfang districts. This accounted for a significant increase in the evolution of the peak, reaching 30.5%. The significant expansion of the urban–rural fringe’s periphery in Harbin is noteworthy. It is specifically distributed in Songbei, Pingfang, and Nangang districts outside the centralized built-up area, sharing urban functions. These areas share part of the urban functions. Harbin’s urbanization has led to a contraction of the primary industry in the interlocking zone. The production–ecology functions account for the lowest value of 50.5%, with space being squeezed and distributed in a discrete manner in Daowai, Daoli, Songbei District, and the outermost areas. The remaining function types are distributed irregularly, forming point-like patterns. By 2020, an equilibrium state is expected, with all functions integrated and balanced. The ratio of urban to rural functions will be in alignment, reducing the dominance of any single function. All functions become coordinated and orderly, forming composite entities.
4.5. Analysis of the Drivers of the Evolution of Urban–Rural Fringes
As a transitional physical space between urban and rural areas, the development and functional distribution of urban–rural fringes are driven by external factors. These factors can be summarized by integrating the evolutionary patterns of urban–rural fringes and Harbin’s macroeconomic policies.
- (1)
Policy factors
The development of Harbin’s urban–rural fringes commenced with policy-driven initiatives. Policies related to the development of the urban-rural fringe in Harbin are listed below(
Table 2). In the early stages of China’s reform and opening up (1980), the Third Plenary Session of the Twelfth Central Committee redirected reform focus towards urban areas. The State Council adopted the “Opinions on Strengthening Urban Construction Work” at the Third National Urban Work Conference. This policy laid the groundwork for subsequent urban development. However, within a decade, its impact on the layout of urban–rural fringes in Harbin was limited. In 1988, Harbin was designated an open city and was subsequently supported by a policy framework. During this period, the urban–rural fringes entered the accumulation phase, with Harbin’s built-up area undergoing a gradual but consistent expansion over a decade. Following the reform of the tax system in 1994, the expansion of cities and towns entered a phase of capitalization. Local governments have accelerated urban spatial expansion and urbanization through land finance and urban infrastructure development. In 2006, the State Council proposed in the Outline of the Eleventh Five-Year Plan to promote the healthy development of urbanization. These national policies were subsequently reflected in the dynamic expansion of the spatial pattern of the urban–rural fringe in Harbin over the following decade. This led to a focus shift from ‘moderate production’ to ‘spatial production’ among the majority of Chinese cities. This approach entails expanding urban areas beyond traditional boundaries to accommodate additional development [
46].
At the start of the 21st century, the state approved plans and construction for Songbei New District, Hulan County’s reclassification as a district, and the Qunli New District development program, initiated in late 2007. This resulted in the urban–rural fringe expanding into the Songbei and Hulan districts, and the Qunli block, from 2000 to 2010. By 2020, a portion of the area had transformed into built-up regions. Furthermore, from 2005 to 2015, Harbin put forward regional development policies, such as the ‘Hardaqi Industrial Corridor’, ‘Construction of Harbin New Area’ and the ‘Coordinated Development of the Harbin–Changchun–Shenyang Urban Agglomeration’, also contributed to Harbin’s peripheral urban–rural fringe expansion. This is especially true in Songbei District and Pingfang District, where high-tech industries are concentrated. In 2014, China introduced the strategy of “new urbanization” for the first time, emphasizing people-centered urbanization. Consequently, China’s urbanization shifted from a focus on quantity to quality. This shift also influenced the development pattern of Harbin’s urban–rural interlocking zone from 2010 to 2020, slowing the expansion rate and increasing the tendency towards structural adjustment within the fringe.
- (2)
Economic factors
During the period of urban expansion, economic growth is the primary factor influencing the development of urban–rural fringes in Harbin. Economic development also shapes the spatial patterns and scales of these expanded urban–rural fringes. In the initial phase, the relatively low cost of the urban–rural fringe encouraged a substantial investment in its interior, with a notable concentration in the city’s peripheral areas. In the mid-stage of development, the significant economic drive and the emergence of the ‘land finance’ model, which led to substantial land appropriation, markedly accelerated the growth of urban–rural fringes. This was due to capital accumulation in the initial stages, resulting in a circle-type intensive development pattern centered on the urban core. For instance, from 2010 to 2020, Harbin’s per capita GDP increased by approximately 41%, and annual urban construction spending surpassed 360 billion yuan. Moreover, the urban–rural fringe area expanded significantly during this period. At the same time, economic factors drive industrial clustering in the interlocking zone. In 1993, industries assembled in the Pingfang District to establish the Harbin Economic Development Zone. Subsequently, a multitude of industrial sectors converged to propel the expanded urban–rural fringe towards the Pingfang District, thereby creating a pioneering urban expansion zone. In 2015, the Limin Development Zone capital formation project commenced in Jiangbei University City. The Harbin City Government collaborated with Songbei District, Sunac, Wanda Group, and other notable enterprises to finance the development and construction of major corporations such as Longjian Group, Welding Research Institute, and Feihe Dairy, relocating them to the new district. Government, manufacturing, pharmaceuticals, real estate, and other capital sectors have jointly contributed to the formation and growth of Harbin’s Jiangbei urban–rural fringe cluster, fostering development opportunities for Harbin [
51].
- (3)
Environmental factors
Furthermore, environmental and social factors have also play a significant role in shaping the evolution of the urban–rural fringe. In site selection, prioritizing ecological richness and high agricultural productivity is particularly evident. This can be observed in the development of the Songhua River, Ash River, and Hulan River Basins. Ecosystem transformation is intricately linked to patterns of land use, particularly within the urban–rural fringe, where alterations in ecosystem service functions are pronounced, shaping the “along the river” and “across the river” development patterns. These developments have facilitated growth in Harbin’s southern and northern fronts. The consistency of economic construction and the coherence of urban–rural fringe development are key factors in this process. Furthermore, the function of the urban–rural fringe is driven by the environment facts, which can be characterized as a production–ecology composite (
Figure 6). Realizing the value of high-quality environmental resources has become a significant incentive for spatial expansion. In addition, functional areas such as wetland protection areas and ecological red lines have also been formed around the river basin within the urban–rural fringe, which, as ecological buffer zones, can appropriately solve problems such as urban heat island effect and non-point source pollution. In addition to ecological protection, it also bears multiple functions of leisure tourism and biodiversity protection, such as the Songhua River Sun Island Wetland Park in Harbin. In the future, the ecological function positioning of Harbin’s urban–rural fringe can improve the overall security and service function of the urban ecosystem by optimizing its landscape pattern, such as building ecological corridors and protecting nature reserves.
- (4)
Social factors
Social factors are reflected in the inward population flow associated with the expansion of the urban–rural fringe. This phenomenon originates from the reform of the household registration system. In the period of 2000–2010, the government has gradually relaxed restrictions on rural residents settling in cities and phased out the dual hukou system, a move that has facilitated the free movement of people between urban and rural areas [
14]. This is evident from the population movement from Harbin’s urban area to surrounding counties and cities. Additionally, a significant influx of foreign populations into the urban–rural fringe has led to large agglomeration formations. The concurrent promotion of urban and rural construction has led to the formation of an urban–rural fringe within villages, positioned between collective living spaces and the expanding urban community. This has resulted in Harbin’s urban–rural fringe adopting a production–living composite function. In 2010, Harbin’s resident population reached 10.636 million, classifying it as a metropolis with 10 million inhabitants. Concurrently, as China’s urban and rural social security system has advanced, the integration of these systems has been progressively realized. This integration has prioritized the allocation of various social security facilities within the urban–rural fringe, thereby facilitating the urbanward development of the fringe. This shift is exemplified in the spatiotemporal evolution pattern of Harbin’s urban–rural fringe. Clearly, multiple driving factors have contributed to the gradual evolution and expansion of Harbin’s urban–rural fringe.
5. Discussion
5.1. Harbin Urban–Rural Fringe Development Stage
The analysis results indicate that the development of Harbin’s urban–rural fringe can be categorized into three distinct phases [
52]. And presented in the following figure (
Figure 9).
(1) Period of slow accumulation (1980–1990): During this phase, the urban–rural fringe experienced modest expansion, marked by slow and incremental spatial growth. The region displayed significant fragmentation, dominated by ecological functions that preserved its rural identity. Although Harbin is a major urban hub in northeastern China, its urban–rural fringe remained largely agricultural. Early industrialization, however, laid the foundation for future rapid growth and development.
(2) Period of rapid development (1990–2010): This era was marked by a substantial surge in the size of the urban–rural fringe area, which expanded to 1014.04 km2 by 2010. This growth, termed ‘jump expansion’, led to significant alterations in the spatial configuration, with an annual expansion rate of 26.89 km2. The functional focus shifted towards production–ecological and production–life roles, reflecting a dominance of these functions and an escalating urban influence that fostered a blending of various functions. As urban elements progressively supplanted rural ones, the urban–rural fringe emerged as a critical facilitator of urban expansion, catalyzing the metamorphosis of urban and rural elements and hastening urbanization and capital accumulation. Concurrently, the delineation between urban and rural areas became more pronounced, accompanied by escalating land use conflicts and fragmentation within the fringe zone. This period represents a paradoxical phase amidst rapid urbanization, highlighting the tensions between growth and equilibrium.
(3) Period of stabilization and reconstruction (2010–2020): The period of stabilization and reconstruction of the urban–rural fringe is characterized by a circular distribution encircling Harbin’s outskirts. These fringes are undergoing internal reconstruction, manifesting an ‘internally heterogeneous’ spatial pattern. By 2020, the urban–rural fringe area had expanded to 1037.3 km2, marked by growth in built-up areas and a deceleration in external expansion, with an annual area change rate of 2.33 km2. The fringe is defined by a complex interplay of functions, which are harmoniously integrated and balanced, effectively aligning with urban and rural developmental trajectories. Urbanization has reached a mature stage, signaling a shift from aggressive expansion to nuanced internal readjustment within the urban–rural fringe. This transition is nearing spatial saturation, thus promoting a stable and robust circulation of capital and efficient resource allocation.
5.2. Urban–Rural Fringe Dilemmas and Policy Planning Suggestions
As urban and rural fringes evolve, the unclear division of functions between urban and rural areas and the lack of coordination in development mechanisms lead to a disorderly spatial layout. This results in dramatic spatial evolution. Concurrently, the outward expansion of urban–rural interaction space, driven by land use conflicts, has become the predominant mode of suburban urbanization in recent decades. This phenomenon is characterized by distinctive regional variations within the urban–rural fringe, including disparities in industrial structure, the wealth gap, resource utilization, and environmental balance. These regional variations can be conceptualized as a ‘suboptimal’ urban–rural land development pattern. This represents a “suboptimal” urban–rural land development pattern, indicating that the urban–rural fringe has yet to achieve its full potential. It is recommended that the future development of the Harbin urban–rural fringe should be guided by a new planning direction that is based on the principles of intensive and sustainable evolution, balanced development, and functional development.
Currently, the principles of urban–rural integration and the potential for rural construction land to be brought to market could propel the urban–rural fringe to the forefront of policy innovation. Looking ahead, national spatial planning should prioritize the efficient utilization of the urban–rural fringe’s unique attributes within policy frameworks. Amidst persistent issues of ‘urban diseases’, it is crucial to deliberate on whether these fringes should embrace ‘urban functions’ and warrant substantial investment in development. Alternatively, we must consider if it is necessary to curb the rapid semi-urbanization and maintain a stable equilibrium between urban and rural elements. Considering the rapid growth of urban areas and the potential future saturation or even reversal of counter-urbanization trends, it is essential to deliberate on the development of adaptive reconfiguration strategies for the urban–rural fringes.
For Harbin, future planning for urban–rural fringes should prioritize functional positioning. According to the spatial evolution study, the expanded urban–rural fringe is unlikely to show significant expansion in the future. Instead, Harbin’s urban–rural fringe, in its current state of smooth development, serves as an ideal pilot area for urban–rural integration. Therefore, the urban–rural security system should be further improved, and infrastructure construction in these areas should be strengthened to narrow the gap between urban and rural regions. Based on the distribution map of the urban–rural fringe, the government should introduce policies to vigorously promote high-tech industries, encouraging them to build factories in the urban–rural fringes of Songbei District and Pingfang District. This will create an aggregation effect while avoiding the unreasonable occupation of agricultural land and promoting intensive land use along the urban–rural fringe [
53]. At the ecological level, the functional evolution map suggests that the ecological barrier role of the urban–rural fringe should be better utilized. Ecological corridors should be established in the Songhua River and Hulan River basins to address intra-urban energy-environmental issues, such as the urban heat island effect [
54].
5.3. Comparison with Results of Existing Studies
This paper synthesizes the dimensions of previous studies on urban–rural fringes by many scholars, and its methodology and results are relatively comprehensive. The article focuses on the dynamics of urban–rural fringes. Compared with studies on the dynamics of urban–rural fringes in Changchun, the city is more inclined towards a “rust belt” distribution. This is characterized by a decrease in the inner circle, filling of the inner hollow, and expansion of the urban–rural fringes. This pattern is similar to that observed in Harbin, another typical city in northeastern China discussed in this article [
43]. In terms of functional evolution, the urban–rural fringe in Harbin gradually shifts towards composite functions, exhibiting similar characteristics to those observed in Xiamen [
53]. In addition, this paper analyzes the factors influencing the development of urban–rural fringes in Harbin. The results align with some existing studies. Some scholars focus on the dynamic shaping of urban–rural fringes by policy, economy, and population flow. They argue that the formation of urban–rural fringes is driven by a variety of objective factors, which also corroborates the findings of this paper [
27]. It has also been argued that urban–rural fringes are the result of policy ambiguity. For example, in the case of Auckland, urban sprawl is not simply the result of population growth and transport improvements, but is a direct manifestation of the ambiguity of planning policy. This ambiguity has led to the failure of measures to control urban sprawl and has further exacerbated the problem [
19]. In general, most current studies focus on the selection of identification methods and the discussion of policy incentives for urban–rural fringes. This paper provides a new perspective for this research with a comprehensive approach.
5.4. Limitations of the Study and Future Prospects
This study also has limitations. Firstly, at the methodological level, the formation and development of the urban–rural fringe are influenced by a variety of factors, including economic, policy, and ecological factors, which add to its complexity. Although we used land use structure information entropy to distinguish the urban–rural fringe from urban and rural areas, this method struggles to fully capture the socioeconomic functions and complex dynamics, such as population flows and industrial development within the fringe.
Additionally, the study’s emphasis on dynamics means that the data dimensions are relatively homogeneous and lack integration across multiple dimensions. Although the original land use data have a resolution of 30 m and an accuracy of over 90%, misjudgments of land use types or untimely updates may still occur in areas with complex topography and rapid changes in the urban–rural fringe. This limits the accuracy of the results. The ten-year time span ensures the effectiveness of the long time series analysis but introduces a relative lag in the results. Moreover, the factors influencing the development of the urban–rural fringe are only qualitatively analyzed, which restricts a more comprehensive understanding.
In addition to the methods used for articles, this method is designed based on the homogeneous land use characteristics of the Northeast China Plain, and its applicability to mountainous or highly heterogeneous areas needs further verification.
Future research on the identification of urban–rural fringes should first integrate multi-dimensional data to better capture the complexity of these areas. Methodologically, more accurate algorithmic models should be employed to improve the precision of identification. Where possible, real-time data capture should be used to address the relative lag in current identification results. Additionally, efforts should be made to quantitatively analyze the various factors influencing the development of urban–rural fringes. Future studies should also focus on the quantitative analysis of the urban–rural fringe’s evolution within the context of regional integration. Specifically, research should examine the exchanges of materials, energy, and information between urban–rural fringes and neighboring cities and rural areas. The mutual influences and the external driving effects of cross-regional factor flows should also be considered. For example, an in-depth investigation into how land use and functions change during the process of industrial transfer from neighboring cities would provide valuable insights into the development dynamics of urban–rural fringes.
6. Conclusions
This study introduces an information entropy model based on land use data. We expanded this model through grid sampling within the study area and utilized the central gravitational agglomeration method to delineate the urban–rural fringe in Harbin from 1980 to 2020 as a single unit. Subsequently, the study provides a detailed analysis of the spatial scope, scale pattern, and functional positioning of the urban–rural fringe, and factors influencing it are explored, revealing its multi-dimensional evolutionary traits and patterns.
(1) Land use information entropy combined with the central gravitational agglomeration method accurately identifies the development and evolution of the urban–rural fringe. The spatial pattern of its expansion can be summarized as three stages: low-speed spreading, jumping expansion, and internal heterogeneity. By 2020, the area of the expanded urban–rural fringe will reach 1037.3 km2. The development of the urban–rural fringe in Harbin is closely related to its urbanization, reflecting its transitional and dynamic characteristics.
(2) The evolutionary scale of the urban–rural interface was analyzed by the superposition method, and three types of stable, expanded, and degraded were classified: 1980–1990, slow change; 1990–2000, significant expansion with a rate of change of 26.89 km2/a; 2000–2010, concentration of stable areas and increase in degraded areas; 2010–2020, dispersal of expanded areas and peak of degraded areas, the degraded area reaches 347.43 km2, with a gradual shift in development from speed to both speed and quality.
(3) By visualizing the functional pattern through the distribution of grid cells in the functional triangle diagram, we found that the proportion of population in urban–rural fringes with a single function decreased from 26.2% in 1980 to 18.4% in 2020, indicating an increase in functional diversity. The production–ecology composite function dominates, while the proportion of the production–life composite function increased from 19.4% to 30.5%. The spatial distribution of various functions has changed dynamically over time.
(4) The evolution of the urban–rural interface in Harbin has been driven by multiple factors. Policy: National and local policies drive its spatial expansion and development pattern change. Economy: Economic growth, land finance, and industrial agglomeration promote its development. Environment: Ecological resources influence its development pattern and provide a variety of ecological functions. Society: Household registration reform, population mobility, and the integration of social security systems drive its transformation into a production–life complex function.


