Article

How Does the National Key Ecological Function Areas Policy Affect High-Quality Economic Development?—Evidence from 243 Cities in China

School of Economics, Minzu University of China, No. 27 Zhongguancun South Street, Haidian District, Beijing 100081, China
*
Author to whom correspondence should be addressed.
Land 2025, 14(2), 345; https://doi.org/10.3390/land14020345
Submission received: 31 December 2024 / Revised: 25 January 2025 / Accepted: 26 January 2025 / Published: 8 February 2025

Abstract

:
Achieving a balance between environmental protection and high-quality economic development forms the cornerstone for fostering a harmonious coexistence between humanity and nature. Consequently, the interplay between these two domains has garnered extensive attention from various stakeholders. However, the current discourse on environmental policies tailored for high-quality economic development remains insufficiently robust. From a policy standpoint, we employ the difference-in-differences methodology to investigate whether China’s National Key Ecological Function Areas Policy, enacted in 2016, can catalyze high-quality economic development. Our findings reveal that this environmental policy has a notably positive influence on high-quality economic development. This effect is indirectly potentiated through increased investments in science and education, as well as the stimulation of consumer demand. Notably, the policy effect varies by region. To ensure a steady enhancement of the policy’s effectiveness, it is imperative to implement differentiated measures tailored to the unique characteristics of different regions, thereby fostering coordinated development. Furthermore, we anticipate that our study will offer empirical insights and data-driven examples for the implementation of environmental policies in developing countries.

1. Introduction

The exploration of how to understand and deal with the relationship between economic development and environmental protection has never ceased and is receiving increasing global attention [1,2,3]. However, there has been no consistent conclusion. In the past period of time, it has become an indisputable fact that the economic development has destroyed the ecological environment [4]. Practice has proved that it is a long-term solution to focus on improving the environment while developing the economy [5]. Economic development in line with ecological constraints has a future [6].
Therefore, it is important to explore whether economic development and environmental quality can be mutually reinforcing over a certain period. Many countries have introduced corresponding environmental policies and are committed to realizing the harmonious coexistence of the environment and economy [7,8]. China is one of them. To alleviate prominent environmental problems [9,10,11,12], China has taken a series of policies since 2003 to change its pursuit of economic growth speed and start working towards high-quality economic development [13,14]. It includes the National Key Ecological Function Areas (NKEFA) policy related to national ecological security. China issued a policy paper on NKEFA and announced a number of pilot lists in September 2016. The policy aims to promote the ecological goals of soil and water conservation, wind prevention and sand fixation and biodiversity conservation in the pilot area, which are related to the ecological security of the region [14,15,16]. It requires that large-scale and high-intensity industrialization and urbanization must be limited in the development of national land space in order to maintain and improve the supply capacity of regional ecological products [17]. Up to now, there have been more pilot areas of NKEFA, which have more than half of the total land area.
Whether the NKEFA policy can achieve stable high-quality economic development remains a question. Although there have been studies to evaluate the economic effects of the NKEFA policy, few have paid attention to its impact on high-quality economic development [15,17,18,19]. Against this backdrop, it is necessary to pay attention to the effect of NKEFA for high-quality economic development. The importance is not only to complement the discussion of the relationship between environmental protection and economic development, but also to guide the practice of the policy.
According to the existing literature, China’s eastern, central and western regions have significant differences in terms of their economic development level, industrial structure and resource endowment [20,21]. These differences may affect how well policies are implemented in different regions. Also, there are obvious differences between ethnic provinces and non-ethnic provinces in the economic structure, resource utilization, social culture and so on [22,23,24]. For example, the industry of the ethnic provinces is dominated by the primary mining and processing of resources, the proportion of high-tech industries is relatively low and the industrialization level is significantly lower than the national average [25]. These particularities mean that the ethnic provinces may face more challenges and opportunities when dealing with the NKEFA policy. Therefore, it is necessary to analyze the regional heterogeneity of different economic conditions when studying the policy’s effect. This will help policy makers more accurately understand the actual situation and needs of different regions, so as to formulate policy measures that are more in line with regional characteristics. This can improve the pertinence and effectiveness of policies and reduce resistance in the process of policy implementation.
The purpose of this paper is to test whether the NKEFA can promote a high-quality economy. For the current relevant research, the edge exploration of this paper is as follows: (1) In terms of indicators, we have built an indicator system for high-quality economic development by using the entropy value method. Moreover, we focus on the impact of NKEFA on high-quality economic development, which is more targeted compared with previous studies. (2) In terms of the transmission mechanism, this paper includes the consumer demand and per capita fiscal expenditure on technology and education. These contents broaden the horizon of the existing research. (3) In terms of heterogeneity, this paper not only investigates the eastern, central and western regions, but also distinguishes ethnic provinces from non-ethnic provinces. These analyses are more conducive to policy practice.

2. Literature Review

Environmental protection and economic development have long been issues of great concern [26,27]. Some scholars insist that ecological protection inhibits economic development. Cao et al. (2010) found through a field survey that the cost of the protected forest program in the Ziwuling region was mainly borne by local residents and that the development of the local livestock industry was in decline [28]. Collins and Zheng (2015) argued that the state should weigh the gains and losses between environmental and economic objectives, and that protecting the environment would lead to a local residents’ income decrease [29].
On the contrary, other scholars insist that ecological protection has positive socio-economic impacts [30]. It has been talked about that ecological restoration will improve human well-being [31]. Following a quasi-natural experiment, Heaer et al. (2018) concluded that improved environmental quality favors poverty reduction [32]. Yang et al. (2022), based on a multi-period DID model, believed that the establishment of nature reserves increased the income of local residents [33].
China’s NKEFA policy was jointly proposed and promoted by a number of departments, including the Ministry of Ecology and Environment, the National Development and Reform Commission and the Ministry of Finance. The policy aims to protect the ecological environment and maintain ecological security, designating a number of areas to undertake important ecological functions such as water conservation, soil and water conservation, wind prevention and sand fixation and biodiversity maintenance [15]. In 2016, the State Council released a list of pilot zones. In these areas, large-scale high-intensity industrialization and urbanization development should be restricted to reduce the damage to the ecological environment. These areas implemented more stringent industrial access and environmental access standards, raising the industrial and environmental thresholds for all types of development projects [17]. At the same time, these areas implemented integrated ecosystem management, including soil and water conservation, water conservation, wind and sand prevention and biodiversity conservation measures [18]. The central government continued to implement the transfer payment policy and provided financial support to the pilot zones. Through the implementation of the NKEFA policy, the ecological environment quality of these regions has been significantly improved, which is of great significance for maintaining ecological security and the sustainable development of a large range of regions.
Regarding the economic effects of the construction of NKEFA, many scholars confirmed through empirical studies that the policy can achieve environmental protection, increase the income of rural residents and adjust the industrial structure [15,17,18,19]. But, no one has analyzed the effect of NKEFA on high-quality economic development. The analysis of the NKEFA policy can help us explore whether environmental protection and economic development can achieve a win–win or zero-sum game. This provides a vivid case for understanding the relationship between the two. At the same time, the analysis of the intermediary mechanism will further reveal how environmental policies indirectly promote high-quality economic development, which provides a new perspective for understanding the economic incentive mechanism of environmental policies.
With the concept of high-quality development, the economic field has also launched relevant research. And it receives more and more attention. However, the meanings of the various studies are not static, and have experienced a shift from the narrow sense to the broad sense in the time dimension. The narrow understanding equates the concept with a single measurement indicator, for example, GDP per capita [34], total factor productivity [35,36,37], green total factor productivity [38] and so on. Undeniably, these attempts to take a single indicator as the object of the research have provided a lot of help for later studies. However, the requirements of high-quality development are comprehensive and diverse. Therefore, to some extent, this means that it is impossible to use a single indicator to scientifically measure our research object.
It is broadly understood that the quality of economic growth is the combined result of the development of multiple factors. Therefore, in terms of the indicator system, the richness should be reflected through multi-dimensional indicators. The diversification of indicators overcomes the problem of narrow understanding. Many scholars try to take the people’s growing multifaceted needs [39], welfare distribution [40], religious beliefs, environmental conditions, social governance [41] and resource allocation [42] as important components of the concept.
In the final analysis, we see that there is no consensus on the construction of indicators. With the continuous changes in China’s economy and society and the transformation of the main contradiction in society, there is still a lot of room to expand the connotation of these indicators. It is currently agreed that the five development concepts of “innovation, coordination, greenness, openness and sharing” can explain high-quality development in a more comprehensive way, and that it is more appropriate to use them as the evaluation criteria [43]. We will follow this view to construct a reasonable indicator system to present this concept better.

3. Theoretical Mechanism and Research Hypotheses

3.1. Direct Effect

The core goal of high-quality economic development is to promote the transformation of the development model. The industrial system pursues a change from the factor-intensive industry to a technology- and knowledge-intensive industry. In terms of the product structure, high-quality economic development strives to realize the product system based on a high technology content and high value-added products. At the same time, high-quality economic development focuses on building an environmentally friendly economy. This means strengthening ecological and environmental protection in the process of economic development, effectively using natural resources, avoiding overexploitation, and taking the path of green development. The NKEFA policy has a direct impact on high-quality economic development, which is determined by its basic tasks, including the following six segments.
Firstly, production and living space can squeeze ecological space [44], so NKEFA strictly regulate all kinds of development activities within the scope of policies. Town construction and industrial development need to be centrally laid out and point-like and piecemeal expansion is prohibited. Development zones should be steadily renovated and upgraded to meet the standards of eco-industrial parks without expanding in scale. This will allow more space to be used to maintain the virtuous cycle of the ecosystem and guide the existing development zones to continue to innovate. Ultimately, it will achieve industrial advancement as well as emission reduction targets [45], which will have a direct impact on green and coordinated development.
Secondly, the NKEFA policy supports the rational development of suitable industries based on the moderate use of specialized resources. The original industries are promoted by the relevant comprehensive economic management departments for the gradient transfer or elimination of industries. And, the industrial structure is deeply adjusted to make the allocation of resource factors more reasonable [46,47]. The main means include the depreciation of equipment, technological renewal, the optimization of infrastructure construction and the cultivation of the ecological product supply capacity. In this process, transport conditions, network infrastructure and tourism services are improved, leading to a more open development of the regional economy [48]. This will help realize coordinated, innovative, shared and open development with high-quality economic development.
Thirdly, the scope of the NKEFA policy requires the comprehensive delineation of ecological red lines. That is, norms will be issued by the Ministry of Environmental Protection (MEP) in accordance with the Opinions of the State Council on Strengthening the Key Work of Environmental Protection and the requirements of the Twelfth Five-Year Plan for National Environmental Protection [49,50]. Fourthly, the NKEFA policy requires the specification of an ecological function assessment, which means that national and provincial environmental protection departments should work together with relevant departments to pay attention to the ecological function survey and assessment. Fifthly, the regulation of the ecological environment in NKEFA will be escalated. After the introduction of the policy, local departments will control the issuance of emission permits and implement the national energy conservation policy measures. As a result, the total amount of pollutant emissions in the area will continue to decline [51]. These three initiatives will contribute to environmental improvement and green economic development [52,53].
Sixthly, NKEFA need a sound ecological compensation mechanism. Pilot regions need to accelerate the development and introduction of eco-compensation policies and regulations. To this end, the central government has increased financial transfers to NKEFA. Local governments have used the fiscal transfer funds mainly for environmental regulation and improving the level of basic public services. The compensation mechanism helps the corresponding NKEFA to achieve coordinated and shared development by adopting various forms such as financial subsidies, targeted assistance and counterpart support [54] (Wei, 2019). In summary, we put forward research Hypothesis 1.
Hypothesis 1:
The construction of China’s NKEFA can improve the level of high-quality economic development and can better deal with the relationship between protection and development.

3.2. Indirect Effect

NKEFA can indirectly influence high-quality economic development through investment in technology and education. The policy can increase the input of technology and education. Firstly, the construction of NKEFA aims to protect and repair the ecological environment and improve the stability and sustainability of the ecosystem. This requirement will focus on technology and education to provide more talent and technical support. Secondly, the construction of NKEFA can attract more technology-based enterprises and investments. These enterprises and investments can bring educational practice sites and scientific research projects [55]. Again, the construction of NKEFA will build more scientific research institutions and laboratories. Better research conditions and equipment will be used for technology and education. To sum up, the construction of NKEFA can positively influence the input of technology and education. By providing more funding, resources, support and opportunities, the policy will promote technology and education and enable the integration of innovation with environmental protection.
Existing studies have shown that the impact of technology and education inputs on high-quality economic development is very important [56,57,58]. This is because investment in technology and education can further improve the quality and skills of the labor force. Quality talents will lead to a series of chain reactions, such as improving the resource utilization efficiency and market efficiency, accelerating industrial upgrading and keeping sustainable economic development [59]. Practice over the years has proved that the leap of China’s economic development stage cannot be achieved without technological aid and the quality of the labor force. This is an important prerequisite for optimizing the structure of production factors, expanding the scale of output and improving product quality. In the face of the new economic development situation, the improvement of technology and education is still the core factor [60]. Based on the above analysis, we propose Hypothesis 2a.
Hypothesis 2a:
NKEFA have promoted high-quality economic development by investing in technology and education.
In addition, NKEFA may also promote high-quality economic development by stimulating the consumer demand. Specifically, this transmission path can be unfolded as follows.
In the process of NKEFA construction, the government can allow more enterprises and investors to participate in the ecological industry through preferential policies such as tax relief, loan support and scientific research funding. This will develop the relevant industrial chain, increase employment opportunities, improve residents’ incomes and stimulate the consumer demand [61]. For example, pilot areas usually have unique natural landscapes and ecological resources. In the process of developing the ecotourism industry, local residents can increase their income by providing rich tourism services and facilities, including tour guides, accommodation and catering [62,63,64]. The increase in income will further stimulate the consumption demand. And, under the guidance of the policy, the characteristic resources of the pilot areas can be developed into ecological products, including organic agricultural products, natural medicinal materials, handicrafts, etc. The production, sales and marketing of ecological products will affect the regional consumption structure and stimulate green consumption [65].
Traditional industries often pursue economic growth at the expense of the environment, resulting in resource shortages, environmental pollution and other problems. The above ecological industries will put ecological protection in the first place through the adoption of environmental protection concepts and a sustainable development mode, not only to help stimulate consumption and improve economic benefits, but also to help reduce environmental damage and achieve green economic development.
In summary, we propose research Hypothesis 2b.
Hypothesis 2b:
NKEFA promotes high-quality economic development by means of stimulating the consumption demand.
NKEFA are distributed in various regions of the country. And China’s inter-regional economic development is not coordinated. On the whole, the eastern provinces are developing rapidly and the income level of the residents is high, the western regions are developing slowly and the income of the residents is relatively low and the economic development of the central region is in between. In addition, for ethnic provinces and non-ethnic provinces, there are also large differences in economic development and environmental conditions. Ethnic provinces tend to have a more backward economic base than non-ethnic provinces, which may make a difference in the policy effectiveness. In summary, we put forward research Hypothesis 3.
Hypothesis 3:
There is regional heterogeneity in the impact of China’s NKEFA on high-quality economic development.

4. Materials and Methods

4.1. Model Construction

This article examines the effect of high-quality economic development of NKEFA set up in 2016. The 51 prefecture-level cities where the policy was piloted are the experimental group, while the control group consists of other cities. In the methodology, difference-in-differences method is used to test the difference in the level of high-quality economic development between the two samples because this model has its advantages. On the one hand, the DID model effectively controls unobservable factors that do not change over time or change slowly over time by comparing the changes before and after the implementation of the policy between the experimental group (the area affected by the policy) and the control group (the area not affected by the policy). This helps to reduce indigeneity problems and improve the accuracy of estimated results. On the other hand, the results of the DID model are usually presented in the form of simple coefficients that represent the average amount of change in the experimental group relative to the control group after the policy is implemented. This way of expression is intuitive and easy to understand, and it is also easy to understand the effect of the policy. According to the basic principle of the difference-in-differences method, it is assumed that before the establishment of the NKEFA, the two groups of variables have the same trend of time effect. Then, after the establishment of the NKEFA, the changes of the two are caused by the policy effect. In this study, Stata17.0 was used to evaluate the policy effect, the baseline regression model is as follows.
Q u a l i t y i t = α + β d i d i t + δ Z i t + λ i + θ t + ε i t
Among them, i and t represent the city and year, respectively. The dependent variable is high-quality economic development ( Q u a l i t y i t ), representing the high-quality economic development of city i in year t. The core explanatory variable is whether it was impacted by the policy (didit); when city i is included in the policy and t is 2016 or later, didit is recorded as 1. Otherwise, it is 0. Zit is the controlled variable; λi is the city-fixed effect; time-fixed effect should be θ t ; and εit is the error term. Coefficient β is the estimated high-quality economic effect of the policy of NKEFA. If the coefficient β > 0, it indicates that the pilot policy significantly promotes the high-quality economic development. If β < 0, the table indicates that the policy plays a negative role and if β = 0, it indicates that the policy has no significant impact on economic growth.

4.2. Variables Selection and Measurement

4.2.1. Data Sources

When measuring the situation of 243 urban indicators in China from 2011 to 2019, all data are from the China Urban Statistical Yearbook, China Environmental Statistical Yearbook, China Science and Technology Statistical Yearbook, China Tertiary Industry Statistical Yearbook, China Population and Employment Statistical Yearbook as well as statistical bulletins on economic and social development.
Considering some cities’ original location conditions and other factors, there may be systematic differences. In order to test the effect, we excluded special economic zones and provincial capital cities as well as a small number of outlier data values during the experiment. In the end, we retained 243 prefecture-level cities as the monitoring sample (Figure 1).

4.2.2. Explained Variables

High-quality economic development involves a number of aspects. Under the premise of operability, we select indicators as comprehensively as possible [66]. Only by focusing on the five dimensions of “innovation, coordination, green, openness and sharing” can the evaluation be representative.
Faced with the situation that the explained variables consist of multiple indicators, we choose the entropy value method to fit the indicators; the results are objective, fair and reasonable [67]. Due to the different scales of the indicators, in order to better measure the high-quality economic development, the raw data of the indicators were first made dimensionless using the extreme value processing method. Subsequently, equal weights were assigned to measure the dimensional and total indices. We use SPSS27 for calculation, and the specific formula for the dimensionless processing of the extreme value processing method is as follows.
b t j ( Z k ) = a t j ( Z k ) m i n i , k   [ ( a t j ( Z k ) ] m a x i , k   [ ( a t j ( Z k ) ] m i n i , k   [ ( a t j ( Z k ) ] ,   [ a i j ( Z k )   i s   a   p o s i t i v e   i n d i c a t o r ] m a x i , k   [ ( a t j ( Z k ) ] a t j ( Z k ) m a x i , k   [ ( a t j ( Z k ) ] m i n i , k   [ ( a t j ( Z k ) ] ,   [ a i j ( Z k )   i s   a   n e g a t i v e   i n d i c a t o r ]
i and j denote cities and indicators, respectively, and Z k denotes time; m i n i , k   [ ( a t j ( Z k ) ]   a n d   m a x i , k   [ ( a t j ( Z k ) ] denote maximum and minimum values of a t j ; and b t j ( Z k ) is dimensionless a t j ( Z k ) .
Next, the information entropy value of each indicator ( e j ) was measured. c i j ( z k ) = a i j ( z k ) / k i a i j ( z k ) . The measurement formula is:
e j = l n 1 n k i   [ c i j ( z k ) l n c i j ( z k ) ]
The weights for each indicator were then obtained.
w j = ( 1 e j ) j ( 1 e j )
Ultimately, the formula for calculating the high-quality urban economic development was obtained.
q u a l i t y i t = a i t ( z k ) w j
Drawing on the existing studies, we have constructed an evaluation index system with 15 indicators by taking advantage of their strengths, as shown in Table 1. In this system, “+” indicates that the corresponding factor serves as a positive indicator in the model, while “−” indicates that the corresponding factor is a negative indicator in the model.

4.2.3. Core Explanatory Variables

The core explanatory variable is specified as implementation of the NKEFA, i.e., the post-2016 policy implementation area. We set up time and between-group dummy variables to measure it and the results are expressed as the product term of the two. The policy examined in this paper was initiated in 2016. Therefore, on the time dummy variable, 2016 and later are assigned a value of 1, and before that a value of 0. On the between-groups dummy variable, cities with NKEFA are assigned a value of 1, and otherwise a value of 0.

4.2.4. Controlled Variables

In empirical tests, reasonable controlled variables can greatly reduce the bias of observations. The controlled variables we chose are as follows.
Industrial value added per capita captures industrial production over a specified period of time [68].
Fixed asset investment to GDP ratio reflects the close relationship between fixed asset investment and economic growth [69].
PM2.5 profoundly affects the green development of economy [70]. The higher the concentration of its content in the air, the more serious the air pollution.
Per capita financial institution loans are an important indicator of the lending business of financial institutions, reflecting the scale and quality of the lending business of financial institutions [71].
Per capita imports and exports is an important symbol reflecting the level of the opening up of the city to the outside world. At the same time, it is an important engine for the city’s economically important engine of high-quality development [72]. Table 2 presents descriptive statistics of variables.

5. Empirical Results

5.1. Benchmark Results

Table 3 shows the main regression results. In order to reduce the error in the results due to large differences in the values between the data for the controlled variables, we standardized the data before conducting the assessment. This removes the effect of the scale and makes the constant term more interpretable. We see that the estimated coefficients for DID are positive for either model condition. This suggests that NKEFA significantly contribute to high-quality economic development in the pilot cities.

5.2. Robustness Test

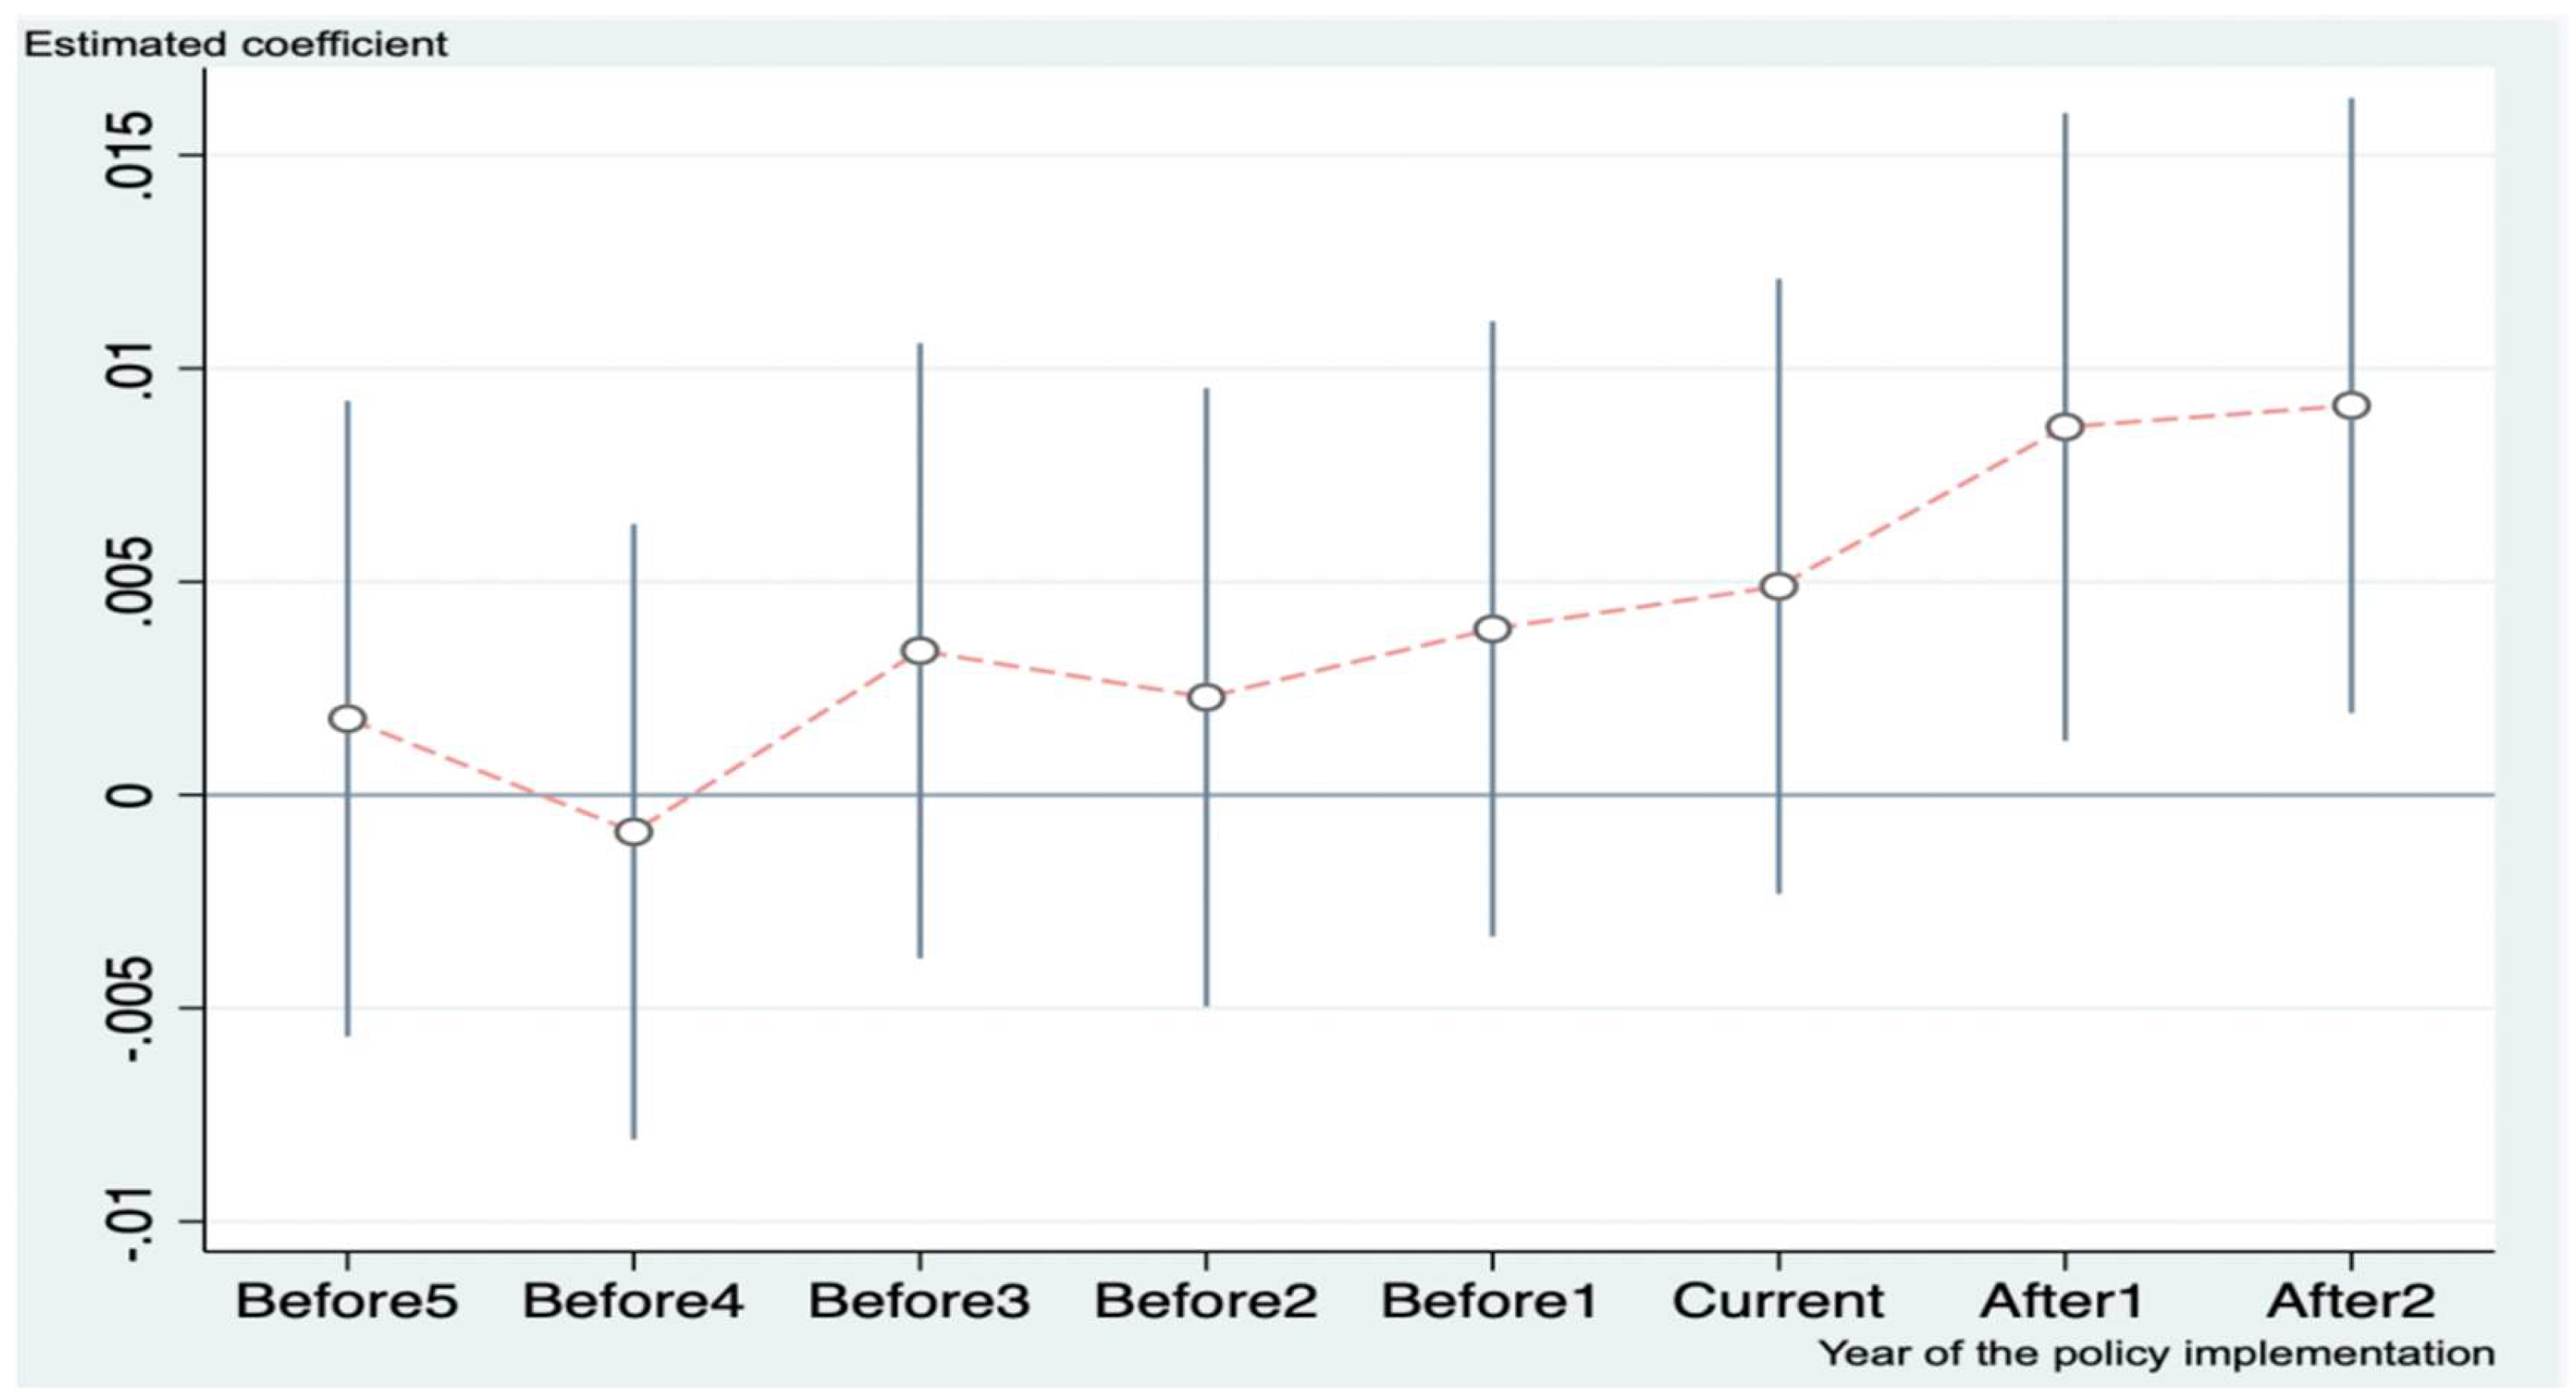
5.2.1. Parallel Trend Test
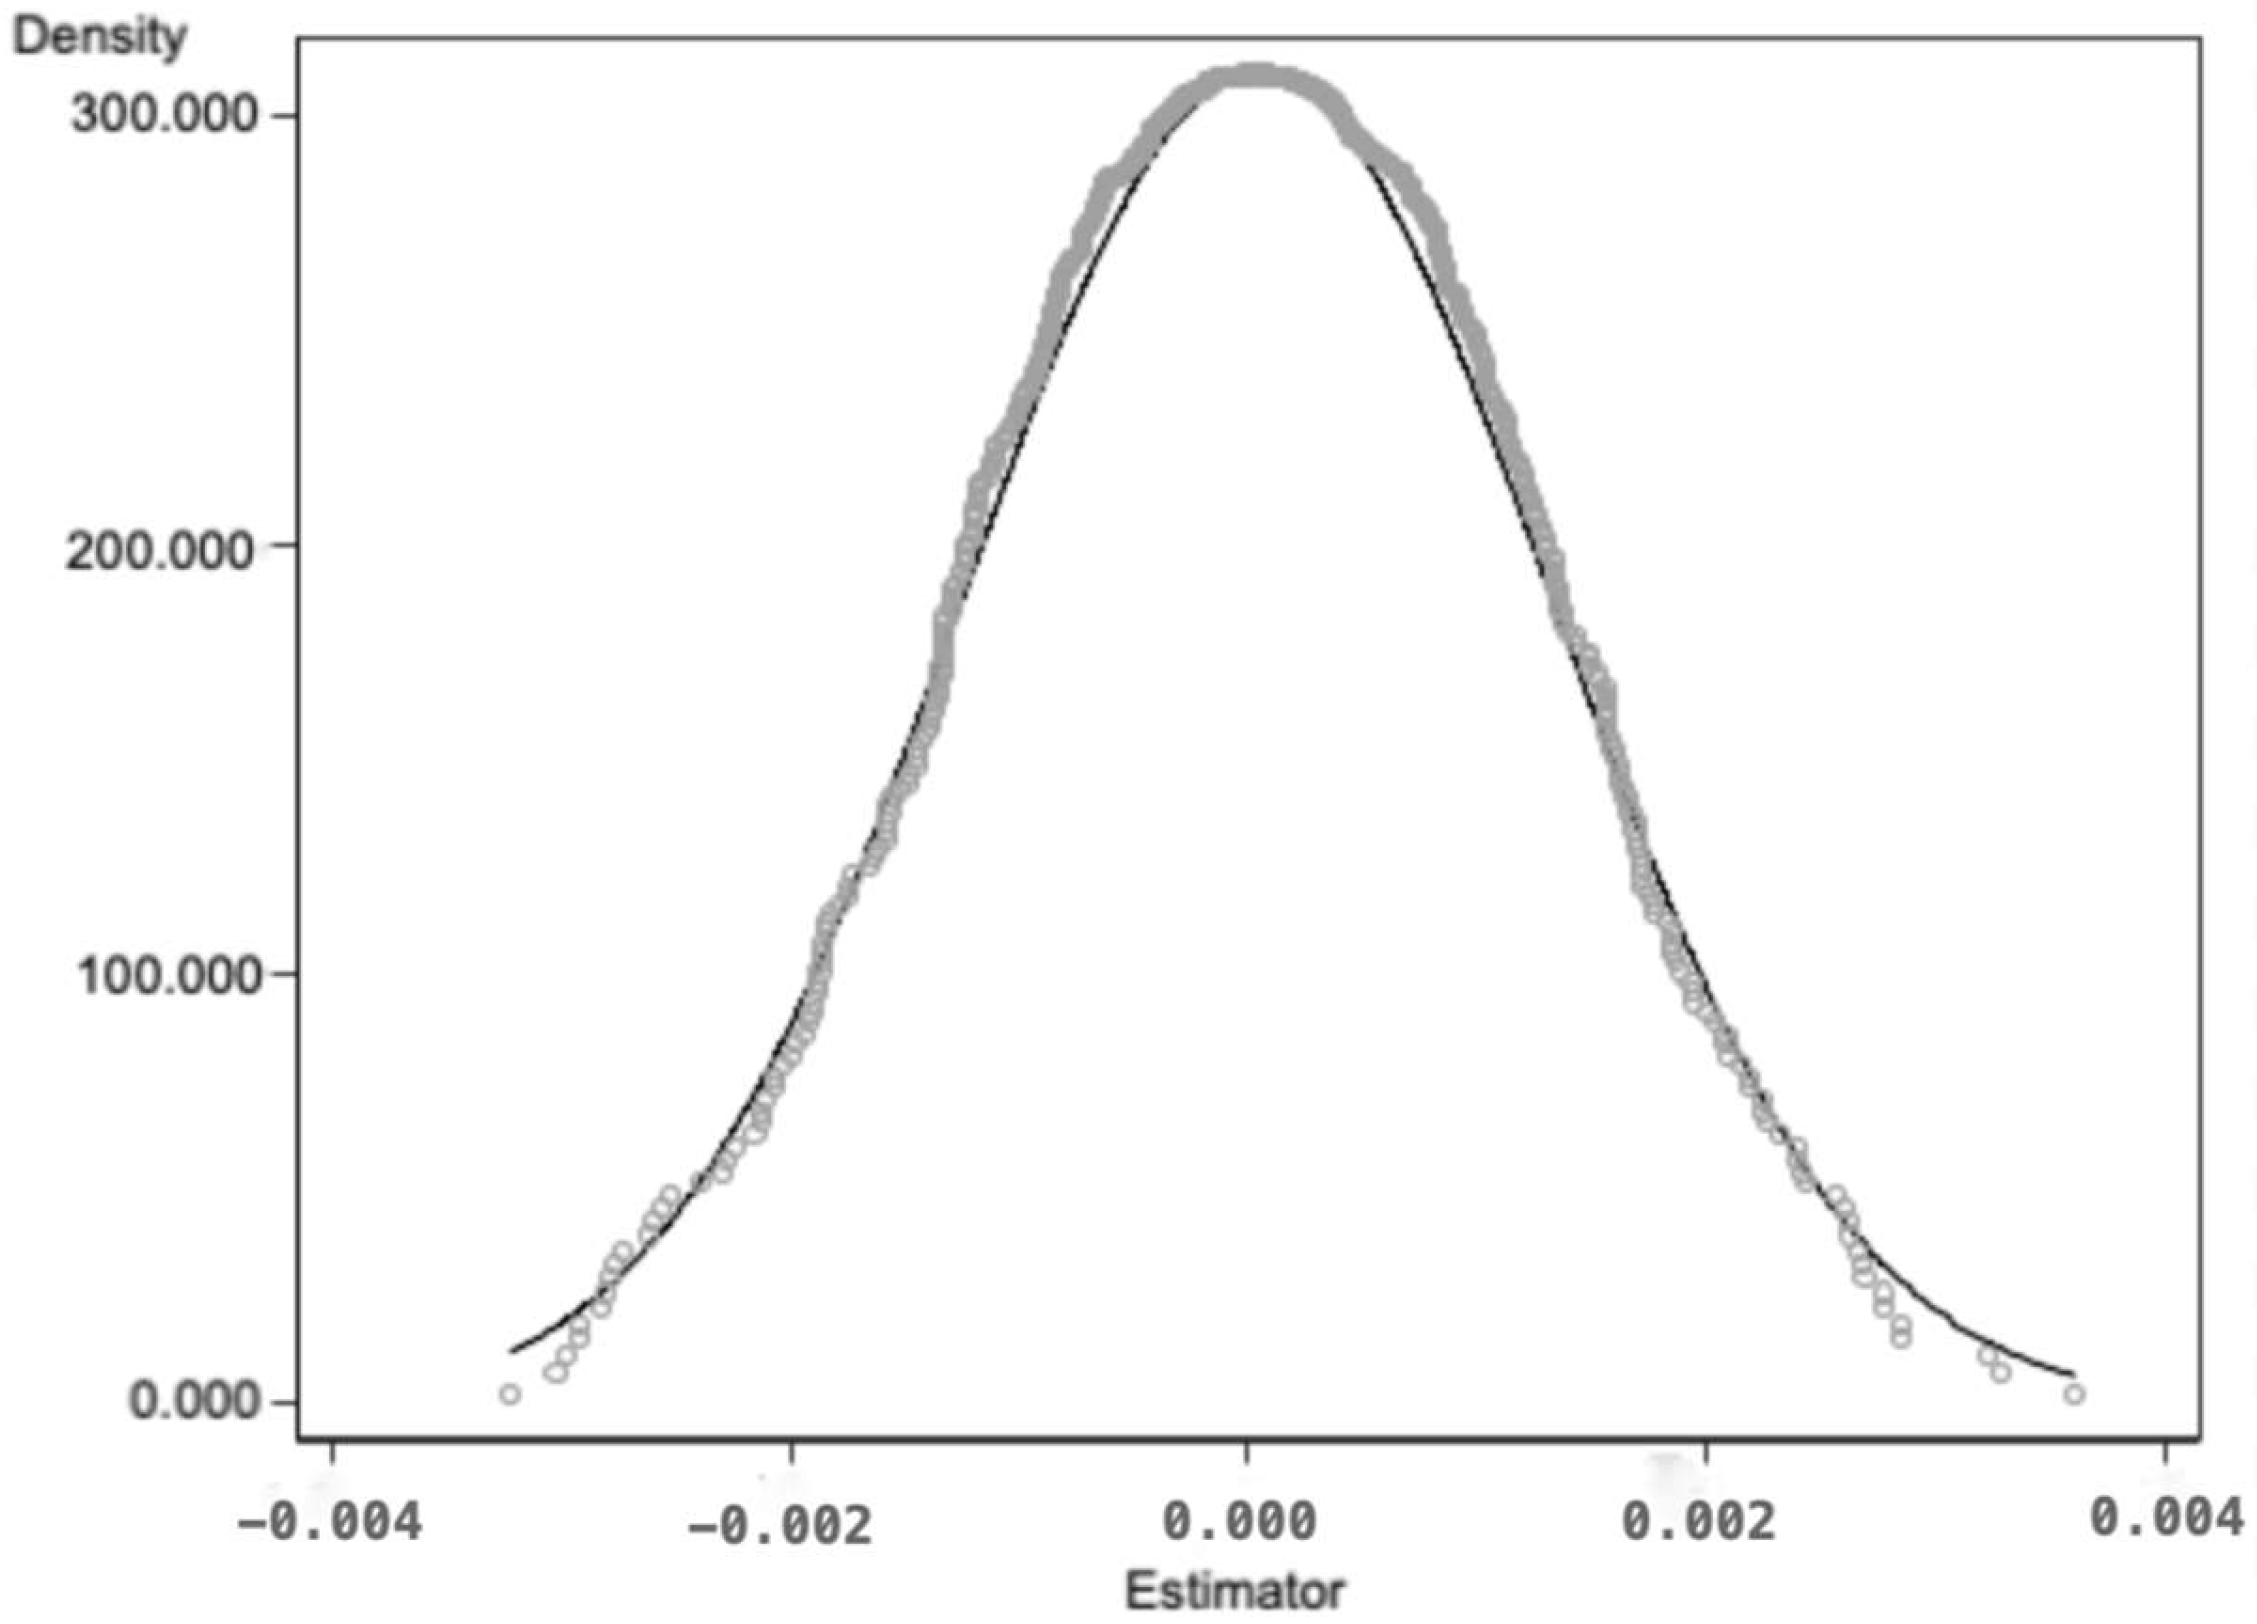
The parallel trend assumption is a necessary precondition for the use of DID in empirical papers [73,74]. This requires that the target variables of the two groups of samples tested prior to 2016 must conform to parallel trends. So, the effects of the policy can be explored. If this requirement is not met, the conclusions drawn by DID are not pure effects of the policy. We show the dynamic parallel trend graph below. Figure 2 clearly illustrates that the parallel trends change around 2016. Before 2016, the estimated coefficients are insignificant and fluctuate around 0. After 2016, the estimated coefficients are significant, which well satisfies the DID hypothesis.

5.2.2. Placebo Test

In complex economies, it is also likely that changes in the trends of the experimental and control groups are influenced by other policy or random factors. Placebo tests can help us make the results of the DID more robust [75]. This is carried out as follows: The treatment of the non-parametric replacement test is used to randomly sample all prefecture-level cities and policy times without duplication. We randomly selected the pilot cities of national key ecological function zones, as well the time of policy implementation. Regression was performed according to the DID regression formula and the probability of the regression coefficients of this spurious experiment was able to judge the reliability of the conclusions. This randomization experiment was then repeated 500 times. This was carried out to increase the persuasiveness of the placebo test. Finally, we plotted the density distribution based on the estimated DID coefficients from the 500 experiments, as in Figure 3. The figure shows that the estimated coefficients are distributed around 0 and have a normal distribution. This suggests that the original model did not miss important influences and the policy effect results are positive. Overall, the core findings are robust.

5.2.3. Replacement of Explanatory Variables

Furthermore, we analyzed the explained variables by replacing them. Our main approach has been to add representative indicators. They are mainly pollutants with high emissions in industrial production, including industrial wastewater emissions, industrial sulfur dioxide emissions and industrial soot emissions indicators [76]. After calculating the new composite index of the explanatory variables, we tested the corresponding regression results. As demonstrated in column (2) of Table 4, the coefficients are positive.

5.2.4. Excluding Other Major Policies

As well as the implementation of this policy, there are other policies implemented in the experimental area which may interfere with the final result. Overall, the policy that is most able to have an impact is the Ecological Civilization Pilot Zone in 2016. The provinces selected as pilot zones include the Fujian, Jiangxi and Guizhou provinces. These provinces were selected because of their good ecological foundation and strong resource and environmental carrying capacity, aiming to promote the reform of ecological civilization systems through trial and exploration and form an effective model that can be promoted. These provinces are pilot regions of the two policies. In order to test the net effect of the NKEFA, we excluded the data of these provinces and brought them into the formula again for testing. The regression results obtained are as follows, and the result shown in column (2) of Table 4 is still significant.
In addition to the above policy, the Green Shield Action in May 2018 also affected the effectiveness of NKEFA. It aims to strengthen the supervision of protected natural areas, discover and investigate the illegal problems in protected natural areas in a timely way and protect the ecological environment and natural resources. The policy covers the provinces of Hubei, Shandong, Heilongjiang and so on. To test the net effect of the NKEFA policy, we further removed the Green Shield Action. The regression results obtained are as follows, and the result shown in column (3) of Table 4 is still significant.

5.3. Transmission Mechanism Analysis

The theoretical analyses in the previous section indicate that the construction of NKEFA may stimulate consumer demand as well as increase the expenditure on technology and education, thus promoting high-quality economic development. We use Formula (1) to verify the mediating effect.

5.3.1. Stimulating Consumer Demand

The results in column (1) of Table 5 indicate that the NKEFA policy has a significant positive effect on the per capita retail sales of consumer goods, which means that the NKEFA policy is able to restructure the industry so that it is better adapted to the process of building the local natural environment. The restructuring of industry includes the creative development of ecotourism and related ecological products. Therefore, the sample area will prepare more abundant ecotourism services or organic agricultural products to influence the demand of local people and satisfy the demand of foreign tourists. Meanwhile, the interaction between the per capita retail sales of consumer goods and this policy variable shows a positive relationship. This suggests that the policy deepens the effect of the mediating mechanism on the explained variables.

5.3.2. Increasing Investment in Technology and Education

The results in column (3) of Table 5 show that the pilot policy of NKEFA has a significant positive impact on per capita expenditure on technology and education, i.e., the NKEFA policy is actively exploring new modes of scientific innovation and development. In practice, governments should support and favor pilot demonstration areas in terms of policy, funding and technology and promote the development of science education. This will be conducive to research on basic theories and applied technologies for the protection of ecological functions. Moreover, the interaction term between per capita technology and education expenditure and policy variables has a significantly positive effect, confirming the real-life impact of the mediating mechanism.

5.4. Heterogeneity Analysis

5.4.1. Analysis of Regional Heterogeneity in East, Central and West of China

The eastern, central and western regions of China are imbalanced in terms of their rate of economic development, infrastructure and resources. It is inferred that the implementation effect of the policy varies by region. In order to test for heterogeneity, we divide the sample of all cities based on the range of the eastern, central and western provinces and regress each of the three components to observe the results. Through Table 6, we see that the establishment of NKEFA increases the level of high-quality economic growth in these two regions. In contrast, the high-quality economic development of the western region has not been fueled by the policy. The spatial distribution of eastern, central and western provinces is shown in Figure 4.

5.4.2. Analysis of Regional Heterogeneity in Ethnic and Non-Ethnic Provinces of China

In China, the overall economic development of ethnic provinces is slower than that of non-ethnic provinces due to historical and geographical factors. Such differences will intrinsically disrupt policy effects. In general, China’s eight ethnic provinces include the Inner Mongolia Autonomous Region, Ningxia Hui Autonomous Region, Xinjiang Uyghur Autonomous Region, Tibet Autonomous Region, Guangxi Zhuang Autonomous Region, Guizhou, Yunnan and Qinghai province. Accordingly, we categorize the observed areas into ethnic and non-ethnic areas. Table 7 examines the additional impact of the construction of the NKEFA. The results show that the policy effect in the eight ethnic provinces is not significant, while the effect of policy implementation in other provinces is improved. This suggests that the NKEFA policy needs to further consider the characteristics of ethnic areas and produce more favorable policies. The autonomous regions also need to have greater initiative under the policy deployment. The spatial distribution of ethnic provinces and non-ethnic provinces is shown in Figure 4.
On the whole, the reasons why the effect of the NKEFA policy is not significant in western regions and ethnic provinces are similar. First of all, in the western regions and ethnic provinces, due to their remote geographical location and inconvenient transportation, resulting in greater difficulty in policy implementation and supervision, the policy effects are difficult to fully show. Secondly, these regions have a relatively low level of economic development and lack sufficient capital and technology to support the construction and development of NKEFA. Finally, the NKEFA policy has strict restrictions on industrial access, especially on high-pollution and high-energy consumption industries. Western regions and ethnic provinces, most of which rely on these industries to sustain economic development, are likely to face greater economic pressure after the policy is implemented.

6. Discussion

In this paper, from the five aspects of innovative development, coordinated development, green development, open development and shared development, we set up high-quality economic development indicators to measure the level of the high-quality economic development of cities [36]. The DID model was introduced to evaluate the impact of the NKEFA policy on high-quality economic development. The results show that the NKEFA policy has a significant positive impact on high-quality economic development. By examining the dynamic parallel trends, we find that the positive contribution of the policy presents a continuous advantage in the time dimension. This once again confirms that the practice of environmental protection can have a positive impact on economic development [1,2,3]. At present, most of the research on the NKEFA policy is about the environmental and economic effects [15,16]. The contribution of this paper is to focus on the impact of NKEFA on high-quality economic development and provide a case supplement to the existing research.

6.1. Discussion on Heterogeneity

As with many policy implementation effects, there are regional differences in the construction of NKEFA. We found that the policy has an impact on the eastern region and central region. Then, no effective policy effect is detected in the western region. For this problem, the existing research provides a lot of inspiration [16,20]. The possible reason is that the infrastructure in the eastern region is relatively perfect and the transportation, communication, energy and other conditions are superior, which is conducive to attracting investment and promoting technological progress. In addition, the service industry and high-tech industries in the eastern region account for a high proportion, which is conducive to high-quality economic development. It may be easier for policies to play a catalytic role in the region because good conditions provide solid support for ecological protection and economic development [21]. Although infrastructure construction in the central region is not as perfect as that in the eastern region, it has been gradually strengthened in recent years. The policy has promoted high-quality economic development in the central region to a certain extent, but its effect may not be as significant as in the eastern region. The infrastructure in the western region is relatively weak, and the problems such as inconvenient transportation and blocked information are more prominent. The economic structure of the western region is relatively unitary, the proportion of resource-based industries is high and the dependence on the ecological environment is strong. The existing research shows that these factors will also restrict the implementation of the NKEFA policy, making it difficult to give full freedom to the promotion role [14].
Similarly, the policy effect in the ethnic provinces did not pass the significance test. China is a multi-ethnic country and this factor needs to be taken into account in the issue of the regional imbalance of development. Only in this way can the policy details be adjusted according to local conditions.
The policy effect of ethnic provinces is not good, which may be caused by a number of complex factors. First of all, these areas have often harsh geographical conditions and are fragile ecological environments, such as drought, cold, rocky desertification, etc., so it is difficult to restore ecological functions. Some areas may be affected by frequent natural disasters, such as floods, landslides and debris flows, which will destroy the existing ecological achievements [22,23]. Secondly, the contradiction between economic development and ecological protection in these regions is more prominent [24]. Many of the ethnic provinces are resource-based, relying on mineral, forestry, agriculture and other resources development. For example, the development of Inner Mongolia depends on rich coal, rare earth metals and wind energy resources. It is also an important animal husbandry base. The development of Yunnan is also inseparable from non-ferrous metals, oil, natural gas, coal and other resources. These activities may conflict with conservation goals. Thirdly, ecological restoration and protection require a large amount of capital investment and these areas may lack sufficient financial support due to financial constraints. Technical limitations are also a key factor, especially in remote and underdeveloped areas where there is a lack of advanced ecological restoration technology and management experience [25]. Finally, socio-cultural factors may also influence the implementation and effectiveness of policies. The lifestyle and traditional customs of the local population may not be fully compatible with ecological conservation measures, such as nomadic, farming, hunting and other activities [76].

6.2. Discussion on Intermediary Mechanism

The mediating roles of per capita expenditure on technology and education was confirmed in the transmission mechanism test. This is consistent with some research findings [56,57]. The policy may encourage businesses and individuals to increase investment in technology and education by providing incentives such as financial subsidies and tax breaks. On the one hand, the increased technological investment can promote technological innovation and the industrial upgrading of enterprises and improve the production efficiency and product quality. Technological progress can also boost the development of emerging industries and provide new impetus for economic growth. On the other hand, the increased investment in education helps to improve the level of human capital and provide talent support. This will have a profound impact on high-quality economic development [58].
The mediating roles of per capita retail sales of consumer goods were also confirmed in the transmission mechanism test. The possible reason is that the policy orientation helps promote the development of a green economy and encourages the rise of eco-friendly industries, such as ecotourism and green agriculture. With the development of these industries, local residents will have more employment opportunities and sources of income, which will enhance their consumption power [59,60,61]. The consumption structure will also be optimized and emerging consumption patterns such as green consumption and healthy consumption will be more widely promoted and accepted. The expanded market demand will stimulate enterprises to increase investment and improve product quality and service levels, thus promoting high-quality economic development. In addition, the upgrading of the consumption structure will also contribute to the formation of a more diversified and high-value-added economic structure [63,64].

6.3. Discussion on the Implications of Policy for Developing Countries

China’s NKEFA policy aims to promote high-quality economic development while protecting the ecological environment. Similarly, many developing countries also face the dual challenges of ecological protection and economic development [4,5]. These countries are often rich in natural resources, but they also face problems such as poverty, poor infrastructure and environmental pollution. As a result, many developing countries have implemented similar policies, which have also achieved both economic growth and environmental protection. However, the effectiveness of these policies is often influenced by a number of factors, including the strength of policy implementation, the level of infrastructure and the participation of local communities. According to the experimental results of this article, policy makers need to take into account regional and ethnic differences when implementing similar policies and take targeted measures to promote balanced development. And, in the process of policy implementation, policy makers can increase the investment in technology and education and stimulate the consumer demand to make the policy effect better.

7. Conclusions and Policy Recommendations

We focus on examining whether the policy of NKEFA can coordinate environmental protection and high-quality economic development and analyze the theoretical mechanisms. After conducting a multifaceted examination, we now summarize the findings. (1) NKEFA can promote high-quality economic development. They prove that the policy balances the relationship between environmental protection and economic development well. (2) The NKEFA policy affects high-quality economic development by two indirect means. One is to stimulate the consumer demand and the other is to increase investment in technology and education. (3) After conducting a test for the heterogeneity of regional policy effects, we find that NKEFA are less effective in regions with less favorable conditions for economic development. Typical examples are the western region and ethnic provinces.
The theoretical mechanisms discussed above, as well as the analysis of heterogeneity, can guide specific practical scenarios. At the same time, we put forward the following suggested policies in order to contribute to the practice.
(1)
Effectively guiding and supporting industries in key ecological function areas to further boost the consumption demand. The development of suitable industries is not only conducive to increasing people’s income, but also profoundly affects the regional consumption demand. NEKFA, under the premise of following the priority of protection, should be based on regional advantages and natural endowments to create one or even multiple growth poles to drive consumption. For example, the western region can establish the new concept of “regional tourism” by virtue of its good natural environment and diverse folk customs, actively develop the ecotourism industry, provide high-quality ecological products and enhance the vitality of economic development.
(2)
In the process of building the NKEFA, support for investment in technology and education should be increased. For example, Anji County in the Zhejiang Province, as a pilot zone, has paid attention to improving the level of education and technology in the process of policy implementation and promoted the upgrading and transformation of local industries by introducing high-end talents and advanced technologies. According to practical experience and experimental results, the investment in technology and education plays a positive role. This can lead to innovation while also improving energy use efficiency, improving the quality and skills of workers and achieving environmental and economic benefits. In the long run, it can maximize the encouragement of the zone to stimulate the endogenous development power of the western region and ethnic regions and alleviate the problem of unbalanced development between regions.
(3)
Policy makers should formulate differentiated policies according to the actual development of different regions and ensure the fairness and effectiveness of policies as much as possible. Since the effect of the policy is significant in the eastern and central regions, it is suggested to further strengthen the construction of the policy in these regions, optimize the allocation of resources, encourage the research and development of green technology and improve the coordinated development of ecological quality and economic quality in these regions.
Given that the effect of the policy in the western region is not significant, it is necessary to deeply learn the characteristics and constraints of the western region and formulate policies that are more in line with the local reality. For example, the Aba Tibetan and Qiang Autonomous Prefecture in the Sichuan Province, as a pilot zone, faces the dual challenges of ecological protection and economic development. Due to its remote location and weak infrastructure, the development of Aba is still limited. Policymakers can promote the further implementation of this policy in the western region by increasing central financial transfer payments to optimize infrastructure construction, as well as providing technical support and personnel training.
In ethnic areas, policy makers need to formulate targeted policies and measures to promote the harmonious coexistence of economy and ecology while fully respecting the culture, customs and ecological characteristics of ethnic areas.
Research prospects: This study focuses on the effects of NKEFA in the short-to-medium term (2011–2019), but the long-term effects of the policy are often more complex and far-reaching. We will continue to track the long-term effects of the policy in the future. At the same time, we found that the policy effect is not significant in the western region or ethnic provinces, which suggests that we need to further analyze the particularity and challenges faced by these regions in the future and continue to explore targeted policy measures.
In addition, the implementation of the policy not only affects economic development; in the future, we will more carefully evaluate the environmental and social benefits of NKEFA in reducing pollution, protecting biodiversity and promoting green transformation.

Author Contributions

Y.Z.: Writing—original draft, methodology, investigation, formal analysis, data curation, conceptualization, validation, writing—review and editing. C.S.: Methodology, software, resources, writing—original draft, formal analysis, methodology, supervision. C.X.: Formal analysis, validation, software, resources, writing—original draft, funding acquisition, writing—review and editing. All authors have read and agreed to the published version of the manuscript.

Funding

This research was supported by the Minzu University of China Project on forging a sense of community for the Chinese nation and the Chunhui program of the Ministry of Education (2023ZQT031).

Data Availability Statement

The data associated with our study have not been deposited into a publicly available repository. The datasets generated during the current study are available from the corresponding author on reasonable request.

Acknowledgments

We are grateful for the comments and criticisms of the journal’s anonymous reviewers and our colleagues.

Conflicts of Interest

The authors declare no conflicts of interest.

References

  1. Arrow, K.; Bolin, B.; Costanza, R.; Dasgupta, P.; Folke, C.; Holling, C.S.; Jansson, B.O.; Levin, S.; Mäler, K.G.; Perrings, C.; et al. Economic Growth, Carrying Capacity, and the Environment. Science 1995, 268, 520–521. [Google Scholar] [CrossRef] [PubMed]
  2. Shahbaz, M.; Ozturk, I.; Afza, T.; Ali, A. Revisiting the environmental Kuznets curve in a global economy. Renew. Sustain. Energy Rev. 2013, 25, 494–502. [Google Scholar] [CrossRef]
  3. Wang, Y.; Hu, H.; Dai, W.; Burns, K. Evaluation of industrial green development and industrial green competitiveness: Evidence from Chinese urban agglomerations. Ecol. Indic. 2021, 124, 107371. [Google Scholar] [CrossRef]
  4. Tomislav, K. The concept of sustainable development: From its beginning to the contemporary issues. Zagreb Int. Rev. Econ. Bus. 2018, 21, 67–94. [Google Scholar]
  5. Chen, S.; Chen, D. Air pollution, Government control and high-quality economic development. Econ. Res.-Ekon. Istraživanja 2018, 53, 20–34. [Google Scholar]
  6. Manioudis, M.; Meramveliotakis, G. Broad strokes towards a grand theory in the analysis of sustainable development: A return to the classical political economy. New Political Econ. 2022, 27, 866–878. [Google Scholar] [CrossRef]
  7. Berisha, E.; Caprioli, C.; Cotella, G. Unpacking SDG target 11a: What is it about and how to measure its progress? City Environ. Interact. 2022, 14, 100080. [Google Scholar] [CrossRef]
  8. Ge, T.; Li, C.; Li, J.; Hao, X. Does neighboring green development benefit or suffer from local economic growth targets? Evidence from China. Econ. Model. 2023, 120, 106149. [Google Scholar] [CrossRef]
  9. Yang, Y.; Su, X.; Yao, S. Nexus between green finance, fintech, and high-quality economic development: Empirical evidence from China. Resour. Policy 2021, 74, 102445. [Google Scholar] [CrossRef]
  10. Ge, T.; Lv, X.; Ma, L.; Shen, X. Can industrial relocation reduce air pollution? Evidence from a quasi-natural experiment in China. Front. Environ. Sci. 2022, 10, 910668. [Google Scholar] [CrossRef]
  11. Xiong, K.; Sharifi, A.; He, B. Resilient Smart Cities: Theoretical and Empirical Insights; The Urban Book Series; Sharifi, A., Salehi, P., Eds.; Springer International Publishing: Cham, Switzerland, 2022. [Google Scholar]
  12. Zhao, J.; Jiang, Q.; Dong, X.; Dong, K.; Jiang, H. How does industrial structure adjustment reduce CO2 emissions? Spatial and mediation effects analysis for China. Energy Econ. 2022, 105, 105704. [Google Scholar] [CrossRef]
  13. Kasztelan, A. Green growth, green economy and sustainable development: Terminological and relational discourse. Prague Econ. Pap. 2017, 26, 487–499. [Google Scholar] [CrossRef]
  14. Guo, J.; Lai, X.; Lu, C.; Cao, S. What has caused China’s economic growth? Econ. Syst. 2022, 46, 100982. [Google Scholar] [CrossRef]
  15. Wang, H.; Wu, W.; Xiong, L.; Wang, F. Is there an environment and economy trade off for the National Key Ecological Function Area policy in China? Environ. Impact Assess. Rev. 2024, 104, 107347. [Google Scholar] [CrossRef]
  16. Fan, J.; Sun, W.; Zhou, K.; Chen, D. Major function oriented zone: New method of spatial regulation for reshaping regional development pattern in China. Chin. Geogr. Sci. 2012, 22, 196–209. [Google Scholar] [CrossRef]
  17. Jin, S.; Jiang, A.; Bao, B. Can China’s transfer payment in key ecological function areas reduce the carbon intensity?–Quasi–Natural experimental evidence from Jiangxi, China. Ecol. Indic. 2023, 154, 110537. [Google Scholar] [CrossRef]
  18. Zhang, R.-b.; Zhong, C.-b. The establishment of the national key ecological functional zone and the county’s ecological green development. Front. Ecol. Evol. 2023, 11, 1144245. [Google Scholar]
  19. Zhao, X.; Chen, H.; Zhao, H.; Xue, B. Farmer households’ livelihood resilience in ecological-function areas: Case of the Yellow River water source area of China. Environ. Dev. Sustain. 2022, 24, 9665–9686. [Google Scholar] [CrossRef]
  20. Guo, J.; Yu, Z.; Ma, Z.; Xu, D.; Cao, S. What factors have driven urbanization in China? Environ. Dev. Sustain. 2022, 24, 6508–6526. [Google Scholar] [CrossRef]
  21. Weng, Q.; Lian, H.; Qin, Q. Spatial disparities of the coupling coordinated development among the economy, environment and society across China’s regions. Ecol. Indic. 2022, 143, 109364. [Google Scholar] [CrossRef]
  22. Long, Y.; He, Y.; Yu, C.; Chen, M. The development status and protection of traditional qiang ethnic minority villages. AIP Conf. Proc. 2018, 1944, 020018. [Google Scholar]
  23. Yousaf, S.; Liu, Y.; Xiang, Y. Tourism and sociocultural identity discourses in ethnic minority communities: A study of she ethnic townships in Zhejiang Province, China. J. Sustain. Tour. 2024, 1–25. [Google Scholar] [CrossRef]
  24. Fan, J.; Zheng, B.; Zhang, B.; Huang, Z.; Liu, J. Research on the Revitalization Path of Ethnic Villages Based on the Inheritance of Spatial Cultural Genes—Taking Tujia Village of Feng Xiang Xi in Guizhou Province as a Case Study. Sustainability 2023, 15, 1303. [Google Scholar] [CrossRef]
  25. Zheng, G.H.; Jiang, D.F.; Luan, Y.F.; Yao, Y. GIS-based spatial differentiation of ethnic minority villages in Guizhou Province, China. J. Mt. Sci. 2022, 19, 987–1000. [Google Scholar] [CrossRef]
  26. Zhao, Y.; Hou, P.; Jiang, J.; Zhai, J.; Chen, Y.; Wang, Y.; Bai, J.; Zhang, B.; Xu, H. Coordination study on ecological and economic coupling of the Yellow River Basin. Int. J. Environ. Res. Public Health 2021, 18, 10664. [Google Scholar] [CrossRef]
  27. Gao, D.; Feng, H.; Cao, Y. The spatial spillover effect of innovative city policy on carbon efficiency: Evidence from China. Singap. Econ. Rev. 2024, 1–23. [Google Scholar] [CrossRef]
  28. Cao, S.; Wang, X.; Song, Y.; Chen, L.; Feng, Q. Impacts of the Natural Forest Conservation Program on the livelihoods of residents of Northwestern China: Perceptions of residents affected by the program. Ecol. Econ. 2010, 69, 1454–1462. [Google Scholar] [CrossRef]
  29. Collins, D.; Zheng, C. Managing the poverty–CO2 reductions paradox: The case of China and the EU. Organ. Environ. 2015, 28, 355–373. [Google Scholar] [CrossRef]
  30. Gao, D.; Zhou, X.; Wan, J. Unlocking sustainability potential: The impact of green finance reform on corporate ESG performance. Corp. Soc. Responsib. Environ. Manag. 2024, 31, 4211–4226. [Google Scholar] [CrossRef]
  31. Fischer, J.; Riechers, M.; Loos, J.; Martin-Lopez, B.; Temperton, V.M. Making the UN decade on eco-system restoration a social-ecological endeavour. Trends Ecol. Evol. 2021, 36, 20–28. [Google Scholar] [CrossRef]
  32. Heger, M.; Zens, G.; Bangalor, M. Does the environment matter for poverty reduction. In The Role of Soil Fertility and Vegetation Vigor in Poverty Reduction; World Bank Group: Washington, DC, USA, 2018. [Google Scholar]
  33. Yang, Z.; Li, Q.; Xue, W. Impacts of nature reserves on local residents’income in China. Ecol. Econ. 2022, 199, 107494. [Google Scholar] [CrossRef]
  34. Wang, Q.; Li, L. The effects of population aging, life expectancy, unemployment rate, population density, per capita GDP, urbanization on per capita carbon emissions. Sustain. Prod. Consum. 2021, 28, 760–774. [Google Scholar] [CrossRef]
  35. Zhang, C.; Kong, J. Effect of Equity in Education on the Quality of Economic Growth: Evidence from China. J. Hum. Sci. 2010, 7, 47–69. [Google Scholar]
  36. Mei, L.; Chen, Z. The Convergence Analysis of Regional Growth Differences in China: The Perspective of the Quality of Economic Growth. J. Serv. Sci. Manag. 2016, 9, 453–476. [Google Scholar] [CrossRef]
  37. Lee, C.C.; Lee, C.C. How does green finance affect green total factor productivity? Evidence from China. Energy Econ. 2022, 107, 105863. [Google Scholar] [CrossRef]
  38. Chen, S.; Chen, D. Haze pollution, government governance and high-quality economic development. Econ. Res. 2018, 53, 20–34. [Google Scholar]
  39. Lu, Z.; Chen, H.; Hao, Y.; Wang, J.; Song, X.; Mok, T.M. The dynamic relationship between environmental pollution, economic development and public health: Evidence from China. J. Clean. Prod. 2017, 166, 134–147. [Google Scholar] [CrossRef]
  40. Thomas, V.; Dailami, M.; Mansoor, D. The Quality of Growth; Oxford University Press: Oxford, UK, 2000. [Google Scholar]
  41. Li, B.; Wang, H. Comprehensive evaluation of urban high-quality development: A case study of Liaoning Province. Environ. Dev. Sustain. 2023, 25, 1809–1831. [Google Scholar] [CrossRef]
  42. Pan, W.; Wang, J.; Lu, Z.; Liu, Y.; Li, Y. High-quality development in China: Measurement system, spatial pattern, and improvement paths. Habitat Int. 2021, 118, 102458. [Google Scholar] [CrossRef]
  43. Liu, Y.; Tian, C.; Cheng, L. Measurement and Comparison of the High Quality Development Level of the World Economy. Economist 2020, 5, 69–78. [Google Scholar]
  44. Lin, G.; Jiang, D.; Fu, J.; Cao, C.; Zhang, D. Spatial Conflict of Production–Living–Ecological Space and Sustainable-Development Scenario Simulation in Yangtze River Delta Agglomerations. Sustainability 2020, 12, 2175. [Google Scholar] [CrossRef]
  45. Kivimaa, P.; Kern, F. Creative destruction or mere niche support? Innovation policy mixes for sustainability transitions. Res. Policy 2016, 45, 205–217. [Google Scholar] [CrossRef]
  46. Burton, D.M.; Gomez, I.A.; Love, H.A. Environmental regulation cost and industry structure changes. Land Econ. 2011, 87, 545–557. [Google Scholar] [CrossRef]
  47. Chong, Z.; Qin, C.; Ye, X. Environmental regulation, economic network and sustainable growth of urban agglomerations in China. Sustainability 2016, 8, 467. [Google Scholar] [CrossRef]
  48. Wang, S.; Liu, J.; Qin, X. Financing constraints, carbon emissions and high-quality urban development—Empirical evidence from 290 Cities in China. Int. J. Environ. Res. Public Health 2022, 19, 2386. [Google Scholar] [CrossRef]
  49. Ministry of Ecology of the People’s Republic of China. Technical Guide for Delimiting Ecological Protection Red Lines. 2015. Available online: https://www.mee.gov.cn/gkml/hbb/bwj/201505/t20150518_301834.htm (accessed on 8 May 2015).
  50. BJNEWS. What Are the Advantages of China’s Ecological Protection Red Line Experience Being Recommended? Detailed Explanation by Experts from the Ministry of Ecology and Environment. 2021. Available online: https://www.bjnews.com.cn/detail/163118288214699.html (accessed on 9 September 2021).
  51. Song, Z.; Wang, C.; Bergmann, L. China’s prefectural digital divide: Spatial analysis and multivariate determinants of ICT difusion. Int. J. Inf. Manag. 2020, 52, 102072. [Google Scholar] [CrossRef]
  52. Christainsen, G.; Haveman, R. The contribution of environmental regulations to the slowdown in productivity growth. J. Environ. Econ. Manag. 1981, 8, 381–390. [Google Scholar] [CrossRef]
  53. Yu, X.; Wang, P. Economic effects analysis of environmental regulation policy in the process of industrial structure upgrading: Evidence from Chinese provincial panel data. Sci. Total Environ. 2021, 753, 142004. [Google Scholar] [CrossRef]
  54. Liu, X. New digital infrastructure, financial resource allocation and high quality economic development in the internet Era. Appl. Math. Nonlinear Sci. 2023, 9, 1–17. [Google Scholar] [CrossRef]
  55. Okerekeoti, C.U. Government expenditure on education and economic growth in Nigeria. Int. J. Recent Res. Commer. Econ. Manag. (IJRRCEM) 2022, 9, 126–134. [Google Scholar]
  56. Tang, T.C.; Lai, S.L. Government spending on tertiary education, knowledge, technology, and economic growth. J. Econ. Dev. 2022, 47, 99–122. [Google Scholar]
  57. Liu, Z.; Tong, Z.; Zhang, Z. Government expenditure structure, technological progress and economic growth. Int. J. Emerg. Mark. 2024, 19, 3729–3767. [Google Scholar] [CrossRef]
  58. Gu, W.; Wang, J.; Hua, X.; Liu, Z. Entrepreneurship and high-quality economic development: Based on the triple bottom line of sustainable development. Int. Entrep. Manag. J. 2021, 17, 1–27. [Google Scholar] [CrossRef]
  59. Cubas, G.; Ravikumar, B.; Ventura, G. Talent, labor quality, and economic development. Rev. Econ. Dyn. 2016, 21, 160–181. [Google Scholar] [CrossRef]
  60. Liu, M.; Hu, H. Carbon emissions, consumption structure upgrading, and high-quality economic development: Empirical evidence from China. J. Asia Pac. Econ. 2021, 29, 237–259. [Google Scholar] [CrossRef]
  61. Thompson, M. Social capital, innovation and economic growth. J. Behav. Exp. Econ. 2018, 73, 46–52. [Google Scholar] [CrossRef]
  62. Gui, Y.; Fang, Y.; Liu, J. Community-based ecotourism in nature reserve of China. Chin. Geogr. Sci. 2004, 14, 276–282. [Google Scholar] [CrossRef]
  63. Nuzula, N.I.; Armono, H.D.; Rosyid, D.M. Management of Baluran National Park resources for coastal ecotourism based on suitability and carrying capacity. Appl. Mech. Mater. 2017, 862, 161–167. [Google Scholar] [CrossRef]
  64. Walter, P.; Regmi, K.D.; Khanal, P.R. Host learning in community-based ecotourism in Nepal: The case of Sirubari and Ghalegaun homestays. Tour. Manag. Perspect. 2018, 26, 49–58. [Google Scholar] [CrossRef]
  65. Lv, P.; Yuan, Y. Industrial collaborative clustering, technological innovation and the quality of economic growth-based on empirical analysis of producer service industry and high-tech manufacturing industry. Theory Pract. Financ. Econ. 2020, 41, 118–125. [Google Scholar]
  66. Guo, J.; Sun, Z. How does manufacturing agglomeration affect high-quality economic development in China? Econ. Anal. Policy 2023, 78, 673–691. [Google Scholar] [CrossRef]
  67. Papalia, R.B.; Bertarelli, S. Nonlinearities in economic growth and club convergence. Empir. Econ. 2013, 44, 1171–1202. [Google Scholar] [CrossRef]
  68. Nie, C.; Jian, X.H. Measurement of china’s high-quality development and analysis of provincial status. J. Quant. Tech. Econ. 2020, 37, 26–47. [Google Scholar]
  69. Wei, R.; Li, T.D. Establishment of free trade areas and high-quality economic development-quasi-natural experiment based on FTA. J. Bus. Econ. 2020, 5, 77–87. [Google Scholar]
  70. Ji, X.; Yao, Y.; Long, X. What causes PM2. 5 pollution? Cross-economy empirical analysis from socioeconomic perspective. Energy Policy 2018, 119, 458–472. [Google Scholar] [CrossRef]
  71. Horst, R.; Joachim, W. Intra-industry adjustment to import competition: Theory and application to the German clothing industry. World Econ. 2010, 33, 1006–1022. [Google Scholar]
  72. Qiao, Z.; Li, Z. Do foreign institutional investors enhance firm innovation in China? Appl. Econ. Lett. 2019, 26, 1125–1128. [Google Scholar] [CrossRef]
  73. Rosenbaum, P.R.; Rubin, D.B. The central role of the propensity score in observational studies for causal effects. Biometrika 1983, 70, 41–55. [Google Scholar] [CrossRef]
  74. Marcus, M.; Sant’Anna, P.H.C. The role of parallel trends in event study settings: An application to environmental economics. J. Assoc. Environ. Resour. Econ. 2021, 8, 235–275. [Google Scholar] [CrossRef]
  75. Huang, D.; Chen, G. Can the carbon emissions trading system improve the green total factor productivity of the pilot cities?—A spatial difference-in-differences econometric analysis in China. Int. J. Environ. Res. Public Health 2022, 19, 1209. [Google Scholar] [CrossRef]
  76. Luo, H.; Li, W.; Cai, Z.; Luo, H. The environmental efects of digital economy: Evidence from province-level empirical data in China. Environ. Sci. Pollut. Res. 2023, 30, 63272–63288. [Google Scholar] [CrossRef]
Figure 1. The distribution regions of the 243 prefecture-level cities in this research. Note: control groups are the pilot cities of the National Key Ecological Function Areas (NKEFA) in 2016; experimental groups are the cities that had not implemented the NKEFA policy in 2016.
Land 14 00345 g001
Figure 2. Parallel Trend Test.
Land 14 00345 g002
Figure 3. Placebo test for national key ecological function areas.
Land 14 00345 g003
Figure 4. Spatial distribution of regional heterogeneity.
Land 14 00345 g004
Table 1. Index system used to evaluate the high-quality economic development.
First-Level IndicatorsSecond-Level IndicatorsDetailed IndicatorsInformation Entropy (e)Information Utility Value (d)Weighting Factor (w)Attribute
High-quality economic development Innovative developmentFinancial Inclusion Index0.98850.01155.13%+
Coordinated developmentIndustrial Advancement0.98280.01727.66%+
Public fiscal expenditure as a share of GDP0.98440.01566.98%+
Population urbanization rate0.98960.01044.65%+
Unemployment rate0.99950.00050.20%
Green DevelopmentComprehensive utilization rate of general industrial solid waste0.99360.00642.87%+
Centralized treatment rate of sewage treatment plants0.99680.00321.42%+
Greening coverage in built-up areas0.9980.0020.88%+
Open DevelopmentTens of thousands of Internet broadband access subscribers0.96430.035715.96%+
Shared DevelopmentNumber of doctors (medical practitioners, medical assistants)0.97320.026811.96%+
Road mileage0.98190.01818.08%+
Number of students enrolled in general secondary schools0.97440.025611.44%+
Number of pupils enrolled in primary schools0.96770.032314.44%+
Urban–rural income gap0.99630.00371.67%
Real disposable income of the population0.98510.01496.66%+
Table 2. Descriptive statistics for variables.
TypesVariablesNMinMaxMeanSd
Explained variablesComposite index of high-quality development21870.100.660.270.79
Core explanatory variablesdid21870.001.000.080.28
Controlled variablesIndustrial value added per capita21871024.62678,727,079.70812,731.9118,098,215.03
Investment in fixed assets as a share of GDP21871218.32417,527.7036,980.7125,045.53
PM2.521871844.4227,439.1710,450.324698.23
Loans from financial institutions per capita2187693,465.42301,167,299.0015,437,010.1221,669,475.35
Imports and exports per capita21870.10209,697.628975.3120,610.21
Mediating variablesPer capita retail sales of consumer goods 2187494.7072,777.9916,727.269539.73
Per capita expenditure on science and technology education21871.04141.7418.284.88
Table 3. DID model estimated results of the impact of the NKEFA on high-quality economic development.
VariablesModel 1Model 2Model 3Model 4
(1)(2)(3)(4)
did0.0583 ***
(16.30)
0.0038 *
(2.28)
0.0158 ***
(7.39)
0.0043 **
(2.63)
cons0.2595 ***
(323.82)
0.2175 ***
(224.10)
0.2628 ***
(576.56)
0.2253 ***
(191.11)
R20.01030.82110.68430.8334
F265.53131.1 × 103821.8468790.2142
ControlNoNoYesYes
City-FENoYesNoYes
Year-FENoYesNoYes
Obs2187218721872187
Note: t statistics in parentheses * p < 0.05, ** p < 0.01, *** p < 0.001.
Table 4. Results of three robustness testing methods.
VariablesReplacement of Explanatory VariablesElimination of Other Policy
(Ecological Civilization Pilot Zone)
Elimination of Other Policy (Green Shield Action)
(1)(2)(3)
did0.0043 **
(2.68)
0.0048 *
(2.54)
0.0931 ***
(4.18)
cons0.2308 ***
(196.77)
0.2254 ***
(176.78)
−0.5076 ***
(−36.63)
R20.86080.82750.8604
F972.6124697.5903778.6174
ControlYesYesYes
City-FEYesYesYes
Year-FEYesYesYes
Obs218720071737
Note: t statistics in parentheses * p < 0.05, ** p < 0.01, *** p < 0.001.
Table 5. Intermediary mechanism test results.
VariablesPer Capita Retail Sales of Consumer Goods High-Quality Economic DevelopmentPer Capita Expenditure on Technology and EducationHigh-Quality Economic Development
(1)(2)(3)(4)
did0.0772 *
(2.51)
0.1269 **
(3.23)
M 0.0083 ***
(6.80)
0.0086 ***
(9.15)
Did × M 0.0063 ***
(3.81)
0.0058 ***
(3.56)
R20.7220 0.7268
F521.2784 894.5424
ControlYesYesYesYes
City-FEYesYesYesYes
Year-FEYesYesYesYes
Obs2187218721872187
Note: t statistics in parentheses * p < 0.05, ** p < 0.01, *** p < 0.001.
Table 6. The results of region heterogeneity in east, central and west of China.
VariablesEastern RegionCentral RegionWestern Region
(1)(2)(3)
did0.0056 *
(2.16)
0.0047 *
(2.18)
0.0020
(0.44)
cons0.6138 ***
(6.80)
0.6090 ***
(10.13)
0.1910 ***
(96.16)
R20.85040.85310.8451
F386.3946357.3948243.3903
ControlYesYesYes
City-FEYesYesYes
Year-FEYesYesYes
Obs864864459
Note: t statistics in parentheses * p < 0.05, *** p < 0.001.
Table 7. Analysis of heterogeneity between ethnic and non-ethnic provinces.
VariablesEthnic ProvincesNon-Ethnic Provinces
(1)(2)
did0.0015
(0.31)
0.0837 ***
(32.96)
cons−0.1241
(−0.81)
0.2317 ***
(161.98)
R20.85710.8306
F114.3830665.6672
ControlYesYes
City-FEYesYes
Year-FEYesYes
Obs2611926
Note: t statistics in parentheses *** p < 0.001.
Disclaimer/Publisher’s Note: The statements, opinions and data contained in all publications are solely those of the individual author(s) and contributor(s) and not of MDPI and/or the editor(s). MDPI and/or the editor(s) disclaim responsibility for any injury to people or property resulting from any ideas, methods, instructions or products referred to in the content.

