Article

Investigation of Diverse Urban Carbon Emission Reduction Pathways in China: Based on the Technology–Organization–Environment Framework for Promoting Socio-Environmental Sustainability

School of Architecture and Urban Planning, Guangdong University of Technology, Guangzhou 510090, China
*
Author to whom correspondence should be addressed.
These authors contributed equally to this work and share first authorship.
Land 2025, 14(2), 260; https://doi.org/10.3390/land14020260
Submission received: 30 December 2024 / Revised: 22 January 2025 / Accepted: 24 January 2025 / Published: 26 January 2025

Abstract

:
In the context of global carbon emissions and climate change, identifying context-specific low-carbon pathways for urban areas is critical for achieving socio-environmental sustainability. This study applies the technology–organization–environment (TOE) framework to examine the driving mechanisms and the diversity in carbon reduction pathways across 81 cities in China. Utilizing partial least squares structural equation modeling (PLS-SEM) and necessary condition analysis (NCA), this research assesses the roles of technological, organizational, and environmental drivers in urban carbon reduction. Fuzzy-set qualitative comparative analysis (fsQCA) is employed to uncover distinct carbon reduction pathways and causal asymmetries between cities. The findings reveal that technological, organizational, and environmental factors significantly drive carbon reduction, with technological and organizational factors playing the central roles. Environmental factors exert primarily indirect effects, interacting with technological and organizational drivers. This study categorizes cities into three distinct carbon reduction models: cities with high carbon-neutral potential primarily leverage technological innovation and energy efficiency optimization; cities with moderate potential integrate technology and policy, emphasizing green landscape planning to achieve balanced development; and cities with lower carbon reduction potential are mainly policy-driven, constrained by technological and resource limitations. This study underscores the role of computational modeling in providing valuable insights for the development of context-tailored carbon reduction strategies. It highlights the synergetic interactions among technological, organizational, and environmental factors, offering essential guidance for advancing sustainable development planning and facilitating the low-carbon transition of cities and communities.

1. Introduction

In 2019, global carbon dioxide concentrations reached a record high of 411 ppm, primarily driven by emissions from fossil fuels [1], making carbon emission reduction and climate change mitigation urgent global priorities [2]. In 2020, in response, China announced a commitment to reaching a carbon peak by 2030 and carbon neutrality by 2060 [3]. Cities, as major contributors to carbon emissions, play a pivotal role in advancing the transition to a green, low-carbon future [4]. For instance, Copenhagen has significantly reduced emissions by integrating district heating systems with wind energy, setting a benchmark for urban energy efficiency [5]. In North America, cities like Vancouver have advanced their low-carbon transitions through stringent building energy efficiency standards, green infrastructure development, and innovative policy tools [6]. Similarly, implementing low-carbon strategies in Chinese cities is crucial for achieving national carbon goals. The National Development and Reform Commission (NDRC) in China has designated several groups of low-carbon pilot cities, each with specific low-carbon development targets [7]. However, significant disparities in resources, development levels, and climate conditions among cities make it challenging for a unified low-carbon pathway to address the diverse needs of different urban types [8]. Most existing studies have focused on the nation as a whole or on urban clusters, insufficiently accounting for regional variations in climate, resources, and low-carbon goals. This generalization overlooks the differing capacity for carbon neutrality among cities, highlighting the need for differentiated carbon reduction pathways based on city classifications [9]. To effectively address these challenges, customized carbon reduction strategies must be developed that reflect the socio-environmental differences among cities while aligning with broader socio-environmental sustainability planning frameworks.
Current research on urban carbon reduction encompasses policy, technology, economic structure, and social awareness. In terms of technology, digital innovation, renewable energy, and industrial advancements are considered key drivers of emission reductions. Digital technologies significantly lower carbon emissions by enhancing energy efficiency and promoting green innovation [10,11]. The adoption of renewable energy technologies helps optimize and change the energy structure, leading to long-term reduction in carbon emissions [12]. Additionally, the integration of virtual reality (VR) technology has enhanced the visualization of three-dimensional carbon emission impacts in low-carbon green landscapes, optimizing carbon assessment and management [13]. Japan’s “Society 5.0” initiative demonstrates the potential of hydrogen energy technologies by incorporating hydrogen fuel cells into urban transportation systems and residential energy supplies, significantly advancing decarbonization goals [14]. Additionally, Lei Yang et al. have optimized landscape plant selection and the use of low-carbon materials through big data-driven technologies to improve energy efficiency and reduce carbon emissions [15]. Most studies, however, have focused on individual technologies rather than analyzing technological synergies. On the policy front, instruments such as carbon taxes, emission trading schemes, and energy subsidies are widely used to promote carbon reduction. Research indicates that financial incentives significantly contribute to green development [16]. Environmental regulations also reduce urban carbon intensity by imposing pressures on high-emission industries [17]. Government green initiatives have also played a key role. For example, the Sekolah case demonstrated that low-carbon landscape design and the application of green elements in schools significantly reduced carbon emissions [18]. The European Green Deal offers a comprehensive policy framework that provides systematic guidance for achieving urban carbon neutrality [19]. In San Francisco, green bonds have successfully mobilized funding for sustainable infrastructure projects, bridging economic gaps between governments and private investors while accelerating carbon reduction efforts [20]. In terms of the economy, the clustering of high-tech industries and industrial upgrading significantly diminish the proportion of high-energy-consuming sectors, optimizing resource allocation, and substantially reducing emissions [21,22]. Rationalizing and improving industrial structures provides “structural dividends”, creating vital momentum for long-term emission reductions [23]. Similarly, Amsterdam’s circular economy initiatives, such as converting waste into energy and reusing materials, illustrate how resource-rich regions can seamlessly integrate carbon reduction within broader sustainability frameworks [24]. In the social awareness domain, studies show that factors such as residents’ housing consumption, travel habits, and household lifestyles significantly impact their carbon emissions, with the average community emission per household reaching 410.6 kg CO2 per month [25]. Further analysis indicates that community lifestyles and awareness have a positive impact on reducing carbon emissions, with frugal living associated with lower carbon emissions, highlighting the importance of promoting green consumption [26]. Achieving urban carbon reduction therefore needs coordinated efforts across policy, technology, economy, and society to drive sustainable development.
In exploring the factors and pathways influencing carbon reduction, index decomposition and econometric analysis are the primary methods, using models such as STIRPAT (stochastic impacts by regression on population, affluence, and technology) and LMDI (logarithmic mean Divisia index) [27,28,29]. While index decomposition methods reveal the compositional structure of carbon emissions, they are limited in capturing complex dynamic factors such as technological progress, ownership structures, and capital efficiency [30]. Econometric analyses can incorporate multiple factors, including policy measures, government investment, technological upgrades, energy structure optimization, and industrial transformation [31,32,33,34]. However, these methods often assess the impact of a single factor while controlling for others, neglecting the interactive relationships among multiple variables and the complexity of multiple equivalent pathways [35]. They also generally assume linear and symmetric relationships between variables. Urban carbon reduction, however, is a complex, dynamic process with many phenomena exhibiting nonlinear and asymmetric characteristics due to the interplay of multiple factors [36]. Consequently, a single carbon reduction pathway cannot meet the diverse needs of different cities. In this context, integrating computational models and methods to conduct an in-depth analysis of the complex causal relationships within carbon reduction pathways and an understanding of technological, organizational, and environmental synergies are crucial for achieving urban emission reduction goals [37].
This study advances the existing literature by systematically analyzing the driving factors of urban carbon reduction within the technology–organization–environment (TOE) framework [38]. Using partial least squares structural equation modeling (PLS-SEM), this study quantifies both the direct and indirect effects of technological, organizational, and environmental factors on urban carbon reduction, revealing key driving factors that are broadly applicable across various cities and their relative importance. This analysis establishes a theoretical foundation for subsequent fuzzy-set qualitative comparative analysis (fsQCA), which enhances our understanding of causal relationships between different carbon reduction pathways. To overcome the limitations of research that focuses solely on singular net effects, this study introduces necessary condition analysis (NCA) to identify the essential conditions for carbon reduction across different city types. The research also classifies cities based on their resources and carbon neutrality capacities, exploring the heterogeneity of carbon reduction pathways among diverse city types. Through fsQCA, this study reveals causal asymmetries and the coexistence of multiple pathways in carbon reduction, deepening our understanding of reduction strategies in complex systems. The fsQCA results provide targeted emission reduction pathways for different urban contexts, assisting urban planners in identifying the core drivers of carbon reduction, particularly in cities with diverse resource, technological, and policy environments. This study integrates computational modeling methods to develop more precise low-carbon policies, thereby avoiding ineffective, uniform strategies. It aims to offer practical guidance for the sustainable development of socio-environmental systems and urban carbon reduction, while also providing innovative strategies to mitigate climate change. Figure 1 illustrates the overall framework of this study.

2. Theoretical Framework and Hypothesis Development

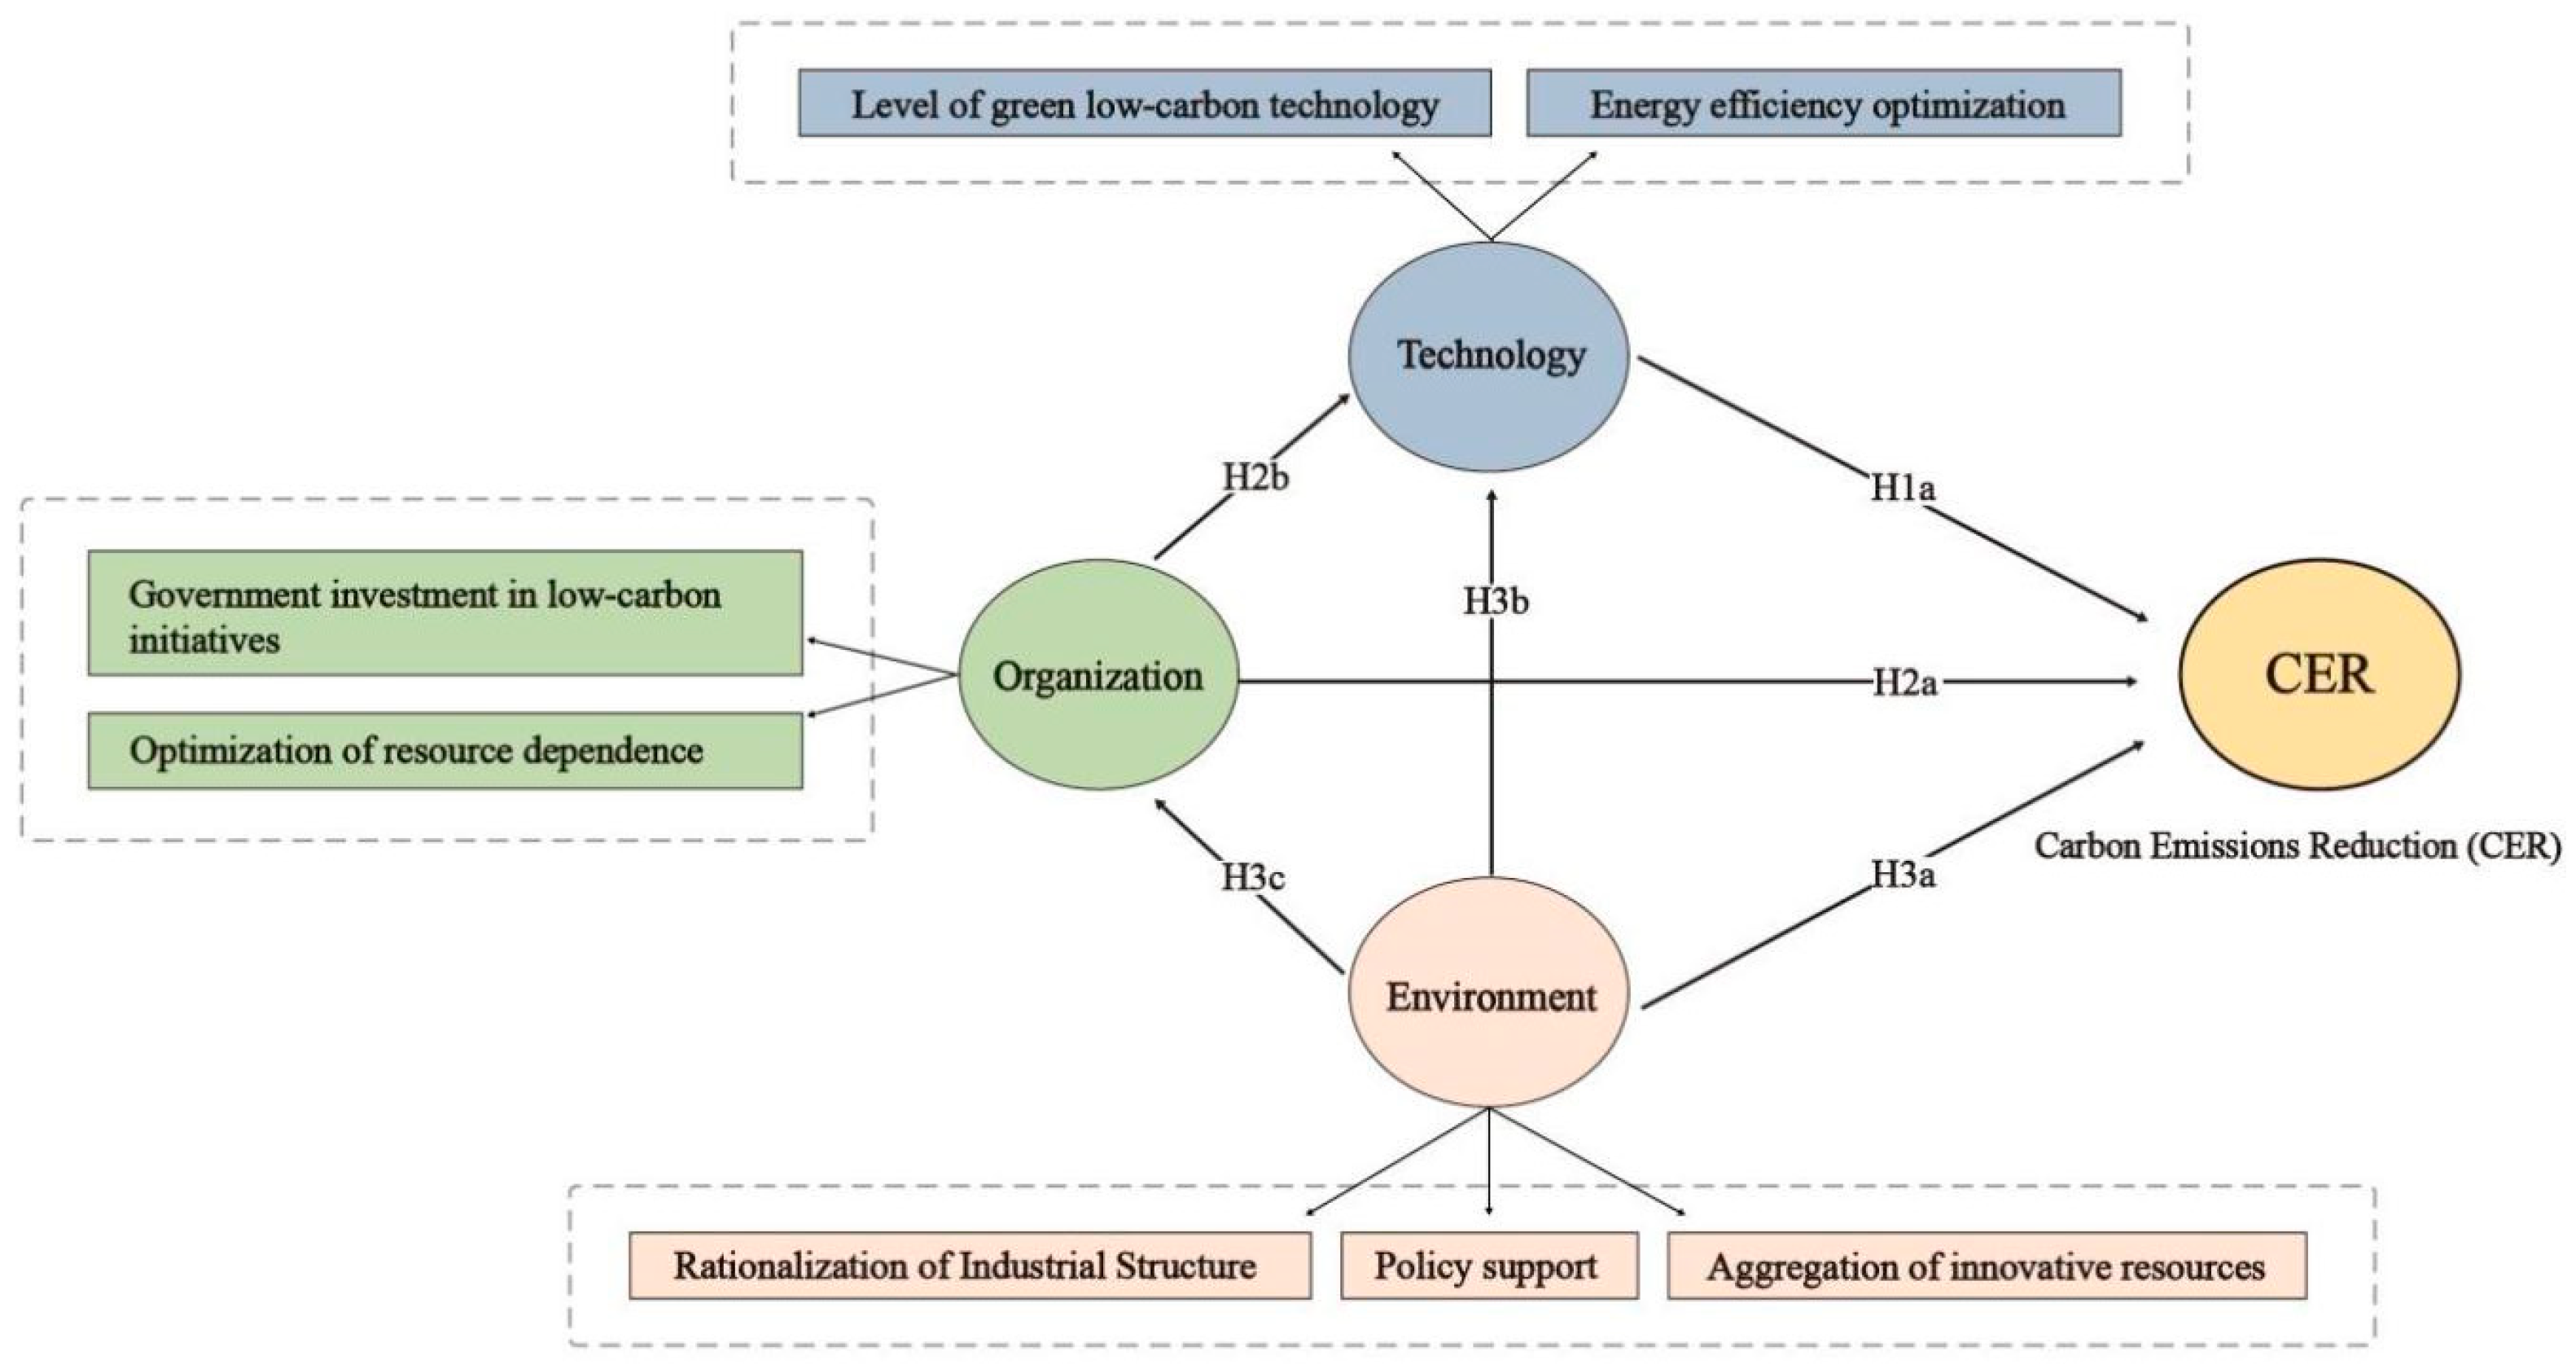
2.1. Technology–Organization–Environment (TOE) Framework

This study uses the TOE framework in the context of differentiated low-carbon urban development to systematically explore the mechanisms underlying carbon reduction pathways. Proposed by Tornatzky and Fleischer in 1990 [38], the TOE framework has been extensively applied to studies on technology adoption and innovation diffusion [39]. It comprises three core dimensions: The technological dimension focuses on factors influencing the adoption of low-carbon technologies, including their relative advantages (e.g., economic feasibility and performance benefits) and the necessary technological infrastructure (hardware and software for implementation). The organizational dimension emphasizes internal elements such as organizational support, resource allocation, and mobilization, which are critical for implementing carbon reduction initiatives [40]. The environmental dimension examines external factors, including policies, regulations, market dynamics, societal pressures, and external support systems, which collectively facilitate or constrain low-carbon transitions [41].
In recent years, the TOE framework has seen significant application in green technology and carbon reduction research. It has proven particularly effective in optimizing green technologies, shaping policy frameworks, and guiding industrial restructuring [42]. For example, it has been employed to evaluate the organizational role of blockchain technology in carbon trading and energy efficiency. Studies indicate that aligning technological adaptability with a supportive organizational environment is crucial for enhancing energy efficiency [43]. Moreover, the framework’s adaptability for developing tailored carbon reduction strategies has also been demonstrated. For instance, integrating supply chain models with fuzzy-set qualitative comparative analysis (fsQCA) has identified key influencing factors [44]. At broader scales, the framework has been used to explore strategies for improving carbon emission efficiency at the provincial level in China and to investigate diverse governance models for low-carbon cities. These studies emphasize the synergistic roles of technological, organizational, and environmental factors in achieving carbon neutrality [37,45,46].
Overall, the TOE framework serves as a robust theoretical tool for analyzing the complexities of low-carbon development. It offers actionable insights for optimizing green technology applications and crafting effective low-carbon policies. By incorporating the TOE framework into the analysis of low-carbon urban development pathways, this study advances current carbon reduction research and introduces a novel, multi-level analytical framework for urban carbon reduction.

2.2. Hypothesis Development

We proposed a conceptual model to determine the direct and indirect impacts of the TOE framework on carbon reduction.

2.2.1. Technological Dimension

The technological dimension centers on two key factors, energy efficiency and green low-carbon technologies, both of which are fundamental to carbon reduction and are well supported by existing theories and practices. Research indicates that improving energy efficiency, through the optimization of green landscapes and building materials, can significantly reduce carbon emissions [47,48]. Energy efficiency also mediates the relationship between the digital economy and carbon reduction, directly promoting emission decreases by improving energy use [49]. Green low-carbon technologies, particularly renewable energy, also play a positive role in long-term emission reductions; a 1% growth in green technology can lead to a 0.032% to 0.037% reduction in carbon emissions, with more pronounced effects over time [50]. Therefore, improvements in energy efficiency and advancements in green technologies together provide the technical foundation for urban carbon reduction. We hypothesized the following:
H1. 
The technological dimension positively affects carbon reduction.

2.2.2. Organizational Dimension

The organizational dimension examines the impact of government low-carbon investments and resource dependency, emphasizing their dual impact on carbon reduction efforts. Government investments cover areas such as green infrastructure, renewable energy, research and development, green financial mechanisms, and carbon pricing [51]. Studies show that governmental policies, such as financial subsidies and green credit, effectively promote energy conservation, emission reduction, and green technological innovation in enterprises [52]. In the field of landscape architecture, the government encourages the participation of social capital in carbon sequestration and carbon trading by promoting the public–private partnership (PPP) model, thus facilitating the efficient alignment of carbon emission rights and corporate investments [53]. Local government investments are equally important for optimizing industrial structures—a 1% increase in government investment can reduce carbon emissions by 0.89% [51]. Collectively, these measures transform energy structures, promote green industries, and incentivize stakeholder participation, providing strong support for comprehensive carbon reduction goals. Conversely, resource dependency has an inhibitory effect on carbon reduction. Regions reliant on non-renewable resources, especially in central and western China, have higher carbon emissions, and this dependency hinders the green transformation of industry [54]. By optimizing resource utilization, dependency can become a driver of carbon reduction [55]. Reducing resource dependency and increasing investments in low-carbon technologies are therefore critical. We hypothesized the following:
H2a. 
The organizational dimension positively affects carbon reduction.
H2b. 
The organizational dimension indirectly affects urban carbon reduction through the technological dimension.

2.2.3. Environmental Dimension

The environmental dimension comprises three key variables: policy support, industrial structure rationalization, and innovation resource agglomeration. These external environmental factors collectively shape carbon reduction pathways. Policy support, a critical component of the external environment, has been widely shown to regulate carbon emissions directly. Environmental policies reduce emissions by setting green standards, implementing carbon taxes, and providing financial subsidies [42]. However, their effectiveness varies across regions. In less-developed areas, such policies may initially suppress green technological innovation, whereas in developed regions, they often foster technological advancement and industrial upgrading [56,57]. Research shows that policies driving the optimization of urban green space quantity and spatial layout, along with enhancing the carbon sequestration capacity of green spaces from a carbon balance perspective, can effectively reduce urban carbon emissions [58]. Industrial structure rationalization significantly reduces carbon emissions over the long term by optimizing resource allocation [59,60]. By transitioning away from high-carbon industries and fostering the development of low-carbon sectors, this process offers strategic support for carbon mitigation by transforming production methods and energy structures [23]. Innovation resource agglomeration demonstrates an inverted U-shaped relationship with carbon emissions: while initial clustering may increase emissions due to concentrated industrial activity, the subsequent diffusion of green technologies ultimately facilitates significant emission reductions [61]. This clustering effect accelerates the adoption of green technologies and provides pivotal support for the green transformation of industries [62]. In conclusion, policy support, industrial restructuring, and the concentration of innovative resources create essential external environmental conditions for carbon reduction. We hypothesized the following:
H3a. 
The environmental dimension positively affects carbon reduction.
H3b. 
The environmental dimension indirectly affects urban carbon reduction through the technological dimension.
H3c. 
The environmental dimension indirectly affects urban carbon reduction through the organizational dimension.

2.3. Conceptual Model

Based on these hypotheses, we developed a conceptual model illustrating the relationships between technology, organization, environment, and carbon reduction. Figure 2 explores the impact of the TOE framework on carbon reduction.

3. Materials and Methods

3.1. Sample Selection and Data Collection

Since 2010, the National Development and Reform Commission has initiated pilot projects for low-carbon cities, expanding the scope in 2012 and 2017 [63,64]. The pilot cities in the 2010 and 2012 batches were selected from voluntary applications, while in 2017, a combination of organizational recommendations and expert evaluations was used. In total, 81 low-carbon pilot cities were designated [65].
To evaluate the capacity and future potential for urban carbon neutrality, this study focused on 81 prefecture-level cities, constructing an index system from the current carbon emissions of the cities and their ability to offset carbon emissions from three dimensions: energy potential, policy and technology, and ecological endowment. The “ecological endowment” dimension refers to the natural resources and environmental conditions that enhance a city’s ability to absorb or offset carbon emissions [66]. By assigning weights to each dimension for each city, we determined a comprehensive score for carbon neutrality capacity, classifying the cities into three categories—high, medium, and low—as shown in Table 1.
To better reflect the carbon emission reductions in low-carbon cities during the 14th Five-Year Plan period, we selected data from 2020 to 2022, using linear interpolation to supplement missing data. The data were taken from the China City Statistical Yearbook, China Environmental Statistical Yearbook, China Energy Statistical Yearbook, and the CNRDS Database [67].

3.2. Data Measurement

3.2.1. Outcome Variables

We selected the changes in carbon emissions and carbon emission intensity of the 81 low-carbon cities between 2020 and 2022 as outcome variables to measure the effectiveness of emission reduction efforts.
Carbon emissions refer to the total amount of carbon dioxide (CO2) emitted by a city or region within a specific period, usually calculated based on energy consumption data. According to the guidelines of the International Energy Agency and the IPCC, CO2 emissions can be calculated using the formula CO2 = ∑ (Ei × Fi), where Ei is the consumption of the ith type of energy and Fi is its carbon emission factor. The main energy types include coal, natural gas, oil, and electricity [68]. By weighing the consumption of different energy sources with their corresponding carbon emission factors, we were able to accurately estimate the total carbon emissions of a city. Carbon emission intensity refers to the amount of carbon dioxide emissions per unit of economic output, usually measured as carbon emissions per unit of GDP [69], calculated as carbon emission intensity = total CO2 emissions/GDP. This indicator reflects changes in the energy consumption structure and directly indicates the degree of decoupling between economic growth and carbon emissions.
During data processing, approximately 3% of the energy consumption data was missing, primarily for the years 2020 to 2021 in cities such as Lu’an, Chenzhou, Xinzhou, Anshun, Yingkou, and Tonghua. In contrast, GDP data were fully available. To address these gaps, a linear interpolation method was applied, estimating missing values based on the average of adjacent years. This approach produced interpolated data closely aligned with the overall trends in energy consumption and carbon emissions observed in low-carbon cities, ensuring a robust and reliable dataset for subsequent analysis.
In conclusion, changes in carbon emission intensity and total carbon emissions provide a comprehensive framework for evaluating the transformative impacts and emission reduction achievements of low-carbon cities.

3.2.2. Condition Variables

We examined seven condition variables—the level of green low-carbon technology, energy efficiency optimization, government investment in low-carbon initiatives, optimization of resource dependence, policy support, rationalization of industrial structures, and aggregation of innovative resources. These variables assess the factors influencing urban carbon emission reduction from three dimensions: technology, organization, and environment.
The technology dimension included the level of green low-carbon technology, measured by the number of green patent applications, an important indicator of technological innovation [70], and energy efficiency measured by the rate of change in the ratio of total energy consumption to GDP, with standard coal consumption representing total energy consumption [71].
The organization dimension included government investment in low-carbon initiatives measured by the proportion of low-carbon expenditure to overall public spending [72], and optimization of resource dependence measured by changes in the ratio of output value of resource-based industries to GDP, where a lower ratio indicated that the city was gradually reducing its reliance on high-carbon industries [73].
The environment dimension included policy support measured by the number of low-carbon policy documents issued [74], rationalization of industrial structures, measured using the Theil index, where a lower index signified a more balanced economic distribution [75], and aggregation of innovative resources evaluated by the number of R&D institutions and high-tech enterprises [76]. Descriptive statistics of each variable are shown in Table 2.

3.3. Analysis Methods

3.3.1. PLS-SEM

Structural equation modeling (SEM) is a statistical tool used to analyze relationships among multiple variables, combining structural and measurement models [77]. The structural model estimates relationships among latent variables, while the measurement model analyzes the connections between observed variables and latent variables. The SEM can be expressed as follows:
y = Bη + ξ + ζ
where ξ represents exogenous latent variables, η represents endogenous latent variables, B is the matrix of relationships among endogenous latent variables, and ζ represents the error term or disturbance, which accounts for errors associated with the endogenous latent variables. The measurement model is
y = Λyη + ε
This model elucidates the observed variables through the measurement matrix and variance. Partial least squares structural equation modeling (PLS-SEM), which uses partial least squares regression, is particularly suitable for small samples or scenarios with uncertain data distributions, especially in complex models [78]. Its independence from normal distribution assumptions makes it highly applicable to non-normal and limited data [79]. PLS-SEM effectively addresses complex causal relationships and captures nonlinear interactions between latent variables. These advantages make it increasingly favored in exploratory research, particularly when analyzing intricate relationships with limited sample sizes [80].
Compared to traditional covariance-based structural equation modeling (CB-SEM), PLS-SEM offers significant advantages in modeling complex causal relationships and identifying both direct and indirect effects. Widely applied in environmental and social sciences, PLS-SEM excels in analyzing dynamic interactions, such as those among policies, technologies, and social factors, and is particularly adept at uncovering latent relationships that traditional linear models struggle to capture. Additionally, PLS-SEM’s ability to handle nonlinear interactions allows it to explore deeper relationships that are often challenging for conventional SEM to identify [81].
In this study, PLS-SEM is employed to analyze the mechanisms and interactions of technological, organizational, and environmental factors influencing low-carbon development. Given its strengths in modeling complex relationships and handling non-normal data, PLS-SEM serves as the primary analytical method for achieving the research objectives.

3.3.2. NCA

Necessary condition analysis (NCA), proposed by Jan Dul (2020) [80], focuses on identifying whether antecedent conditions are necessary for the outcome. Unlike traditional analysis methods that mainly focus on whether antecedent conditions are sufficient to cause the outcome, NCA quantitatively analyzes which conditions must exist for the outcome to occur. The advantage of NCA is that it can clearly identify the “bottleneck effect” of certain antecedent conditions—if a necessary condition is not met, the outcome cannot occur.
By combining NCA and fsQCA [82], researchers can analyze the sufficiency of combinations of antecedent conditions from a qualitative perspective and quantitatively assess the necessity of these conditions for the outcome. In the field of green and low-carbon development, research often involves the interaction of multiple influencing factors. The application of the NCA method helps analyze the necessity of different factors for low-carbon development and can determine which conditions are critical. For example, in studies of urban low-carbon governance, NCA can quantify the impact of policy, technology, economy, and other antecedent conditions on the level of low-carbon governance [45], thereby revealing the indispensable role of various factors in achieving low-carbon development.

3.3.3. fsQCA

Fuzzy-set qualitative comparative analysis (fsQCA) is based on the theory of multiple conjunctural causation, combining Boolean algebra and set theory to explore asymmetric relationships between antecedent variables and outcome variables [83]. Compared with traditional quantitative methods, fsQCA is well suited for uncovering nonlinear and asymmetric relationships among multiple factors. It excels at identifying how combinations of conditions collectively influence specific outcomes. FsQCA’s adaptability to complexity makes it particularly useful for examining scenarios where multiple pathways lead to the same outcome. As a complement to traditional regression methods, fsQCA reveals the diversity and interdependence of causal relationships, making it ideal for analyzing complex societal issues, such as low-carbon development [84].
In recent years, fsQCA has found extensive application in management and environmental research. Ragin (2009) emphasized that fsQCA could reveal the mechanisms through which various combinations of conditions lead to the same outcome [85]. Rihoux et al. (2013) highlighted that fsQCA was capable of managing qualitatively distinct data [86], allowing for the identification of effective combinations of conditions and the revelation of causal heterogeneity and driving mechanisms. For instance, in studies focused on low-carbon city development, fsQCA can identify key factors influencing carbon reduction across different urban contexts, thereby providing both theoretical and empirical support for green low-carbon development [87]. Cao Ping et al. (2023) utilized fsQCA to analyze pathways linking ecological civilization construction to carbon emissions, identifying three distinct low-carbon pathways and their key drivers, while underscoring the importance of regional differences and integrated measures [88].
In its practical application, fsQCA assesses the relationship between condition variables and outcome variables based on two primary metrics: consistency and coverage. Consistency evaluates whether the outcome variable Y is a subset of the condition variable X, calculated using the following formula:
C o n s i s t e n c y ( Y i X i ) = Σ [ m i n ( X i , Y i ) ] Σ [ Y i ]
Coverage measures the extent to which the condition variable X explains the outcome variable Y, represented by the following:
C o v e r a g e ( Y i X i ) = Σ [ m i n ( X i , Y i ) ] Σ [ X i ]
Through this analytical framework, fsQCA serves as a robust tool for identifying the complex pathways of carbon reduction in low-carbon cities, uncovering effective strategies that emerge from the collaborative interaction of multiple factors.

4. Results

4.1. PLS-SEM Analysis Results

4.1.1. Measurement Model

The PLS-SEM analysis was conducted using SmartPLS software (version 4.0) and involved three key steps: (1) assessing the estimation accuracy of path coefficients, (2) evaluating the structural model’s predictive relevance via blindfolding and PLSpredict procedures, and (3) determining the statistical significance of path coefficients using bootstrapping.
The quality of the measurement model was assessed based on reliability, convergent validity, and discriminant validity. As shown in Table 3, Cronbach’s alpha and composite reliability (CR) values exceeded 0.70, indicating a high degree of internal consistency [89]. Furthermore, all items exhibited factor loadings greater than 0.70, and the average variance extracted (AVE) values exceeded the 0.50 threshold, reflecting adequate convergent validity.
Finally, variance inflation factors (VIFs) were all below the recommended threshold of 3.3 [90], indicating no significant multicollinearity issues in the model.
Discriminant validity was evaluated using the Fornell–Larcker criterion and cross-loadings [91]. As presented in Table 4, the square root of the AVE for each construct (on the diagonal) was greater than its correlations with other constructs, satisfying the criterion. Each construct’s cross-loadings were also higher than those of other constructs, further confirming adequate discriminant validity. These results indicate that the constructs in this study had strong discriminant validity.

4.1.2. Structural Model
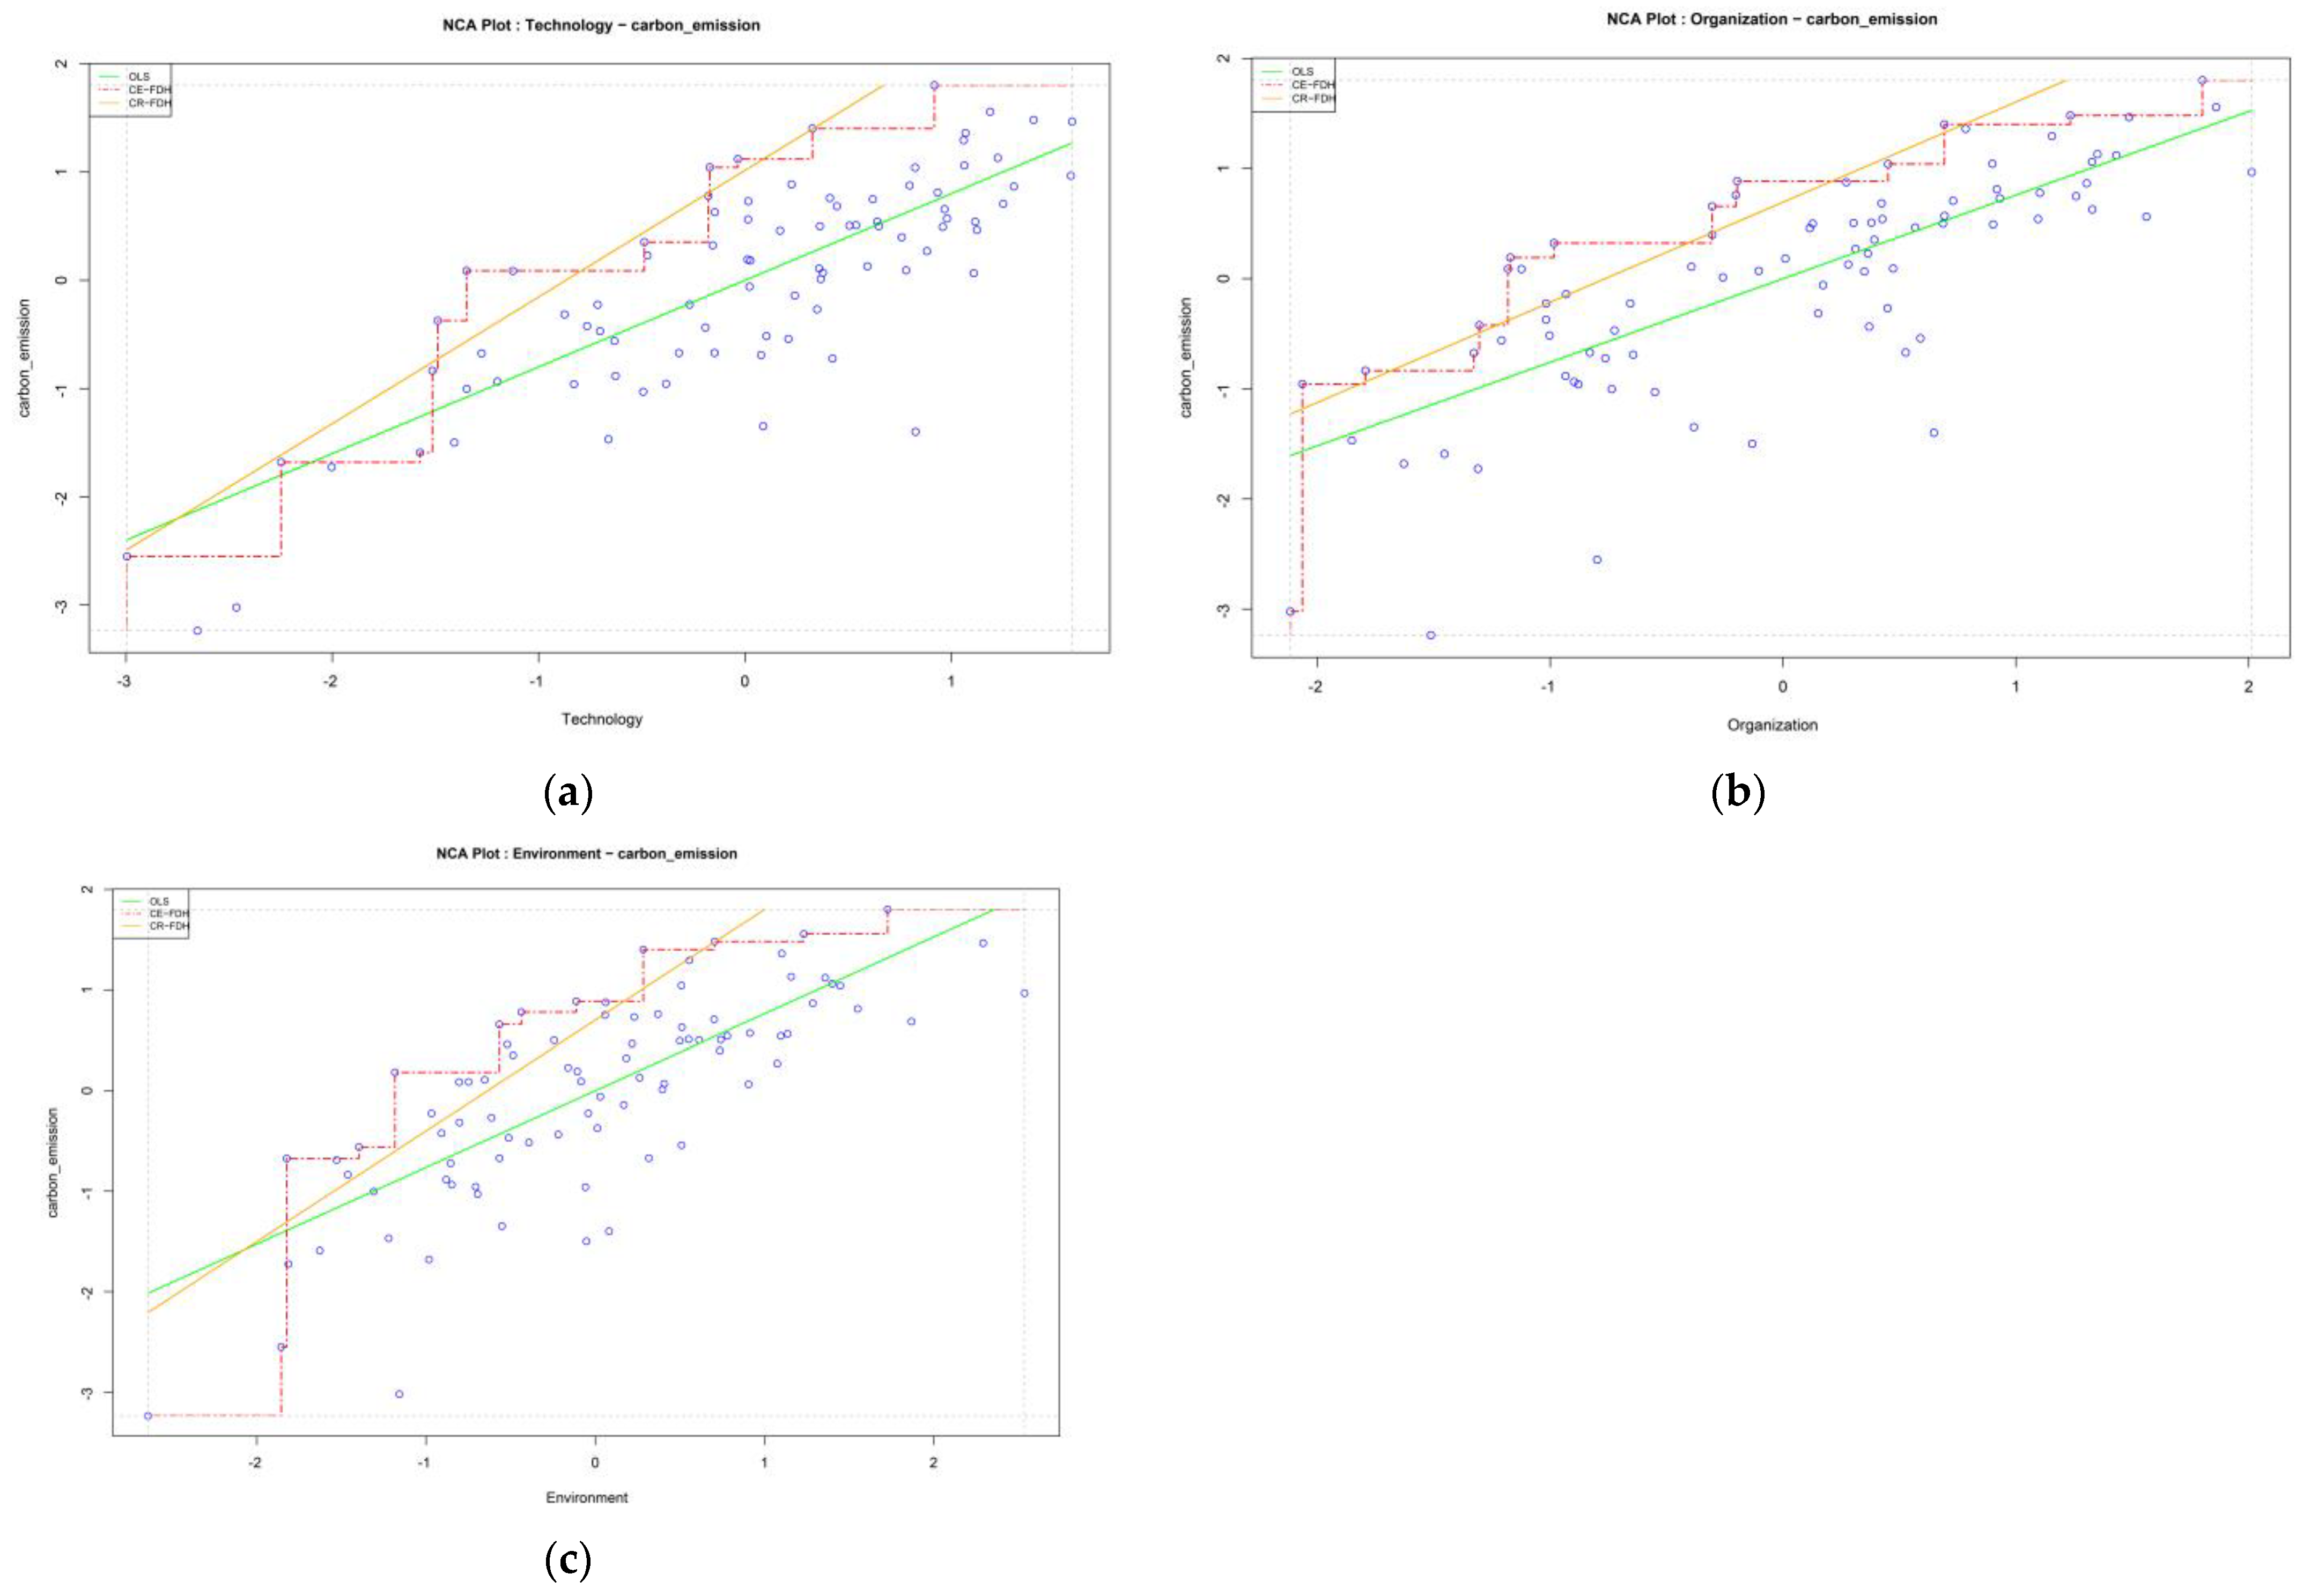
We then assessed the structural model, revealing differences in variable influences across different models [92]. Since this study aimed to explore the key factors influencing carbon emission reduction pathways under the TOE framework, we conducted a PLS analysis without moderating variables. The model’s predictive ability was evaluated using the coefficient of determination (R2) and redundancy measures (Q2) from the blindfolding procedure. The results showed that the R2 values for carbon emission reduction, technology, and organization were 0.704, 0.642, and 0.615, respectively, with Q2 values of 0.662 and 0.394, indicating good predictive accuracy.
To assess the statistical significance of path coefficients (β), we combined the PLS algorithm with bootstrap analysis, using 5000 resamples and bias-corrected and accelerated confidence interval estimation. Hypothesis testing was conducted at a 0.05 significance level (two-tailed). Table 5 presents the standardized t-values, p-values, path coefficients (β), and standard deviation (STDEV) for each hypothesis. Of the three hypotheses tested, two were supported within the 95% confidence interval.
According to Cohen’s criteria (1988), effect sizes greater than 0.02, 0.15, and 0.35 are considered small, medium, and large, respectively [93]. As illustrated in Figure 3, technology had a significant positive impact on carbon emission reduction (β = 0.437, t = 3.948, p < 0.05), indicating that a 1-unit increase in technology led to a 0.437-unit increase in carbon emission reduction, supporting hypothesis H1. Similarly, organization exerted a significant positive effect on carbon emission reduction (β = 0.273, t = 2.766, p < 0.05), confirming hypothesis H2a. In contrast, the direct effect of environment on carbon emission reduction was not significant (β = 0.207, t = 1.907, p > 0.05) and hypothesis H3a was not supported.
Regarding indirect effects, the influence of organization on carbon emission reduction through technology was weakly significant (β = 0.142, t = 2.410, p < 0.05), supporting hypothesis H2b. The effect of environment on carbon emission reduction through technology was moderately significant (β = 0.229, t = 2.953, p < 0.05), supporting hypothesis H3b. The indirect effect of environment on carbon emission reduction through organization was also moderately significant (β = 0.215, t = 2.729, p < 0.05), confirming hypothesis H3c.
In summary, technology and organization had significant positive effects on carbon emission reduction, validating hypotheses H1, H2a, H2b, H3b, and H3c. Enhancements in technology and organizational dimensions significantly promoted carbon emission reduction. Although the direct effect of the environmental dimension was minimal, it still positively influenced carbon emission reduction through the indirect effects of technology and organization.

4.2. NCA Results

To identify necessary conditions, we adopted the three-step criteria proposed by Dul (2019) [94]. First, a clear theoretical basis had to establish the hypothesized relationships between predictor and outcome variables. Second, the effect size of the necessary condition had to be non-zero and statistically significant. Third, hypothesis testing was conducted to control for Type I errors. Bootstrapping and permutation tests were employed to determine statistical significance, with a threshold of p-value < 0.05.
As described by Richter et al. (2020) [95], latent variable scores obtained from PLS-SEM were analyzed using R software(version 4.2.1). Predictor variables were plotted on the horizontal axis and outcome variables on the vertical axis within Cartesian coordinates. Ceiling lines (Figure 4) were applied to delineate the boundary between observed and unobserved regions, ensuring precise identification. Additionally, the recommended ceiling regression-free disposal hull technique was used to visualize unobserved areas.
The CR-FDH line was utilized to illustrate trends between discrete and continuous data points, highlighting the strength of necessary conditions observed in the upper-left empty region of the plot. The effect size d(CS) was computed as the ratio of empty space (C) to total area (S) within the observed range. NCA further provided statistical outputs, including p-values and accuracy metrics, to assess condition significance.
This analysis reveals whether factors such as technology, organization, and environment within the TOE framework are necessary conditions for achieving urban carbon emission reduction, providing strong empirical support for identifying key driving factors.
We assessed the effect sizes (d) of the latent variable scores and determined statistical significance using permutation tests with 10,000 random samples, as recommended by Andreev et al. (2009) [92]. As shown in Table 6, carbon emission reduction depended on multiple conditions, as the effect sizes of these factors were greater than zero. The technology dimension exhibited the largest effect size (d = 0.377, p < 0.01), followed by the environment dimension (d = 0.305, p < 0.01), both exceeding the threshold for large effect sizes (d > 0.3). The organization dimension (d = 0.249, p < 0.01) was also identified as a necessary condition. These three factors were considered significantly important for carbon emission reduction.
To further understand the impact of the TOE framework on carbon emission reduction, we constructed a bottleneck table (Table 7). This table presents the minimum threshold values that the three TOE dimensions need to reach to achieve high carbon emission reduction capacity (80% and above), expressed as percentages [96]. The results indicate that the minimum thresholds for the technology, organization, and environment dimensions were 61.3%, 53.9%, and 52.7%, respectively. These values suggest that if these thresholds were not met, the impact of the TOE framework on carbon emission reduction would be significantly weakened. In conclusion, the NCA demonstrated that the three TOE dimensions were important necessary conditions for carbon emission reduction.

4.3. Results of fsQCA Analysis

4.3.1. Data Calibration

Before conducting empirical case analysis, fsQCA transforms condition and outcome variables into fuzzy-set data to facilitate Boolean logic analysis [97]. This calibration process requires determining specific calibration values for each variable. Existing studies often employ the quartile method for direct calibration, converting continuous variables into fuzzy-set membership scores based on medians and quartiles. Ragin (2009) [85] noted that the quartile method was particularly effective in large-sample studies, as it accurately reflected data distribution characteristics and minimized the influence of extreme values on results.
In this study, the 25th percentile, 50th percentile, and 75th percentile served as calibration points for “full non-membership”, “crossover point”, and “full membership”, respectively, converting original variable data into fuzzy membership values ranging from 0 to 1. The calibration anchors for the variables are presented in Table 8.

4.3.2. Necessary Condition Analysis in QCA

Before using fsQCA 4.1 software, we performed a necessity analysis for each condition variable to determine whether the outcome variable depended on a specific condition—that is, whether a condition was necessary for the occurrence of the outcome. This analysis yielded two key indicators: consistency and coverage. A consistency value exceeding 0.9 indicated necessity, while coverage measured the explanatory power of the condition for the outcome. As shown in Figure 1, all condition variables had consistency values below 0.9, indicating that factors such as the level of green low-carbon technology, energy efficiency optimization, government investment in low-carbon initiatives, optimization of resource dependence, policy support, rationalization of industrial structures, and aggregation of innovative resources were not necessary conditions for changes in carbon emission intensity. This suggests that no single condition sufficiently explained the carbon emission reduction effects in low-carbon cities. Therefore, it was both reasonable and essential to conduct QCA configuration analysis to explore the combined effects of multiple conditions. This result indicated that carbon emission reduction in low-carbon cities involved multiple concurrent causal relationships. The findings are illustrated in Figure 5.

4.3.3. Analysis of Sufficient Conditions for Urban Typology Paths

Due to variations in economic levels and resource endowment, there is significant heterogeneity in the carbon emission reduction levels in different regions. We divided the sample data into high, medium, and low categories based on carbon neutrality capacity and used the fsQCA method to analyze differential paths of sufficient conditions. Condition combination analysis reveals the impact of different condition combinations on the outcome [87]. Generally, the consistency of sufficient condition combinations should not be less than 0.75. After the necessity analysis, we used a truth table to further test the sufficiency of each condition configuration. Following standard QCA procedures, we set a consistency threshold and a frequency threshold. Based on the Aboelmaged (2014) suggestion, we established the PRI consistency threshold to avoid overlapping condition configurations with negative outcomes, setting the raw consistency threshold, PRI consistency threshold, and case frequency threshold at 0.8, 0.75, and 1, respectively [40].
Since QCA involves counterfactual reasoning, the standard analysis method is considered to enhance result confidence. Therefore, we used standard analysis to calculate results under conditions of high and non-high efficiency, generating three types of solutions: complex solutions (excluding logical remainders), intermediate solutions (including some logical remainders), and parsimonious solutions (including all logical remainders). By analyzing the nested relationships between intermediate and parsimonious solutions, we identified the core conditions of each solution. According to Fiss’s (2011) theory, core conditions are variables appearing in both parsimonious and intermediate solutions, while peripheral conditions appear only in intermediate solutions [83]. Our study identified seven condition configurations representing different transformation paths for low-carbon cities. The results are shown in Table 9. There were significant differences in carbon emission reduction paths for Chinese cities with high, medium, and low carbon neutrality capacities, with overall consistency exceeding 0.836—well above the minimum standard of 0.75. The xyplot generated from the fsQCA analysis illustrates the relationship between carbon emission reduction capacity (Y-axis) and carbon reduction paths (X-axis). Each data point represents a city, reflecting its carbon neutrality capacity. The trend line indicates the correlation between the two. Cities with data points closer to the trend line exhibit carbon reduction performance more aligned with the characteristics of that path.
Cities with higher carbon neutrality capacities mainly exhibited two carbon reduction paths: technology-dominated and jointly dominated by technology and organization. The specific paths were as follows:
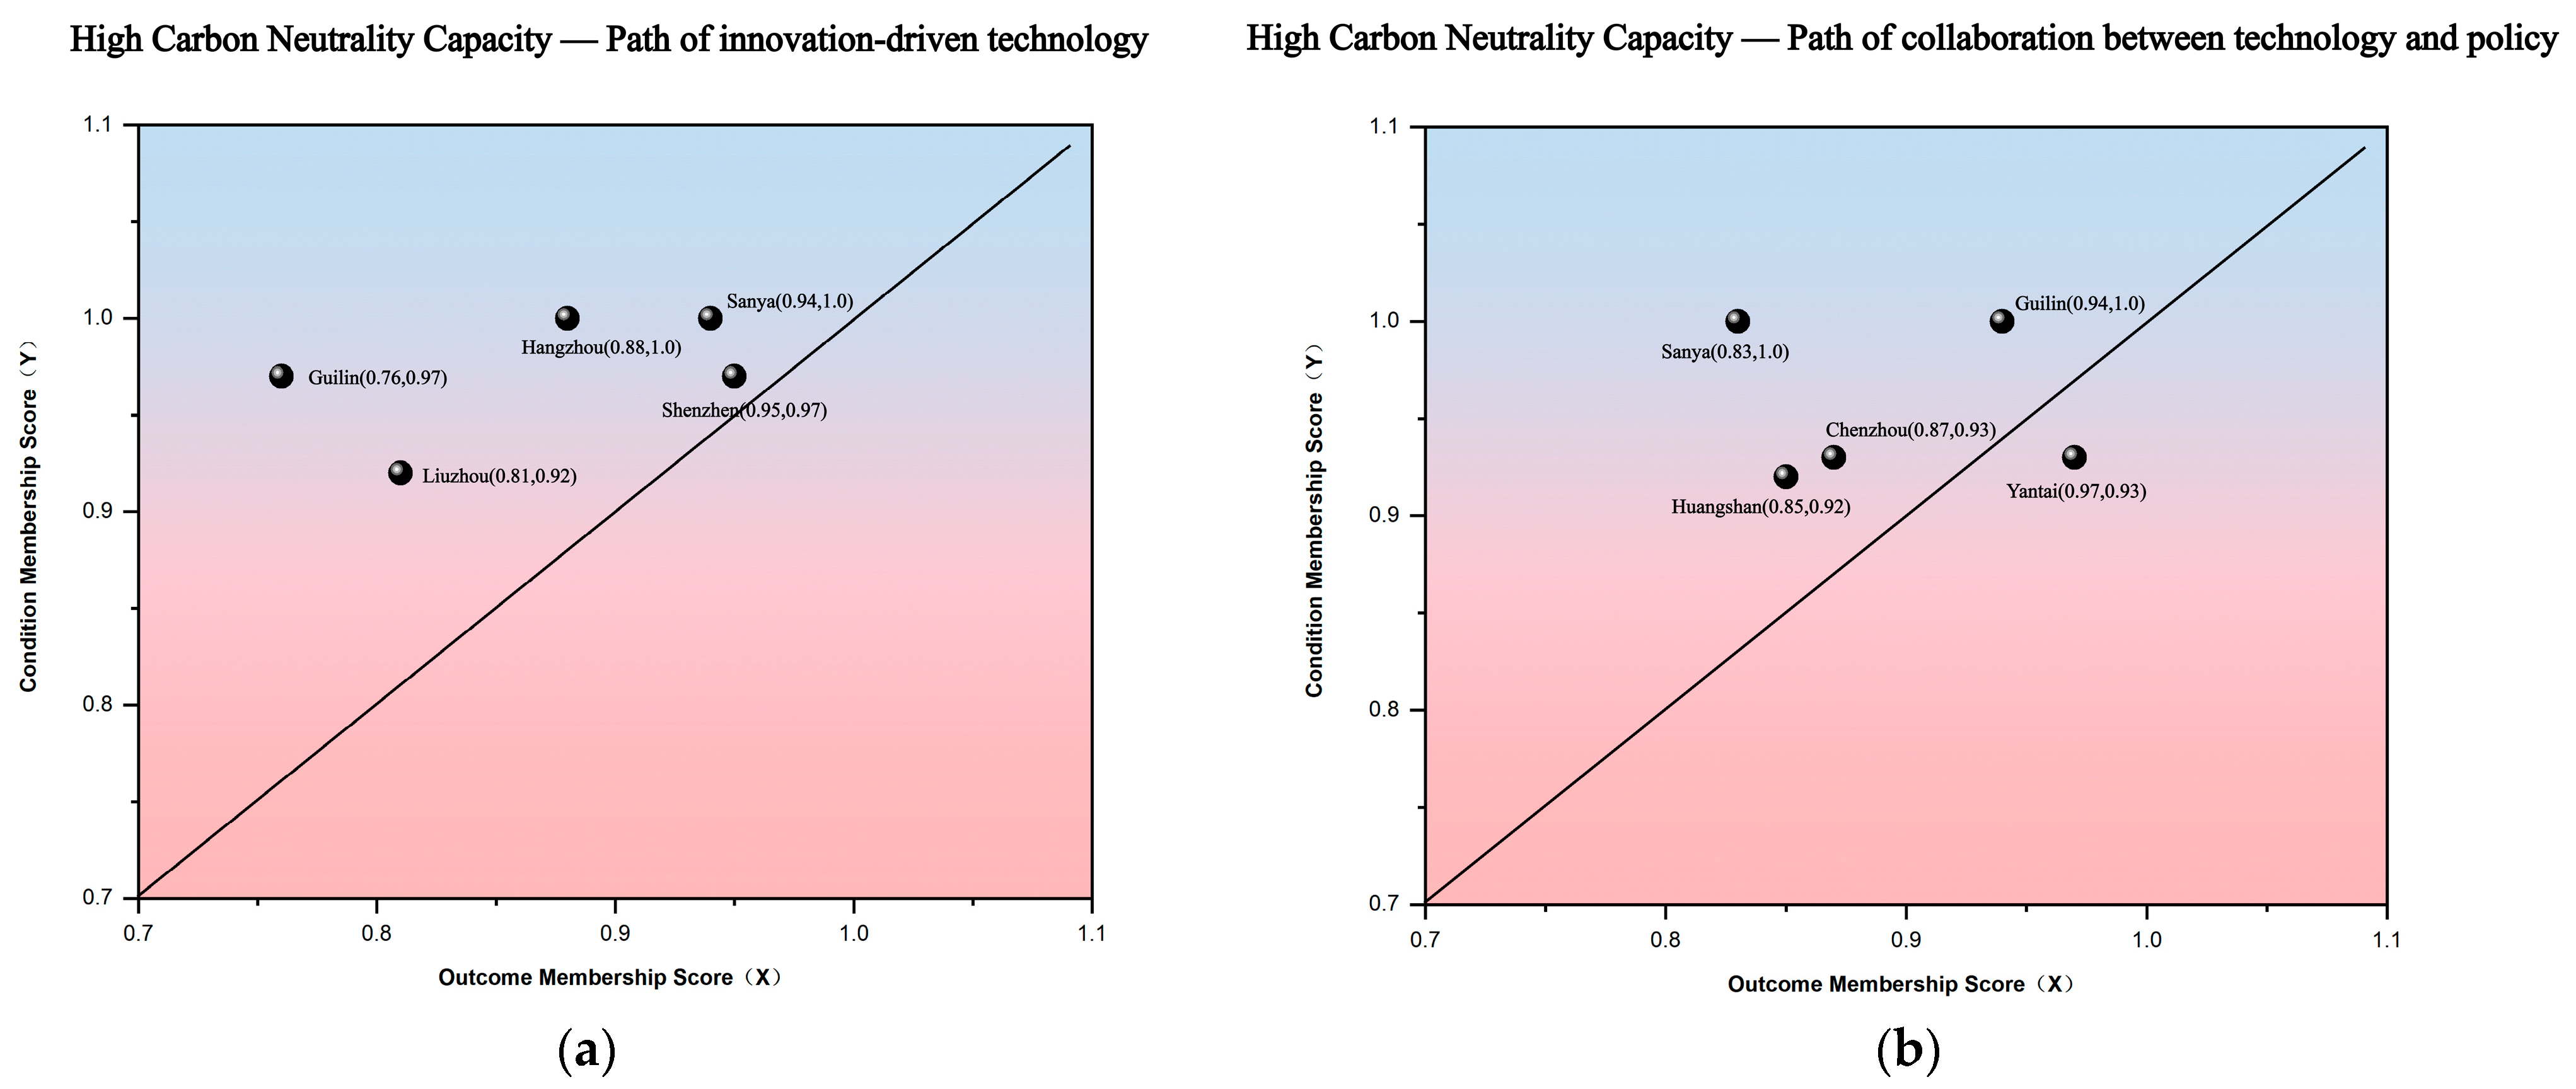
  • Innovation-driven technology. Path 1 indicates that high levels of green low-carbon technology, improved energy efficiency, and government low-carbon investment are core conditions for achieving significant carbon emission reductions. This path has a consistency of 1.0 and a raw coverage of 0.45, explaining 45% of the cases. Technological innovation and energy efficiency enhancement were the primary drivers of this path. Figure 6 shows that Hangzhou and Shenzhen are typical examples of innovation-driven technology cities.
  • Collaboration between technology and policy. Path 2 shows that core conditions included high energy efficiency and strong policy support, supplemented by resource dependence optimization and industrial structure rationalization. This path had a consistency of 0.89 and a raw coverage of 0.31, explaining 31% of the cases. It emphasizes the synergy between technological and organizational factors. Figure 6 illustrates that Yantai and Guilin are typical of this path.
Cities with medium carbon neutrality capacities exhibited three carbon reduction paths: technology and environment dominance, technology dominance, and joint organization and technology dominance. The specific paths were as follows:
  • Enhancing technology through environmental incentives. Path 1 indicated that high energy efficiency was the core condition, supplemented by advanced green low-carbon technology, policy support, and innovation resource aggregation, which significantly enhanced carbon reduction effects. This path had a consistency of 0.83 and a raw coverage of 0.338, explaining 33.8% of the cases. Figure 7 shows that Chengdu and Huzhou are typical of this path.
  • Emission reduction through traditional technology innovation. Path 2 demonstrated that advanced green low-carbon technology, high energy efficiency, and government low-carbon investment were key conditions for achieving carbon reductions. This path had a consistency of 0.97 and a raw coverage of 0.25, explaining 25% of the cases. Figure 7 indicates that Nanjing and Beijing are typical of this path.
  • Technology path focused on resource optimization. Path 3 shows that resource dependence optimization and government investment were core conditions for carbon reduction, supplemented by green low-carbon patents and industrial structure rationalization, leading to effective carbon emission reductions. This path had a consistency of 0.93 and a raw coverage of 0.217, explaining 22% of the cases. Figure 7 illustrates that Wenzhou and Zhangjiajie are typical of this path.
Cities with lower capacities for achieving carbon neutrality primarily exhibited two carbon reduction pathways: policy-driven and environment and organization co-led models. The specific pathways were as follows:
  • Policy-driven. Path 1 indicates that strong policy support and rationalization of industrial structure were core conditions for achieving carbon reduction. When combined with optimizing resource dependence, these factors can significantly enhance reduction effects. This pathway had a consistency of 0.92 and a raw coverage of 0.41, explaining 41% of the cases. Figure 8 shows that Tianjin and Suzhou are typical of this path.
  • Resource integration with an environmental focus. Path 2 demonstrates that high levels of government investment in low-carbon initiatives, optimization of resource dependence, and policy support were core conditions. Supplemented by the rationalization of industrial structure, this can achieve higher levels of carbon reduction. This pathway had a consistency of 0.87 and a raw coverage of 0.37, explaining 37% of the cases. Figure 8 shows that Yinchuan and Zibo are typical of this path.

4.3.4. Robustness Test

Qualitative comparative analysis (QCA) is a set theory method widely applied for its robustness. Even minor changes in operational conditions tend to maintain consistent subset relationships in the results, ensuring the validity of interpretations [83]. Robustness testing is crucial for assessing result stability. Schneider and Wagemann (2012) proposed two robustness criteria: first, minimal changes in fit parameters [98]; second, maintenance of clear subset relationships in configuration results. Based on prior research using the fsQCA method, three robustness testing approaches are commonly adopted: increasing the consistency threshold, adjusting the PRI consistency, or altering the number of cases. Following the study by Shipan and Volden (2008) [99], we raised the raw consistency threshold from 0.8 to 0.85 while keeping the frequency number at 1. The results indicated that, after increasing the threshold, the configuration paths remained consistent with the original ones, demonstrating that the configurations of urban carbon emission reduction exhibited strong robustness.

5. Discussion

5.1. Discussion of PLS-SEM and NCA Results

This study, grounded in the technology–organization–environment (TOE) framework, thoroughly investigated how these three critical factors affected urban carbon emission reduction, using partial least squares structural equation modeling (PLS-SEM) and necessary condition analysis (NCA). Our findings indicate that technology and organization significantly promote urban carbon emission reduction. While environmental factors have limited direct effects, they indirectly facilitate carbon reduction through synergistic interactions with technology and organization. These findings deepen our understanding of the mechanisms by which each TOE component influences carbon reduction, providing a solid foundation for policy development and technological innovation.
Our study confirms that technology is a critical factor in the success of urban carbon reduction. The analysis results from PLS-SEM and NCA consistently show that technology significantly impacts carbon reduction in importance, particularly through an enhancement in green low-carbon technologies and the optimization of energy efficiency. This is consistent with the conclusions of Wang et al. (2021) [100], which indicate that technological innovation is a key pathway to achieving carbon neutrality and can effectively reduce carbon emissions. For instance, the promotion of smart appliances and new energy vehicles has significantly optimized energy efficiency at the community level in urban areas [101]. Our results suggest that the effectiveness of carbon reduction in the organization and environmental dimensions somewhat depends on technology as a mechanism, so there may be a time lag in seeing the impacts of the organization and environmental dimensions. For cities facing urgent carbon reduction challenges, adopting advanced technologies used by other cities can lead to significant carbon reduction outcomes in the shorter term. Furthermore, green landscape design plays an essential ecological role in supporting technological innovation. By increasing urban greening and strategically planning ecological corridors, green landscapes not only enhance carbon sequestration but also serve as crucial support for technology-driven carbon reduction strategies. Future research should continue to examine the varied roles of technology in different urban contexts, particularly regarding reduction effects under diverse economic structures and technological foundations, to enhance our understanding of technological innovation in the carbon reduction process.
Our results also reveal that organizations play a vital supportive role in urban carbon reduction through government investment, resource allocation, and policy incentives. This is consistent with the work of Zhang et al. (2024) [102], which highlighted the organization’s key role in coordinating resources, providing financial support, and implementing policies to effectively promote low-carbon behaviors among enterprises and residents. Additionally, community-level low-carbon behaviors driven by fiscal incentives, such as tiered electricity pricing, have a significant impact on carbon reduction, effectively guiding residents toward more efficient electricity usage and thereby lowering emissions. We also identified a significant synergy between organization and technology. While technological innovation drives carbon reduction, its application and dissemination are limited unless there is policy support and resource allocation. Green landscape projects, such as urban parks and community pocket parks, are made possible through government investments. These projects not only provide residents with opportunities for low-carbon lifestyles but also promote the application of green technologies and resource integration, accelerating the diffusion of carbon reduction technologies. Organizations facilitate technology implementation by offering financial incentives, regulatory support, and policy assurance, thereby accelerating the carbon reduction process. This extends the insights of Chen et al. (2022) [103] on the organization’s role in social mobilization and resource integration, emphasizing the importance of organizational and technological synergy in achieving carbon reduction.
Our study shows that environmental factors have less direct impact compared to technology and organization, but that they indirectly promote urban low-carbon transformation through synergistic effects. Xie and Teo (2022) demonstrated that external elements such as policy support and industrial restructuring provide necessary conditions for technological innovation and organizational resource allocation [104], thereby facilitating overall carbon reduction. This underscores the importance of environmental factors working in tandem with other elements rather than acting alone. We further found that the synergy between environment and technology was particularly pronounced. External policy incentives and the aggregation of innovative resources accelerate the development and deployment of green technologies. Technological advancement benefits not only from intrinsic innovation capabilities but also from supportive policies, innovation resources, and industrial adjustments. This reflects the findings of Zhang et al. (2021) [57], who noted that the convergence of innovation resources and policy promotion shortens the transition from laboratory research to market application, enhancing the dissemination efficiency of low-carbon technologies. We also found that environmental factors indirectly boosted organizational effectiveness, encouraging organizations to optimize funding and resource allocation, especially under low-carbon financial incentives, enabling more efficient support for carbon reduction technologies. Wang, Yu et al. (2022) pointed out that industrial restructuring reduced reliance on traditional high-carbon industries and enhanced the organization’s role in technology-intensive sectors [105], further emphasizing the organization’s importance in optimizing resource dependence to promote carbon reduction. External environmental factors effectively translate into tangible carbon reduction outcomes only when cities possess sufficient technological foundation and organizational support.

5.2. Discussion of fsQCA Results

By using fsQCA, this study offers valuable insights into the pathways leading to successful carbon reduction, highlighting complex asymmetry, equifinality, and causality. Our results indicate that successful carbon reduction does not depend on a single TOE factor but on the combination and synergy of multiple factors. We identified seven distinct configuration paths, reflecting strategic differences in carbon neutrality efforts for cities with high, medium, and low capacities.

5.2.1. Configuration Paths for Cities with High Carbon Neutrality Capacity

The analysis of high carbon neutrality cities reveals that effective carbon reduction strategies hinge on the synergistic integration of technological innovation and organizational collaboration. Technology is identified as a crucial prerequisite for achieving carbon reduction in these cities. This underscores the pivotal role that technology plays in the reduction process, particularly within the path of innovation-driven technology where innovations in technology and enhancements in energy efficiency serve as key catalysts. The development and application of green technologies have markedly improved energy utilization efficiency, with government financial support further accelerating the diffusion and implementation of these innovations. For instance, Hangzhou has achieved notable success in developing green infrastructure and applying green technologies. By leveraging taxi trajectory data and carbon emission calculations based on the Vehicle-Specific Power (VSP) model, Hangzhou has provided precise technical support for low-carbon zoning management [106]. Meanwhile, Shenzhen has excelled in urban transformation, particularly in the development and application of new energy technologies. The city has promoted its energy transition with a focus on new energy vehicles (NEVs), constructing charging infrastructure and integrating new energy with green landscapes. This combination of technological infrastructure and ecological development strengthens the city’s green foundation [107]. Additionally, Shenzhen promotes low-carbon lifestyles through community parks and educational initiatives, raising public awareness of carbon reduction efforts.
Furthermore, organizational factors also play a critical role in carbon reduction processes. In the path of collaboration between technology and policy, the government facilitates the rational allocation of resources and the optimization of industrial structures through low-carbon financial support and technological upgrades. The case of Yantai demonstrates how combining fiscal policy with technological upgrades can promote efficient resource allocation and foster innovation in low-carbon technologies. This synergy accelerates technology diffusion and enhances application efficiency, illustrating the dynamic interaction between government and enterprises. Furthermore, Yantai’s green transformation includes dynamic analyses of resource allocation during regional development, clarifying the link between systemic innovation and low-carbon capabilities [108].
The fsQCA results reveal diverse carbon reduction strategies among cities with high carbon neutrality capacities. These cities, supported by robust economic systems and substantial financial resources, can extensively deploy green technologies and refine their energy structures, including transitioning to renewable energy sources. Moreover, their modern infrastructure and stringent energy-saving standards have led to significant improvements in energy efficiency. Consequently, cities with high carbon neutrality capacities possess varied carbon reduction pathways, enabling them to flexibly select appropriate strategies tailored to regional characteristics.

5.2.2. Configuration Paths for Cities with Medium Carbon Neutrality Capacity

Cities with medium capacity have diverse carbon reduction pathways, mainly categorized as technology-and-environment-dominated, technology-dominated, and organization-dominated.
  • Enhancing technology through environmental incentives. This path is driven by improvements in energy efficiency and through policy support. The application of green technologies and the concentration of innovation resources significantly enhance carbon reduction outcomes. For example, Chengdu has boosted energy efficiency and enhanced ecological carbon sequestration through the development of green transportation and urban landscape planning, establishing a “park city” with urban green corridors. Similarly, Huzhou has focused on “ecological civilization construction”, integrating sustainable development principles across urban planning, industrial transformation, and resource management. Under policy guidance, these efforts have yielded impressive results. Additionally, a comprehensive evaluation of Huzhou’s low-carbon city competitiveness highlights the crucial role of combining policy and technological innovation, offering valuable lessons for other cities [109]. This model underscores the synergy between policy and technology, emphasizing their combined potential to drive carbon reduction.
  • Emission reduction through traditional technology innovation. This path relies on improvements in existing technologies, further accelerated by technological innovation and advancements in energy efficiency. Through the development and application of green technologies, energy use efficiency has seen significant advancements, further propelled by government financial support that promotes the adoption and implementation of these technologies. For instance, Nanjing has made significant progress by increasing investments in technological innovation, particularly in the fields of smart manufacturing and green building landscapes. The city’s green and ecological smart city initiatives integrate modern technology with ecological principles, driving sustainable urban development [110]. In Beijing, policy guidance and technological innovation have enabled a successful low-carbon transition, with technology playing a central role in the city’s green development [111]. Furthermore, at the community level, Beijing has reduced carbon emissions from residential travel by promoting clean energy policies, optimizing the layout of new energy charging stations, and constructing low-carbon infrastructure. This pathway demonstrates how combining traditional technological innovation with financial incentives and policy support can help cities transition to a low-carbon trajectory.
  • Technology path focused on resource optimization. This pathway relies heavily on government resource allocation and financial investment. Even with limited innovation resources, cities have successfully achieved carbon reduction by optimizing resources, adjusting industrial structures, and securing additional government funding through policy initiatives and strategic planning. This model is particularly relevant for cities reliant on traditional resource-based industries. For example, Wenzhou has driven low-carbon manufacturing upgrades through industrial restructuring and fiscal support. Similarly, Zhangjiajie, under policy guidance, has developed ecological tourism and green industries, successfully implementing a green transformation model.
These pathways reflect the complexity and diversity in carbon reduction strategies in cities with medium carbon neutrality capacities. These cities are at a critical juncture in transitioning from traditional high-carbon models to low-carbon ones. Although their economies still partially depend on high-carbon emission sectors, such as manufacturing and heavy industry, they are actively developing green industries. The share of clean energy use is gradually increasing, with more renewable sources such as wind and solar energy. Cities with medium carbon neutrality capacity demonstrate strong technological capability, introducing and using low-carbon technologies effectively. Policy support and enforcement are increasingly robust, contributing to a gradually maturing green transition.

5.2.3. Configuration Paths for Cities with Low Carbon Neutrality Capacity

Low-capacity cities face significant challenges in emission reduction, particularly regarding economic reliance on high-carbon industries, energy structure, and technological capability. They primarily follow policy-dominated or joint organization-and-environment-dominated pathways.
  • Policy-driven path. Even in the face of low levels of energy efficiency and green technology, effective policy design and execution facilitate carbon reduction by promoting industrial upgrades and reducing resource dependence. Policies provide essential institutional support and strategic direction in this process. For example, Tianjin has facilitated the transformation of high-carbon industries through targeted policy initiatives. Suzhou, through policy-driven measures, has effectively balanced advanced manufacturing with ecological protection, leveraging its extensive network of gardens and green spaces to enhance carbon sequestration. Additionally, the construction of low-carbon industrial parks has aligned ecological development with industrial growth, contributing to successful carbon reduction outcomes. Urban renewal policies, which incorporate lifecycle assessment (LCA) and building information modeling (BIM) technologies, have optimized carbon emission and sequestration calculations. This provides practical technical guidance for resource management and low-carbon urban planning, enhancing the effectiveness of carbon reduction efforts [112].
  • Resource integration with an environmental focus. Government financial support and policy promotion are central to this pathway. By reasonably adjusting industrial structures and reducing reliance on high-carbon resources, these cities make their green development initiatives more sustainable. Policies play a vital role in optimizing resource allocation and facilitating the application of green technologies. For instance, Yinchuan has successfully reduced its reliance on high-carbon resources through government-led industrial restructuring and resource optimization, improving the sustainability of regional ecosystem services [113]. Similarly, Zibo has catalyzed the green transformation of traditional industries through policy support and green technologies, successfully implementing a carbon reduction model driven by both environmental and organizational collaboration. This approach highlights the critical role of policy and inter-organizational cooperation in addressing the challenges posed by high-carbon industries during the low-carbon transition.
Despite ongoing efforts to promote green transition, the economic structures of these cities remain heavily reliant on high-carbon emission sectors, such as mining and fossil fuel industries, placing them under substantial pressure to transform. Many of these cities also exhibit weak technological innovation capability and lack the internal momentum needed to foster the development of green and low-carbon technologies. Funding shortages also present barriers to advancing carbon neutrality projects and building green infrastructure in some cities. It is crucial, therefore, for these cities to select appropriate pathways based on regional conditions to effectively address their unique challenges.

6. Conclusions

This study, grounded in the TOE framework, systematically analyzed the multidimensional mechanisms that influence urban carbon reduction paths by integrating partial least squares structural equation modeling (PLS-SEM), necessary condition analysis (NCA), and fuzzy-set qualitative comparative analysis (fsQCA). It uncovered the complex interactions among technological, organizational, and environmental factors in carbon emission control and low-carbon development. Using multi-factor configuration analysis, this study identified the essential roles of various factors in shaping the carbon reduction paths of diverse city types. The main conclusions drawn from this study are as follows:
First, the PLS-SEM and NCA analyses supported all hypotheses. Our findings highlight that technology, organization, and environment are crucial factors in urban carbon reduction. Specifically, the organizational dimension has both a direct influence on carbon reduction and an indirect influence by enhancing the technological dimension, thereby further advancing emission reductions. In comparison, the environmental dimension has a smaller direct impact on carbon reduction, though it significantly contributes to reductions through its interactions with technological and organizational factors.
Second, the fsQCA results indicate that no single factor is sufficient to drive urban carbon reduction. Multiple factors across technological, organizational, and environmental dimensions—such as the level of green low-carbon technology, energy efficiency optimization, government investment in low-carbon initiatives, optimization of resource dependence, policy support, rationalization of industrial structures, and aggregation of innovative resources—are collectively necessary to support low-carbon urban development. This also suggests that obstacles to carbon reduction are also not driven by any one factor in isolation. The interdependencies among these factors illustrate a complex network of interactions, underscoring the need for policymakers to consider the multifaceted nature of these relationships when developing carbon reduction strategies, rather than relying on a single approach.
Third, our study reveals significant differences in low-carbon development paths for various city types, demonstrating the multidimensional synergy of technological, organizational, and environmental factors. Cities with high carbon neutrality capacity primarily depend on innovation-driven technology and collaboration between technology and policy, significantly enhancing carbon reduction outcomes through technological innovation and efficient organization management. Cities with medium carbon neutrality capacity rely on the synergy of technology, organization, and environment. Despite limited resources, they improve energy efficiency through policy support and optimized resource allocation, effectively promoting the adoption of green technologies. For cities with low carbon neutrality capacity, policy-driven strategies are the core driving force for carbon reduction, but relying solely on policy initiatives is inadequate for achieving significant reductions. These cities urgently require external technological assistance and the introduction of innovative resources to overcome technological bottlenecks in carbon reduction.
The innovative aspects of this study are primarily reflected in the following areas: first, this study examines the differences in carbon reduction pathways across different types of cities, using the technology–organization–environment (TOE) framework. It addresses critical gaps in existing research on the selection of low-carbon city pathways. While much of the current literature focuses on the provincial level [46] or the carbon reduction strategies of individual cities [37,45], there has been insufficient attention to variations in pathway selection across different city types. Notably, the role of city type differences in shaping carbon reduction pathways remains underexplored. This study classifies 81 cities in China into three categories—high, medium, and low—based on their carbon neutrality potential, and systematically investigates the driving mechanisms for carbon reduction in these cities, integrating the technological, organizational, and environmental dimensions. By introducing differentiated city samples and innovative indicators, this study proposes a framework for selecting carbon reduction pathways according to city types. The key contribution lies in clarifying the pathway characteristics of cities with varying carbon reduction potential. This classification perspective deepens our understanding of carbon reduction pathways.
Second, methodologically, this study combines partial least squares structural equation modeling (PLS-SEM), necessary condition analysis (NCA), and fuzzy-set qualitative comparative analysis (fsQCA) to develop a multi-level framework for analyzing driving factors and pathways. This approach addresses the limitations of existing methods in explaining the complexity of carbon reduction pathways. For example, while Cao Ping et al. employed fsQCA to analyze complex combinations of conditions linking ecological civilization and carbon reduction [88], and Qin Min et al. combined NCA and fsQCA to explore drivers of provincial carbon emission efficiency [46], studies by Li Youdong et al. and Chen Weidong et al. used fsQCA within the TOE framework to investigate low-carbon governance pathways [37,45]. Although these studies highlight the diversity in carbon reduction pathways, they primarily focus on the combinatory analysis of conditions using fsQCA, without exploring the causal relationships among driving factors or systematically elucidating the mechanisms behind pathway generation. To fill this gap, this study employs PLS-SEM to analyze both direct and indirect effects of driving factors, bridging the gap in causal relationship analysis in the literature. Combined with NCA, this study identifies the necessary conditions for achieving carbon reduction. Furthermore, fsQCA is applied to explore the conditional combinations of technological, organizational, and environmental factors across different city types, systematically revealing the differentiated characteristics of carbon reduction pathways. This integrated methodological framework broadens and deepens the study of carbon reduction pathways while addressing existing limitations in pathway and driving mechanism analysis.
However, this study acknowledges certain limitations. The “environment” dimension of the TOE framework focuses on macro-environmental factors, such as policy guidance, regulatory constraints, and market forces, that influence technology adoption and organizational behavior. However, this study does not include specific indicators of the built environment, such as transportation infrastructure and land-use changes, which involve the physical spatial characteristics of the urban built environment and fall outside the scope of the “environment” dimension in the TOE framework. Nonetheless, integrating socio-economic indicators with physical indicators of the built environment could provide a more comprehensive understanding of the mechanisms driving low-carbon city development. Future research could focus on developing a holistic analytical framework that combines macro socio-economic factors from the TOE framework with physical indicators of the built environment. For example, modeling the dynamic interactions between factors such as remote sensing data, traffic flow, and land-use changes, alongside policy and market factors, could offer insights into how these elements interact to drive or influence carbon emissions. Such an integrated framework would offer a more comprehensive theoretical perspective and practical guidance for low-carbon city development. Expanding on this research direction would not only address the current gap in analyzing built environment factors but also extend the potential applications of the TOE framework to study complex systems. This would enhance both the theoretical depth and practical relevance of research on urban carbon reduction pathways.

Author Contributions

Conceptualization, H.J., J.L. and X.X.; methodology, H.J., J.L. and X.X.; software, J.L. and R.Z.; validation, J.L. and R.Z.; writing—original draft preparation, H.J., J.L. and X.X. All authors have read and agreed to the published version of the manuscript.

Funding

This research was funded by the National Key Research and Development Program of China (grant no. 2023YFC3807700) and the National Natural Science Foundation of China (grant no. 52308056).

Data Availability Statement

The data supporting this study are available upon request from the corresponding author due to confidentiality agreements.

Conflicts of Interest

The authors declare no conflicts of interest.

References

  1. Friedlingstein, P.; O’Sullivan, M.; Jones, M.W.; Andrew, R.M.; Hauck, J.; Olsen, A.; Peters, G.P.; Peters, W.; Pongratz, J.; Sitch, S.; et al. Global Carbon Budget 2020. Earth Syst. Sci. Data 2020, 12, 3269–3340. [Google Scholar] [CrossRef]
  2. Jakimowicz, A.; Rzeczkowski, D. The impact of public administration digitalization on the decarbonization of the economy. Energies 2021, 14, 5739. [Google Scholar] [CrossRef]
  3. Chen, W.; Di, K.; Cai, Q.; Li, D.; Liu, C. Research on motivational mechanisms and pathways for promoting public participation in environmental protection behavior. Int. J. Environ. Res. Public Health 2023, 20, 5084. [Google Scholar] [CrossRef] [PubMed]
  4. Zhang, Z.; Zhu, J.; Yang, L.; Lu, N. Toward dual carbon targets: Spatial correlation on comprehensive carbon emission index in urban agglomerations based on a new evaluation model. J. Clean. Prod. 2024, 458, 142507. [Google Scholar] [CrossRef]
  5. Kaittani, M. Greener Cities for a Sustainable Future: Exploring Key Elements of Urban Sustainability. Bachelor’s Thesis, Metropolia University of Applied Sciences, Helsinki, Finland, 2024. [Google Scholar]
  6. Rahoui, H. Greenest City 2020, Vancouver. In Urban Planning for Transitions; John Wiley & Sons, Ltd.: Hoboken, NJ, USA, 2021; pp. 47–67. [Google Scholar]
  7. Du, M.; Feng, R.; Chen, Z. Blue sky defense in low-carbon pilot cities: A spatial spillover perspective of carbon emission efficiency. Sci. Total Environ. 2022, 846, 157509. [Google Scholar] [CrossRef]
  8. Li, L.; Li, J.; Peng, L.; Wang, X.; Sun, S. Optimal pathway to urban carbon neutrality based on scenario simulation: A case study of Shanghai, China. J. Clean. Prod. 2023, 416, 137901. [Google Scholar] [CrossRef]
  9. Yang, X.; Wang, X.-C.; Zhou, Z.-Y. Development path of Chinese low-carbon cities based on index evaluation. Adv. Clim. Change Res. 2018, 9, 144–153. [Google Scholar] [CrossRef]
  10. Liu, Y.; Zhang, X.; Shen, Y. Technology-driven carbon reduction: Analyzing the impact of digital technology on China’s carbon emission and its mechanism. Technol. Forecast. Soc. Change 2024, 200, 123124. [Google Scholar] [CrossRef]
  11. Shen, X.; Padua, M.G.; Kirkwood, N.G. Transformative Impact of Technology in Landscape Architecture on Landscape Research: Trends, Concepts and Roles. Land 2024, 13, 630. [Google Scholar] [CrossRef]
  12. Abbasi, K.R.; Shahbaz, M.; Zhang, J.; Irfan, M.; Alvarado, R. Analyze the environmental sustainability factors of China: The role of fossil fuel energy and renewable energy. Renew. Energy 2022, 187, 390–402. [Google Scholar] [CrossRef]
  13. Zhu, F.; Chen, Y. Advanced Hierarchical Planning and Design for Low-Carbon Landscape Architecture Leveraging Virtual Reality Technology. Int. J. Low-Carbon Technol. 2024, 19, 1787–1792. [Google Scholar] [CrossRef]
  14. Mavrodieva, A.V.; Shaw, R. Disaster and Climate Change Issues in Japan’s Society 5.0—A Discussion. Sustainability 2020, 12, 1893. [Google Scholar] [CrossRef]
  15. Yang, L.; Ye, W. Landscape Design of Garden Plants Based on Green and Low-Carbon Energy Under the Background of Big Data. Energy Rep. 2022, 8, 13399–13408. [Google Scholar] [CrossRef]
  16. Sun, L.; Feng, N. Research on fiscal policies supporting green and low-carbon transition to promote energy conservation and emission reduction in cities: Empirical evidence from China. J. Clean. Prod. 2023, 430, 139688. [Google Scholar] [CrossRef]
  17. Ye, T.; Zheng, H.; Ge, X.; Yang, K. Pathway of green development of Yangtze River Economic Belt from the perspective of green technological innovation and environmental regulation. Int. J. Environ. Res. Public Health 2021, 18, 10471. [Google Scholar] [CrossRef]
  18. Mohamed, S.A.; Ismail, W.A.W.; Hamid, N.H.A.; Kurzi, N.S.; Hasan, R.; Bak, Y.L.; Ramlee, N. Greening Strategy Through Implementation of Sustainable Landscape Design Towards Low Carbon School. IOP Conf. Ser. Earth Environ. Sci. 2023, 1167, 012048. [Google Scholar] [CrossRef]
  19. Wolf, S.; Teitge, J.; Mielke, J.; Schütze, F.; Jaeger, C. The European Green Deal—More Than Climate Neutrality. Intereconomics 2021, 56, 99–107. [Google Scholar] [CrossRef]
  20. Chen, C. New insights for managing the public finance aspects of climate-resilient infrastructure systems. In Research Handbook on Public Financial Management; Edward Elgar Publishing: Cheltenham, UK, 2023; pp. 385–401. Available online: https://www.elgaronline.com/edcollchap/book/9781800379718/book-part-9781800379718-37.xml (accessed on 18 July 2023).
  21. Song, Y.; Yang, L.; Sindakis, S.; Aggarwal, S.; Chen, C. Analyzing the role of high-tech industrial agglomeration in green transformation and upgrading of manufacturing industry: The case of China. J. Knowl. Econ. 2023, 14, 3847–3877. [Google Scholar] [CrossRef]
  22. Zhu, X. Have carbon emissions been reduced due to the upgrading of industrial structure? Analysis of the mediating effect based on technological innovation. Environ. Sci. Pollut. Res. 2022, 29, 54890–54901. [Google Scholar] [CrossRef]
  23. Gu, R.; Li, C.; Li, D.; Yang, Y.; Gu, S. The impact of rationalization and upgrading of industrial structure on carbon emissions in the Beijing-Tianjin-Hebei urban agglomeration. Int. J. Environ. Res. Public Health 2022, 19, 37997. [Google Scholar] [CrossRef]
  24. Korminouri, F. Circular Economy Potential of Climate Change Adaptation in Cities: The Case of Rotterdam, The Netherlands. Master’s Thesis, University of Twente, Enschede, The Netherlands, 2018. Available online: https://essay.utwente.nl/77475/ (accessed on 17 January 2025).
  25. Zhang, J.; Li, F.; Sun, M.; Sun, S.; Wang, H.; Zheng, P.; Wang, R. Household Consumption Characteristics and Energy-Related Carbon Emissions Estimation at the Community Scale: A Study of Zengcheng, China. Clean. Respons. Consum. 2021, 2, 100016. [Google Scholar] [CrossRef]
  26. Shen, X.; Chen, M.; Li, X.; Gao, S.; Yang, Q.; Wen, Y.; Sun, Q. Advancing Climate Resilience through a Geo-Design Framework: Strengthening Urban and Community Forestry for Sustainable Environmental Design. J. For. Res. 2024, 35, 117. [Google Scholar] [CrossRef]
  27. Ahmed, M.; Shuai, C.; Ahmed, M. Influencing factors of carbon emissions and their trends in China and India: A machine learning method. Environ. Sci. Pollut. Res. 2022, 29, 48424–48437. [Google Scholar] [CrossRef] [PubMed]
  28. Li, A.; Zhang, A.; Zhou, Y.; Yao, X. Decomposition analysis of factors affecting carbon dioxide emissions across provinces in China. J. Clean. Prod. 2017, 141, 1428–1444. [Google Scholar] [CrossRef]
  29. Liu, M.; Zhang, X.; Zhang, M.; Feng, Y.; Liu, Y.; Wen, J.; Liu, L. Influencing factors of carbon emissions in transportation industry based on CD function and LMDI decomposition model: China as an example. Environ. Impact Assess. Rev. 2021, 90, 106623. [Google Scholar] [CrossRef]
  30. Song, F.; Zheng, X. What drives the change in China’s energy intensity: Combining decomposition analysis and econometric analysis at the provincial level. Energy Policy 2012, 51, 445–453. [Google Scholar] [CrossRef]
  31. Cheng, Z.; Li, L.; Liu, J. The emissions reduction effect and technical progress effect of environmental regulation policy tools. J. Clean. Prod. 2017, 149, 191–205. [Google Scholar] [CrossRef]
  32. Cheng, Z.; Li, L.; Liu, J. Industrial structure, technical progress and carbon intensity in China’s provinces. Renew. Sustain. Energy Rev. 2018, 81, 2935–2946. [Google Scholar] [CrossRef]
  33. Fang, Z. Assessing the impact of renewable energy investment, green technology innovation, and industrialization on sustainable development: A case study of China. Renew. Energy 2023, 205, 772–782. [Google Scholar] [CrossRef]
  34. Su, Y.; Fan, Q. Renewable energy technology innovation, industrial structure upgrading and green development from the perspective of China’s provinces. Technol. Forecast. Soc. Change 2022, 180, 121727. [Google Scholar] [CrossRef]
  35. Shi, Z.; Wang, R. Configuration analysis of agricultural carbon emission influencing factors in China’s provincial regions under the TOE framework: Combining NCA and fsQCA methods. Chin. J. Ecol. Agric. 2024, 32, 1566–1577. Available online: https://link.cnki.net/urlid/13.1432.S.20240506.1835.002 (accessed on 25 December 2023).
  36. Shen, W. Synergistic CO2 reduction effects in Chinese urban agglomerations: Perspectives from social network analysis. Sci. Total Environ. 2021, 798, 149352. [Google Scholar] [CrossRef] [PubMed]
  37. Chen, W.; Cai, Q.; Di, K.; Li, D.; Liu, C.; Wang, M.; Liu, S.; Di, Z.; Shi, Q. What determines the performance of low-carbon cities in China? Analysis of the grouping based on the technology—Organization—Environment framework. PLoS ONE 2023, 18, e0289160. [Google Scholar] [CrossRef]
  38. Awa, H.O.; Ukoha, O.; Igwe, S.R. Revisiting technology-organization-environment (T-O-E) theory for enriched applicability. Bottom Line 2017, 30, 2–22. [Google Scholar] [CrossRef]
  39. Awa, H.O.; Ojiabo, O.U.; Orokor, L.E. Integrated technology-organization-environment (T-O-E) taxonomies for technology adoption. J. Enterp. Inf. Manag. 2017, 30, 893–921. [Google Scholar] [CrossRef]
  40. Aboelmaged, M.G. Predicting e-readiness at firm-level: An analysis of technological, organizational and environmental (TOE) effects on e-maintenance readiness in manufacturing firms. Int. J. Inf. Manag. 2014, 34, 639–651. [Google Scholar] [CrossRef]
  41. Gutierrez, A.; Boukrami, E.; Lumsden, R. Technological, organisational and environmental factors influencing managers’ decision to adopt cloud computing in the UK. J. Enterp. Inf. Manag. 2015, 28, 788–807. [Google Scholar] [CrossRef]
  42. Meng, X.; Cheng, Y.; Xuan, Y. Multiple paths of green and low-carbon development in industrial parks: Group analysis based on the TOE framework. Front. Environ. Sci. 2024, 12, 1361598. [Google Scholar] [CrossRef]
  43. Fernando, Y.; Tseng, M.-L.; Wahyuni-TD, I.S.; Sroufe, R.; Mohd-Zailani, N.I.A. Blockchain technology adoption for carbon trading and energy efficiency: ISO manufacturing firms in Malaysia. Int. J. Logist. Res. Appl. 2023, 26, 1556–1577. [Google Scholar] [CrossRef]
  44. Wang, S.; Zhang, X.; Peng, J.; Tan, Y.; Fan, Z. Providing Solutions for Carbon Emission Reduction Using the TOE Framework. Expert Syst. Appl. 2024, 255, 124547. [Google Scholar] [CrossRef]
  45. Li, Y.-D.; Yan, C.-L.; Zhao, Y.-H.; Bai, J.-Q. Analysing Multiple Paths of Urban Low-Carbon Governance: A Fuzzy-Set Qualitative Comparative Analysis Method Based on 35 Key Cities in China. Sustainability 2023, 15, 7613. [Google Scholar] [CrossRef]
  46. Min, Q.; Zhu, R.; Peng, L. Pathways to Improving Carbon Emission Efficiency in Provinces: A Comparative Qualitative Analysis Based on the Technology-Organization-Environment Framework. Heliyon 2024, 10, e25132. [Google Scholar] [CrossRef] [PubMed]
  47. As, M.; Bilir, T. Machine learning algorithms for energy efficiency: Mitigating carbon dioxide emissions and optimizing costs in a hospital infrastructure. Energy Build. 2024, 318, 114494. [Google Scholar] [CrossRef]
  48. Prianto, E.; Windarta, J.; Harianja, B. The Role of Vegetation and Landscape in the Energy Efficiency of Tropical Building. Am. Sci. Lett. 2017, 23, 1–6. [Google Scholar] [CrossRef]
  49. Zhang, L.; Mu, R.; Zhan, Y.; Yu, J.; Liu, L.; Yu, Y.; Zhang, J. Digital economy, energy efficiency, and carbon emissions: Evidence from provincial panel data in China. Sci. Total Environ. 2022, 852, 158403. [Google Scholar] [CrossRef]
  50. Habiba, U.; Xinbang, C.; Ali, S. Investigating the impact of financial development on carbon emissions: Does the use of renewable energy and green technology really contribute to achieving low-carbon economies? Gondwana Res. 2023, 121, 472–485. [Google Scholar] [CrossRef]
  51. He, L.; Yin, F.; Zhong, Z.; Ding, Z. The Impact of Local Government Investment on the Carbon Emissions Reduction Effect: An Empirical Analysis of Panel Data from 30 Provinces and Municipalities in China. PLoS ONE 2017, 12, e0180946. [Google Scholar] [CrossRef]
  52. Xue, F.; Chen, X. The carbon emission reduction effect of green fiscal policies: Evidence from ‘Energy-saving and emission reduction fiscal policy comprehensive demonstration cities’. J. Financ. Econ. 2022, 48, 79–93. [Google Scholar] [CrossRef]
  53. Jyh-Harng, S. Carbon sink trading platform mechanism of PPP mode of landscape architecture project based on carbon neutralization concept. E3S Web Conf. 2024, 490, 03018. [Google Scholar] [CrossRef]
  54. Li, J.; Dong, K.; Wang, K.; Dong, X. How does natural resource dependence influence carbon emissions? The role of environmental regulation. Resour. Policy 2023, 80, 103268. [Google Scholar] [CrossRef]
  55. Fan, M.; Li, M.; Liu, J.; Shao, S. Is High Natural Resource Dependence Doomed to Low Carbon Emission Efficiency? Evidence from 283 Cities in China. Energy Econ. 2022, 115, 106328. [Google Scholar] [CrossRef]
  56. Chen, X.; Chen, Y.E.; Chang, C.-P. The effects of environmental regulation and industrial structure on carbon dioxide emission: A non-linear investigation. Environ. Sci. Pollut. Res. 2019, 26, 30252–30267. [Google Scholar] [CrossRef] [PubMed]
  57. Du, K.; Cheng, Y.; Yao, X. Environmental regulation, green technology innovation, and industrial structure upgrading: The road to the green transformation of Chinese cities. Energy Econ. 2021, 98, 105247. [Google Scholar] [CrossRef]
  58. Liu, Y.; Xia, C.; Ou, X.; Lv, Y.; Ai, X.; Pan, R.; Zhang, Y.; Shi, M.; Zheng, X. Quantitative Structure and Spatial Pattern Optimization of Urban Green Space from the Perspective of Carbon Balance: A Case Study in Beijing, China. Ecol. Indic. 2023, 148, 110034. [Google Scholar] [CrossRef]
  59. Hu, L.; Yuan, W.; Jiang, J.; Ma, T.; Zhu, S. Asymmetric effects of industrial structure rationalization on carbon emissions: Evidence from thirty Chinese provinces. J. Clean. Prod. 2023, 428, 139347. [Google Scholar] [CrossRef]
  60. Tong, J.; Tao, L. Impact of industrial structure rationalization and upgrading on well-being performance of carbon emissions: Empirical analysis based on Chinese provincial level. Pol. J. Environ. Stud. 2023, 32, 5347–5363. [Google Scholar] [CrossRef]
  61. Wang, J.; Dong, X.; Dong, K. How does ICT agglomeration affect carbon emissions? The case of Yangtze River Delta urban agglomeration in China. Energy Econ. 2022, 111, 106107. [Google Scholar] [CrossRef]
  62. Zhang, J.; Yu, H.; Zhang, K.; Zhao, L.; Fan, F. Can innovation agglomeration reduce carbon emissions? Evidence from China. Int. J. Environ. Res. Public Health 2021, 18, 382. [Google Scholar] [CrossRef]
  63. Khanna, N. China’s pilot low-carbon city initiative: A comparative assessment of national goals and local plans. Sustain. Cities Soc. 2014, 12, 110–121. [Google Scholar] [CrossRef]
  64. National Development and Reform Commission (NDRC). Notice on Carrying Out Pilot Programs in the Third Group of National Low-Carbon Provinces and Cities; NDRC: Beijing, China, 2017. Available online: https://www.ndrc.gov.cn/xxgk/zcfb/tz/201701/t20170124_962888.html (accessed on 1 March 2023).
  65. Yu, Y. Low-carbon city pilot and carbon emission efficiency: Quasi-experimental evidence from China. Energy Econ. 2021, 46, 100. [Google Scholar] [CrossRef]
  66. Li, D.; Cao, L.; Zhou, Z.; Zhao, K.; Du, Z.; Chen, Y. Correlating CO2 emissions of cities with the inter-city carbon compensation mechanism: A regional perspective in the middle reaches of the Yangtze River (MRYR), China. Environ. Dev. Sustain. 2024, 26, 9185–9216. [Google Scholar] [CrossRef]
  67. Honaker, J.; King, G. What to do about missing values in time-series cross-section data. Am. J. Polit. Sci. 2010, 54, 561–581. [Google Scholar] [CrossRef]
  68. Ma, X.; Wang, C.; Dong, B.; Gu, G.; Chen, R.; Li, Y.; Zou, H.; Zhang, W.; Li, Q. Carbon emissions from energy consumption in China: Its measurement and driving factors. Sci. Total Environ. 2019, 648, 1411–1420. [Google Scholar] [CrossRef] [PubMed]
  69. Tan, Z.; Li, L.; Wang, J.; Wang, J. Examining the driving forces for improving China’s CO2 emission intensity using the decomposing method. Appl. Energy 2011, 88, 4439–4446. [Google Scholar] [CrossRef]
  70. Abbas, S. Pathways towards carbon neutrality in low carbon cities: The role of green patents, R&D and energy use for carbon emissions. Technol. Forecast. Soc. Change 2024, 185, 121467. [Google Scholar]
  71. Zhu, J. Economic growth pressure and energy efficiency improvement: Empirical evidence from Chinese cities. Appl. Energy 2022, 297, 117127. [Google Scholar] [CrossRef]
  72. Ali, S.; Yan, Q.; Irfan, M.; Ameer, W.; Atchike, D.W.; Acevedo-Duque, Á. Green Investment for Sustainable Business Development: The Influence of Policy Instruments on Solar Technology Adoption. Front. Energy Res. 2022, 10, 874824. [Google Scholar] [CrossRef]
  73. Wang, K.; Wu, M.; Sun, Y.; Shi, X.; Sun, A.; Zhang, P. Resource abundance, industrial structure, and regional carbon emissions efficiency in China. Resour. Policy 2019, 60, 203–214. [Google Scholar] [CrossRef]
  74. Yue, X.; Zhao, S.; Ding, X.; Xin, L. How the pilot low-carbon city policy promotes urban green innovation: Based on temporal-spatial dual perspectives. Int. J. Environ. Res. Public Health 2023, 20, 561. [Google Scholar] [CrossRef]
  75. Hou, G.; Zou, Z.; Zhang, T.; Meng, Y. Analysis of the effect of industrial transformation of resource-based cities in northeast China. Economies 2019, 7, 40. [Google Scholar] [CrossRef]
  76. Li, Z.; Shi, H.; Liu, H. Research on the concentration, potential and mission of science and technology innovation in China. PLoS ONE 2021, 16, e0257636. [Google Scholar] [CrossRef] [PubMed]
  77. Hair, J.F. The use of partial least squares structural equation modeling in strategic management research: A review of past practices and recommendations for future applications. Long Range Plan. 2012, 45, 43–55. [Google Scholar] [CrossRef]
  78. Hair, J.F.; Ringle, C.M.; Sarstedt, M. PLS-SEM: Indeed a silver bullet. J. Mark. Theory Pract. 2011, 19, 139–152. [Google Scholar] [CrossRef]
  79. Hair, J.F.; Risher, J.J.; Sarstedt, M.; Ringle, C.M. When to use and how to report the results of PLS-SEM. Eur. Bus. Rev. 2019, 31, 2–24. [Google Scholar] [CrossRef]
  80. Dul, J.; van der Laan, E.; Kuik, R. A statistical significance test for necessary condition analysis. Organ. Res. Methods 2020, 23, 385–395. [Google Scholar] [CrossRef]
  81. Memon, M.A.; Ramayah, T.; Cheah, J.-H.; Ting, H.; Chuah, F.; Cham, T.H. PLS-SEM statistical programs: A review. J. Appl. Struct. Eq. Model. 2021, 5, i–xiv. [Google Scholar] [CrossRef]
  82. Vis, B.; Dul, J. Analyzing relationships of necessity not just in kind but also in degree: Complementing fsQCA with NCA. Sociol. Methods Res. 2018, 47, 872–899. [Google Scholar] [CrossRef]
  83. Fiss, P.C. Building better causal theories: A fuzzy set approach to typologies in organization research. Acad. Manag. J. 2011, 54, 393–420. [Google Scholar] [CrossRef]
  84. Kraus, S.; Ribeiro-Soriano, D.; Schüssler, M. Fuzzy-Set Qualitative Comparative Analysis (fsQCA) in Entrepreneurship and Innovation Research—The Rise of a Method. Int. Entrep. Manag. J. 2018, 14, 15–33. [Google Scholar] [CrossRef]
  85. Ragin, C.C. Redesigning Social Inquiry: Fuzzy Sets and Beyond; University of Chicago Press: Chicago, IL, USA, 2009. [Google Scholar]
  86. Rihoux, B.; Álamos-Concha, P.; Bol, D.; Marx, A.; Rezsöhazy, I. From niche to mainstream method? A comprehensive mapping of QCA applications in journal articles from 1984 to 2011. Polit. Res. Q. 2013, 66, 175–184. Available online: https://www.jstor.org/stable/23563600 (accessed on 5 October 2023).
  87. Xu, Q.; Xu, P.; Bao, C. Multifaceted pathways of carbon emission reduction policies: A study based on the decoupling effect and fsQCA method in the Yangtze River Delta urban agglomeration. Sustainability 2023, 15, 3745. [Google Scholar] [CrossRef]
  88. Cao, P.; Chen, R. Research on the Impact Path of Ecological Civilization Construction on Carbon Emission Based on fsQCA Method. Front. Ecol. Evol. 2023, 11, 1172180. [Google Scholar] [CrossRef]
  89. Ziggers, G.W.; Henseler, J. The reinforcing effect of a firm’s customer orientation and supply-base orientation on performance. Ind. Mark. Manag. 2016, 52, 18–26. [Google Scholar] [CrossRef]
  90. García-Alcaraz, J.L.; Realyvasquez-Vargas, A.; García-Alcaraz, P.; Pérez de la Parte, M.; Blanco Fernández, J.; Jiménez Macias, E. Effects of human factors and lean techniques on just in time benefits. Sustainability 2019, 11, 1864. [Google Scholar] [CrossRef]
  91. Hamid, M.R.A.; Sami, W.; Sidek, M.H.M. Discriminant validity assessment: Use of Fornell & Larcker criterion versus HTMT criterion. J. Phys. Conf. Ser. 2017, 890, 012163. [Google Scholar] [CrossRef]
  92. Andreev, P.; Heart, T.; Maoz, H.; Pliskin, N. Validating formative partial least squares (PLS) models: Methodological review and empirical illustration. In Proceedings of the ICIS 2009 Proceedings, Phoenix, AZ, USA, 15–18 December 2009; Available online: https://aisel.aisnet.org/icis2009/193 (accessed on 10 December 2024).
  93. AlWahaibi, I.S.H.; AlHadabi, D.A.M.Y.A.; AlKharusi, H.A.T. Cohen’s criteria for interpreting practical significance indicators: A critical study. Cypriot J. Educ. Sci. 2020, 15, 246–258. [Google Scholar] [CrossRef]
  94. Dul, J. Conducting Necessary Condition Analysis for Business and Management Students. Available online: https://uk.sagepub.com/en-gb/eur/conducting-necessary-condition-analysis-for-business-and-management-students/book262898 (accessed on 12 December 2024).
  95. Richter, N.F.; Hauff, S.; Ringle, C.M.; Sarstedt, M.; Kolev, A.E.; Schubring, S. How to apply necessary condition analysis in PLS-SEM. In Partial Least Squares Path Modeling: Basic Concepts, Methodological Issues and Applications; Latan, H., Hair, J.F., Noonan, R., Eds.; Springer International Publishing: Cham, Switzerland, 2023; pp. 267–297. [Google Scholar] [CrossRef]
  96. Dul, J. Necessary Condition Analysis (NCA) with R (Version 3.1.0): A Quick Start Guide. Available online: https://www.erim.eur.nl/fileadmin/user_upload/_generated_/download/Quick_Start_Guide_NCA_3.1.0_March_2__2021.pdf (accessed on 8 December 2024).
  97. Meuer, J.; Rupietta, C. A review of integrated QCA and statistical analyses. Qual. Quant. 2017, 51, 2063–2083. [Google Scholar] [CrossRef]
  98. Schneider, C.Q.; Wagemann, C. Set-Theoretic Methods for the Social Sciences: A Guide to Qualitative Comparative Analysis; Cambridge University Press: Cambridge, UK, 2012. [Google Scholar]
  99. Shipan, C.R.; Volden, C. The mechanisms of policy diffusion. Am. J. Polit. Sci. 2008, 52, 840–857. [Google Scholar] [CrossRef]
  100. Wang, F.; Harindintwali, J.D.; Yuan, Z.; Wang, M.; Wang, F.; Li, S.; Yin, Z.; Huang, L.; Fu, Y.; Li, L.; et al. Technologies and perspectives for achieving carbon neutrality. Innovation 2021, 2, 100180. [Google Scholar] [CrossRef]
  101. Ceglia, F.; Esposito, P.; Marrasso, E.; Sasso, M. From Smart Energy Community to Smart Energy Municipalities: Literature Review, Agendas and Pathways. J. Clean. Prod. 2020, 254, 120118. [Google Scholar] [CrossRef]
  102. Zhang, Z.-H.; Ling, D.; Yang, Q.-X.; Feng, Y.-C.; Xiu, J. Central environmental protection inspection and carbon emission reduction: A tripartite evolutionary game model from the perspective of carbon neutrality. Petroleum Sci. 2024, 21, 2139–2153. [Google Scholar] [CrossRef]
  103. Chen, L.; Bai, X.; Chen, B.; Wang, J. Incentives for green and low-carbon technological innovation of enterprises under environmental regulation: From the perspective of evolutionary game. Front. Energy Res. 2022, 9, 793667. [Google Scholar] [CrossRef]
  104. Xie, R.; Teo, T.S.H. Green technology innovation, environmental externality, and the cleaner upgrading of industrial structure in China—Considering the moderating effect of environmental regulation. Technol. Forecast. Soc. Change 2022, 184, 122020. [Google Scholar] [CrossRef]
  105. Wang, J.; Yu, S.; Li, M.; Cheng, Y.; Wang, C. Study of the impact of industrial restructuring on the spatial and temporal evolution of carbon emission intensity in Chinese provinces—Analysis of mediating effects based on technological innovation. Int. J. Environ. Res. Public Health 2022, 19, 13401. [Google Scholar] [CrossRef]
  106. Li, S.; Xue, F.; Xia, C.; Zhang, J.; Bian, A.; Lang, Y.; Zhou, J. A Big Data-Based Commuting Carbon Emissions Accounting Method—A Case of Hangzhou. Land 2022, 11, 900. [Google Scholar] [CrossRef]
  107. Huang, P.; Li, P. Politics of urban energy transitions: New energy vehicle (NEV) development in Shenzhen, China. Environ. Polit. 2020, 29, 524–545. [Google Scholar] [CrossRef]
  108. Wang, C. Study on the dynamic evaluation of the regional green low-carbon transformation in China evidence from Qingdao, Yantai and Weihai. Chaos Solitons Fractals 2016, 89, 147–152. [Google Scholar] [CrossRef]
  109. Zeng, S.; Chu, Y.; Yang, Y.; Li, P.; Liu, H. Comprehensive Evaluation of Low-Carbon City Competitiveness under the “Dual-Carbon” Target: A Cross-Sectional Comparison between Huzhou City and Neighboring Cities in China. Systems 2022, 10, 235. [Google Scholar] [CrossRef]
  110. Li, M.H.; Ni, H. The Research of Green Ecological Wisdom City Construction—Taking Nanjing as an Example. Adv. Mater. Res. 2015, 1073–1076, 1368–1375. [Google Scholar] [CrossRef]
  111. Wang, T.; Song, Z.; Zhou, J.; Sun, H.; Liu, F. Low-Carbon Transition and Green Innovation: Evidence from Pilot Cities in China. Sustainability 2022, 14, 7264. [Google Scholar] [CrossRef]
  112. Zhang, L.; Cai, Y.; Song, S.; Sun, L. An Urban Renewal Design Method Based on Carbon Emissions and Carbon Sink Calculations: A Case Study on an Environmental Improvement Project in the Suzhou Industrial Investment Science and Technology Park. Buildings 2024, 14, 2962. [Google Scholar] [CrossRef]
  113. Wang, W.; Li, B.Y.; Ren, Z.Y. Ecosystem service function evaluation: A case study of the Yinchuan basin in China. Ecol. Eng. 2017, 106, 333–339. [Google Scholar] [CrossRef]
Figure 1. Research framework.
Land 14 00260 g001
Figure 2. Conceptual model.
Land 14 00260 g002
Figure 3. Path diagram of the research model.
Land 14 00260 g003
Figure 4. Visualization of necessity analysis for TOE dimensions in carbon reduction. (a) Technology and Carbon Emissions (b) Organization and Carbon Emissions (c) Environment and Carbon Emissions.
Land 14 00260 g004
Figure 5. Necessity analysis results.
Land 14 00260 g005
Figure 6. Scatter plot of high carbon neutrality configurations. (a) Path of Innovation-Driven Technology (b) Path of Collaboration Between Technology and Policy.
Land 14 00260 g006
Figure 7. Scatter plot of medium carbon neutrality configurations. (a) Path for enhancing technology through environmental incentives. (b) Path for emission reduction through traditional technology innovation (c) Technology path focused on resource optimization.
Land 14 00260 g007
Figure 8. Scatter plot of low carbon neutrality configurations. (a) Policy-Driven Path (b) Path for Resource Integration with an Environmental Focus.
Land 14 00260 g008
Table 1. Classification of cities by carbon neutrality capacity.
Carbon Neutrality CapacityRepresentative Cities
High Huangshan, Xingzhou, Ganzhou, Huaihua, Liuzhou, Guilin, Dalian, Hangzhou, Xiamen, Yantai, Changsha, Guangzhou, Shenzhen, Sanya, Kunming
Medium Beijing, Nanjing, Changzhou, Ningbo, Wenzhou, Jinhua, Jining, Zhoushan, Hefei, Huaibei, Huainan, Suzhou, Fuyang, Luoyang, Wuhan, Zhuhai, Yulin, Yichang, Jiujiang, Huangshi, Tongling, Xuancheng, Maoming, Chongqing, Chengdu, Anshun, Tianmen, Lishui, Xiangtan, Huaian, Suqian, Ma’anshan, Hengshui, Yiyang, Ganzhou, Lu’an, Liu’an, Sanming, Shangrao, Linfen, Xiangyang, Dehong, Chenzhou, Longyan, Putian, Ji’an, Meizhou, Foshan, Chaozhou, Hezhou
LowTianjin, Dalian, Yangquan, Yuxi, Linyi, Shanghai, Wuxi, Xuzhou, Jining, Huainan, Yinchuan, Jincheng, Baotou, Baoding, Yingkou, Tonghua, Daqing, Lianyungang, Yancheng, Yangzhou, Bozhou, Tongling, Luoyang, Chengde, Liangshan
Table 2. Descriptive statistics of variables.
CategoryDimensionVariable Measurement ApproachData Source
Outcome variableCarbon emission intensityChange rate of the ratio of total carbon emissions to city GDP (2020–2022)China Energy Statistical Yearbook, city statistical yearbooks, carbon emission data from the Ministry of Ecology and Environment
Carbon emissionsChange rate of total carbon emissions (2020–2022)China Energy Statistical Yearbook, city statistical yearbooks, carbon emission data from the Ministry of Ecology and Environment
Conditional variableTechnologyLevel of green low-carbon technologyNumber of low-carbon patent applications (2020–2022)CNRDS Database
Energy efficiency optimizationChange rate of urban energy consumption as a proportion of city GDP (2020–2022)China Energy Statistical Yearbook, city statistical yearbooks
OrganizationGovernment investment in low-carbon initiativesChange rate of government expenditure on energy conservation, environmental protection, and low-carbon initiatives as a share of public fiscal expenditure (2020–2022)China Environmental Statistical Yearbook, China Energy Statistical Yearbook, provincial statistical yearbooks
Optimization of resource dependenceChange rate of output value from resource industries (e.g., mining, oil, natural gas) as a proportion of city GDP (2020–2022)Provincial and city statistical yearbooks
EnvironmentPolicy supportNumber of low-carbon policies adopted by cities in the past three years (2020–2022)Provincial and city policy documents
Rationalization of industrial structuresChange rate of Theil index (2020–2022)China Energy Statistical Yearbook, China Environmental Statistical Yearbook, provincial and city statistical yearbooks
Aggregation of innovative resourcesNumber of provincial-level and above research institutions and recognized high-tech enterprises (2020–2022)Provincial and city technology bureau websites, technology statistical reports, or annual work summaries
Table 3. Reliability and validity indicators.
ConstructVariable LoadingVIFCRAVECronbach’s Alpha
TechnologyLevel of green low-carbon technology0.8891.5110.8830.7910.736
Energy efficiency optimization0.8911.511
OrganizationGovernment investment in low-carbon initiatives0.8901.4380.8730.7760.711
Optimization of resource dependence0.8721.438
EnvironmentPolicy support0.8792.1210.9090.7700.851
Rationalization of industrial structures0.8612.040
Aggregation of innovative resources0.8922.099
Carbon emission reductionCarbon emissions0.8661.5390.8850.7940.744
Carbon emission intensity0.9161.539
Table 4. Discriminant validity analysis using the Fornell–Larcker criterion.
ConstructTechnologyEnvironmentCarbon Emission ReductionOrganization
Technology0.889
Environment0.7810.878
Carbon emission reduction0.8000.7630.891
Organization0.7380.7870.7590.881
Table 5. Hypothesis testing results.
RelationshipPath
Coefficient (β)
STDEVp-Valuet-ValueCI [2.5–97.5%]Hypothesis
Direct effects
Technology -> carbon emission reduction0.4370.1110.0003.9480.195–0.63Supported
Organization -> carbon emission reduction0.2730.0990.0062.7660.085–0.471Supported
Environment -> carbon emission reduction0.2070.1090.0571.9070.006–0.429Not supported
Indirect effects
Organization -> technology -> carbon emission reduction0.1420.0590.0162.4100.050–0.282Supported
Environment -> technology -> carbon emission reduction0.2290.0770.0032.9530.096–0.401Supported
Environment -> organization -> carbon emission reduction0.2150.0790.0062.7290.062–0.371Supported
Table 6. NCA effect size.
DimensionEffect Size (CR-FDH Model)p-ValueSignificance
Technology0.3770.00**
Organization0.2490.03**
Environment0.3050.01**
** Indicates statistical significance at the 0.05 level.
Table 7. Bottleneck analysis (percentage).
Carbon Reduction LevelTechnologyOrganizationEnvironment
0NNNNNN
10NNNNNN
204.8NNNN
3014.2NN8.5
4023.60.217.3
5033.013.626.2
6042.427.035.0
7051.840.543.8
8061.353.952.7
9070.767.361.5
10080.180.770.3
NN signifies that this dimension is not a necessary condition at the specified carbon reduction level.
Table 8. fsQCA calibration anchors.
VariableAnchors
Full Non-MembershipCrossover PointFull Membership
Conditional
variable
Level of green low-carbon technology1613671108
Energy efficiency optimization0.0005410.0018460.005925
Government investment in low-carbon initiatives9.13953215.5738025.86490
Optimization of resource dependence0.0013910.0123950.118568
Policy support737108
Rationalization of industrial structures0.0287780.0474350.066384
Aggregation of innovative resources102221886
Outcome variableCarbon emission intensity0.0000580.0001060.000157
Table 9. Configuration pathways for urban typologies.
Urban TypologyHigh Carbon Neutral CapacityMedium Carbon Neutral CapacityLow Carbon Neutral Capacity
Conditional variablePath 1Path 2Path 1Path 2Path 3Path 1Path 2
Level of green low-carbon technologyLand 14 00260 i002Land 14 00260 i002Land 14 00260 i001Land 14 00260 i002Land 14 00260 i001Land 14 00260 i003Land 14 00260 i004
Energy efficiency optimizationLand 14 00260 i002Land 14 00260 i002Land 14 00260 i002Land 14 00260 i002Land 14 00260 i001
Government investment in low-carbon initiatives Land 14 00260 i002Land 14 00260 i004Land 14 00260 i004Land 14 00260 i002Land 14 00260 i004Land 14 00260 i002
Optimization of resource dependenceLand 14 00260 i003 Land 14 00260 i004 Land 14 00260 i001Land 14 00260 i002Land 14 00260 i002
Policy support Land 14 00260 i003Land 14 00260 i001Land 14 00260 i004 Land 14 00260 i002Land 14 00260 i002
Rationalization of industrial structuresLand 14 00260 i002Land 14 00260 i002Land 14 00260 i002Land 14 00260 i002Land 14 00260 i004 Land 14 00260 i002
Aggregation of innovative resourcesLand 14 00260 i004Land 14 00260 i004 Land 14 00260 i004 Land 14 00260 i004Land 14 00260 i003
Consistency1.0000.8930.8360.9690.9250.9220.870
Raw coverage0.4500.3090.3380.2480.2170.4090.368
Unique coverage0.2250.1700.1500.1420.1360.2570.139
Land 14 00260 i001 Core causal condition present; Land 14 00260 i003 core causal condition absent; Land 14 00260 i002 peripheral condition present; Land 14 00260 i004 peripheral condition absent.
Disclaimer/Publisher’s Note: The statements, opinions and data contained in all publications are solely those of the individual author(s) and contributor(s) and not of MDPI and/or the editor(s). MDPI and/or the editor(s) disclaim responsibility for any injury to people or property resulting from any ideas, methods, instructions or products referred to in the content.

