


Ecological Security Evaluation System Integrated with Circuit Theory for Regional Ecological Security Pattern Construction: A Coordinated Study of Chang-Zhu-Tan Metropolitan Area in China

Abstract
1. Introduction
2. Study Area and Materials
2.1. Research Area
2.2. Materials
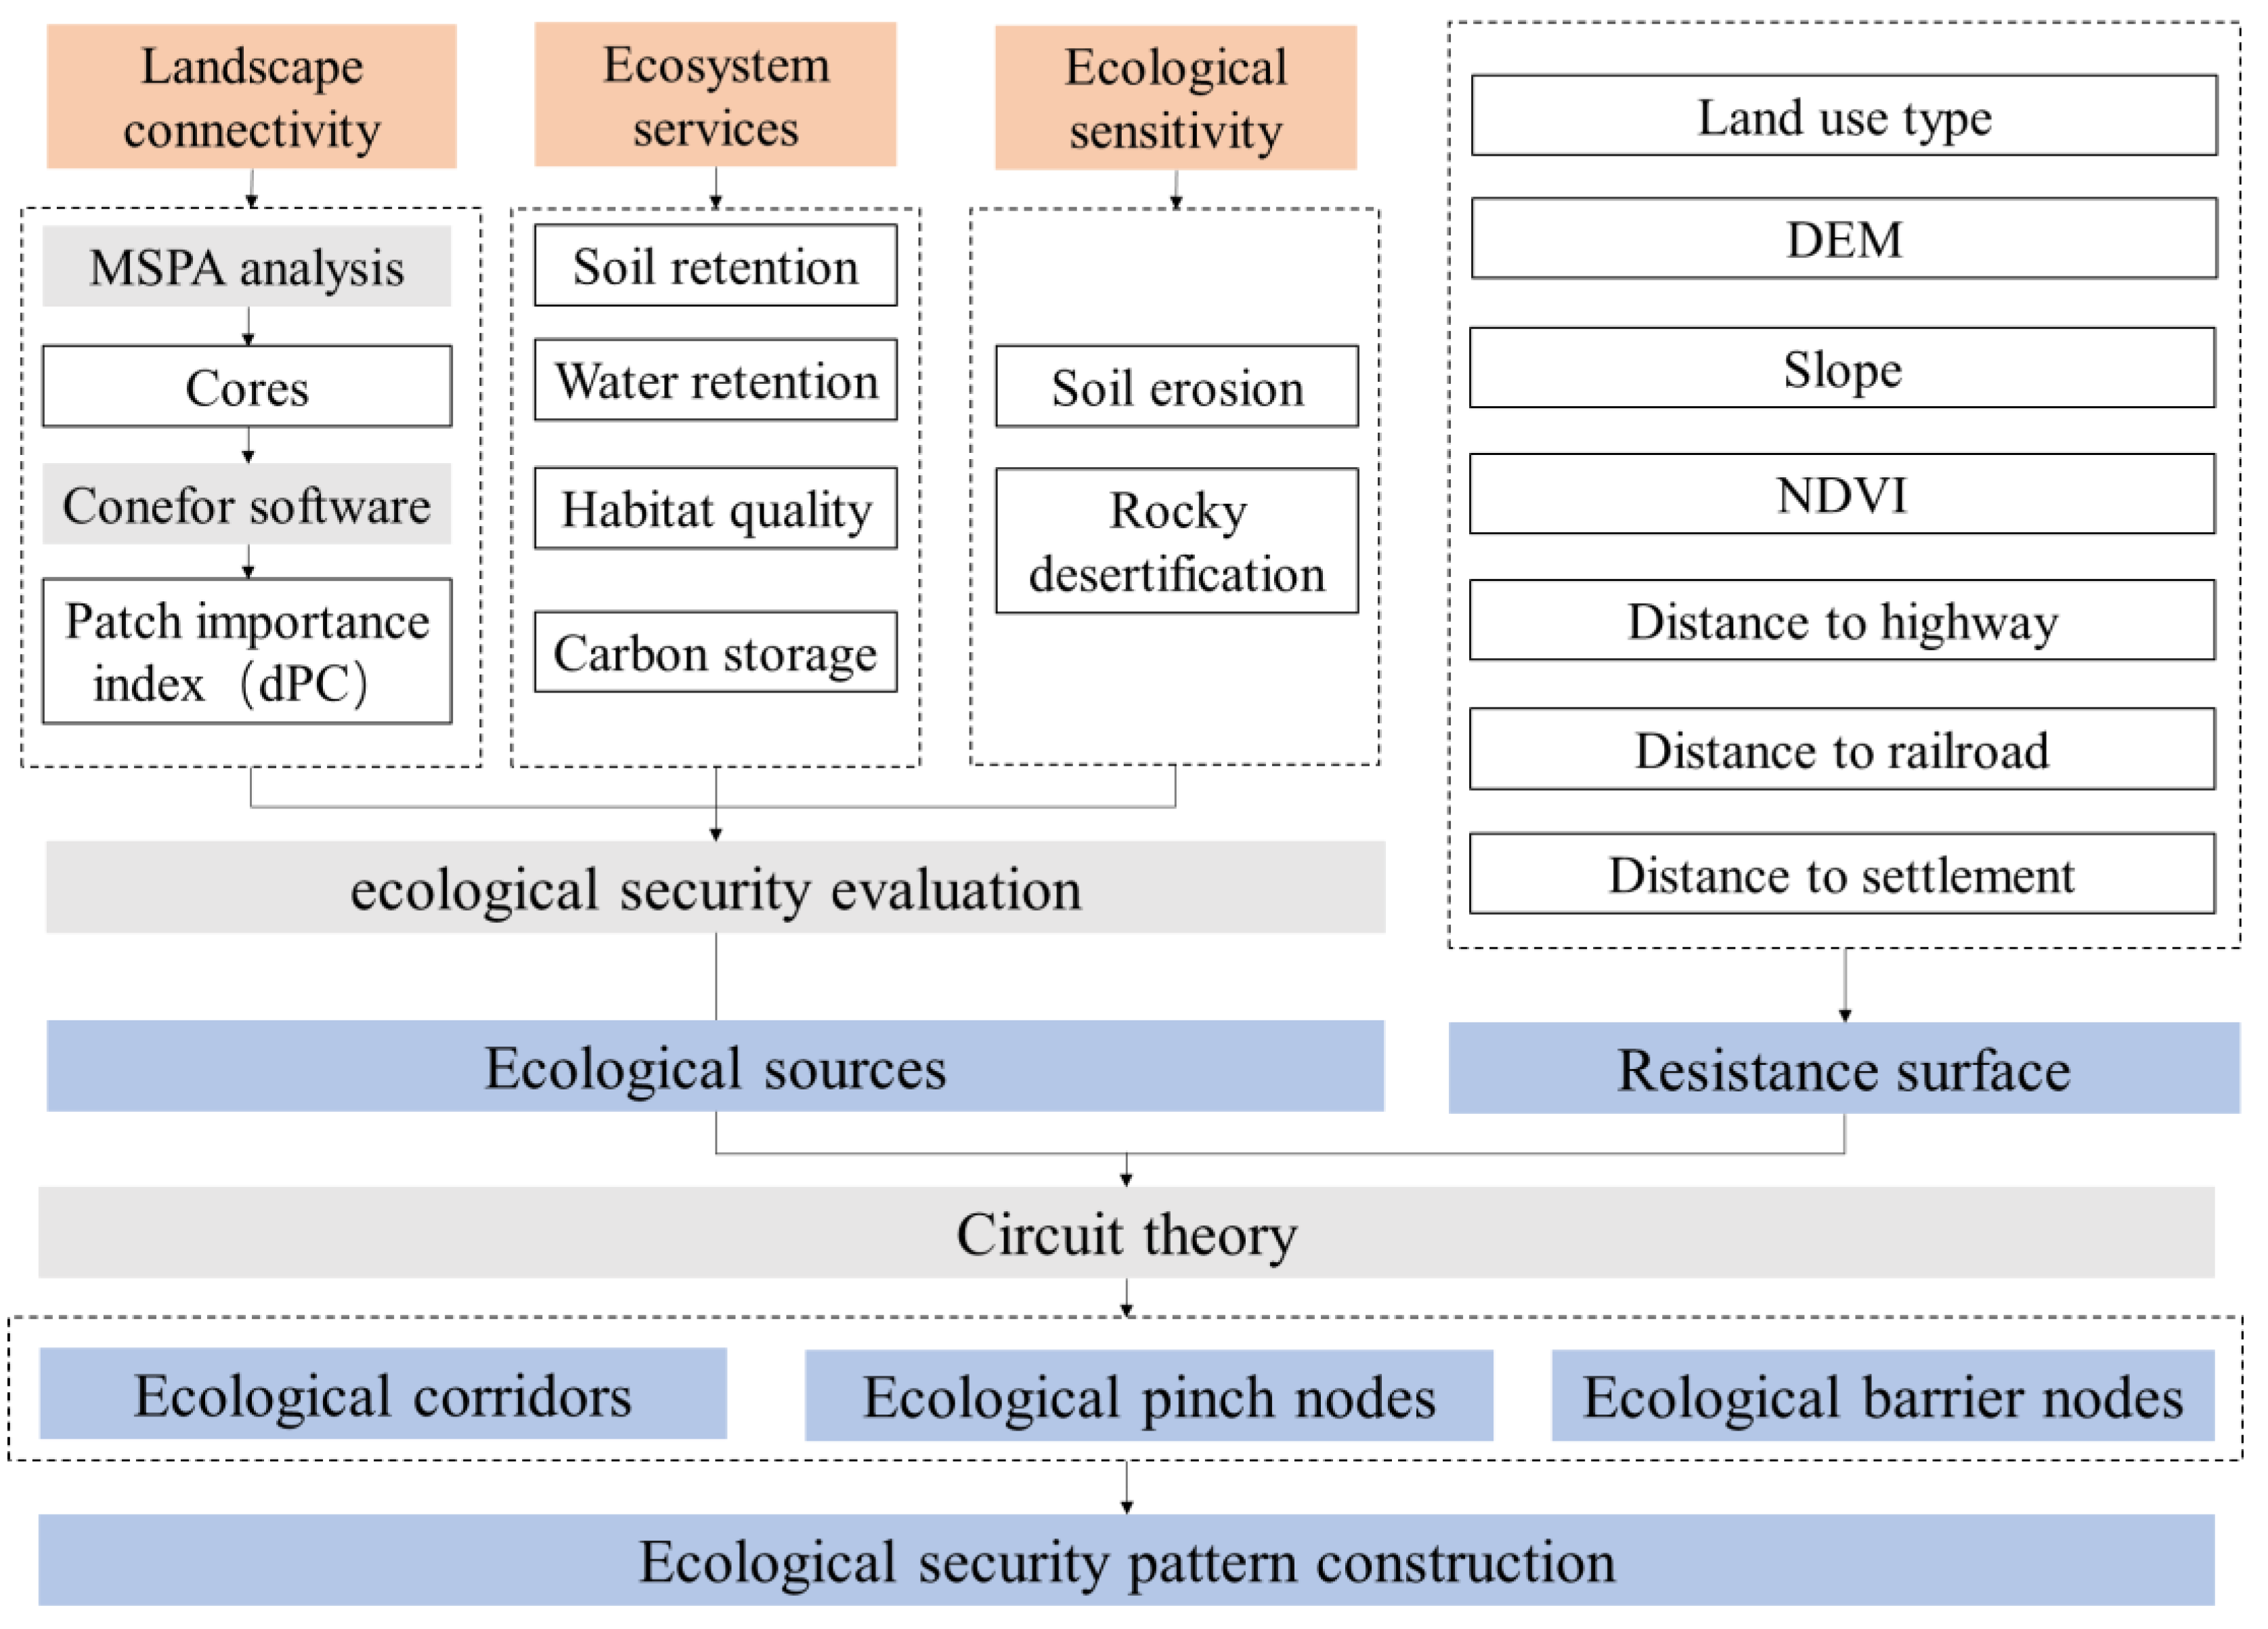
3. Methodology
3.1. Identification of Ecological Sources
3.1.1. Landscape Connectivity Analysis
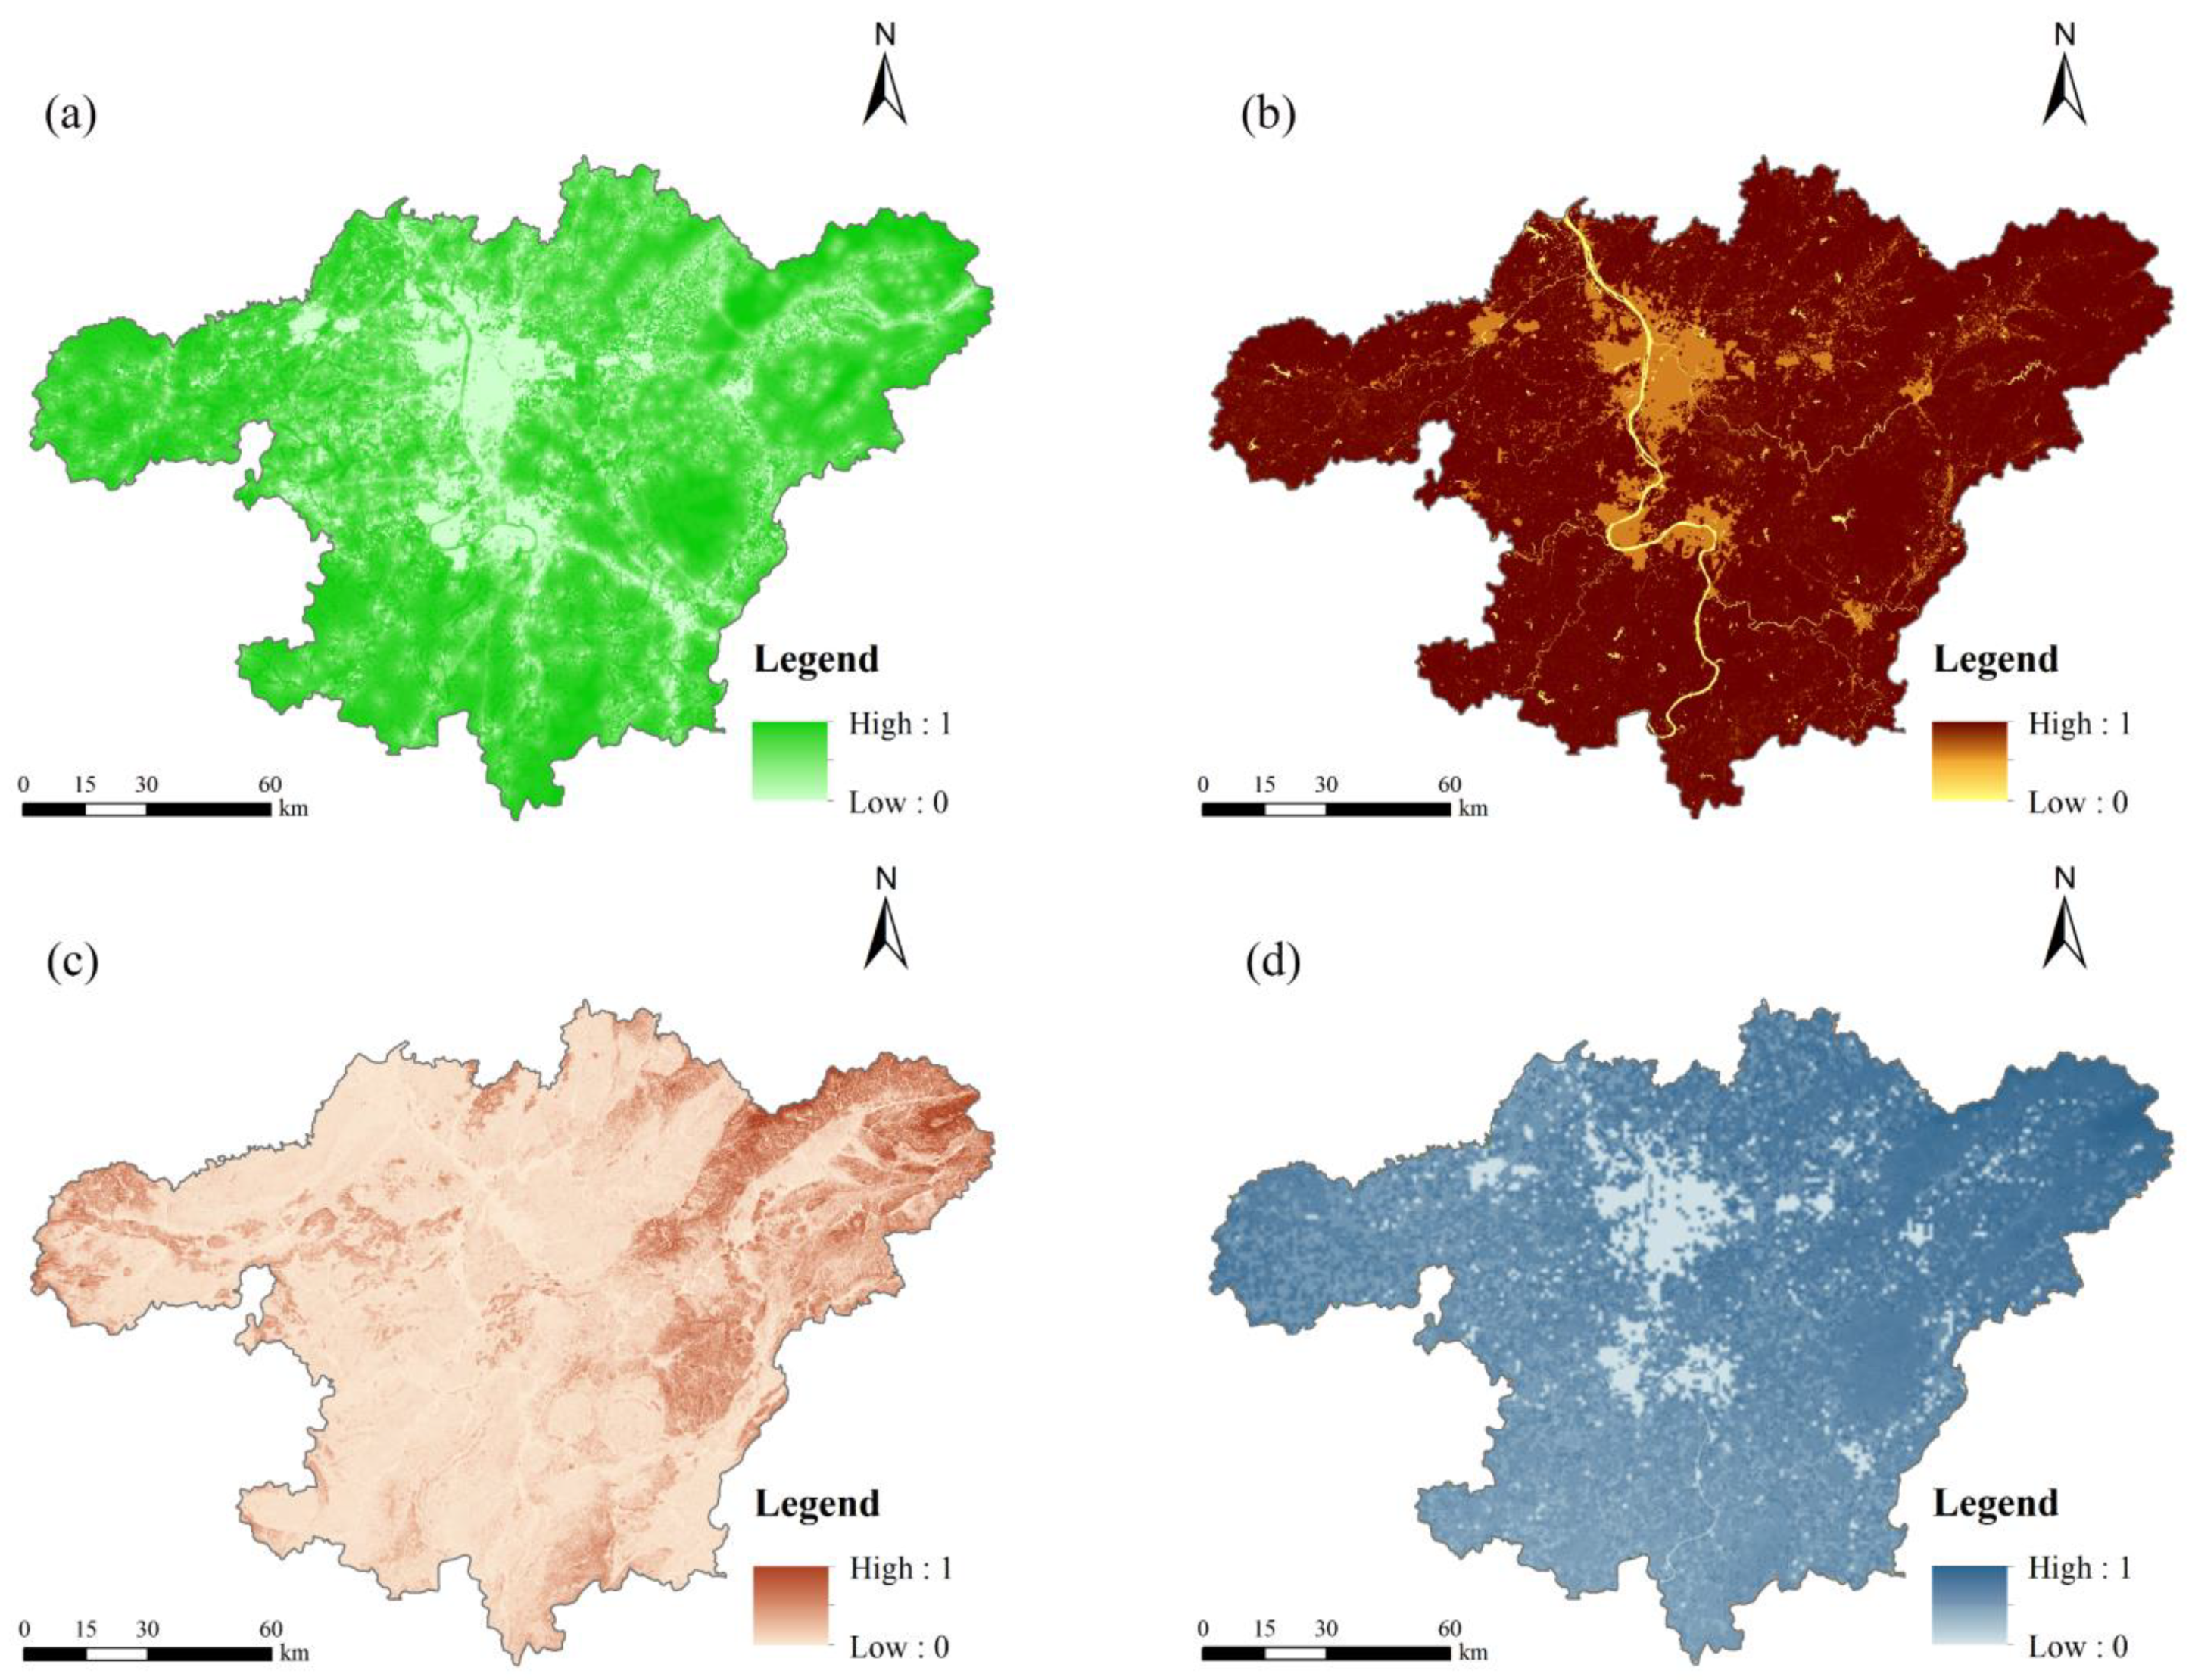
3.1.2. Ecosystem Service Evaluation
- (1)
- Habitat quality
- (2)
- Soil retention
- (3)
- Carbon sequestration
- (4)
- Water retention
3.1.3. Ecological Sensitivity Analysis
3.2. Construction of Resistance Surface
3.3. Identification of Ecological Corridors and Nodes
4. Results
4.1. Spatial Distribution Pattern of Ecological Sources
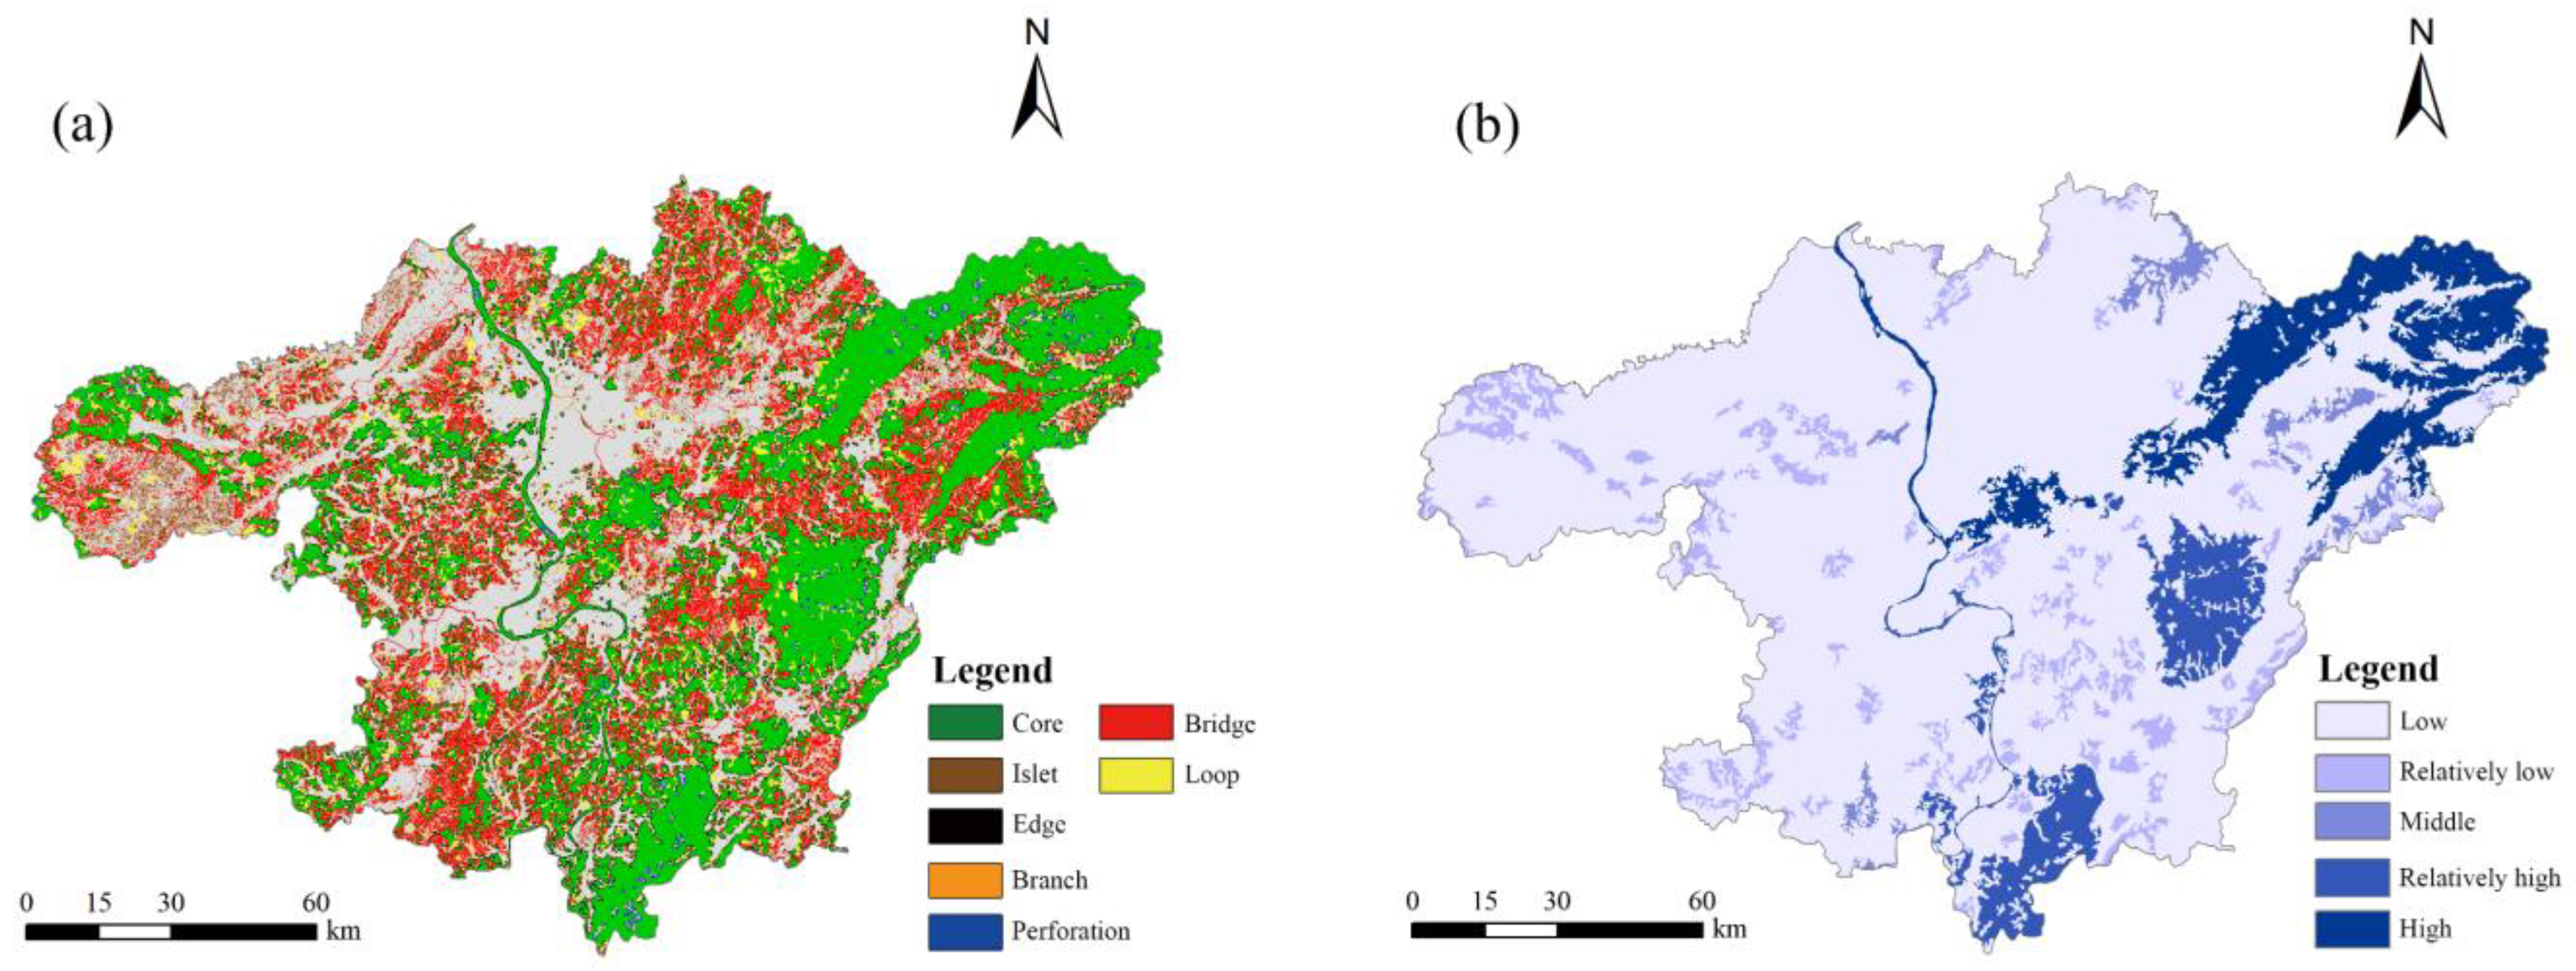
4.1.1. Spatial Distribution Pattern of Landscape Types and Connectivity
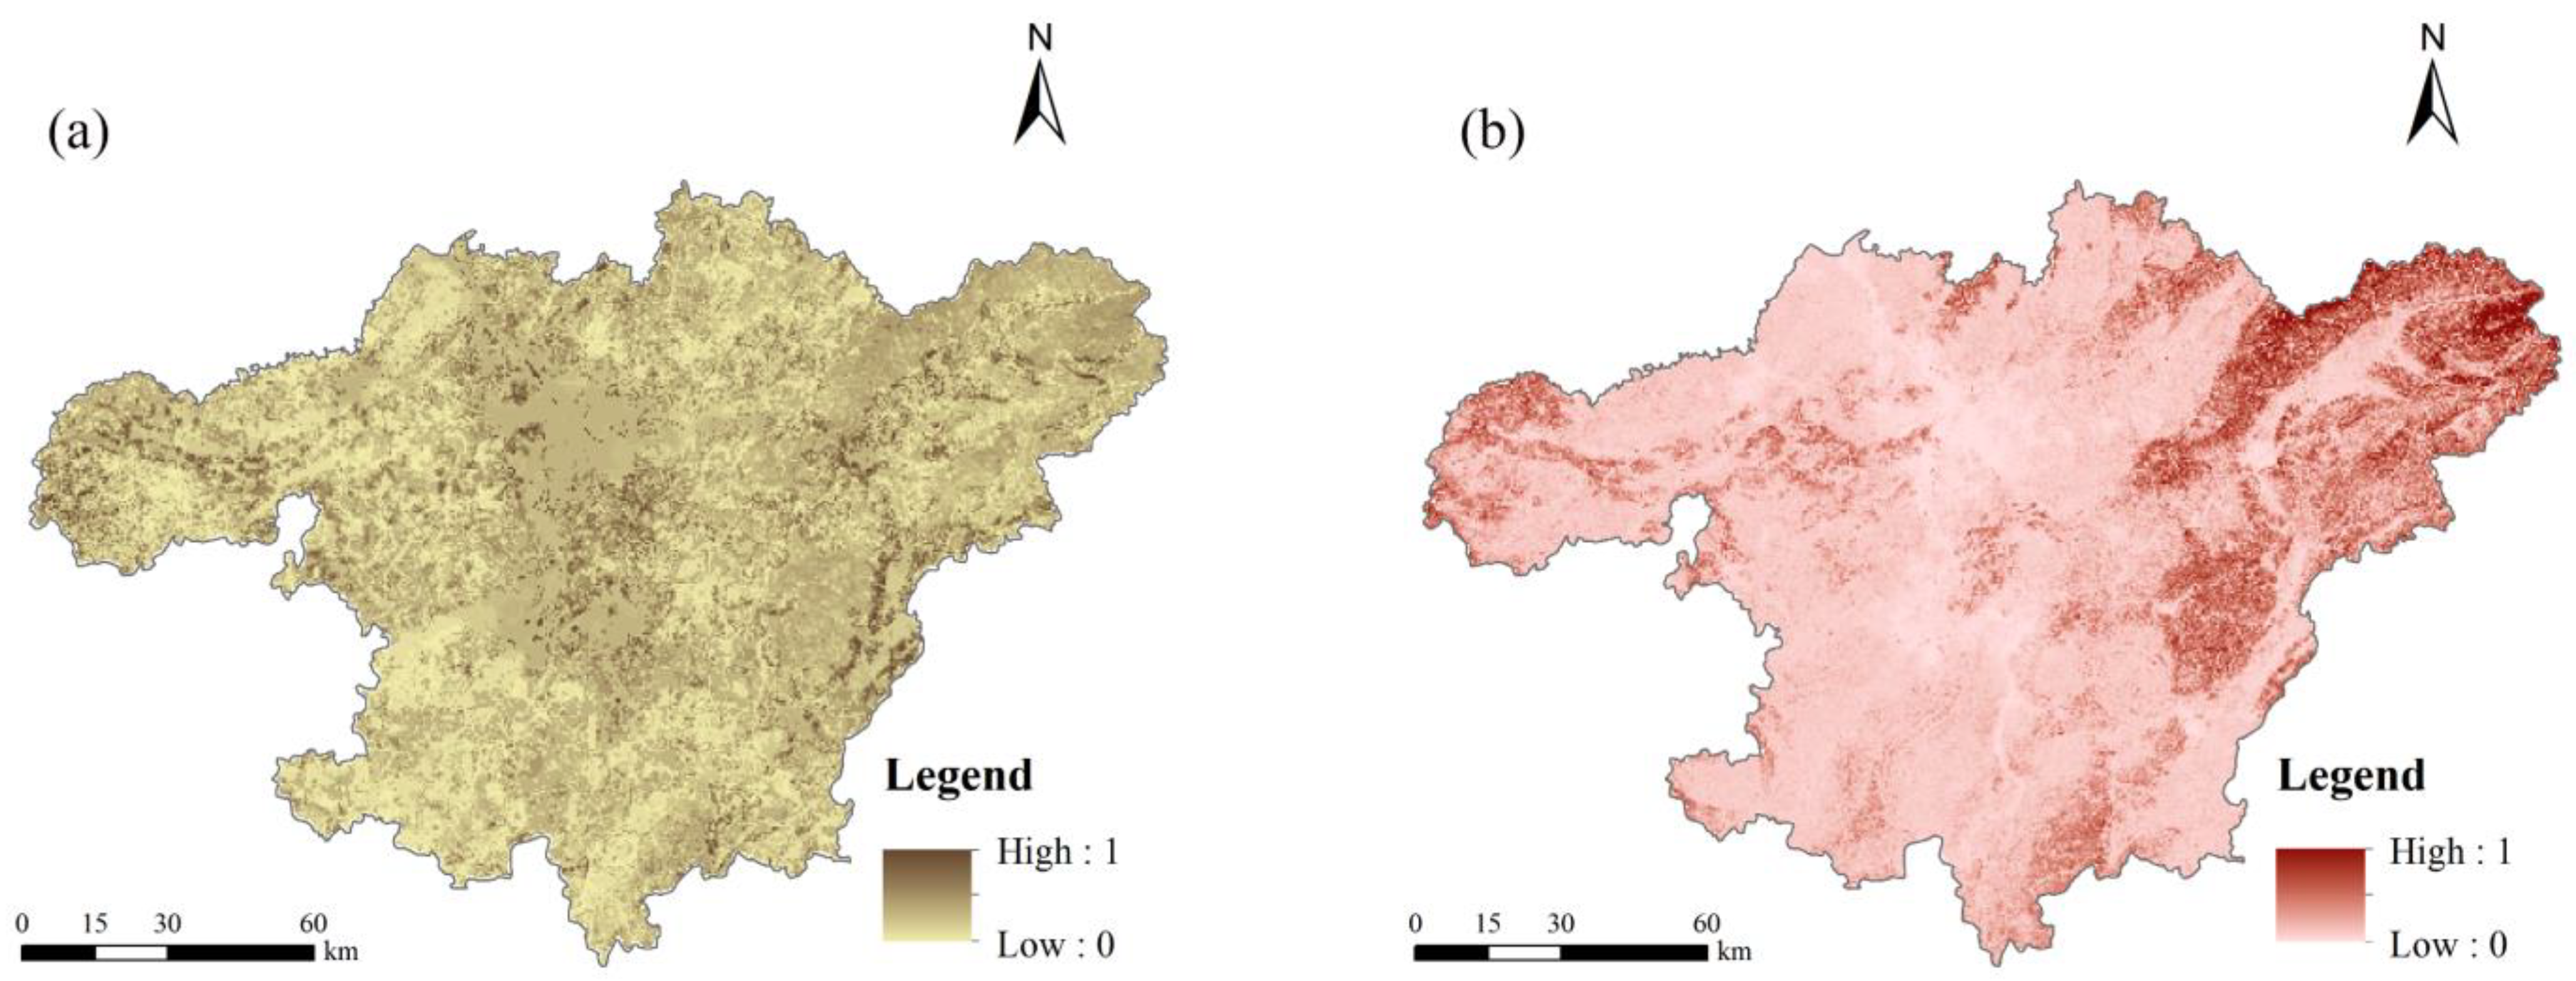
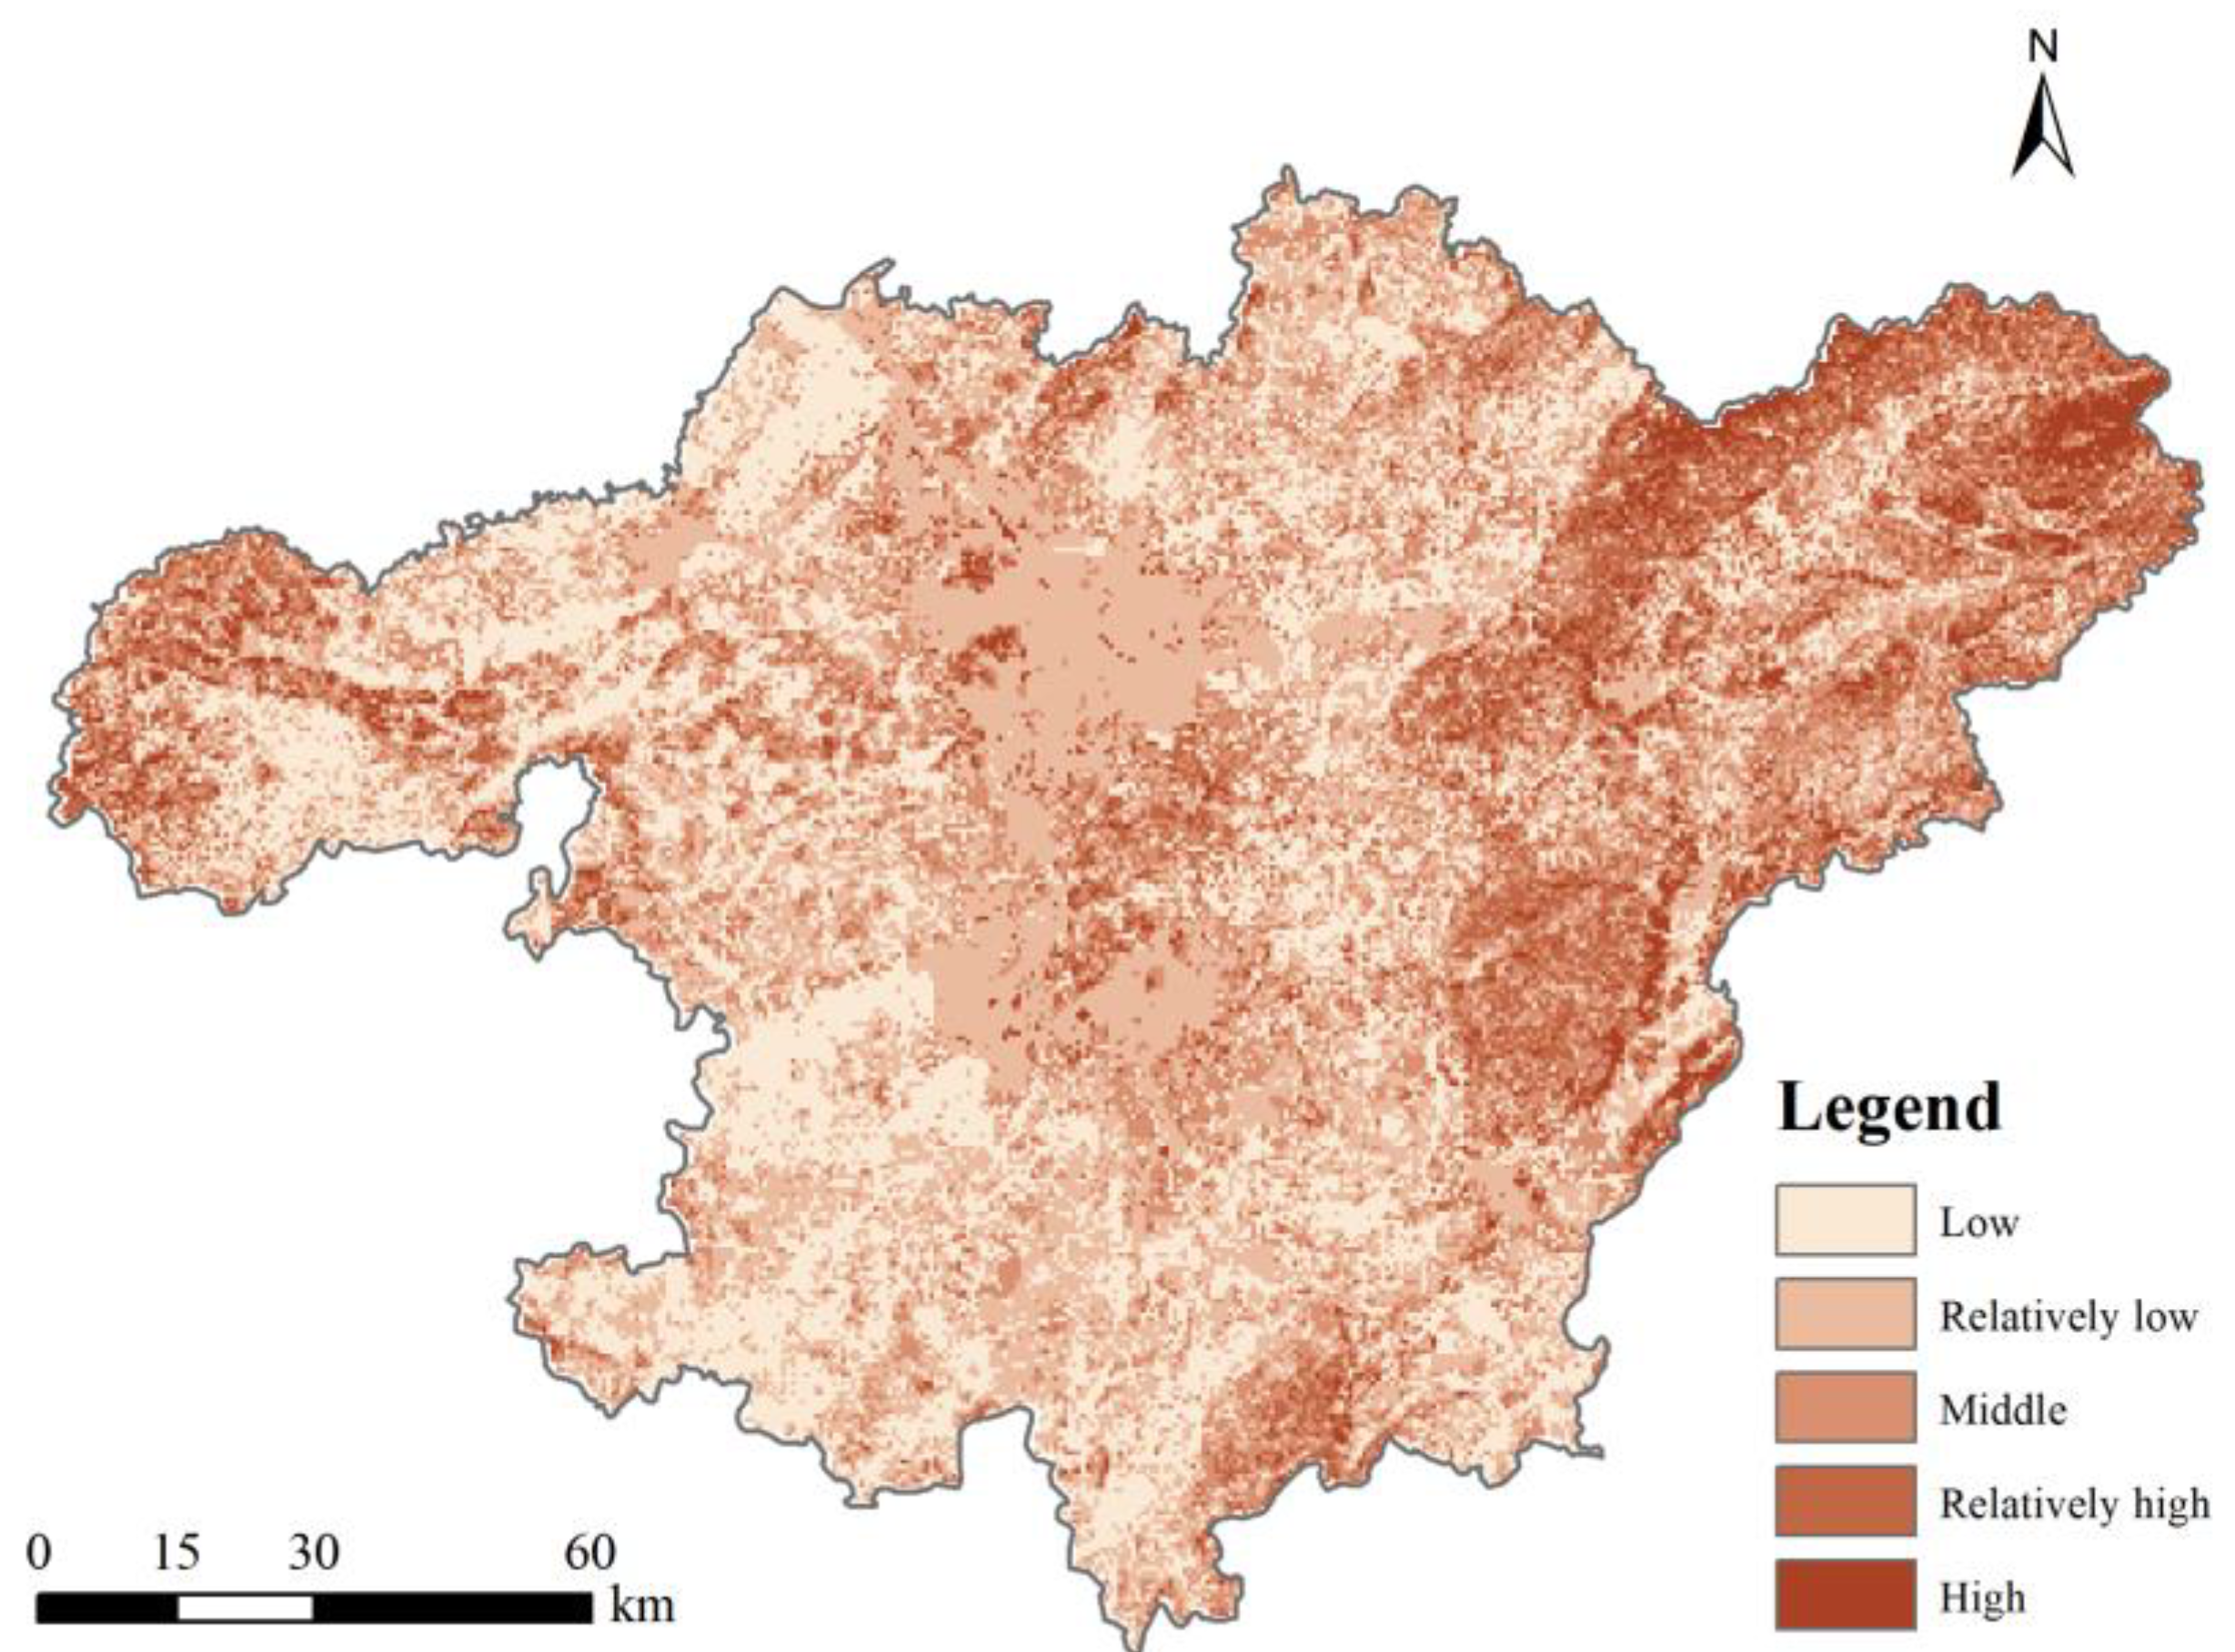
4.1.2. Spatial Distribution Pattern of Ecosystem Service Importance
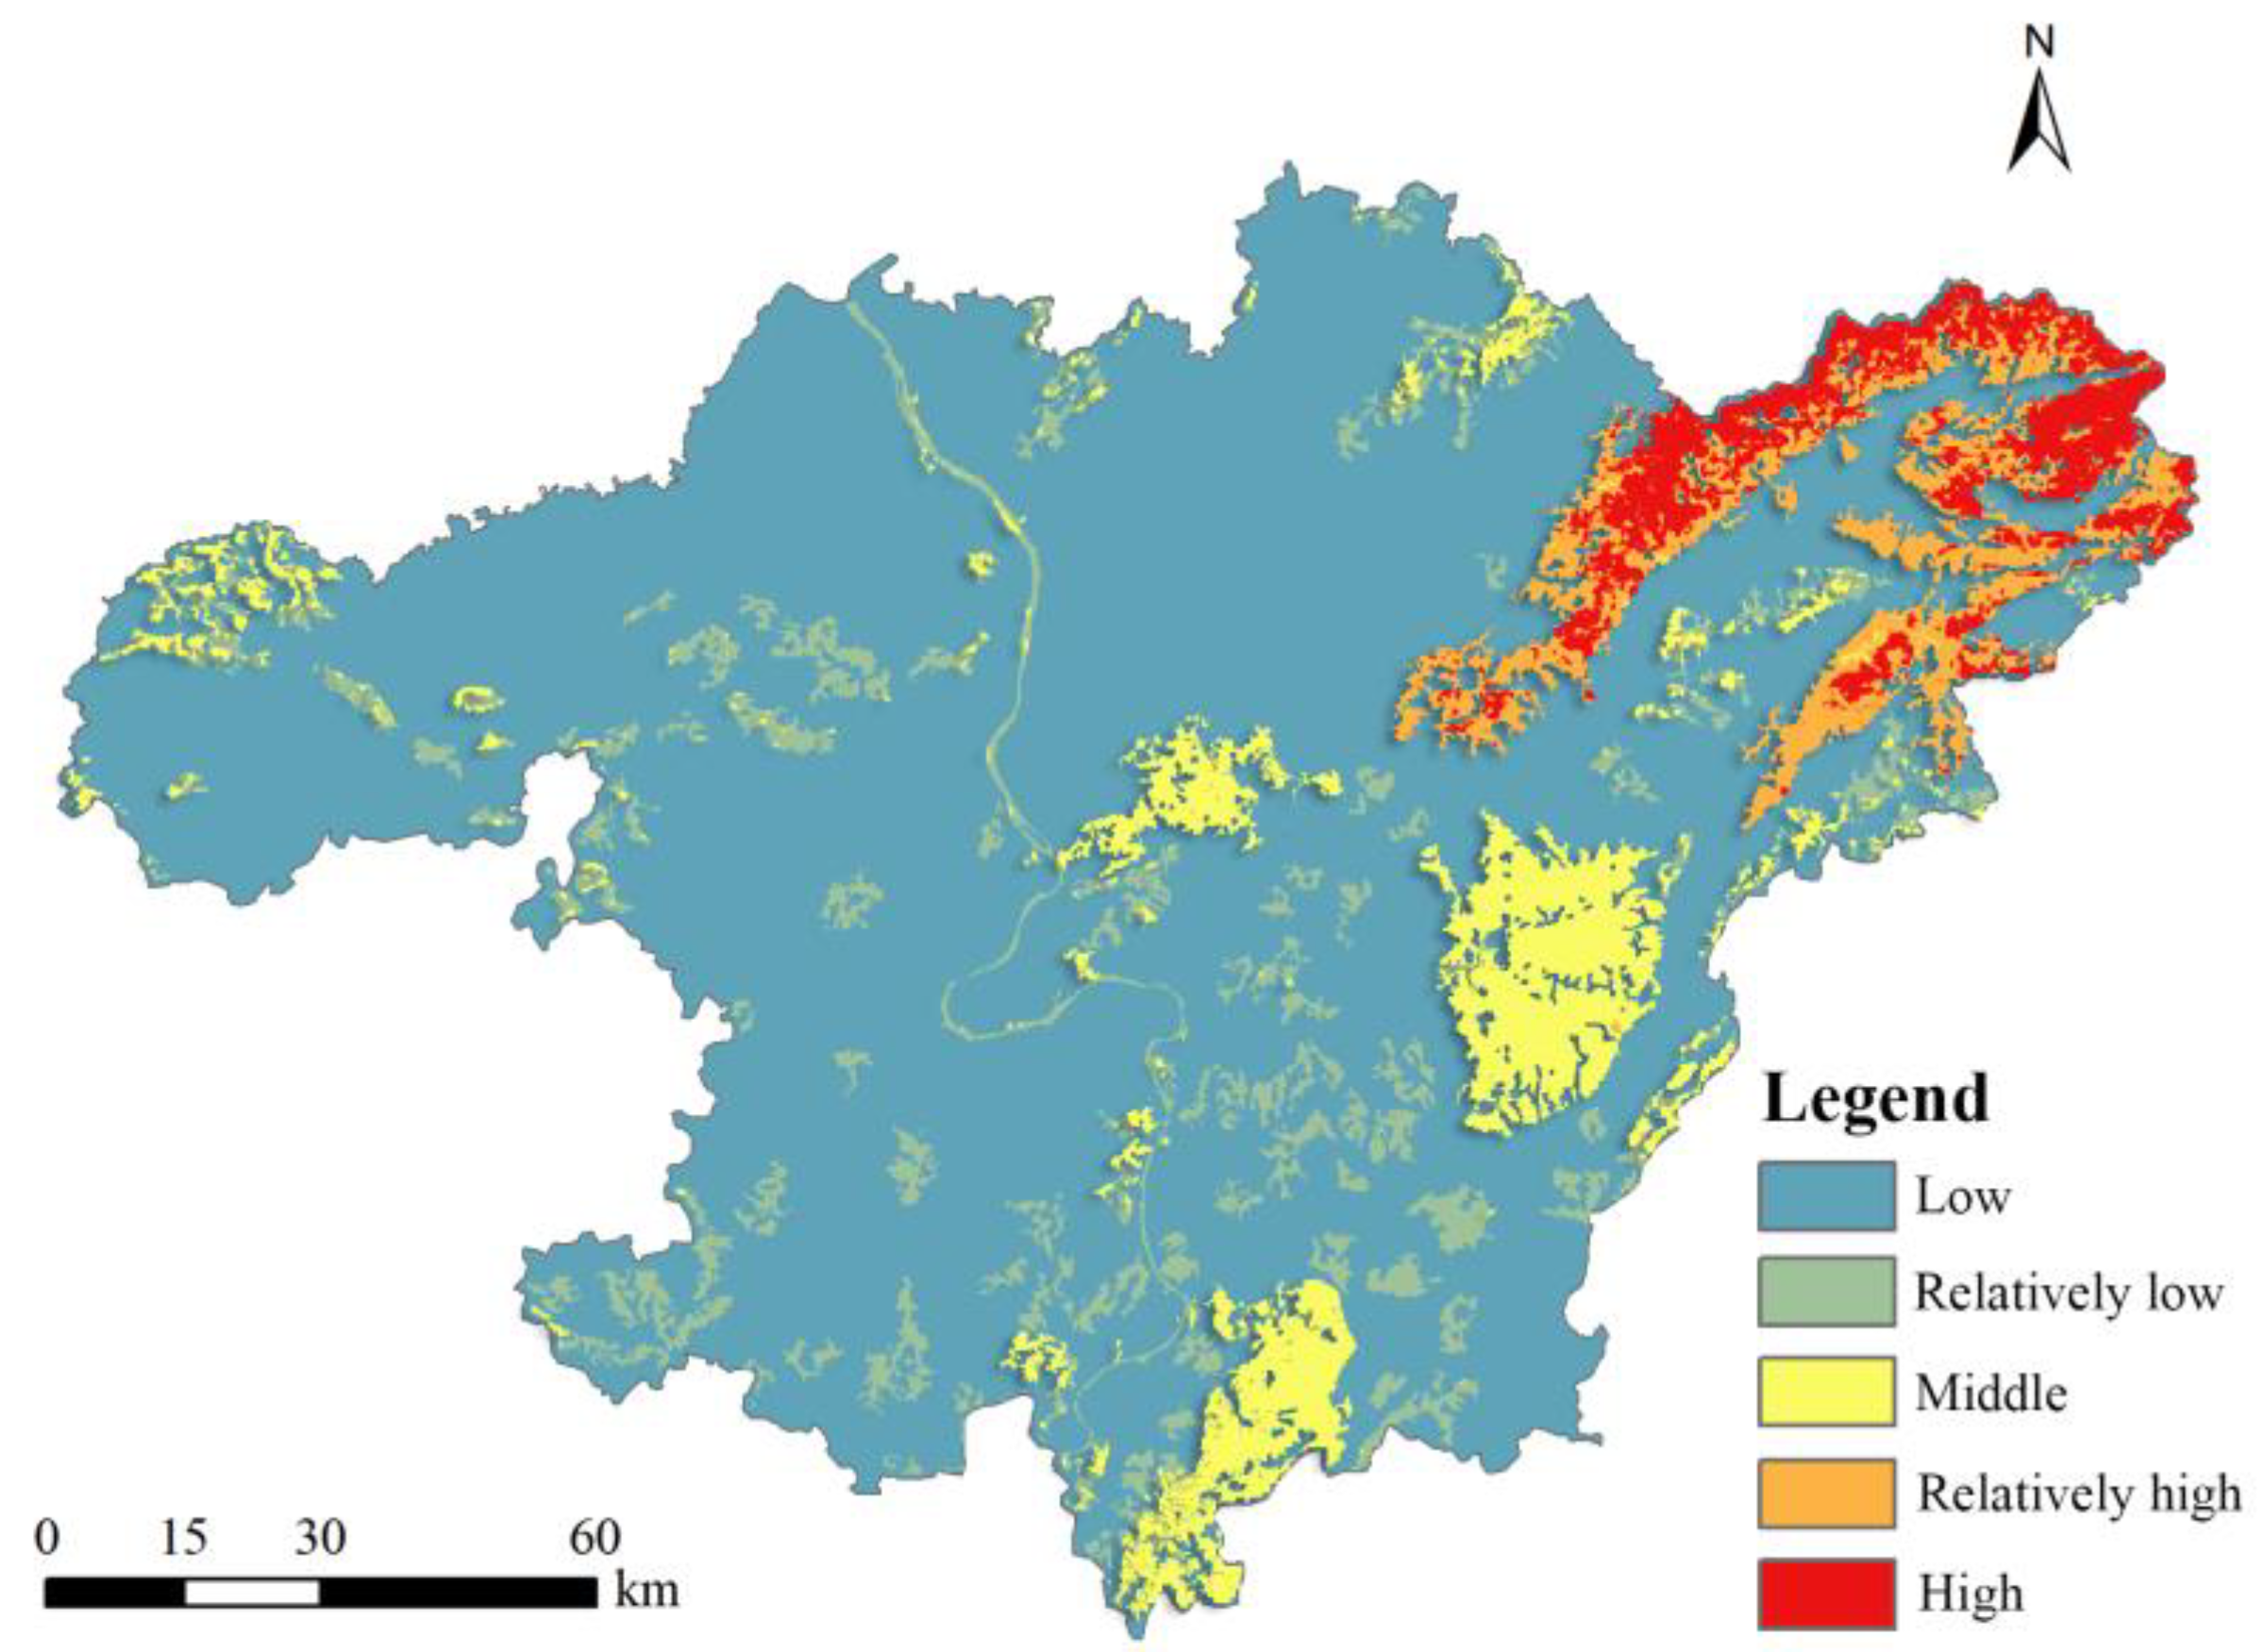
4.1.3. Spatial Distribution Pattern of Ecological Sensitivity
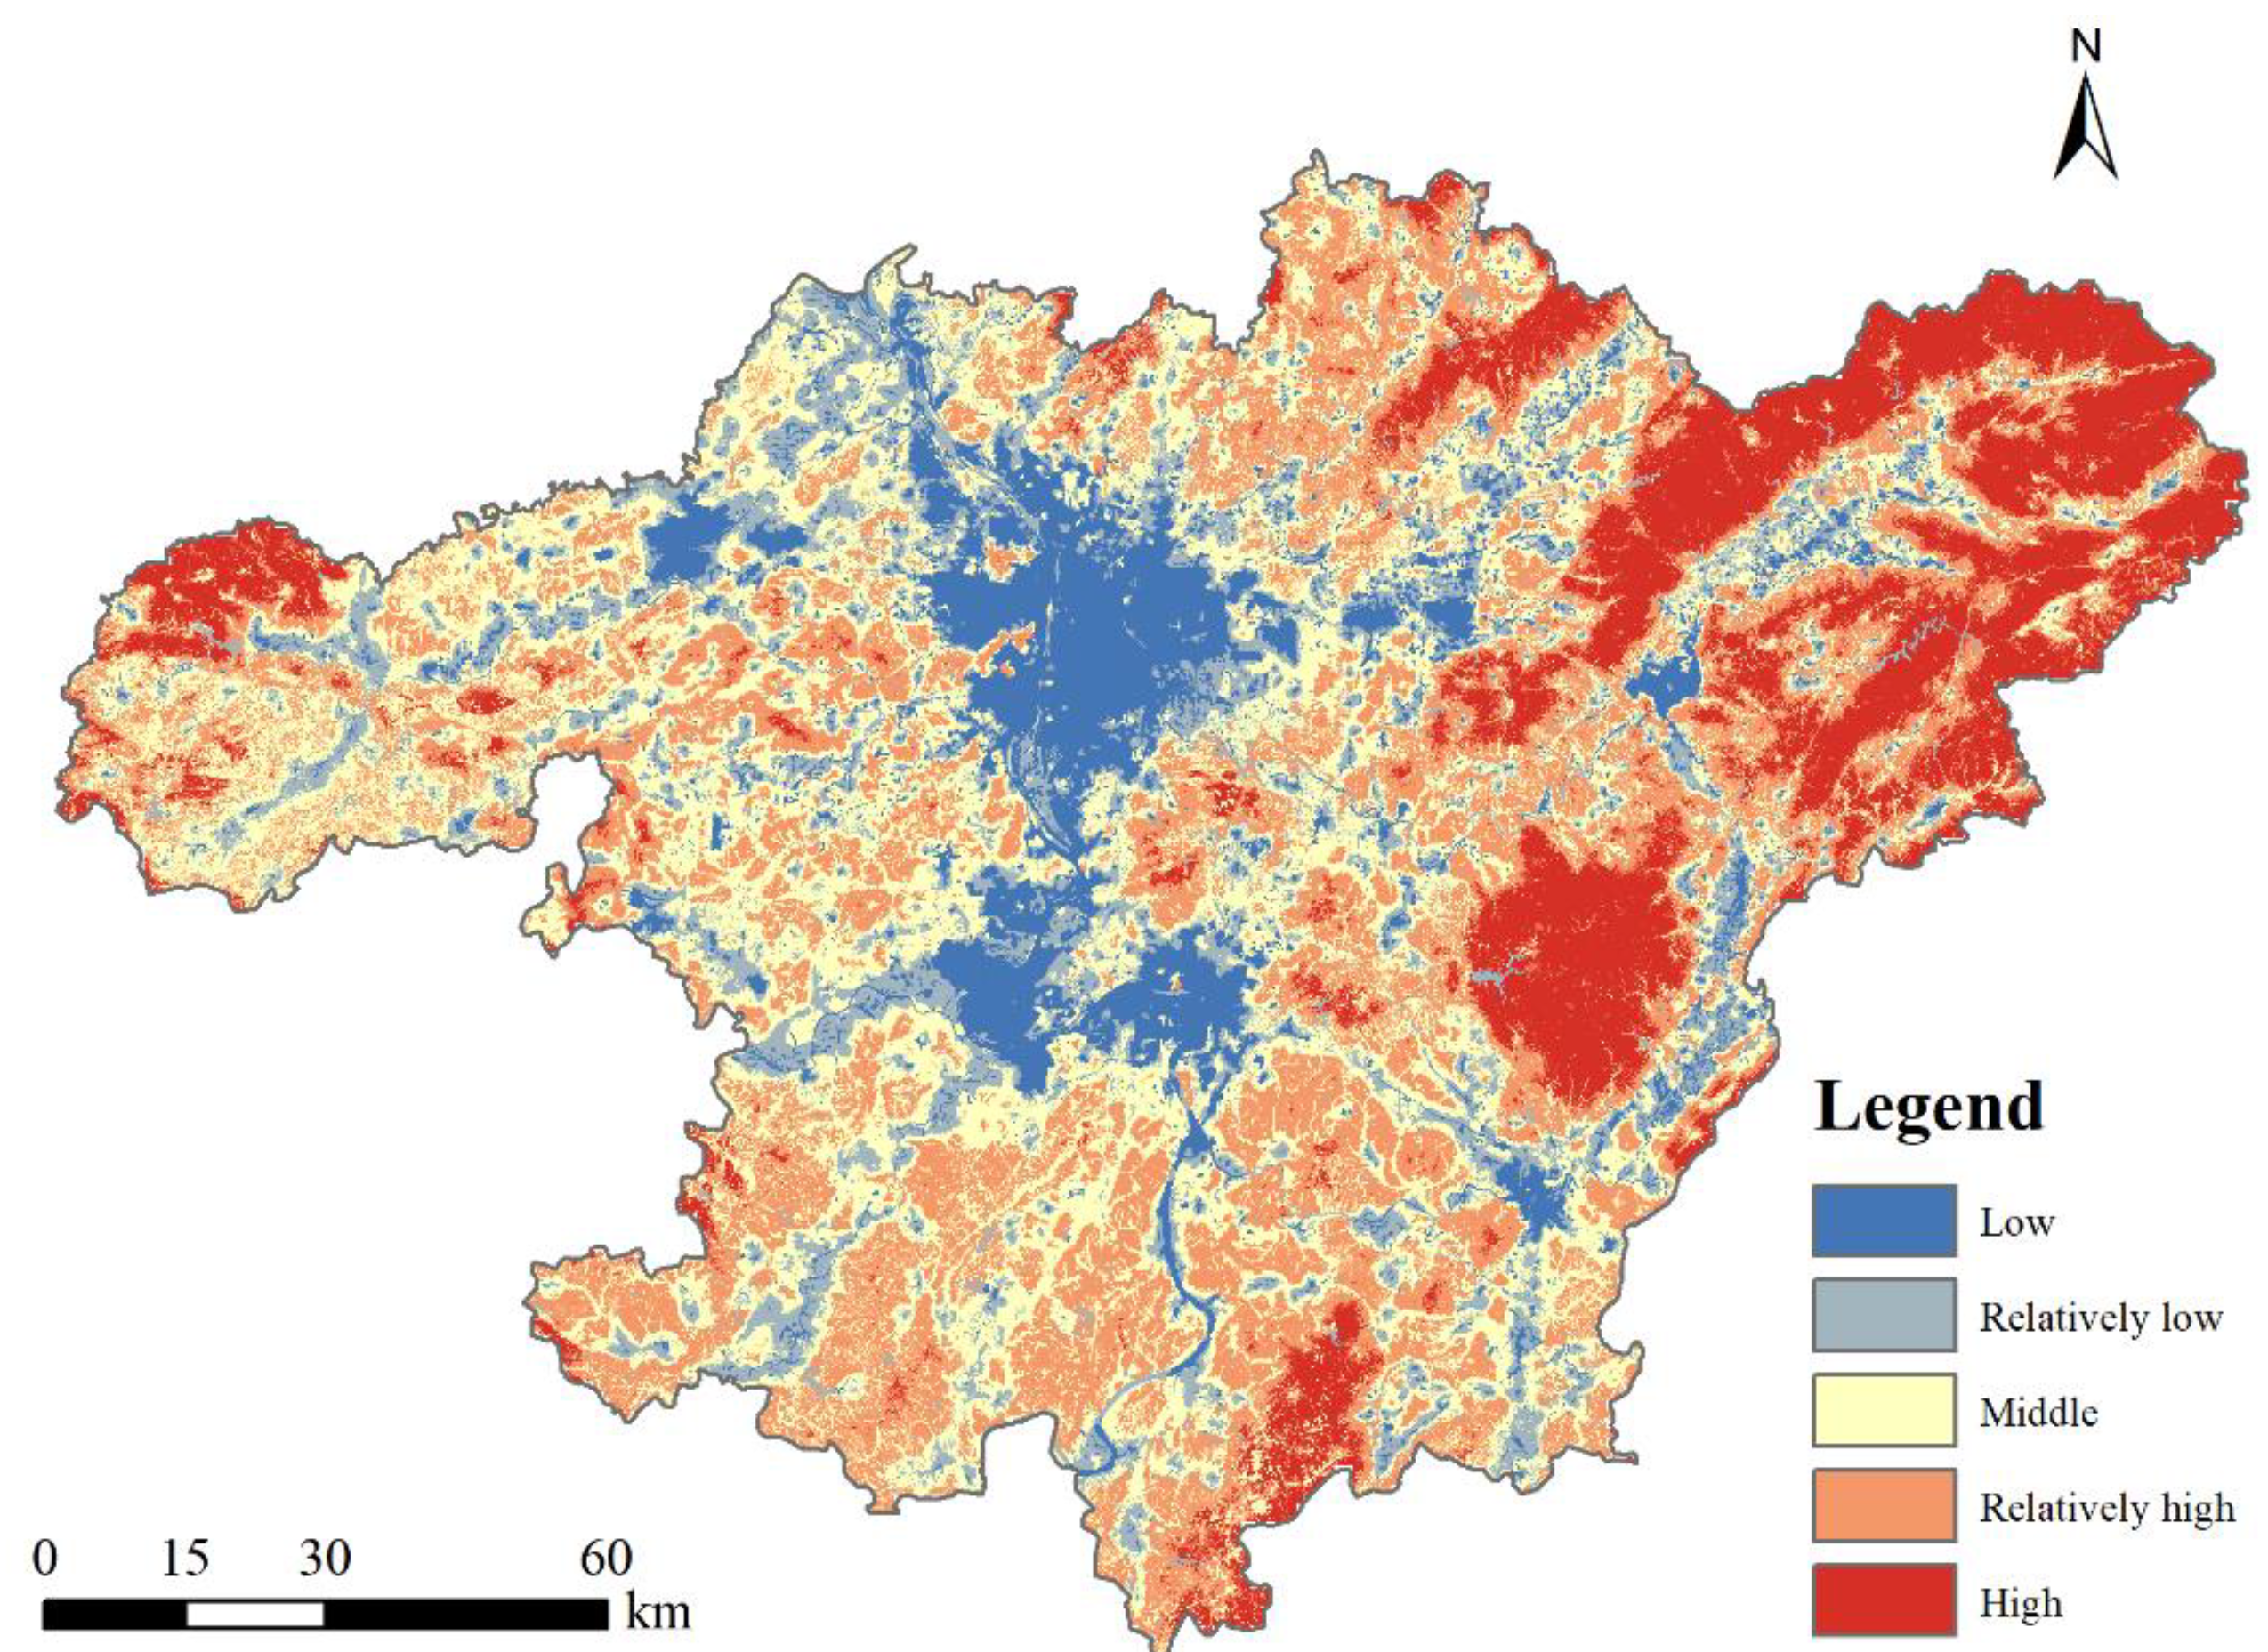
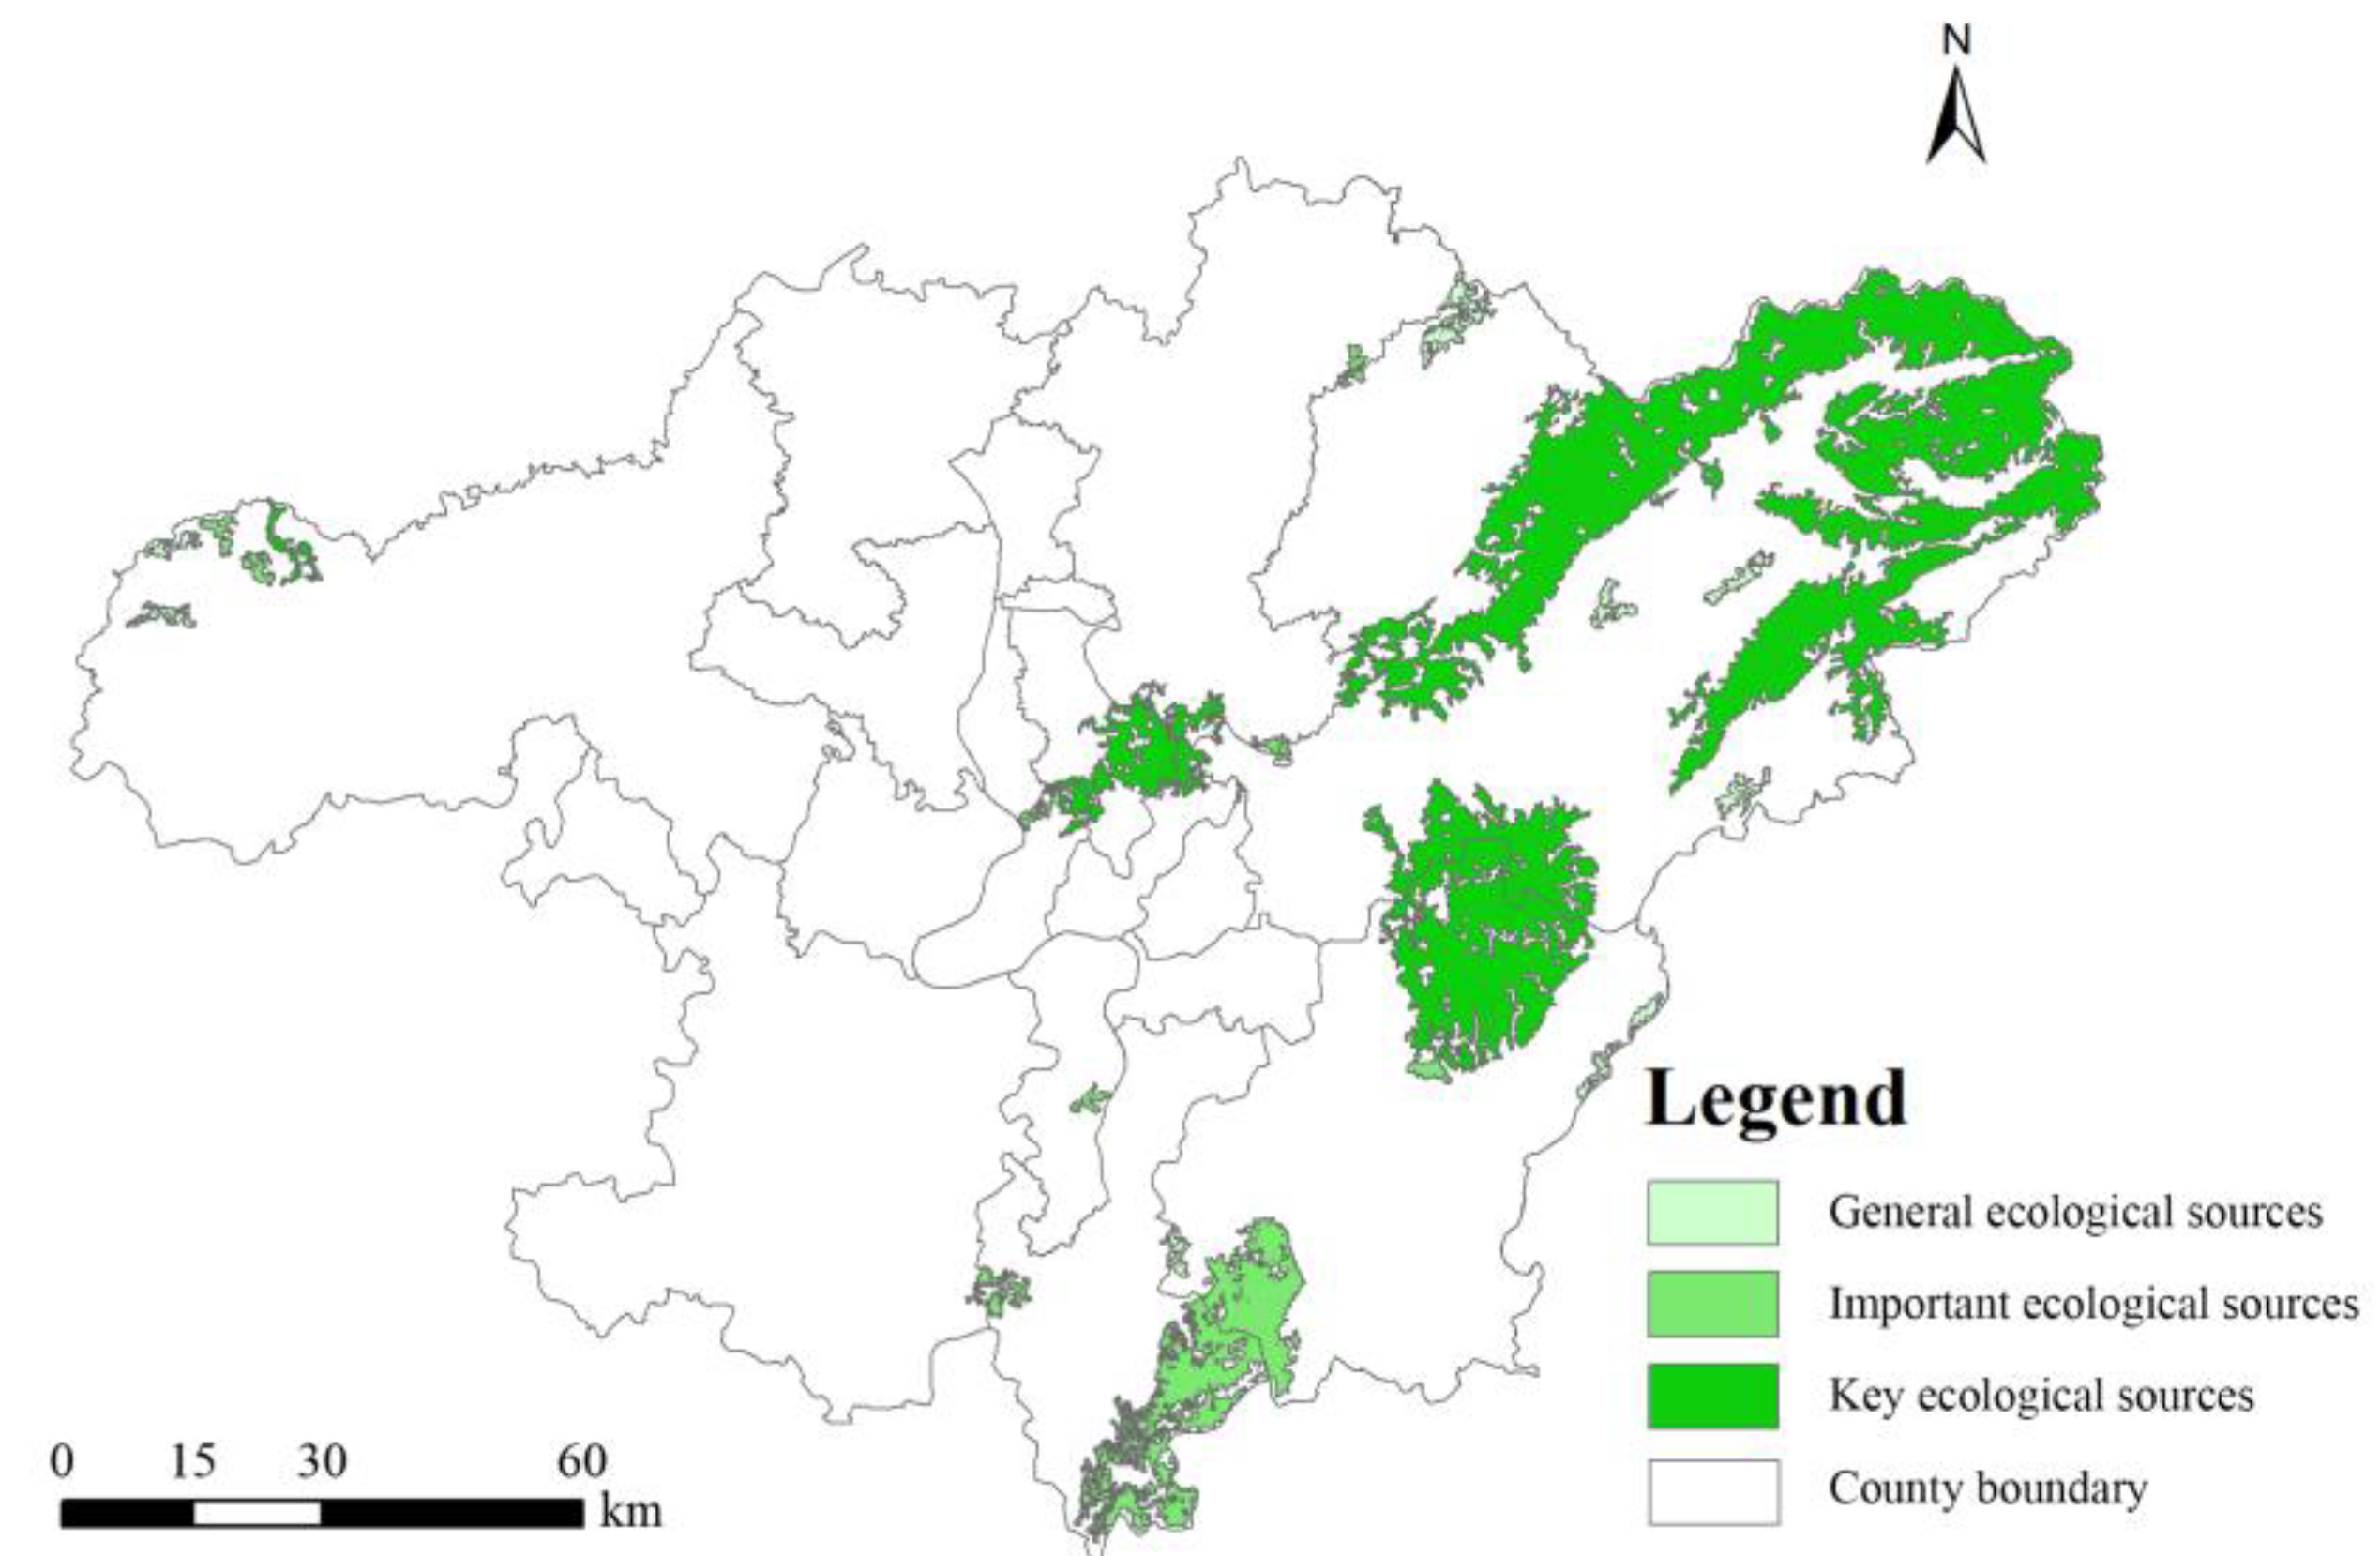
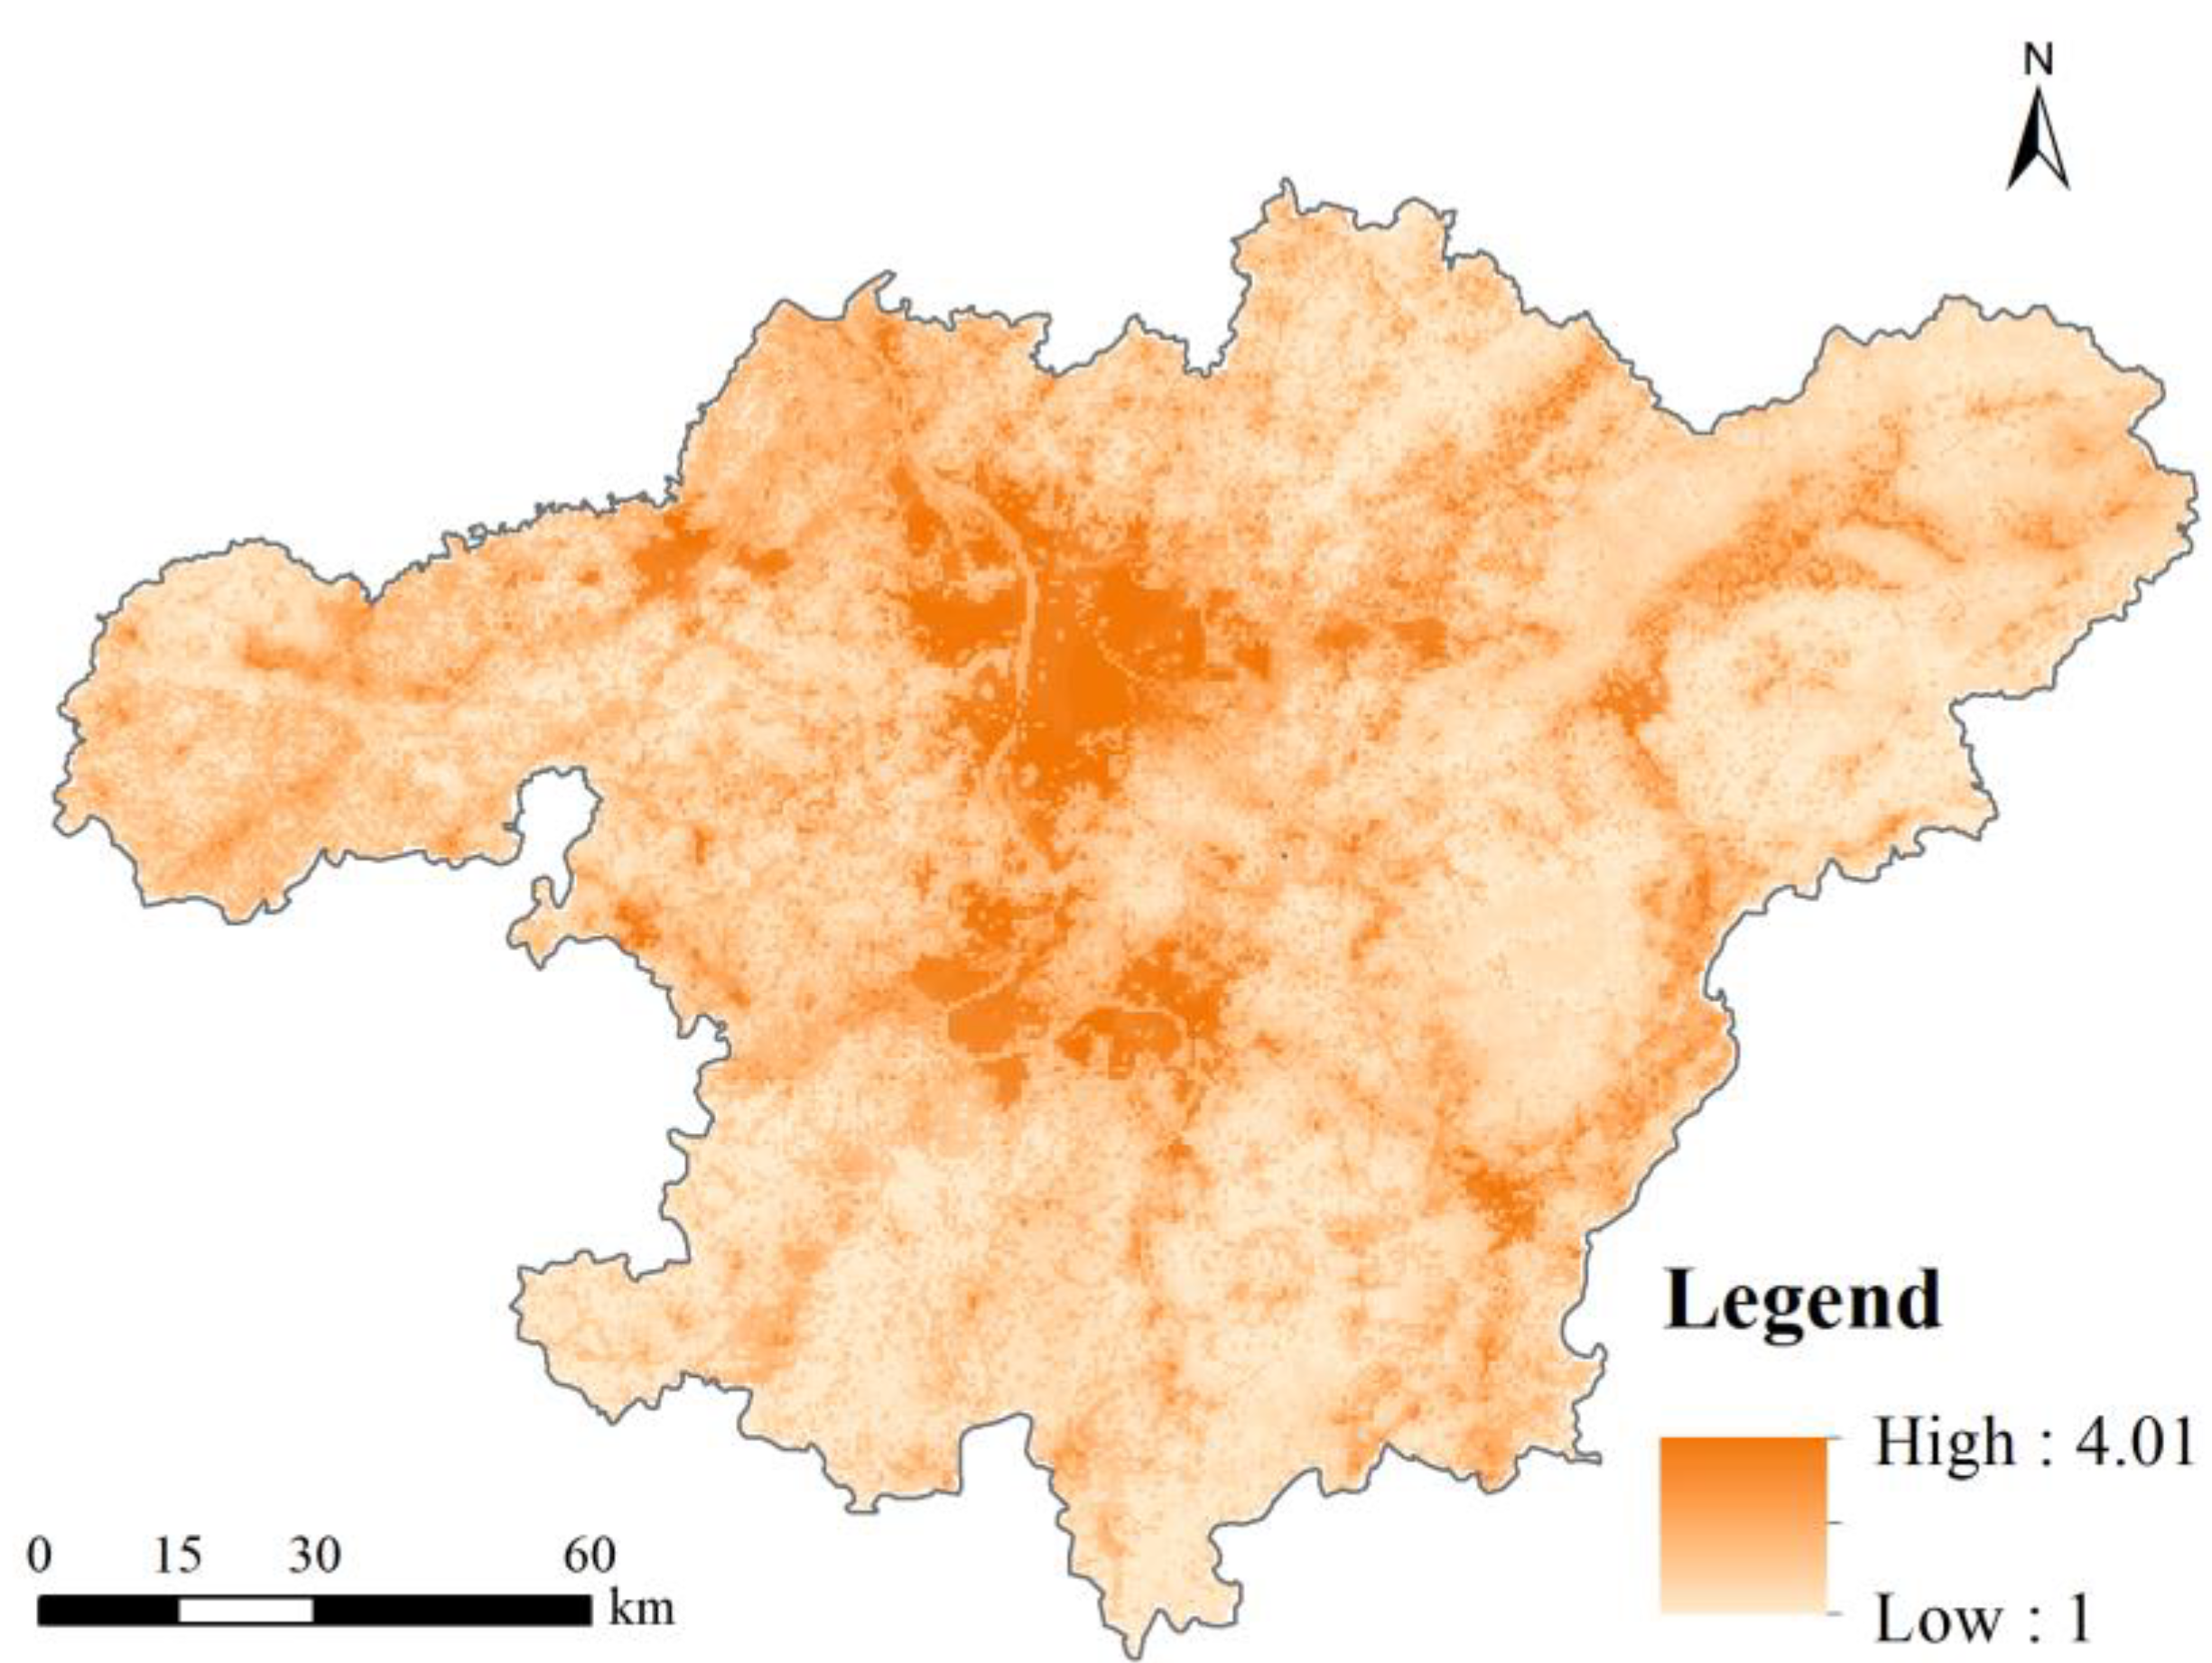
4.1.4. Comprehensive Result of ESE and Spatial Distribution of Ecological Sources
4.2. Resistance Surface and Spatial Pattern of Ecological Corridors
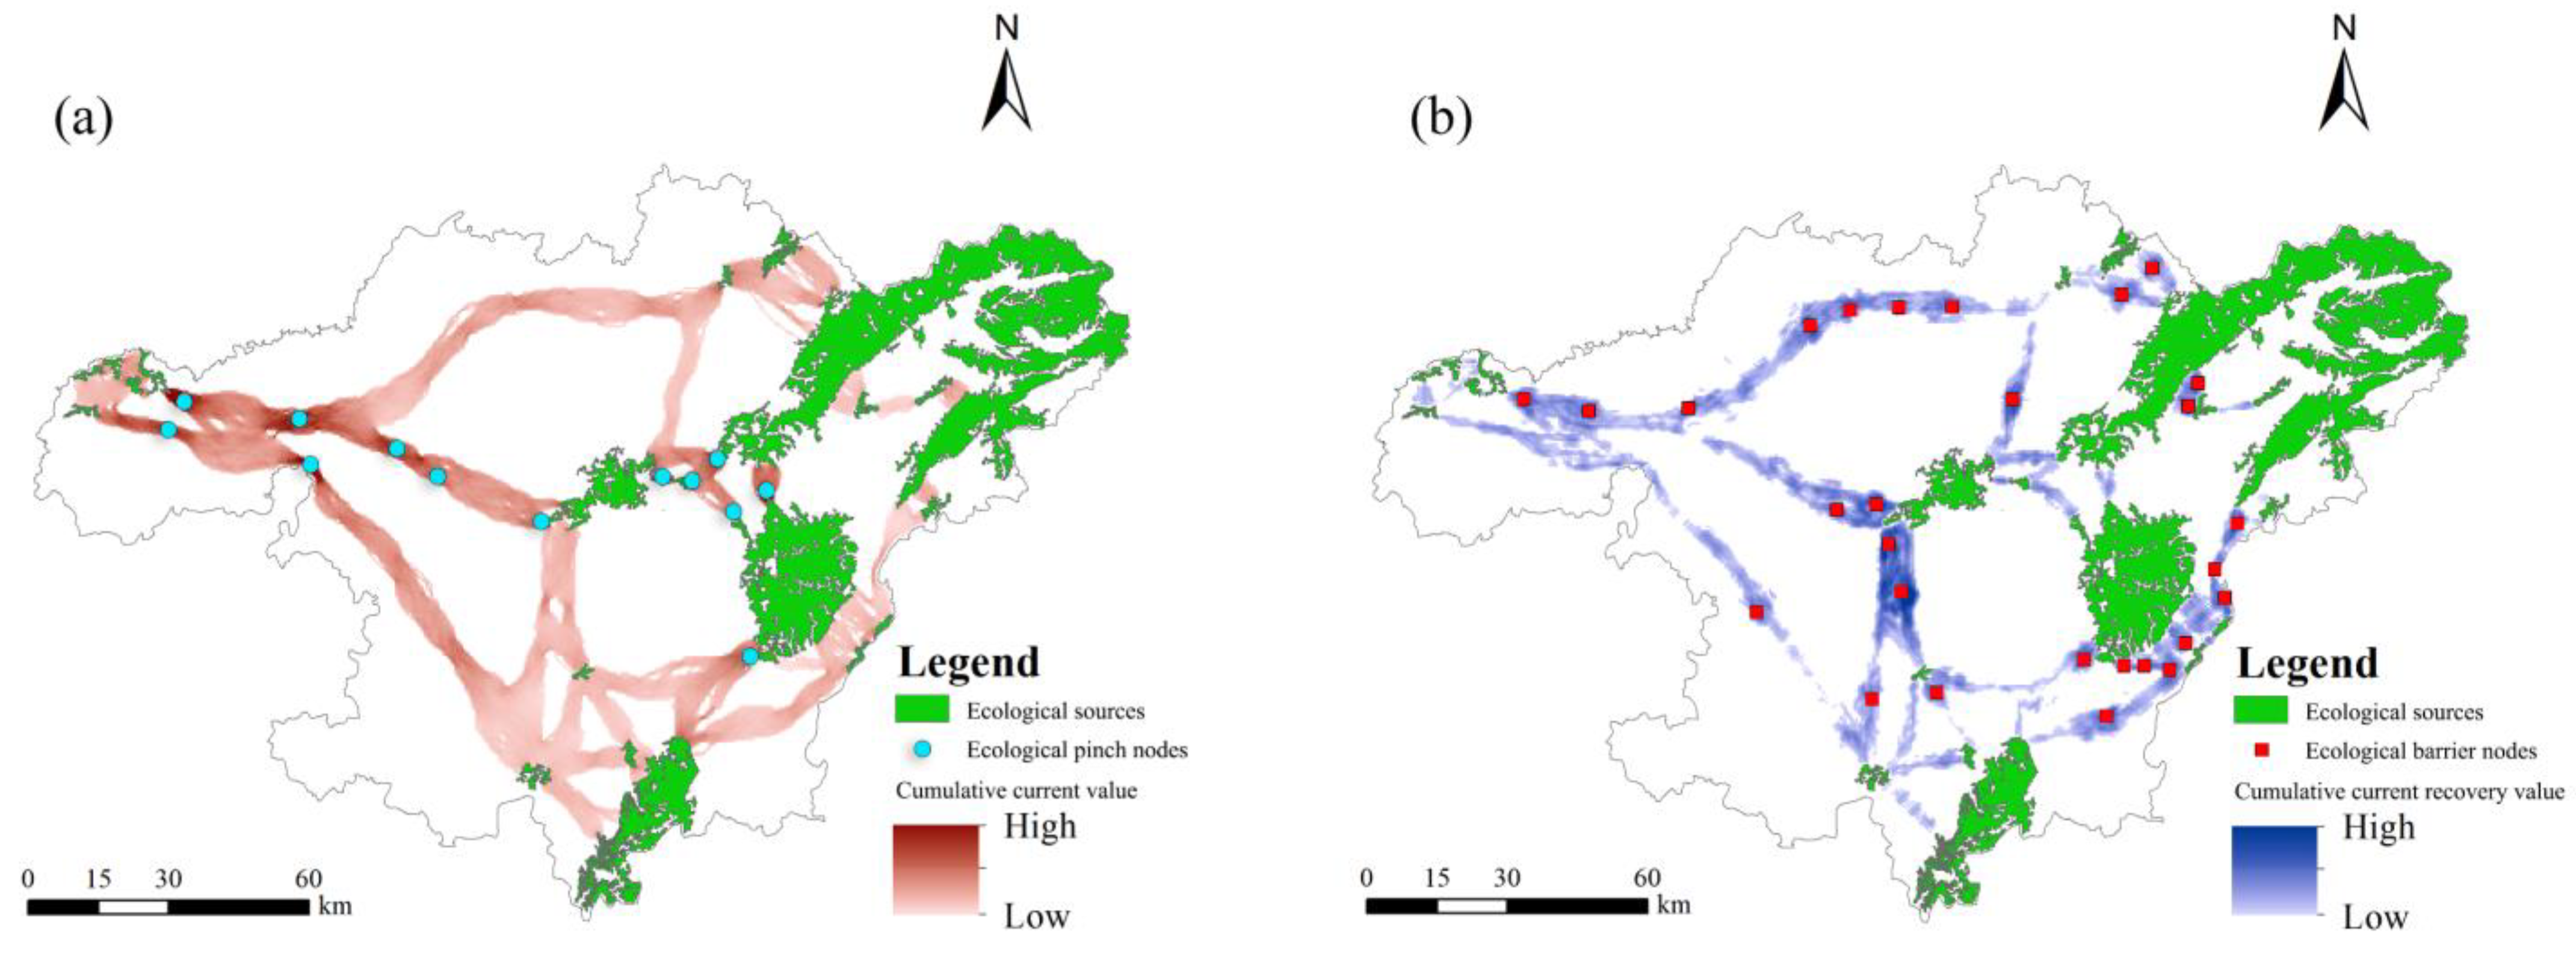
4.3. Spatial Distribution of Ecological Nodes
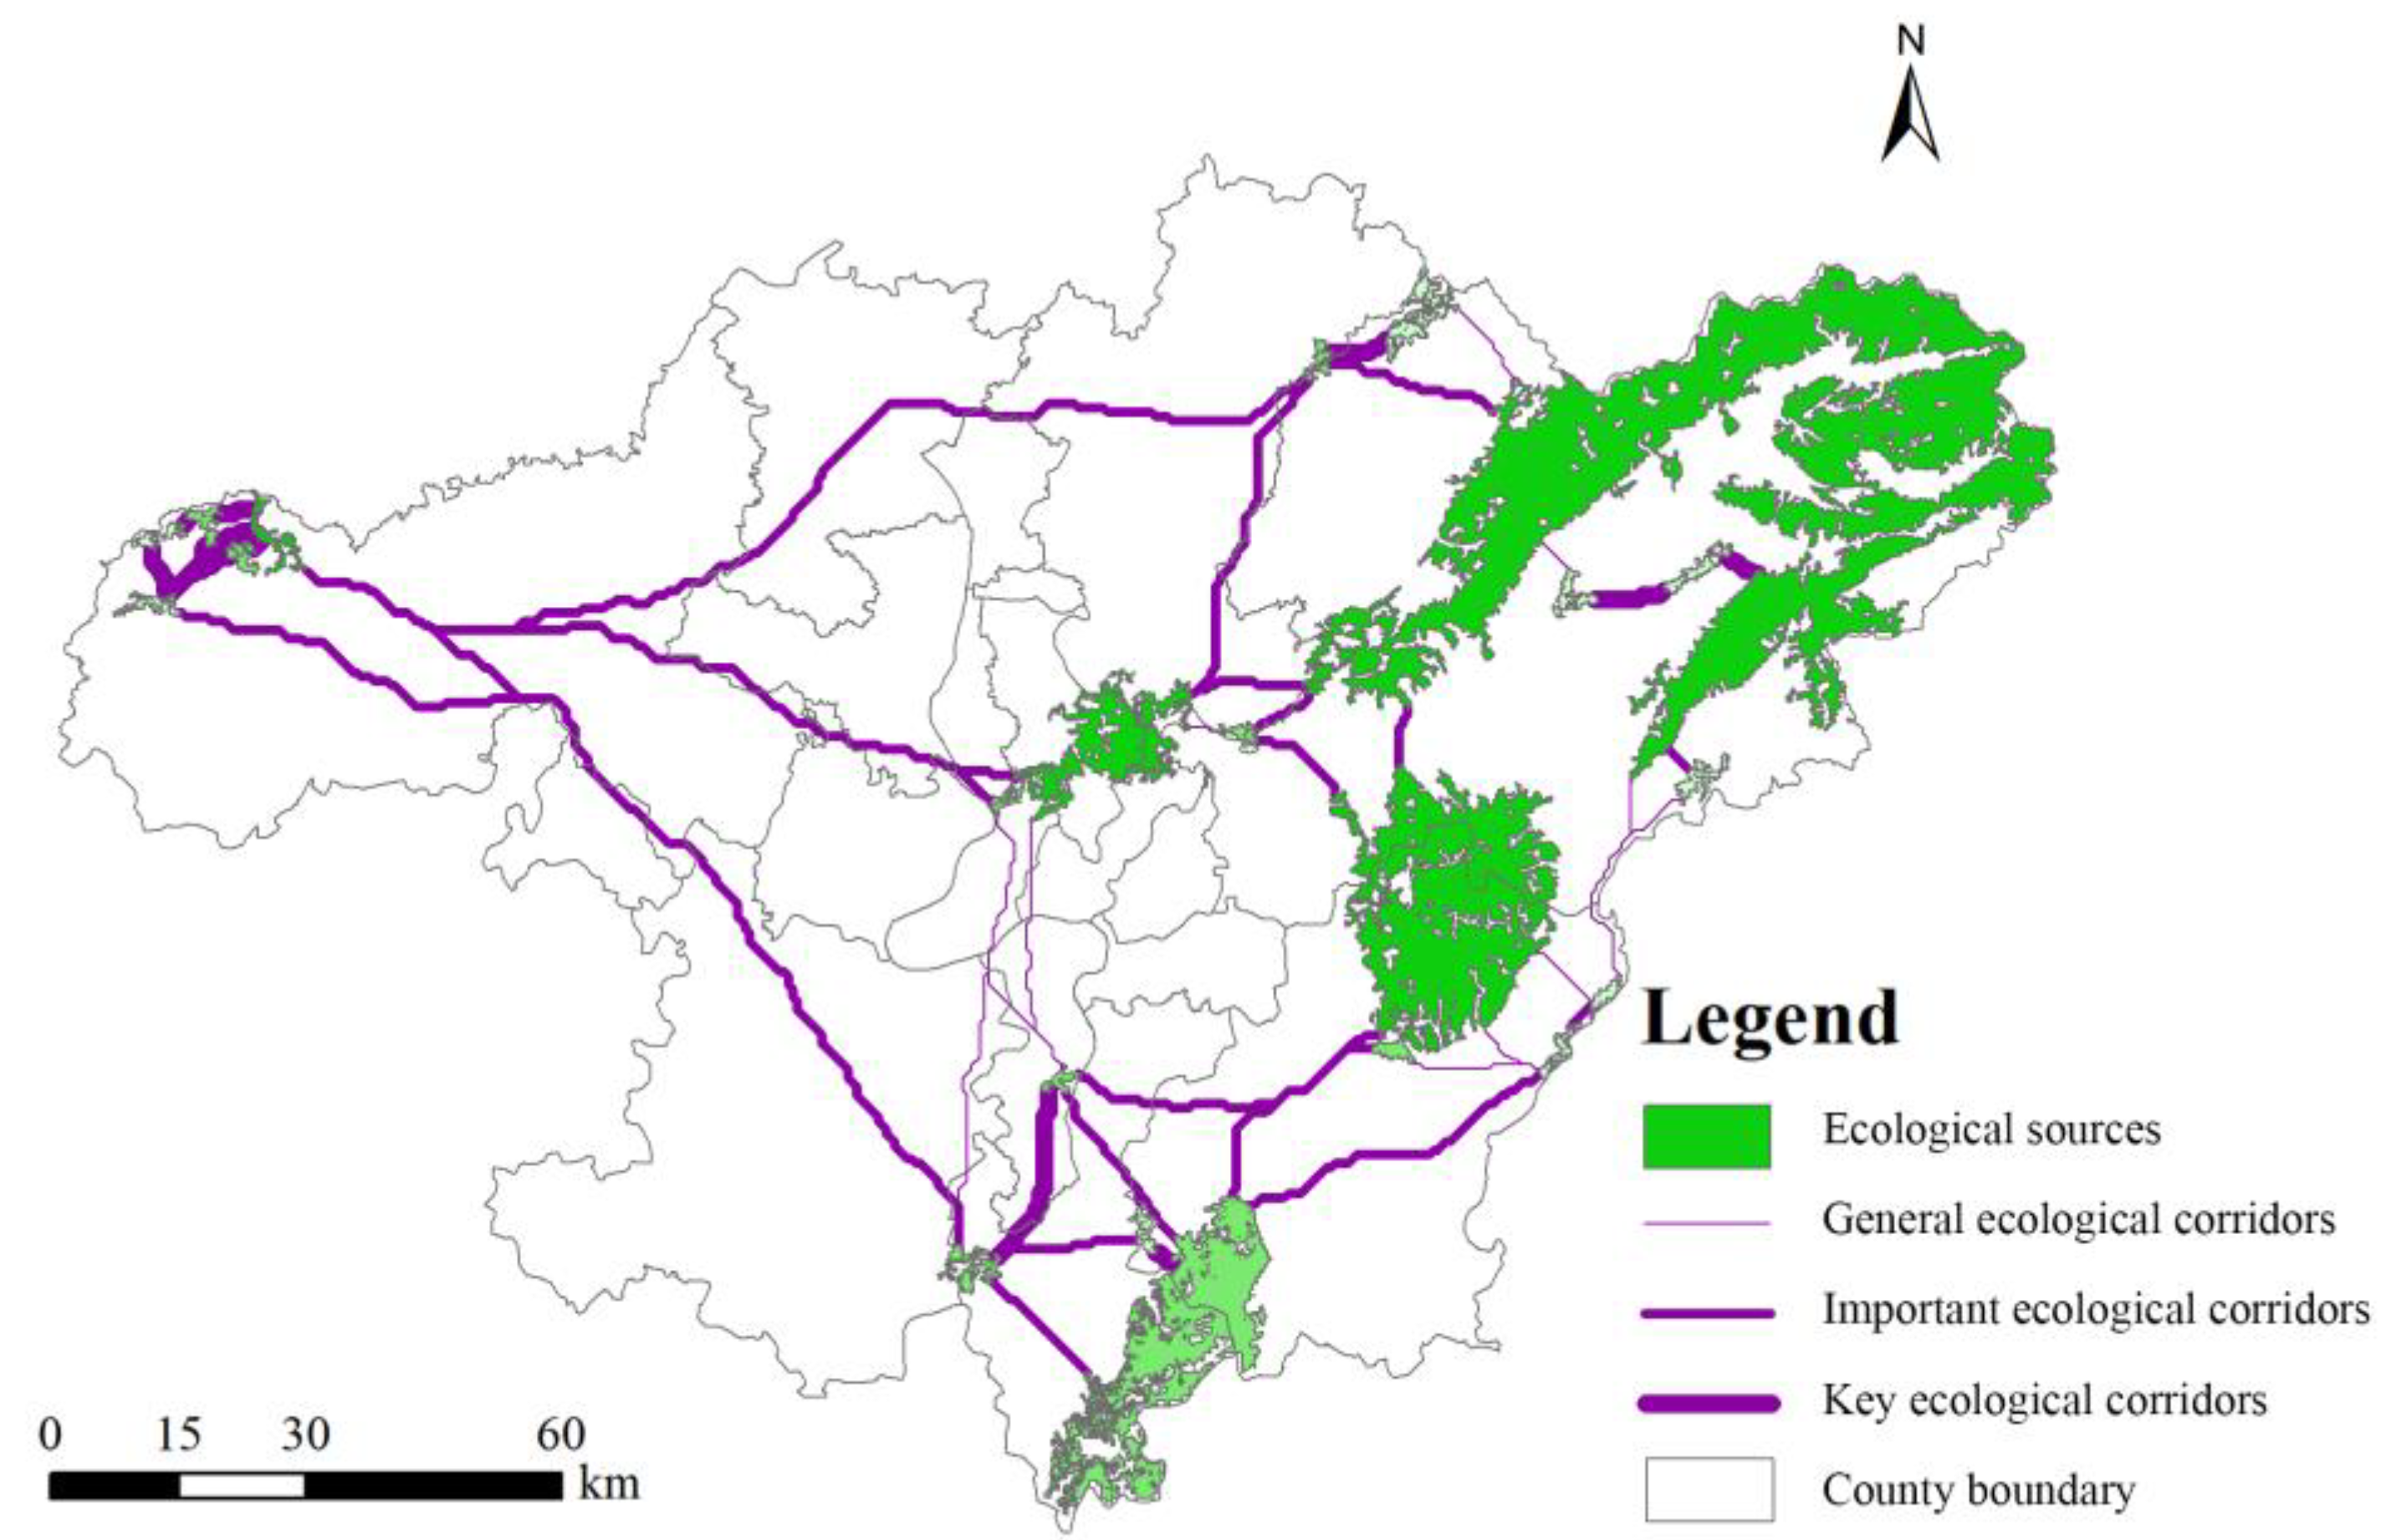
4.4. Construction of ESP
5. Discussion
5.1. The Rationality of ESP Construction
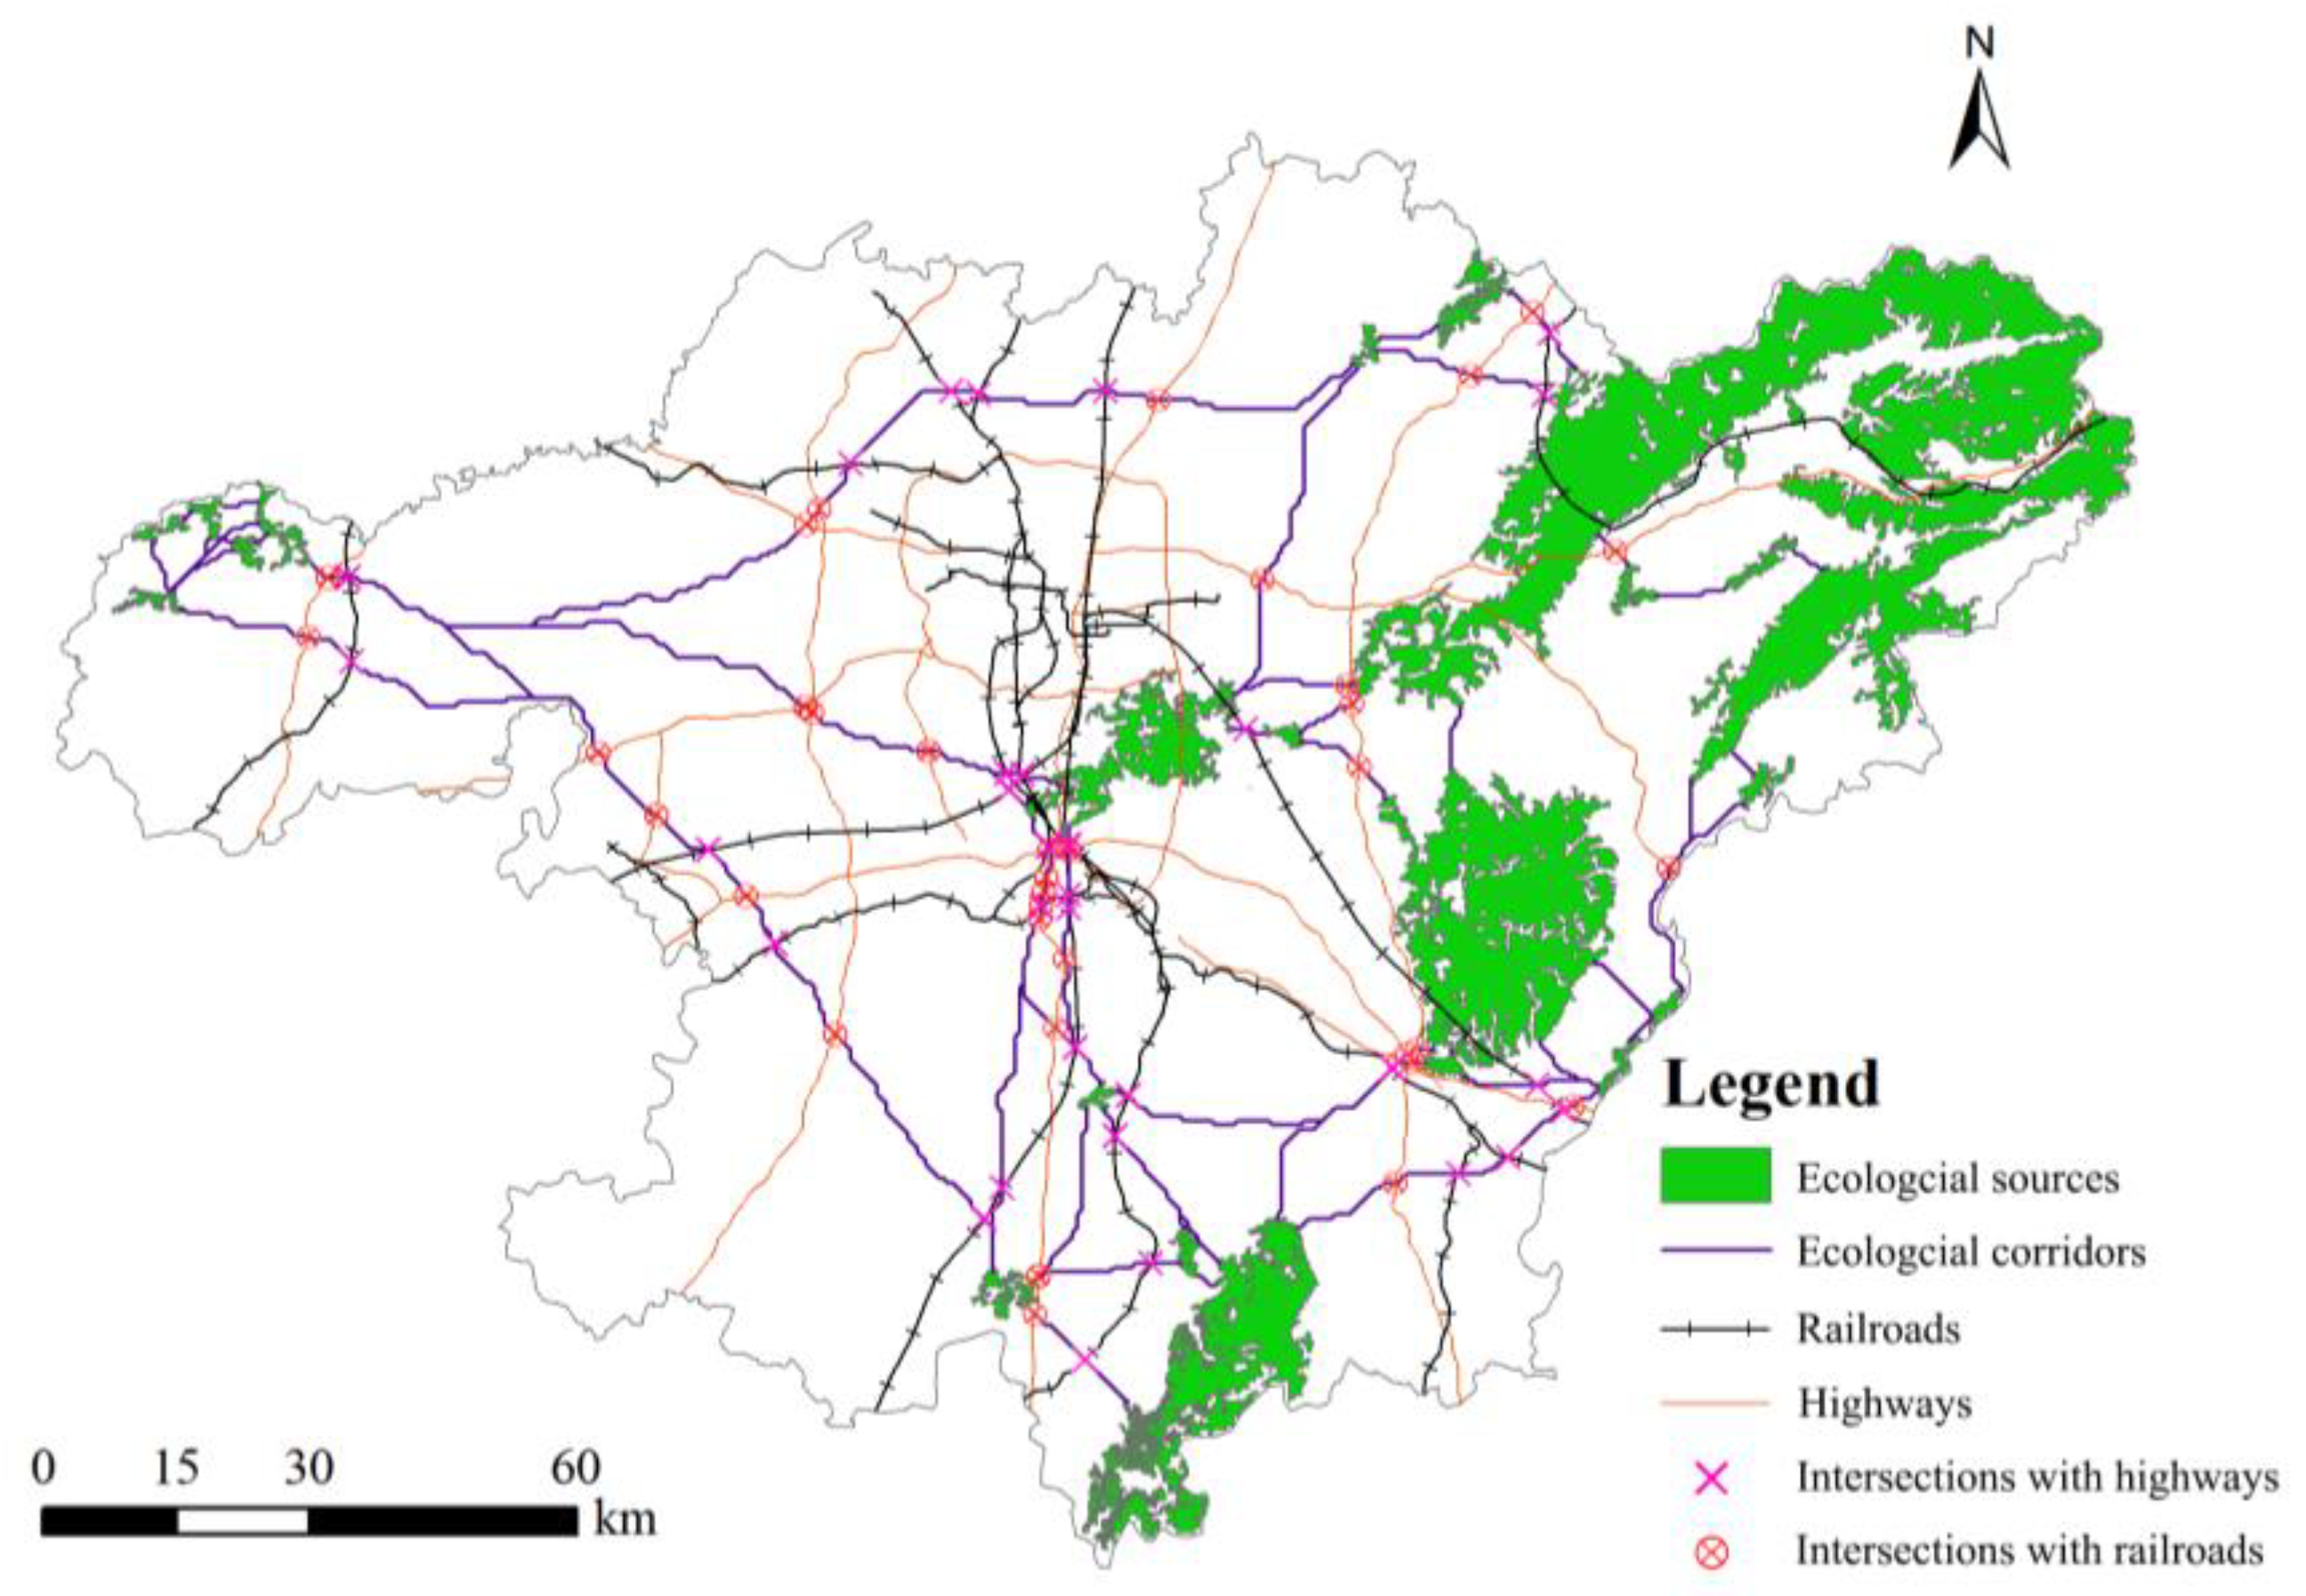
5.2. Suggestions for Optimizing ESP
5.3. Coordinated Mechanisms for Ecological Protection and Restoration
5.4. Limitations and Future Study Directions
6. Conclusions
- (1)
- Twenty-two ecological sources distributed heterogeneously from the eastern to western CZTMA, mainly consisting of woodlands, grasslands, and water bodies;
- (2)
- Forty-eight ecological corridors connected large-scale ecological patches such as rivers, lakes, wetlands, and woodlands in the CZTMA, and the average distance of the east side was shorter while the distance of the west side was longer;
- (3)
- Thirteen ecological pinch nodes and twenty-eight ecological barrier nodes were identified as important nodes.
Author Contributions
Funding
Data Availability Statement
Conflicts of Interest
References
- Peng, J.; Pan, Y.; Liu, Y.; Zhao, H.; Wang, Y. Linking Ecological Degradation Risk to Identify Ecological Security Patterns in a Rapidly Urbanizing Landscape. Habitat Int. 2018, 71, 110–124. [Google Scholar] [CrossRef]
- Montesino Pouzols, F.; Toivonen, T.; Di Minin, E.; Kukkala, A.S.; Kullberg, P.; Kuusterä, J.; Lehtomäki, J.; Tenkanen, H.; Verburg, P.H.; Moilanen, A. Global Protected Area Expansion Is Compromised by Projected Land-Use and Parochialism. Nature 2014, 516, 383–386. [Google Scholar] [CrossRef]
- Bai, Y.; Ochuodho, T.O.; Yang, J. Impact of Land Use and Climate Change on Water-Related Ecosystem Services in Kentucky, USA. Ecol. Indic. 2019, 102, 51–64. [Google Scholar] [CrossRef]
- Wu, J. Urban Ecology and Sustainability: The State-of-the-Science and Future Directions. Landsc. Urban Plan. 2014, 125, 209–221. [Google Scholar] [CrossRef]
- Wei, H.; Zhu, H.; Chen, J.; Jiao, H.; Li, P.; Xiong, L. Construction and Optimization of Ecological Security Pattern in the Loess Plateau of China Based on the Minimum Cumulative Resistance (MCR) Model. Remote Sens. 2022, 14, 5906. [Google Scholar] [CrossRef]
- Li, H.; Zhang, T.; Cao, X.-S.; Zhang, Q.-Q. Establishing and Optimizing the Ecological Security Pattern in Shaanxi Province (China) for Ecological Restoration of Land Space. Forests 2022, 13, 766. [Google Scholar] [CrossRef]
- Li, Y.; Liu, W.; Feng, Q.; Zhu, M.; Yang, L.; Zhang, J.; Yin, X. The Role of Land Use Change in Affecting Ecosystem Services and the Ecological Security Pattern of the Hexi Regions, Northwest China. Sci. Total Environ. 2023, 855, 158940. [Google Scholar] [CrossRef]
- Yu, K. Security Patterns and Surface Model in Landscape Ecological Planning. Landsc. Urban Plan. 1996, 36, 1–17. [Google Scholar] [CrossRef]
- Hepcan, Ş.; Hepcan, Ç.C.; Bouwma, I.M.; Jongman, R.H.G.; Özkan, M.B. Ecological Networks as a New Approach for Nature Conservation in Turkey: A Case Study of İzmir Province. Landsc. Urban Plan. 2009, 90, 143–154. [Google Scholar] [CrossRef]
- Fan, F.; Liu, Y.; Chen, J.; Dong, J. Scenario-Based Ecological Security Patterns to Indicate Landscape Sustainability: A Case Study on the Qinghai-Tibet Plateau. Landsc. Ecol. 2021, 36, 2175–2188. [Google Scholar] [CrossRef]
- Wang, Z.; Shi, P.; Zhang, X.; Tong, H.; Zhang, W.; Liu, Y. Research on Landscape Pattern Construction and Ecological Restoration of Jiuquan City Based on Ecological Security Evaluation. Sustainability 2021, 13, 5732. [Google Scholar] [CrossRef]
- Kong, F.; Yin, H.; Nakagoshi, N.; Zong, Y. Urban Green Space Network Development for Biodiversity Conservation: Identification Based on Graph Theory and Gravity Modeling. Landsc. Urban Plan. 2010, 95, 16–27. [Google Scholar] [CrossRef]
- Wei, Q.; Halike, A.; Yao, K.; Chen, L.; Balati, M. Construction and Optimization of Ecological Security Pattern in Ebinur Lake Basin Based on MSPA-MCR Models. Ecol. Indic. 2022, 138, 108857. [Google Scholar] [CrossRef]
- Hu, C.; Wang, Z.; Huang, G.; Ding, Y. Construction, Evaluation, and Optimization of a Regional Ecological Security Pattern Based on MSPA–Circuit Theory Approach. Int. J. Environ. Res. Public Health 2022, 19, 16184. [Google Scholar] [CrossRef]
- Peng, J.; Yang, Y.; Liu, Y.; Hu, Y.; Du, Y.; Meersmans, J.; Qiu, S. Linking Ecosystem Services and Circuit Theory to Identify Ecological Security Patterns. Sci. Total Environ. 2018, 644, 781–790. [Google Scholar] [CrossRef]
- Wang, Y.; Zhang, L.; Song, Y. Study on the Construction of the Ecological Security Pattern of the Lancang River Basin (Yunnan Section) Based on InVEST-MSPA-Circuit Theory. Sustainability 2023, 15, 477. [Google Scholar] [CrossRef]
- Xu, X.; Wang, S.; Yan, G.; He, X. Ecological Security Assessment Based on the “Importance–Sensitivity–Connectivity” Index and Pattern Construction: A Case Study of Xiliu Ditch in the Yellow River Basin, China. Land 2023, 12, 1296. [Google Scholar] [CrossRef]
- Wang, S.; Huang, Y.; Jiang, X.; Wang, T.; Jin, Y. Identification and Optimization of Ecological Security Patterns in the Xiangyang Metropolitan Area. IEEE J. Sel. Top. Appl. Earth Obs. Remote Sens. 2023, 16, 8671–8679. [Google Scholar] [CrossRef]
- Yang, Y.; Chen, J.; Huang, R.; Feng, Z.; Zhou, G.; You, H.; Han, X. Construction of Ecological Security Pattern Based on the Importance of Ecological Protection—A Case Study of Guangxi, a Karst Region in China. Int. J. Environ. Res. Public Health 2022, 19, 5699. [Google Scholar] [CrossRef]
- Li, Y.; Zhao, J.; Yuan, J.; Ji, P.; Deng, X.; Yang, Y. Constructing the Ecological Security Pattern of Nujiang Prefecture Based on the Framework of “Importance–Sensitivity–Connectivity”. Int. J. Environ. Res. Public Health 2022, 19, 10869. [Google Scholar] [CrossRef] [PubMed]
- Gurrutxaga, M.; Rubio, L.; Saura, S. Key Connectors in Protected Forest Area Networks and the Impact of Highways: A Transnational Case Study from the Cantabrian Range to the Western Alps (SW Europe). Landsc. Urban Plan. 2011, 101, 310–320. [Google Scholar] [CrossRef]
- Wei, S.; Pan, J.; Liu, X. Landscape Ecological Safety Assessment and Landscape Pattern Optimization in Arid Inland River Basin: Take Ganzhou District as an Example. Hum. Ecol. Risk Assess. Int. J. 2020, 26, 782–806. [Google Scholar] [CrossRef]
- Xu, J.; Fan, F.; Liu, Y.; Dong, J.; Chen, J. Construction of Ecological Security Patterns in Nature Reserves Based on Ecosystem Services and Circuit Theory: A Case Study in Wenchuan, China. Int. J. Environ. Res. Public Health 2019, 16, 3220. [Google Scholar] [CrossRef] [PubMed]
- Dilts, T.E.; Weisberg, P.J.; Leitner, P.; Matocq, M.D.; Inman, R.D.; Nussear, K.E.; Esque, T.C. Multiscale Connectivity and Graph Theory Highlight Critical Areas for Conservation under Climate Change. Ecol. Appl. 2016, 26, 1223–1237. [Google Scholar] [CrossRef]
- Liu, X.; Su, Y.; Li, Z.; Zhang, S. Constructing Ecological Security Patterns Based on Ecosystem Services Trade-Offs and Ecological Sensitivity: A Case Study of Shenzhen Metropolitan Area, China. Ecol. Indic. 2023, 154, 110626. [Google Scholar] [CrossRef]
- Jiang, J.; Abulizi, A.; Abliz, A.; Zayiti, A.; Akbar, A.; Ou, B. Construction of Landscape Ecological Security Pattern in the Zhundong Region, Xinjiang, NW China. Int. J. Environ. Res. Public Health 2022, 19, 6301. [Google Scholar] [CrossRef] [PubMed]
- Knaapen, J.P.; Scheffer, M.; Harms, B. Estimating Habitat Isolation in Landscape Planning. Landsc. Urban Plan. 1992, 23, 1–16. [Google Scholar] [CrossRef]
- Zhang, H.; Li, J.; Tian, P.; Pu, R.; Cao, L. Construction of Ecological Security Patterns and Ecological Restoration Zones in the City of Ningbo, China. J. Geogr. Sci. 2022, 32, 663–681. [Google Scholar] [CrossRef]
- Fan, X.; Rong, Y.; Tian, C.; Ou, S.; Li, J.; Shi, H.; Qin, Y.; He, J.; Huang, C. Construction of an Ecological Security Pattern in an Urban–Lake Symbiosis Area: A Case Study of Hefei Metropolitan Area. Remote Sens. 2022, 14, 2498. [Google Scholar] [CrossRef]
- Xie, J.; Xie, B.; Zhou, K.; Li, J.; Xiao, J.; Liu, C. Impacts of Landscape Pattern on Ecological Network Evolution in Changsha-Zhuzhou-Xiangtan Urban Agglomeration, China. Ecol. Indic. 2022, 145, 109716. [Google Scholar] [CrossRef]
- Zhang, Y.; She, J.; Long, X.; Zhang, M. Spatio-Temporal Evolution and Driving Factors of Eco-Environmental Quality Based on RSEI in Chang-Zhu-Tan Metropolitan Circle, Central China. Ecol. Indic. 2022, 144, 109436. [Google Scholar] [CrossRef]
- Deng, Z.; Quan, B.; Zhang, H.; Xie, H.; Zhou, Z. Scenario Simulation of Land Use and Cover under Safeguarding Ecological Security: A Case Study of Chang-Zhu-Tan Metropolitan Area, China. Forests 2023, 14, 2131. [Google Scholar] [CrossRef]
- Vogt, P.; Ferrari, J.R.; Lookingbill, T.R.; Gardner, R.H.; Riitters, K.H.; Ostapowicz, K. Mapping Functional Connectivity. Ecol. Indic. 2009, 9, 64–71. [Google Scholar] [CrossRef]
- Sahraoui, Y.; De Godoy Leski, C.; Benot, M.-L.; Revers, F.; Salles, D.; Van Halder, I.; Barneix, M.; Carassou, L. Integrating Ecological Networks Modelling in a Participatory Approach for Assessing Impacts of Planning Scenarios on Landscape Connectivity. Landsc. Urban Plan. 2021, 209, 104039. [Google Scholar] [CrossRef]
- Saura, S.; Torné, J. Conefor Sensinode 2.2: A Software Package for Quantifying the Importance of Habitat Patches for Landscape Connectivity. Environ. Model. Softw. 2009, 24, 135–139. [Google Scholar] [CrossRef]
- Zeng, W.; Tang, H.; Liang, X.; Hu, Z.; Yang, Z.; Guan, Q. Using Ecological Security Pattern to Identify Priority Protected Areas: A Case Study in the Wuhan Metropolitan Area, China. Ecol. Indic. 2023, 148, 110121. [Google Scholar] [CrossRef]
- Costanza, R.; d’Arge, R.; De Groot, R.; Farber, S.; Grasso, M.; Hannon, B.; Limburg, K.; Naeem, S.; O’Neill, R.V.; Paruelo, J.; et al. The Value of the World’s Ecosystem Services and Natural Capital. Nature 1997, 387, 253–260. [Google Scholar] [CrossRef]
- Yang, X.; Wei, G.; Liang, C.; Yang, Z.; Fang, H.; Zhang, S. Construction of Ecological Security Pattern Based on Ecosystem Service Evaluation and Minimal Cumulative Resistance Model: A Case Study of Hefei City, China. Environ. Dev. Sustain. 2024, 26, 10681–10700. [Google Scholar] [CrossRef]
- Liang, F.; Bai, M.; Hu, Q.; Lin, S.-H. Ecological Security and Ecosystem Quality: A Case Study of Xia-Zhang-Quan Metropolitan Area in China. Land 2022, 11, 707. [Google Scholar] [CrossRef]
- Mckinney, M.L. Urbanization, Biodiversity, and Conservation. Bioscience 2002, 52, 883–890. [Google Scholar] [CrossRef]
- Wei, Q.; Abudureheman, M.; Halike, A.; Yao, K.; Yao, L.; Tang, H.; Tuheti, B. Temporal and Spatial Variation Analysis of Habitat Quality on the PLUS-InVEST Model for Ebinur Lake Basin, China. Ecol. Indic. 2022, 145, 109632. [Google Scholar] [CrossRef]
- Renard, K.G.; Foster, G.R.; Weesies, G.A.; Mccool, D.K.; Yoder, D.C. Predicting Soil Erosion by Water: A Guide to Conservation Planning with the Revised Universal Soil Loss Equation (RUSLE). In Agricultural Handbook; US Department of Agriculture, Agricultural Research Service: Washington, DC, USA, 1997. [Google Scholar]
- Teng, H.; Liang, Z.; Chen, S.; Liu, Y.; Viscarra Rossel, R.A.; Chappell, A.; Yu, W.; Shi, Z. Current and Future Assessments of Soil Erosion by Water on the Tibetan Plateau Based on RUSLE and CMIP5 Climate Models. Sci. Total Environ. 2018, 635, 673–686. [Google Scholar] [CrossRef] [PubMed]
- Liu, L.; Liu, X. Landscape Pattern and Ecosystem Service Function of Loess Plateau during 1990–2000. J. Arid Land Resour. Environ. 2011, 25, 8–13. [Google Scholar] [CrossRef]
- Tsou, J.; Gao, Y.; Zhang, Y.; Genyun, S.; Ren, J.; Li, Y. Evaluating Urban Land Carrying Capacity Based on the Ecological Sensitivity Analysis: A Case Study in Hangzhou, China. Remote Sens. 2017, 9, 529. [Google Scholar] [CrossRef]
- Chen, Y.; Yang, J.; Yu, W.; Ren, J.; Xiao, X.; Xia, J.C. Relationship between Urban Spatial Form and Seasonal Land Surface Temperature under Different Grid Scales. Sustain. Cities Soc. 2023, 89, 104374. [Google Scholar] [CrossRef]
- Li, J.; Liu, Z.; Lei, X.; Wang, L. Distributed Fusion of Heterogeneous Remote Sensing and Social Media Data: A Review and New Developments. Proc. IEEE 2021, 109, 1350–1363. [Google Scholar] [CrossRef]
- Xu, J.; Xu, D.; Qu, C. Construction of Ecological Security Pattern and Identification of Ecological Restoration Zones in the City of Changchun, China. Int. J. Environ. Res. Public Health 2022, 20, 289. [Google Scholar] [CrossRef]
- Tan, K.W. A Greenway Network for Singapore. Landsc. Urban Plan. 2006, 76, 45–66. [Google Scholar] [CrossRef]
- McRae, B.H.; Beier, P. Circuit Theory Predicts Gene Flow in Plant and Animal Populations. Proc. Natl. Acad. Sci. USA 2007, 104, 19885–19890. [Google Scholar] [CrossRef]
- McRae, B.H.; Dickson, B.G.; Keitt, T.H.; Shah, V.B. Using circuit theory to model connectivity in ecology, evolution, and conservation. Ecology 2008, 89, 2712–2724. [Google Scholar] [CrossRef] [PubMed]
- Yang, S.; Wang, X.; Hu, J. Mountain Frog Species Losing out to Climate Change around the Sichuan Basin. Sci. Total Environ. 2022, 806, 150605. [Google Scholar] [CrossRef]
- Carroll, C.; McRAE, B.H.; Brookes, A. Use of Linkage Mapping and Centrality Analysis Across Habitat Gradients to Conserve Connectivity of Gray Wolf Populations in Western North America. Conserv. Biol. 2012, 26, 78–87. [Google Scholar] [CrossRef] [PubMed]
- Wang, F.; Yuan, X.; Zhou, L.; Zhang, M. Integrating Ecosystem Services and Landscape Connectivity to Construct and Optimize Ecological Security Patterns: A Case Study in the Central Urban Area Chongqing Municipality, China. Environ. Sci. Pollut. Res. 2022, 29, 43138–43154. [Google Scholar] [CrossRef]
- Shu, R.; Ma, G.; Zou, Y.; Guo, N.; Su, H.; Zhang, G. Bibliometric Analysis of Ecological Security Pattern Construction: Current Status, Evolution, and Development Trends. Ecol. Indic. 2024, 169, 112754. [Google Scholar] [CrossRef]
- Li, Y.; Wang, X.; Dong, X. Delineating an Integrated Ecological and Cultural Corridor Network: A Case Study in Beijing, China. Sustainability 2021, 13, 412. [Google Scholar] [CrossRef]
- Wang, W.; Li, B.; Su, F.; Jiang, Z.; Chen, S. Identifying Ecological Security Patterns Meeting Future Urban Expansion in Changsha–Zhuzhou–Xiangtan Urban Agglomeration, China. Remote Sens. 2023, 15, 3141. [Google Scholar] [CrossRef]
- Peng, J.; Zhao, S.; Dong, J.; Liu, Y.; Meersmans, J.; Li, H.; Wu, J. Applying Ant Colony Algorithm to Identify Ecological Security Patterns in Megacities. Environ. Model. Softw. 2019, 117, 214–222. [Google Scholar] [CrossRef]
- Dong, J.; Peng, J.; Xu, Z.; Liu, Y.; Wang, X.; Li, B. Integrating Regional and Interregional Approaches to Identify Ecological Security Patterns. Landsc. Ecol. 2021, 36, 2151–2164. [Google Scholar] [CrossRef]


| Layer | Weight | Factor | Weight |
|---|---|---|---|
| Landscape connectivity | 0.27 | Landscape connectivity | 0.27 |
| Ecosystem service importance | 0.43 | Habitat quality | 0.13 |
| Soil retention | 0.08 | ||
| Carbon sequestration | 0.11 | ||
| Water retention | 0.11 | ||
| Ecological sensitivity | 0.30 | Soil erosion | 0.16 |
| Rocky desertification | 0.14 |
| Factors | Resistance Value | Weights | ||||
|---|---|---|---|---|---|---|
| 1 | 2 | 3 | 4 | 5 | ||
| Land cover type | Woodland, Water body and wetland | Grassland | Cropland | Bare ground | Artificial surface | 0.30 |
| DEM | <100 | 100~400 | 400~800 | 800~1200 | >1200 | 0.13 |
| Slope (°) | <5 | 5~15 | 15~20 | 20~30 | >30 | 0.15 |
| NDVI | 0.84~0.90 | 0.76~0.84 | 0.65~0.76 | 0.50~0.65 | 0.16~0.50 | 0.18 |
| Distance to highway (km) | >5 | 3.5~5.0 | 2.0~3.5 | 0.5~2.0 | <0.5 | 0.06 |
| Distance to railroad (km) | >10 | 5~10 | 3~5 | 1~3 | <1 | 0.06 |
| Distance to settlement (km) | >3 | 2.0~3.0 | 1.0~2.0 | 0.5~1.0 | <0.5 | 0.12 |
| Types | Core | Islet | Edge | Perforation | Bridge | Loop | Branch |
|---|---|---|---|---|---|---|---|
| Area (km2) | 5435.42 | 484.51 | 1381.21 | 98.40 | 3523.76 | 618.18 | 649.66 |
| Percentage (%) | 44.59 | 3.97 | 11.33 | 0.81 | 28.90 | 5.07 | 5.33 |
Disclaimer/Publisher’s Note: The statements, opinions and data contained in all publications are solely those of the individual author(s) and contributor(s) and not of MDPI and/or the editor(s). MDPI and/or the editor(s) disclaim responsibility for any injury to people or property resulting from any ideas, methods, instructions or products referred to in the content. |
© 2025 by the authors. Licensee MDPI, Basel, Switzerland. This article is an open access article distributed under the terms and conditions of the Creative Commons Attribution (CC BY) license (https://creativecommons.org/licenses/by/4.0/).
Share and Cite
Wu, T.; Lu, S.; Ding, Y. Ecological Security Evaluation System Integrated with Circuit Theory for Regional Ecological Security Pattern Construction: A Coordinated Study of Chang-Zhu-Tan Metropolitan Area in China. Land 2025, 14, 257. https://doi.org/10.3390/land14020257
Wu T, Lu S, Ding Y. Ecological Security Evaluation System Integrated with Circuit Theory for Regional Ecological Security Pattern Construction: A Coordinated Study of Chang-Zhu-Tan Metropolitan Area in China. Land. 2025; 14(2):257. https://doi.org/10.3390/land14020257
Chicago/Turabian StyleWu, Tingke, Shiwei Lu, and Yichen Ding. 2025. "Ecological Security Evaluation System Integrated with Circuit Theory for Regional Ecological Security Pattern Construction: A Coordinated Study of Chang-Zhu-Tan Metropolitan Area in China" Land 14, no. 2: 257. https://doi.org/10.3390/land14020257
APA StyleWu, T., Lu, S., & Ding, Y. (2025). Ecological Security Evaluation System Integrated with Circuit Theory for Regional Ecological Security Pattern Construction: A Coordinated Study of Chang-Zhu-Tan Metropolitan Area in China. Land, 14(2), 257. https://doi.org/10.3390/land14020257