Article

Dynamic Simulation and Reduction Path of Carbon Emission in “Three-Zone Space”: A Case Study of a Rapidly Urbanizing City

1
School of Public Administration, China University of Geosciences, Wuhan 430074, China
2
School of Public Policy and Management, Tsinghua University, Beijing 100084, China
*
Author to whom correspondence should be addressed.
Land 2025, 14(2), 245; https://doi.org/10.3390/land14020245
Submission received: 22 November 2024 / Revised: 16 January 2025 / Accepted: 20 January 2025 / Published: 24 January 2025

Abstract

:
Understanding the current and future net carbon emission trajectories in “Three-Zone Space” is crucial for China to promote the formation of a low-carbon development pattern in territorial space and realize carbon neutrality. Taking Wuhan as the study area, we developed carbon emission and sequestration inventories for “Three-Zone Space”. Key driving factors of net carbon emissions were analyzed using the logarithmic mean division index, and future emissions and sequestration under six scenarios were projected with a system dynamics model. The optimal emission reduction pathway was identified through the intelligent decision-making index analysis. Our results show that Wuhan’s net carbon emission increased from 18.589 Mt in 2000 to 42.794 Mt in 2020. The emissions during this period primarily came from urban production space and urban living space. Economic development is the primary factor contributing to the increase in net carbon emissions (36.412 Mt). The efficiency of territorial space utilization is the strongest mitigator of net carbon emissions, reducing net carbon emissions by 74.341 Mt (accounting for 42.06% of total emissions). The comprehensive scenario is the most effective for net carbon emission reduction in urban and ecological spaces, while the technological progress scenario provides the greatest reduction potential in agricultural spaces. These findings provide actionable insights for optimizing spatial planning, enhancing ecological restoration, and adopting low-carbon agricultural technologies to achieve targeted emissions reductions in “Three-Zone Space”. The results of this study can further provide scientific basis for the formulation of targeted emission reduction measures for “Three-Zone Space” and guide the construction of low-carbon territorial space patterns.

1. Introduction

Climate change is a formidable global challenge that poses a substantial threat to the well-being of humanity [1,2,3]. The Paris Agreement, which specified a long-term global temperature goal [4], strengthened by the Glasgow Climate Pact, states that realizing the 1.5 °C temperature target requires a global reduction in carbon emissions of 45% below 2010 levels by the year 2030 [5,6]. To meet this target, it is imperative for countries worldwide to diligently contribute to emission reduction efforts [7]. As the world’s largest energy consumers and carbon emitter, the Chinese government has formally declared its dual carbon target of peak carbon emissions before 2030 and become carbon neutral by 2060. China is confronted with substantial challenges in mitigating carbon emissions [8,9]. As a major developing country in the world, determining how to balance the dual carbon strategy and social and economic development has become an important issue that needs to be solved urgently in China [10]. To effectively tackle this issue, the government must formulate emission reduction policies that align with regional development needs and pursue sustainable pathways for emission reduction.
Territorial space not only serves as a habitat for natural resources like forests that act as carbon sequestration, but also carries socio-economic activities that serve as carbon sources. The Chinese government has made a top-level design for the carbon neutrality goal and proposed a specific carbon neutrality path for the territorial space in a series of policy documents. For example, the Proposal of the CPC Central Committee on Formulating the 14th Five-Year Plan for National Economic and Social Development and the Long-Term Goals for 2035 clearly proposes accelerating the promotion of green and low-carbon development and build a new pattern of territorial space development and protection. The Action Plan for Carbon Peaking Before 2030 proposes establishing a territorial space development and protection pattern that supports carbon peaking and carbon neutrality, in tandem with the preparation of NTSP. Furthermore, Working Guidance for Carbon Dioxide Peaking and Carbon Neutrality in Full and Faithful Implementation of the New Development Philosophy explicitly advocates building a new territorial space development and protection framework conducive to carbon neutrality and optimizing the regional layout for green and low-carbon development [11]. As a guide for the rational development and utilization of territorial space, the national territorial spatial planning (NTSP) puts forward the spatial development and protection pattern of the “Three-Zone Space” (urban, agricultural, and ecological spaces), which are the spatial units for the government to implement territorial spatial governance and regulation [12]. Therefore, a comprehensive analysis of the current status and future trends of carbon emissions and sequestration from the perspective of the “Three-Zone Space” has important practical significance for putting forward multi-dimensional, systematic and differentiated low-carbon development strategies according to local conditions and is conducive to shaping a low-carbon and sustainable territorial space pattern.
Wuhan city, as a central city in the Yangtze River Basin for both ecological preservation and economic development, faces significant challenges related to ecological sustainability, industrial transformation, and economic growth. Thus, determining an effective emission reduction strategy is crucial. On one hand, Wuhan, representing rapid urbanization and industrialization, experiences an accelerated loss of high-quality ecological land due to rapid urbanization. Additionally, being a significant industrial base in China, Wuhan’s substantial demands for resources and energy result in highly anticipated carbon emissions and immense pressure for carbon emission reduction. On the other hand, Wuhan is rich in natural resources such as lakes, wetlands, and forests, leading to significant pressure with regard to regional ecological conservation. By focusing on Wuhan as the study area, exploring an emission reduction pathway not only provides specific policy recommendations, but also contributes scientific references and serves as a typical demonstration for other rapidly urbanizing cities in developing countries.
The contribution of this paper can be summarized as follows. First, this study establishes the relationships between the “Three-Zone Space” and their associated carbon emissions and sequestration inventories, quantifies the carbon emissions and sequestration for “Three-Zone Space”, and provides a scientific foundation for the low-carbon utilization of territorial space. Second, based on the simulation of carbon emission and sequestration trends under different scenarios in the future, this study introduces an Intelligent Decision-Making Index (IDMI) model to conduct decision analysis on emission reduction paths.
This study constructs a research framework to provide carbon emissions and sequestration accounting, factor decomposition, prediction, and pathway selection for emission reduction recommendations in “Three-Zone Space” (Figure 1). Taking Wuhan as the study area, this study assesses carbon emissions and sequestration from the “Three-Zone Space”, decomposes driving factors of net carbon emissions, simulates future carbon emissions and sequestration in “Three-Zone Space” under different policy scenarios, and conducts a decision analysis for emission reduction paths.

2. Literature Review

Carbon accounting forms the foundation for developing effective emission reduction policies. Regarding accounting methods, the carbon emissions coefficient method has become the predominant approach due to its ease of data acquisition, moderate computational demands, and high accuracy [13]. In terms of emission inventories, most previous studies have concentrated on energy-related carbon emissions [14,15,16]. Relatively few have addressed other forms of carbon emissions. Furthermore, research has predominantly focused on carbon emission and sequestration accounting at various scales, including national [17], regional [16], provincial [18], city [19], major functional zones [10], industrial land spaces [20,21], and the entity level [22]. The “Three-Zone Space” framework represents a critical spatial unit for implementing territorial spatial governance and regulation in China. Understanding the current and projected carbon emission and sequestration trajectories within the “Three-Zone Space” is essential for advancing a low-carbon development pattern in territorial space and realizing carbon neutrality. However, current research lacks a comprehensive carbon emissions and sequestration accounting framework specifically tailored to the “Three-Zone Space” scale.
The accurate prediction of future carbon emissions is essential for the formulation of targeted emission reduction policies. Many studies integrated scenarios analysis with forecasting models for regional carbon management. Economic statistical models (e.g., Kaya, STIRPAT), system dynamic (SD) models, and Integrated Assessment models (IAMs) are widely used in the field of carbon emission forecasting [23]. Among them, SD models have the advantage of flexibility and the ability to capture complex feedback relationships within the system. Yang et al. established a multi-level SD model to comprehensively simulate China’s future energy-related carbon emissions, considering the relationship between factors of society, economic, energy and carbon emissions [24]. Hao et al. applied the SD model to predict the carbon emission peak in China [25]. Thus, this model offers an effective approach to scenario-based simulation for forecasting future trajectories of carbon emissions. Although these studies have established a good foundation for constructing an SD model for future carbon emission simulation, these studies overlooked the simulation of carbon sequestration. The realization of carbon neutrality needs to consider both carbon emissions and sequestration [10]. Therefore, incorporating carbon sequestration into the regional carbon emission simulation model will enhance the simulation accuracy, aiding in the formulation of a more comprehensive emission reduction plan.
Some scholars have examined the optimal emission reduction path from the perspectives of equity and efficiency. Maheen et al. calculated the costs and benefits associated with different low-carbon scenarios for China’s power industry [26]. In summary, scholars have determined optimal emission reduction paths from the perspective of amount of emission reductions, the equity and efficiency considerations, and the cost-benefit of different paths. A reliable decision-making method is crucial for selecting an emission reduction path. When contemplating emission reduction pathways, it is imperative to thoroughly consider the divergence in regional development objectives. Traditional single-index decision-making analyses are inadequate in integrating pertinent indicators that characterize regional development goals into pathway selection [27,28]. The IDMI method distinguishes itself by emphasizing the integration of internal decision-making indices, making it particularly effective in scenarios where internal decision factors must be explicitly assessed alongside external alternatives [29]. Compared with methods such as AHP and TOPSIS, IDMI places greater emphasis on comprehensively analyzing both internal decision-making factors and external alternatives. This approach facilitates a closer integration of internal objectives (e.g., development goals) with external conditions (e.g., market demands, policy requirements), thereby enabling decisions that better align with real-world contexts.

3. Materials and Methods

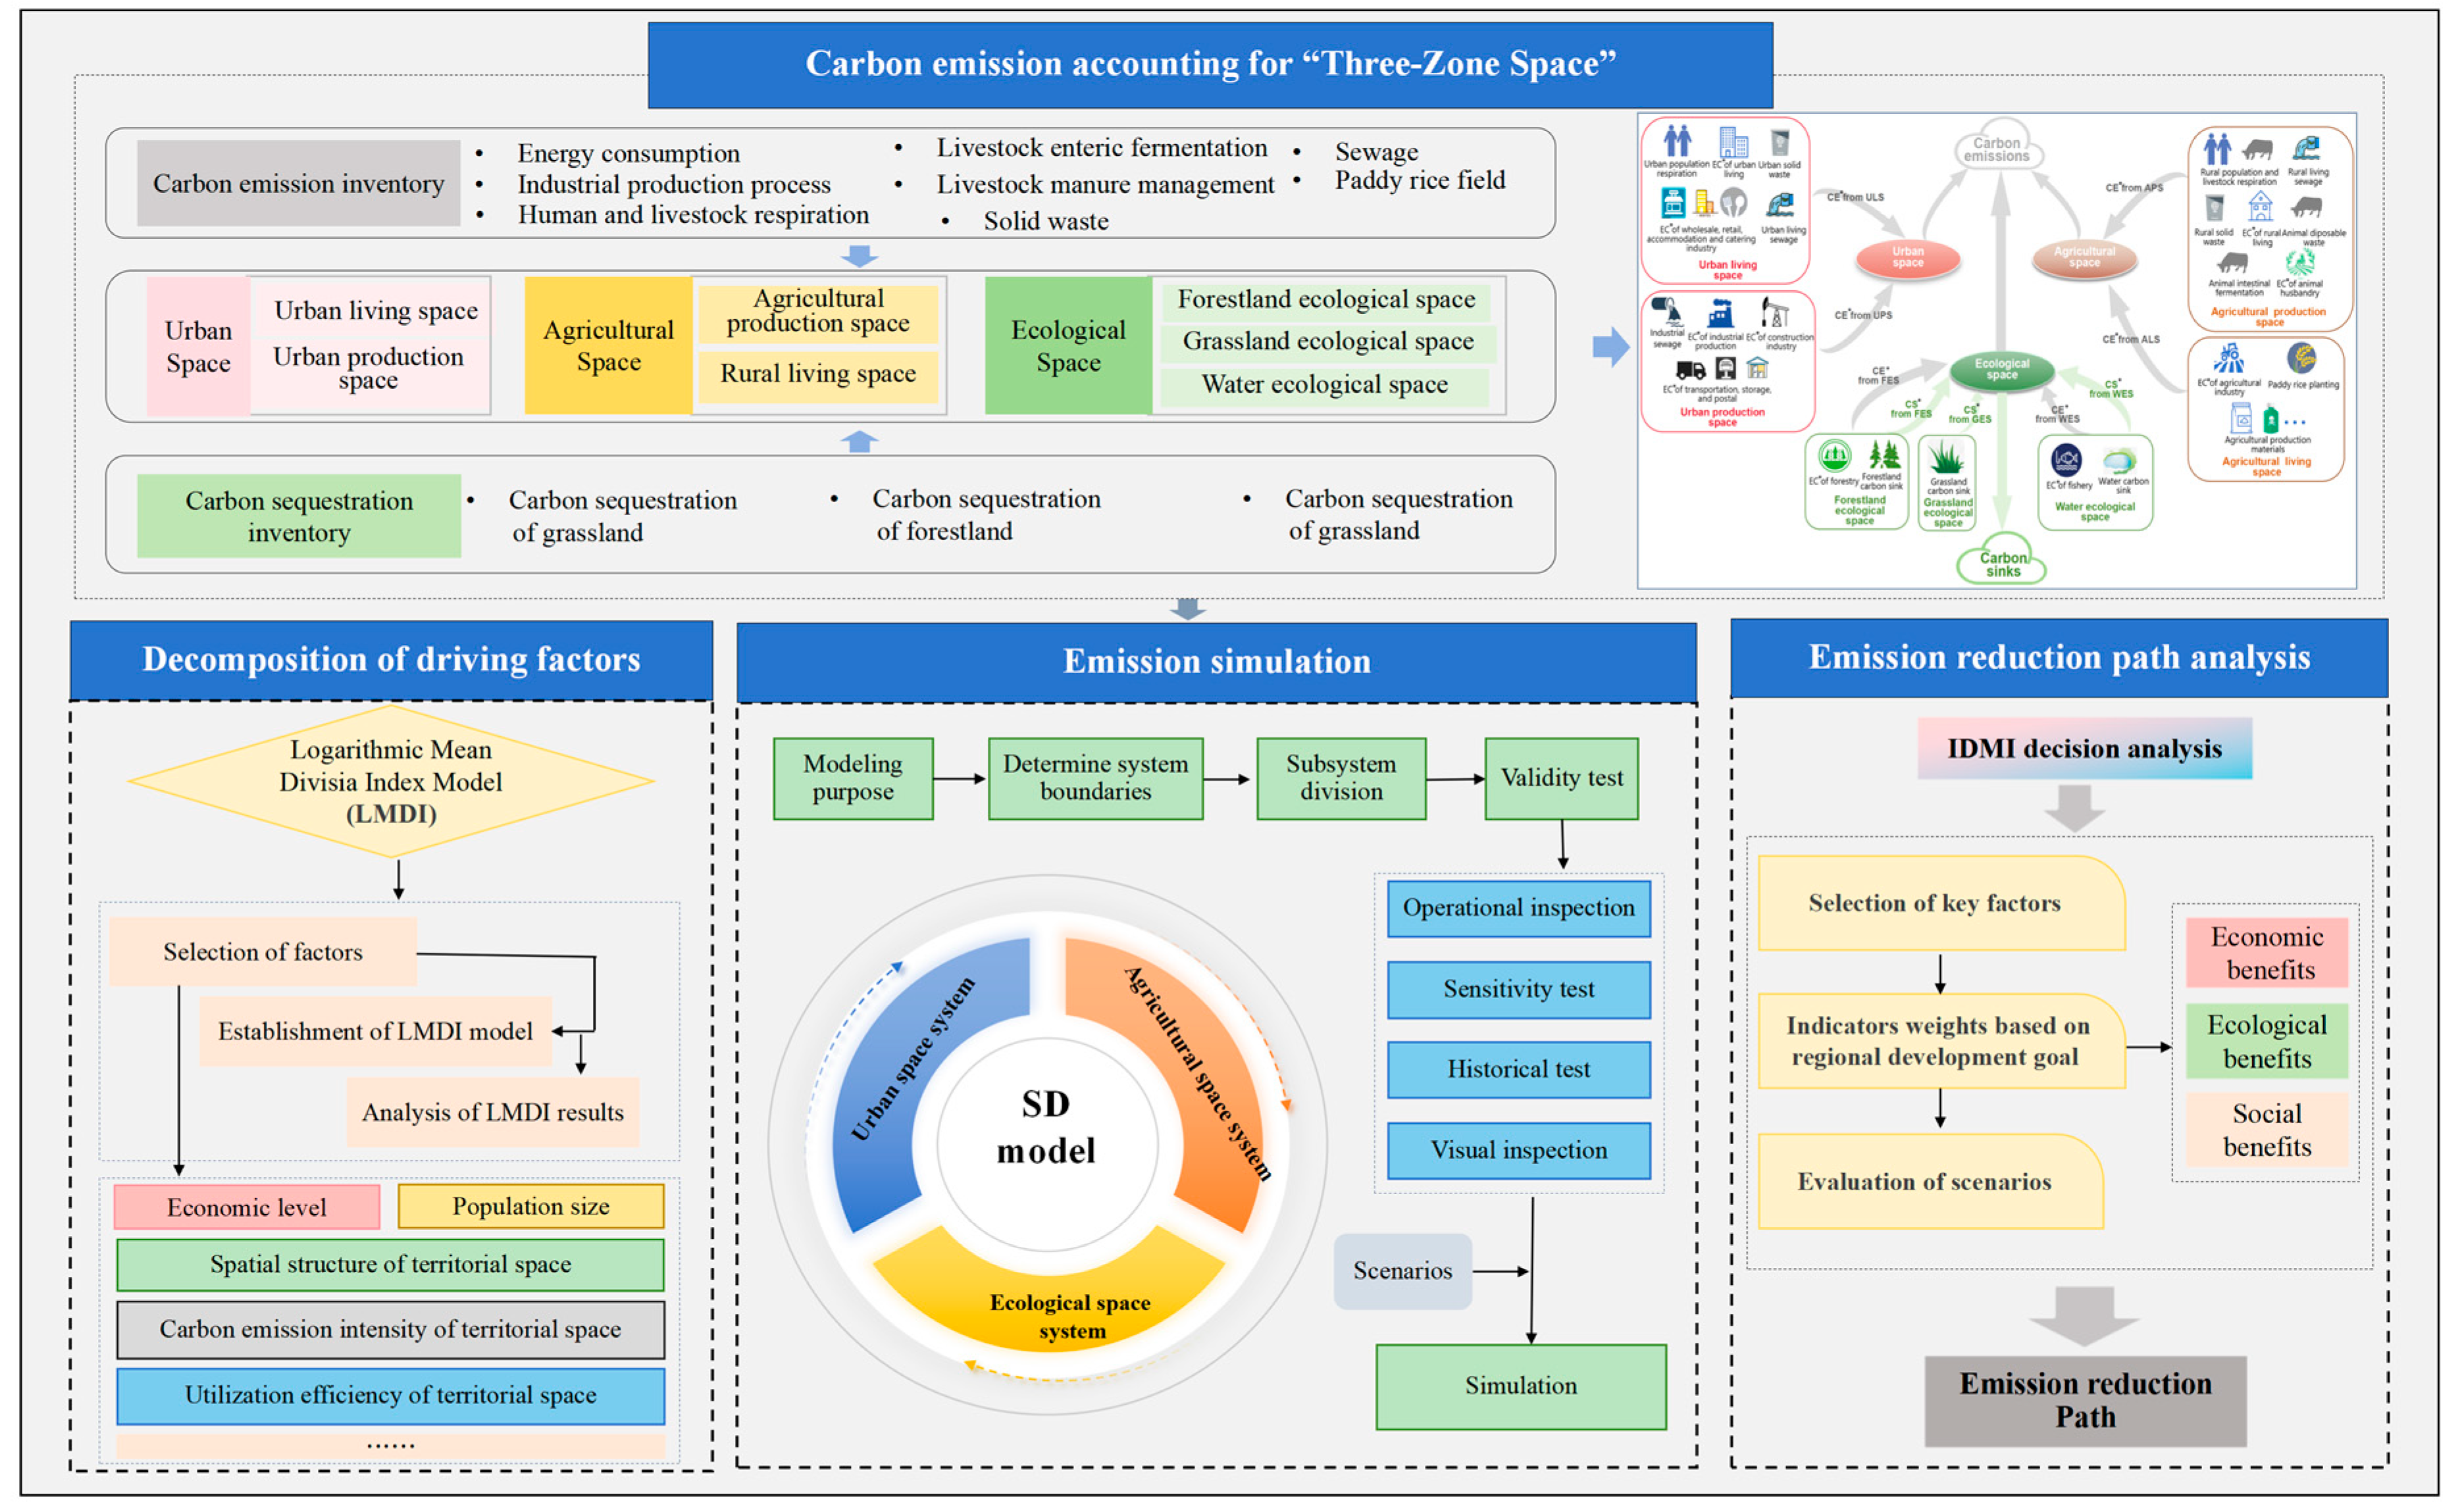
3.1. Research Framework

This study introduces an analytical framework for examining both current and future carbon emissions and carbon sequestration across the “Three-Zone Space”, as well as a decision-making process for selecting optimal carbon reduction pathways (Figure 1).
The carbon accounting in this study encompasses both carbon emission and sequestration inventories, including contributions from energy consumption, industrial production processes, solid waste, wastewater, human and livestock respiration, agricultural activities, rice cultivation, and livestock enteric fermentation with manure management. Energy-related carbon emissions are further disaggregated by industry. Building on the carbon emission and sequestration accounting, the “Three-Zone Space” is matched with the corresponding emission and sink inventories. Next, the framework subsequently employed the Logarithmic Mean Divisia Index (LMDI) method to decompose the driving factors influencing net carbon emissions. These factors were integrated into a System Dynamics (SDs) model to simulate future carbon emission and sequestration trajectories within the “Three-Zone Space”. Finally, the IDMI method is employed to identify the optimal pathway for emission reduction.

3.2. Study Area

Wuhan city is the core city of the urban agglomeration in the middle reaches of the Yangtze River and the pilot area for national “low-carbon city” and “two-oriented society” reforms (Figure 2). At the end of 2019, Wuhan had a resident population of 11.21 million and a regional GDP of RMB 1.62 trillion. Its rapid economic development has also intensified the development of territorial space in Wuhan, resulting in accelerated urban expansion and the loss of high-quality arable and ecological land. Higher carbon emissions also placed the city under major pressure to reduce these emissions. It is important, therefore, for Wuhan to achieve its carbon peak and neutrality goals as soon as possible to seek the optimal carbon emission reduction path, reduce carbon emission, and improve the level of carbon sink in “Three-Zone Space”.

3.3. Datasets

The data for carbon emission accounting were derived from the Hubei province energy consumption data from the energy balance sheet (physical quantity) in the China Energy Statistical Yearbook, and the domestic waste landfill and incineration data came from the China Urban and Rural Construction Statistical Yearbook. The domestic sewage and industrial wastewater treatment volumes were obtained from the China Urban Statistical Yearbook. Fertilizer use, pesticide use, agricultural film use, the animal inventory, crop yield, and industrial product output were obtained from the Wuhan Statistical Yearbook. Chemical oxygen demand (COD) emissions were obtained from the China Environmental Statistical Yearbook.
The land use data of 30 m × 30 m in Wuhan in 2000, 2005, 2010, 2015, and 2020 were obtained from the Resource and Environment Data Center of the Chinese Academy of Sciences (http://www.resdc.cn).
Socioeconomic data were obtained from the Wuhan Statistical Yearbook, Wuhan Statistical Bulletin, Hubei Statistical Yearbook, China Macroeconomic Database and China Tertiary Industry Database.

3.4. Estimation of Carbon Emissions and Sequestration in “Three-Zone Space”

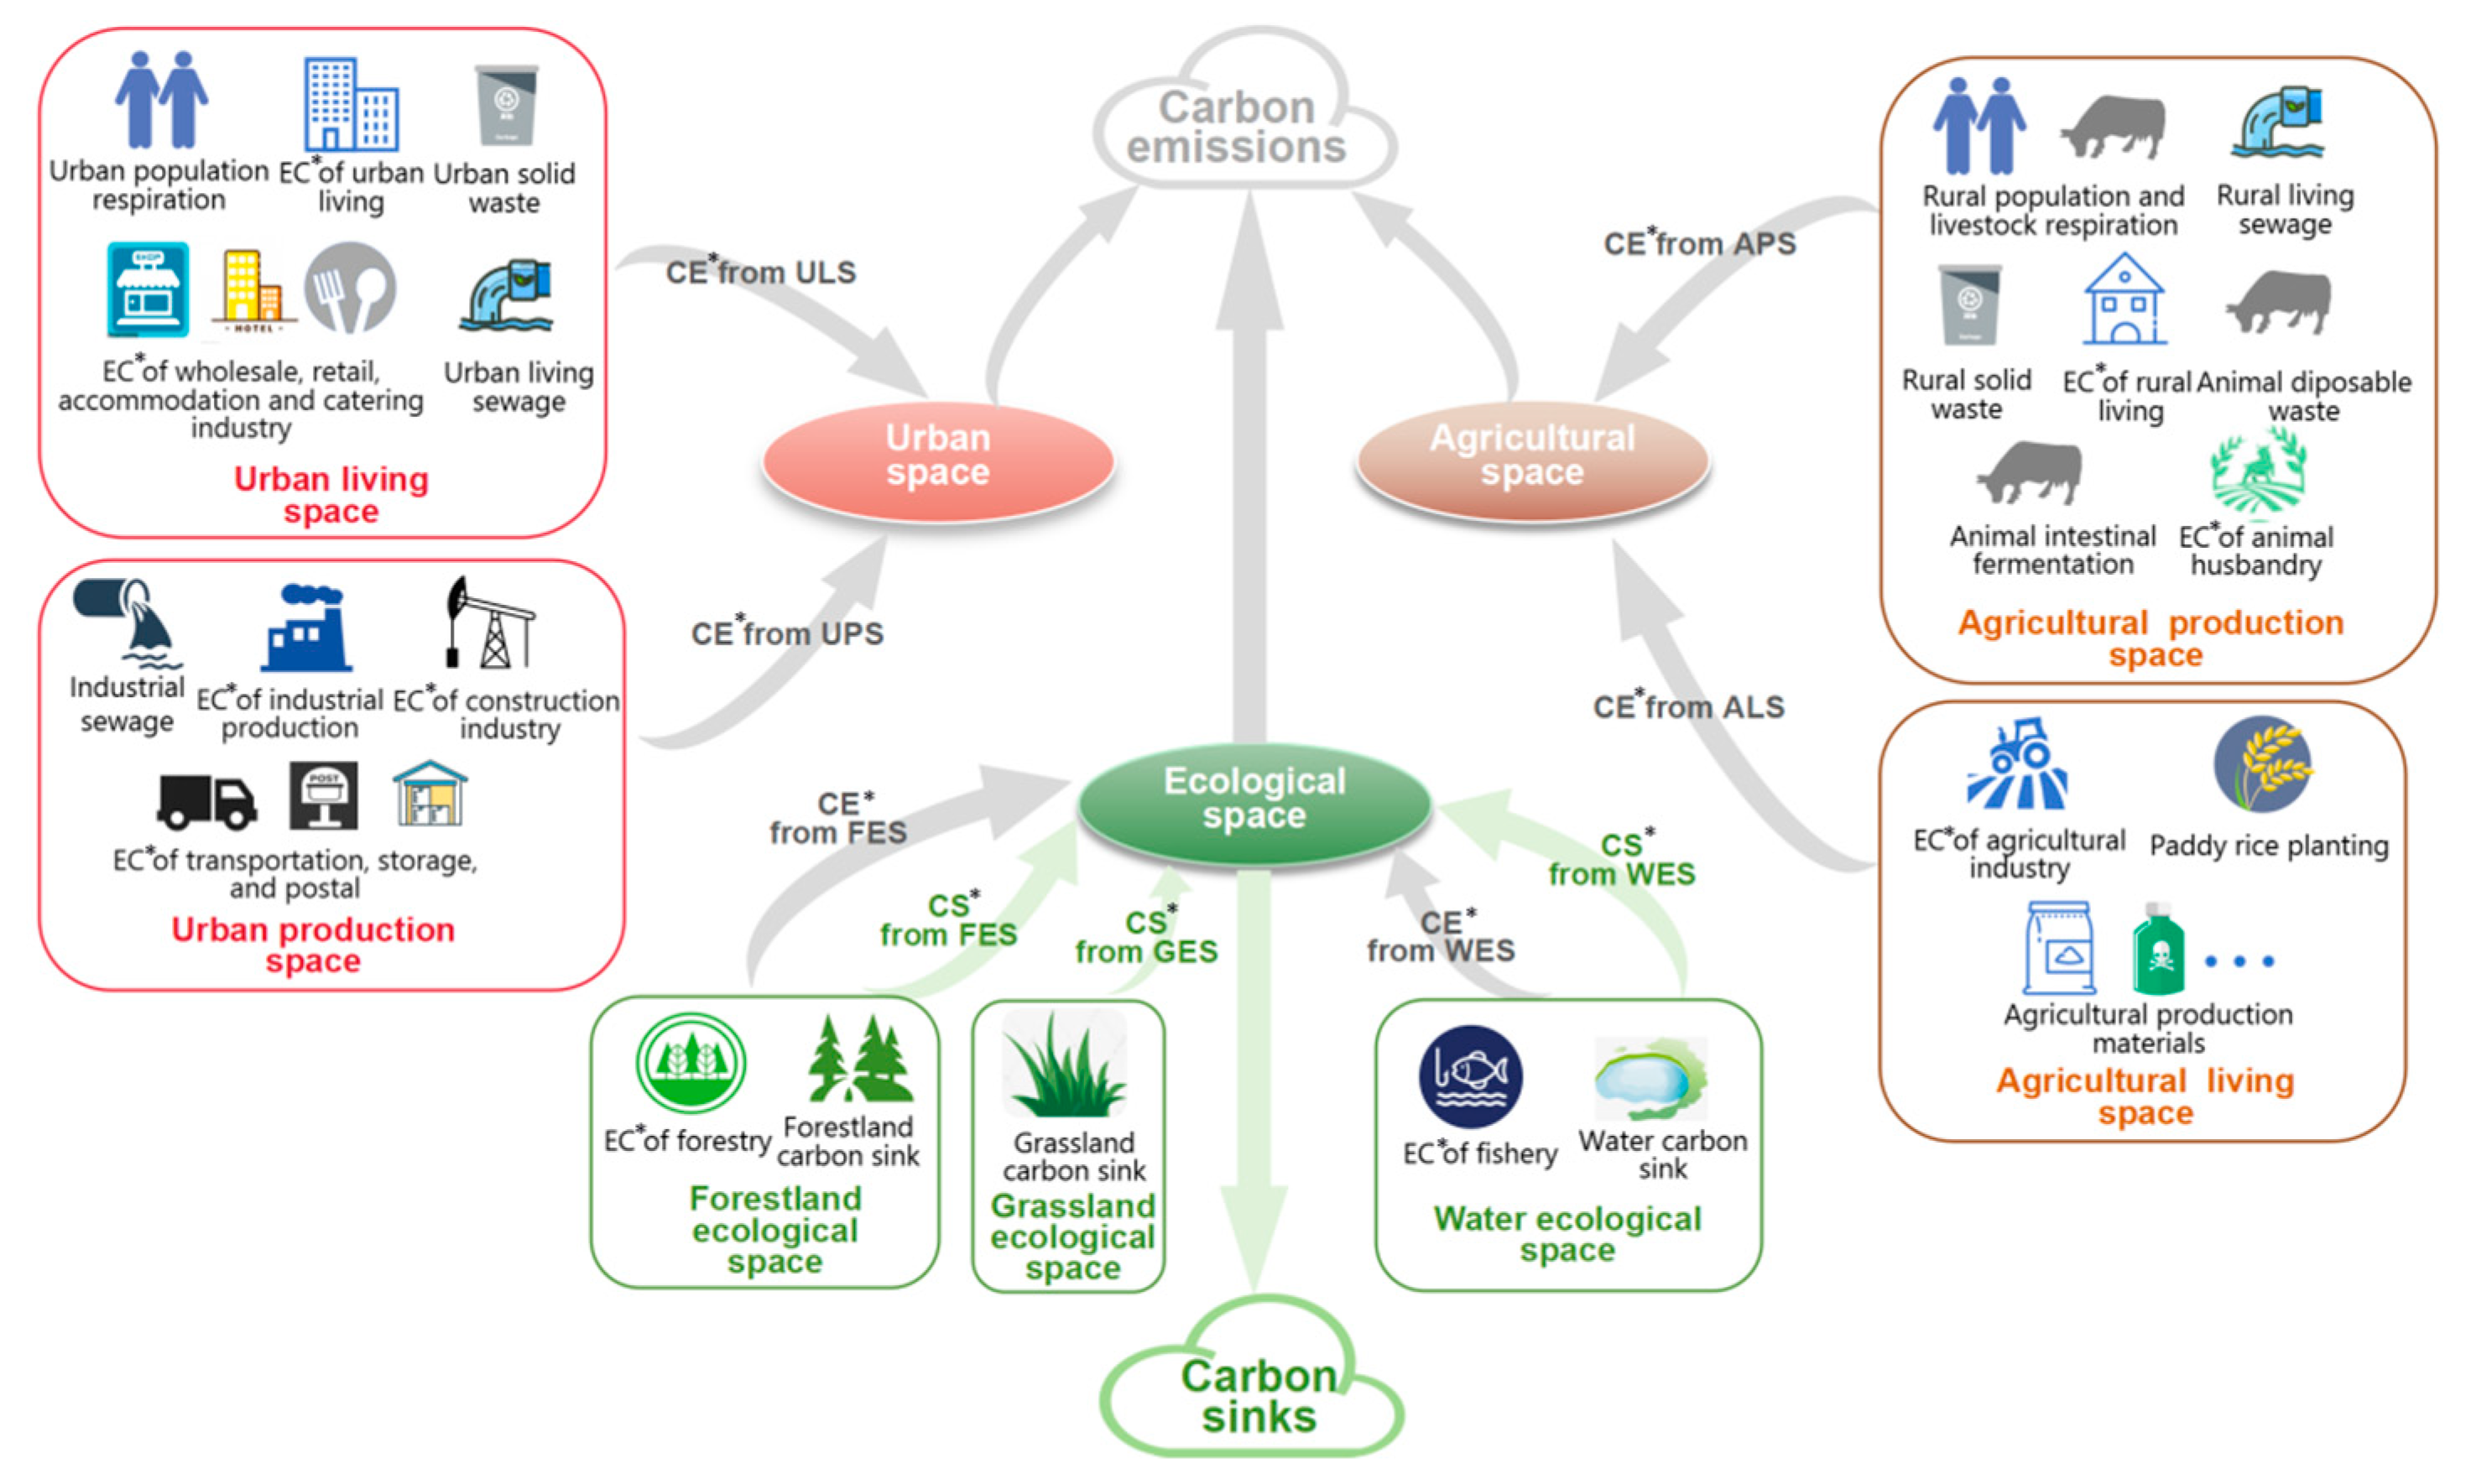
3.4.1. Carbon Emission and Sequestration Accounting

Accounting items include ecosystem carbon sinks, and carbon emissions from energy consumption, industrial production processes, solid waste, sewage, human and livestock respiration, agricultural production processes, rice fields, and animal enteric fermentation with manure management. It is crucial to emphasize that our study did not consider the carbon sink generated by crop growth. It is important to consider the carbon uptake and release dynamics of different vegetation types when calculating the carbon sequestration. However, previous studies [30,31] found that crops, despite absorbing carbon during the growth period, release it into the atmosphere soon after harvest and decomposition, resulting in a zero-carbon sink capacity. This situation is particularly relevant in Wuhan, where most crops are annual crops. Therefore, when estimating the carbon sink in this region, it is reasonable to exclude the carbon uptake of farmland vegetation.
(1)
Carbon emissions from energy consumption
Fossil fuel consumption is the most important source of carbon emissions. According to the characteristics of energy consumption in Wuhan, 20 energy types such as raw coal, washed refined coal, briquette, crude oil, gasoline, and natural gas were selected for carbon emission accounting. The formula for calculating carbon emissions from energy consumption is as follows:
C e n r = Q e n r i × Z e n r i × ( i + θ i )
where C e n r represents the total carbon emissions of energy consumption; Q e n r i indicates the consumption of the i-th energy type; Z e n r i indicates the net calorific value of the i-th energy type; i represents the carbon emission coefficient for the i-th energy type; and θ i represents the methane emission factor for the i-th energy type. Carbon emission coefficients are shown in Supplementary Materials (Table S1).
(2)
Carbon emissions from the industrial production process
Carbon emissions from the industrial processes include not only those from energy consumption, but also those released from production processes. Carbon emissions from energy consumption in industrial production processes can be calculated in Equation (2); therefore, only carbon emissions from chemical reactions in the process are calculated here as follows:
C l n d = Q l n d i × f l n d i
where C l n d represents the total carbon emissions of the industrial production process; Q l n d i is the output of the first industrial product; and f l n d i represents the carbon emission coefficient for industrial products in i . Carbon emission coefficients are shown in Supplementary Materials (Table S2).
(3)
Carbon emissions from solid waste
Waste carbon emissions mainly include solid waste carbon emissions and sewage carbon emissions. Among them, solid waste carbon emissions include carbon dioxide from landfills and methane from waste incineration. The carbon emissions of waste incineration are calculated as follows:
C b = N b × C C n × M C n × E F × ω
where C b denotes the carbon emissions generated by waste incineration; N b represents the amount of waste incinerated; C C n is the proportion of carbon in the garbage, the default value of which is 50%; M C n is the proportion of mineral carbon in the garbage, the default value of which is 40%; E F represents the complete burn rate of garbage, the default value of which is 95%; and ω indicates the conversion ratio of carbon dioxide to carbon, which is 12/44.
The formula for calculating the carbon emissions from landfills is as follows:
C l f = N l f × D O C l f × F l f × f l f × μ
where C l f indicates the carbon emissions generated by landfill; N l f represents the amount of landfill;   D O C l f is the proportion of degradable organic carbon in the garbage, the default value of which is 11.4%; F l f is the actual decomposition ratio of degradable organic carbon in garbage, the default value of which is 55%; f l f is the proportion of degradable organic carbon that is actually decomposed in the garbage into methane, the default value of which is 50%; μ denotes the conversion factor of carbon to methane, with a value of 0.75.
(4)
Carbon emissions from waste water
Wastewater mainly includes domestic sewage and industrial wastewater, and the carbon emission of wastewater mainly comes from methane generated during the disposal process. The formula for calculating carbon emissions from domestic sewage is as follows:
C w l = B O D × B m a x × M C F S
where C w l denotes the carbon emissions from domestic sewage; B O D represents the total amount of organic matter in sewage; B m a x indicates the maximum methane production capacity, the default value of which is 0.6 kg CH4/kg BOD; M C F is the methane correction factor, the default value of which is 0.165; and S is the methane recovery amount, which is 0 [32].
Due to the lack of domestic sewage BOD data, this study used the domestic sewage COD to calculate the domestic sewage BOD. The calculation formula of domestic sewage is as follows:
B O D = C O D × 0.49
  C O D = C O D l × P × 365
where 0.49 is the conversion factor value of BOD and COD; in the Formula (7), C O D l is the generation factor of COD, which is 75 g/(cap·g); and P is the number of resident population in the region.
The formula for calculating carbon emissions from industrial wastewater is as follows:
C w i = i [ ( T O W i N i ) × B m a x × F i S i ]
where C w i is the carbon emission from industrial wastewater; i represents different industries; T O W i indicates the content of organic matter in industrial wastewater; N i indicates the content of organic matter removed by sludge; B m a x denotes the maximum methane production capacity, which is 0.25 kg/kg COD; F i indicates the methane correction factor, which is 0.1; and S i represents the methane recovery quantity, which is 0 [32].
(5)
Carbon emissions from human and livestock respiration
Humans and livestock will absorb oxygen and expel carbon dioxide during daily breathing. The formula for calculating carbon emissions from human and livestock respiration is as follows:
C b r = K a i × ρ a i + N p × θ p
where C b r indicates the respiration carbon emissions of humans and livestock; K a i denotes the quantity of the i-th livestock; ρ a i represents the respiration carbon emission coefficient of the i-th livestock; N p denotes the number of resident population in the study area; and θ p represents the carbon emission coefficient of human respiration, which is 0.079 t/a. According to the livestock breeding situation in Wuhan, this research selected pigs, cattle, and sheep as the main animals to calculate the carbon emissions from livestock respiration, and their carbon emission coefficients are 0.796 t/a, 0.082 t/a, and 0.042 t/a, respectively [32].
(6)
Carbon emissions from the agricultural production process
Existing studies have shown that agricultural carbon emissions mainly come from direct or indirect carbon emissions generated by the input of agricultural production materials (such as chemical fertilizers, pesticides, and agricultural film) and organic carbon loss caused by soil ploughing. They also come from carbon emissions caused by the energy consumption of agricultural machinery and electricity consumption in agricultural irrigation activities [33], and these carbon emissions are calculated in the energy consumption section; therefore, this section only calculates the agricultural production means carbon emissions from inputs and soil tillage. The formula for calculating carbon emissions from agricultural production inputs is as follows:
C a m = Q a m i × f a m i
where C a m represents the carbon emissions of the agricultural production process; Q a m i indicates the input of different types of agricultural production materials; f a m i denotes the carbon emission coefficients of different types of agricultural production materials; and the carbon emission factors of different agricultural production materials are shown in Table S3.
The formula for calculating carbon emissions from soil tillage is as follows:
C s t = S s t × f s t
where C s t represents the total amount of carbon emissions from soil tillage; S s t denotes the tillage area; and f s t indicates the carbon emission coefficient of soil tillage. According to the research results of Tian et al. [34], the carbon emission coefficient of soil tillage is 312.6 kgC/km2.
(7)
Carbon emissions from the paddy rice field
In the process of rice cultivation, organic matter will generate methane through microbial metabolism and mineralization, and methane will be transported to the atmosphere through the stalk of rice. The formula for calculating methane carbon emissions from rice fields is as follows:
C r = A k × f k
where C r indicates the methane carbon emission of rice fields; A represents the sown area of rice; f indicates the methane emission factor; and k denotes the different types of rice, including single-cropping rice, double-cropping early rice and double-cropping late rice. Methane emission factors of different rice types are obtained from the NDRC [32].
(8)
Animal enteric fermentation carbon emissions with manure management
The methane produced by animal intestinal fermentation mainly comes from the methane carbon emission produced by the fermentation of microorganisms in the intestinal tract during animal metabolism. Methane emissions from ruminants are large; methane emissions from non-ruminants are small and negligible. However, considering the large number of pigs in China, the enteric fermentation methane of pigs is also included in the enteric fermentation methane carbon emissions. According to the actual situation of the study area, the carbon emission sources of animal enteric fermentation in Wuhan mainly include dairy cows, non-dairy cows, sheep, and pigs. The formula for calculating the carbon emissions of animal enteric fermentation is as follows:
C r = A k × f k
where C f e represents the methane emission from the enteric fermentation of animals; f i represents the methane emission factor of enteric fermentation of the i-th animal; the enteric fermentation methane emission factors of dairy cows, sheep and pigs are 88.1, 52.9, 8.2, and 1, respectively; N i denotes the number of animals in stock i . The methane emission factor of enteric fermentation and the enteric fermentation methane emission factors of dairy cows, sheep, and pigs are obtained from the NDRC [32].
Methane emissions from animal manure management originate from methane released during manure storage and processing. Pigs, non-dairy cows, dairy cows, sheep, goats, poultry, horses, donkeys, mules, and camels are the main animals responsible for carbon emissions from manure management, according to the NDRC [32]. The formula for calculating carbon emissions from animal manure management is as follows:
C d e = k i × N i
where C d e is the carbon emission of animal manure management; k i represents the manure management emission factor of the i-th animal, where the value is derived from the NDRC (2011); and N i denotes the stock number of the i-th animal.
(9)
Terrestrial ecosystem carbon sequestration
The formula for calculating forestland carbon sinks is as follows:
C f l = S f l × C S f l
where C f l represents the carbon sink of forestland; S f l represents the area of forestland; and C S f l is the carbon sink coefficient. The carbon sink coefficient of forestland adopts the results of Fang et al. to calculate the carbon sink of forest land in terrestrial ecosystems in China [35], and its carbon sequestration coefficient is 64.4 t/km2.
Grassland has carbon absorption capacity, and the calculation formula of the grassland carbon sink is as follows:
C g l = S g l × C S g l
where C g l denotes the carbon sink of grassland; S g l represents the area of the grassland; and C S g l denotes the carbon sequestration coefficient of grassland. According to the research of Zhang et al., the grassland types in Wuhan are mainly improved grassland and artificial grassland [36], and the carbon absorption coefficient is 2.4 t/km2.
Water area has carbon sequestration capacity, and the formula for calculating carbon sinks in water area is as follows:
C w = S w × C S w
where C w denotes the carbon sink of water area; S w represents the area of water area; and C S w is the carbon sequestration coefficient of water area. Based on the research results of Duan et al. [37], the carbon sequestration coefficient of water area is 21.8 t/km2.

3.4.2. The Relationship Between the “Three-Zone Space” Classification and Carbon Emission/Sequestration Inventories

The “Three-Zone Space” is classified into three levels (Table 1). The first-level classification corresponds to the “Three Zones and Three Lines” of the NTSP, and the territorial space is divided into urban, agricultural, and ecological spaces, which correspond to the urbanized areas, the main agricultural production areas, and key ecological functional areas in the national main functional area plan. The second-level classification subdivides the first-level classification by considering the ecological-production-living function and practicality of the territorial space. Urban, agricultural, and ecological spaces are further classified into seven sub-categories: urban production space (UPS), urban living space (ULS), agricultural production space (APS), rural living space (RLS), water ecological space (WES), forestland ecological space (FES), and grassland ecological space (GES). The third-level classification links to the land use classification system.
We established a relationship between the “Three-Zone Space” classification and carbon emission accounts by connecting carbon emission and sequestration inventories to the “Three-Zone Space” (Figure 3).
As our study classified the carbon emissions from animal husbandry energy consumption into the RLS, the GES in this study does not carry carbon emissions. For the calculation of carbon emissions of population respiration, respiratory carbon emissions of urban population and rural population were divided according to the proportion of the urban and rural population. Similarly, urban solid waste and rural solid waste carbon emissions, urban living sewage and rural living sewage carbon emissions were allocated according to the proportion of urban and rural population. Carbon emissions from energy consumption in each industry were calculated based on the final energy consumption of energy in each industry. The level data were calculated based on the ratio of the output value of Wuhan and Hubei province. As the final consumption value of agriculture, forestry, animal husbandry, and fishery was comprehensive, the calculation process was based on the proportion of the output value of Wuhan’s agriculture, forestry, animal husbandry, and fishery industries.

3.5. Decomposition of Net Carbon Emissions in “Three-Zone Space”

3.5.1. The Extended Kaya Identity

We adopted the extended Kaya identity for this study to decompose the driving factor of carbon emissions. The extended Kaya identity is shown as follows:
C = C i S i × S i S × S G D P × G D P P × P
where C is the total amount of net carbon emissions; C i represents the net carbon emissions of the i-th “Three-Zone Space” type; S i is the area of the i-th “Three-Zone Space” type; S denotes the total “Three-Zone Space” area; G D P represents the gross domestic product; and P denotes the total population. The formula is expressed as follows:
e i = C i S i ;   l i = S i S ;   s e = S G D P ;   g = G D P P
C = e i × l i × s e × g × P
where e i represents the carbon emission intensity of the territorial space; l i represents the spatial structure of the territorial space; s e denotes the utilization efficiency of the territorial space; g represents the economic level; and P denotes the population size.

3.5.2. Logarithmic Mean Divisia Index (LMDI) Decomposition Method

To further analyze the contribution of each driving factor to net carbon emissions in “Three-Zone Space”, we used the LMDI decomposition method to calculate the effect of each driving factor as follows:
C = C t C 0 = e i + l i + s e + g + P
l i = C i t C i 0 l n C i t l n C i 0 l n l i t l i 0
s e = C i t C i 0 l n C i t l n C i 0 l n s e t s e 0
g = C i t C i 0 l n C i t l n C i 0 l n g t g 0
P = C i t C i 0 l n C i t l n C i 0 l n P t P 0
e i = C i t C i 0 l n C i t l n C i 0 l n e i t e i 0
where C t is the net carbon emissions in “Three-Zone Space” of the t year; C 0 is the carbon emissions in “Three-Zone Space” of the base year; and the five driving factors can be further divided into four groups: scale effect ( g , P ), structure effect ( l i ), intensity effect ( e i ), and efficiency effect ( s e ).

3.6. Simulation of Future Carbon Emissions and Sequestration in “Three-Zone Space”

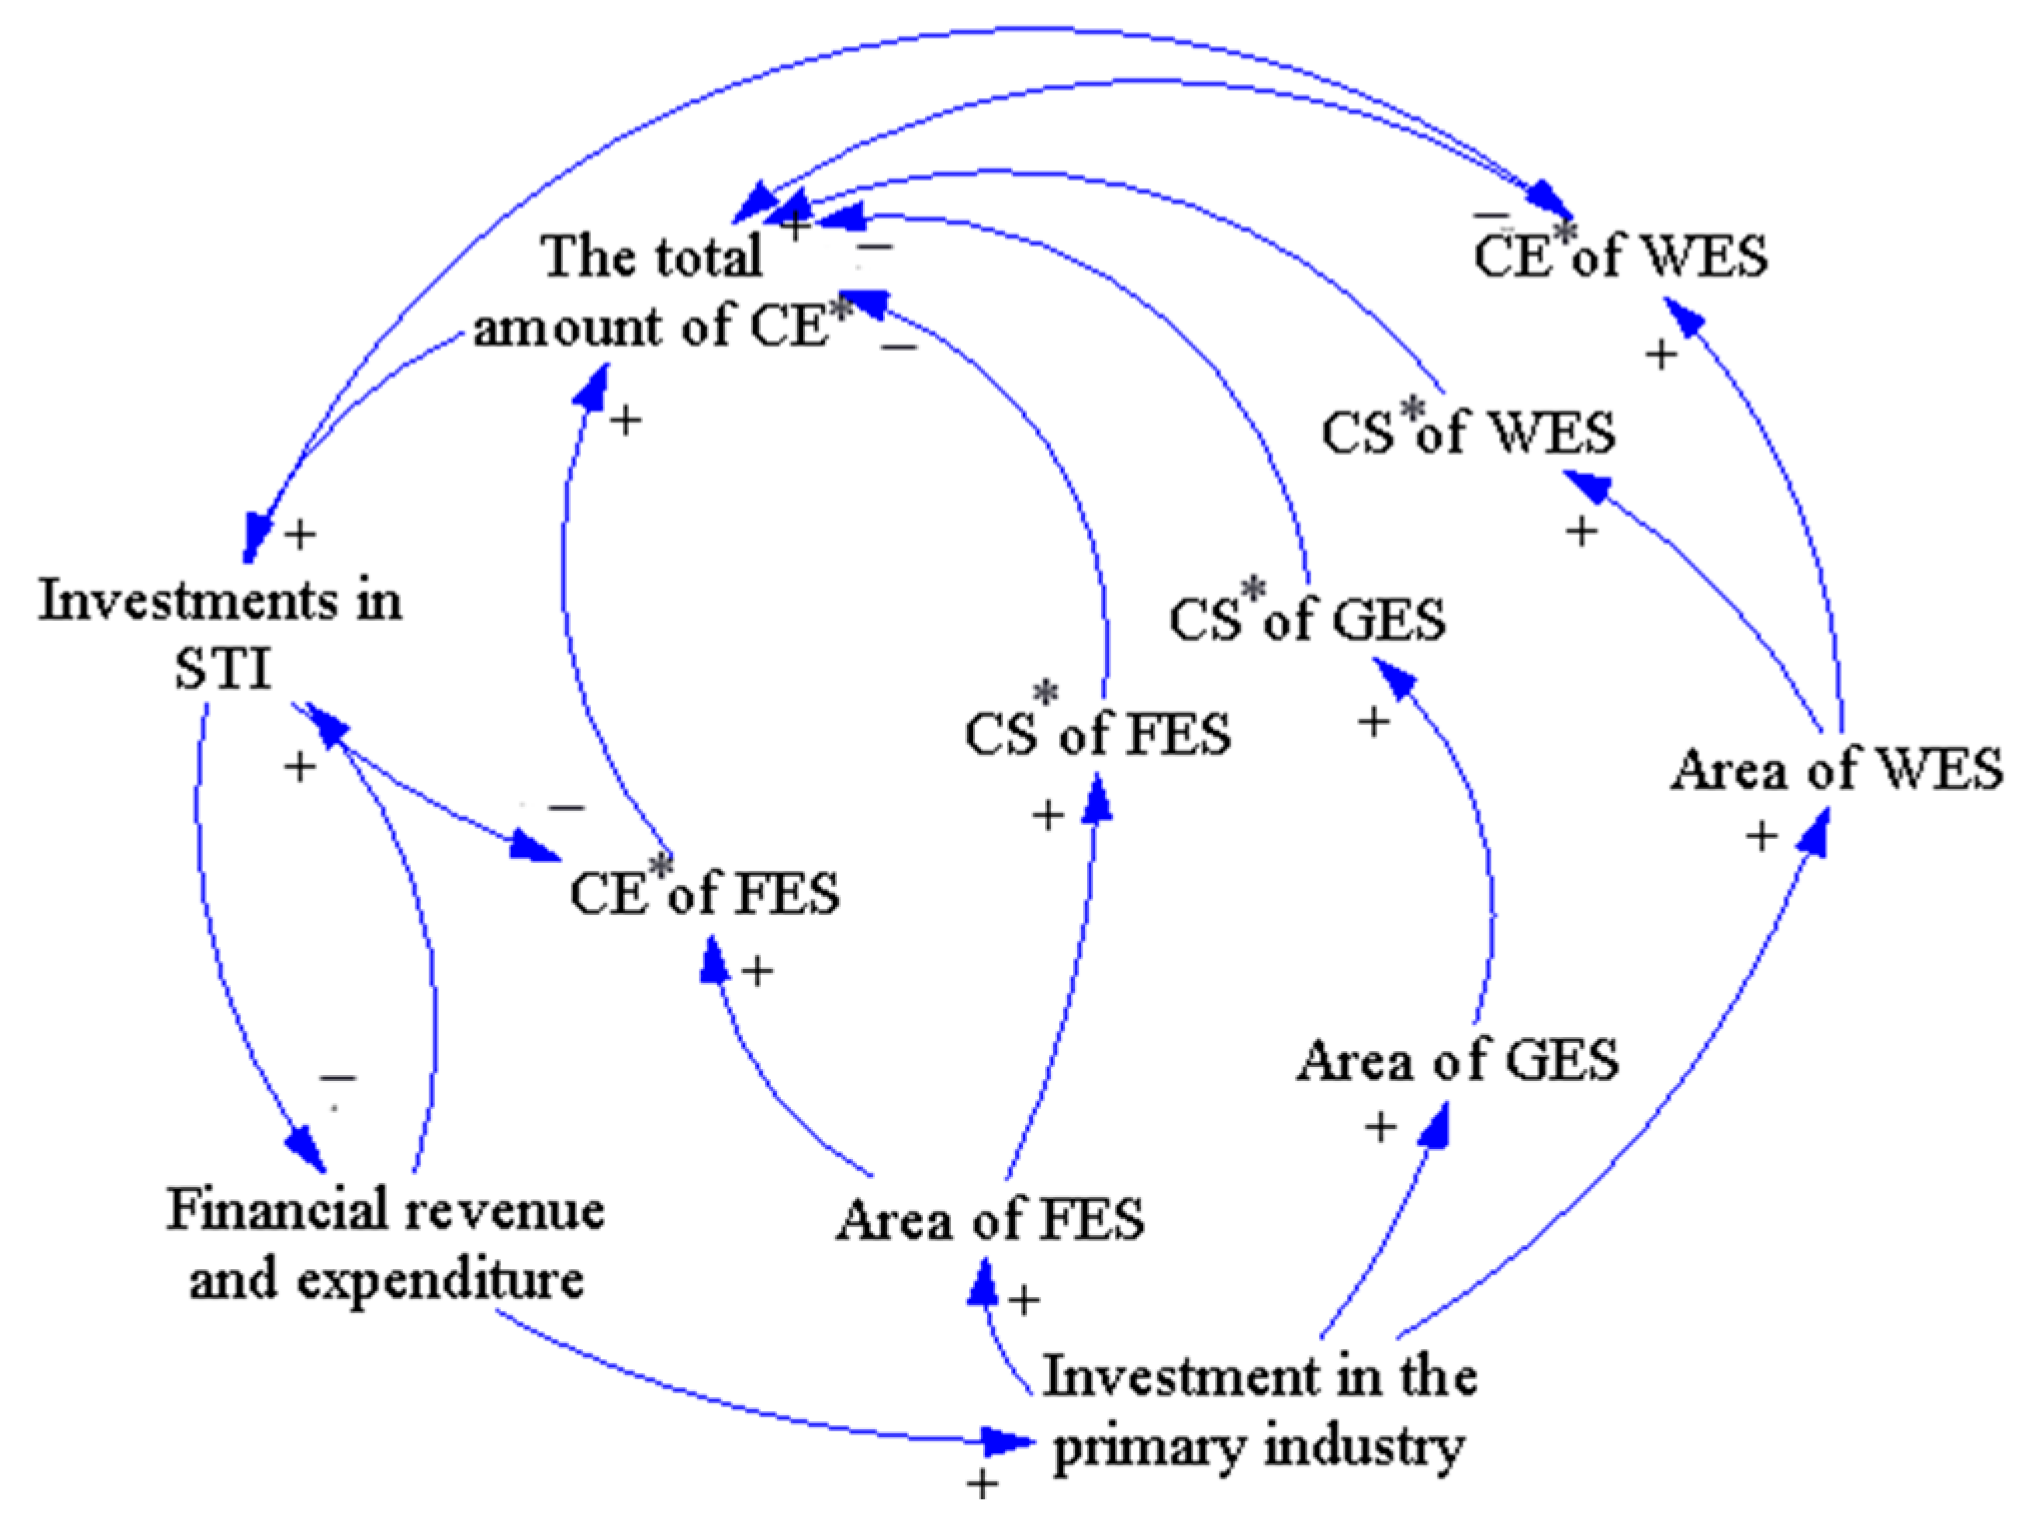
3.6.1. System Dynamic Model

The Vensim PLE 7.3.5 was then used to constructed the SD model. The SD model constructed for this study mainly included three subsystems: the urban space, agricultural space, and ecological space. The simulation period of the SD model was 2000–2035 with a time step of one year. The historical simulation stage corresponded to 2000–2020. The base year of the scenario simulation was 2000, and changes in future carbon emissions in “Three-Zone Space” were simulated under different policy scenarios. The stock flow diagram of the SD model of the carbon emission of Wuhan’s “Three-Zone Space” is shown in Figure 4.
(1)
The urban space subsystem
Urban space (UPS) is an important carrier of social and economic development. On one hand, UPS carries industrial production activities and service industries, drives the development of secondary and tertiary industries, and promotes economic development. On the other hand, the ULS has important social functions, mainly in that it is the living space of the urban population, to meet the housing needs of the urban population. Therefore, urban space accounts for a large amount of carbon emissions from both production and the life of the urban population.
Economic development increases the consumption of productive energy, waste, and wastewater, resulting in an increase in carbon emissions in urban space [38]. Economic development also affects the investment in fixed assets in various industries, and thus affects the area of different types of territory space [39]. The increase in investment in fixed assets in the secondary and tertiary industries promotes the growth of UPS and ULS. However, economic development also leads to an increase in investment in scientific and technological innovation, which may improve energy efficiency and low-carbon technologies in industrial production, reducing carbon emissions in urban spaces [40].
Increases in the total amount of carbon emissions may also prompt governments to invest more funds in scientific and technological innovation for carbon emission reductions. The causal chains of the urban space subsystem are shown in Figure 5.
(2)
The agricultural space subsystem
Agricultural space mainly carries the life and production activities of the rural population. On one hand, APS provides food for human beings and ensures national food security. On the other hand, RLS provides a place for rural residents to live. Therefore, agricultural space not only carries the carbon emissions from agricultural energy consumption, the carbon emissions from the agricultural production process, and the methane emissions from rice field cultivation, but also carries the carbon emissions from rural life. The investment of fixed assets in different industries will affect the area of different types of territorial space. The increase in investment in the primary industry will lead to the expansion of APS. The increase in APS leads to the increase in energy consumption in agricultural production; the increase in the use of chemical fertilizers, agricultural film, and pesticides in the agricultural production process; and the increase in rice fields, thereby increasing carbon emissions.
Investment in scientific and technological innovation can help improve energy efficiency and reduce carbon emissions from energy consumption in RLS [41]. Increases in total carbon emissions will also prompt the government to invest more funds in scientific and technological innovation for carbon emission reductions. Causal chains of the agricultural space subsystem are shown in Figure 6.
(3)
The ecological space subsystem
Ecological space has an important carbon sink function. FES, GES, and WES all have carbon absorption capacity. FES and WES also contribute carbon emissions from forestry and fishery energy consumption. An increase in investment in the primary industry may lead to the expansion of FES, GES, and WES, and this will not only increase their carbon sequestration, but also increase the carbon emissions from forestry and fishery energy consumption. The causal chains of the ecological space subsystem are shown in Figure 7.

3.6.2. Scenario Design

With the continuous transformation of the mode of economic production and continuous adjustment of the industrial structure, China has gradually moved from high to low energy consumption. The proportion of traditional industries has gradually decreased, and the proportion of service industries in the national economy has continued to rise [42]. In the future, the trend will be to adjust the structure of primary, secondary, and tertiary industries, and develop a tertiary industry with low energy consumption and low pollution [43]. The dynamic model of the carbon emission in Wuhan’s “Three-Zone Space” shows that investment in fixed assets is the main factor affecting the industrial structure. For this reason, the fixed asset investment ratios of the primary, secondary, and tertiary industries were used in the adjustment model to simulate the impact of industrial structure adjustment on carbon emissions from the “Three-Zone Space” in Wuhan. According to Gu et al., the industry optimization scenario was set to keep the primary industry investment unchanged, to decrease the secondary industry fixed asset investment by 3%, and to increase the tertiary industry fixed asset investment by 3% [44].
Technological progress is a necessary condition for economic growth, and one which helps to change the mode of industrial production, in turn affecting energy consumption and carbon emissions [45]. The dynamic model shows that the input of scientific and technological innovation is the main factor affecting the progress of science and technology. For this reason, the impact of scientific and technological progress on the carbon emission of Wuhan’s “Three-Zone Space” was simulated by adjusting the proportion of scientific and technological innovation input in the model. The scientific and technological progress scenario was set as a 3% increase in scientific and technological innovation investment based on Chen et al. [46].
There are significant differences in the intensity of carbon emissions in “Three-Zone Space”. Construction land is the carrier for human production and life, resulting in the carbon emissions of construction land carrying most of the carbon emissions [47]. China’s construction land use has shifted from the incremental era to the stock era, and the traditional extensive land use model is no longer suitable for the current development situation of China [48]. Therefore, shrinking the supply of construction land not only helps to promote the efficient and intensive use of construction land, but also helps to reduce emissions [49]. At the same time, the quantity of arable land is related to food security, and a large amount of arable land has been occupied in the process of urbanization. The “14th Five-Year Plan for Territorial Space of Wuhan City” proposes to resolutely prevent the tendency of “non-agriculturalization” of arable land, and strengthen the prevention and control of various types of non-agricultural land. From the previous 2000–2020 “Three-Zone Space” carbon sink calculation results in Wuhan City, woodland is the most important carbon sink in Wuhan City. The “14th Five-Year Plan for Territorial Space of Wuhan City” also proposes to strengthen the protection of forest resources through artificial afforestation and other methods to improve the quality of ecological functions and carbon sinks. Therefore, reducing the occupation of forest land for construction has great significance for increasing the amount of ecological space. On this basis, referring to the research of Yang and Wu, the optimization scenario of territorial spatial structure was set to reduce the area of construction land by 10%, increase the area of cultivated land by 5%, and increase the area of forest land by 5% [50].
Previous studies have shown that an increase in population increases energy consumption, resulting in an increase in carbon emissions [51]. The dynamic model of Wuhan’s carbon emission from the “Three-Zone Space” shows that population has a significant impact on carbon emissions in both urban and RLS. Our study set the baseline scenario (BS), the industrial structure optimization scenario (IO), the scientific and technological progress scenario (TP), the territorial space structure optimization scenario (SO), the population adjustment scenario (PC), and the integrated scenario (CH), as shown in Table 2.

3.6.3. Historical Simulation and Model Verification

Historical testing uses model prediction values to test the consistency of historical data values, this is also an important way to detect the accuracy and validity of the model [45]. By comparing the historical data values with the predicted values of the model, the relative error of the two is calculated. The smaller the absolute value, the higher the accuracy of the model and the more effective it is. For our study, Wuhan’s GDP, total population, carbon emissions from APS, carbon emissions from ULS and carbon sinks from FES were selected as the test variables for the model historical simulation test. The simulation relative error was calculated using the following formula:
μ = P X X ( % )
where μ represents the relative error; P is the historical actual value; and X denotes the simulated value.
The simulation results show that the relative errors of the five variables are within 10%, indicating that the results of the system simulation have a high degree of fit to the true values (Supplementary Materials Tables S7–S11). The SD model of the carbon emission system of Wuhan’s territorial space in this study is effective and reflects well the actual situation of TSCE in Wuhan.

3.7. Intelligent Decision-Making Index (IDMI) Decision Analysis

The Intelligent Decision-Making Index (IDMI) method is a multi-criteria decision-making approach proposed by Hu et al., that helps decision-makers in making the correct choice among various options [29]. Compared to other methods, the IDMI method has advantages of simplicity, ease of operation, relative objectivity, internal linkage, and the ability to take account of the influence of key indicators. The IDMI value is a numerical value without units or physical significance. Before implementing the IDMI method, it is feasible to select one or two key indicators that can be selected as the evaluation criteria for decision analysis, and then the IDMI values can be calculated for each scheme. The result with the minimum value is considered the optimal scheme.
When there are no key indicators:
I D M I i = j = 1 n   C i j , i = 1,2 , m
When there is only one key indicator:
I D M I i = j = 1 n 1     C i j × C n , i = 1,2 , m
When there are two key indicators:
I D M I i = j = 1 n 2     C i j × C n × C n 1 , i = 1,2 , m
where I D M I denotes the I D M I value of scheme i ; m represents the number of available schemes; n is the number of indicators; C i j indicates the value of indicator j in scheme i ; C n denotes the first key indicator; and C n 1 is the second key indicator. The detailed calculation process is shown in Supplementary Materials.

4. Results

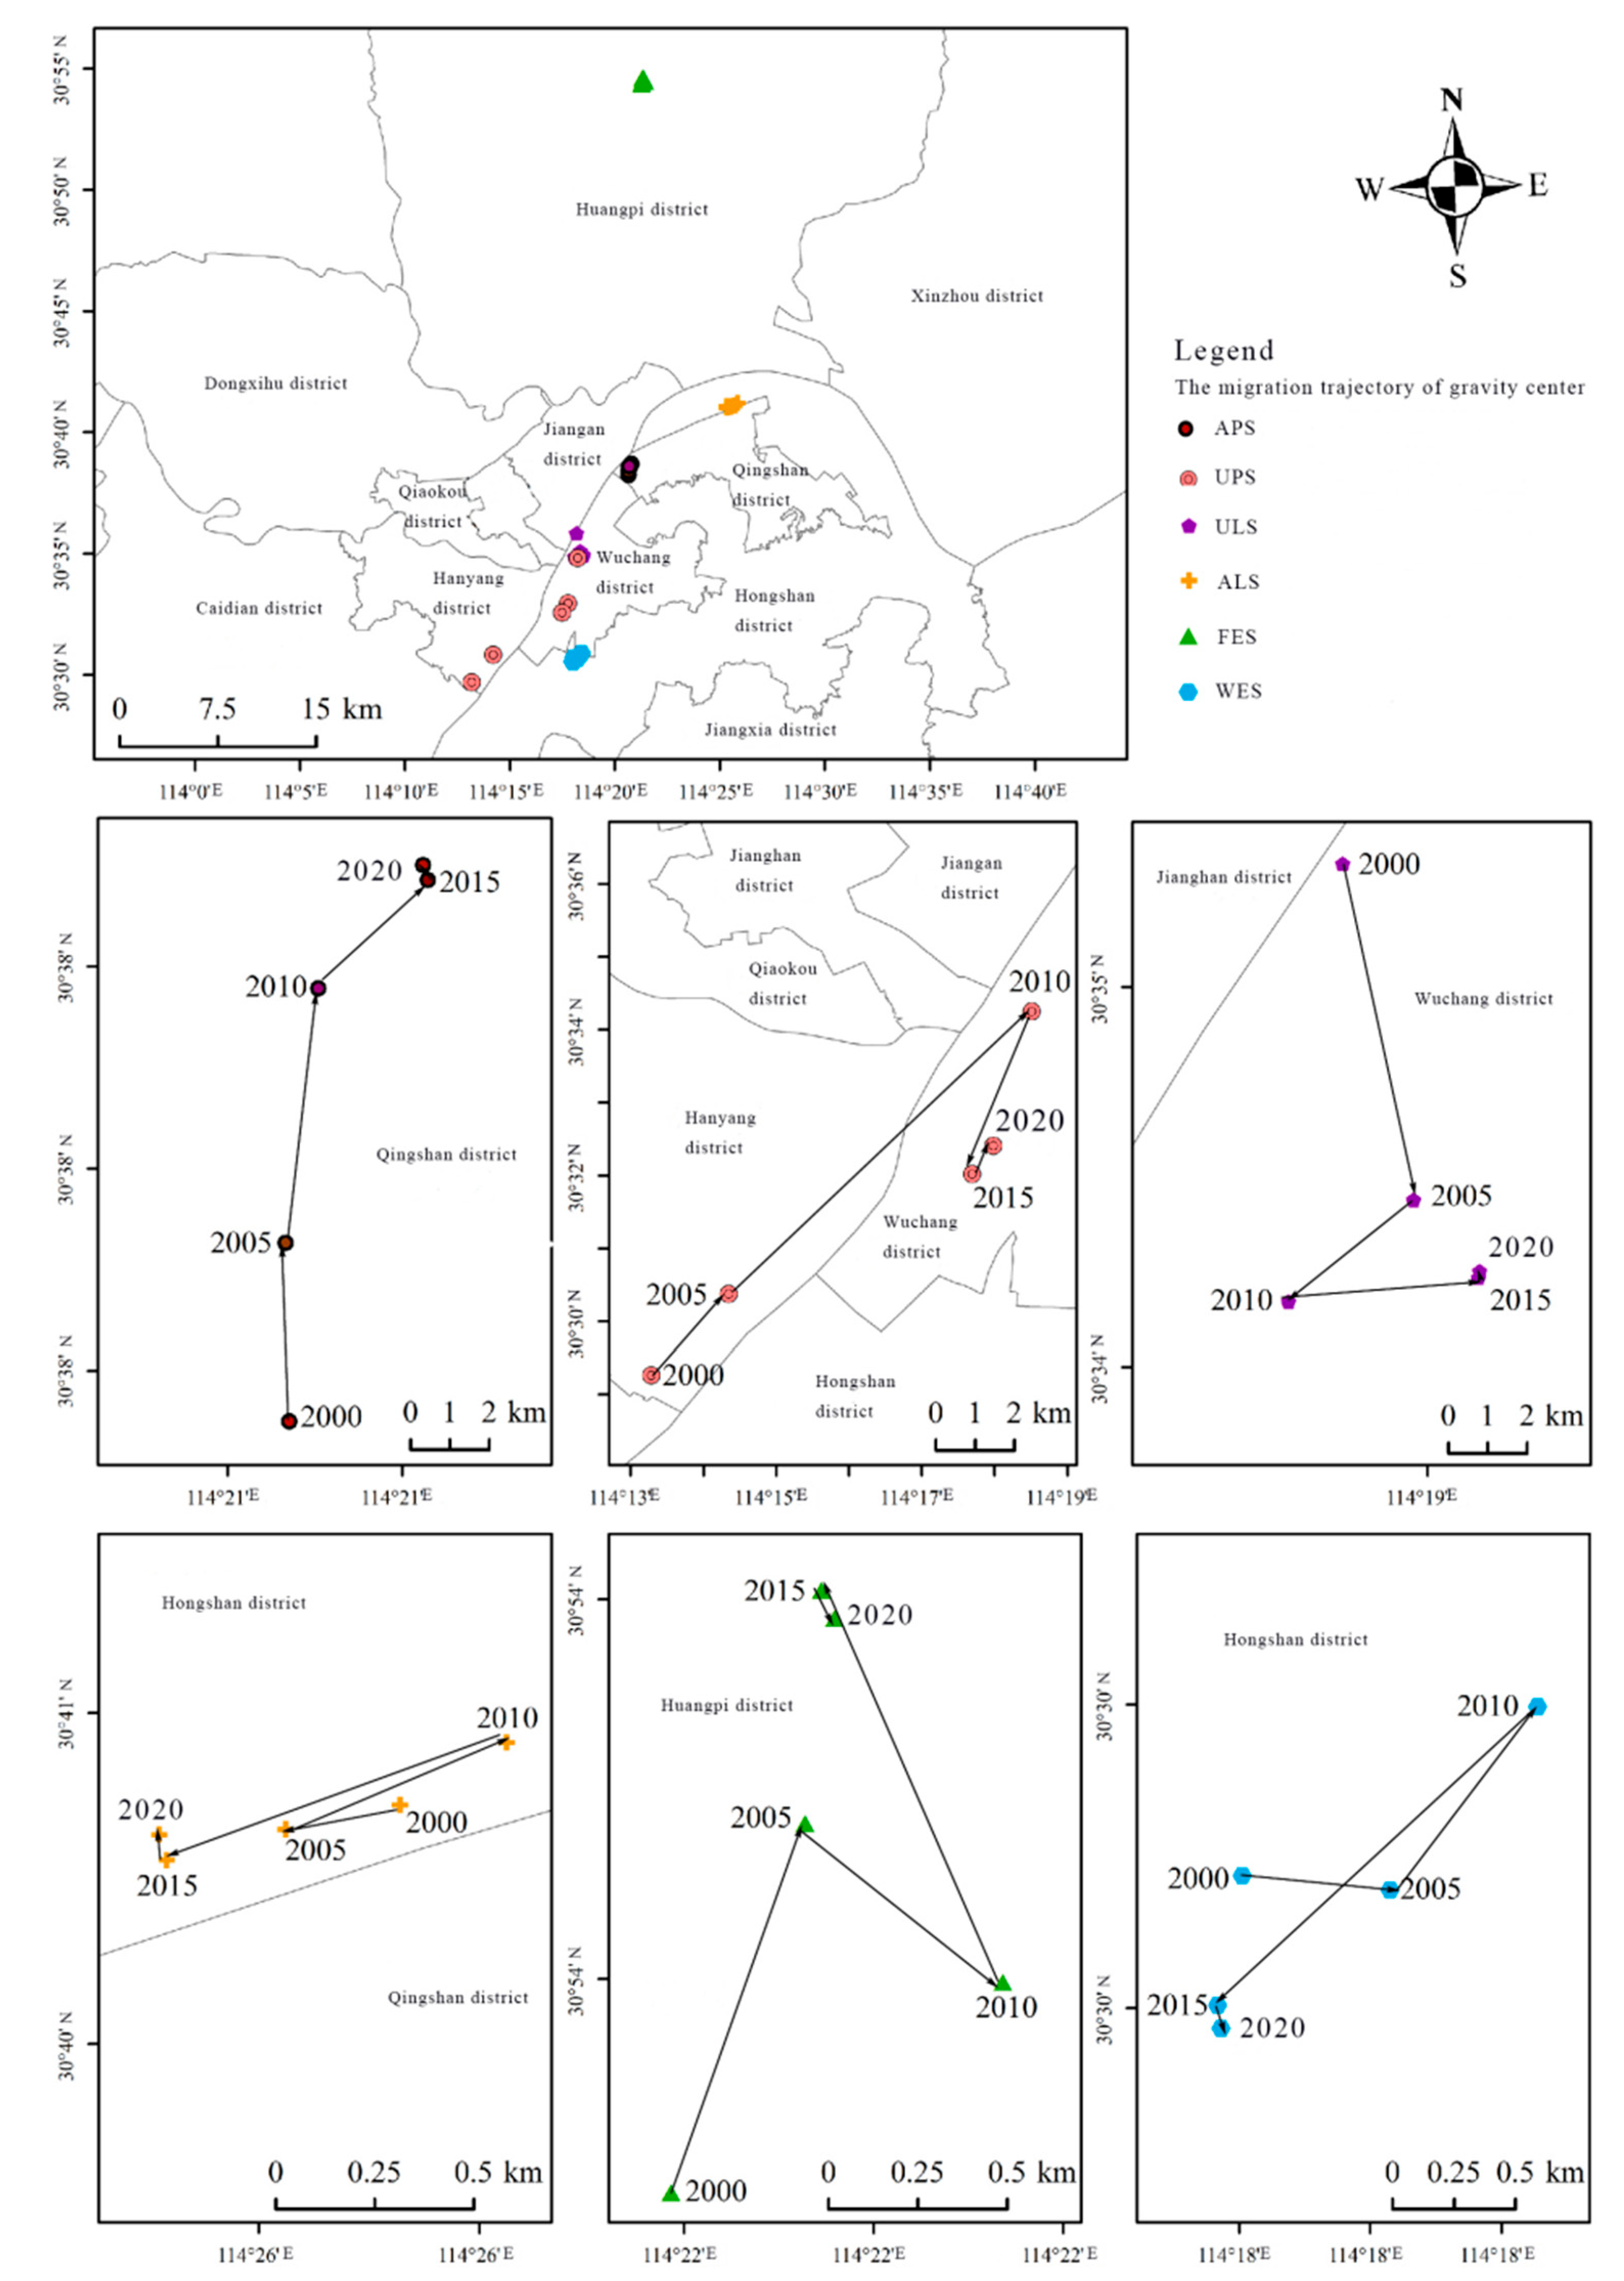
4.1. Spatial-Temporal Changes in Net Carbon Emissions in “Three-Zone Space” from 2000 to 2020

The temporal changes in net carbon emissions in “Three-Zone Space” from 2000 to 2020 are listed in Table 3. Over the study period, the carbon emissions in “Three-Zone Space” increased from 18.589 Mt in 2000 to 42.794 Mt in 2020, with an annual increasing rate of 6.51%. Carbon emissions from UPS were the highest, and showed a fluctuating upward trend, while those from ULS increased from 0.889 Mt in 2000 to 3.081 Mt in 2020, an increase of 3.46 times. Carbon emissions from RLS increased from 1.589 Mt in 2000 to 1.787 Mt in 2020, an increase of 1.13-fold and carbon emissions from APS showed a downward trend, from 0.499 Mt in 2000 to 0.478 Mt in 2020, a decrease of 4.15%. FES carbon emissions were the lowest, with carbon emission less than carbon sequestration. However, the carbon sequestration of FES showed a downward trend during the study period, indicating that processes to increase forest ecological space should be strengthened in the future. The net carbon emissions of WES showed an increasing trend, from −0.018 Mt in 2000 to 0.004 Mt in 2020. From 2000 to 2010, the WES net carbon emission was negative, indicating that the carbon sequestration role of the WES was more significant than its role as a source of carbon. This reversed between 2015 and 2020, with the WES net carbon emission becoming positive.
Carbon emissions from APS showed a downward trend, from 0.499 Mt in 2000 to 0.478 Mt in 2020, a decrease of 4.15%. FES carbon emissions were the lowest, with carbon emission less than carbon sequestration. However, the carbon sequestration of FES showed a downward trend during the study period, indicating that the work on increasing forest ecological space should be strengthened in the future. Grassland ecological space plays the role of a carbon sink, and GES carbon emissions were stable. The net carbon emissions of WES showed an increasing trend, from −0.018 Mt in 2000 to 0.005 Mt in 2020. From 2000 to 2010, the WES net carbon emission was negative, indicating that the carbon sink role of the WES was more significant than its role as a source of carbon. This reversed between 2015 and 2020, with the WES net carbon emission becoming positive.
To investigate the spatial variation in carbon emissions and sequestration across the “Three-Zone Space” of Wuhan, this study employed a gravity center migration model to determine the longitude and latitude of the carbon emissions and sequestration gravity center in Wuhan from 2000 to 2020. The ArcGIS software 10.8 was then used to create a gravity center migration map and calculate the migration distance of the carbon emissions and sequestration gravity center within “Three-Zone Space” (Figure 8 and Figure 9).
With the exception of the FES’s carbon emission center, which was located in Huangpi district, all other carbon emission centers lay in the central urban area, indicating that this area hosted most of the carbon emissions. Specifically, the carbon emission center of the APS was situated in the northwest of Qingshan district, while that of the FES is consistently found in central Huangpi district. The carbon emission center of the WES is located in the southwest of Hongshan district, and the ULS’s carbon source center is in the northwest of Wuchang district. The RLS’s carbon emission center is in the northwest of Hongshan district, and the UPS’s carbon emission centers are in the south of Hanyang district as well as the northwest and southwest of Wuchang district. The center of gravity for ULS carbon emissions shifted generally to the southeast, suggesting a notable increase in carbon emissions from ULS in that region. The UPS’s center of gravity shifted much farther to the northeast than to the southwest, indicating a substantial increase in carbon emissions from urban production activities in the northeastern region. The carbon emission center of APS moved northeastward during the study period, and the carbon emissions from agricultural production in the northwest of Qingshan district showed an obvious growth trend. The carbon source center of the FES shifted more toward the northeast than the northwest, suggesting a substantial increase in forestry-related energy consumption emissions in the northeastern region during the study period.
The carbon sequestration center of the FES was predominantly located in the central and southern areas of Huangpi district. The GES’s carbon sequestration center was largely concentrated in central and northern Hongshan district, except in 2010, when it was situated in central and eastern Wuchang district. Likewise, the WES’s carbon sequestration center primarily occupied southwestern Hongshan district, except in 2010, when it was found in central and eastern Wuchang district. The carbon sequestration center of FES and GES indicated a trend of migrating to the northeast, and the carbon sequestration center of WES showed a trend of migrating to the southwest. The migration distance of the carbon sequestration centers followed the order: GES > WES > FES. This indicated that the carbon sequestration center in GES underwent the greatest fluctuations during the study period.

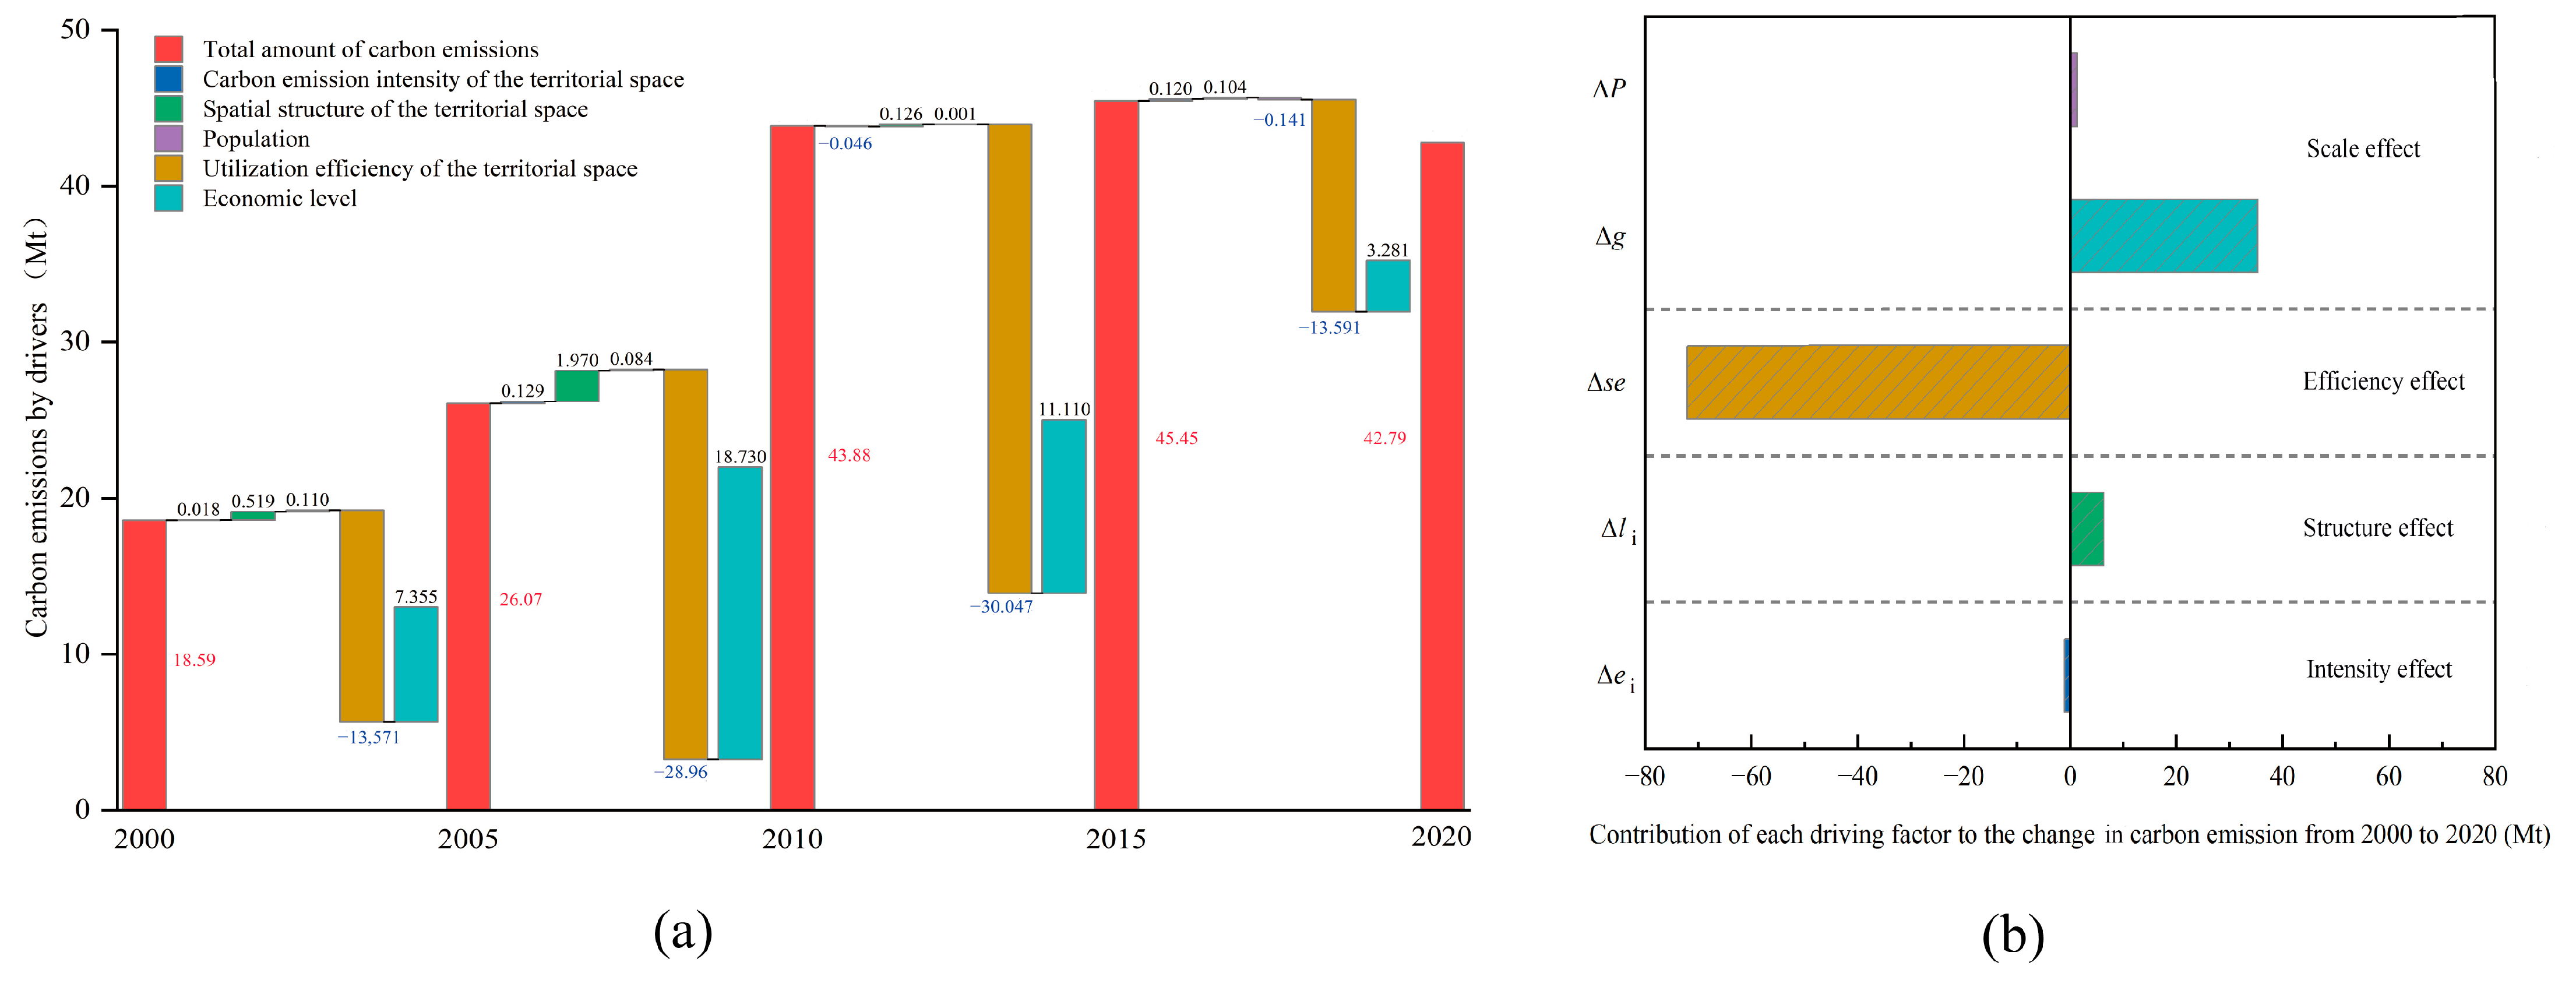
4.2. Logarithmic Mean Divisia Index (LMDI) Decomposition Results

The driving effects and contribution values of each factor for net carbon emissions are shown in Figure 10.
Between 2000 and 2020, the economic level emerged as the primary driver of net carbon emission growth, contributing to an increase of 36.412 Mt. The territorial spatial structure ranked as the second-largest factor, resulting in a growth of 6.321 Mt. Population size also played a role in carbon emission growth, contributing to an increase of 1.315 Mt. Conversely, the efficiency of territorial spatial utilization and the carbon emission intensity of territorial space acted as inhibiting factors on net carbon emissions. Notably, the efficiency of territorial spatial utilization exhibited a more pronounced inhibiting effect. The efficiency of territorial spatial utilization and the intensity of carbon emissions contributed to a decrease in net carbon emissions by 72.073 and 1.003 Mt, respectively.
As for the scale effect, the economic level consistently exhibited a positive contribution value in various periods, highlighting its influential role in driving net carbon emissions. The contribution value of the economic level exhibited a fluctuating downward trend, with a peak value of 18.7302 Mt observed between 2005 and 2010. Subsequently, there was a significant decrease in the contribution value from 2010 to 2015. The observed trend can be attributed to Wuhan’s commitment to optimizing its industrial structure, strengthening environmental governance and ecological construction, and promoting the concept of green and low-carbon development during the 12th Five-Year Plan period. These efforts led to significant energy conservation and emission reduction in key industries. Population size had a positive impact on net carbon emissions, primarily due to increased energy consumption and respiration associated with population growth [46]. Over the study period, the population of Wuhan exhibited an upward trend. While the contribution rate of population size was smaller compared to the economic level and territorial spatial structure, the influence of population size on net carbon emissions should not be disregarded. In particular, the implementation of China’s three-child policy could potentially exacerbate net carbon emissions [52].
In terms of the structural effect, the territorial spatial structure had a significant role in net carbon emissions during the study period. However, the contribution value of territorial spatial structure showed a fluctuating downward trend, increasing to 1.9702 Mt during the period of 2005–2010, suggesting that changes in territorial spatial structure during this period had a significant impact on net carbon emissions. Implementing the Rise of Central China Plan stimulated Wuhan to actively enhance the level of industrial development during the 11th Five-Year Plan period, resulting in the rapid expansion of UPS [28].
In terms of the intensity effect, the carbon emission intensity of territorial space exhibited varying effects during different time periods. From 2010 to 2015, the carbon emission intensity of territorial space showed a mitigating effect on net carbon emissions. However, during the periods of 2000–2005, 2005–2010, and 2015–2020, the carbon emission intensity of territorial space played a role in promoting net carbon emissions.
The figures also show that the contribution value of territorial space efficiency was consistently negative across different periods, but its contribution rate exhibited an upward trend. This indicates that territorial space efficiency had a substantial inhibitory effect on the growth of net carbon emissions during the study period.

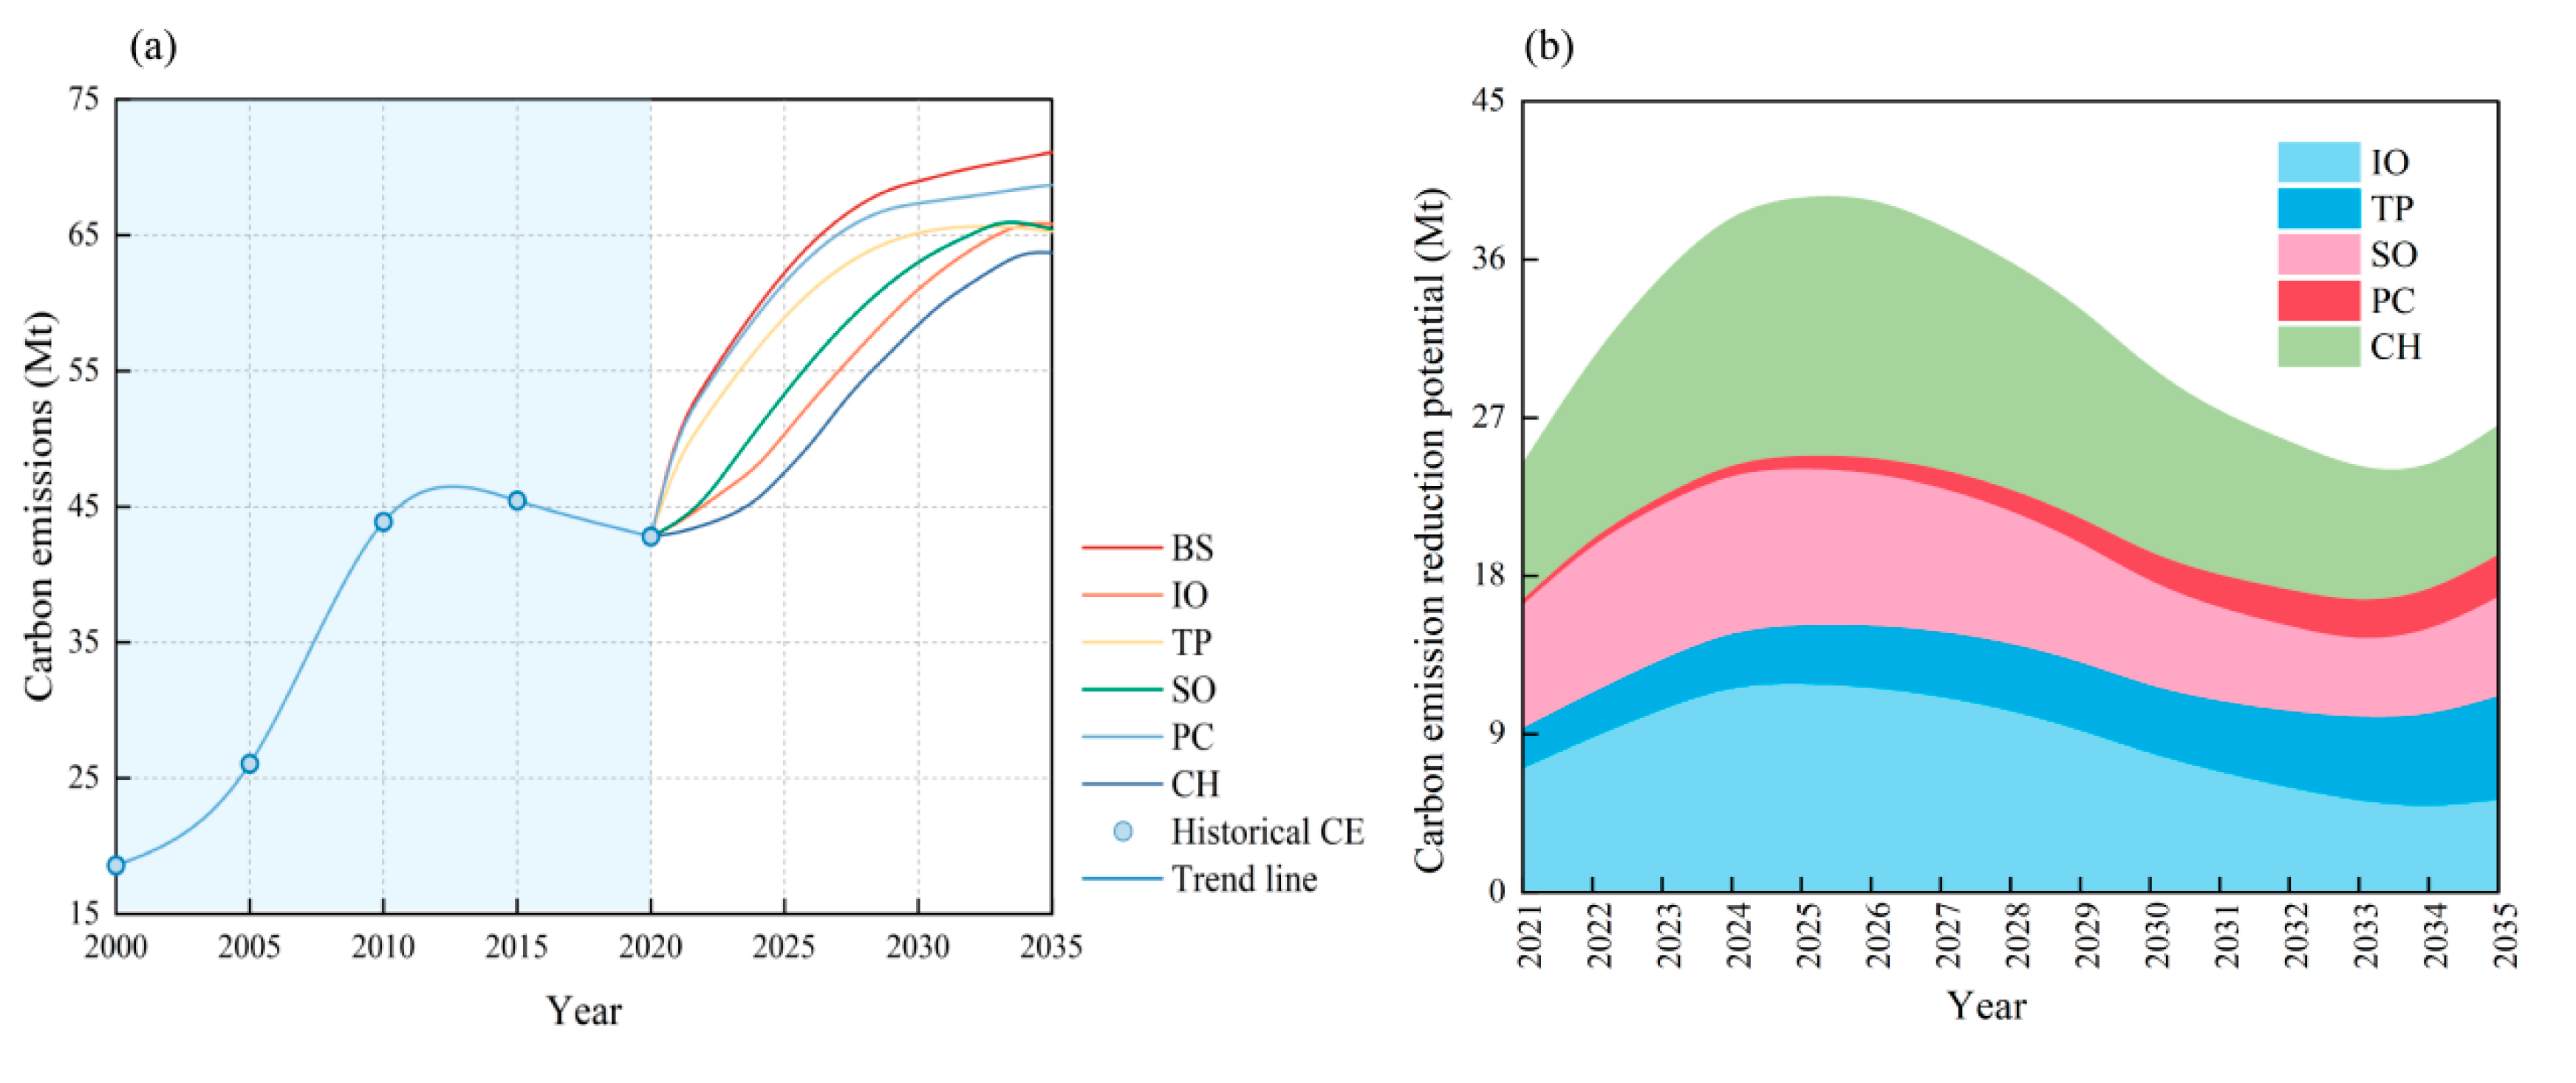
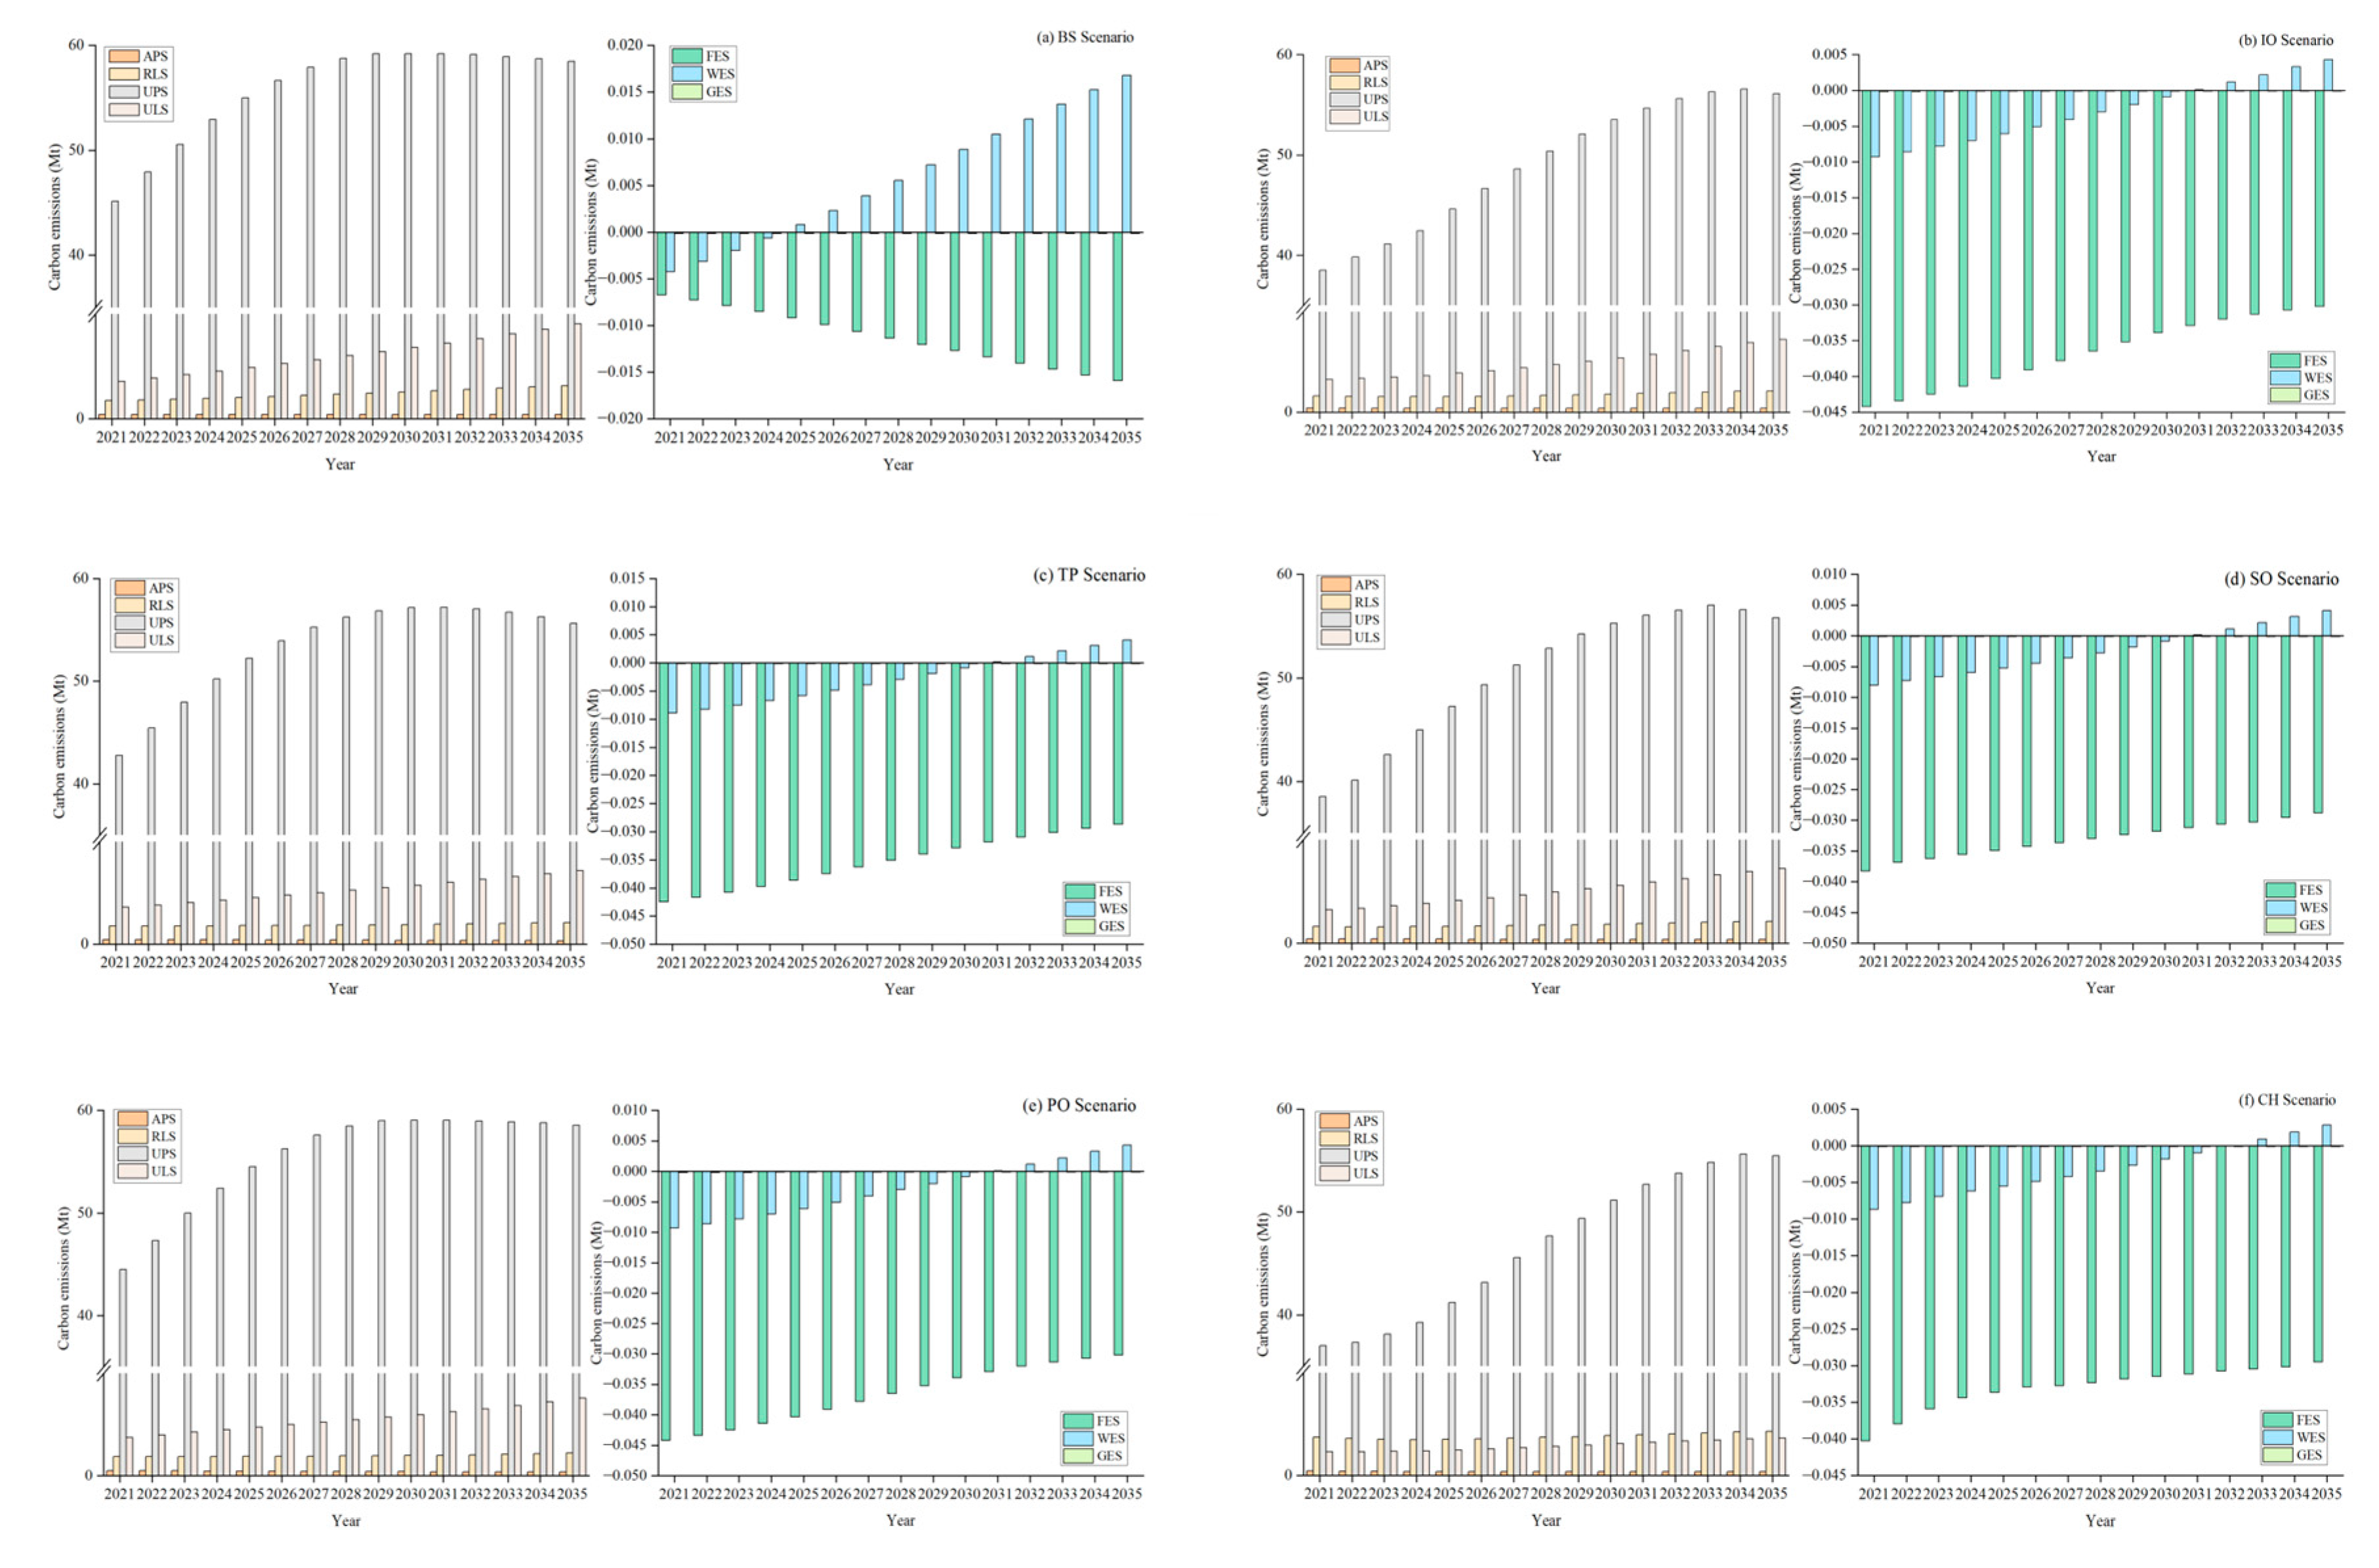
4.3. Scenario Analysis of Net Carbon Emissions in “Three-Zone Space” from 2021 to 2035

The simulation results of net carbon emissions in “Three-Zone Space” under different policy scenarios from 2021 to 2035 in Wuhan are shown in Figure 11. Net carbon emissions under six scenarios rank as: BS > PC > IO > SO > TP > CH. Specifically, the BS predicts that the net carbon emissions will reach 71.102 Mt by 2035, while net carbon emissions under PC, IO, SO, TP, and CH scenarios were projected to reach 68.687 Mt, 65.804 Mt, 65.446 Mt, 65.215 Mt, and 63.712 Mt, respectively, in 2035.
Among the four single measures (PC, IO, SO, and TP scenarios), the TP scenario had the best emission reduction effect with reduction potential of 5.852 Mt in 2035 relative to the BS scenario, followed by the 5.657 Mt emission reduction effect of SO scenario, relative to the BS scenario. The IO scenario had an emission reduction potential of 5.298 Mt. It revealed a trend of an initial increase and then a decrease, indicating that adjusting the industrial structure had a gradually weakening effect on carbon emission reduction. The PC scenario had an emission reduction potential of 2.416 Mt, and showed an upward trend. The increase rate was relatively stable, indicating a gradual increase in the effect of the total population control policy on carbon emission reduction. The CH scenario had the largest emission reduction potential at 7.391 Mt in 2035.
In terms of carbon peaking time, the IO and CH scenarios were shown to achieve carbon peaks in the year 2034, with values of 65.914 Mt and 63.797 Mt, respectively. The TP and SO scenarios would achieve carbon peaks in the year 2032 and 2033, with values of 65.652 Mt and 66.018 Mt, respectively. However, these results were still far from the NDC goal of peaking in 2030 or earlier [53].
To show the carbon emissions and sequestration in different types of “Three-Zone Space” under various scenarios, a more detailed breakdown of net carbon emissions is presented in Figure 12.
Carbon emissions from urban space were at their lowest under the CH scenario, reaching 59.091 Mt in 2035. This was followed by the TP scenario, with carbon emissions of 62.812 Mt. UPS emerged as the predominant source of carbon emissions under the five scenarios. Carbon emissions from UPS also experienced an inverted “V” trend under different scenarios, and carbon emissions from UPS in the CH scenario had the largest emission reduction potential of 3.013 Mt in 2035 relative to the BS scenario. Carbon emissions from ULS showed a continually increasing trend. In the CH scenario, ULS had the largest emission reduction potential of 5.428 Mt in 2035 in relation to the BS scenario.
In the TP scenario, agricultural space had the lowest carbon emissions, reaching 2.464 Mt in 2035, followed by 2.471 Mt in the SO scenario. RLS showed an upward trend in the five scenarios, with the greatest reduction potential (1.040 Mt) in the TP scenario relative to the BS scenario. The carbon emissions of APS showed a downward trend in all scenarios. Compared to the BS scenario, APS in the TP scenario had the greatest carbon reduction potential of 0.080 Mt in 2035.
In terms of the carbon sequestration from ecological space, the CH scenario gave the highest carbon sequestration level out of all the scenarios, reaching −0.0268 Mt in 2035. Next was the PO scenario, with a carbon sequestration level of 0.0261 Mt in 2035. Although FES was a carbon sequestration in all five scenarios, its carbon sequestration level showed a declining trend. From 2021 to 2035, the WES moved from being a carbon sequestration to a carbon source in all scenarios. This indicates that the carbon emissions from WES would be constantly increasing. The CH scenario led to the lowest carbon emissions for WES with a value of 0.003 Mt in 2035, followed by the TP scenario with a value of 0.004 Mt in 2035. Under the five scenarios, the carbon sink of GES showed a stable state without significant change.

4.4. Decision Analysis of Emission Reduction Paths

To decide between the scenarios, the focus should not only be on the level of emission reductions, but also on achieving high-quality societal and economic development [54]. The economic, ecological, and social benefits of each emission reduction path should be considered, and the optimal carbon emission reduction path should be selected according to the goal of ensuring stable societal and economic development and the protection of the ecological environment. We analyzed the economic, ecological, and social benefits of carbon emission reduction pathways under IO, TP, SO, PC, and CH scenarios with a view to selecting the optimal path. We initially selected six variables to evaluate the economic, ecological, and social benefits of different emission reduction scenarios: GDP and per capita GDP were selected as the economic benefit indicators, the population density and the area of farmland were selected as the social benefit indicators, and the carbon sink of territorial space and carbon emission intensity of territorial space were selected as the ecological benefit indicators. From the standardized processing results of the initial data and the IDMI method, we obtained the IDMI evaluation value. Detailed procedures are shown in Supplementary Materials.
When the economic benefit of the emission reduction path was emphasized (the key variable of per capita GDP was selected), the PC scenario was the preferred path (Table 4). When the social benefit of the emission reduction path was emphasized (the key variable of farmland was selected), the rank of the IDMI value was: CH > PC > IO > SO > TP. When the ecological benefit of the emission reduction path was emphasized (the key variable of carbon emission intensity of the territorial space was selected), the rank of the IDMI value was: CH > PC > SO > TP > IO scenario. The CH scenario proved to be the optimal emission reduction path in scenarios that emphasized social benefits or ecological benefits. When the economic, social, and ecological benefits of the emission reduction path were emphasized (no key variables are selected), the CH scenario has the smallest IDMI value, indicating that this path had the optimal benefits for the economy, society, and ecology. The detailed IDMI calculation process is shown in Supplementary Materials.

5. Discussion

Our simulation results demonstrate that Wuhan is projected to reach its carbon peak as early as 2032, which is slightly later than the estimates of Yu et al. [55]. This discrepancy can be attributed to the broader scope of our carbon emissions calculation system, as well as the inclusion of more influencing factors in our simulation compared to the factors considered in the STIRPAT model used by Yu et al. [55].
Among single measures, the TP path led to the greatest carbon reduction, consistent with the conclusions of some previous studies [14,24]. There are two main reasons for this. One is that investments in scientific and technological innovations contribute to improving energy efficiency, thereby reducing energy intensity and carbon emissions. The other is that such investments foster the development of low-carbon technologies, thereby reducing carbon emissions from industrial production and waste disposal processes.
Our study results show that the effect of IO on carbon emission reduction from 2021 to 2035 would gradually weaken. This is because the demand for fossil energy from the secondary industry is much greater than from the tertiary industry, leading to more carbon emissions in the former. Reduced investments in the secondary industry would help steer the gradual withdrawal of backward industries, leading to reduced carbon emissions.
The results show that the effect of PC on carbon emission reduction would gradually increase from 2021 to 2035. The main reason is that the projected population for 2035 is estimated to be 16.6 million, representing a growth of 34.7% compared to 2020, with an average annual growth rate of 2.3%. The population projection for the PC scenario in 2035 is based on forecast data derived from The Territory Space Plan of Wuhan City (2021–2035). Consequently, the population of Wuhan is anticipated to maintain a steady growth trend in the future, thereby indicating an increasing effectiveness of the PC scenario regarding emission reductions. Our results are in line with the result of Ding et al. [56], whose research findings suggested that the Chinese population will undergo a gradual and modest increase between 2021 and 2035. This demographic trend is anticipated to contribute to an increase in carbon emissions.
Unlike other studies that solely focused on carbon emissions on the city scale, our results highlight the differences in future carbon emission trends for “Three-Zone Space” under varying policy scenarios. For urban and ecological spaces, an integrated path (CH) was the most effective scenario. For agricultural spaces, TP had the largest potential to reduce emissions. This finding highlights that a focus on low-carbon agricultural production technologies is required to reduce emissions in agricultural spaces [57].
In previous studies, scholars analyzed the optimal emission reduction path from different perspectives. Gu et al. used coupled LMDI and SD models to explore determinants of the change in CO2 emissions during 1995–2016 and to predict the emission mitigation potential from 2016 to 2030 in Shanghai [44]. Their results showed that the integration of all reduction measures had the largest mitigation potential. An et al. concluded that the Chinese steel industry had the ability to reduce CO2 emissions by 818.3 Mt between 2015 and 2030 and found that the most effective strategy to decarbonize was to promote low-carbon technologies [58]. In this study, we applied the IDMI decision analysis for the selection of the optimal emission reduction path. This method provides decision-making preferences for policymakers on the benefits of carbon emission reduction, allowing them to choose the optimal emission reduction pathway in line with the development phase and goals. This approach moves beyond solely evaluating the carbon emission reduction potential to a more comprehensive approach that emphasizes the coordinated development of economy, society, and ecology.

6. Conclusions and Policy Implications

6.1. Conclusions

This study developed a research framework encompassing emission accounting, driving factor decomposition, prediction, and decision analysis for analyzing carbon emissions and sequestration in “Three-Zone Space”. The carbon emission and sequestration inventories for “Three-Zone Space” in Wuhan were constructed through the establishment of the corresponding relationship of the “Three-Zone Space” and carbon emission and sequestration inventories. The LMDI method was applied to analyze driving factors of net carbon emissions in “Three-Zone Space” in Wuhan from 2000 to 2020. Furthermore, an SD model of the carbon emissions and sequestration in “Three-Zone Space” was established to predict and simulate emission and sequestration trajectories under various reduction scenarios from 2021 to 2035. Based on the IDMI decision analysis, the optimal carbon reduction pathways were systematically identified. The key findings are as follows.
First, from 2000 to 2020, net carbon emissions increased significantly, rising from 18.589 to 42.795 Mt at an average annual growth rate of 6.51%. The primary contributors to these emissions were UPS and ULS. The carbon emission center of APS, UPS, and FES showed a trend of migrating to the northeast, the WES and RLS showed a trend of migrating to the southwest, and the ULS showed a trend of migrating to the southeast. The carbon sequestration center of FES and GES exhibited a trend of migrating to the northeast, and the carbon sequestration center of WES indicated a trend of migrating to the southwest.
Second, the driving factor analysis indicated that economic growth, territorial spatial structure, and population size were the main contributors to the increase in net carbon emissions, with economic growth contributing the most (36.412 Mt). In contrast, the efficiency of territorial spatial utilization and the intensity of carbon emissions in territorial space served as mitigating factors, with spatial utilization efficiency playing a particularly significant role in curbing emissions.
Third, among individual emission reduction policies, the TP scenario was the most effective, followed by the SO, IO, and PC scenarios. The comprehensive emission reduction measure exhibited the highest potential, achieving a reduction of 7.391 Mt by 2035. The scenario analysis showed that the CH scenario was the most effective for emission reduction in urban and ecological spaces, while the TP scenario provided the greatest reduction potential in agricultural spaces.
Fourth, optimal emission reduction pathways varied based on government priorities. When economic benefits were prioritized, the PC scenario emerged as the optimal pathway. Conversely, when social or ecological benefits were emphasized, the CH scenario became the preferred choice. Notably, when balancing economic, social, and ecological objectives, the CH scenario consistently proved to be the optimal pathway.

6.2. Policy Implications

Our findings indicate that the comprehensive scenario combining industrial structure optimization, scientific and technological progress, territorial space structure optimization, and population adjustment exhibits greater potential for achieving emission reductions and provides superior economic, social, and ecological benefits compared to single emission reduction measures. The emission reduction recommendations for “Three-Zone Space” are as follows.
For urban space, the government should strengthen the control of territorial space planning and use, and encourage the intensive and low-carbon development of urban space. According to the “14th Five-Year Plan for Wuhan Territorial Space”, the area of urban construction land in Wuhan will be expanded in the future. Therefore, the new round of NTSP should be based on controlling the function of land, strictly controlling the disorderly expansion of construction land, and optimizing the structure and layout of territorial space. The structural adjustment of industrial land should be guided, upgrading to clean and high-value-added industries. There should be strict controls on the supply of industrial land with high energy consumption and high pollution in some areas, and constraints on carbon emission intensity. Carbon emission reduction indicators should be integrated into the NTSP indicator system to guide the urban intensive and low-carbon development model and create an efficient and intensive, low-carbon and livable urban spatial system.
For ecological spaces, the ecological restoration of national territorial space should be strengthened, and an ecological space with high carbon sequestration capacity should be developed. The FES, GES, and WES are important carbon sink spaces in Wuhan. However, in the process of rapid urbanization, a large amount of carbon sink land in Wuhan has been eroded, which has been detrimental for ecosystems and has reduced their carbon sequestration capacity. It is necessary to improve the protection system for woodland, grassland, and lakes to stabilize existing areas of carbon storage. Moreover, the ecological restoration of territory space—for example, by returning farmland to wetland, the ecological restoration of mines and woodland, and the improvement in lakes—would help to increase carbon sinks within ecosystems. In the process of implementing ecological restoration projects, the core concept of natural restoration should be followed and a carbon sink upgrading plan formulated for local conditions. The integrated governance of landscapes, forests, lakes, grass, and sand should be strengthened along with the role of ecological restoration to improve the carbon sink capacity of territorial space.
The results show that TP has the most significant effect on the emission reductions in agricultural space. Therefore, the adoption of low-carbon agricultural technology should be considered for agricultural space emission reductions. We recommend improving the use of agricultural resources by improving crop cultivation, irrigation, and management patterns. These practices help optimize resource use, reduce fertilizer and pesticide inputs, improve soil health, and enhance carbon sequestration of agricultural land. Moreover, carbon emissions caused by livestock can be mitigated by optimizing feed varieties, improving the nutritional quality of roughage, and rationally using feed additives as the main means to reduce intestinal methane emissions of ruminants. The implementation and scale-up of such low-carbon agricultural production technologies are critical to achieving emission reduction targets in the agricultural sector.

6.3. Limitations

Nevertheless, this study has some limitations. First, we calculated the spatial carbon emissions of Wuhan city based on the coefficient method, mostly using statistical data and previous research results. In future studies, multi-source data such as nighttime light data and net ecosystem productivity could be integrated to improve the accuracy of carbon emission accounting. Second, the relationship between carbon emission accounts and “Three-Zone Space” could be further refined. Due to the limitation of data acquisition, different land use types in UPS and ULS were not divided in detail in this study, which may have some impact on the accuracy of the results. Third, the territorial carbon emission system is a complex system with many interacting factors. In this study, only representative influencing factors were selected, and some complex and difficult-to-obtain factors were simplified. Therefore, future studies could consider selecting more comprehensive influencing factors and combining other optimization methods to characterize the interaction and feedback mechanisms among various factors in the territorial carbon emission system in depth. This would enable more accurate simulations of the future carbon emissions.

Supplementary Materials

The following supporting information can be downloaded at: https://www.mdpi.com/article/10.3390/land14020245/s1.

Author Contributions

Conceptualization, Y.W.; methodology, Y.W.; software, H.L.; validation, Y.W., Y.F. and H.L.; formal analysis, Y.W.; investigation, Y.W.; resources, Y.W.; data curation, Z.S.; writing—original draft preparation, Y.W.; writing—review and editing, Y.W.; visualization, Y.W. and Y.F.; supervision, Y.W.; project administration, Y.W.; funding acquisition, Y.W. All authors have read and agreed to the published version of the manuscript.

Funding

This work was supported by the Youth Foundation of the School of Public Administration, China University of Geosciences (CUGGG-2301), and the “CUG Scholar” Scientific Research Funds at the China University of Geosciences (Wuhan) (2022128).

Data Availability Statement

The original contributions presented in the study are included in the article, further inquiries can be directed to the corresponding author.

Conflicts of Interest

The authors declare no conflicts of interest.

References

  1. Jin, G.; Guo, B.; Deng, X. Is there a decoupling relationship between CO2 emission reduction and poverty alleviation in China? Technol. Forecast. Soc. Change 2020, 151, 119856. [Google Scholar] [CrossRef]
  2. Adger, W.N.; Barnett, J.; Heath, S.; Jarillo, S. Climate change affects multiple dimensions of well-being through impacts, information, and policy responses. Nat. Hum. Behav. 2022, 6, 1465–1473. [Google Scholar] [CrossRef] [PubMed]
  3. O’Neill, B.C. Envisioning a future with climate change. Nat. Clim. Change 2023, 13, 874–876. [Google Scholar] [CrossRef]
  4. UNFCCC. Adoption of the Paris Agreement. 2015. Available online: http://unfccc.int/resource/docs/2015/cop21/eng/l09r01.pdf (accessed on 15 June 2023).
  5. UNFCCC. FCCC/CP/2021/L.13/CP.26—Glasgow Climate Pact. 2021. Available online: https://unfccc.int/sites/default/files/resource/cp2021_L13adv.pdf (accessed on 15 June 2023).
  6. van de Ven, D.-J.; Mittal, S.; Gambhir, A.; Lamboll, R.D.; Doukas, H.; Giarola, S.; Hawkes, A.; Koasidis, K.; Köberle, A.C.; McJeon, H.; et al. A multimodel analysis of post-Glasgow climate targets and feasibility challenges. Nat. Clim. Change 2023, 13, 570–578. [Google Scholar] [CrossRef]
  7. Pianta, S.; Brutschin, E. Increased ambition is needed after Glasgow. Nat. Clim. Change 2023, 13, 505–506. [Google Scholar] [CrossRef]
  8. Wang, S.; Fang, C.; Guan, X.; Pang, B.; Ma, H. Urbanisation, energy consumption, and carbon dioxide emissions in China: A panel data analysis of China’s provinces. Appl. Energy 2014, 136, 738–749. [Google Scholar] [CrossRef]
  9. Wang, S.; Wang, J.; Fang, C.; Feng, K. Inequalities in carbon intensity in China: A multi-scalar and multi-mechanism analysis. Appl. Energy 2019, 254, 113720. [Google Scholar] [CrossRef]
  10. Wang, W.; Wang, W.; Xie, P.; Zhao, D. Spatial and temporal disparities of carbon emissions and interregional carbon compensation in major function-oriented zones: A case study of Guangdong province. J. Clean. Prod. 2020, 245, 118873. [Google Scholar] [CrossRef]
  11. Xinhua Agency. Opinions of the CPC Central Committee and the State Council on the Establishment and Supervision of Territorial Space Planning System. 2019. Available online: https://www.gov.cn/zhengce/2019-05/23/content_5394187.htm (accessed on 20 June 2024).
  12. Liu, Y.; Zhou, Y. Territory spatial planning and national governance system in China. Land Use Policy 2021, 102, 105288. [Google Scholar] [CrossRef]
  13. Fang, K.; Tang, Y.; Zhang, Q.; Song, J.; Wen, Q.; Sun, H.; Ji, C.; Xu, A. Will China peak its energy-related carbon emissions by 2030? Lessons from 30 Chinese provinces. Appl. Energy 2019, 255, 113852. [Google Scholar] [CrossRef]
  14. Luo, X.; Liu, C.; Zhao, H. Driving factors and emission reduction scenarios analysis of CO2 emissions in Guangdong-Hong Kong-Macao Greater Bay Area and surrounding cities based on LMDI and system dynamics. Sci. Total Environ. 2023, 870, 161966. [Google Scholar] [CrossRef] [PubMed]
  15. Lee, J.; Akashi, Y.; Takaguchi, H.; Sumiyoshi, D.; Lim, J.; Ueno, T.; Maruyama, K.; Baba, Y. Forecasting model of activities of the city-level for management of CO2 emissions applicable to various cities. J. Environ. Manag. 2021, 286, 112210. [Google Scholar] [CrossRef] [PubMed]
  16. Zhan, J.; Wang, C.; Wang, H.; Zhang, F.; Li, Z. Pathways to achieve carbon emission peak and carbon neutrality by 2060: A case study in the Beijing-Tianjin-Hebei region, China. Renew. Sustain. Energy Rev. 2024, 189, 113955. [Google Scholar] [CrossRef]
  17. Barrett, J.; Peters, G.; Wiedmann, T.; Scott, K.; Lenzen, M.; Roelich, K.; Le Quéré, C. Consumption-based GHG emission accounting: A UK case study. Clim. Policy 2013, 13, 451–470. [Google Scholar] [CrossRef]
  18. Wang, Y.; Zhang, H.; Zhang, C.; Liu, C. Is ecological protection and restoration of full-array ecosystems conducive to the carbon balance? A case study of Hubei Province, China. Technol. Forecast. Soc. Change 2021, 166, 120578. [Google Scholar] [CrossRef]
  19. Chen, W.; Lei, Y.; Feng, K.; Wu, S.; Li, L. Provincial emission accounting for CO2 mitigation in China: Insights from production, consumption and income perspectives. Appl. Energy 2019, 255, 113754. [Google Scholar] [CrossRef]
  20. Wu, S.; Hu, S.; Frazier, A.E. Spatiotemporal variation and driving factors of carbon emissions in three industrial land spaces in China from 1997 to 2016. Technol. Forecast. Soc. Change 2021, 169, 120837. [Google Scholar] [CrossRef]
  21. Le Quéré, C.; Korsbakken, J.I.; Wilson, C.; Tosun, J.; Andrew, R.; Andres, R.J.; Canadell, J.G.; Jordan, A.; Peters, G.P.; van Vuuren, D.P. Drivers of declining CO2 emissions in 18 developed economies. Nat. Clim. Change 2019, 9, 213–217. [Google Scholar] [CrossRef]
  22. Wang, X.; Cai, Y.; Liu, G.; Zhang, M.; Bai, Y.; Zhang, F. Carbon emission accounting and spatial distribution of industrial entities in Beijing—Combining nighttime light data and urban functional areas. Ecol. Inform. 2022, 70, 101759. [Google Scholar] [CrossRef]
  23. Azar, C.; Johansson, D.J.A. DICE and the Carbon Budget for Ambitious Climate Targets. Earths Future 2021, 9, e2021EF002041. [Google Scholar] [CrossRef]
  24. Yang, H.; Li, X.; Ma, L.; Li, Z. Using system dynamics to analyse key factors influencing China’s energy-related CO2 emissions and emission reduction scenarios. J. Clean. Prod. 2021, 320, 128811. [Google Scholar] [CrossRef]
  25. Hao, J.; Gao, F.; Fang, X.; Nong, X.; Zhang, Y.; Hong, F. Multi-factor decomposition and multi-scenario prediction decoupling analysis of China’s carbon emission under dual carbon goal. Sci. Total Environ. 2022, 841, 156788. [Google Scholar] [CrossRef] [PubMed]
  26. Maheen, R.; Cai, L.; Zhang, Y.; Zhao, M. Quantitative analysis of carbon dioxide emission reduction pathways: Towards carbon neutrality in China’s power sector. Carbon Capture Sci. Technol. 2023, 7, 100112. [Google Scholar] [CrossRef]
  27. Li, G.; Chen, X.; You, X.-Y. System dynamics prediction and development path optimization of regional carbon emissions: A case study of Tianjin. Renew. Sustain. Energy Rev. 2023, 184, 113579. [Google Scholar] [CrossRef]
  28. Zhang, F.; Deng, X.; Phillips, F.; Fang, C.; Wang, C. Impacts of industrial structure and technical progress on carbon emission intensity: Evidence from 281 cities in China. Technol. Forecast. Soc. Change 2020, 154, 119949. [Google Scholar] [CrossRef]
  29. Hu, E.; Abley, W.; Zou, L. Environmental related decision making using the Interlink Decision Making Index (IDMI). Int. J. Environ. Waste Manag. 2008, 2, 257–266. [Google Scholar] [CrossRef]
  30. Chuai, X.; Huang, X.; Wang, W.; Zhao, R.; Zhang, M.; Wu, C. Land use, total carbon emissions change and low carbon land management in Coastal Jiangsu, China. J. Clean. Prod. 2015, 103, 77–86. [Google Scholar] [CrossRef]
  31. Wen, J.; Chuai, X.; Zuo, T.; Huifen Cai, H.; Cai, L.; Zhao, R.; Chen, Y. Land use change on the surface area and the influence on carbon. Ecol. Indic. 2023, 153, 110400. [Google Scholar] [CrossRef]
  32. NDRC (National Development and Reform Commission). The Guidelines for the Preparation of Provincial GHG Inventories (Trial). 2011. Available online: https://scholar.google.com/scholar_lookup?title=Guidelines%20for%20the%20Preparation%20of%20Provincial%20Greenhouse%20Gas%20Inventories%20(Trial)&author=National%20Development%20and%20Reform%20Commission&publication_year=2011 (accessed on 20 June 2024).
  33. Wu, H.; Huang, H.; Chen, W.; Meng, Y. Estimation and spatiotemporal analysis of the carbon-emission efficiency of crop production in China. J. Clean. Prod. 2022, 371, 133516. [Google Scholar] [CrossRef]
  34. Tian, Y.; Yin, M. Reestimation of agricultural carbon emissions in China: Basic status, dynamic evolution and spatial spillover effect. China Rural. Econ. 2022, 104–127. [Google Scholar]
  35. Fang, J.; Guo, Z.; Piao, S.; Chen, A. Estimation of China’s terrestrial vegetation carbon sink from 1981 to 2000. Sci. China (Ser. D Earth Sci.) 2007, 50, 804–812. [Google Scholar]
  36. Zhang, J.; Zhang, A.; Dong, J. Carbon emission effect analysis and factor decomposition of land use in Wuhan urban circle. Resour. Environ. Yangtze River Basin 2014, 23, 595–602. [Google Scholar]
  37. Duan, X.; Wang, X.; Lu, F.; Ou, Z. Current status and potential of carbon sequestration in wetland ecosystems in China. Chin. J. Ecol. 2008, 463–469. [Google Scholar]
  38. Chen, X.; Di, Q.; Jia, W.; Hou, Z. Spatial correlation network of pollution and carbon emission reductions coupled with high-quality economic development in three Chinese urban agglomerations. Sustain. Cities Soc. 2023, 94, 104552. [Google Scholar] [CrossRef]
  39. Tong, D.; Chu, J.; MacLachlan, I.; Qiu, J.; Shi, T. Modelling the Impacts of land finance on urban expansion: Evidence from Chinese cities. Appl. Geogr. 2023, 153, 102896. [Google Scholar] [CrossRef]
  40. Li, R.; Li, L.; Wang, Q. The impact of energy efficiency on carbon emissions: Evidence from the transportation sector in Chinese 30 provinces. Sustain. Cities Soc. 2022, 82, 103880. [Google Scholar] [CrossRef]
  41. Adebayo, T.S.; Ullah, S.; Kartal, M.T.; Ali, K.; Pata, U.K.; Ağa, M. Endorsing sustainable development in BRICS: The role of technological innovation, renewable energy consumption, and natural resources in limiting carbon emission. Sci. Total Environ. 2023, 859, 160181. [Google Scholar] [CrossRef]
  42. Ge, Q.; Liu, X.; Zhang, Y.; Liu, S. Has China’s Free Trade Zone policy promoted the upgrading of service industry structure?: Based on the empirical test of 185 prefecture-level cities in China. Econ. Anal. Policy 2023, 210, 100008. [Google Scholar]
  43. Du, K.; Cheng, Y.; Yao, X. Environmental regulation, green technology innovation, and industrial structure upgrading: The road to the green transformation of Chinese cities. Energy Econ. 2021, 98, 105247. [Google Scholar] [CrossRef]
  44. Gu, S.; Fu, B.; Thriveni, T.; Fujita, T.; Ahn, J.W. Coupled LMDI and system dynamics model for estimating urban CO2 emission mitigation potential in Shanghai, China. J. Clean. Prod. 2019, 240, 118034. [Google Scholar] [CrossRef]
  45. Chen, J.; Gao, M.; Mangla, S.K.; Song, M.; Wen, J. Effects of technological changes on China’s carbon emissions. Technol. Forecast. Soc. Change 2020, 153, 119938. [Google Scholar] [CrossRef]
  46. Chen, Z.; Zhao, X.; Ni, X. Scenario setting and simulation of land use carbon emission in Hunan Province based on SD method. J. Hunan Univ. Technol. 2019, 33, 67–74. [Google Scholar]
  47. Ye, X.; Chuai, X. Carbon sinks/sources’ spatiotemporal evolution in China and its response to built-up land expansion. J. Environ. Manag. 2022, 321, 115863. [Google Scholar] [CrossRef] [PubMed]
  48. Long, H.; Qu, Y. Land use transitions and land management: A mutual feedback perspective. Land Use Policy 2018, 74, 111–120. [Google Scholar] [CrossRef]
  49. Bai, Y.; Deng, X.; Gibson, J.; Zhao, Z.; Xu, H. How does urbanization affect residential CO2 emissions? An analysis on urban agglomerations of China. J. Clean. Prod. 2019, 209, 876–885. [Google Scholar] [CrossRef]
  50. Yang, H.; Wu, Q. Dynamic simulation of land use carbon emissions in Nanjing under different policy schemes. Areal Res. Dev. 2021, 40, 121–126. (In Chinese) [Google Scholar]
  51. Hong, S.; Hui, E.C.M.; Lin, Y. Relationships between carbon emissions and urban population size and density, based on geo-urban scaling analysis: A multi-carbon source empirical study. Urban Clim. 2022, 46, 101337. [Google Scholar] [CrossRef]
  52. Tang, L.; Yang, J.; Zheng, J.; Sun, X.; Cheng, L.; He, K.; Li, L.; Li, J.; Cai, W.; Wang, S.; et al. Assessing the impacts of fertility and retirement policies on China’s carbon emissions. Nat. Clim. Chang. 2024, 14, 1261–1267. [Google Scholar] [CrossRef]
  53. CSC (China’s State Council). Enhanced actions on climate change: China’s intended nationally determined contributions. 2015. Available online: http://www.gov.cn/xinwen/2015-06/30/content_2887330.htm (accessed on 26 June 2022).
  54. Deng, X.; Wang, Y.; Song, M. Development Geography for exploring solutions to promote regional development. Geogr. Sustain. 2023, 4, 49–57. [Google Scholar] [CrossRef]
  55. Yu, L. Carbon emission scenario analysis of Wuhan City based on STIRPAT model. J. Hubei Inst. Technol. 2022, 38, 1–6+16. (In Chinese) [Google Scholar]
  56. Ding, S.; Xu, N.; Ye, J.; Zhou, W.; Zhang, X. Estimating Chinese energy-related CO2 emissions by employing a novel discrete grey prediction model. J. Clean. Prod. 2020, 259, 120793. [Google Scholar] [CrossRef]
  57. Maraseni, T.; An-Vo, D.-A.; Mushtaq, S.; Reardon-Smith, K. Carbon smart agriculture: An integrated regional approach offers significant potential to increase profit and resource use efficiency, and reduce emissions. J. Clean. Prod. 2021, 282, 124555. [Google Scholar] [CrossRef]
  58. An, R.; Yu, B.; Li, R.; Wei, Y.M. Potential of energy savings and CO2 emission reduction in China’s iron and steel industry. Appl. Energy 2018, 226, 862–880. [Google Scholar] [CrossRef]
Figure 1. Research framework. * EC denotes energy consumption, CE denotes carbon emission, and CS denotes carbon sequestration.
Land 14 00245 g001
Figure 2. (a) Location of Hubei province in China, (b) location of Wuhan city in Hubei province, and (c) administrative division map of Wuhan city.
Land 14 00245 g002
Figure 3. A framework of carbon emissions and sequestration accounting in “Three-Zone Space”. * EC denotes energy consumption, CE denotes carbon emission, and CS denotes carbon sequestration.
Land 14 00245 g003
Figure 4. The feedback interactions of the variables in the system dynamic model.
Land 14 00245 g004
Figure 5. The urban space subsystem of the system dynamic model. * CE denotes carbon emissions and STI denotes scientific and technological innovation.
Land 14 00245 g005
Figure 6. The agricultural space subsystem of the system dynamic model. * CE denotes carbon emissions and STI denotes scientific and technological innovation.
Land 14 00245 g006
Figure 7. Causal chains of the ecological space subsystem. * CE denotes carbon emissions, STI denotes scientific and technological innovation, and CS denotes carbon sequestration.
Land 14 00245 g007
Figure 8. The migration trajectory of gravity center of carbon emissions in “Three-Zone Space”.
Land 14 00245 g008
Figure 9. The migration trajectory of gravity center of carbon sequestration in “Three-Zone Space”.
Land 14 00245 g009
Figure 10. Contribution of each driving factor to the change in (a) different time periods and from (b) 2000 to 2020.
Land 14 00245 g010
Figure 11. (a) Projected net carbon emissions under different scenarios and (b) carbon emission reduction potential under different scenarios.
Land 14 00245 g011
Figure 12. Projected carbon emissions and sequestration in different spaces under policy scenarios.
Land 14 00245 g012
Table 1. Classification of “Three-Zone Space”.
First-Level ClassificationSecond-Level ClassificationThird-Level
Classification
Urban
space
UPSUrban land
ULSOther construction land
Agricultural spaceAPSPaddy field, dryland
RLSRural settlements
Ecological spaceFESForested land, scrubland, open woodland, other forest land
GESHigh-coverage grassland, moderate-coverage grassland, low-coverage grassland
WESRiver and canals, lakes, reservoir, bench land
Table 2. Description of different policy scenarios.
ScenariosParameter Settings
BSThe original data of the model; each variable develops according to the natural trend.
IOThe industrial structure is adjusted and the investment in the primary industry is unchanged, making the investment in fixed assets in the secondary industry decrease by 3% and the investment in fixed assets in the tertiary industry increase by 3%.
TPInvestment in scientific and technological innovation is adjusted and investment in scientific and technological innovation by 3% is increased.
SOThe area of construction land is reduced by 10%, the area of arable land is increased by 5%, and the area of forestland is increased by 5%.
PCThe total population of Wuhan is controlled to 16.6 million in 2035 according to the requirements of the “The Territory Space Plan of Wuhan City (2021–2035)”.
CHThe parameter settings in IO, TP, SO, and PC are integrated.
Table 3. Net carbon emissions in “Three-Zone Space” (Mt).
“Three-Zone Space”20002005201020152020
ULS0.88948 1.299753.73169 3.21434 3.08103
UPS15.67990 22.16868 37.48381 39.35701 37.4863
APS0.49853 0.55665 0.52671 0.51770 0.47783
RLS1.58904 2.10596 2.19021 2.39737 1.78774
FES−0.05040 −0.04929 −0.04878 −0.04517 −0.0418
GES−0.00017 −0.00016 −0.00018 −0.00016 −0.00016
WES−0.01762 −0.01002 −0.00211 0.01111 0.00355
Table 4. IDMI values of different scenarios.
Key Variable IOTPSOPCCH
No key variable (focusing on the balance of economic, social, and ecological benefits)IDMI value2.954 2.980 2.914 2.649 2.637
Ranking45321
Per capita GDP (focusing on economic benefits)IDMI value2.954 3.138 2.927 1.926 2.178
Ranking45312
Farmland area (focusing on social benefits)IDMI value2.774 3.059 2.962 2.733 2.590
Ranking35421
Carbon emission intensity of the territorial space (focusing on ecological benefits)IDMI value2.954 2.761 2.682 2.441 2.304
Ranking54321
Note: “Carbon emission intensity of the territorial space” is defined as the ratio of total carbon emission to the area of territorial space.
Disclaimer/Publisher’s Note: The statements, opinions and data contained in all publications are solely those of the individual author(s) and contributor(s) and not of MDPI and/or the editor(s). MDPI and/or the editor(s) disclaim responsibility for any injury to people or property resulting from any ideas, methods, instructions or products referred to in the content.

