Article

Spatial Distribution Characteristics and Influencing Factors of Cultivated Land Productivity in a Large City: Case Study of Chengdu, Sichuan, China

1
Institute of Agricultural Information and Rural Economy, Sichuan Academy of Agricultural Sciences, Chengdu 610066, China
2
Sichuan Agricultural Zoning Research Association, Chengdu 610066, China
3
College of Resources and Environment, Chengdu University of Information Technology, Chengdu 610225, China
4
College of Resources, Sichuan Agriculture University, Chengdu 611130, China
*
Author to whom correspondence should be addressed.
Land 2025, 14(2), 239; https://doi.org/10.3390/land14020239
Submission received: 23 December 2024 / Revised: 13 January 2025 / Accepted: 15 January 2025 / Published: 23 January 2025
(This article belongs to the Special Issue Land Use Policy and Food Security: 2nd Edition)

Abstract

:
Given the constraints of limited cultivated land resources, ensuring and enhancing crop productivity are crucial for food security. This study takes Chengdu as a case study. Using the cultivated land productivity (CLP) evaluation model, we calculated the cultivated land productivity index (CLPI) and analyzed its spatial distribution characteristics. The Geographical Detector model was employed to identify the main factors influencing CLP, and corresponding countermeasures and measures were proposed based on the limiting degrees of these factors. The findings reveal that Chengdu’s CLP index ranges from 1231 to 3053. Global spatial autocorrelation analysis indicates a spatial agglomeration pattern in Chengdu’s overall crop productivity distribution. The local spatial autocorrelation analysis demonstrates that township (street)-level crop productivity in Chengdu is primarily characterized by “high–high”, “low–low”, and “low–high” clusters. Key factors influencing the spatial differentiation of CLP in Chengdu include the agronomic management level, soil bulk density, irrigation guarantee rate, soil body configuration, field slope, and farmland flood control standard. Interaction detection shows that there are both double-factor and nonlinear enhancements among the factors. Specifically, the interaction between soil bulk density and the agronomic management level among other factors have the most explanatory power for the spatial differentiation of CLP. The CLP in Chengdu is highly restricted by its technical level, with the agronomic management level severely limiting CLP by more than 50%. These research results provide a theoretical reference for regional high-standard farmland construction and the protection and utilization of cultivated land resources.

1. Introduction

Cultivated land, as the most fundamental means of agricultural production, serves as the material foundation of human existence and development. With rapid urbanization and industrialization in China, agricultural production spaces are inevitably being encroached upon, posing a significant challenge to the protection of cultivated land and food security [1,2,3]. China, with its huge population base and high demand for grain, faces a shortage of cultivated land resources due to its complex terrain [4]. This unique national situation necessitates more urgent assessments of cultivated land grain output to ensure food security and a stable supply [5]. China has placed great emphasis on the protection and utilization of cultivated land, establishing a new three-in-one conservation model that focuses on quantity, quality, and ecology [6,7]. Given limited cultivated land resources, enhancing cultivated land productivity (CLP) is crucial for achieving regional food security and sustainable resource and environmental development [8,9,10,11]. The CLP is a key indicator. By calculating CLP, analyzing its spatial differentiation characteristics, evaluating the comprehensive production capacity of different regions, and analyzing its utilization intensity and limiting factors, it is of great significance to enhance the productivity of cultivated land, ensure food security, and promote the sustainable development of agriculture.
In recent years, extensive analyses have been conducted on CLP both domestically and internationally [12,13,14,15]. Foreign studies primarily focus on production potential, with a notable emphasis on Agricultural Ecological Zoning (AEZ) developed by the Food and Agriculture Organization of the United Nations (FAO), which has significantly influenced methods of estimating land productivity in agricultural production management [16,17,18]. Domestic research predominantly concentrates on three aspects: The first aspect involves defining and expanding CLP; developing evaluation index systems; and paying attention to technological innovation to improve cultivation techniques [19,20,21,22,23]. The second aspect involves the development of a CLP evaluation system across various spatial scales at specific time periods or points [22,24,25], including productivity estimation [18,26,27] and the analysis of differences in spatial and temporal patterns [23,28,29]. Thirdly, attention is given to the analysis of factors influencing CLP and its potential for improvement [18,24,25,30]. In addition, other scholars also integrate research on CLP with land occupation and compensation, as well as land renovation [27,31,32,33]. However, in situations where the quantity of cultivated land decreases and the degree of farmland abandonment increases during the rapid economic development of large cities, the research on estimations of and the spatial–temporal differences in CLP remain insufficient, and there are few studies on the limiting effect of influencing factors on CLP.
Chengdu, a key city in western China and a part of the “double core” in the construction of the Chengdu–Chongqing Economic Circle, also serves as the core area of the “Tianfu granary”. Balancing the demand for land for urbanization and industrialization while ensuring an effective supply of grains and essential agricultural products to meet the needs of citizens is essential. Drawing on the case of Chengdu, Sichuan, China, this paper uses the CLP evaluation model to estimate the CLP index based on a cultivated land quality database.We analyzed the spatial agglomeration of regional CLP using spatial autocorrelation, identified the main influencing factors and interactive relationships of the spatial differentiation of CLP using GeoDetector, and determined the degree of limiting factors using the limiting factor index model. By employing the CLP evaluation model, a geographical detector, the limiting factor index model, and other methods, we identified the main constraints affecting CLP differentiation and can now propose countermeasures to improve CLP. This provides theoretical support for enhancing regional CLP and the sustainable utilization of cultivated land resources.

2. Materials and Methods

2.1. Study Area

Chengdu is located in southwest China and lies on the eastern edge of Qinghai–Tibet Plateau and within the middle reaches of the Minjiang River in western Sichuan Basin, between 102°54′~104°53′ E and 30°05′~31°26′ N (Figure 1), covering an area of 14,335 km2. The topography and geomorphological conditions are complex and diverse, with a gradual slope from northwest to southeast. The elevation difference within the city is approximately 5000 m. Chengdu has a subtropical humid monsoon climate, characterized by a mild and comfortable climate and abundant precipitation. The annual average temperature is 16 °C, and the annual average precipitation is 1124.6 mm. The existing cultivated land area in Chengdu is 3710 km2, which includes 1920 km2 of paddy field, 460 km2 of irrigated land, and 1330 km2 of dry land. Paddy fields are predominantly found in the flat areas between the Qionglai Mountain and the Longquan Range, and the irrigated land is in the hilly areas on the western side of the Longquan Range. The dry land is mainly located in Jianyang City and Jintang County on the eastern side of the Longquan Mountains. Chengdu is a significant metropolis in western China, with an urban permanent population of more than 10 million (as defined by China), an annual GDP exceeding 300 billion US dollars, and an annual permanent population of more than 20 million (as of the date of this article). Its rich cultural history, well-developed transportation network, and economic strength have collectively contributed to its development into a powerful metropolis. With rapid economic growth, the demand for various types of land—including urban expansion, ecological construction, and rural revitalization—continues to increase, placing unprecedented pressure on the conservation of cultivated land.

2.2. Data Sources

The data used in this study encompass terrain data, cultivated land quality data, and rural economy data (Table 1). The terrain data were obtained from the Geospatial Data Cloud and were used to extract information such as terrain position and field slope through slope analysis in ArcGIS. The cultivated land quality data were sourced from multiple databases, including the Land Use Change Survey Database (2020), the Chengdu Cultivated Land Quality Database, the Annual Update and Evaluation Database (2018), the National Earth System Science Data Center, and the World Soil Database. These data were used to extract information on administrative divisions, cultivated land map patterns, cultivated land quality, and drainage conditions. The rural economic data were derived from the Chengdu Statistical Yearbook, the Chengdu Rural Statistical Yearbook, the Chengdu Natural Disaster Integrated Risk Survey results, and the soil testing and formula fertilization dataset. These datasets were used to assess levels of agricultural mechanization, agricultural disaster prevention and control, and agronomic management. All data were resampled to a spatial resolution of 10 m × 10 m, and the grid cells were unified. The geographical coordinate system used was the 2000 National Geodetic Coordinate System.

2.3. Methods

2.3.1. CLP Evaluation Model

The calculation of CLPI utilizes the stepwise correction method [34]. The light–temperature (climate) productivity potential index and crop yield ratio coefficient are employed to reflect climatic conditions, forming the basis for evaluating CLP. Subsequently, the cultivated land natural quality coefficient and technical level coefficient are applied sequentially to make stepwise corrections. The formula for calculating CLPI is as follows:
P = i = 1 n α i × β i × q × t   ( i = 1 , 2 , 3 )
where P is CLPI, and α i is the light–temperature (climate) productivity potential index of the i crop. β i is the yield ratio coefficient of the i crop. q is the natural quality coefficient of cultivated land; t is the technical level coefficient.
Rice was selected as the benchmark crop for calculating CLP, based on the Quick Reference Table of Light–Temperature (climate) Crop Productivity Potential Index for counties (cities) in China, which lists a light–temperature (climate) productivity potential index of 1619 for rice. The crop yield ratio was defined as the ratio of the yield per unit area of the local benchmark crop to the actual yield per unit area of the specified crops. Referring to the “Regulations for Grading Agricultural Land Quality”, the standard farming system for Chengdu was determined to be “two crops a year”. In this study, the paddy field utilize a rapeseed–rice rotation model, while the dry lands employ a rapeseed–corn rotation model. Rice was used as the benchmark crop, and the designated crops—rice, rapeseed, and corn—were used to calculate the comprehensive light–temperature productivity index.
In accordance with the “Standards for Investigation, Monitoring, and Evaluation of Cultivated Land Quality” and the “Regulations for Grading Agricultural Land Quality”, an agricultural land grading system was adopted [35]. Eighteen indicators, including light–temperature production potential, crop yield ratio coefficient, and terrain location, were selected from three broader categories: climate conditions, natural quality of cultivated land, and technical level. These indicators were used to construct an evaluation index system for CLP. The weight of each index was determined using the Delphi method and the analytic hierarchy process (AHP) (Table 2). The natural quality of cultivated land is influenced by two factors: topography and soil properties. Accordingly, the natural quality coefficient of cultivated land within the study area was computed (Figure 2a) [36]. Additionally, the technical level coefficient was derived by multiplying the standardized value of each secondary index by its respective weight (Figure 2b).
According to the Code for Investigation, Monitoring and Evaluation of Cultivated Land Quality, the calculation results of the CLP index are divided into 15 grades, and the higher the CLP score, the smaller the grade (Table 3).

2.3.2. Spatial Autocorrelation Analysis

Spatial autocorrelation is a statistical method used to measure the degree of interdependence between data at a specific spatial location and data at other locations. It is a multi-directional and multi-dimensional autocorrelation method. The global Moran’s I quantifies the spatial aggregation and dispersion of CLP between the research unit and its adjacent units and assesses the degree of spatial autocorrelation [25]. The value of Moran’s I ranges from −1 to 1. When Moran’s I > 0, it indicates that the region exhibits a positive spatial correlation, and CLP is spatially aggregated. Conversely, when Moran’s I < 0, it indicates that the region exhibits a negative spatial correlation, and CLP is spatially dispersed. A Moran’s I value of 0 indicates a random distribution and the absence of spatial clustering or the dispersion of CLP. In this study, Moran’s I was calculated by GeoDa 1.14.0, which enables us to discuss the spatial clustering and spatial dispersion of CLP and analyze the spatial distribution pattern of CLP. The formula is as follows:
I = n S o · i = 1 n j = 1 n ω i , j Z i Z j i = 1 n Z i 2
S o = i = 1 n j = 1 n ω i , j
where Z i , Z j is the deviation between the attribute value of space element i or j and its mean value, n is the total number of space elements, and ω i , j is the spatial weight value between elements i and j.
In addition, the local Moran’s I can be used to explore the local characteristics of the spatial distribution of CLP, and a Moran’s I scatter plot can be employed to describe the local spatial correlation. The types of local spatial autocorrelation are categorized into four groups: high–high, low–low, low–high and high–low. The calculation formula is as follows:
I i = n Z i j = 1 n ω i , j Z j i = 1 n Z i 2

2.3.3. GeoDetectors

GeoDetectors are a set of statistical methods designed to detect spatial differences and reveal underlying driving forces [37,38,39]. The core concept is that when the independent variable significantly impacts a dependent variable, their spatial distributions should exhibit similarity. In this study, we utilize the factor detection and interaction functions of the GeoDetector model to analyze the dominant influencing factors and the interactions/relationships among various factors in the spatial differentiation of CLP in Chengdu. The formula for factor detection is as follows:
q = 1 h = 1 L N h σ h 2 N σ 2
where h = 1…L is the stratification of dependent variable Y (CLP) or independent variable X, and N h and N are the number of units in the layer and the whole area, respectively. σ h 2 and σ 2 are the variances of the Y values of the layer h and the whole region, respectively. The value of q ranges from 0 to 1 [40]. The larger the value of q, the greater the interpretation degree of independent variable X to dependent variable Y, the more obvious the differentiation, and the smaller the vice versa.
The principle of interactive detection is to determine the interactions among different influencing factors X. Specifically, it aims to evaluate whether the combined action of factors X1 and X2 increases or decreases the explanatory power of the dependent variable Y, or whether their impacts on Y are independent of each other [41]. The interaction types are determined by comparing the q-values of any two influencing factors acting independently, namely q (X1) and q (X2), with the q-values when both factors act together—q (X1∩X2).

2.3.4. Limiting Factor Index Model

Based on the CLP evaluation and the GeoDetector factor analysis, the limiting factor index model is introduced to analyze the main limiting factors affecting CLP and determine their limiting degree. The limiting degree of each factor is assessed by comparing its actual score with the maximum possible score, where the percentage difference relative to the maximum score represents the global limiting degree of the factor. The specific calculation formula is as follows:
Pij = 100 − Aij
X i j = P i j G i j i = 1 n P i j G i j
where X i j represents the limit degree of the index, specifically, the limiting degree of the single index j within criterion layer i on CLP; P i j denotes the deviation degree, that is, the difference between the single index j in criterion layer i and the standard value of the index; and G i j indicates the contribution degree, that is, the degree of influence (weight) of the single index j in criterion layer i on CLP. A i j stands for the membership degree of an indicator, specifically, the membership degree corresponding to the single indicator j in criterion layer i. The degree of restriction is categorized into four levels: no limit (0%), light limit (0~15%), moderate limit (15~40%), and severe limit (>40%).

3. Results

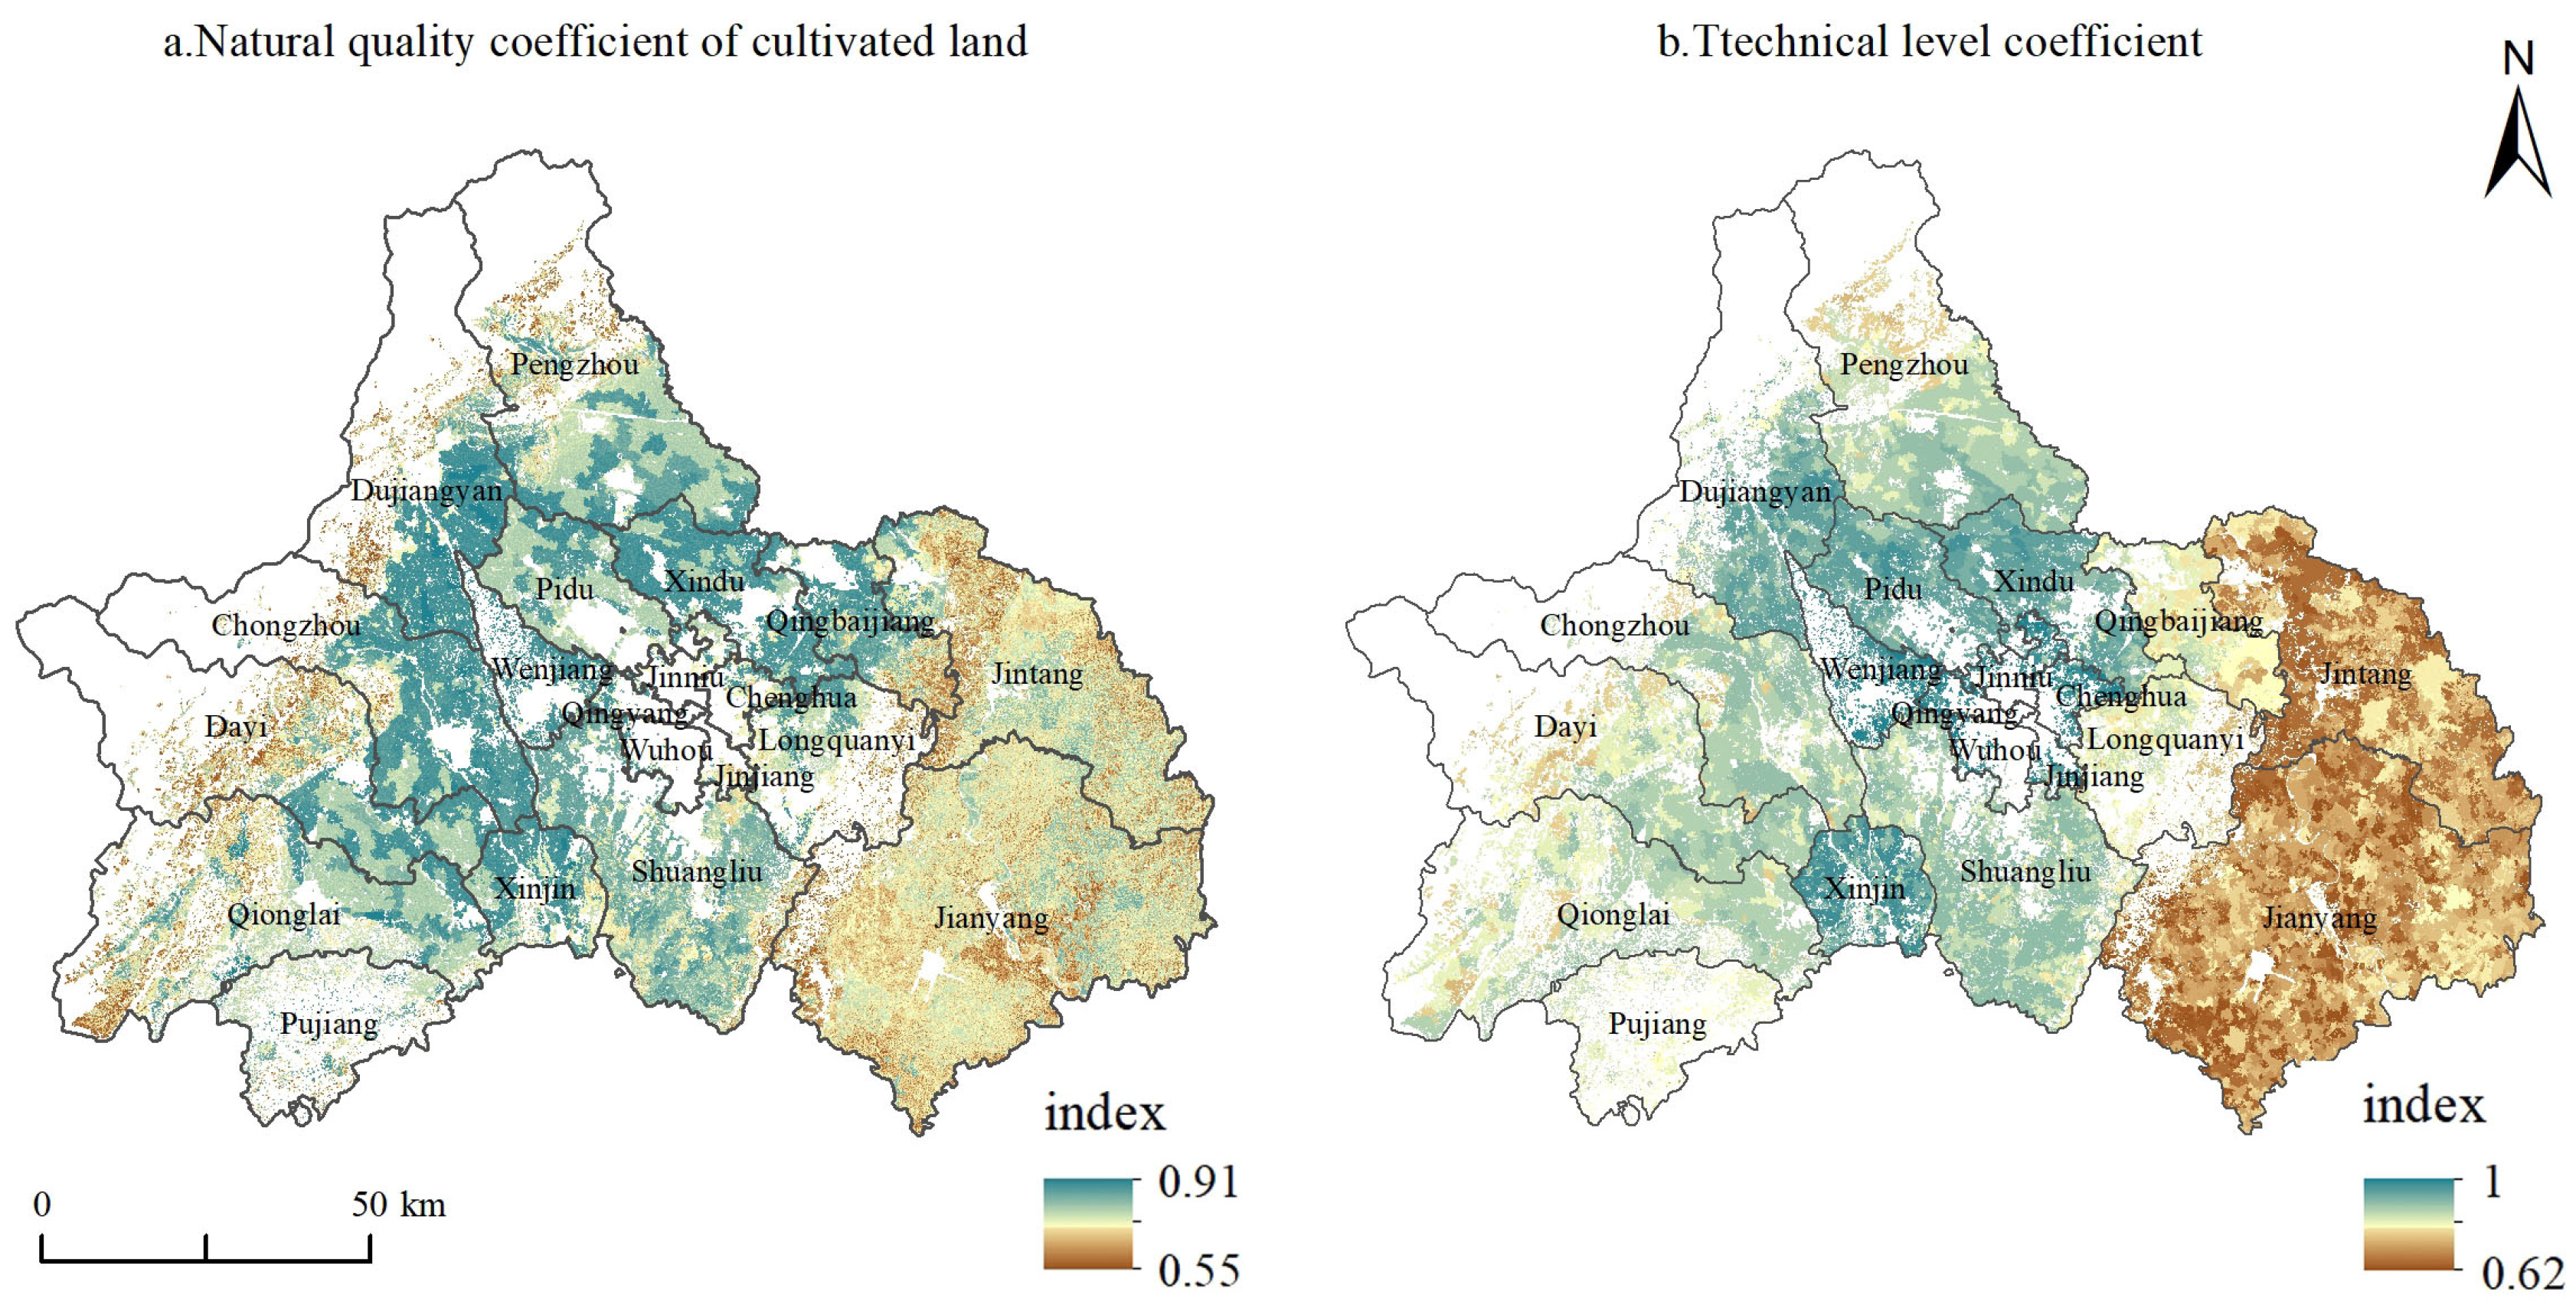
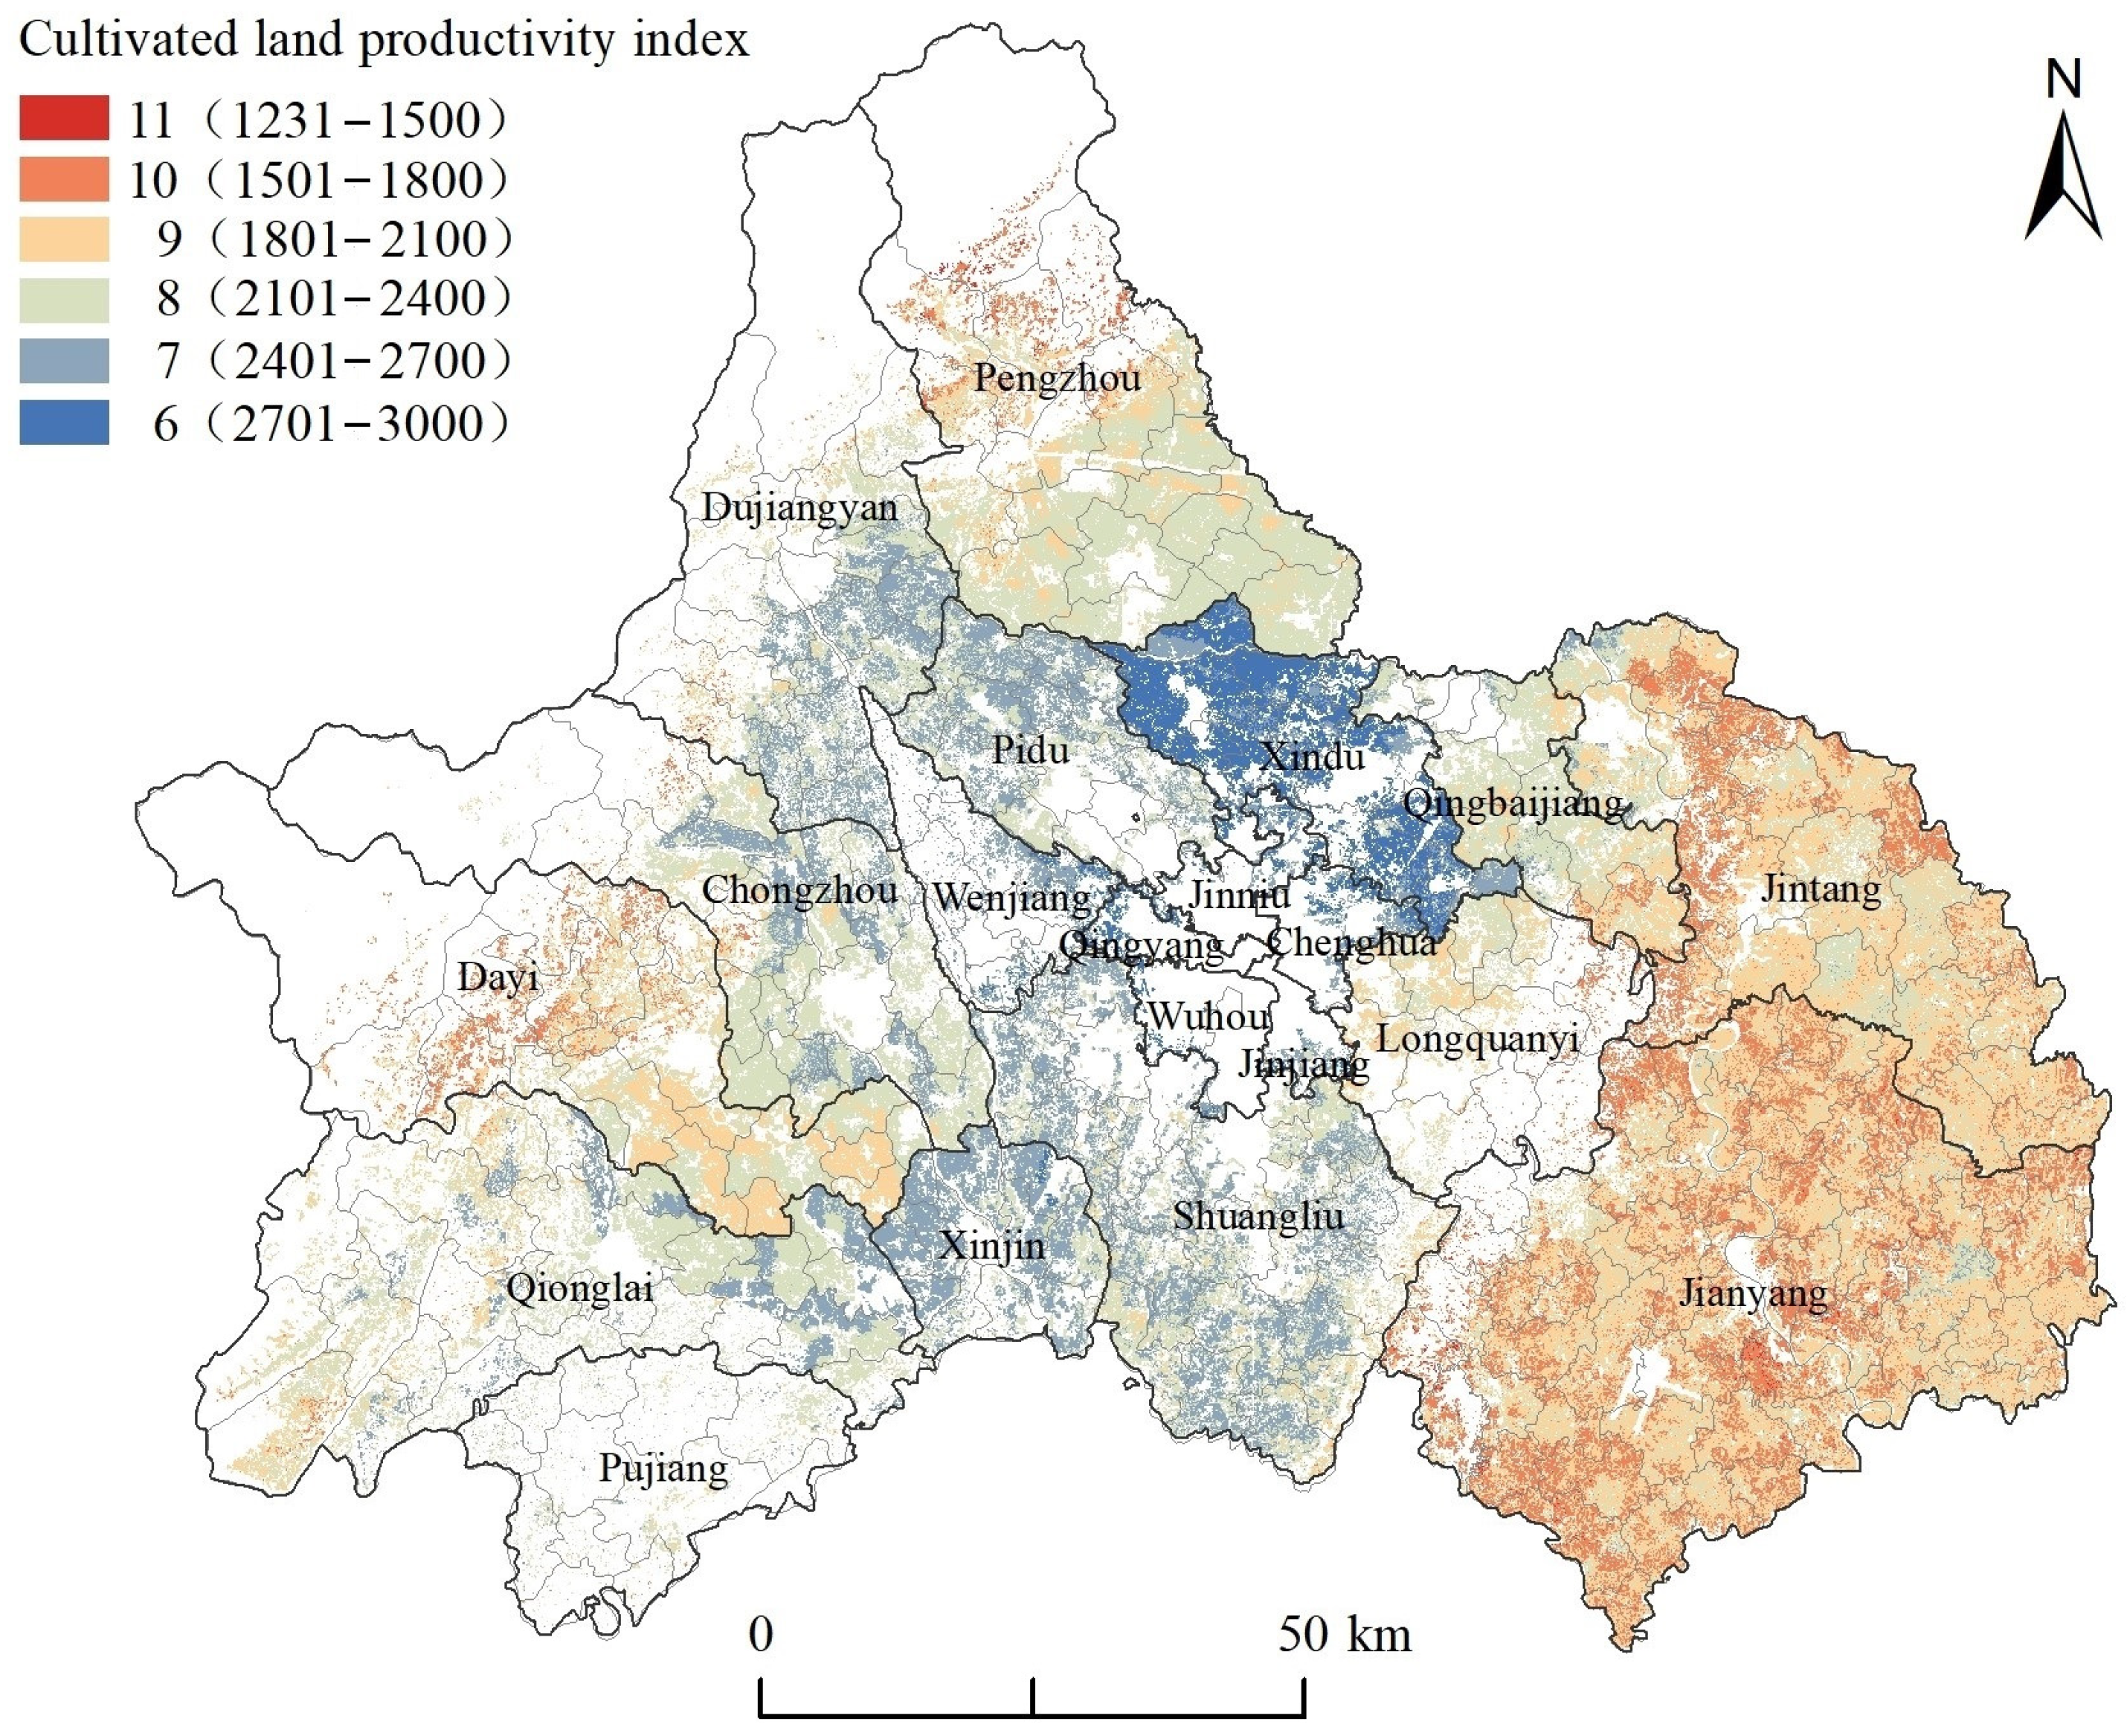
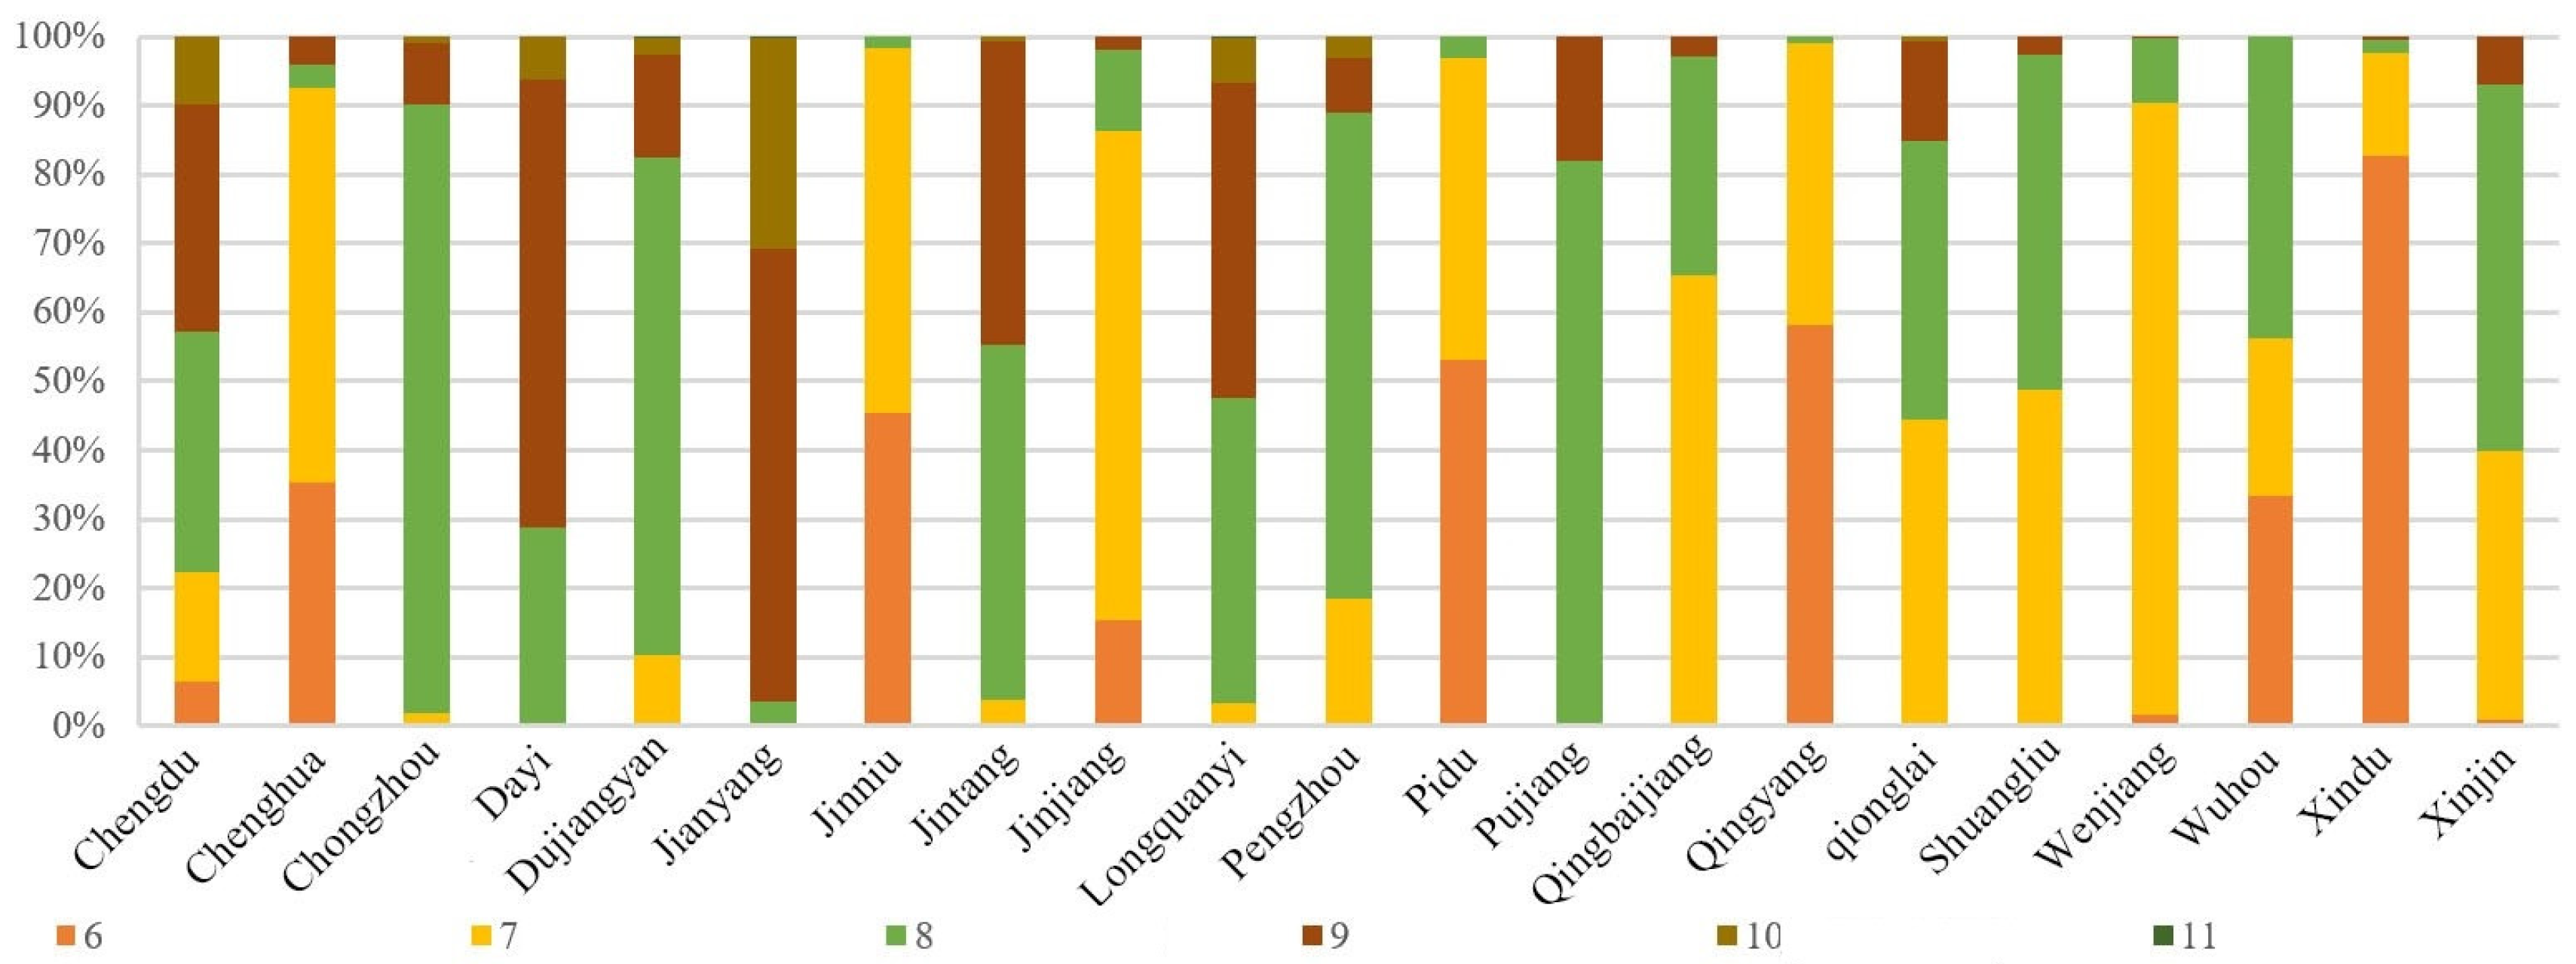
3.1. Spatial Differentiation Characteristics of CLP

According to the CLP evaluation model, Chengdu’s CLPI ranges from 1231 to 3053. Based on the classification statistics of CLPI and the proportion of CLPI in each district and county of Chengdu (Figure 3 and Figure 4), the CLPI of Chengdu is distributed within grades 6 to 11 (as a CLPI of more than 3000 accounts for a relatively low proportion and only exists in a few cultivated land spots, this part is classified into the 6th grade). Spatially, the CLPI in Chengdu exhibits high values in the center and low values at the periphery. This pattern is related to the terrain characteristics of Chengdu, which are low in the middle and high in the surrounding areas. High-standard farmland is mainly distributed between Longquan Mountain and Longmen Mountain. Among these areas, the highest CLPI values are found in Xindu District, with an average index of 2795. The cultivated land in this district consists of floodplains and the first and second terraces formed by alluvial sediments of the Minjiang and Tuojiang tributaries and the Pihe river system. In contrast, the lowest CLPI values are concentrated in Jianyang City and Jintang County, with average indices of 1922 and 1981, respectively. This is attributed to the pronominally low-hill terrain, where the cultivated land area is relatively large but fragmented and lacks coherence.
Based on CLPI interval statistics, the CLP in Chengdu is primarily concentrated in grades 7, 8 and 9, and these three grades account for 83.88% of the total. Specifically, the cultivated land area of grade 7 is 6.0 × 10⁴ hm2, representing 16% of the total cultivated land area. It is mainly concentrated in the south of Pengzhou City, Qingbaijiang District, Wenjiang District, Shuangliu District, Xinjin District, and the eastern part of Qionglai City. Grade 8 has the largest cultivated land area, at 13.0 × 10⁴ hm2, accounting for 34.88% of the total cultivated land. It is widely distributed across the south of Pengzhou City, the southeast of Dujiangyan City, the flat area in the south of Chongzhou City, the south of Qionglai City, parts of Shuangliu City, and the southern region of Jintang County. Grade 9 cultivated land covers 12.2 × 10⁴ hm2, representing 33% of the total cultivated land. It is mainly found in Jintang County to the east of Longquan Mountain, Jianyang City, and Dayi County to the south, and along the mountain belts of Chongzhou City, Dujiangyan City, and Pengzhou City.

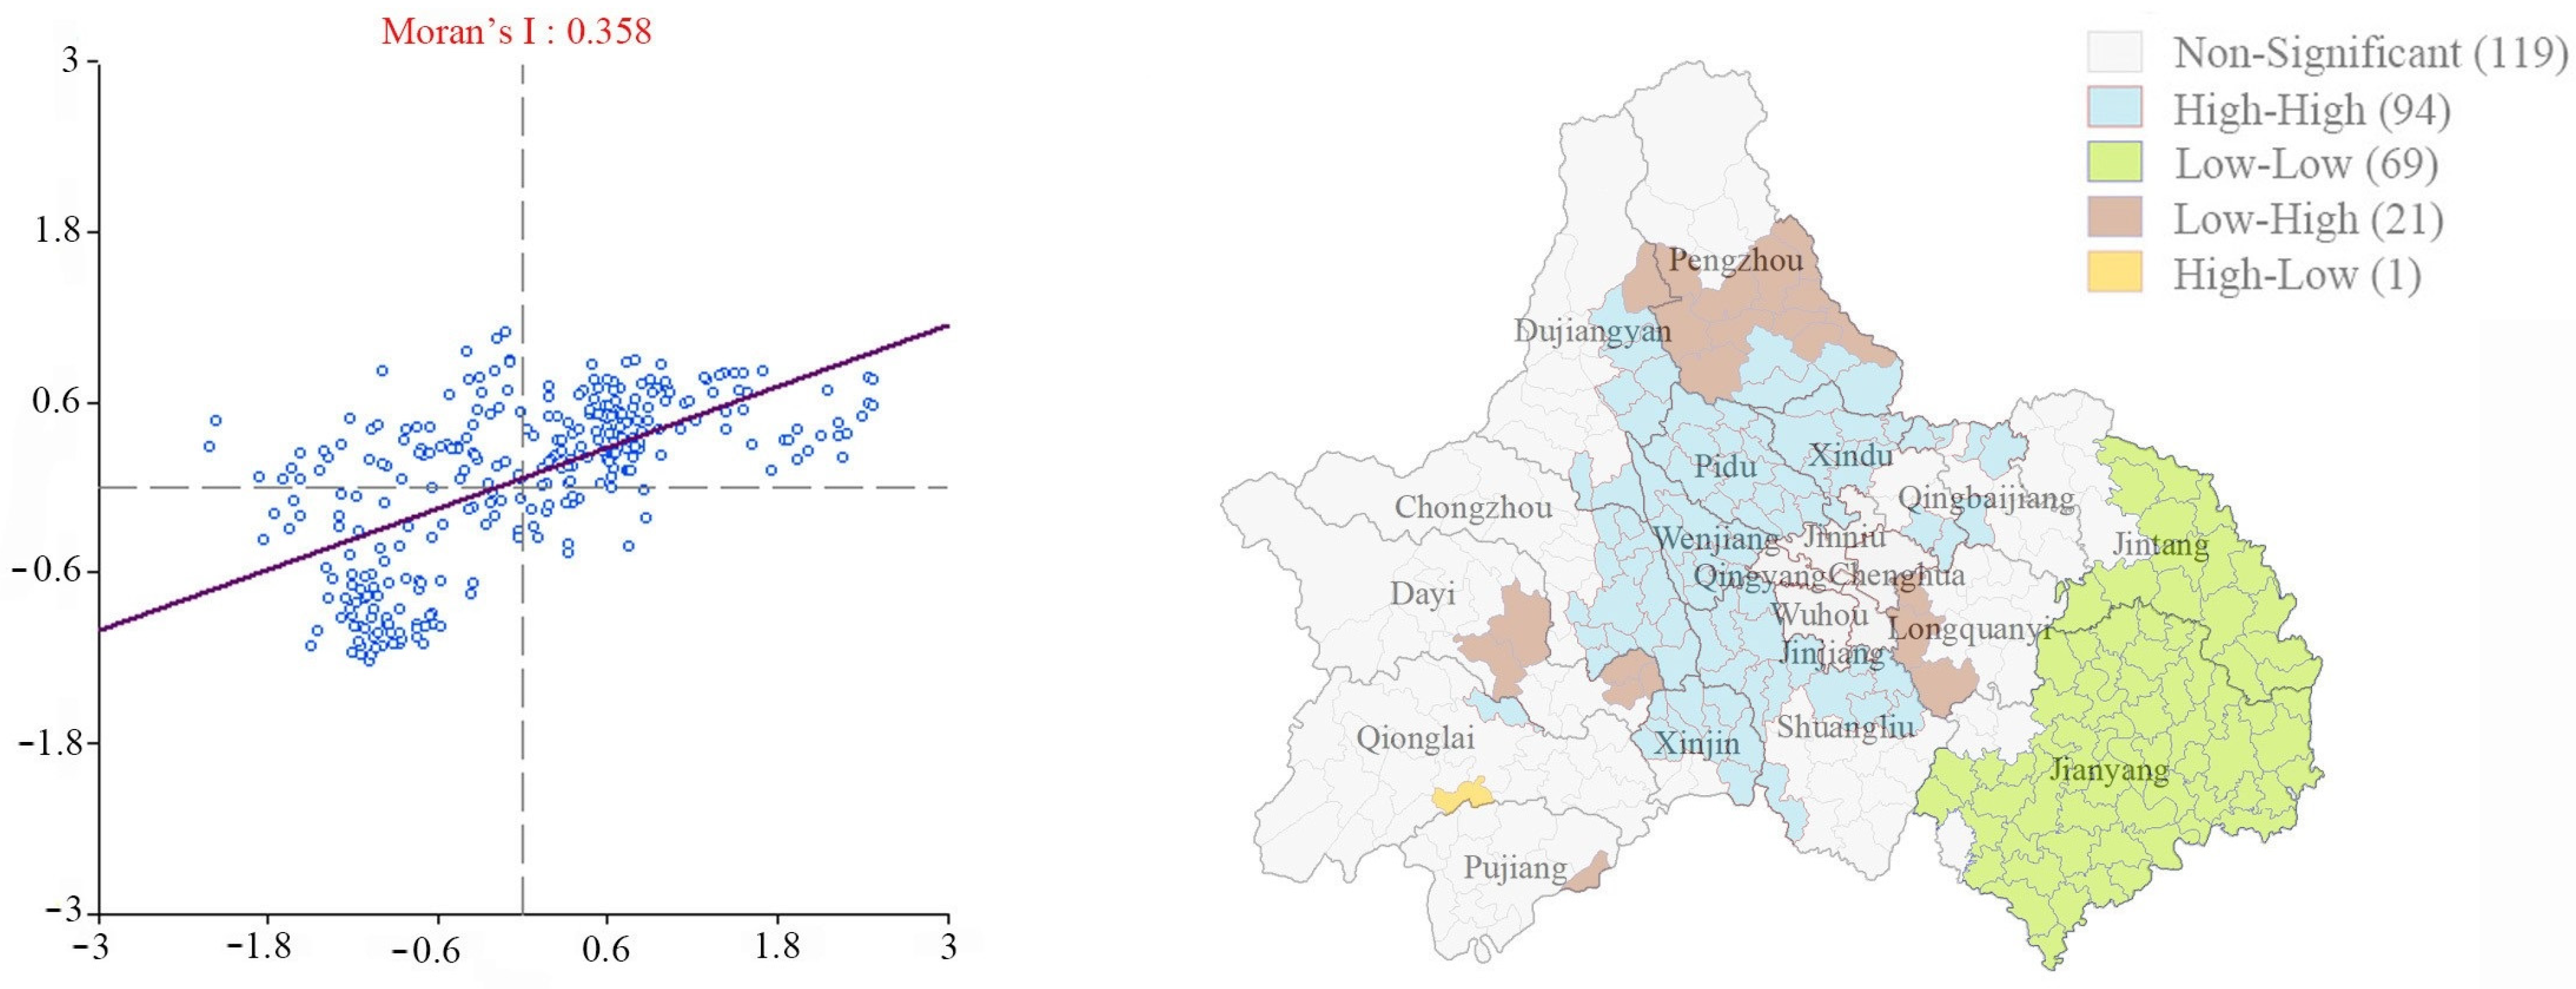
3.2. Spatial Autocorrelation Analysis of CLP

Global spatial autocorrelation analysis of CLP in Chengdu was conducted using GeoDa. The Moran’s I value of 0.358 indicates that the spatial distribution of CLP in Chengdu exhibits a clustering trend, with a Z-value of 22.1 (p < 0.001). As shown in the scatter plot (Figure 5), the majority of the points are located in the first and third quadrants, indicating a spatial agglomeration distribution. Taking 304 townships (subdistricts) in Chengdu as the research units, we further explored an autocorrelation analysis. The results show that the spatial autocorrelation types of CLPI in Chengdu’s townships (subdistricts) are primarily high–high (94), low–low (69) and low–high (21). The spatial distribution of these types is illustrated in the local spatial autocorrelation cluster plot of CLPI of Chengdu (Figure 5). The high–high type is mainly concentrated in central Chengdu, including Pidu, Xindu, Wenjiang, and Shuangliu Districts. This indicates that areas with high CLPI values are clustered in these regions. The low–low type is predominantly found in the eastern part of Chengdu, covering most of Jintang County and Jianyang City, indicating that low-CLPI areas are concentrated here. The low–high type is distributed along the edge of the high–high clusters, with its main concentration in the southern part of Pengzhou City.

3.3. Driving Factor Analysis

The data in the study area were processed, a fishing net was created in ArcGIS 10.6 to divide the administrative region of Chengdu, and the whole study area was divided into a grid of 1 km × 1 km. Subsequently, the cultivated land was distributed using the grid method, resulting in 2802 valid sample points on the patches of the cultivated land map. CLPI and the corresponding influence factors were extracted for the sample points, and factor detection analysis was performed in the GeoDetector.
Table 4 shows the results of factor detection. Except for soil organic matter content and soil nutrient elements that failed to pass the significance test (since p > 0.1), the remaining 14 factors all passed the significance test. This indicates that these 14 factors exert significant influence on the spatial differentiation of CLP in Chengdu City. The q values of each driving factor are ranked as follows: agronomic management level (0.56) > soil bulk density (0.43) > irrigation guarantee rate (0.30) > soil body configuration (0.30) > field slope (0.29) > agricultural mechanization level (0.25) > surface rock outcrop degree (0.19) > effective soil layer thickness (0.19) > drainage condition (0.15) > PH value (0.13) > farmland flood control level (0.12) > surface soil texture (0.10) > agricultural disaster prevention and control standard (0.09) > topographic position (0.07). The results show that the high level of agricultural management technology plays an indispensable supporting role in the agricultural modernization of Chengdu Plain, and the soil natural conditions, including soil bulk density, soil body configuration, and field slope, also affect CLP. Looking at how the secondary classification of each factor mainly affects the spatial differentiation of CLP, the influence of field slope, soil bulk density, soil body configuration, irrigation guarantee rate, agronomic management level, and farmland flood control standard is more prominent, indicating that these six factors are the main driving forces. Soil physical properties determine the natural quality of cultivated land and thus affect CLP, while farmland management methods determine the technical level of cultivated land and then affect the difference in CLP. However, the spatial distribution of CLP is scarcely influenced by topography and the level of agricultural disaster prevention and control.
Through interactive detection of the relationship between the two influencing factors on CLP, the difference in interaction intensity among the factors is explored, and 16 influencing factors are classified. The results obtained from the interactive detection and analysis can be seen in Table 5. The findings of the interactive detection indicate that there are no independent factors. This shows that the spatial pattern difference in CLP in Chengdu is not controlled by a sole factor or a single class of factors but is influenced by multiple factors. The interaction between irrigation and drainage conditions and technical management is one of double-factor enhancement, indicating that drainage conditions and the technical level play a synergistic role in affecting CLP. The interaction of the other four types of influencing factors is both double-factor and nonlinear enhancement, showing that these factors affect CLP in a complex manner. Among the 16 interaction factors, soil bulk density (X6) and agronomic management level (X13) have the strongest interaction relationship with other factors, which implies that these 2 factors possess significant explanatory power regarding the spatial differentiation of CLP.

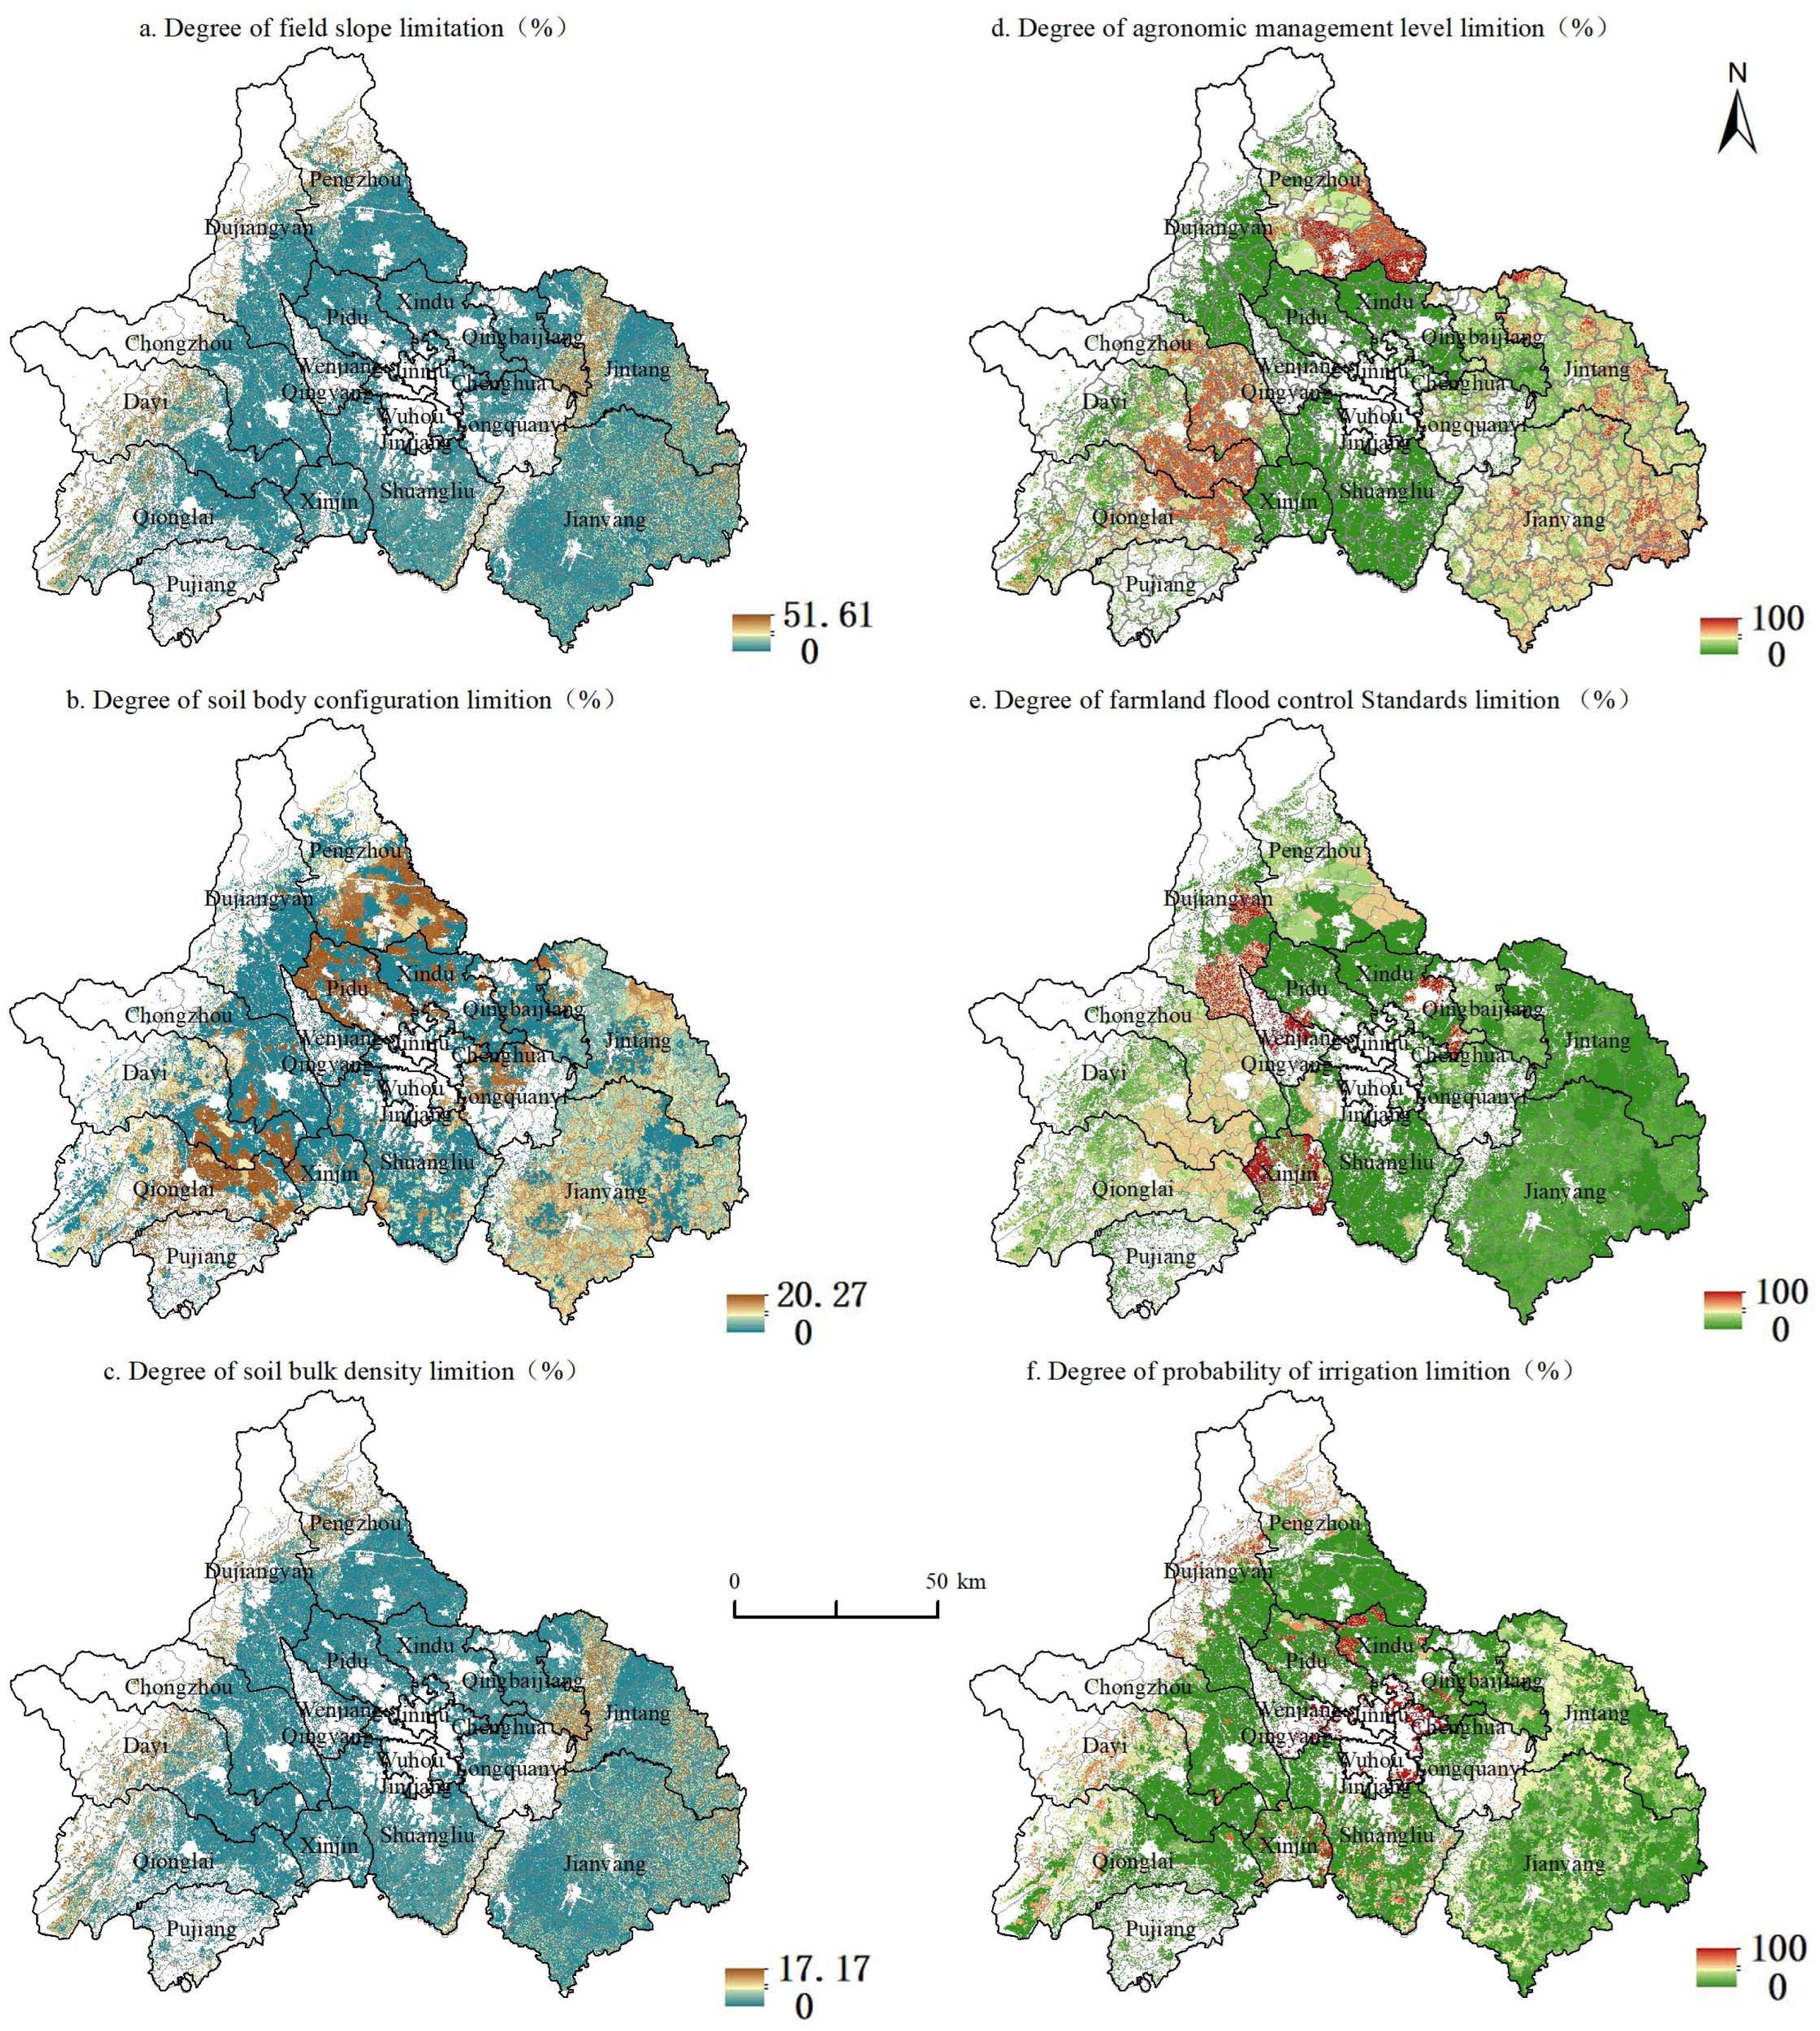
3.4. Analysis of Limiting Factors of CLP

Based on the analysis results of the GeoDetector, the limitation degrees of the six main driving factors influencing CLP in the study area were calculated, resulting in six limitation degrees related to CLP. These factors are soil bulk density, soil body configuration, field slope, agronomic management level, farmland flood control standard, and irrigation guarantee rate (Table 6 and Figure 6). The results indicate that the field slope, soil body configuration and soil bulk density in the natural quality of cultivated land do not significantly limit the productivity of cultivated land. Most of the limitation degrees are unrestricted and mildly limited (unrestricted + mildly limited > 80 %). Specifically, the moderate and mild limitations of the field slope are primarily found on Longquan Mountain and its two flanks. The slight restriction of soil body configuration is mainly distributed in Jianyang City and Jintang County in the east of Longquan Mountain, where the terrain is predominantly characterized by shallow tombs and the slope of cultivated land is relatively small. The moderate limitation is found in the south of Pengzhou City, Pidu District, the east of Qionglai City, and the southeast of Dayi County, where the surface fluctuation is large in the Longmen Mountain belt. Slight restrictions on soil bulk density are observed in southern Pengzhou City, Dayi County, southeastern Chongzhou City, Shuangliu District, and Xinjin District. CLP is highly restricted by the technical level, and the distribution of the three limiting factors is relatively dispersed (Figure 6). The cultivated land with light and moderate restrictions on the irrigation guarantee rate is mainly distributed in the shallow hill and Longquan Mountain area in the east of Chengdu, as well as in the Longmen Mountain and Qionglai Mountain area along the mountain range. In contrast, the severely restricted land is mainly distributed in Jianyang City and Jintang County to the east of Longquan Mountain. The area of farmland with moderately restricted flood control standards is primarily located in Chongzhou City, the south of Dayi County, the east area of Qionglai City, and part of the south area of Pengzhou City. The severely restricted area is mainly concentrated in the west of Xinjin District and the east of Dujiangyan City, with small areas in the Pidu and Xindu Districts. This is because large rivers pass through these areas, and the farmland is affected by summer flood season, leading to limited flood control levels. The proportion of the severe restriction of agronomic management is the highest, exceeding 50%, and is mainly distributed in the east of Qionglai City, the south of Dayi County, the south of Chongzhou City, the south of Pengzhou City, and Jintang County and Jianyang City to the east side of Longquan Mountain. Compared with the Wenjiang District, Pidu District and Xindu District, these areas still have some distance to cover in the process of agricultural modernization, indicating that the level of agronomic management places the highest degree of restriction on CLP in Chengdu.

4. Discussion

4.1. Spatial Patterns and Influencing Factors

Based on the established CLP evaluation index system, this study calculates the CLP index for Chengdu and analyzes the spatial distribution pattern of CLP within the region. Compared to studies in other regions, CLP in Chengdu remains at a relatively low level, with areas of high CLP being notably scarce [21]. Consistent with most studies, areas with high-quality cultivated land tend to exhibit higher CLP [7,19,21,42]. The results of this study indicate that CLP in Chengdu is characterized by a spatial distribution pattern of moderate to high values, excluding urban built-up areas and mountainous regions, which is related to the topographic conditions of Chengdu. The vast plain between the Longquan Mountain Range and the Longmen Mountain Range features fertile land, abundant water resources, complete irrigation and drainage facilities, and a high level of agricultural mechanization, contributing to the high CLP index in this area. In contrast, Jintang County and Jianyang City, which are primarily shallow hills to the east of Longquan Mountain Range, are affected by low soil fertility, land fragmentation, low levels of agricultural machinery, and flood season impacts.
This paper examines the spatial distribution characteristics, influencing factors, and the limitation degree of main factors of CLP in Chengdu; it also analyzes the spatial agglomeration characteristics of CLP in different regions and explores the spatial differentiation characteristics of CLP and the explanatory power of different influencing factors. Using GeoDetector, we discuss the differentiation and interaction responses to different influences on the productivity of cultivated land. It has been discovered that the organic matter content and soil nutrient elements in soil fertility have no significant impact on the spatial differentiation of CLP (p > 0.1). Compared to the results of an analysis of CLP and influencing factors by Du et al. [24], the P values for organic matter content and soil nutrient elements are inconsistent. This discrepancy is attributed to the soil organic matter content in Chengdu, which ranges between 0.5 and 30 g/kg. Combined with the classification standard of cultivated land organic matter quality, the organic matter content of CLP in Chengdu is categorized into three levels, 3, 4, and 6, with the majority concentrated in grade 6 (grading standard: level 1: ≥40 g/kg; level 2: 30 g/kg–40 g/kg; level 3: 20 g/kg–30 g/kg; level 4: 10 g/kg–20 g/kg: level 5: 6 g/kg–10 g/kg; grade 6: <6 g/kg). The classification of soil nutrient elements is primarily concentrated in level 3 (see Table 7 for classification standards), accounting for over 95% of the cultivated land area. This concentration in one category during the discrete classification of the independent variables using the Geographical Detector leads to insignificant study results and very small Q-values. Nevertheless, the classification of soil organic matter content in Chengdu clearly shows that the content of soil organic matter in most regions is quite low (<6 g/kg), which is significantly lower than the average level in China [43]. Therefore, it is crucial to enhance the soil organic matter content of the cultivated land in Chengdu to increase CLP through measures such as increasing the application of organic fertilizers, returning straw to the fields, and practicing crop rotation.
When factor detection and cross detection were used to analyze the influencing factors of CLP, it was found that soil bulk density in the natural of cultivated land and agronomic management level in technical level had the most significant influence. This may be due to the fact that the Chengdu Plain, formed by river alluvial processes, has parent material primarily consisting of river alluvium, resulting in relatively uniform soil particle composition and lower soil bulk density compared to cultivated land in Tianjin, Hebei, Henan, Shandong, and other regions [44]. The level of agronomic management encompasses a series of complex and interrelated management measures from soil preparation to crop harvest, and its level directly determines the efficiency of arable land use and the quality and quantity of agricultural products produced. The low quality of agricultural practitioners in Chengdu Plain area, the lack of technical promotion and training in systematic science, and the mixed scale of agricultural management are among the reasons for the low level of agronomic management in the study area.

4.2. Degree of Restriction

In existing research, several scholars have analyzed the impact of limiting factors on CLP. According to Zhao et al., irrigation has emerged as the primary factor restricting the natural quality of cultivated land in Zhuozhou City, which is attributed to the significant disparity in the comprehensive utilization levels of local cultivated land [45]. Feng et al. noted that in hilly areas with low-quality cultivated land, slope and irrigation conditions significantly limit the improvement of cultivated land quality in this region. Similarly, the cultivated land on both sides of Longquan Mountain Range and Longmen Mountain Range, as examined in this study, exhibits such limitations [42]. However, compared to the natural conditions of cultivated land, the development of urban agriculture, primarily on the plains, is more constrained by the level of agronomic management. Factors such as soil fertility management, crop planting management, irrigation and drainage management, and disease and pest control management limit the enhancement of CLP. Therefore, based on the identified limiting factors of CLP, targeted improvement measures should be implemented during high-standard farmland construction and agricultural production to enhance CLP, thereby improving the productivity of cultivated land and alleviating the pressure on cultivated land protection and food security [46]. Firstly, soil improvement measures should be implemented to improve soil structure and increase soil productivity [47,48]. For instance, engineering methods like guest soil improvement and land leveling have been employed to improve soil environmental quality and enhance the soil’s capacity to balance water, fertilizer, air and heat, thereby improving soil structure. Practices such as straw back and formula fertilization are used to increase the organic matter in the soil [49]. Engineering measures are adopted to optimize the slope of the field surface and improve site conditions. Secondly, to address the technological limitations of agricultural land, efforts should focus on strengthening farmland engineering construction and cultivating advanced management techniques to achieve efficient and sustainable agricultural development [50]. For example, accurate soil fertility detection and scientific fertilization can enhance soil permeability and water retention. Constructing farmland water conservancy facilities and rationally designing irrigation and drainage projects can promote efficient water-saving irrigation technologies and improve farmland irrigation and drainage capacities. Enhancing disease and pest detection and early warning systems, improving preventive measures, and monitoring the occurrence of diseases and pests in a timely and accurate manner are also crucial. Additionally, strengthening the selection and breeding of excellent crop varieties, optimizing planting structure, enhancing soil testing and formula fertilization facilities, and monitoring diseases and pests (alongside better training in agricultural production technology) can significantly improve the level of agronomic management [19].

4.3. Limitations and Prospects

Taking Chengdu City as a case study, this paper examines CLP using the agricultural land grading system and explores the degree of restriction imposed by different influencing factors on CLP through the GeoDetector and the limiting factor index model. CLP is influenced by numerous complex factors, including those from nature, society, the economy, and policy [51]. In this study, 16 factors affecting the natural quality and technological level of cultivated land were selected, but the factors used to evaluate CLP were limited. Therefore, assessment of the comprehensiveness of the factors affecting CLP warrants further research in future work. On the other hand, continuous change in CLP affects spatial distribution patterns in real time, and the mechanisms by which each driver affects CLP are also dynamic. Against the backdrop of the apparent changes in the quality and scale of cultivated land in Chengdu, a long-term series examining CLP and the magnitude of the influence of its various factors will require further investigation. Thanks to improvements in data acquisition capabilities, in combining the temporal and spatial scales [52], the spatiotemporal variation characteristics of CLP and its influencing factors can be further explored. Moreover, the evolutionary mechanism can be analyzed to provide more accurate countermeasures and suggestions for enhancing regional CLP and ensuring food security.

5. Conclusions

This study takes Chengdu City as the research area, establishes a CLP evaluation index system based on agricultural land grading results, and calculates the CLP index. GeoDa is used to analyze global spatial autocorrelation, and the spatial distribution characteristics of CLP are examined. Additionally, GeoDetector is introduced to analyze the main limiting factors of CLP. The limiting factor index model is employed to calculate the limiting degree of the major drivers affecting CLP. The conclusions are as follows.
(1) The CLPI of Chengdu ranges from 1231 to 3053, and CLP is mainly concentrated in grades 7, 8 and 9, accounting for 83.88% of the total. The Moran’s I index for the global spatial autocorrelation analysis of CLP in Chengdu is 0.358, indicating that the spatial distribution of CLP in Chengdu is clustered. The spatial autocorrelation types of the CLP index in the townships (streets) of Chengdu are mainly of the high–high, low–low and low–high type.
(2) Through factor detection analysis using GeoDetector, 14 factors are found to significantly affect the spatial differentiation of CLP in Chengdu. According to the classification criteria, the level of agronomic management, soil bulk density, irrigation guarantee rate, soil body configuration, field slope, and farmland flood control standards are the main factors that affect the spatially differentiated characteristics of CLP. Interaction detection shows that two-factor interactions have a stronger explanatory power over cropland productivity than single-factor interactions, with both nonlinear and two-factor enhanced interaction types. The interaction between soil bulk density and the level of agronomic management, along with other factors, is the strongest.
(3) According to the limiting factor index model, the field slope, soil body configuration, and soil bulk density do not significantly limit CLP within the natural quality of cultivated land. However, the CLP is highly limited by the technical level, within a wide range of restrictions. Among these, the agronomic management level severely limits CLP, accounting for over 50% of its limitation.
(4) During the process of high-standard farmland construction and agricultural production, measures should be taken to improve soil structure and fertility, thereby enhancing CLP and further increasing the productivity of cultivated land. For example, guest soil improvement methods and land leveling can be employed to optimize land configuration. Strengthening organic matter management and improving soil fertility are also crucial. Furthermore, enhancing the construction of farmland projects, cultivating advanced management techniques, building water conservancy facilities in farmland, enhancing irrigation and drainage capacity, and increasing training in agricultural production techniques can significantly raise the level of agricultural management.

Author Contributions

Y.L., Z.L. and P.H. were responsible for the design of this research. J.C., C.C. and Z.S. collected and analyzed the data, G.L. and W.G. helped with format correction, and Y.L. and Q.L. wrote the paper. All authors have read and agreed to the published version of the manuscript.

Funding

This study was supported by Science and Technology Project of Sichuan Province (2022JDR0172), the Sichuan Academy of Agricultural Sciences Science and Technology Research Plan (1+9KJGG009), the Sichuan Academy of Agricultural Sciences financial independent innovation special project (2022ZZCX036),the Open Foundation of the Research Center for Human Geography of Tibetan Plateau and Its Eastern Slope (RWDL2024-YB002), and The 2024 Yibin Agricultural Science and Technology Innovation Project.

Data Availability Statement

The raw data supporting the conclusions of this article will be made available by the authors on request.

Acknowledgments

The authors would like to acknowledge data support from the following sources: the Geospatial Data Cloud (http://www.gscloud.cn, accessed on 5 April 2023), the Food and Agriculture Organization (FAO) Harmonized World Soil Database v1.2 (https://www.fao.org/soils-portal/soil-survey/soil-maps-and-databases/harmonized-world-soil-database-v12/en/, accessed on 6 May 2023), the National Earth System Science Data Center (http://www.geodata.cn, accessed on 6 May 2023), the Chengdu Statistical Yearbook, Chengdu Rural Statistical Yearbook, and the Chengdu Natural Disaster Comprehensive Risk Survey results. The authors also express their gratitude to the anonymous reviewers for their valuable comments and suggestions.

Conflicts of Interest

The authors declare that they have no known competing financial interests or personal relationships that could have appeared to influence the work reported in this paper.

References

  1. Ensieh Esmaeili, F.S.; Sarmadian, F.; Jafarzadeh, A.A.; Hayati, B. Impacts of cultivated land conversion on cultivated land productivity in China: Prediction and analysis. Chin. J. Appl. Ecol. 2010, 21, 3113–3119. [Google Scholar]
  2. Li, Y.; Wu, H.-x.; Shi, Z. Farmland productivity and its application in spatial zoning of agricultural production: A case study in Zhejiang province, China. Environ. Earth Sci. 2016, 75, 159. [Google Scholar] [CrossRef]
  3. Yao, C.; Teng, Y.; Huang, L. Evaluation index system construction and empirical analysis on food security in China. Trans. Chin. Soc. Agric. Eng. 2015, 31, 1–10. [Google Scholar]
  4. Lichtenberg, E.; Ding, C. Assessing farmland protection policy in China. Land Use Policy 2008, 25, 59–68. [Google Scholar] [CrossRef]
  5. He, J.; Liu, Y.; Yu, Y.; Tang, W.; Xiang, W.; Liu, D. A counterfactual scenario simulation approach for assessing the impact of farmland preservation policies on urban sprawl and food security in a major grain-producing area of China. Appl. Geogr. 2013, 37, 127–138. [Google Scholar] [CrossRef]
  6. Qianwen, C.; Penghui, J.; Lingyan, C.; Jinxia, S.; Yunqian, Z.; Liyan, W.; Manchun, L.; Feixue, L.; Axing, Z.; Dong, C. Delineation of a permanent basic farmland protection area around a city centre: Case study of Changzhou City, China. Land Use Policy 2017, 60, 73–89. [Google Scholar] [CrossRef]
  7. Zhao, C.; Zhou, Y.; Jiang, J.; Xiao, P.; Wu, H. Spatial characteristics of cultivated land quality accounting for ecological environmental condition: A case study in hilly area of northern Hubei province, China. Sci. Total Environ. 2021, 774, 145765. [Google Scholar] [CrossRef]
  8. Li, T.; Long, H.; Zhang, Y.; Tu, S.; Ge, D.; Li, Y.; Hu, B. Analysis of the spatial mismatch of grain production and farmland resources in China based on the potential crop rotation system. Land Use Policy 2017, 60, 26–36. [Google Scholar] [CrossRef]
  9. Hao, S.; Wang, G.; Yang, Y.; Zhao, S.; Huang, S.; Liu, L.; Zhang, H. Promoting grain production through high-standard farmland construction: Evidence in China. J. Integr. Agric. 2024, 23, 324–335. [Google Scholar] [CrossRef]
  10. Peng, J.; Zhao, Z.; Chen, L. The Impact of High-Standard Farmland Construction Policy on Rural Poverty in China. Land 2022, 11, 1578. [Google Scholar] [CrossRef]
  11. Zhao, Y.; Liu, X.; Ao, Y. Analysis of cultivated land change, pressure index and its prediction in Shaanxi province. Trans. Chin. Soc. Agric. Eng. (Trans. CSAE) 2013, 29, 217–223. [Google Scholar]
  12. Dedeoğlu, M.; Başayiğit, L.; Yüksel, M.; Kaya, F. Assessment of the vegetation indices on Sentinel-2A images for predicting the soil productivity potential in Bursa, Turkey. Environ. Monit. Assess. 2019, 192, 16. [Google Scholar] [CrossRef] [PubMed]
  13. Gu, Z.; Xie, Y.; Gao, Y.; Ren, X.; Cheng, C.; Wang, S. Quantitative assessment of soil productivity and predicted impacts of water erosion in the black soil region of northeastern China. Sci. Total Environ. 2018, 637–638, 706–716. [Google Scholar] [CrossRef]
  14. Sciortino, M.; De Felice, M.; De Cecco, L.; Borfecchia, F. Remote sensing for monitoring and mapping Land Productivity in Italy: A rapid assessment methodology. CATENA 2020, 188, 104375. [Google Scholar] [CrossRef]
  15. Xiao, L.; Yang, X.; Cai, H.; Zhang, D. Cultivated Land Changes and Agricultural Potential Productivity in Mainland China. Sustainability 2015, 7, 11893–11908. [Google Scholar] [CrossRef]
  16. Lazarus, W.; Headlee, W.; Zalesny, R. Impacts of Supplyshed-Level Differences in Productivity and Land Costs on the Economics of Hybrid Poplar Production in Minnesota, USA. BioEnergy Res. 2015, 8, 231–248. [Google Scholar] [CrossRef]
  17. Yang, J.; Huang, K.; Lee, C.; Chiu, C. Incorporating lost productivity calculation into delay analysis for construction projects. KSCE J. Civ. Eng. 2014, 18, 380–388. [Google Scholar] [CrossRef]
  18. Peng, J.; Wen, L.; Fu, L.; Yi, M. Total factor productivity of cultivated land use in China under environmental constraints: Temporal and spatial variations and their influencing factors. Environ. Sci. Pollut. Res. 2020, 27, 18443–18462. [Google Scholar] [CrossRef] [PubMed]
  19. Wu, F.; Mo, C.; Dai, X.; Li, H. Spatial Analysis of Cultivated Land Productivity, Site Condition and Cultivated Land Health at County Scale. Int. J. Environ. Res. Public Health 2022, 19, 12266. [Google Scholar] [CrossRef]
  20. Zhang, X.; Wu, K.; Yang, Q.; Li, X. Progress on Connotation and Evaluation Index System of Cultivated Land Healthy Productivity. Chin. J. Soil Sci. 2020, 51, 245–252. [Google Scholar]
  21. Zhao, C.; Zhou, Y.; Li, X.; Xiao, P.; Jiang, J. Assessment of Cultivated Land Productivity and Its Spatial Differentiation in Dongting Lake Region: A Case Study of Yuanjiang City, Hunan Province. Sustainability 2018, 10, 3616. [Google Scholar] [CrossRef]
  22. Zhang, Y.; Feng, X.; Ren, S.; You, X.; Yu, C. Evaluation index system of cultivated land quality and productivity: A case study of Binyang County, Guangxi. J. Agric. Resour. Environ. 2021, 38, 1039–1050. [Google Scholar]
  23. Tang, M.; Wang, Q.; Mei, S.; Ying, C.; Gao, Z.; Ma, Y.; Hu, H. Research on the Inversion Model of Cultivated Land Quality Using High-Resolution Remote Sensing Data. Agronomy 2023, 13, 2871. [Google Scholar] [CrossRef]
  24. Du, H.; Cui, J.; Ha, K.; Men, M. Evaluation and Influencing factors of cultivated land productivity in coastal plain area: A case study of Huanghua City, Hebei Province. J. Agric. Univ. Hebei 2019, 42, 16–22. (In Chinese) [Google Scholar]
  25. Zhu, X.; Wang, B.; Huang, K.; Cao, T. Analysis of spatial distribution and factors influencing productivity of cultivated land in Zhong lou District of Changzhou City, China. J. Agric. Resour. Environ. 2020, 37, 672–680. [Google Scholar]
  26. Wu, X.; Jin, X.; Han, B.; Xu, W.; Ren, J.; Sun, R.; Zhou, Y. Characteristics of cultivated land productivity change and potential during 2001–2017 in Sichuan Province, China. Trans. Chin. Soc. Agric. Eng. 2021, 37, 238–249. [Google Scholar]
  27. Chen, Y.; Han, B.; Jin, X.; Zhang, Y. Analysis of the cropland productivity change and the impact of land consolidation in the Yangtze River Economic Zone. Trans. Chin. Soc. Agric. Eng. 2023, 39, 182–193. [Google Scholar]
  28. Zhang, J.; Dong, Y.; Ye, Z. Calculation of county-level cultivated land productivity based on NPP index corrected by topography. Trans. Chin. Soc. Agric. Eng. 2020, 36, 227–234. [Google Scholar]
  29. Lai, Z.; Chen, M.; Liu, T. Changes in and prospects for cultivated land use since the reform and opening up in China. Land Use Policy 2020, 97, 104781. [Google Scholar] [CrossRef]
  30. Zhang, X.; Wang, Y.; Yuan, X.; Yang, Y. Regional land ecological security evaluation and ecological poverty alleviation practice: A case study of Yangxian County in Shaanxi Province, China. J. Geogr. Sci. 2022, 32, 682–700. [Google Scholar] [CrossRef]
  31. He, Z.; He, W.; Li, L.; Zhang, J.; Li, H. Analysis of factors influencing quality of newly increased cultivated land and grain productivity in arid highland area—Taking occupation complementary balance project as an example. J. Drain. Irrig. Mach. Eng. (JDIME) 2022, 40, 1151–1158, 1166. (In Chinese) [Google Scholar]
  32. Ye, S.; Ren, S.; Song, C.; Cheng, C.; Shen, S.; Yang, J.; Zhu, D. Spatial patterns of county-level cultivated land productive-capacity and its coordination with land-use intensity in mainland China. Agric. Ecosyst. Environ. 2022, 326, 107757. [Google Scholar] [CrossRef]
  33. Wang, Y.; Li, G.; Wang, S.; Zhang, Y.; Li, D.; Zhou, H.; Xu, S. A Comprehensive Evaluation of Benefit of High-Standard Farmland Development in China. Sustainability 2022, 14, 10361. [Google Scholar] [CrossRef]
  34. Li, Y.; Chang, C.; Wang, Z.; Li, T.; Li, J.; Zhao, G. Identification of Cultivated Land Quality Grade Using Fused Multi-Source Data and Multi-Temporal Crop Remote Sensing Information. Remote Sens. 2022, 14, 2109. [Google Scholar] [CrossRef]
  35. Jiang, G.; Zhang, R.; Ma, W.; Zhou, D.; Wang, X.; He, X. Cultivated land productivity potential improvement in land consolidation schemes in Shenyang, China: Assessment and policy implications. Land Use Policy 2017, 68, 80–88. [Google Scholar] [CrossRef]
  36. Wang, X.; Zhou, D.; Jiang, G.; Peng, C. How can the sustainable goal of cultivated land use in the Qinghai-Tibet Plateau be realized?—Based on a research framework of cultivated land use patterns. Front. Environ. Sci. 2023, 11, 1134136. [Google Scholar] [CrossRef]
  37. Wang, J.; Xu, C. Geodetector: Principle and prospective. Acta Geogr. Sin. 2017, 72, 116–134. [Google Scholar]
  38. Wang, J.; Hu, Y. Environmental health risk detection with GeogDetector. Environ. Model. Softw. 2012, 33, 114–115. [Google Scholar] [CrossRef]
  39. Cao, F.; Ge, Y.; Wang, J. Optimal discretization for geographical detectors-based risk assessment. GIScience Remote Sens. 2013, 50, 78–92. [Google Scholar] [CrossRef]
  40. Jiang, Y.; Gao, J.; Wu, S.; Jiao, K. Mediation effect as the component to ecosystem? Establishing the chain effect framework of ecosystem services across typical karst basin in China. CATENA 2023, 221, 106761. [Google Scholar] [CrossRef]
  41. Lin, Q.; Ou, G.; Wang, R.; Li, Y.; Zhao, Y.; Dong, Z. The Spatiotemporal Characteristics and Climatic Factors of COVID-19 in Wuhan, China. Sustainability 2021, 13, 8112. [Google Scholar] [CrossRef]
  42. Feng, M.Q.; Huang, P.; Pan, H.Y.; Xu, J. Study on potentials of cultivated land quality improvement based on combination of restricted factors-taking Shifang as an example. China J. Agric. Resour. Reg. Plan. 2019, 40, 126–133. [Google Scholar]
  43. Liang, Z.; Chen, S.; Yang, Y.; Zhao, R.; Shi, Z.; Viscarra Rossel, R.A. National digital soil map of organic matter in topsoil and its associated uncertainty in 1980’s China. Geoderma 2019, 335, 47–56. [Google Scholar] [CrossRef]
  44. Zhang, L.; Peng, W.; Zhang, J. Assessment of Land Ecological Security from 2000 to 2020 in the Chengdu Plain Region of China. Land 2023, 12, 1448. [Google Scholar] [CrossRef]
  45. Zhao, D.L.; He, S.S.; Yang, J.Y.; Zhang, C.; Li, P.S.; Du, Z.B. Qualitative potential calculation of arable land consolidation based on limiting factors and hot spot analysis. Trans. Chin. Soc. Agric. Mach. 2017, 48, 158–164. [Google Scholar]
  46. Duan, D.; Sun, X.; Liang, S.; Sun, J.; Fan, L.; Chen, H.; Xia, L.; Zhao, F.; Yang, W.; Yang, P. Spatiotemporal Patterns of Cultivated Land Quality Integrated with Multi-Source Remote Sensing: A Case Study of Guangzhou, China. Remote Sens. 2022, 14, 1250. [Google Scholar] [CrossRef]
  47. Binte Mostafiz, R.; Noguchi, R.; Ahamed, T. Agricultural Land Suitability Assessment Using Satellite Remote Sensing-Derived Soil-Vegetation Indices. Land 2021, 10, 223. [Google Scholar] [CrossRef]
  48. Zhang, F.; Wang, H.; Qin, T.; Rojas, R.; Qiu, L.; Yang, S.; Fang, Z.; Xue, S. Towards sustainable management of agricultural resources: A framework to assess the relationship between water, soil, economic factors, and grain production. J. Environ. Manag. 2023, 344, 118401. [Google Scholar] [CrossRef] [PubMed]
  49. Nabiollahi, K.; Taghizadeh-Mehrjardi, R.; Kerry, R.; Moradian, S. Assessment of soil quality indices for salt-affected agricultural land in Kurdistan Province, Iran. Ecol. Indic. 2017, 83, 482–494. [Google Scholar] [CrossRef]
  50. Xingwu, D.; Li, R.; Guangli, Z.; Jinming, H.; Haiyan, F. Soil productivity in the Yunnan province: Spatial distribution and sustainable utilization. Soil Tillage Res. 2015, 147, 10–19. [Google Scholar] [CrossRef]
  51. Dong, H.; Han, J.; Zhang, Y.; Chen, T.; Fan, H.; Wang, C. Research on influencing factors of cultivated land productivity of high-standard farmland projects in Hanzhong city of China—An empirical study based on PLS-SEM. Front. Sustain. Food Syst. 2023, 7, 1176426. [Google Scholar] [CrossRef]
  52. Huo, K.; Ruan, Y.; Fan, H.; Guo, C.; Cai, H. Spatial-temporal variation characteristics of cultivated land and controlling factors in the Yangtze River Delta region of China. Front. Environ. Sci. 2022, 10, 871482. [Google Scholar] [CrossRef]
Figure 1. Study area.
Land 14 00239 g001
Figure 2. Natural quality coefficient of cultivated land and technical level coefficient.
Land 14 00239 g002
Figure 3. CLPI grade.
Land 14 00239 g003
Figure 4. Classification statistics of CLPI in each district and county of Chengdu.
Land 14 00239 g004
Figure 5. Scatter plot of CLPI and local spatial autocorrelation cluster plot.
Land 14 00239 g005
Figure 6. Spatial distribution of restricting degree of major factors.
Land 14 00239 g006
Table 1. Data sources and description.
Data TypeNameSource
Topographic dataDEMhttps://www.gscloud.cn/
accessed on 5 April 2023
Field slope
Cultivated land quality dataOrganic matter contenthttps://www.fao.org/soils-portal/soil-survey/soil-maps-and-databases/harmonized-world-soil-database-v12/en/, accessed on 6 May 2023
Surface soil texture
PH
Soil nutrient element
Topographic positionCultivated land quality is derived from the 2020 Land Use Change Survey database,
Chengdu cultivated land quality and other annual update evaluation database,
http://www.geodata.cn/
accessed on 6 May 2023
soil body configuration
Soil bulk density
Rural economy dataAgricultural mechanization levelChengdu Statistical Yearbook, Chengdu Rural Statistical Yearbook, Chengdu natural disaster comprehensive risk survey results
Agricultural disaster prevention level
Agronomic management level
Irrigation guarantee rate
Farmland flood control standard
Table 2. Indicators and weights of CLP evaluation.
Serial NumberPrimary IndexSecondary IndexWeight
1Climatic conditionsLight–temperature potential productivity-
2Coefficient of crop yield ratio-
3Natural quality of
cultivated land
Topographic position0.13
4Field slope0.16
5Effective soil layer thickness0.05
6Organic content0.15
7Surface soil texture0.14
8Surface rock outcrop degree0.02
9soil body configuration0.06
10Soil bulk density0.04
11Soil nutrient element0.15
12PH0.1
13Technical levelIrrigation guarantee rate0.17
14Drainage condition0.18
15Farmland flood control standard0.18
16Disaster prevention level0.19
17Agricultural mechanization level0.16
18Agronomic management level0.12
Table 3. Corresponding table of CLP grades and scores.
GradeCLPIGradeCLPIGradeCLPI
1[4200, 4500]6[2700, 3000)11[1200, 1500)
2[3900, 4200)7[2400, 2700)12[900, 1200)
3[3600, 3900)8[2100, 2400)13[600, 900)
4[3300, 3600)9[1800, 2100)14[300, 600)
5[3000, 3300)10[1500, 1800)15[0, 300)
Table 4. Analysis results of factor detection.
Primary ClassificationSecondary ClassificationFactorIdQp
Natural quality of cultivated landTopographic conditionField slopeX10.29<0.01
Topographic positionX20.07<0.01
Soil fertilityOrganic contentX30.003>0.1
Soil nutrient elementX40.013>0.1
PHX50.13<0.01
Soil bulk densityX60.43<0.01
Physical structureSurface soil textureX70.10<0.01
Effective soil layer thicknessX80.19<0.01
soil body configurationX90.30<0.01
surface rock outcrop degreeX100.19<0.01
Technical levelIrrigation and drainage conditionDrainage conditionX110.15<0.01
Irrigation guarantee rateX120.30<0.01
Technical managementAgronomic management levelX130.56<0.01
Agricultural mechanization levelX140.25<0.01
Disaster prevention and reductionDisaster prevention levelX150.09<0.01
Farmland flood control standardX160.12<0.01
Table 5. Interactive detection analysis of the relationship.
IdNatural Quality of Cultivated LandTechnical Level
Topographic ConditionSoil FertilityPhysical StructureIrrigation and Drainage ConditionTechnical ManagementDisaster Prevention and Reduction
X1X2X3X4X5X6X7X8X9X10X11X12X13X14X15X16
X10.29
X20.30.07
X30.290.070.00
X40.300.080.020.01
X50.360.190.140.150.13
X60.530.460.440.440.450.43
X70.400.190.110.120.320.510.10
X80.380.220.190.190.230.490.350.19
X90.490.340.300.310.410.550.300.410.30
X100.400.240.190.200.240.460.340.240.400.19
X110.370.210.160.160.290.460.250.370.420.320.15
X120.440.320.310.310.330.520.440.320.470.320.430.30
X130.660.590.560.560.600.590.610.620.620.570.580.650.56
X140.420.310.260.260.300.440.360.350.430.310.310.410.580.25
X150.350.160.100.110.220.460.190.260.350.260.220.380.560.290.09
X160.390.170.120.130.230.510.210.290.390.290.250.390.570.390.230.12
Note: The rectangular box indicates that the interaction between the influence factors is nonlinear enhancement, and the rest indicate two-factor enhancement. X1: field slope; X2: topographic position; X3: organic content; X4: soil nutrient elements; X5: PH; X6: soil bulk density; X7: surface soil texture; X8: effective soil layer thickness; X9: soil body configuration; X10: surface rock outcrop degree; X11: drainage condition; X12: irrigation guarantee rate; X13: agronomic management level; X14: agricultural mechanization level; X15: disaster prevention level; X16: farmland flood control standards.
Table 6. Statistics regarding the degree of CLP-limiting factors.
Limiting FactorLimit Degree RangeNo LimitMild LimitModerate LimitSevere Limit
field slope0–51.61%36.09%49.84%14.02%0.04%
soil body configuration0–20.27%38.71%52.75%8.54%0
soil bulk density0–17.17%39.38%60.53%0.09%0
irrigation guarantee rate0–100%46.99%15.65%22.94%14.42%
farmland flood control standards0–100%27.16%41.22%28.03%3.59%
agronomic management level0–100%17.15%0.07%28.79%53.98%
Table 7. Classification standards of soil nutrient elements.
LevelLevel 1Level 2Level 3Level 4Level 5
N(g/kg)>2>1.5–2>1–1.5>0.75–1<0.75
P>1>0.8–1>0.6–0.8>0.4–0.6≤0.4
Ka>25>20–25>15–20>10–15≤10
Alkeline-N(mg/kg)>150>120–150>90–120>60–90≤60
rapidly available P>40>20–40>10–20>5–10≤5
rapidly available Ka>200>150–200>100–150>50–100≤50
Disclaimer/Publisher’s Note: The statements, opinions and data contained in all publications are solely those of the individual author(s) and contributor(s) and not of MDPI and/or the editor(s). MDPI and/or the editor(s) disclaim responsibility for any injury to people or property resulting from any ideas, methods, instructions or products referred to in the content.

