Article

Multi-Scale Remote Sensing Evaluation of Land Surface Thermal Contributions Based on Quality–Quantity Dimensions and Land Use–Geomorphology Coupling

1
Human Settlements Research Center, Liaoning Normal University, Dalian 116029, China
2
Jangho Architecture College, Northeastern University, Shenyang 110169, China
3
School of Humanities and Law, Northeastern University, Shenyang 110169, China
4
School of Science, Liaodong University, Dandong 118001, China
5
Key Laboratory for Environment Computation and Sustainability of Liaoning Province, Institute of Applied Ecology, Chinese Academy of Sciences, Shenyang 110016, China
*
Authors to whom correspondence should be addressed.
Land 2025, 14(12), 2318; https://doi.org/10.3390/land14122318
Submission received: 26 October 2025 / Revised: 19 November 2025 / Accepted: 24 November 2025 / Published: 25 November 2025

Abstract

With the intensification of global warming, surface thermal environment issues have become increasingly prominent, particularly in the ecologically fragile Yellow River Basin (YRB). However, most studies neglect the synergistic effects of underlying surface composition and geomorphological context, limiting the understanding of regional thermal contribution patterns. Based on MODIS-derived land surface temperature and Landsat 8-based land use and Fathom DEM-derived geomorphological datasets, this study constructs an integrated assessment framework combining a dual “quality–quantity” perspective with land use–geomorphology coupling, systematically analyzing the comprehensive thermal contributions of different underlying surfaces. Results show that (1) the YRB features diverse underlying surfaces, transitioning from natural (forest, grassland) to human-dominated (cropland, construction land) land uses, and from high-altitude, large undulating mountains to low-altitude, small undulating plains along the source-to-downstream gradient. (2) The average LST is 17.97 °C, displaying a south–north and east–west gradient. Human disturbance intensity drives thermal responses at the land use level, with natural surfaces contributing to cooling regulation, while artificial and desert surfaces generate heat accumulation. Geomorphology jointly shapes the thermal distribution, with high mountains acting as cold sources and plains/hills as heat sources. (3) Dual “quality–quantity” dimensional evaluation reveals that temperature-based assessments alone overestimate localized extremes (e.g., towns, extremely high mountains) and underestimate broad, moderate surfaces (e.g., drylands, large and medium undulating high mountains). This “area-neglect effect” may lead to biased regional thermal assessments and unbalanced resource allocation. (4) Coupled land use–geomorphology analysis uncovers the multi-scale composite mechanisms of thermal formation and mitigates single-factor assessment biases. Geomorphology defines macro-scale energy exchange, while land use regulates local heat responses. The results provide scientific support for large-scale thermal assessment and refined management.

1. Introduction

With the rapid growth of the global population and economy, human activities such as urban expansion, agricultural development, and transportation construction have profoundly altered the characteristics of the underlying surface, thereby reshaping land–atmosphere energy exchange processes and inducing substantial changes in land surface thermal patterns [1,2]. Land surface temperature (LST), as a key parameter reflecting the surface energy balance [3], not only directly influences climate variables such as evapotranspiration, near-surface air temperature, and relative humidity but also regulates ecological processes including precipitation and vegetation growth [4,5]. According to the latest IPCC report, the global mean LST during 2011–2020 increased by approximately 1.1 °C compared to the late 19th century, accompanied by a notable rise in the frequency of extreme weather events, posing severe threats to human livelihoods and ecosystems [6,7]. Therefore, elucidating the spatial distribution of LST under the influence of human activities is crucial for understanding human–environment interactions under climate change, assessing regional ecological risks, and informing mitigation and adaptation strategies for global warming [8,9]. Meanwhile, the acceleration of urbanization has resulted in increasingly complex surface spatial configurations [10,11]. Identifying the spatial heterogeneity of LST across extensive geomorphological gradients and diverse land use contexts is essential for revealing regional climate response mechanisms and formulating differentiated ecological protection and thermal regulation strategies [12].
The advancement of remote sensing technology has greatly facilitated large-scale monitoring of LST [13]. By utilizing multi-source remote sensing data such as Landsat [14,15], MODIS [16,17], and Sentinel [18,19], researchers have retrieved high-resolution LST across various spatial and temporal scales [20,21,22]. Based on land use/land cover (LUCC) data for classification and characterization, studies have revealed that different underlying surface types are key drivers of spatial variations in LST patterns [23,24]. On a macro scale, global and national land use products such as GlobeLand30 [25], FROM-GLC [26], and SinoLC-1 [27] provide essential data on major land categories—including construction land, cropland, forest land, grassland, and water body—forming a critical foundation for LST monitoring and analysis [28]. At finer scales, some studies further subdivide primary land classes—for instance, categorizing construction land into residential, commercial, public service, and open spaces [29,30], or forest land into dense forest, shrubland, and sparse woodland—and investigate their relationships with LST using landscape metrics [31]. Furthermore, with the advancement of urban climatology, the Local Climate Zone (LCZ) framework, which integrates surface morphological and functional attributes, has become a valuable tool for delineating thermal contrasts among urban surface types [32].
Despite these advances, most existing research has focused primarily on land use patterns while overlooking the critical regulatory effects of geomorphological differences on regional thermal environments. Variations in geomorphological factors—such as elevation, slope, and surface relief—significantly influence radiation fluxes, turbulent mixing, and hydro-vegetation feedbacks [33], potentially leading to distinct thermal behaviors for identical land use types under differing geomorphic conditions [34]. Specifically, elevation modifies near-surface atmospheric pressure, air density, and moisture conditions, thereby regulating evapotranspiration rates and surface heating efficiency; slope aspect determines the intensity and duration of solar radiation received, leading to systematic thermal contrasts between sunny and shaded slopes; and topographic roughness alters boundary-layer stability and air circulation, influencing the dissipation or accumulation of surface heat. Moreover, many regional studies have primarily compared temperature differences across land cover types [35], without adequately considering their areal proportions and integrated contributions to the regional thermal environment. The “Contribution Index”, derived from the heat source–sink landscape theory, emphasizes that even land types with modest temperature changes can exert dominant influence on regional thermal patterns if they occupy substantial spatial proportions [36]. Neglecting this aspect may lead to a biased attribution of driving mechanisms, reduce the transferability and robustness of empirical models, weaken mechanistic explanations of LST formation, and ultimately distort heat-risk assessment and land management strategies—thereby diminishing the applicability of research outcomes to climate adaptation and ecological governance.
The Yellow River Basin (YRB), spanning the Qinghai–Tibet Plateau, Loess Plateau, and North China Plain, encompasses diverse geomorphological units [37]—including mountains, hills, and plains—and multiple surface cover types such as grassland, forest land, cropland, construction land, and water body [38]. This high degree of geomorphic and land cover heterogeneity makes the YRB an ideal region for examining the thermal differentiation of various surface types [39].
Therefore, this study takes the YRB as the research area and employs MODIS-derived LST data, which offer broad coverage and high spatiotemporal continuity. We construct an integrated assessment framework that couples geomorphological and land cover dimensions from both qualitative and quantitative perspectives, referring, respectively, to the thermal characteristics of each land type and its area proportion within the basin. By systematically revealing the composite contributions of different underlying surfaces to the regional thermal environment, this study not only advances the theoretical understanding of surface–thermal interactions across diverse geomorphological contexts and addresses the underexplored role of geomorphological variability but also provides scientific support for the implementation of the “Ecological Protection and High-Quality Development Strategy of the YRB.” Ultimately, the findings aim to inform differentiated thermal risk management and region-specific ecological protection policies.

2. Materials and Methods

2.1. Study Area

The YRB is located between 95°53′–119°05′ E and 32°10′–41°50′ N, covering a total area of approximately 795,000 km2 (Figure 1). The basin is dominated by a temperate continental monsoon climate, which generally transitions from arid in the west to semi-arid and semi-humid in the east. Approximately three-quarters of its land area lies within arid and semi-arid zones rich in solar radiation and thermal resources. Topographically, the terrain of the YRB is high in the west and low in the east, with substantial elevation differences [40]. The basin exhibits pronounced heterogeneity in underlying surface types; each differing markedly in their capacities to absorb and reflect solar radiation. These variations contribute to distinct spatial differentiation patterns of LST across the YRB [41].

2.2. Data Sources

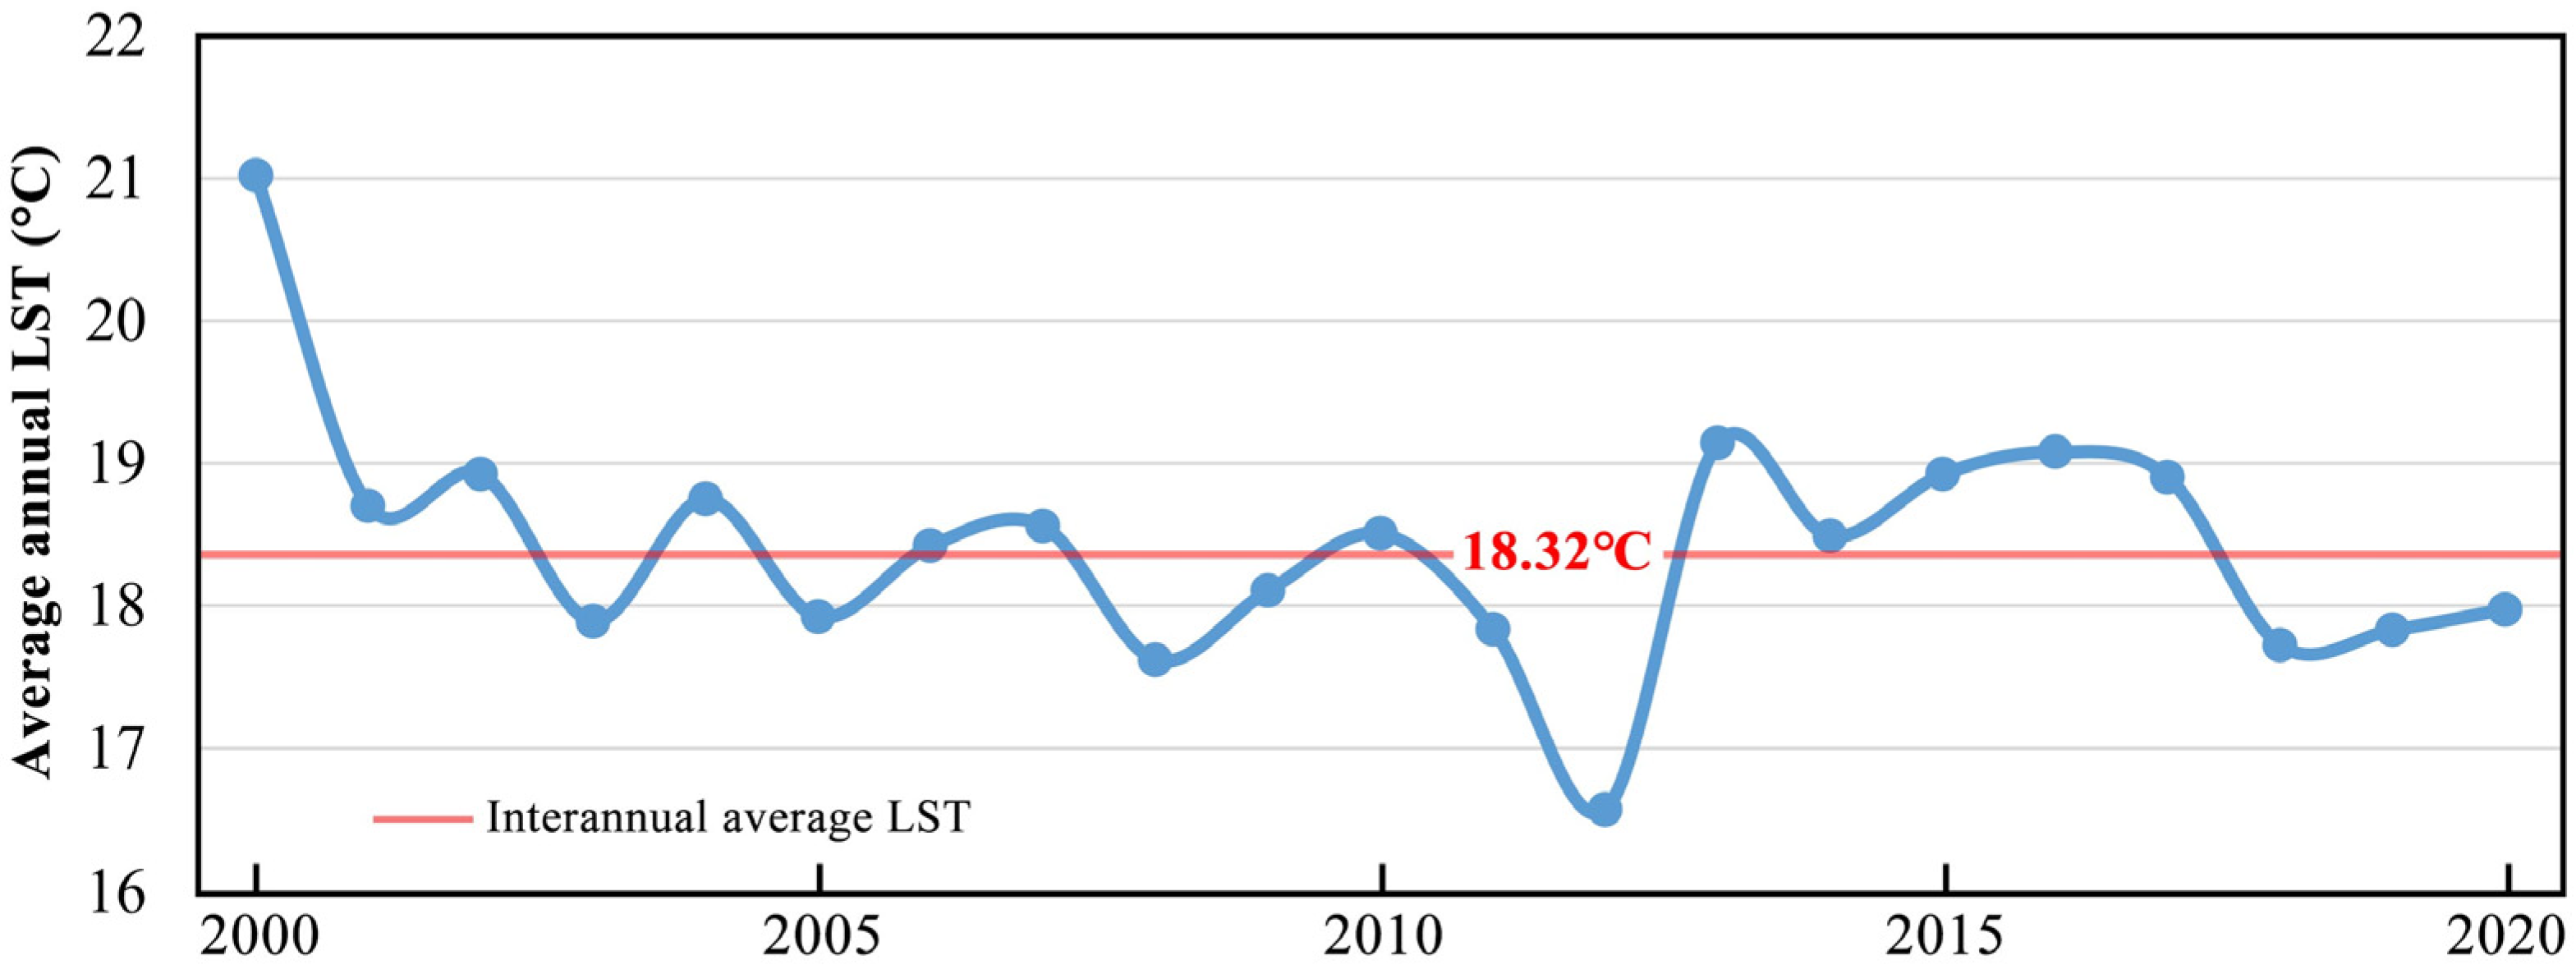
The LST data used in this study were obtained from the MOD11A2 product provided by the National Aeronautics and Space Administration (NASA) (http://modis.gsfc.nasa.gov/) (accessed on 20 September 2025). This dataset is derived from the MODIS Terra global daily LST/emissivity data, formatted in HDF. The year 2020 was selected as the analysis period because it provides a complete and continuous MODIS LST observation record with full spatial coverage across the YRB. Moreover, 2020 represents a relatively stable thermal condition within the long-term 2000–2020 MODIS archive, during which interannual LST fluctuations exhibit oscillatory yet gradually stabilizing patterns (Figure 2). Selecting a thermally stable year minimizes the influence of anomalous climatic conditions and thereby facilitates the identification of intrinsic thermal contribution differences across land use types. In addition, 2020 serves as an appropriate baseline for future inter-annual comparisons and aligns with major national policy milestones—particularly China’s 14th Five-Year Plan (2021–2025), which places a strong emphasis on ecological protection and high-quality development in the YRB.
Data preprocessing included mosaicking, projection conversion, and clipping to the study area, which were conducted using the MODIS Reprojection Tool (MRT) (The MRT was developed by Science Applications International Corporation (SAIC) in collaboration with the U.S. Geological Survey (USGS). The development took place at the USGS Earth Resources Observation and Science (EROS) Center, located in Sioux Falls, South Dakota, United States) and ArcGIS 10.8 software. Based on the monthly LST data for 2020, an annual mean LST dataset was generated. To ensure the reliability of the MODIS-derived LST, the results were validated using ground-based meteorological station observations obtained from the China Meteorological Administration (http://data.cma.cn/) (accessed on 20 September 2025) [42].
The land use data were derived from the China Multi-Period Land Use Remote Sensing Monitoring Dataset (CNLUCC) for 2020, provided by the Resource and Environmental Science and Data Center, Chinese Academy of Sciences (https://www.resdc.cn) (accessed on 20 September 2025). The dataset adopts a secondary classification system (Table 1). Geomorphological data were generated from the Fathom DEM, which was improved based on the Copernicus Digital Elevation Model (COP-DEM) released by the European Space Agency in 2021. Systematic deviations caused by vegetation, buildings, and instrument errors were removed [43]. The COP-DEM data were resampled to a 1 km resolution and classified into 26 geomorphological types according to the 1:1,000,000 Digital Geomorphological Classification System of China (Table 2) [44]. The classification was conducted based on four key terrain attributes—elevation, relief amplitude, slope, and aspect—which are widely recognized as the fundamental criteria for differentiating geomorphological units.
To ensure the reliability of the geomorphological classification, the derived results were cross-validated against the 1:1,000,000 Geomorphological Type Spatial Distribution Dataset of China (https://www.resdc.cn) (accessed on 20 September 2025), confirming consistency and improving classification accuracy. The overall classification consistency reached 87.4%, indicating a high level of agreement. Major landform units such as low-altitude plains, medium-altitude hills, and high-altitude mountains achieved individual accuracies of 85–93%, while smaller or transitional units (e.g., mesas and piedmont zones) exhibited slightly lower accuracies due to boundary complexity. These results verify that the geomorphological classification derived from COP-DEM provides reliable spatial representation for subsequent thermal environment analyses. Finally, both land use and geomorphological datasets were preprocessed—cropped to the study area and used to extract the boundaries of each land use and geomorphological type. These datasets provided the essential foundation for analyzing the spatial differentiation of LST across different land use and geomorphological types within the YRB.

2.3. Methodology

2.3.1. Land Surface Temperature Retrieval

The original MODIS data were batch-preprocessed using the MODIS Reprojection Tool (MRT) to perform projection transformation and band extraction. The processed data were then clipped to the study area boundary using ArcGIS. Finally, the raster calculator was used to convert the MODIS_LSTD data from Kelvin (K) to degrees Celsius (°C) using the following formula [45]:
T s   =   D N   ×   0.02     273.15
In the formula, T s is the converted LST in degrees Celsius (°C), and D N represents the extracted thermodynamic temperature in Kelvin (K).

2.3.2. Contribution of Heat Source and Sink Landscapes to LST

This study employed the Heat Source and Sink Landscape Index (HSI) to identify heat source and heat sink landscapes of LST. Within a certain spatial range, different underlying surface types can function as either heat sources or heat sinks. The identification principle is as follows: first, the LST of the YRB was classified into five levels (Table 3) using the standard deviation breakpoint method. Then, within each analysis unit, the proportion of high and relatively high temperature areas in each underlying surface type was calculated and compared with the proportion of high and relatively high temperature areas in the entire study area. The ratio of these two proportions was used to determine the thermal attribute of each type.
H S I   =   S i h S i / S h S
where S i h represents the area of high and relatively high temperature zones within the i-th underlying surface type; S i is the total area of the i-th underlying surface type; S h denotes the total area of high and relatively high temperature zones within the analysis unit; and S is the total area of the analysis unit. When H S I > 1, the underlying surface type is identified as a heat source; when H S I = 1, it is considered neutral; and when H S I < 1, it is classified as a heat sink.

2.3.3. Contribution Index Calculation

The contribution of land use types and geomorphological types to the thermal environment was quantitatively characterized using the contribution index. This index represents the product of the difference between the mean LST of a specific land use or geomorphological type and the mean LST of the entire study area, and the proportion of the area occupied by that type. The calculation formula is as follows [46]:
C I   =   L S T i ¯     L S T ¯   ×   S i S
where i denotes different land use or geomorphological types; L S T i ¯ is the mean LST of the i -th land use or geomorphological type; L S T ¯ is the mean LST of the study area; S i is the area of the i -th land use or geomorphological type; S is the total area of the study region. If CI ≥ 0, the i -th land use or geomorphological type makes a positive contribution to LST increase. If CI < 0, it makes a negative contribution to LST increase.
As shown in Table 3, this study classifies LST into five categories using mean- and standard-deviation-based thresholds. This classification system was adopted because it balances the need for adequate thermal resolution with the requirement of statistical robustness. A five-level scheme avoids an excessive subdivision of samples—particularly important in large, geomorphologically diverse basins—while maintaining clear interpretability for climate adaptation assessment and thermal-regulation policy design.

3. Results

3.1. Spatial Distribution of Different Underlying Surface Types in the YRB

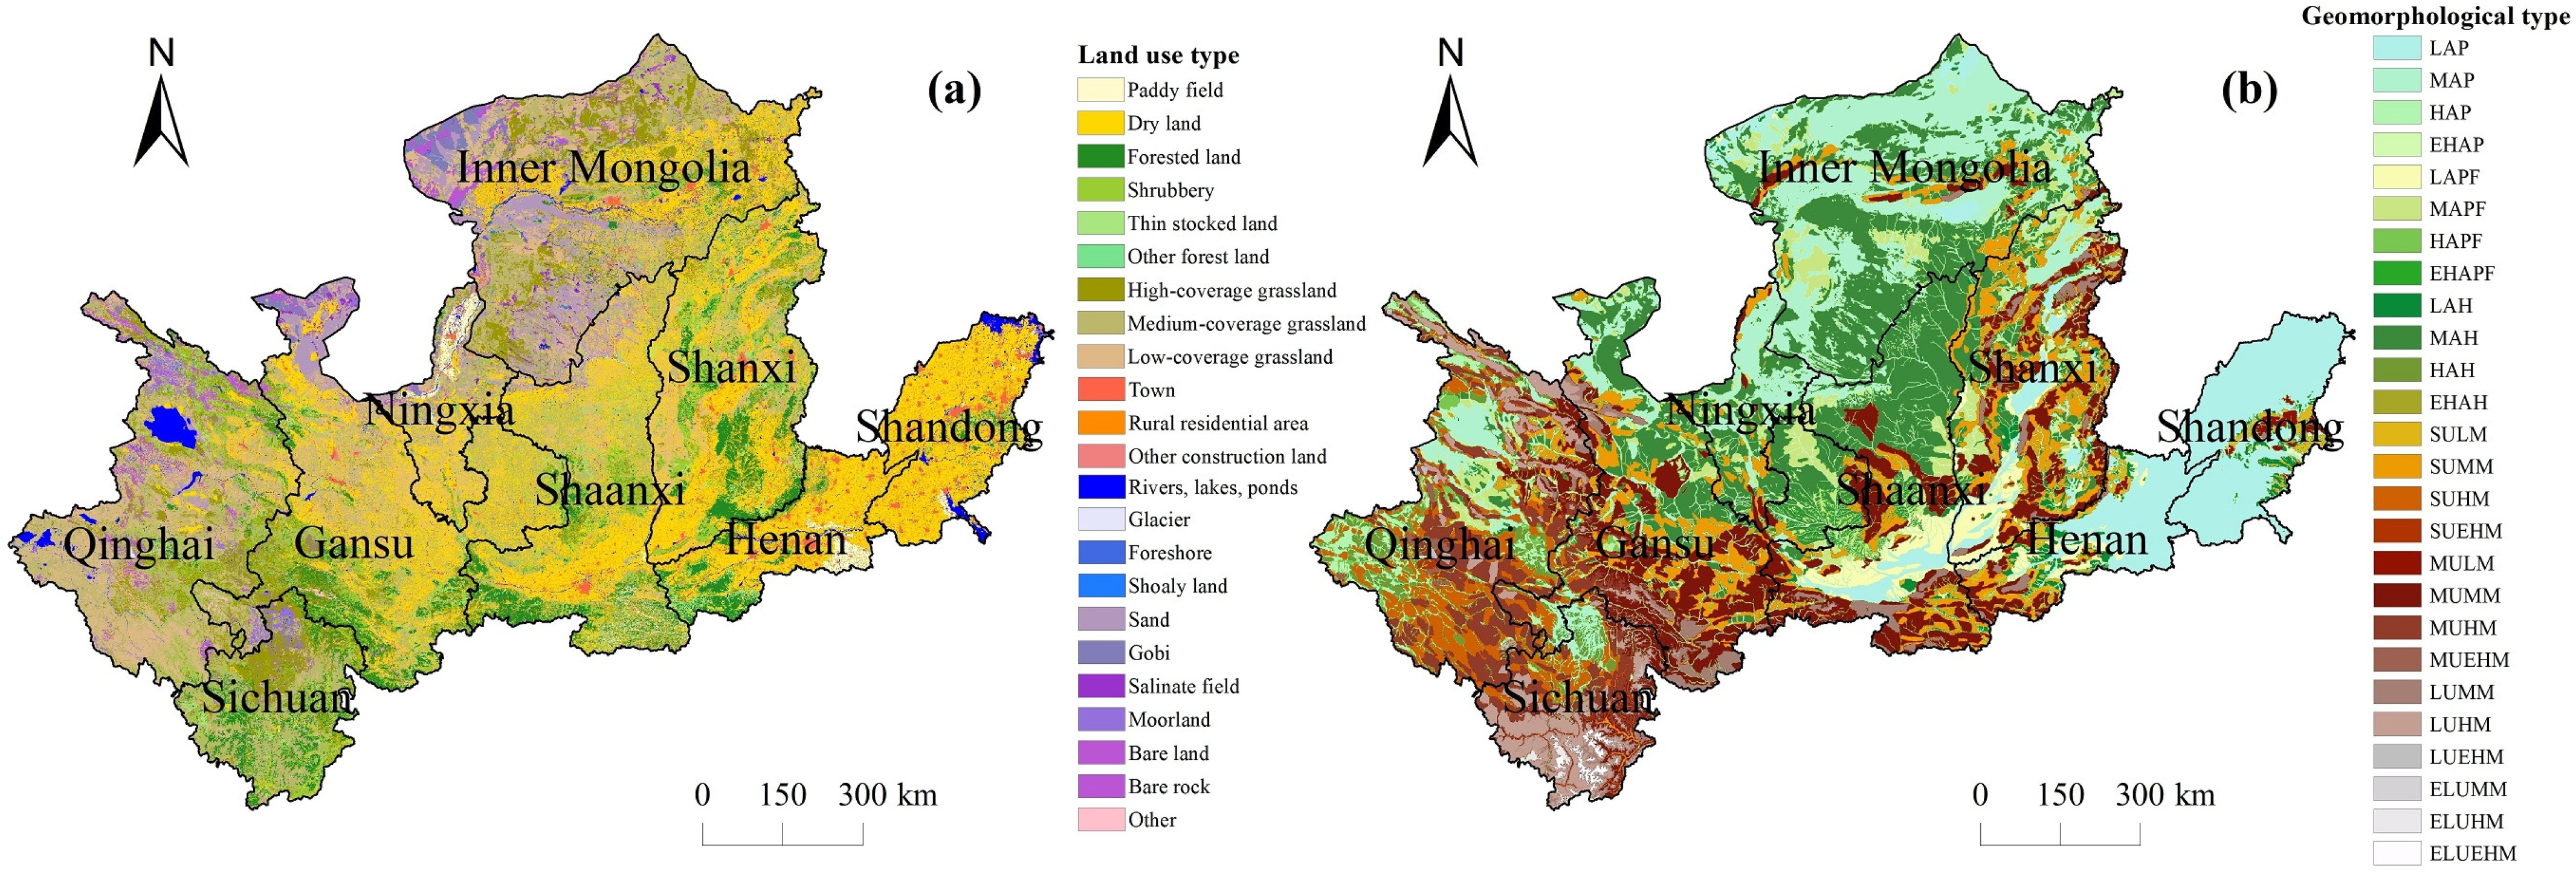
This section examines the spatial distribution characteristics of underlying surfaces in the YRB from the perspectives of land use types and geomorphological types (Figure 3 and Figure 4).
The results indicate that, in terms of land use, the basin is primarily composed of grassland (44.6%), dry land (24.7%), and forest land (14.8%). Grassland dominates the source area (59.6%) and the upper reaches (55.0%), reflecting that high-altitude and cold regions are mainly covered by natural vegetation. Its proportion decreases markedly in the middle (32.9%) and lower reaches (4.1%). Forest land is widely distributed in the source (19.3%) and middle reaches (23.9%), functioning as an important ecological barrier and water conservation zone, while its share in the upper and lower reaches is less than 5%, indicating weaker ecological protection functions there. The proportion of dry land increases progressively from the source (6.6%), upper (18.6%), and middle (36.1%) reaches to the lower reaches (63.0%). Meanwhile, the high proportions of rural residential area (11.7%) and urban land (5.8%) in the lower reaches reveal strong human disturbances. Overall, land use types in the YRB exhibit a gradient transition from natural-dominated to human-dominated patterns from the source to the lower reaches.
In terms of geomorphological types, the basin consists of hills (22.5%), plains (28.1%), mountains (38.9%), and platforms (10.6%), showing a clear spatial pattern of high in the west and low in the east. Geomorphologically, medium-altitude landforms dominate (62.4%), followed by low-altitude (18.2%) and high-altitude (17.5%) landforms, while extremely high-altitude landforms account for only 1.9%. Significant variations exist among sub-basins. The source area is characterized by rugged terrain dominated by mountains (70.6%), with high mountains (45.4%) serving as key water conservation areas. The upper reaches feature relatively gentle terrain, dominated by medium-altitude plains (35.8%), hills (34.7%), and platforms (8.1%). The middle reaches are typified by the Loess Hills and Gully region, with mid-mountains (36.4%), hills (22.3%), and platforms (16.0%) forming a complex erosional geomorphological system. In contrast, the lower reaches are dominated by low-altitude plains (83.6%), with flat terrain and high suitability for land development.
Overall, geomorphological types in the YRB exhibit a spatial transition from high-altitude, large-undulating landforms in the source area to low-altitude, small-undulating landforms in the lower reaches, forming the topographic basis for regional thermal differentiation.

3.2. Spatial Distribution of LST Across Different Underlying Surface Types

This section analyzes the spatial distribution of LST from both land use and geomorphological perspectives, aiming to identify the regulatory effects of different underlying surface structures on the basin’s thermal environment.
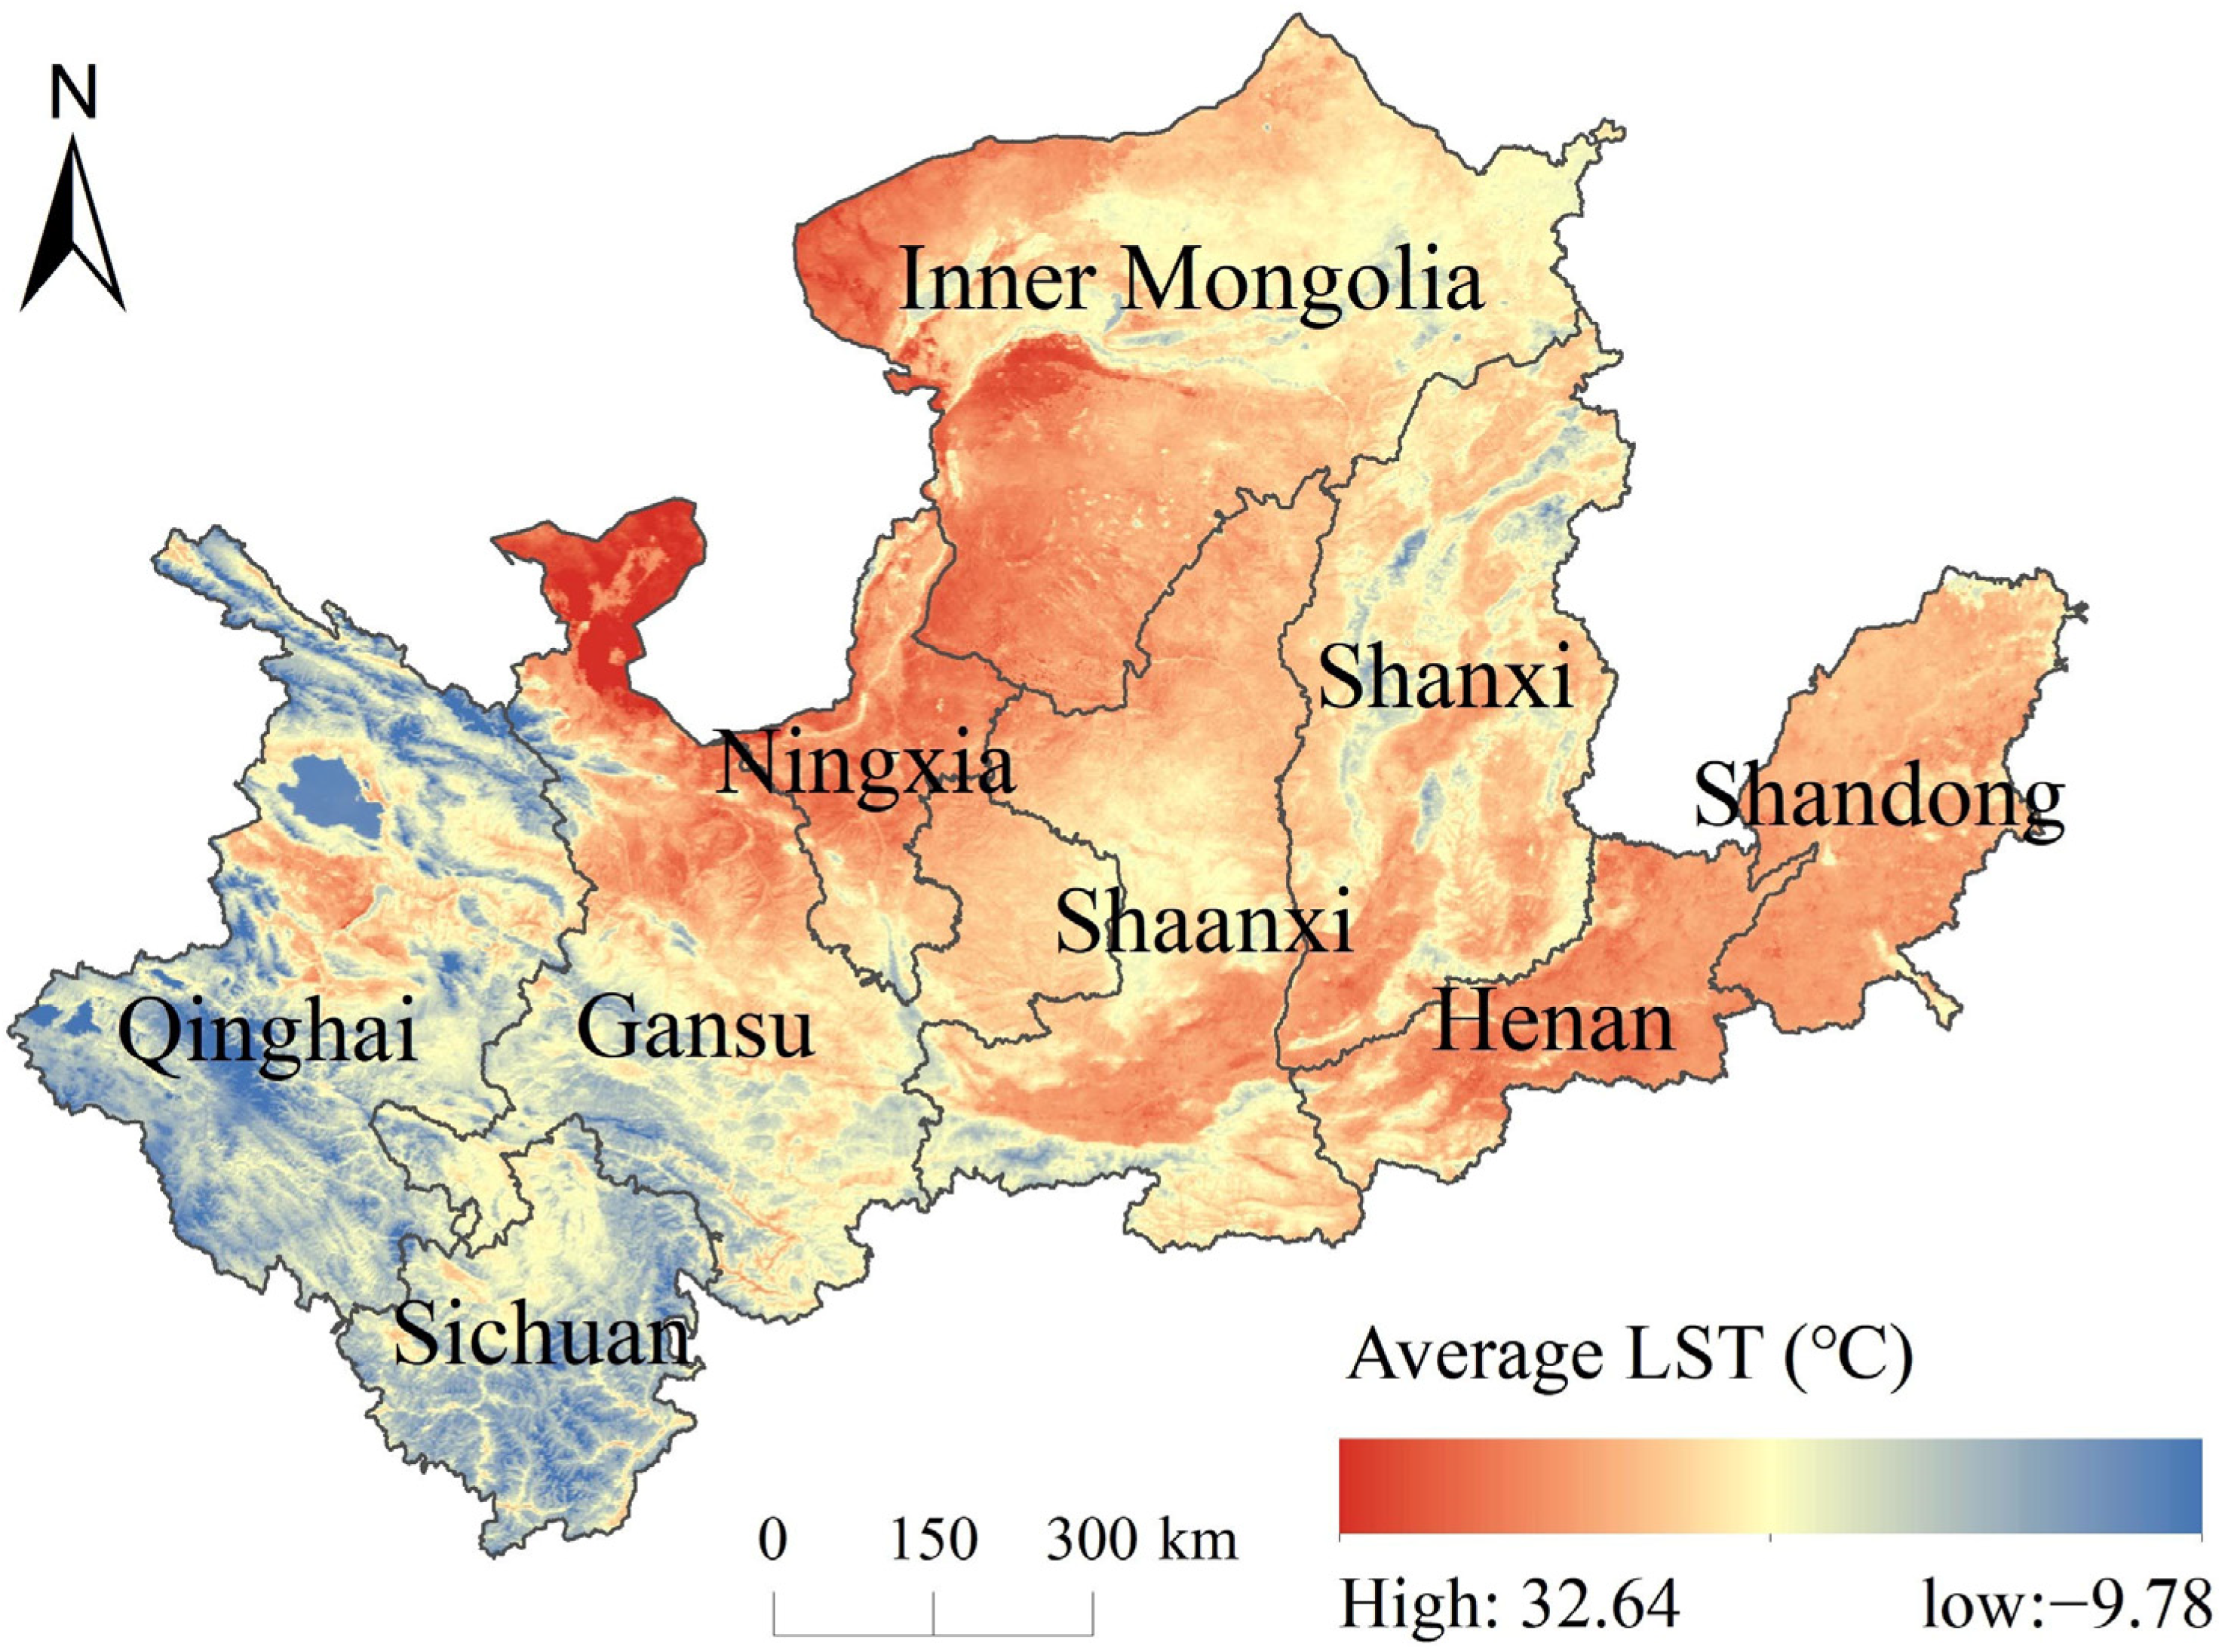
Overall, the mean LST of the YRB is 18.0 °C, exhibiting a spatial pattern of higher values in the south and east, and lower in the north and west. The mean LSTs of sub-basins follow the order: source area (13.6 °C) < middle reaches (18.9 °C) < upper reaches (20.1 °C) < lower reaches (21.5 °C), showing a temperature gradient from cold glacier–alpine meadow regions to warm arid–semi-arid plains and valleys (Figure 5).
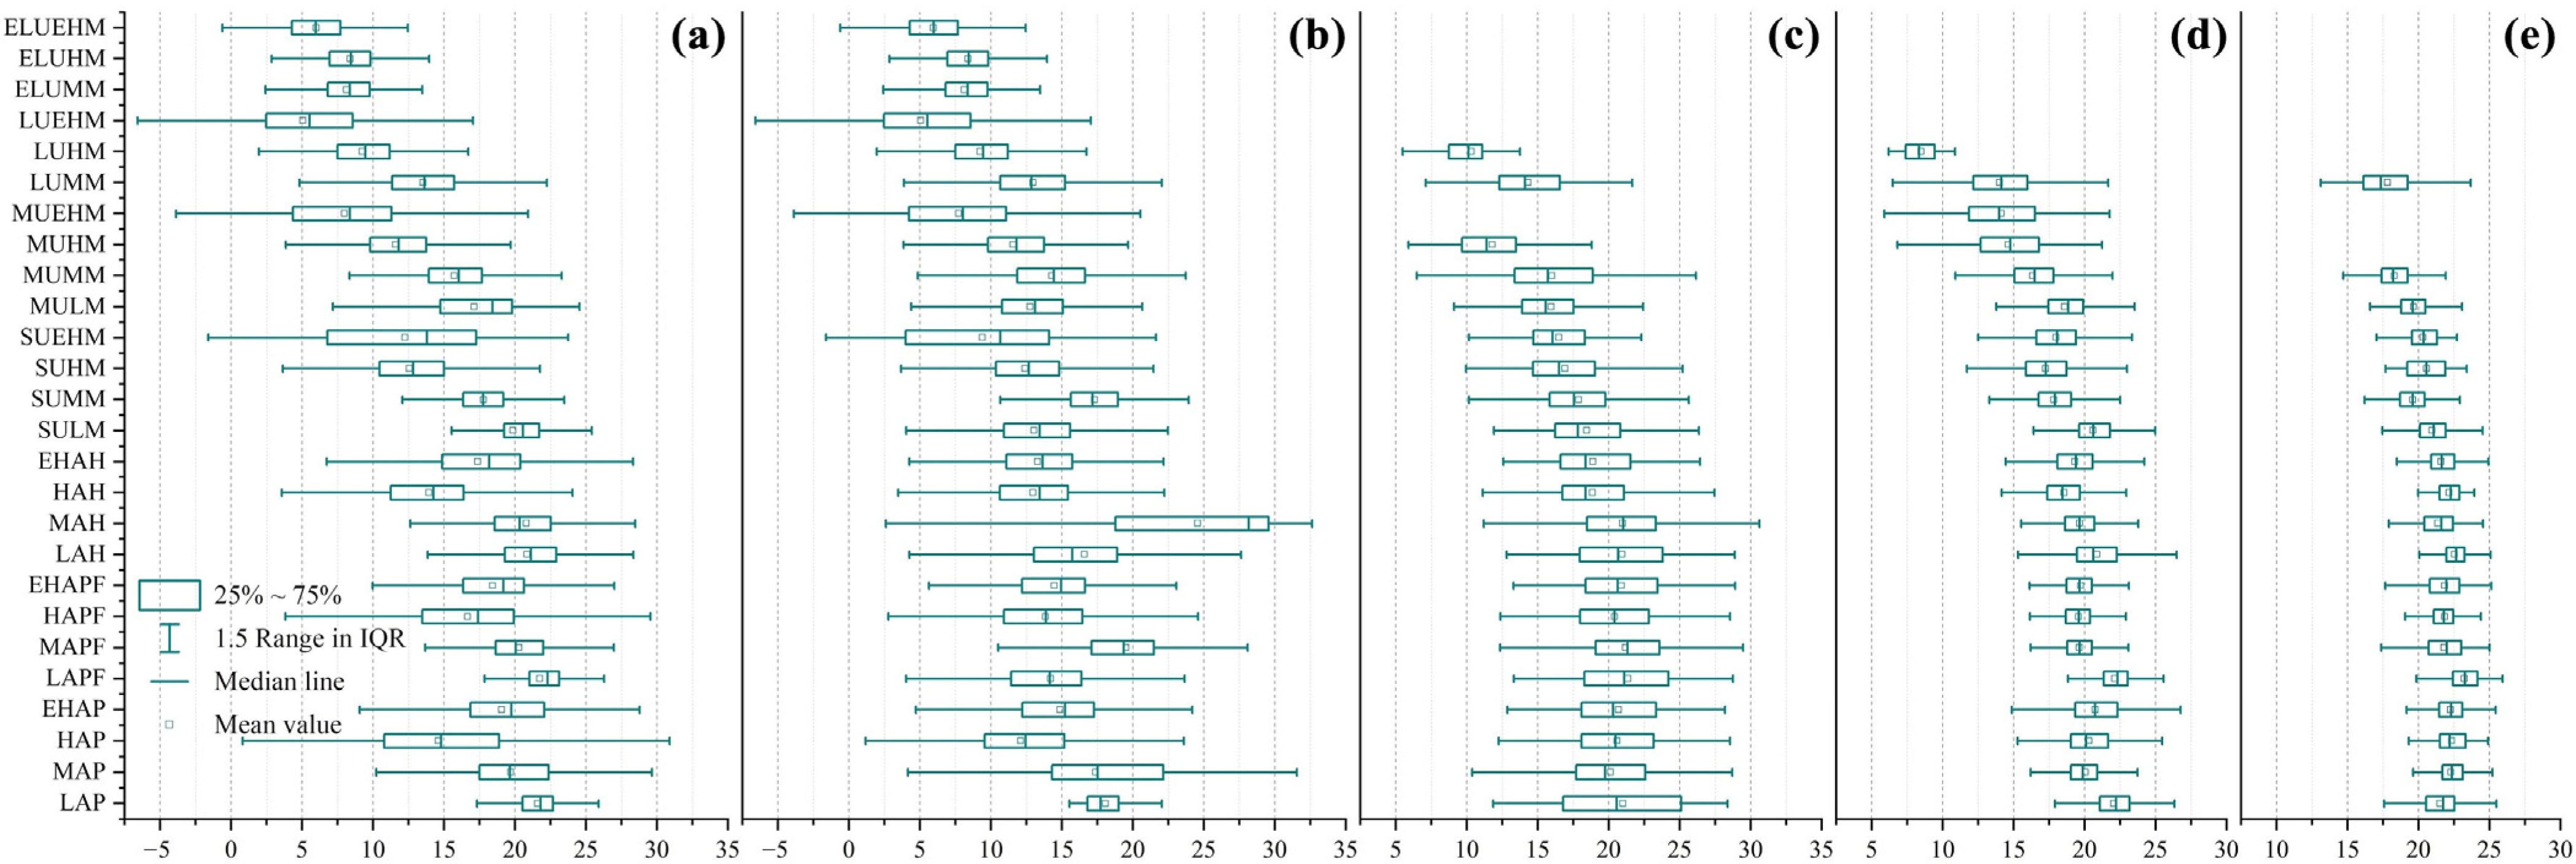
In terms of land use types (Figure 6), the low-HSI “sink” categories are primarily lakes (HSI = 0.07, 8.0 °C), forested land (0.11, 14.5 °C), and shrubbery (0.13, 14.6 °C). Their pronounced cooling effects can be attributed to the high specific heat capacity of water bodies and the evapotranspiration of vegetation. Conversely, land use types with high HSI values, identified as “sources,” are mainly unused land and construction land. Among them, Gobi (2.83, 24.8 °C) and sand (2.73, 24.2 °C) exhibit strong heat accumulation under arid and vegetation-sparse conditions, while town (2.28, 21.7 °C) reflects the anthropogenic surface heating effect induced by urbanization.
Spatially, cold-source land types remain consistent across sub-basins but show increasing LSTs from the source to the lower reaches. For example, the LSTs of forest land and lakes increase from 11.1 °C and 5.5 °C in the source area to 22.2 °C and 16.8 °C in the lower reaches. Heat-source land types exhibit more variation: the source and upper reaches are dominated by sand (26.9 °C, 23.5 °C) and Gobi (26.3 °C, 24.3 °C); the middle reaches transition to town (21.7 °C) and rural residential area (21.2 °C); and the lower reaches are dominated by town (22.7 °C) and paddy field (22.6 °C), indicating a progressive intensification of human-induced thermal effects downstream.
In terms of geomorphology, high-HSI “source” landforms are mainly low-altitude platforms (2.48, 21.8 °C), plains (2.37, 21.6 °C), and hills (1.81, 20.9 °C). In contrast, low-HSI “sink” landforms are primarily concentrated in high-altitude mountains, such as large undulating high mountains (0.001, 9.2 °C) and medium undulating high mountains (0.002, 11.6 °C).
Spatially, heat-source landforms remain consistent across sub-basins but exhibit increasing temperatures from upstream to downstream (Figure 7). For instance, the LST of low-altitude platforms increases from 21.4 °C in the upper reaches to 23.2 °C in the lower reaches. Cold-source landforms vary by region: the source area is dominated by large undulating extremely high mountains (5.1 °C) and extremely large undulating extremely high mountains (6.0 °C); the upper and middle reaches are dominated by large undulating high mountains (10.3 °C, 8.5 °C) and mid-mountains (14.3 °C, 14.0 °C); while the lower reaches are mainly composed of large undulating mid-mountains (17.8 °C) and medium undulating mid-mountains (18.3 °C).
These results indicate that, regarding land use, the degree of human disturbance determines the strength of thermal response—natural land types (e.g., forest land, water body) exhibit cooling regulation, while artificial and barren land types (e.g., construction land, unused land) form heat accumulation centers. In terms of geomorphology, both relief amplitude and elevation shape the fundamental pattern of thermal distribution: cold-source effects dominate high mountainous regions, while heat-source effects prevail in plains and hilly areas. Overall, the spatial distribution of LST in the YRB demonstrates a composite gradient pattern shifting from natural-environment dominance to human-activity intensification, reflecting pronounced spatial heterogeneity and geomorphology–land use coupling characteristics.

3.3. Contributions of Different Underlying Surface Types to the Thermal Environment of the YRB

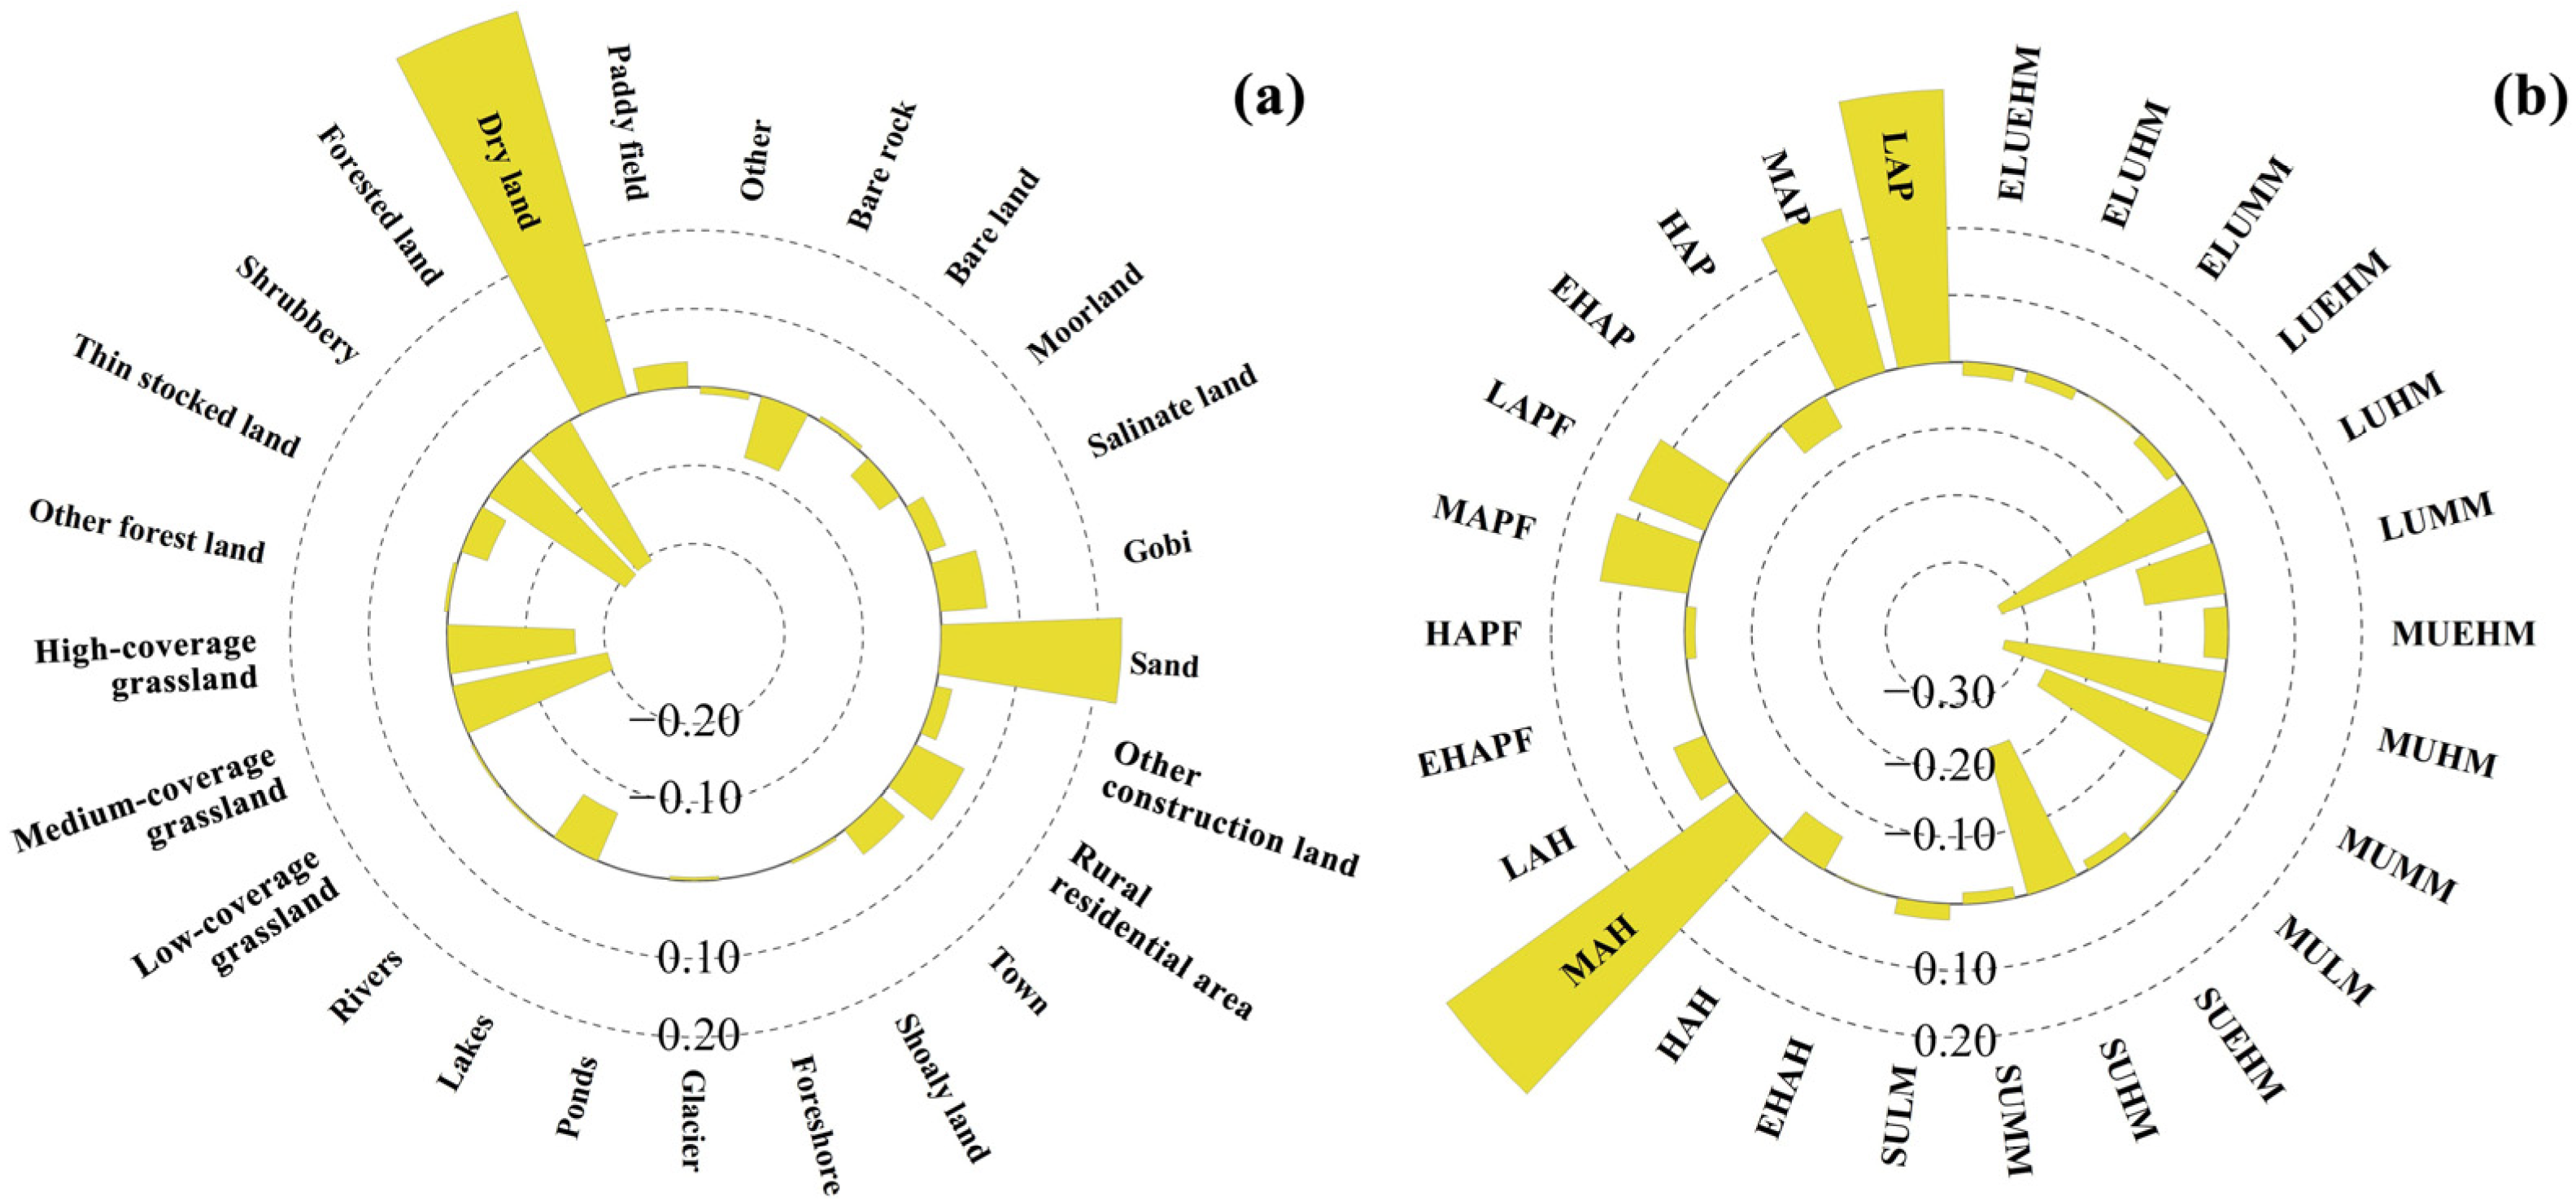
This section quantitatively evaluates the contributions of different underlying surfaces to the overall thermal environment of the YRB by considering both their temperature characteristics (quality) and area proportions (quantity). The aim is to identify underlying surface types whose effects are underestimated or overestimated when analyses rely solely on temperature features, thereby providing a more precise characterization of the spatial drivers of the basin’s thermal environment (Figure 8).
In terms of land use types, surface types that contribute significantly and positively to overall LST include dry land, unused land, and construction land. Among unused land, sand (24.2 °C, 3.7%, 0.23) and Gobi (24.8 °C, 0.9%, 0.06) show prominent contributions despite their relatively small area, due to their high-temperature characteristics. For construction land, rural residential areas (20.7 °C, 2.6%, 0.07) have lower temperatures than town (21.7 °C, 1.1%, 0.04), but their larger area results in nearly twice the positive contribution of town. Dry land demonstrates the most significant positive contribution (20.0 °C, 24.7%, 0.51). Although its temperature is lower than other high-temperature land types, its large spatial extent makes its contribution approximately twice that of sand, and 10 times that of Gobi and town, making it the dominant factor in the basin’s thermal effects. Conversely, land types with significant negative contributions are those with pronounced low-temperature characteristics, such as shrubbery (14.6 °C, 6.1%, −0.21) and forested land (14.5 °C, 6.0%, −0.21). Additionally, medium-coverage grassland (17.0 °C, 20.3%, −0.20) and high-coverage grassland (16.4 °C, 10.5%, −0.20), although near the basin mean, play a critical cooling role at the basin scale due to their widespread distribution.
In terms of geomorphology, surface types contributing positively to LST include low-altitude plains and medium-altitude hills. Although medium-altitude hills (20.8 °C, 19.1%, 0.54) have a lower mean temperature than low-altitude plains (21.6 °C, 11.4%, 0.41), their broad spatial distribution results in a higher overall thermal contribution. Interestingly, the largest negative contributions do not come from the coldest extremely high mountains, but rather from mountainous areas with larger spatial coverage, such as large undulating high mountains (9.2 °C, 3.8%, −0.33) and medium undulating high mountains (11.6 °C, 5.2%, −0.33).
Overall, considering both “quality” and “quantity”, the results reveal that assessments based solely on temperature tend to overestimate the effects of locally high-temperature but limited-area surfaces (e.g., town, low-altitude plains) while underestimating the overall contribution of widespread but moderately warm surfaces (e.g., dry land, medium-altitude hills). This “area neglect effect” may lead to bias in regional thermal assessments and misallocation of resources.

3.4. Combined Contributions of Land Use and Geomorphology to the Thermal Environment of the YRB

To more accurately identify the composite effects of underlying surfaces on the basin’s thermal environment, this section integrates land use–geomorphology coupling, comparing the results with those obtained from single-factor assessments to reveal the thermal differentiation patterns under their interaction (Figure 9).
Overall, the results indicate that the coupled analysis provides a more refined reflection of the composite thermal contributions of underlying surfaces. The combinations exhibiting the most significant positive contributions are primarily dry land–low-altitude plain (21.6 °C, 7.3%, 0.26), sand–medium-altitude hills (24.7 °C, 3.0%, 0.20), and low-coverage grassland–medium-altitude hills (20.8 °C, 4.0%, 0.11). Compared with single-factor assessments, dry land and sand remain the highest contributors, maintaining the same relative importance ranking. Coupling with geomorphology allows more precise spatial localization of high-contribution areas. The importance of low-coverage grassland increases, while construction land declines in ranking, suggesting that incorporating geomorphological factors improves the accuracy and spatial resolution of thermal contribution assessments. Negative-contribution combinations include medium-coverage grassland–large undulating high mountain (9.5 °C, 1.3%, −0.11), medium-coverage grassland–medium undulating high mountain (12.0 °C, 1.6%, −0.10), and forested land–medium undulating mid-mountain (14.7 °C, 2.6%, −0.09). Here, the relative importance of medium-coverage grassland increases compared to single-factor assessment.
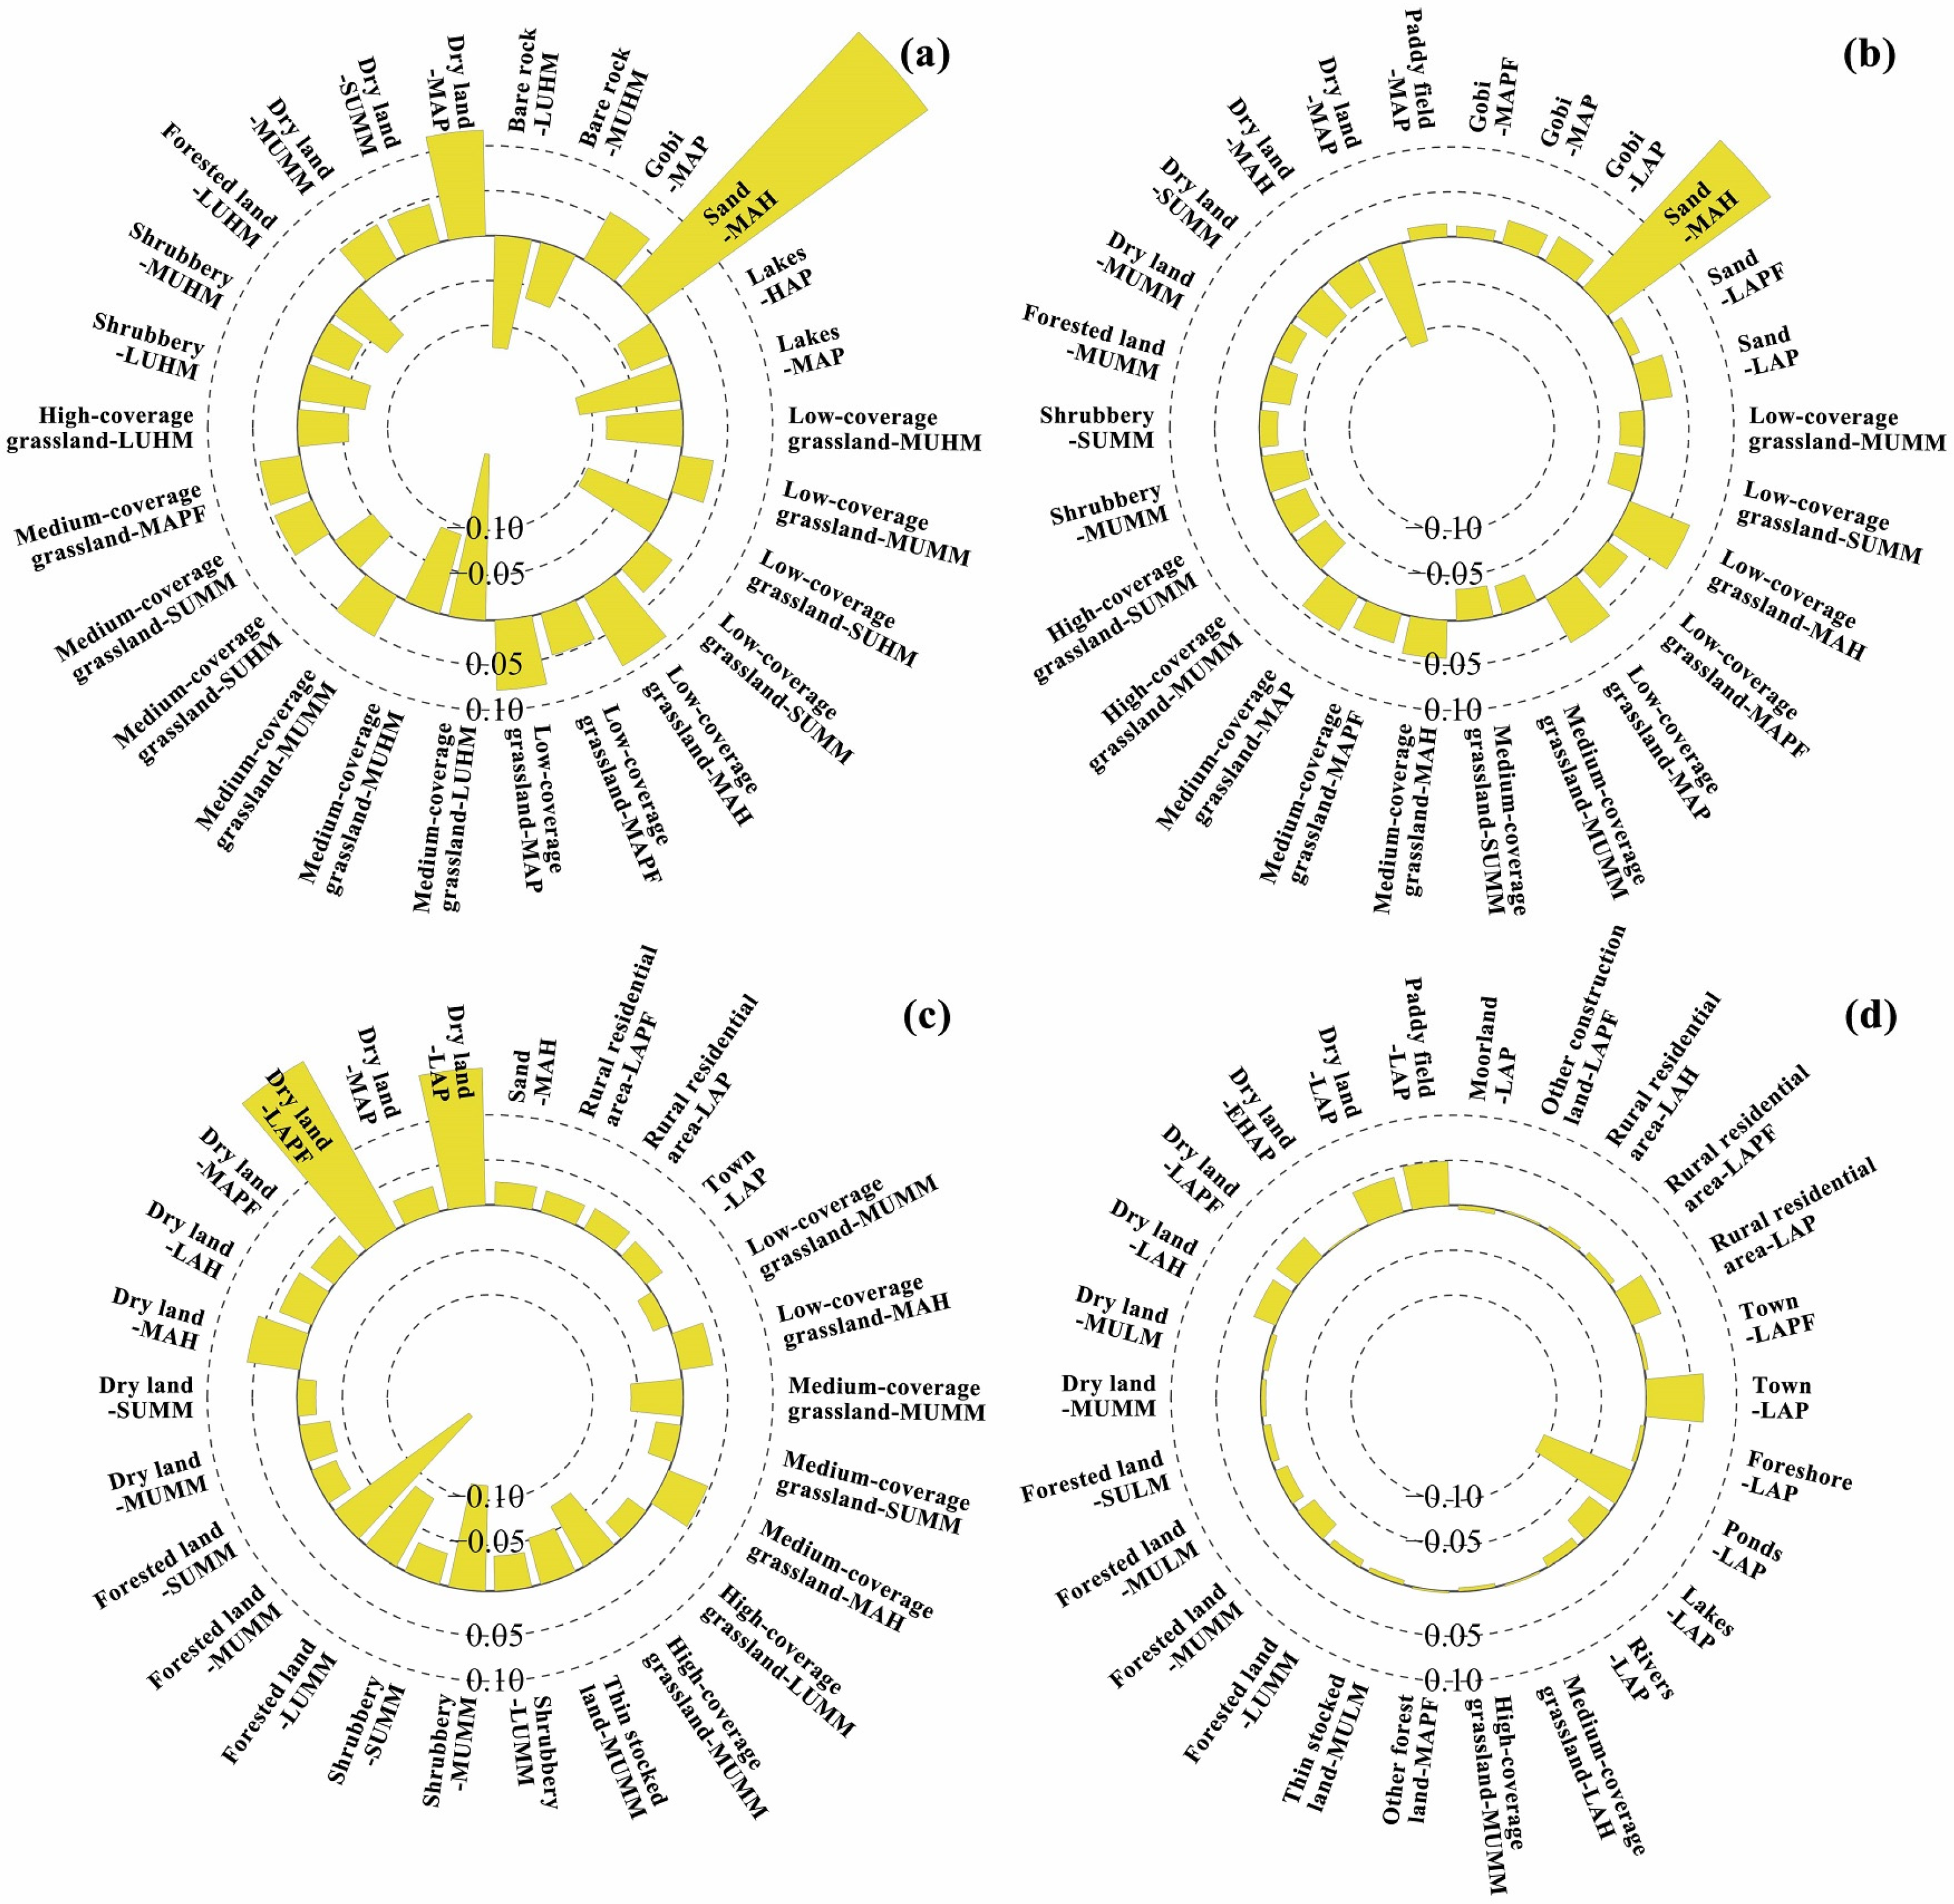
Further analysis along the river gradient shows that positive-contribution types exhibit a spatial transition from “medium–high-altitude unused land → low-altitude cropland → low-altitude construction land” (Figure 10). Negative-contribution types display a spatial transition from “high mountain grassland → mid-mountain forest → plain water body”.
Comparisons indicate that single-factor land use or geomorphology assessments cannot accurately reflect the complex formation mechanisms of the thermal environment. Geomorphology amplifies or constrains the thermal effects of different land types. For example, forest land acts as a weak cooling source on low-altitude plains but becomes a strong cooling source in mountainous areas. Dry land forms significant warming cores on low-altitude plains but has reduced warming effects in large-undulating high mountains.
Overall, combined land use–geomorphology analysis helps reveal the multi-scale; composite mechanisms shaping the basin’s thermal environment and highlights the bias of single-factor assessments. Geomorphology reshapes energy exchange at the macro scale, while land use reflects human activity type and intensity, modulating local thermal responses. Their interaction produces a composite pattern in which geomorphology controls the macro-scale structure and land use shapes local variations.

4. Discussion

With the continued intensification of global warming, surface thermal anomalies have become a critical issue affecting regional ecological security and human living environments [47]. Investigating the formation mechanisms of large-scale LST is of significant importance for understanding energy processes under the interaction of human activities and natural factors, as well as for formulating regional thermal risk mitigation strategies [48]. This study calculates the contribution degree of each type based on its thermal characteristics and area proportion, and identifies the integrated contribution patterns of land use–geomorphology combinations within a geomorphological partitioning framework.

4.1. Hierarchical Patterns of Integrated Thermal Contributions in the YRB

Within the dual “quality–quantity” framework, this study reveals the integrated contributions of different underlying surfaces to the YRB’s thermal environment. Results indicate that evaluating thermal effects solely based on mean temperature tends to overestimate the impact of extreme high-temperature land types (e.g., construction land) while underestimating the dominant role of broadly distributed moderate-temperature types (e.g., dryland, grassland) in overall thermal balance. Under a temperature-only ranking, the hottest surfaces would be ordered as follows: Gobi (24.8 °C), sand (24.2 °C), and town (21.7 °C), while the lowest temperatures occur in glacier (−0.4 °C) and lakes (8.0 °C). However, when integrating both thermal intensity and area proportion, the principal positive-contribution types shift dramatically: dry land (CI = +0.511, 24.7% of basin area), sand (CI = +0.230, 3.7%), and rural residential area (CI = +0.070, 2.6%). Conversely, the strongest negative contributors are shrubbery (CI = −0.209), forested land (CI = −0.207), and medium-coverage grassland (CI = −0.202). This reranking underscores the necessity of incorporating the “quantity” dimension to more accurately capture basin-wide thermal contributions, thereby reinforcing that thermal assessments should not rely solely on extreme surface temperatures. This finding is consistent with Liu et al. (2022) in the Yangtze River Basin, which suggests that regional thermal environment changes are more dependent on systematic variations in underlying surface composition than on extreme temperature values of individual land types [49]. Thus, incorporating the “quantity” dimension through area proportion allows for a more accurate reflection of the basin-wide thermal balance and facilitates the identification of latent thermal sources, providing a more holistic explanation for surface thermal environment assessments.
Considering geomorphological context further, the study finds that geomorphological differences significantly modulate the intensity and spatial patterns of thermal responses for each land type. Along the basin from source to downstream, the main positive-contribution types shift from natural-surface-dominated combinations (e.g., medium-altitude hills–sand, grassland) to human-activity-dominated combinations (e.g., low-altitude plain–dryland, town), reflecting the gradual evolution of controlling factors from natural attributes to human disturbances. Negative-contribution types transition from high-altitude mountain cold sources (grassland, bare rock) to low-altitude plain cold sources (water body). Compared with Li et al. (2025) in the North China Plain [50], the combination analysis in this study reveals more refined thermal contribution patterns: the same land type exhibits significant differences in thermal contribution across geomorphic units—for instance, dryland in medium-altitude hills produces a stronger warming effect on LST than in low-altitude platforms; grassland contributes significantly to cooling in high-altitude mountains but is nearly neutral in low-altitude plains. These cross-geomorphic contrasts can be explained by several fundamental topographic controls on land–atmosphere energy exchange. Elevation and slope modify solar radiation receipt and heat load, causing land types such as dryland to warm more strongly on sun-exposed hill slopes than on low, flat plains. Water availability also differs: hillslopes typically retain less soil moisture, reducing evaporative cooling, whereas plains support higher moisture storage and stronger evapotranspiration. In addition, topography shapes local airflow—mountain–valley winds and cold-air drainage enhance convective cooling at higher elevations, while plains often experience weaker ventilation. These hydrothermal and aerodynamic differences explain why the same land use type exhibits divergent thermal contributions across geomorphic contexts. This indicates that geomorphology not only influences surface energy absorption and reflection processes but also indirectly shapes LST patterns by altering surface hydrothermal conditions and vegetation physiological states. These results corroborate Xiong et al. (2021), who noted that “topographic features indirectly control surface thermal states through energy flux distribution [51],” and align with Wang et al. (2022), who emphasized that “geomorphological differentiation is a key factor in explaining the nonlinearity of underlying surface thermal effects [52].” Overall, the dual “quality–quantity” contribution identification and the integrated “land use–geomorphology” assessment framework not only theoretically deepen the understanding of thermal environment evolution under human–natural coupling but also provide a generalizable technical approach for LST analysis in multi-geomorphic composite regions.

4.2. Policy Implications

The study’s findings have significant theoretical and practical implications for regional thermal environment management and land use planning. First, thermal regulation and spatial optimization should shift toward an integrated contribution perspective, systematically considering both the “thermal effect intensity” and “spatial dominance” of underlying surfaces to achieve an integrated understanding and regulation of thermal processes [53]. Land types with moderate thermal intensity but occupying substantial spatial proportions (e.g., dryland, grassland) should be prioritized in land use zoning and ecological management as structural units maintaining regional thermal balance. Ignoring the spatial dominance of such surfaces may increase regional-scale warming risks [54].
Second, spatial optimization should incorporate geomorphological differentiation, implementing refined, partitioned management based on energy exchange characteristics and thermal response patterns of different geomorphic units [55]. For example, in medium-altitude hills, connectivity of grassland and sand should be maintained to enhance natural cooling; in low-altitude plains, water body should be strategically arranged to improve local cooling capacity; for widely distributed moderate-intensity surfaces such as dryland and grassland, preserving area and structure is essential to maintain their structural dominance in regional thermal balance.
The integrated land use–geomorphology analysis indicates that spatial thermal differentiation in the YRB exhibits marked gradients and structural patterns, with thermal contribution patterns shaped jointly by land-type functional attributes and geomorphic energy constraints [56]. Therefore, thermal regulation and land spatial optimization should treat land use–geomorphology combinations as basic units, establishing partitioned and typified management frameworks to shift from single-factor governance to coordinated multi-factor regulation. Specifically, in the source and upstream regions, positive-contribution types are dominated by natural combinations such as sand–medium-altitude hills and low-coverage grassland–medium-altitude hills; ecological restoration measures such as degraded grassland recovery, desert stabilization, and vegetation restoration should be implemented to reduce surface sensible heat accumulation. In the midstream, warming-dominant combinations such as dryland–low-altitude platform and dryland–low-altitude plain require optimized farmland structure, reinforced forest–water mosaics, and containment of high-intensity agricultural expansion. Downstream, significant warming areas include town–low-altitude plain and paddy field–low-altitude plain combinations, which can be mitigated through ventilation corridors, integrated green–blue space planning, and land redevelopment. Meanwhile, negative-contribution combinations such as mid and high-altitude grassland, forest land, and water body play key roles in maintaining regional cold-source stability and should be included in core ecological management zones. Such place-based strategies optimize thermal regulation while safeguarding ecosystem service functions, achieving harmony between regional development and environmental control.

4.3. Limitations

This study conducted a systematic analysis of the YRB’s surface thermal environment; however, several limitations remain. First, the spatial and temporal resolution of LST and land-cover data may not fully capture local micro-scale thermal variations. Second, the geomorphological classification derived from terrain metrics calculated from the DEM provides a reliable macro-scale framework, but it cannot fully capture the fine-scale hydrological and vegetation physiological differences embedded within each land use type. This limitation reflects the explanatory boundary of geomorphological stratification. Future research will further characterize how local environmental conditions operate within different land use–geomorphology combinations. Third, the study focuses on static spatial contribution patterns and does not deeply explore seasonal or interannual variations in thermal environments; thus, applicability to extreme heat events or climate-change adaptation strategies is limited.
Future research can enhance data precision, incorporate dynamic meteorological and hydrological variables, and integrate remote sensing with field observations to further improve quantitative assessment and regulatory strategies for multi-geomorphic composite regions, providing more operational scientific support for basin-scale thermal environment management.

5. Conclusions

This study focuses on the YRB, constructing an integrated assessment framework combining dual “quality–quantity” dimensions with a land use–geomorphology coupling perspective, systematically revealing the composite contributions of different underlying surfaces to the land surface thermal environment, and providing scientific guidance for regional thermal environment evaluation and land use planning. The main findings are as follows:
(1) The YRB exhibits diverse underlying surface types with significant spatial differentiation. Land use transitions from natural dominance (forest and grassland) in the source region to human-dominated landscapes (cropland and construction land) downstream, reflecting joint socioeconomic and ecological influences. Geomorphologically, a transition occurs from high-altitude, large-relief landforms to low-altitude, small-relief plains, providing the topographic foundation for thermal differentiation.
(2) The mean LST of the YRB is 17.97 °C, showing a south–north and east–west gradient (higher in the south and east). Thermal patterns are shaped by human disturbance: natural surfaces (forest, water) provide cooling, while artificial and desert surfaces (construction, unused land) act as heat centers. Topography and elevation jointly structure the thermal landscape, with cold mountainous regions contrasting sharply with hot plains and hills.
(3) Considering both temperature characteristics (quality) and area proportions (quantity), single-temperature assessments tend to overestimate the influence of localized extreme surfaces (e.g., town or extremely high-altitude mountains) and underestimate the contribution of widespread moderate-intensity ones (e.g., dryland, mid and high undulating mountains). This “area neglect effect” can bias regional thermal evaluations and lead to resource misallocation.
(4) Land use–geomorphology coupling analysis reveals that neither factor alone captures the complexity of thermal formation. Geomorphology amplifies or constrains land use thermal responses: forests cool weakly in low plains but strongly in mountains; croplands intensify heat in low plains but weaken in high mountains. Integrated analysis thus clarifies the multi-scale spatial patterns shaping the YRB thermal environment, mitigating biases from single-factor assessments. At the macro scale, geomorphology controls energy exchange structures, while land use modulates local thermal responses, together forming a compound pattern of “geomorphology controlling the macro-scale structure and land use shaping local variations.”

Author Contributions

Conceptualization, Z.L. and J.Y.; methodology, H.L. and Z.L.; software, Z.L.; validation, Z.L. and H.L.; formal analysis, H.L. and X.X.; data curation, H.L. and X.X.; writing—original draft preparation, Z.L.; writing—review and editing, J.Y. and X.X.; funding acquisition, J.Y. All authors have read and agreed to the published version of the manuscript.

Funding

This study was supported by the Liaoning Revitalization Talents Program (grant no. XLYC2202024), the Basic Scientific Research Project (Key Project) of the Education Department of Liaoning Province (grant no. LJ212410165084), and the National Natural Science Foundation of China (grant no. 41771178).

Data Availability Statement

Data will be made available on request.

Acknowledgments

The authors would like to acknowledge all colleagues and friends who have voluntarily reviewed the translation of the survey and the manuscript of this study.

Conflicts of Interest

The authors declare no conflicts of interest.

References

  1. Xuan, B.; Li, Z.; Kang, J.; Hu, Y. Spatiotemporal Relationship Between Human Activities and Urban Heat in Chinese Megacities Based on Multisource Remote Sensing. IEEE J. Sel. Top. Appl. Earth Obs. Remote Sens. 2025, 18, 17064–17079. [Google Scholar] [CrossRef]
  2. Gebrechorkos, S.H.; Sheffield, J.; Vicente-Serrano, S.M.; Funk, C.; Miralles, D.G.; Peng, J.; Dyer, E.; Talib, J.; Beck, H.E.; Singer, M.B.; et al. Warming Accelerates Global Drought Severity. Nature 2025, 642, 628–635. [Google Scholar] [CrossRef]
  3. Hutengs, C.; Vohland, M. Downscaling Land Surface Temperatures at Regional Scales with Random Forest Regression. Remote Sens. Environ. 2016, 178, 127–141. [Google Scholar] [CrossRef]
  4. Guo, A.; Yang, J.; Sun, W.; Xiao, X.; Xia Cecilia, J.; Jin, C.; Li, X. Impact of Urban Morphology and Landscape Characteristics on Spatiotemporal Heterogeneity of Land Surface Temperature. Sustain. Cities Soc. 2020, 63, 102443. [Google Scholar] [CrossRef]
  5. Yin, Z.; Wu, P.; Foody, G.M.; Wu, Y.; Liu, Z.; Du, Y.; Ling, F. Spatiotemporal Fusion of Land Surface Temperature Based on a Convolutional Neural Network. IEEE Trans. Geosci. Remote Sens. 2021, 59, 1808–1822. [Google Scholar] [CrossRef]
  6. Zhou, D.; Xiao, J.; Bonafoni, S.; Berger, C.; Deilami, K.; Zhou, Y.; Frolking, S.; Yao, R.; Qiao, Z.; Sobrino, J. Satellite Remote Sensing of Surface Urban Heat Islands: Progress, Challenges, and Perspectives. Remote Sens. 2018, 11, 48. [Google Scholar] [CrossRef]
  7. Nie, G.; Yang, J.; Zhang, Y.; Xiao, X.; Xia, J.; Cai, X.; Li, C. Duration of Exposure to Compound Daytime-Nighttime High Temperatures and Changes in Population Exposure in China under Global Warming. Humanit. Soc. Sci. Commun. 2024, 11, 1065. [Google Scholar] [CrossRef]
  8. Xu, T.; Gong, J.; Cao, J.; Tian, Y.; Rao, Y.; Ma, Y.; Duman, I.; Kerimbaevich, E.F. Differential Spatiotemporal Patterns in Urban Thermal Environment Driven by Impervious Surface Trajectories: A Multi-Scale Assessment Framework. Environ. Impact Assess. Rev. 2026, 117, 108178. [Google Scholar] [CrossRef]
  9. Yang, J.; Ren, J.; Creutzig, F.; Zhao, B.; Sun, W.; Xiao, X.; Xia, J.C.; Ge, Q. Continuous Assessment of the Factors Driving the Urban Surface Thermal Environment in 1,469 Cities Worldwide. Cell Rep. Sustain. 2025, 2, 100463. [Google Scholar] [CrossRef]
  10. Ji, Y.; Peng, Y.; Li, Z.; Li, J.; Liu, S.; Cai, X.; Yin, Y.; Feng, T. Driving Mechanism of Differentiation in Urban Thermal Environment during Rapid Urbanization. Remote Sens. 2023, 15, 2075. [Google Scholar] [CrossRef]
  11. Shen, P.; Zhao, S. Intensifying Urban Imprint on Land Surface Warming: Insights from Local to Global Scale. iScience 2024, 27, 109110. [Google Scholar] [CrossRef] [PubMed]
  12. Estoque, R.C.; Murayama, Y.; Myint, S.W. Effects of Landscape Composition and Pattern on Land Surface Temperature: An Urban Heat Island Study in the Megacities of Southeast Asia. Sci. Total Environ. 2017, 577, 349–359. [Google Scholar] [CrossRef] [PubMed]
  13. Mushore, T.D.; Mutanga, O.; Odindi, J. Estimating Urban LST Using Multiple Remotely Sensed Spectral Indices and Elevation Retrievals. Sustain. Cities Soc. 2022, 78, 103623. [Google Scholar] [CrossRef]
  14. Li, Z.; Wu, F.; Ma, H.; Xu, Z.; Wang, S. Spatiotemporal Evolution and Relationship between Night Time Light and Land Surface Temperature: A Case Study of Beijing, China. Land 2022, 11, 548. [Google Scholar] [CrossRef]
  15. Rahman, M.T.; Aldosary, A.S.; Mortoja, M.G. Modeling Future Land Cover Changes and Their Effects on the Land Surface Temperatures in the Saudi Arabian Eastern Coastal City of Dammam. Land 2017, 6, 36. [Google Scholar] [CrossRef]
  16. Ghaderpour, E.; Mazzanti, P.; Bozzano, F.; Mugnozza, G.S. Trend Analysis of MODIS Land Surface Temperature and Land Cover in Central Italy. Land 2024, 13, 796. [Google Scholar] [CrossRef]
  17. Aik, D.H.J.; Ismail, M.H.; Muharam, F.M. Land Use/Land Cover Changes and the Relationship with Land Surface Temperature Using Landsat and MODIS Imageries in Cameron Highlands, Malaysia. Land 2020, 9, 372. [Google Scholar] [CrossRef]
  18. Yang, J.; Li, Z.; Zhou, Y.; Bai, X.; Xin, J.; Kang, X.; Nie, G.; Zhang, Y.; Zhou, L.; Xiao, X.; et al. Systematic Overestimation of Urban Parks’ Cooling Effects May Mislead Heat-Governance-Oriented Park Planning. Landsc. Urban Plan. 2025, 264, 105467. [Google Scholar] [CrossRef]
  19. García, D.H. Analysis and Precision of the Terrestrial Surface Temperature Using Landsat 8 and Sentinel 3 Images: Study Applied to the City of Granada (Spain). Sustain. Cities Soc. 2021, 71, 102980. [Google Scholar] [CrossRef]
  20. Wang, R.; Murayama, Y. Geo-Simulation of Land Use/Cover Scenarios and Impacts on Land Surface Temperature in Sapporo, Japan. Sustain. Cities Soc. 2020, 63, 102432. [Google Scholar] [CrossRef]
  21. Chen, S.; Haase, D.; Qureshi, S.; Firozjaei, M.K. Integrated Land Use and Urban Function Impacts on Land Surface Temperature: Implications on Urban Heat Mitigation in Berlin with Eight-Type Spaces. Sustain. Cities Soc. 2022, 83, 103944. [Google Scholar] [CrossRef]
  22. Hurduc, A.; Ermida, S.L.; DaCamara, C.C. On the Suitability of Different Satellite Land Surface Temperature Products to Study Surface Urban Heat Islands. Remote Sens. 2024, 16, 3765. [Google Scholar] [CrossRef]
  23. Tran, D.X.; Pla, F.; Latorre-Carmona, P.; Myint, S.W.; Caetano, M.; Kieu, H.V. Characterizing the Relationship between Land Use Land Cover Change and Land Surface Temperature. ISPRS J. Photogramm. Remote Sens. 2017, 124, 119–132. [Google Scholar] [CrossRef]
  24. Husain, M.A.; Kumar, P.; Gonencgil, B. Assessment of Spatio-Temporal Land Use/Cover Change and Its Effect on Land Surface Temperature in Lahaul and Spiti, India. Land 2023, 12, 1294. [Google Scholar] [CrossRef]
  25. Arsanjani, J.J. Characterizing, Monitoring, and Simulating Land Cover Dynamics Using GlobeLand30: A Case Study from 2000 to 2030. J. Environ. Manag. 2018, 214, 66–75. [Google Scholar] [CrossRef]
  26. Yu, L.; Du, Z.; Dong, R.; Zheng, J.; Tu, Y.; Chen, X.; Hao, P.; Zhong, B.; Peng, D.; Zhao, J.; et al. FROM-GLC Plus: Toward near Real-Time and Multi-Resolution Land Cover Mapping. GIScience Remote Sens. 2022, 59, 1026–1047. [Google Scholar] [CrossRef]
  27. Li, Z.; He, W.; Cheng, M.; Hu, J.; Yang, G.; Zhang, H. SinoLC-1: The First 1 m Resolution National-Scale Land-Cover Map of China Created with a Deep Learning Framework and Open-Access Data. Earth Syst. Sci. Data 2023, 15, 4749–4780. [Google Scholar] [CrossRef]
  28. Chen, T.-L. Mapping Temporal and Spatial Changes in Land Use and Land Surface Temperature Based on MODIS Data. Environ. Res. 2021, 196, 110424. [Google Scholar] [CrossRef]
  29. Yang, J.; Zhou, X.; Chen, X.; Yao, X.; Li, M.; Yin, M.; Dong, F.; Yan, S.; Zhao, J. Exploring the main and interactive effects of urban morphology on land surface temperature across different functional zones: A local geoshapley analysis based on XAI. Sustain. Cities Soc. 2025, 134, 106913. [Google Scholar] [CrossRef]
  30. Chen, Y.; Yang, J.; Yang, R.; Xiao, X.; Xia, J. Contribution of Urban Functional Zones to the Spatial Distribution of Urban Thermal Environment. Build. Environ. 2022, 216, 109000. [Google Scholar] [CrossRef]
  31. Liu, W.; Zhang, L.; Hu, X.; Meng, Q.; Qian, J.; Gao, J.; Li, T. Nonlinear Effects of Urban Multidimensional Characteristics on Daytime and Nighttime Land Surface Temperature in Highly Urbanized Regions: A Case Study in Beijing, China. Int. J. Appl. Earth Obs. Geoinf. 2024, 132, 104067. [Google Scholar] [CrossRef]
  32. Yang, J.; Yu, W.; Baklanov, A.; He, B.; Ge, Q. Mainstreaming the Local Climate Zone Framework for Climate-Resilient Cities. Nat. Commun. 2025, 16, 5705. [Google Scholar] [CrossRef]
  33. Luo, P.; Yu, B.; Li, P.; Liang, P.; Zhang, Q.; Yang, L. Understanding the Relationship between 2D/3D Variables and Land Surface Temperature in Plain and Mountainous Cities: Relative Importance and Interaction Effects. Build. Environ. 2023, 245, 110959. [Google Scholar] [CrossRef]
  34. Peng, S.; Feng, Z.; Liao, H.; Huang, B.; Peng, S.; Zhou, T. Spatial-Temporal Pattern of, and Driving Forces for, Urban Heat Island in China. Ecol. Indic. 2019, 96, 127–132. [Google Scholar] [CrossRef]
  35. Patel, S.; Indraganti, M.; Jawarneh, R.N. Land Surface Temperature Responses to Land Use Dynamics in Urban Areas of Doha, Qatar. Sustain. Cities Soc. 2024, 104, 105273. [Google Scholar] [CrossRef]
  36. Rajagopal, P.; Priya, R.S.; Sudha, G. Spatial Characteristics of Urban Heat Islands: Land Use-Based Assessment Using Chennai’s Second Master Plan. Environ. Sustain. Indic. 2025, 28, 100900. [Google Scholar] [CrossRef]
  37. Yan, J.; Qiao, H.; Li, Q.; Song, M.; Yao, X.; Gao, P.; Zhang, M.; Li, J.; Qi, G.; Li, G. Landscape Ecological Risk Assessment across Different Terrain Gradients in the Yellow River Basin. Front. Environ. Sci. 2024, 11, 1305282. [Google Scholar] [CrossRef]
  38. Yu, T.; Huang, X.; Chen, X.; Liang, J.; Li, X.; Cui, X. Deciphering the Spatial Code of the Yellow River Basin: A Novel Framework for Optimizing Land Use Functions and Zoning Identification Strategies. J. Environ. Manag. 2025, 389, 126168. [Google Scholar] [CrossRef]
  39. Cao, H.; Gao, B.; Gong, T.; Wang, B. Analyzing Changes in Frozen Soil in the Source Region of the Yellow River Using the MODIS Land Surface Temperature Products. Remote Sens. 2021, 13, 180. [Google Scholar] [CrossRef]
  40. Qin, Z.; Wang, J.; Lu, Y. Multifractal Characteristics Analysis Based on Slope Distribution Probability in the Yellow River Basin, China. ISPRS Int. J. Geo-Inf. 2021, 10, 337. [Google Scholar] [CrossRef]
  41. Bai, X.; Zhang, Z.; Li, Z.; Zhang, J. Spatial Heterogeneity and Formation Mechanism of Eco-Environmental Quality in the Yellow River Basin. Sustainability 2023, 15, 10878. [Google Scholar] [CrossRef]
  42. Kang, Z.; Zhang, Z.; Liu, L.; Wang, T.; Wang, H.; Chen, H.; Zhang, X. Spatio-temporal variation characteristics of land surface temperature in Xinjiang based on MODIS. Geogr. Res. 2022, 41, 997–1017. [Google Scholar] [CrossRef]
  43. Uhe, P.; Lucas, C.; Hawker, L.; Brine, M.; Wilkinson, H.; Cooper, A.; Saoulis, A.A.; Savage, J.; Sampson, C. FathomDEM: An Improved Global Terrain Map Using a Hybrid Vision Transformer Model. Environ. Res. Lett. 2025, 20, 034002. [Google Scholar] [CrossRef]
  44. Li, B.; Pan, B.; Cheng, W.; Han, J.; Qi, D.; Zhu, C. Research on geomorphological regionalization of China. Acta Geographica Sinica. 2013, 68, 291–306. [Google Scholar] [CrossRef]
  45. Zhao, W.; Duan, S.-B. Reconstruction of Daytime Land Surface Temperatures under Cloud-Covered Conditions Using Integrated MODIS/Terra Land Products and MSG Geostationary Satellite Data. Remote Sens. Environ. 2020, 247, 111931. [Google Scholar] [CrossRef]
  46. Yu, Z.; Yao, Y.; Yang, G.; Wang, X.; Vejre, H. Spatiotemporal Patterns and Characteristics of Remotely Sensed Region Heat Islands during the Rapid Urbanization (1995–2015) of Southern China. Sci. Total Environ. 2019, 674, 242–254. [Google Scholar] [CrossRef] [PubMed]
  47. Freychet, N.; Hegerl, G.C.; Lord, N.S.; Lo, Y.T.E.; Mitchell, D.; Collins, M. Robust Increase in Population Exposure to Heat Stress with Increasing Global Warming. Environ. Res. Lett. 2022, 17, 064049. [Google Scholar] [CrossRef]
  48. Yu, W.; Yang, J.; Sun, D.; Ren, J.; Xue, B.; Sun, W.; Xiao, X.; Xia, J.C.; Li, X. How Urban Heat Island Magnifies Hot Day Exposure: Global Unevenness Derived from Differences in Built Landscape. Sci. Total Environ. 2024, 945, 174043. [Google Scholar] [CrossRef]
  49. Liu, J.; Liu, S.; Tang, X.; Ding, Z.; Ma, M.; Yu, P. The Response of Land Surface Temperature Changes to the Vegetation Dynamics in the Yangtze River Basin. Remote Sens. 2022, 14, 5093. [Google Scholar] [CrossRef]
  50. Li, X.; Luo, M.; Li, J.; Wu, S.; Zhang, H.; Huang, Z.; Wang, Q.; Cao, W.; Tang, Y.; Wang, X. Human-Perceived Temperature Changes Linked to Local Climate Zones under Extreme Hot and Cold Weathers: A Study in the North China Plain. Sustain. Cities Soc. 2025, 121, 106201. [Google Scholar] [CrossRef]
  51. Xiong, Y.; Zhang, F. Effect of Human Settlements on Urban Thermal Environment and Factor Analysis Based on Multi-Source Data: A Case Study of Changsha City. J. Geogr. Sci. 2021, 31, 819–838. [Google Scholar] [CrossRef]
  52. Wang, G.; Peng, W. Quantifying the Spatial Differentiation Mechanism of Land Use Degree. Heliyon 2022, 8, e11389. [Google Scholar] [CrossRef]
  53. Wang, Z.; Liu, Y.; Wang, T.; Tang, S.; Wu, X. Supply and Demand Analysis of Urban Thermal Environments Regulation Services from an Accessibility Perspective: A Coupled Thermal Risk and Green Space Cooling Assessment Model. Urban Clim. 2025, 60, 102356. [Google Scholar] [CrossRef]
  54. Yao, T.; Wu, C.; Yeh, P.J.-F.; Hu, B.X.; Jiao, Y.; Li, Q.; Niu, J. Widespread Global Enhancement of Vegetation Resistance to Compound Dry-Hot Events Due to Anthropogenic Climate Change. Ecol. Indic. 2025, 178, 113880. [Google Scholar] [CrossRef]
  55. Chen, L.; Yao, Y.; Xiang, K.; Dai, X.; Li, W.; Dai, H.; Lu, K.; Li, W.; Lu, H.; Zhang, Y.; et al. Spatial-Temporal Pattern of Ecosystem Services and Sustainable Development in Representative Mountainous Cities: A Case Study of Chengdu-Chongqing Urban Agglomeration. J. Environ. Manag. 2024, 368, 122261. [Google Scholar] [CrossRef]
  56. Gao, Y.; Fu, S.; Cui, H.; Cao, Q.; Wang, Z.; Zhang, Z.; Wu, Q.; Qiao, J. Identifying the Spatio-Temporal Pattern of Drought Characteristics and Its Constraint Factors in the Yellow River Basin. Ecol. Indic. 2023, 154, 110753. [Google Scholar] [CrossRef]
Figure 1. The geographical locations of the study areas: (a) China, (b) the Yellow River Basin.
Land 14 02318 g001
Figure 2. The average annual LST changes in the YRB from 2000 to 2020.
Land 14 02318 g002
Figure 3. Spatial distribution of underlying surface types in the YRB: (a) land use types; (b) geomorphological types.
Land 14 02318 g003
Figure 4. Proportions of different underlying surface types in each sub-basin of the YRB.
Land 14 02318 g004
Figure 5. Spatial distribution of LST in the YRB.
Land 14 02318 g005
Figure 6. LST distribution of different land use types in each sub-basin of the YRB: (a) the YRB; (b) source area; (c) upper reaches; (d) middle reaches; (e) lower reaches.
Land 14 02318 g006
Figure 7. LST distribution of different geomorphological types in each sub-basin of the YRB: (a) the YRB; (b) source area; (c) upper reaches; (d) middle reaches; (e) lower reaches.
Land 14 02318 g007
Figure 8. Contribution index of different underlying surface types to overall LST in the YRB: (a) land use; (b) geomorphology. High positive contribution ranking of land use types (Top 5): dry land, sand, rural residential area, Gobi, town; high negative contribution ranking (top 5): shrubbery, forested land, medium-coverage, grassland, high-coverage grassland, bare rock. High positive contribution ranking of geomorphic types (Top 5): MAH, LAP, MAP, MAPF, LAPF; high negative contribution ranking (top 5): MUHM, LUHM, MUMM, SUHM, LUMM.
Land 14 02318 g008
Figure 9. Contribution index of combined land use–geomorphology types to the overall thermal environment of the YRB. High positive contribution ranking of land use–geomorphology types (top 5): dry land-LAP, sand-MAH, low-coverage grassland-MAH, Medium-coverage grassland-MAH, Dry land-LAPF; High negative contribution ranking (top 5): medium-coverage grassland-LUHM, medium-coverage grassland-MUHM, forested land-MUMM, low-coverage grassland-SUHM, medium-coverage grassland-SUHM.
Land 14 02318 g009
Figure 10. Contribution index of combined land use–geomorphology types to the thermal environment of each sub-basin of the YRB: (a) source area; (b) upper reaches; (c) middle reaches; (d) lower reaches. High positive contribution ranking of land use–geomorphology types in the source area of the YRB (top 5): sand-MAH, dry land-MAP, low-coverage grassland-MAH, low-coverage grassland-MAP, Gobi-MAP; High negative contribution ranking (top 5): medium-coverage grassland-LUHM, bare rock-LUHM, lake-MAP, low-coverage grassland-SUHM, medium-coverage grassland-MUHM. High positive contribution ranking of land use–geomorphology types in the upper reaches of the YRB (top 5): Sand-MAH, low-coverage grassland-MAH, low-coverage grassland-MAP, medium-coverage grassland-MAP, medium-coverage grassland-MAH; high negative contribution ranking (top 5): dry land-MAP, shrubbery-MUMM, dry land-SUMM, low-coverage grassland-MUMM, dry land-MAH. High positive contribution ranking of land use–geomorphology types in the middle reaches of the YRB (top 5): dry land-LAPF, dry land-LAP, dry land-MAH, medium-coverage grassland-MAH, dry land-LAH; high negative contribution ranking (top 5): forested land-MUMM, shrubbery-MUMM, forested land-LUMM, high-coverage grassland-MUMM, medium-coverage grassland-MUMM. High positive contribution ranking of land use–geomorphology types in the lower reaches of the YRB (top 5): town-LAP, paddy field-LAP, dry land-LAP, rural residential area-LAP, dry land-LAPF; high negative contribution ranking (top 5): ponds-LAP, lakes-LAP, forested land-MUMM, forested land-MULM, rivers-LAP.
Land 14 02318 g010
Table 1. Basic morphological types of land use.
Primary TypeSecondary Type
CroplandPaddy fieldDry land————
Forest landForested landShrubberyThin stocked landOther forest land
GrasslandHigh-coverage grasslandMedium-coverage grasslandLow-coverage grassland
Water bodyRiversLakesPondsGlacier
ForeshoreShoaly land————
Construction landTownRural residential areaOther construction land——
Unused landSandGobiSalinate landMoorland
Bare landBare rockOther——
Table 2. Basic morphological types of geomorphologies.
Relief AmplitudeElevation
Low Altitude (<1000 m)Medium Altitude (1000~3500 m)High Altitude (3500~5000 m)Extremely High Altitude (>5000 m)
Plain (generally <30 m)Low-altitude plain (LAP)Medium-altitude plain (MAP)High-altitude plain (HAP)Extremely high-altitude plain (EHAP)
Platform (generally >30 m)Low-altitude platform (LAPF)Medium-altitude platform (MAPF)High-altitude platform (HAPF)Extremely high-altitude platform (EHAPF)
Hills (<200 m)Low-altitude hills (LAH)Medium-altitude hills (MAH)High-altitude hills (HAH)Extremely high-altitude hills (EHAH)
Small undulating mountains (200–500 m)Small undulating low mountain (SULM)Small undulating mid-mountain (SUMM)Small undulating high mountain (SUHM)Small undulating extremely high mountain (SUEHM)
Medium undulating mountains (500–1000 m)Medium undulating low mountain (MULM)Medium undulating mid-mountain (MUMM)Medium undulating high mountain (MUHM)Medium undulating extremely high mountain (MUEHM)
Large undulating mountains (1000–2500 m)——Large undulating mid-mountain (LUMM)Large undulating high mountain (LUHM)Large undulating extremely high mountain (LUEHM)
Extremely large undulating mountains (>2500 m)——Extremely large undulating mid-mountain (ELUMM)Extremely large undulating high mountain (ELUHM)Extremely large undulating extremely high mountain (ELUEHM)
Table 3. Classification of LST.
LST GradeLST Region
HighT > u + 2 std
Relatively Highu + 0.5 std < T < u + 2 std
Mediumu − 0.5 std < T < u + 0.5 std
Relatively Lowu − 2 std < T < u − 0.5 std
LowT < u − 2 std
Disclaimer/Publisher’s Note: The statements, opinions and data contained in all publications are solely those of the individual author(s) and contributor(s) and not of MDPI and/or the editor(s). MDPI and/or the editor(s) disclaim responsibility for any injury to people or property resulting from any ideas, methods, instructions or products referred to in the content.