Article

Land Expansion and Green Rural Transformation in Developing Countries: A Kaya Identity Approach

by
Edward B. Barbier
Department of Economics, Colorado State University, Fort Collins, CO 80523-1771, USA
Land 2025, 14(12), 2314; https://doi.org/10.3390/land14122314
Submission received: 23 September 2025 / Revised: 12 November 2025 / Accepted: 18 November 2025 / Published: 25 November 2025

Abstract

Many developing countries are highly dependent on agriculture and land expansion, which leads to the loss of forests and other natural habitats. Both features pose a challenge for green rural transformation. By applying a “land” Kaya identity, growth in agricultural land use for developing countries is at least partially attributed to four factors: growth in income (GDP) per capita, population, the agricultural value-added share of GDP, and the land intensity of agricultural value added. The results show that, across 122 developing countries from 2010 to 2021, both the agricultural value-added share of GDP and land expansion are negatively correlated with GDP per capita. However, there is little association between income per person and land intensity. From 2000 to 2021, the agricultural value-added share of GDP and land intensity declined in developing countries, but not sufficiently to offset the pressure on agricultural land expansion from the growth of GDP per capita and population. Decoupling land use expansion from economic growth will require substantial reductions in land intensity and agricultural dependency through policies that raise agricultural land productivity, improve efficiency and equity, and limit unnecessary agricultural land expansion. Future research should focus on applying geospatial data and sub-national analysis to analyze these trends.

1. Introduction

Rural transformation is broadly defined as “a process of comprehensive societal change whereby societies diversify their economies and reduce their reliance on agriculture” [1] (p. 463). One possible pathway for low- and middle-income, or developing, countries is through green rural transformation, which implies a process of rural development and economic diversification that is less environmentally damaging and thus more sustainable [2,3,4,5,6,7].
However, developing countries are facing several challenges to successful green rural transformation. Many are still recovering from the economic and financial dislocation caused by the COVID-19 pandemic. The disproportionate impacts of the pandemic on manufacturing and services relative to agriculture and the higher debt burdens incurred have delayed green rural transformation [3,5]. However, even as low- and middle-income countries recover from such constraints, they face two additional structural obstacles.
The first challenge is that many developing economies are not diversifying but instead continue to be dependent on agriculture for much of their employment, output, and exports. In addition, around 3.2 billion people in the rural areas of developing countries are dependent on food systems and primary production for their livelihoods [8]. Agricultural dependency is also significantly higher for poorer, as opposed to richer, countries. Agriculture’s share of total employment averaged 34.5% across all developing economies; however, agriculture in low-income countries employed 58% of the workforce, compared to 35% in lower-middle-income and 21% in upper-middle-income economies [3]. Value added from agriculture, forestry, and fishing accounts for nearly 15% of GDP for all developing countries, but the share is 27% for low-income, 16% for lower-middle-income, and 7.5% for upper-middle-income economies [3]. Agricultural exports account for around a third of all merchandise exports across developing countries, and this share rises to 40% for low-income countries [3]. Although over the longer term, many developing countries will seek to diversify their economies and reduce reliance on agriculture in an environmentally sustainable way, the sector will continue to be vital for their development and poverty alleviation goals [3,4,9,10,11].
A second challenge for green rural transformation is agricultural land expansion, especially at the expense of forests and other natural habitats [1,2,12,13,14,15,16,17]. Figure 1 depicts the trends in agricultural land use for 127 developing countries from 1990 to 2021. Over this period, agricultural land area that is arable, under permanent crops, and under permanent pastures grew by 4% on average across all countries. However, there is a considerable difference between income groups. Agricultural land increased by 15% for 24 low-income countries and by 7% for 50 lower-middle-income economies. However, for 53 upper-middle-income countries, agricultural land declined by 1% over 1990–2021.
This paper explores how agricultural dependency, as measured by the agricultural value-added share of GDP, and the land intensity of agricultural production influence land expansion in developing countries. These two components of agricultural land use are revealed by applying a Kaya identity, which has been used to track the key factors underlying energy-related carbon emissions [18,19] and water [20]. According to this decomposition, agricultural land expansion in developing countries is at least partially attributed to growth in income (GDP) per capita, population, the agricultural value-added share of GDP, and the land intensity of agricultural value added. Decoupling land use expansion from economic growth will require substantial reductions in land intensity and in the overall agricultural dependency of an economy.
To some extent, such decoupling occurs as developing countries become richer. Across 122 developing countries from 2010 to 2021, both the agricultural value-added share of GDP and land expansion are negatively correlated with GDP per capita. However, there is little association between income per person and land intensity. In addition, among low- and lower-middle-income countries, land intensity and agricultural dependency are not falling fast enough to reduce agricultural land expansion. As agriculture will continue to be vital for development and poverty alleviation goals, especially among the poorest developing countries, policies to raise agricultural land productivity and limit unnecessary agricultural land expansion are important for green rural transformation. This paper ends by discussing these policy implications, the limitations of this study, and the key areas for future research.

2. Materials and Methods

First proposed by [18], the “Kaya identity” is used to assign energy-related carbon emissions C into its major constituent parts: the carbon intensity of energy consumed (C/E), energy intensity of output (E/GDP), and gross domestic product (GDP). That is,
C C E · E G D P · G D P
Consequently, much of the growth in carbon emissions for an economy can be attributed to the growth in output, energy intensity, and carbon intensity. Thus, the Kaya identity has proven useful to determine how well different countries, such as developed versus developing economies, have been able to decarbonize through changes in their carbon and energy intensities [19]. An analogous Kaya identity for water has been used to attribute the growth of freshwater withdrawals to the growth in water intensity of an economy, GDP per person, and population [20]
We can construct a similar identity for land. For example, the agricultural land use (A) of an economy in any period t can be decomposed into four constituent factors: the land intensity of agricultural value added (A/V), agricultural value-added share of output (V/GDP), income per capita (GDP/N), and population (N), i.e.,
A A V · V G D P · G D P N · N
It follows from the identity (2) that the growth in agricultural land use for a country or group of countries can be at least partially attributed to growth in the land intensity of agricultural value added, agriculture’s share of GDP, income per capita, and population.
The decomposition of agricultural land use into its four constituent parts helps determine whether it is possible to decouple economic growth (i.e., GDP per capita) from agricultural land expansion. This is investigated through two analyses. The first examines the extent to which the agricultural land expansion from 2000 to 2021, agricultural value-added share of GDP (2010–2021 average), and agricultural land intensity (2010–2021 average) are associated with levels of GDP per capita (2010–2021 average) for 122 LMICs. The second analysis identifies and compares trends from 2000 to 2021 in the four components of the land identity (2), agricultural land intensity, value-added share of GDP, GDP per capita, and population for the sample of 122 LMICs.

3. Results

3.1. Correlations with GDP per Capita

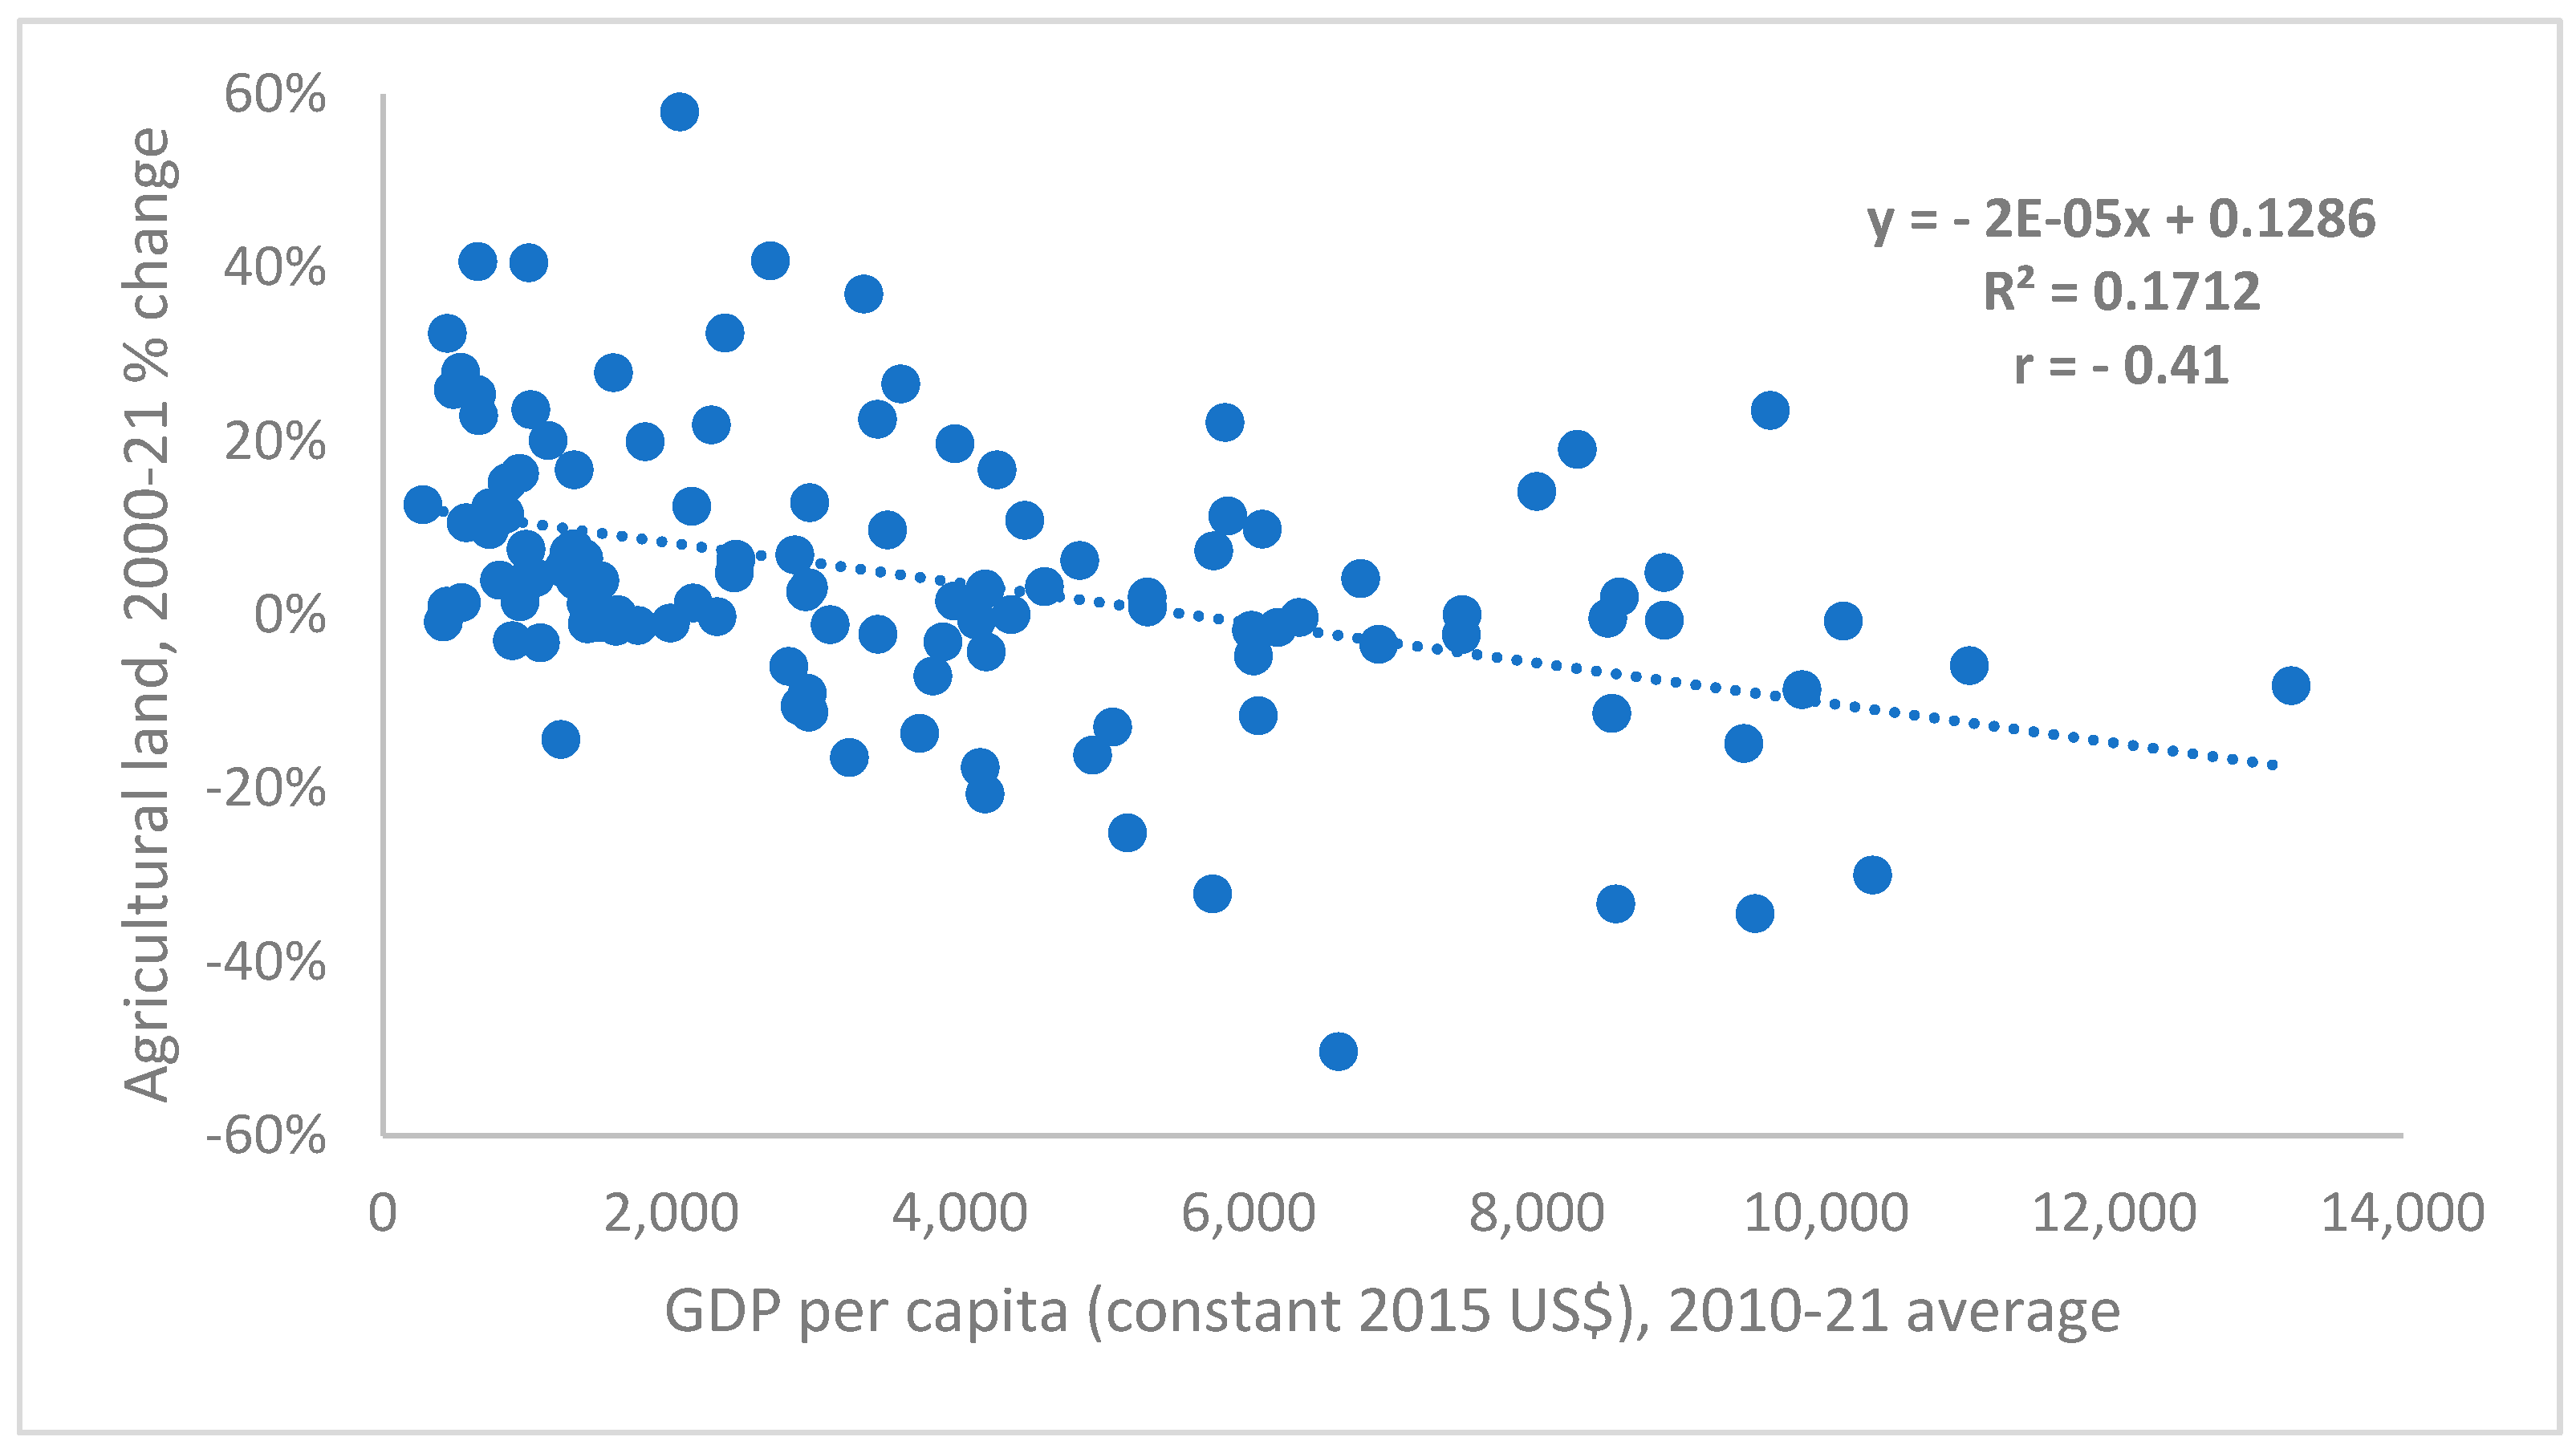
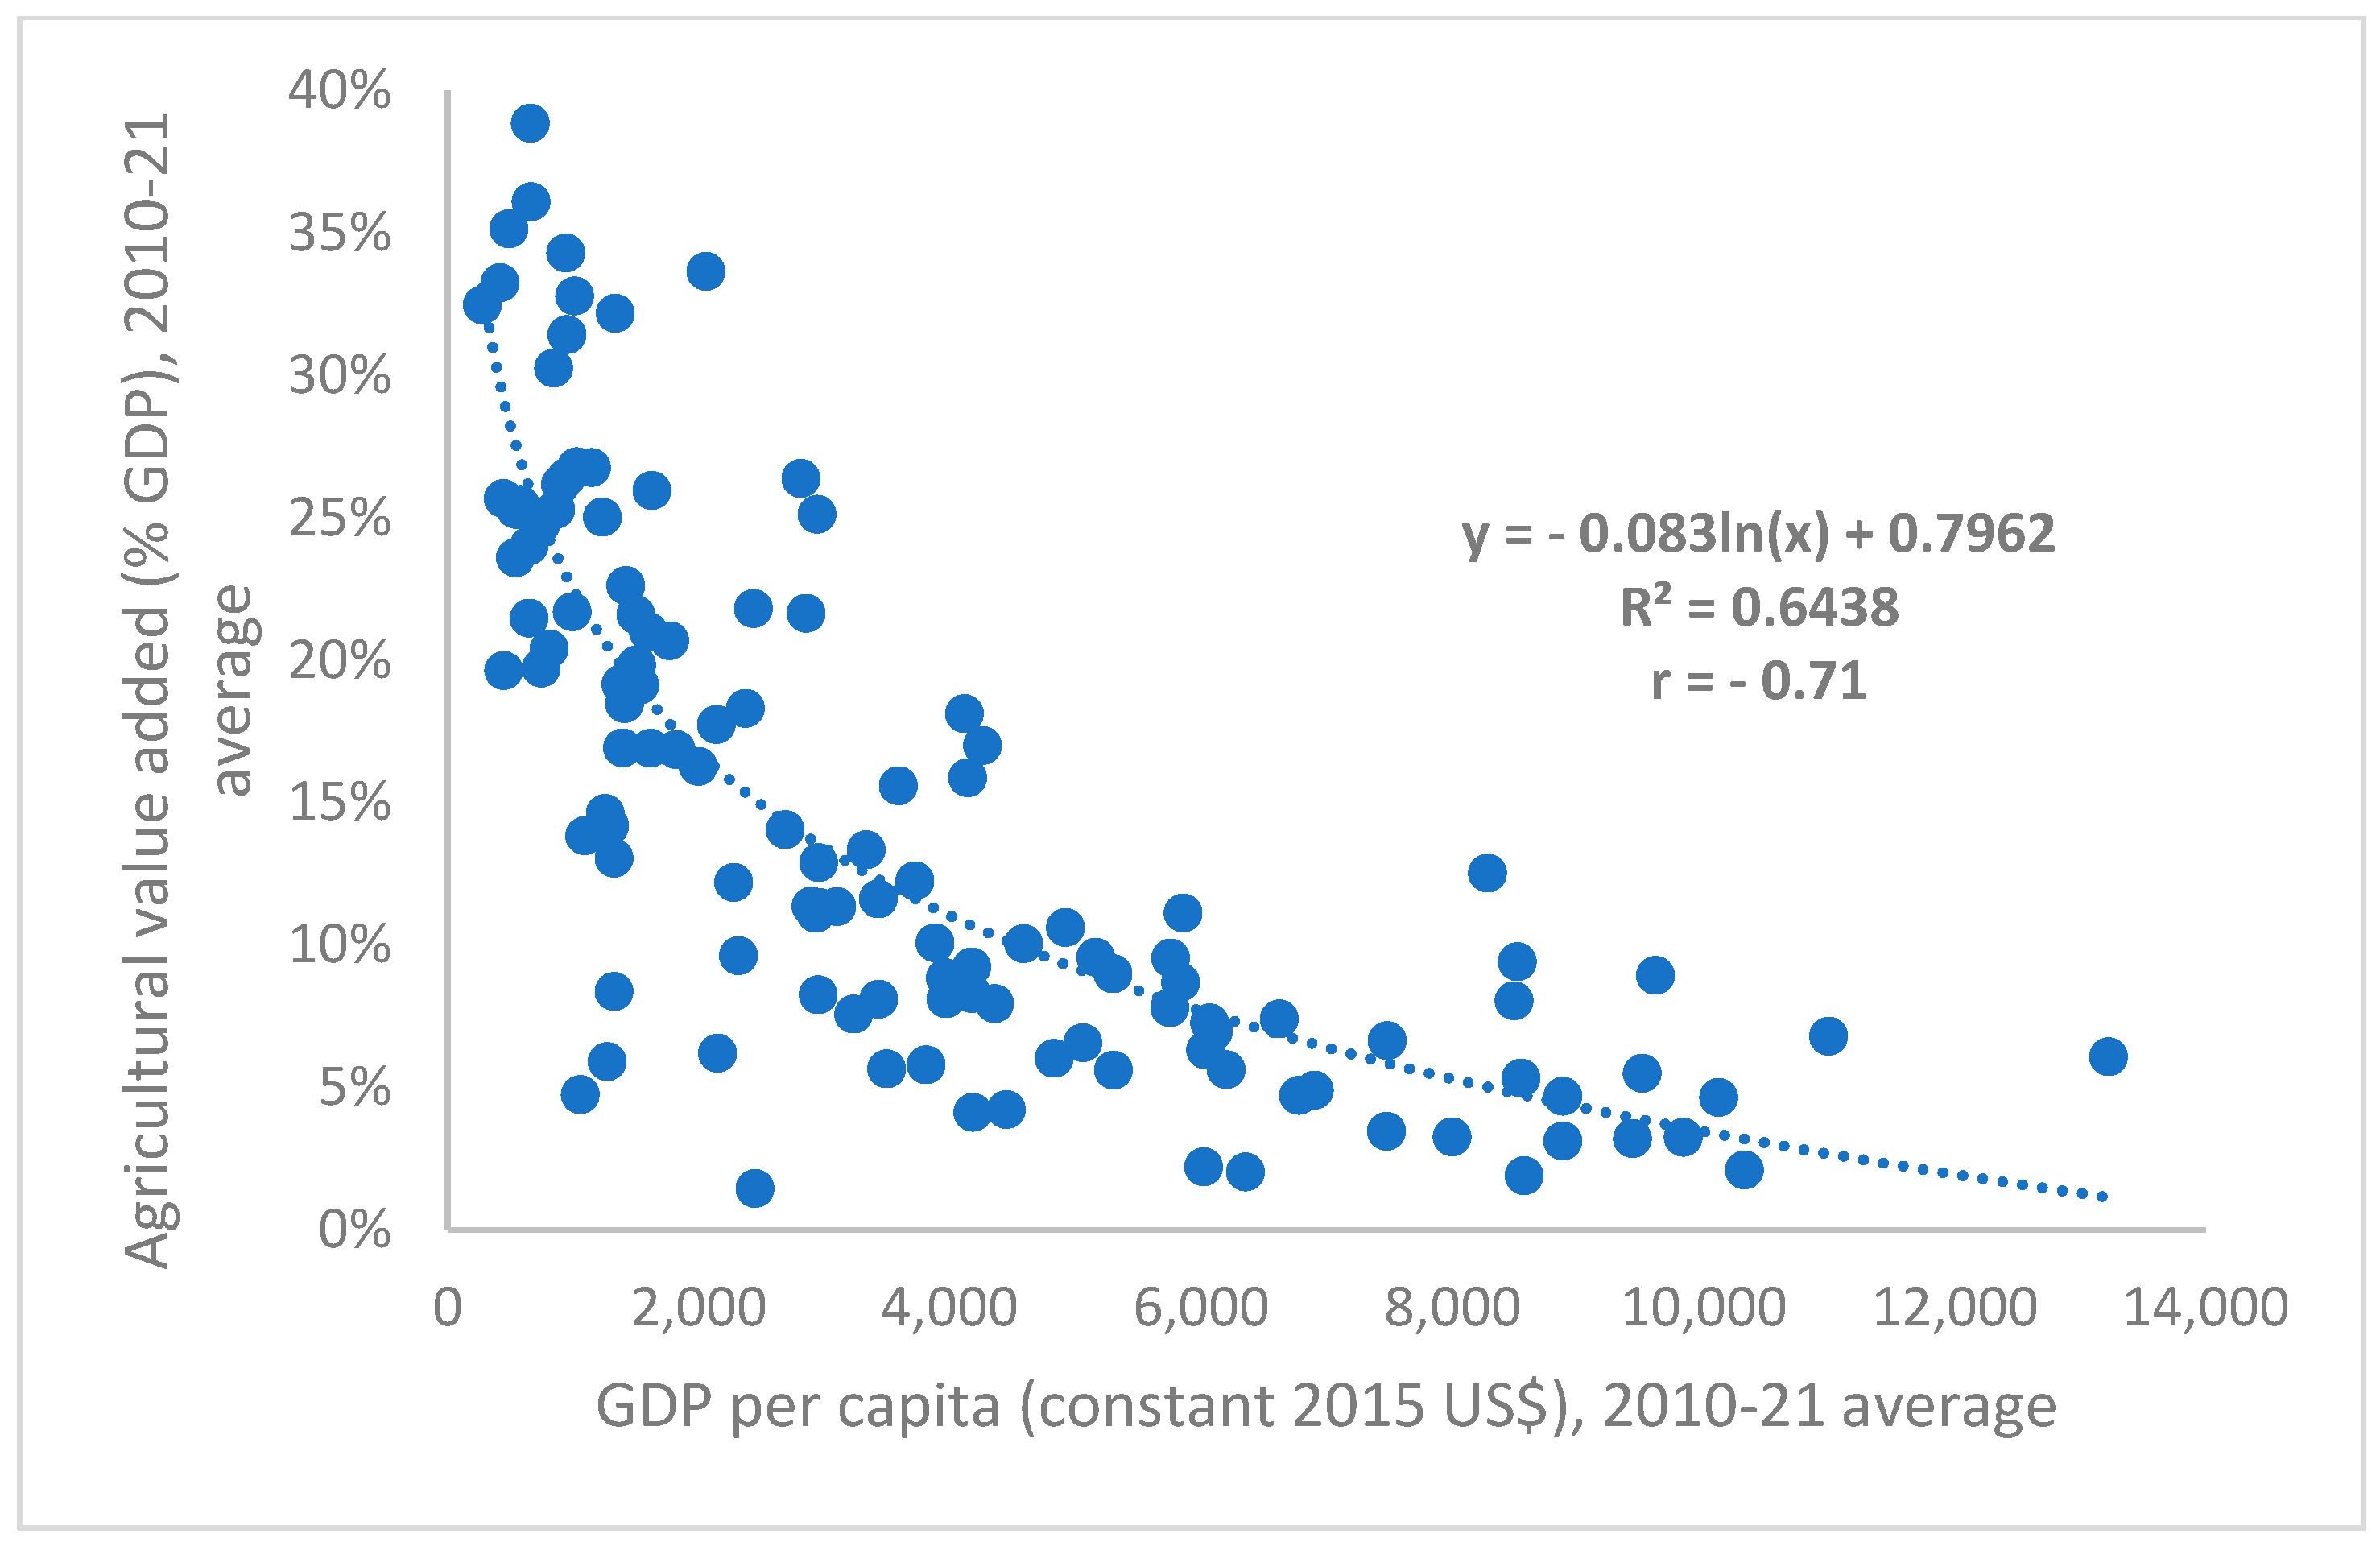
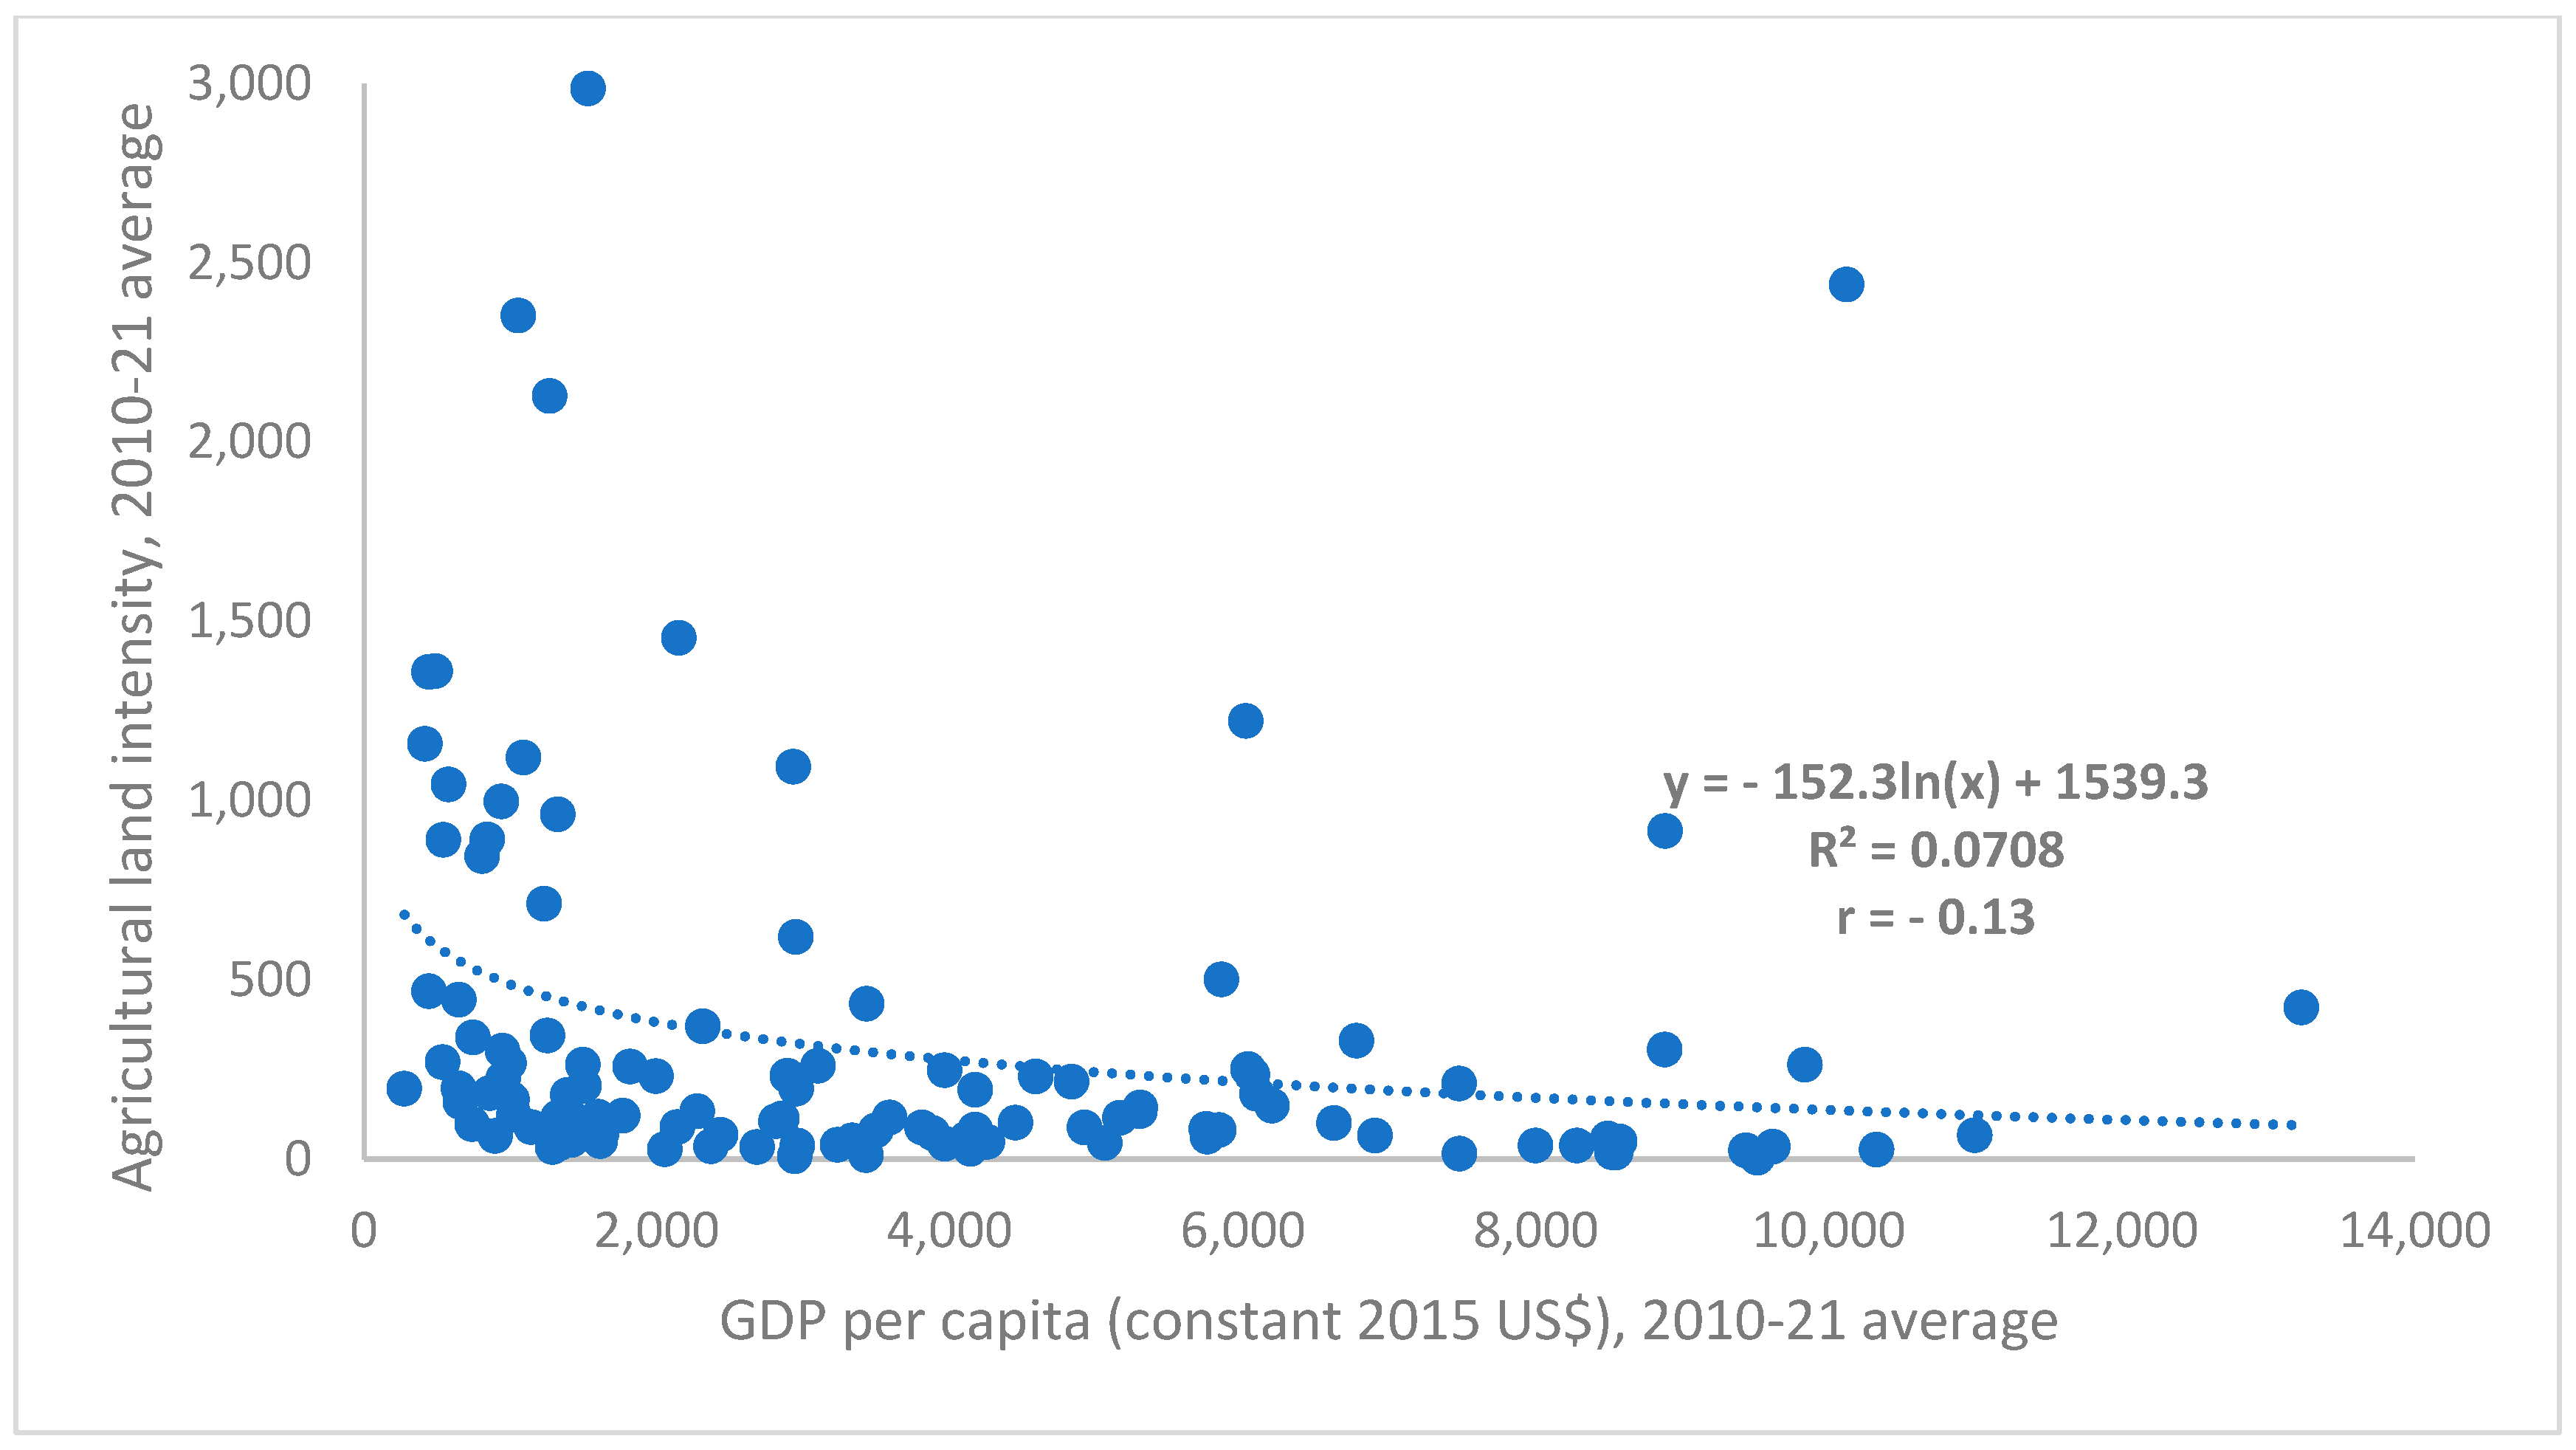
Figure 2, Figure 3 and Figure 4 display the results of the analysis of the association between agricultural land expansion, the agricultural value-added share of GDP, and agricultural land intensity, respectively, with the levels of GDP per capita for 122 developing countries from 2000 to 2021.
Figure 2 depicts the pairwise comparison of the percentage change in agricultural land use from 2000 to 2021 and GDP per capita (constant 2015 $), averaged from 2010 to 2021, for 122 LMICs. The sample of countries includes 21 low-income, 50 lower-middle-income, and 51 upper-middle-income economies. The dotted line is the regression across these observations, with the estimated bivariate equation, its goodness of fit (R2), and the corresponding Pearson correlation coefficient (r) displayed.
As the figure shows, land use expansion from 2000 to 2021 and real income per capita appear to be moderately negatively correlated (r = −0.41) across all developing countries. LMICs with a higher average GDP per capita from 2010 to 2021 tended to display lower levels of agricultural land expansion from 2000 to 2021.
Figure 3 indicates the pairwise comparison of the agriculture, forestry, and fishing value-added share (%) of GDP, averaged from 2000 to 2021, and GDP per capita (constant 2015 $), averaged from 2010 to 2021, for the 122 LMICs. This sample of countries includes 21 low-income, 50 lower-middle-income, and 51 upper-middle-income economies. The dotted line is the regression across these observations, with the estimated bivariate equation, its goodness of fit (R2), and the corresponding Pearson correlation coefficient (r) displayed.
The figure shows that the agricultural value-added share of GDP and income per capita are strongly negatively correlated (r = −0.71). Moreover, the best-fit regression is logarithmic (R2 = 64), suggesting that countries with a higher GDP per capita experience a more rapid decline in the share of output from agriculture, forestry, and fishing.
Finally, Figure 4 shows the pairwise comparison of agricultural land intensity, which is agricultural land (km2) divided by 106 agriculture, forestry, and fishing value-added (constant 2015 US$), averaged from 2000 to 2021, and GDP per capita (constant 2015 $), averaged from 2010 to 2021. The comparison is for 118 LMICs, which comprise 21 low-income, 48 lower-middle-income, and 49 upper-middle-income economies. The dotted line is the regression across these observations, with the estimated bivariate equation, its goodness of fit (R2), and the corresponding Pearson correlation coefficient (r) displayed.
As the figure indicates, there is very little correlation (r = −0.13) between the agricultural land intensity and real GDP per capita, and although the best-fit regression is displayed, its goodness of fit is low (R2 = 0.07).
To summarize the results depicted in Figure 2, Figure 3 and Figure 4, across 122 developing countries from 2010 to 2021, both the agricultural value-added share of GDP and land expansion are negatively correlated with GDP per capita. The negative association between the agricultural value-added share of GDP and income per capita is especially strong. However, there is little association between income per person and land intensity.

3.2. Trends in Key Components of the Land Identity

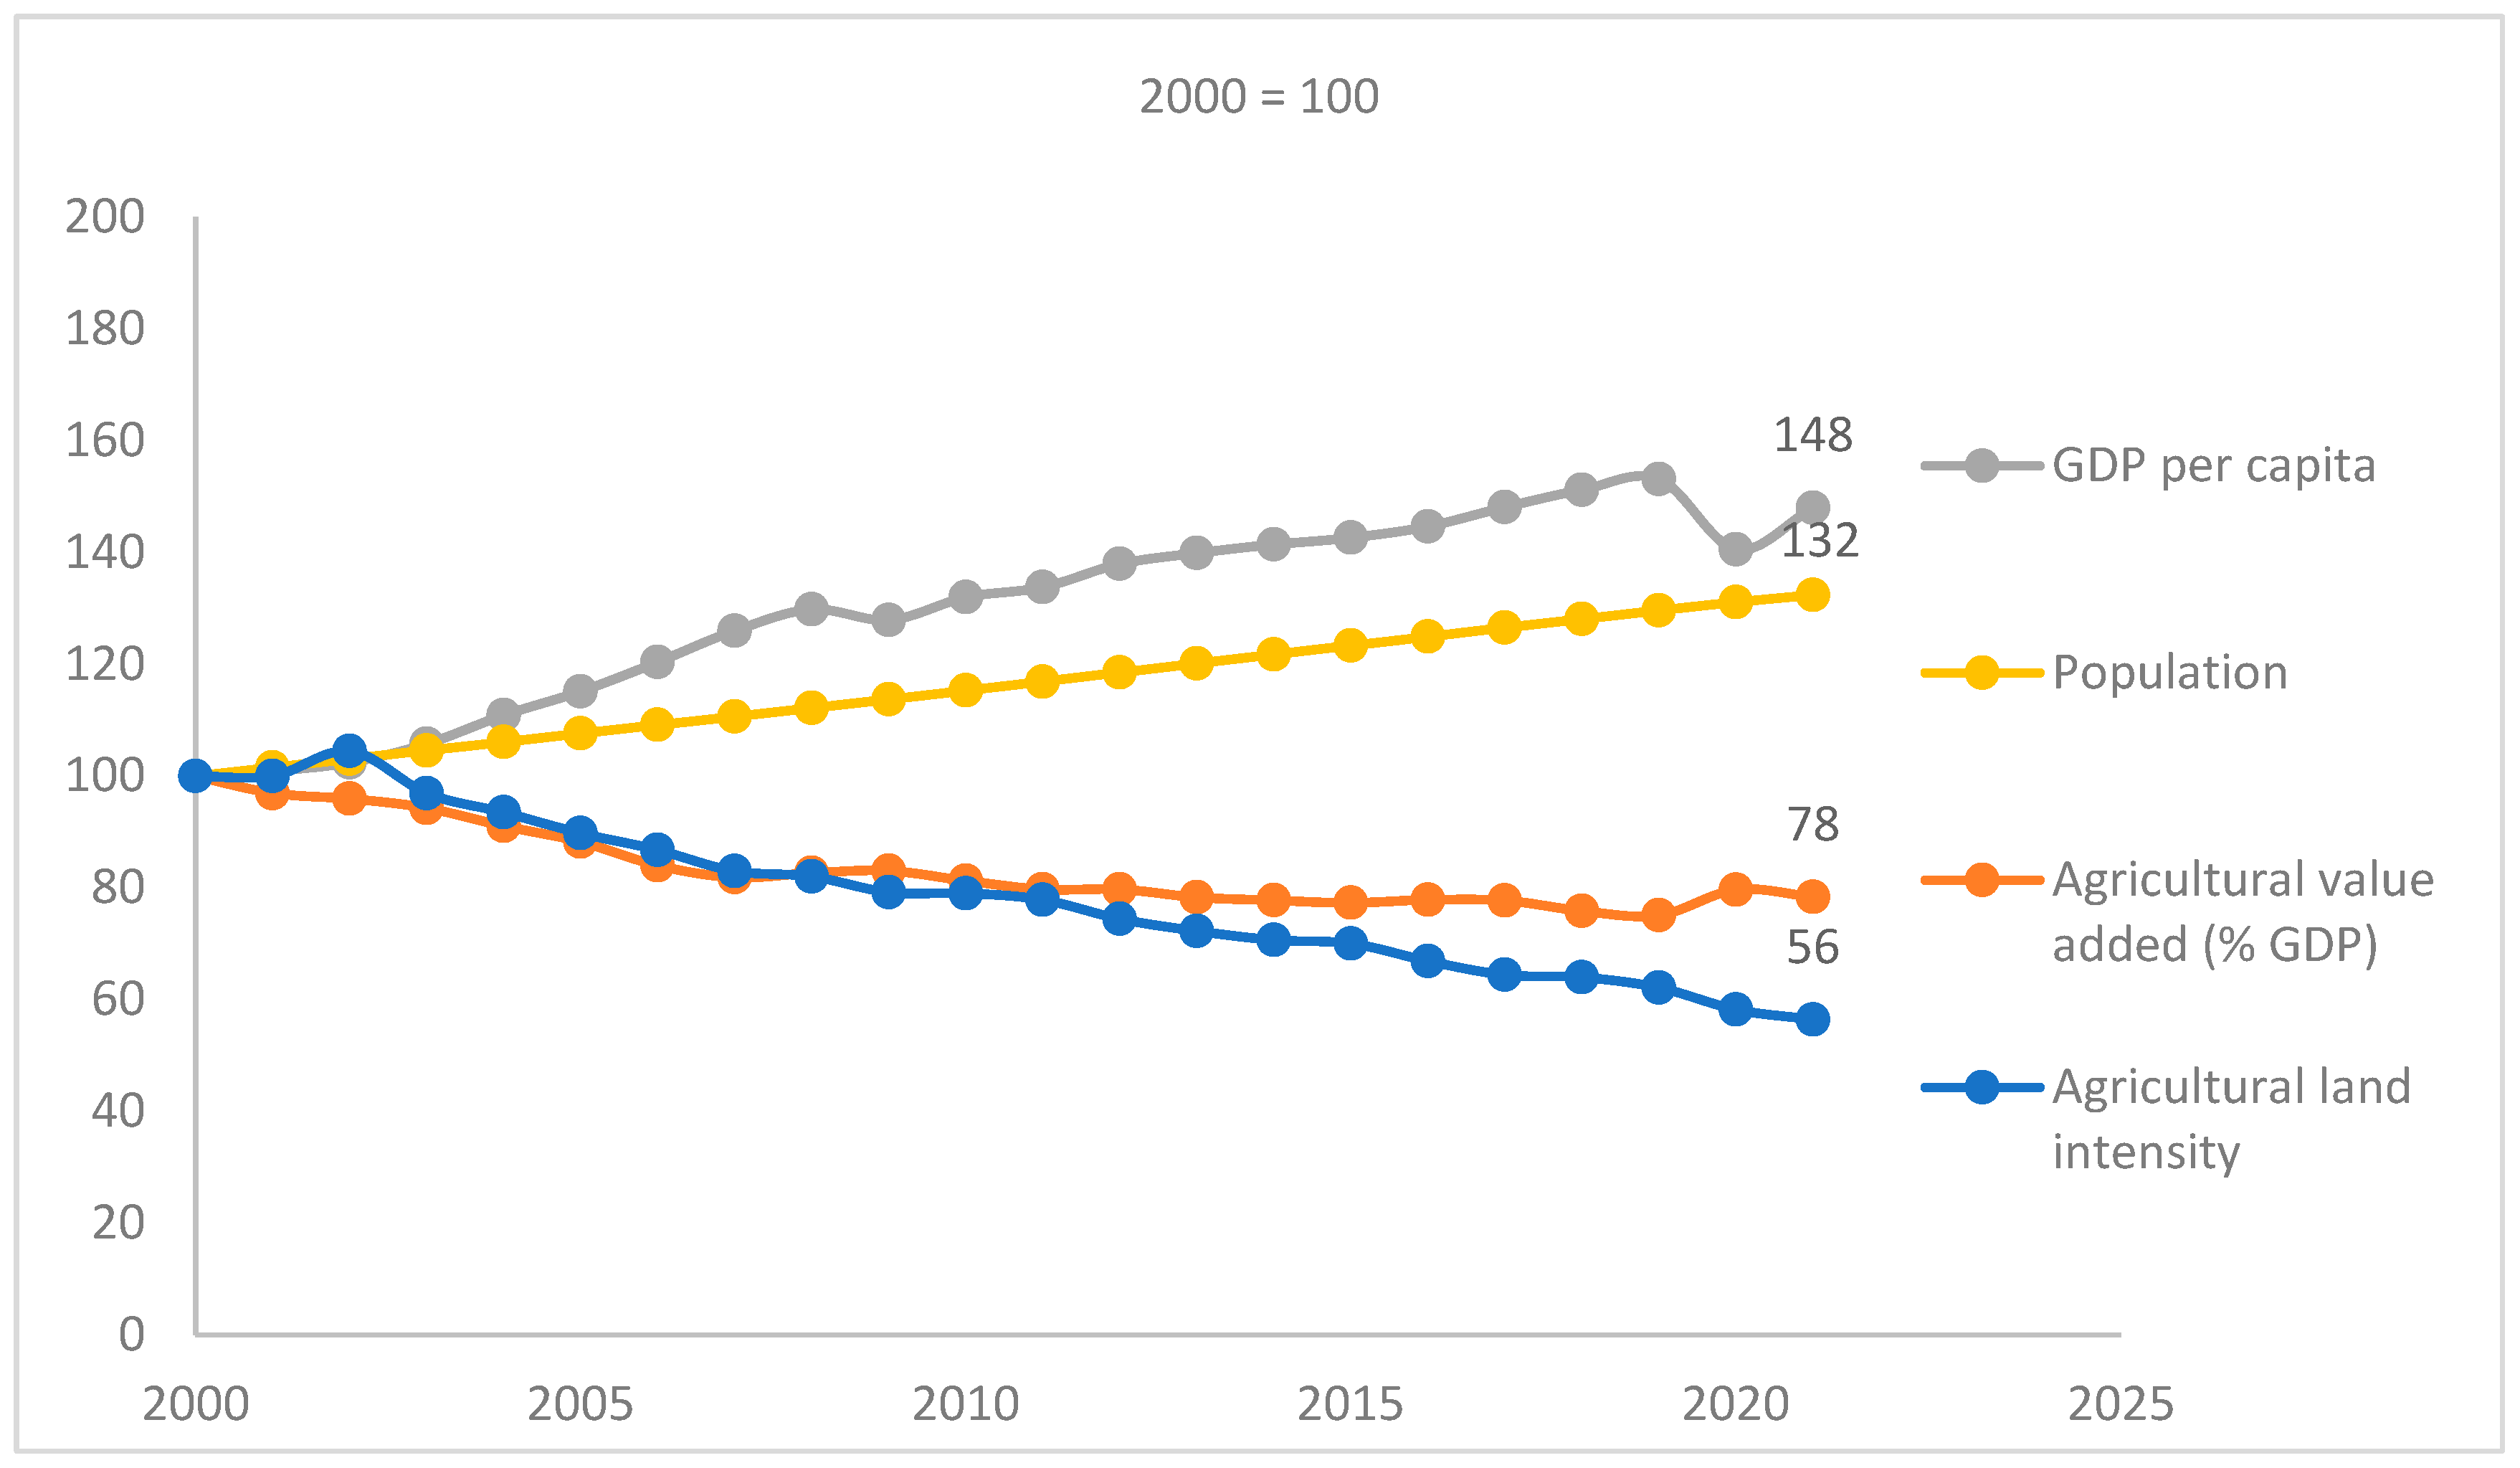
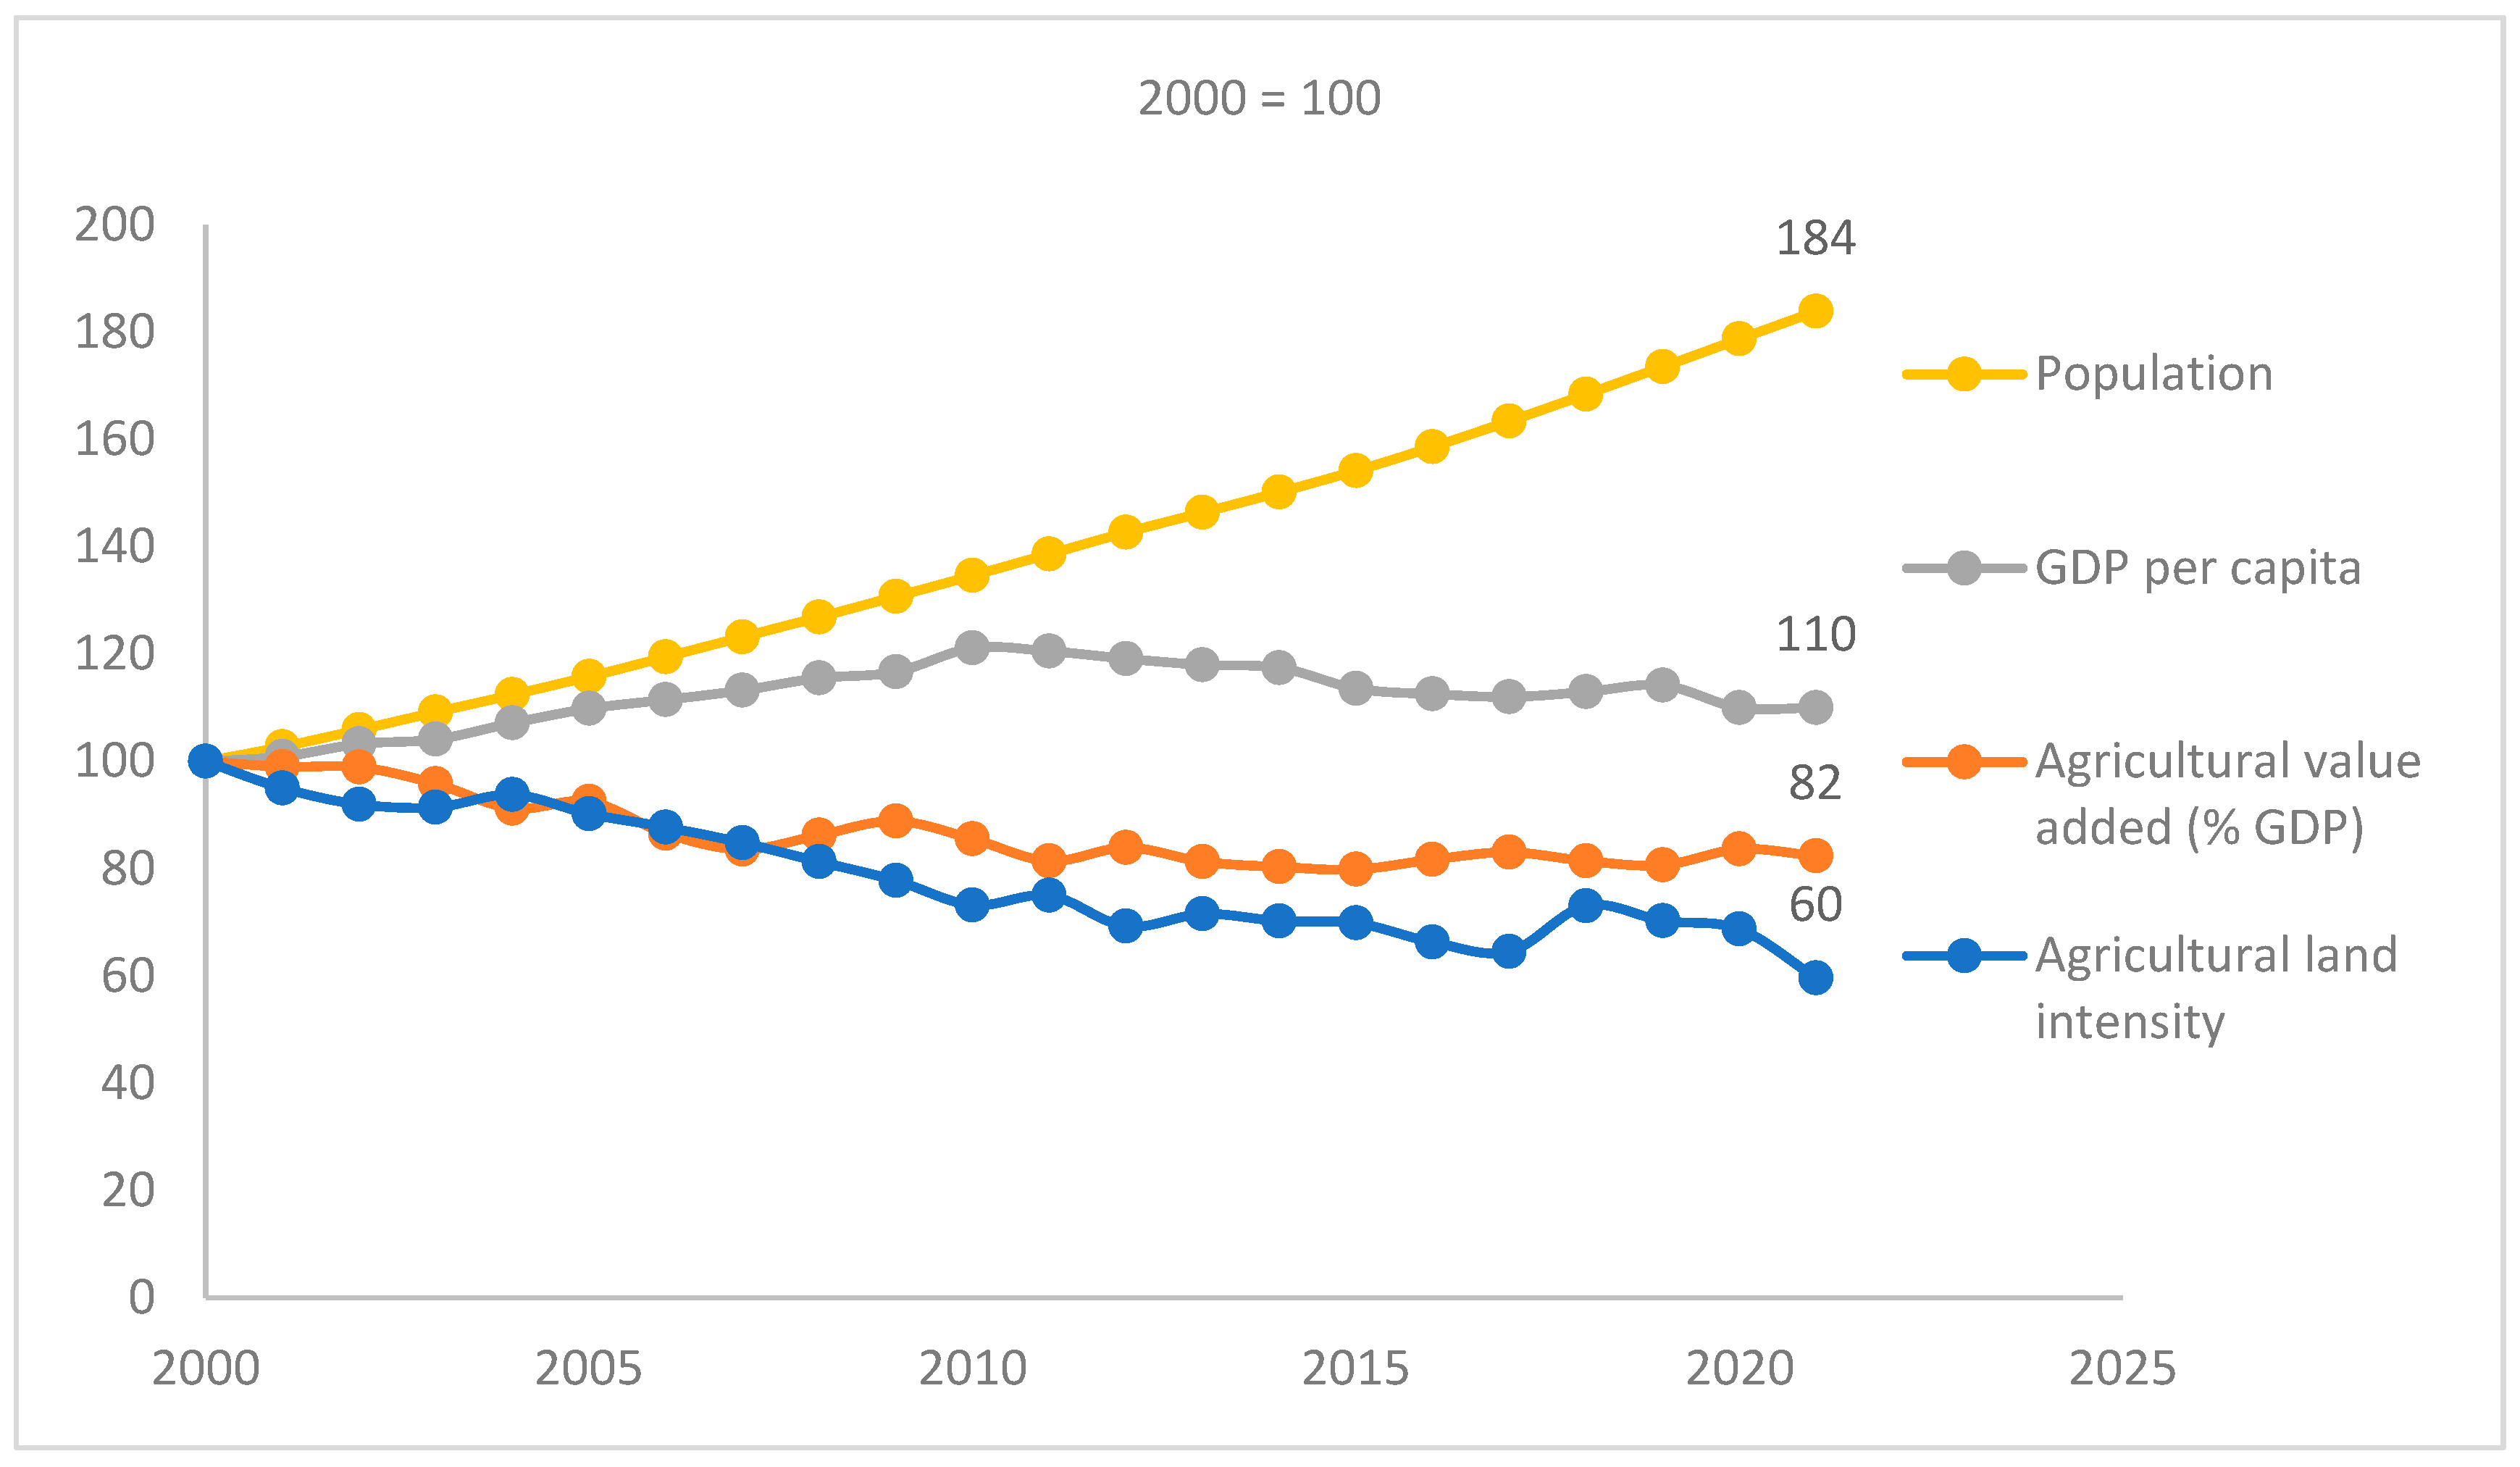
Figure 5 depicts trends from 2000 to 2021 in the four components of the land identity (2) for the 122 LMICs. From 2000 to 2021, the real GDP per capita rose by 48%, and the total population increased by 32% on average for these developing countries. These two factors were important drivers of agricultural land expansion in LMICs over this period. However, from 2000 to 2021, the agricultural value-added share of GDP fell by 22%, and agricultural land intensity decreased by 44%. These declines helped to reduce pressure for agricultural land expansion for developing countries, but they were not sufficient to offset this pressure completely. As indicated in Figure 1, from 2000 to 2021, agricultural land use in developing countries increased by 4%.
The 50 lower-middle-income and 51 upper-middle-income countries display similar trends for the land identity components, as depicted in Figure 5. However, the trends for the 21 low-income economies are somewhat different. The results are shown in Figure 6.
For low-income countries, the total population grew by 84%, but the real GDP per capita increased by only 10% from 2000 to 2021. Population pressure was therefore the main driver of agricultural land expansion in these poorer economies. Over this period, the agricultural value-added share of GDP decreased by 18%, and agricultural land intensity decreased by 40%. Because these declines were more modest, they failed to offset the upward pressure on agricultural land expansion from GDP per capita and, in particular, population growth. Consequently, agricultural land use in low-income countries increased by 15% from 2000 to 2021.
Table 1 compares the average 2000–2002 and 2019–2021 values for the four components of the land identity for low-income, lower-middle-income, and upper-middle-income economies. This comparison confirms the results from the pairwise comparison of the agricultural value-added share of GDP and agricultural land intensity to GDP per capita (see Figure 3 and Figure 4). That is, developing countries with a higher GDP per capita experienced a more rapid fall in the share of output from agriculture, forestry, and fishing, but there is little association between agricultural land intensity and income per capita. For example, from 2019 to 2021, the agricultural value-added share of GDP averaged 28% for the 21 low-income, 15.7% for the 50 lower-middle-income, and 7.8% for the 51 upper-middle-income economies. In contrast, from 2019 to 2021, agricultural land intensity did not differ significantly between these income groups. Land use per unit agricultural value added was 528 km2/106 $ for low-income, 467 km2/106 $ for lower-middle-income, and 472 km2/106 $ for low-income km2/106 $ for upper-middle-income countries.
Table 1 also indicates the percentage change from 2000–2002 to 2019–2021 in the four components of the land identity by income group. The comparison by income group confirms the trends depicted in Figure 5 and Figure 6. Both agricultural land intensity and the share of agricultural value added in GDP fell for developing countries from 2000–2002 to 2019–2021, but the declines were much greater in upper-middle-income countries (−49.8% and −22.1%, respectively) than in lower-middle-income economies (−36.6% and −21.8%) and, in particular, for low-income countries (−30.8% and −17.2%). In addition, for upper-middle-income countries, declining agricultural land intensity and agriculture’s share in GDP may have somewhat offset the pressure on agricultural land expansion from the rising GDP per capita and population growth from 2000–2002 to 2019–2021, but the more modest declines in lower-middle-income and low-income countries do not appear to have countered agricultural land expansion due to GDP per capita and population growth. Table 1 also confirms the trends shown in Figure 6, which is that the greatest pressure on agricultural land expansion in low-income countries from 2000–2002 to 2019–2021 came from population growth.
Table 2 depicts the key components of the land identity in 2000–2002 and 2019–2021, as well as the percentage changes in these components over this period, for the 122 developing countries by region. The developing countries in all six regions, on average, displayed significant declines in agricultural land intensity, and the share of agricultural value added in GDP fell for developing countries from 2000–2002 to 2019–2021. However, there were important differences across regions.
For example, the regions with the highest agricultural land intensity in 2000–2002 were Sub-Saharan Africa (1225 km2/106 $ agricultural value added) and East Asia and the Pacific (1017 km2/106 $ agricultural value added). By 2019–2021, agricultural land intensity in Sub-Saharan Africa fell by 30.8%, whereas in East Asia and the Pacific, land intensity declined by 66.4%. In 2000–2002, the regions with the highest share of agricultural value added in GDP were Sub-Saharan Africa (23.3%), South Asia (23.3%), and East Asia and the Pacific (22.1%). By 2019–2021, agriculture’s share of GDP had declined by 29.4% in South Asia and 26.6% in East Asia and the Pacific, but by only 17.7% in Sub-Saharan Africa.
In all six regions, except, possibly, for East Asia and the Pacific, the declines in agricultural land intensity and agriculture’s share of GDP from 2000–2002 to 2019–2021 were unlikely to offset the upward pressure on agricultural land expansion from GDP per capita and population growth over this period. In Europe and Central Asia, South Asia, and East Asia and the Pacific, the main driver for land expansion appears to have been economic growth, whereas for Sub-Saharan Africa and for the Middle East and North Africa, the main driver was population growth. In particular, in Sub-Saharan Africa and South Asia, declining agricultural land intensity and agriculture’s share in GDP from 2000–2002 to 2019–2021 may have been insufficient to offset the upward pressure on agricultural land expansion from GDP per capita and population growth.

4. Discussion

The results of the pairwise comparison analysis indicate that, across 122 developing countries from 2010 to 2021, both the agricultural value-added share of GDP and land expansion are negatively correlated with GDP per capita. However, there is little association between income per person and agricultural land intensity, which is agricultural land (km2) divided by 106 agriculture, forestry, and fishing value-added (constant 2015 US$).
The analysis of the key components of the land identity reveals that, across all 122 LMICs, the upward pressure on agricultural land expansion from GDP per capita and population growth from 2000 to 2021 was somewhat offset by the decline in the agricultural value-added share of GDP and agricultural land intensity of production. A similar trend was observed for all six developing country regions.
However, the more modest declines in land intensity and agriculture’s share of GDP in lower-middle-income and low-income countries and in Sub-Saharan Africa and South Asia may have been insufficient to offset the upward pressure on agricultural land expansion due to GDP per capita and population growth. For example, in low-income countries and Sub-Saharan Africa, the principal driver of agricultural land expansion was population growth, and the offsetting declines in the agricultural value-added share and land intensity were relatively low. Consequently, from 2000 to 2021, agricultural land use increased by 15% in poorer countries and by 10% in Sub-Saharan Africa. Perhaps the more concerning outcome is that, on average, from 2019 to 2021, the land intensity of agricultural production was still high across all income groups, and there was not much significant difference between rich and poor countries. In 2019–2021, land use per unit of agricultural value added was 528 km2/106 $ for low-income, 467 km2/106 $ for lower-middle-income, and 472 km2/106 $ for upper-middle-income countries.

4.1. Policy Implications

The main policy implication of these results is that decoupling land use expansion from economic growth in developing countries will require substantial reductions in land intensity and in the overall agricultural dependency of an economy. As agriculture will continue to be vital for development and poverty alleviation goals, especially among the poorest countries, policies to raise agricultural land productivity and limit unnecessary agricultural land expansion are important for green rural transformation.
One concern is the growing proliferation of environmentally harmful agricultural subsidies among LMICs, especially those that encourage excessive land expansion [13,14,21,22,23]. For example, market price support and payments based on commodity output produced or variable inputs used, which often encourage farming practices and production to increase land use, have increased from $13 billion per year in 2000–2002 to over $130 billion annually in 2020–2022 for 11 major LMICs, which are Argentina, Brazil, China, India, Indonesia, Kazakhstan, the Philippines, Russian Federation, South Africa, Ukraine, and Vietnam [21]. Across all developing countries, agricultural subsidies are responsible for the loss of 2.2 million hectares of forest per year—or 14% of global deforestation [13].
Removing or lowering such subsidies would improve the efficiency of agricultural production on existing land, boost the competitiveness of smaller producers and poor economies, reduce land use expansion, and protect natural habitats and biodiversity [3,13,22,23]. The financial savings from subsidy reduction could also be repurposed to provide greater support for agricultural R&D that focuses on adopting new technologies and climate-smart methods that could boost productivity on existing agricultural land, protect production from climate-related risks, and reduce the overall land intensity of agriculture in developing countries [3,13,22,23,24,25,26]. Globally, investments to support climate-smart agriculture and food security goals of developing countries will require additional agricultural R&D investments of $6.5 billion per year and an additional hundreds of billions of dollars per year for complementary extension services and infrastructure investment [25]. Although such additional funding seems high, it is substantially less than the $635 billion to $1 trillion per year allocated to global agricultural subsidies [23], which are mainly employed by developing countries and often spur excessive agricultural land use [13].
Overall, the results of this study support calls to broaden the “agricultural productivity-led model” of rural development [27]. Raising the productivity of agricultural land is still an essential goal, but so is the need to control agricultural land expansion, improve agriculture’s resilience to climate risks, reduce inequality and poverty, and expand the rural non-farm economy [3,4,5,6,7,8,27,28,29,30,31,32]. However, any agricultural policy reforms should be tailored to the specific development needs and objectives of different countries [3].
For example, the green rural transformation literature suggests that the policy and investment priorities should differ across the major developing regions [7,29,30,31]. In Sub-Saharan Africa, because agriculture has suffered from chronic underinvestment, the growth of agricultural production has largely occurred through the expansion of cultivated areas, rather than the increase in yields [29]. Consequently, the priority should be an increase in irrigation, the adoption of climate-resilient farming systems, index insurance, credit, the non-farm rural economy, and other targeted investments in local rural economies that can boost returns by reducing the agricultural land intensity and expansion [29]. In Latin America and the Caribbean, unsustainable rural development has been driven mainly by exports of primary products from large-scale commercial agricultural production, whereas more priority must be given to investing in smallholder farming systems, improving the ecological restoration of degraded forests, and reducing tropical forest conversion [7,30]. Controlling agricultural land expansion in tropical developing countries in Asia and the Pacific is also important, along with improving the livelihoods of poor rural populations that are in highly vulnerable locations of the region, such as small-island states, landlocked mountainous regions, and less-favored agricultural areas [31,32].

4.2. Limitations

Although a novel contribution of this study is to examine how the growth of GDP per capita, population, the agricultural value-added share of GDP, and agricultural land intensity impact agricultural land expansion in developing countries, additional analysis is needed to examine the principal drivers of these factors, especially land intensity. For example, examinations of the “carbon” Kaya identity have explored, in detail, the major influences on the long-run carbon intensity (kgCO2/$1000 GDP) of economies [19]. Similarly, in a “water” Kaya identity, the key component is water use efficiency, which is usually measured by $GDP per cubic meter (m3) of freshwater withdrawals [20]. A panel analysis of changes in water use efficiency for 46 high-income and 84 low- and middle-income countries from 1995 to 2020 indicates that growth in water use efficiency is associated with lower initial levels of water use efficiency, better institutional quality and capacity for innovation, and less agricultural dependence in economies [33].
In addition, this study conducts only a bivariate comparison of agricultural land expansion, the agricultural value-added share of GDP, and agricultural land intensity with levels of GDP per capita across developing countries. A more in-depth analysis of the factors driving agricultural land expansion should incorporate other potential drivers and include both temporal and spatial analyses [12,15,16,17]. The analysis of cropland expansion incorporating spatial effects indicates that low-income countries have lower increases in yields but substantially expanded cropland area over time, whereas tropical middle-income countries (e.g., Brazil, Indonesia, Thailand, Colombia, and Malaysia) have both the highest crop yield increases and cropland expansion rates [17]. Overall, for low- and middle-income countries, high-profit commercial crops, such as soybean, oil palm, and sugar cane, have caused more than half of the global deforestation from cropland expansion from 1960 to 2020 [17].
Finally, this study focuses on analyzing the factors associated with agricultural land expansion at the country level. As better spatially referenced datasets become available, future studies should examine land use change within countries [12]. Such a sub-national analysis is important as agricultural land expansion is becoming increasingly concentrated in the land-abundant “frontiers” of developing countries, which contain large areas of forests and natural habitats [34,35].

5. Conclusions

By applying a “land” Kaya identity, this article has demonstrated how growth in agricultural land use for a country can be at least partially attributed to four factors: the growth in income (GDP) per capita, population, the agricultural value-added share of GDP, and the land intensity of agricultural value added. A novel contribution of this analysis is to show that decoupling land use expansion from economic growth will require substantial reductions in land intensity and in the overall agricultural dependency of an economy. From 2000 to 2021, the agricultural value-added share of GDP and land intensity declined in 122 developing countries, but not sufficiently to offset the pressure on agricultural land expansion from the growth of GDP per capita and population. Such findings are important to successful green rural transformation, given that global land use change is four times greater than previously estimated [16].
The relationship between land use expansion, agricultural dependency, and the land intensity of agricultural production in developing countries is a critical area for future research to support green rural transformation. Research on this relationship should include spatial and temporal effects and focus on key agricultural regions within developing countries where the control of land use expansion and loss of important natural habitats and biodiversity are especially prevalent [12,15,16,17]. This might involve a more sub-national analysis that focuses on the various drivers of such expansion in the remaining land-abundant frontiers of developing countries [34,35]. More research is also needed to determine the extent to which the repurposing of subsidies that encourage land expansion to support land-saving and more sustainable agricultural R&D and investments is feasible for such regions.

Funding

This research received no external funding.

Institutional Review Board Statement

Not applicable.

Informed Consent Statement

Not applicable.

Data Availability Statement

The original data presented in this study are openly available from the website sources indicated in this paper.

Conflicts of Interest

The author declares no conflict of interest.

References

  1. Berdegué, J.; Rosada, T.; Bebbington, A. The rural transformation. In International Development Ideas, Experience and Prospects; Currie-Alder, B., Kanbur, R., Malone, D., Medhora, R.R., Eds.; Oxford University Press: Oxford, UK; New York, NY, USA, 2014; pp. 463–478. [Google Scholar]
  2. Barbier, E.B. Is green rural transformation possible in developing countries? World Dev. 2020, 131, 104955. [Google Scholar] [CrossRef]
  3. Barbier, E.B. Greening agriculture for rural development. World Dev. 2025, 191, 106974. [Google Scholar] [CrossRef]
  4. Barrett, C.B.; Ortiz-Bobea, A.; Pham, T. Structural transformation, agriculture, climate, and the environment. Rev. Environ. Econ. Policy 2023, 17, 195–216. [Google Scholar] [CrossRef]
  5. Mallawaarachchi, T.; Rahut, D.B. Realising rural economic transformation: Pathways to inclusive and sustainable prosperity in post-COVID-19 Asia. Econ. Anal. Policy 2023, 77, 1076–1082. [Google Scholar] [CrossRef] [PubMed]
  6. Rahman, A.; Rosandi, V.B.; Indraprahasta, G.S.; Prasetyadi, A.; Saputra, A.Y.; Pravitasari, A.E. Rural transformation research: Current state, dynamics, and future directions. Area 2025, e70049. [Google Scholar] [CrossRef]
  7. Silva, J.M.C.; Araujo, L.S.; Torres, R.R.; Barbosa, L.C.F. The sustainability of development pathways and climate change vulnerability in the Americas. Ecol. Econ. 2024, 220, 108164. [Google Scholar] [CrossRef]
  8. International Labor Organization (ILO). Sectoral Policies for a Just Transition; Just Transition Policy Brief; ILO: Geneva, Switzerland, 2022. [Google Scholar]
  9. Christiaensen, L.; Martin, W. Agriculture, structural transformation and poverty reduction: Eight new insights. World Dev. 2018, 109, 413–416. [Google Scholar] [CrossRef]
  10. Ligon, E.; Sadoulet, E. Estimating the relative benefits of agricultural growth on the distribution of expenditures. World Dev. 2018, 109, 417–428. [Google Scholar] [CrossRef]
  11. Organization for Economic Cooperation and Development (OECD); Food and Agricultural Organization (FAO). OECD-FAO Agricultural Outlook 2024–2033; OECD: Paris, France, 2024. [Google Scholar] [CrossRef]
  12. Busch, J.; Ferretti-Gallon, K. What drives and stops deforestation, reforestation, and forest degradation? An updated meta-analysis. Rev. Environ. Econ. Policy 2023, 17, 217–250. [Google Scholar] [CrossRef]
  13. Damania, R.; Balseca, E.; De Fontaubert, C.; Gill, J.; Rentschler, J.; Russ, J.; Zaveri, E. Detox Development: Repurposing Environmentally Harmful Subsidies; World Bank: Washington, DC, USA, 2023. [Google Scholar]
  14. Gallardo, R.K. The environmental impacts of agriculture: A review. Int. Rev. Environ. Resour. Econ. 2024, 18, 165–235. [Google Scholar] [CrossRef]
  15. Pendrill, F.; Gardner, T.A.; Meyfroidt, P.; Persson, U.M.; Adams, J.; Azevedo, T.; Bastos Lima, M.G.; Baumann, M.; Curtis, P.G.; De Sy, V.; et al. Disentangling the numbers behind agriculture-driven tropical deforestation. Science 2022, 377, eabm9267. [Google Scholar] [CrossRef] [PubMed]
  16. Winkler, K.; Fuchs, R.; Rounsevell, M.; Herold, M. Global land use changes are four times greater than previously estimated. Nat. Commun. 2021, 12, 2501. [Google Scholar] [CrossRef] [PubMed]
  17. Winkler, K.; Fuchs, R.; Rounsevell, M.; Herold, M. Six decades of global crop yield increase and cropland expansion from 1960 to 2020. Environ. Res. Commun. 2025, 7, 055013. [Google Scholar] [CrossRef]
  18. Kaya, Y. The role of CO2 removal and disposal. Energy Convers. Manag. 1995, 36, 375–380. [Google Scholar] [CrossRef]
  19. Fankhauser, S.; Jotzo, F. Economic growth and development with low-carbon energy. Wiley Interdiscip. Rev. Clim. Change 2018, 9, e495. [Google Scholar] [CrossRef]
  20. Barbier, E.B. Water and economic growth in developed and developing countries. Water Econ. Policy 2024, 10, 2430002. [Google Scholar] [CrossRef]
  21. Organization for Economic Cooperation and Development (OECD). Agricultural Policy Monitoring and Evaluation 2023: Adapting Agriculture to Climate Change Mitigation; OECD: Paris, France, 2023; Available online: https://www.oecd-ilibrary.org/agriculture-and-food/agricultural-policy-monitoring-and-evaluation-2023_b14de474-en (accessed on 23 October 2025).
  22. Food and Agricultural Organization (FAO). The State of Food and Agriculture 2023—Revealing the True Cost of Food to Transform Agrifood Systems; FAO: Rome, Italy, 2023. [Google Scholar] [CrossRef]
  23. Gautam, M.; Laborde, D.; Mamun, A.; Martin, W.; Piñeiro, V.; Vos, R. Repurposing Agricultural Policies and Support: Options to Transform Agriculture and Food Systems to Better Serve the Health of People, Economies, and the Planet; World Bank and IFPRI: Washington, DC, USA, 2022. [Google Scholar]
  24. Laborde, D.; Mamun, A.; Martin, W.; Piñeiro, V.; Vos, R. Agricultural subsidies and global greenhouse gas emissions. Nat. Commun. 2021, 12, 2601. [Google Scholar] [CrossRef]
  25. Rosegrant, M.W.; Sulser, T.B.; Wiebe, K. Global investment gap in agricultural research and innovation to meet Sustainable Development Goals for hunger and Paris Agreement climate change mitigation. Front. Sustain. Food Syst. 2022, 6, 965767. [Google Scholar] [CrossRef]
  26. Belton, B.; Baldiga, L.; Justice, S.; Minten, B.; Narayanan, S.; Reardon, T. Can the global drone revolution make agriculture more sustainable? Science 2025, 389, 972–976. [Google Scholar] [CrossRef]
  27. Davis, B.; de la O Campos, A.P.; Farrae, M.; Winters, P. Whither the agricultural productivity-led model? Reconsidering resilient and inclusive rural transformation in the context of agrifood systems. Glob. Food Secur. 2024, 43, 100812. [Google Scholar] [CrossRef]
  28. Dong, W.; Chunlai, C. A review of rural transformation studies: Definition, measurement, and indicators. J. Integr. Agric. 2023, 22, 3568–3581. [Google Scholar] [CrossRef]
  29. De Janvry, A.; Sadoulet, E. Seven Propositions to Support and Finance the Agricultural Sector in Sub-Saharan Africa in the Context of Climate Change. In FERDI Working Paper; Fondation pour les Études et Recherches sur le Développement International: Clermont-Ferrand, France, 2023; Available online: https://hal.science/hal-04123941v1 (accessed on 11 November 2025).
  30. Beduschi, L.C.; Faret, P.; Hadad, M.I. Inclusive rural transformations in Latin America—Reassessing and planning under pressures and constraints. In FAO Inclusive Agrifood Systems Working Papers; No. 2; FAO: Rome, Italy, 2025. [Google Scholar] [CrossRef]
  31. Barbier, E.B. The policy challenges of green rural transformation for Asia-Pacific emerging and developing economies in a post-COVID world. Econ. Anal. Policy 2020, 75, 689–704. [Google Scholar] [CrossRef]
  32. Azhgaliiyeva, D.; Rahut, D.B.; Sonobe, T. (Eds.) Strategies for Climate Resilience and Equity in Developing Asia and the Pacific; Asian Development Bank Institute: Tokyo, Japan, 2025. [Google Scholar] [CrossRef]
  33. Barbier, E.B.; Burgess, J.C. Economics of water scarcity and efficiency. Sustainability 2024, 16, 8550. [Google Scholar] [CrossRef]
  34. Meyfroidt, P.; Abeygunawardane, D.; Baumann, M.; Bey, A.; Buchadas, A.; Chiarella, C.; Junquera, V.; García, A.K.; Kuemmerle, T.; le Polain de Waroux, Y.; et al. Explaining the emergence of land-use frontiers. R. Soc. Open Sci. 2024, 11, 240295. [Google Scholar] [CrossRef] [PubMed]
  35. Barbier, E.B. Scarcity, frontiers and development. Geogr. J. 2012, 178, 110–122. [Google Scholar] [CrossRef]
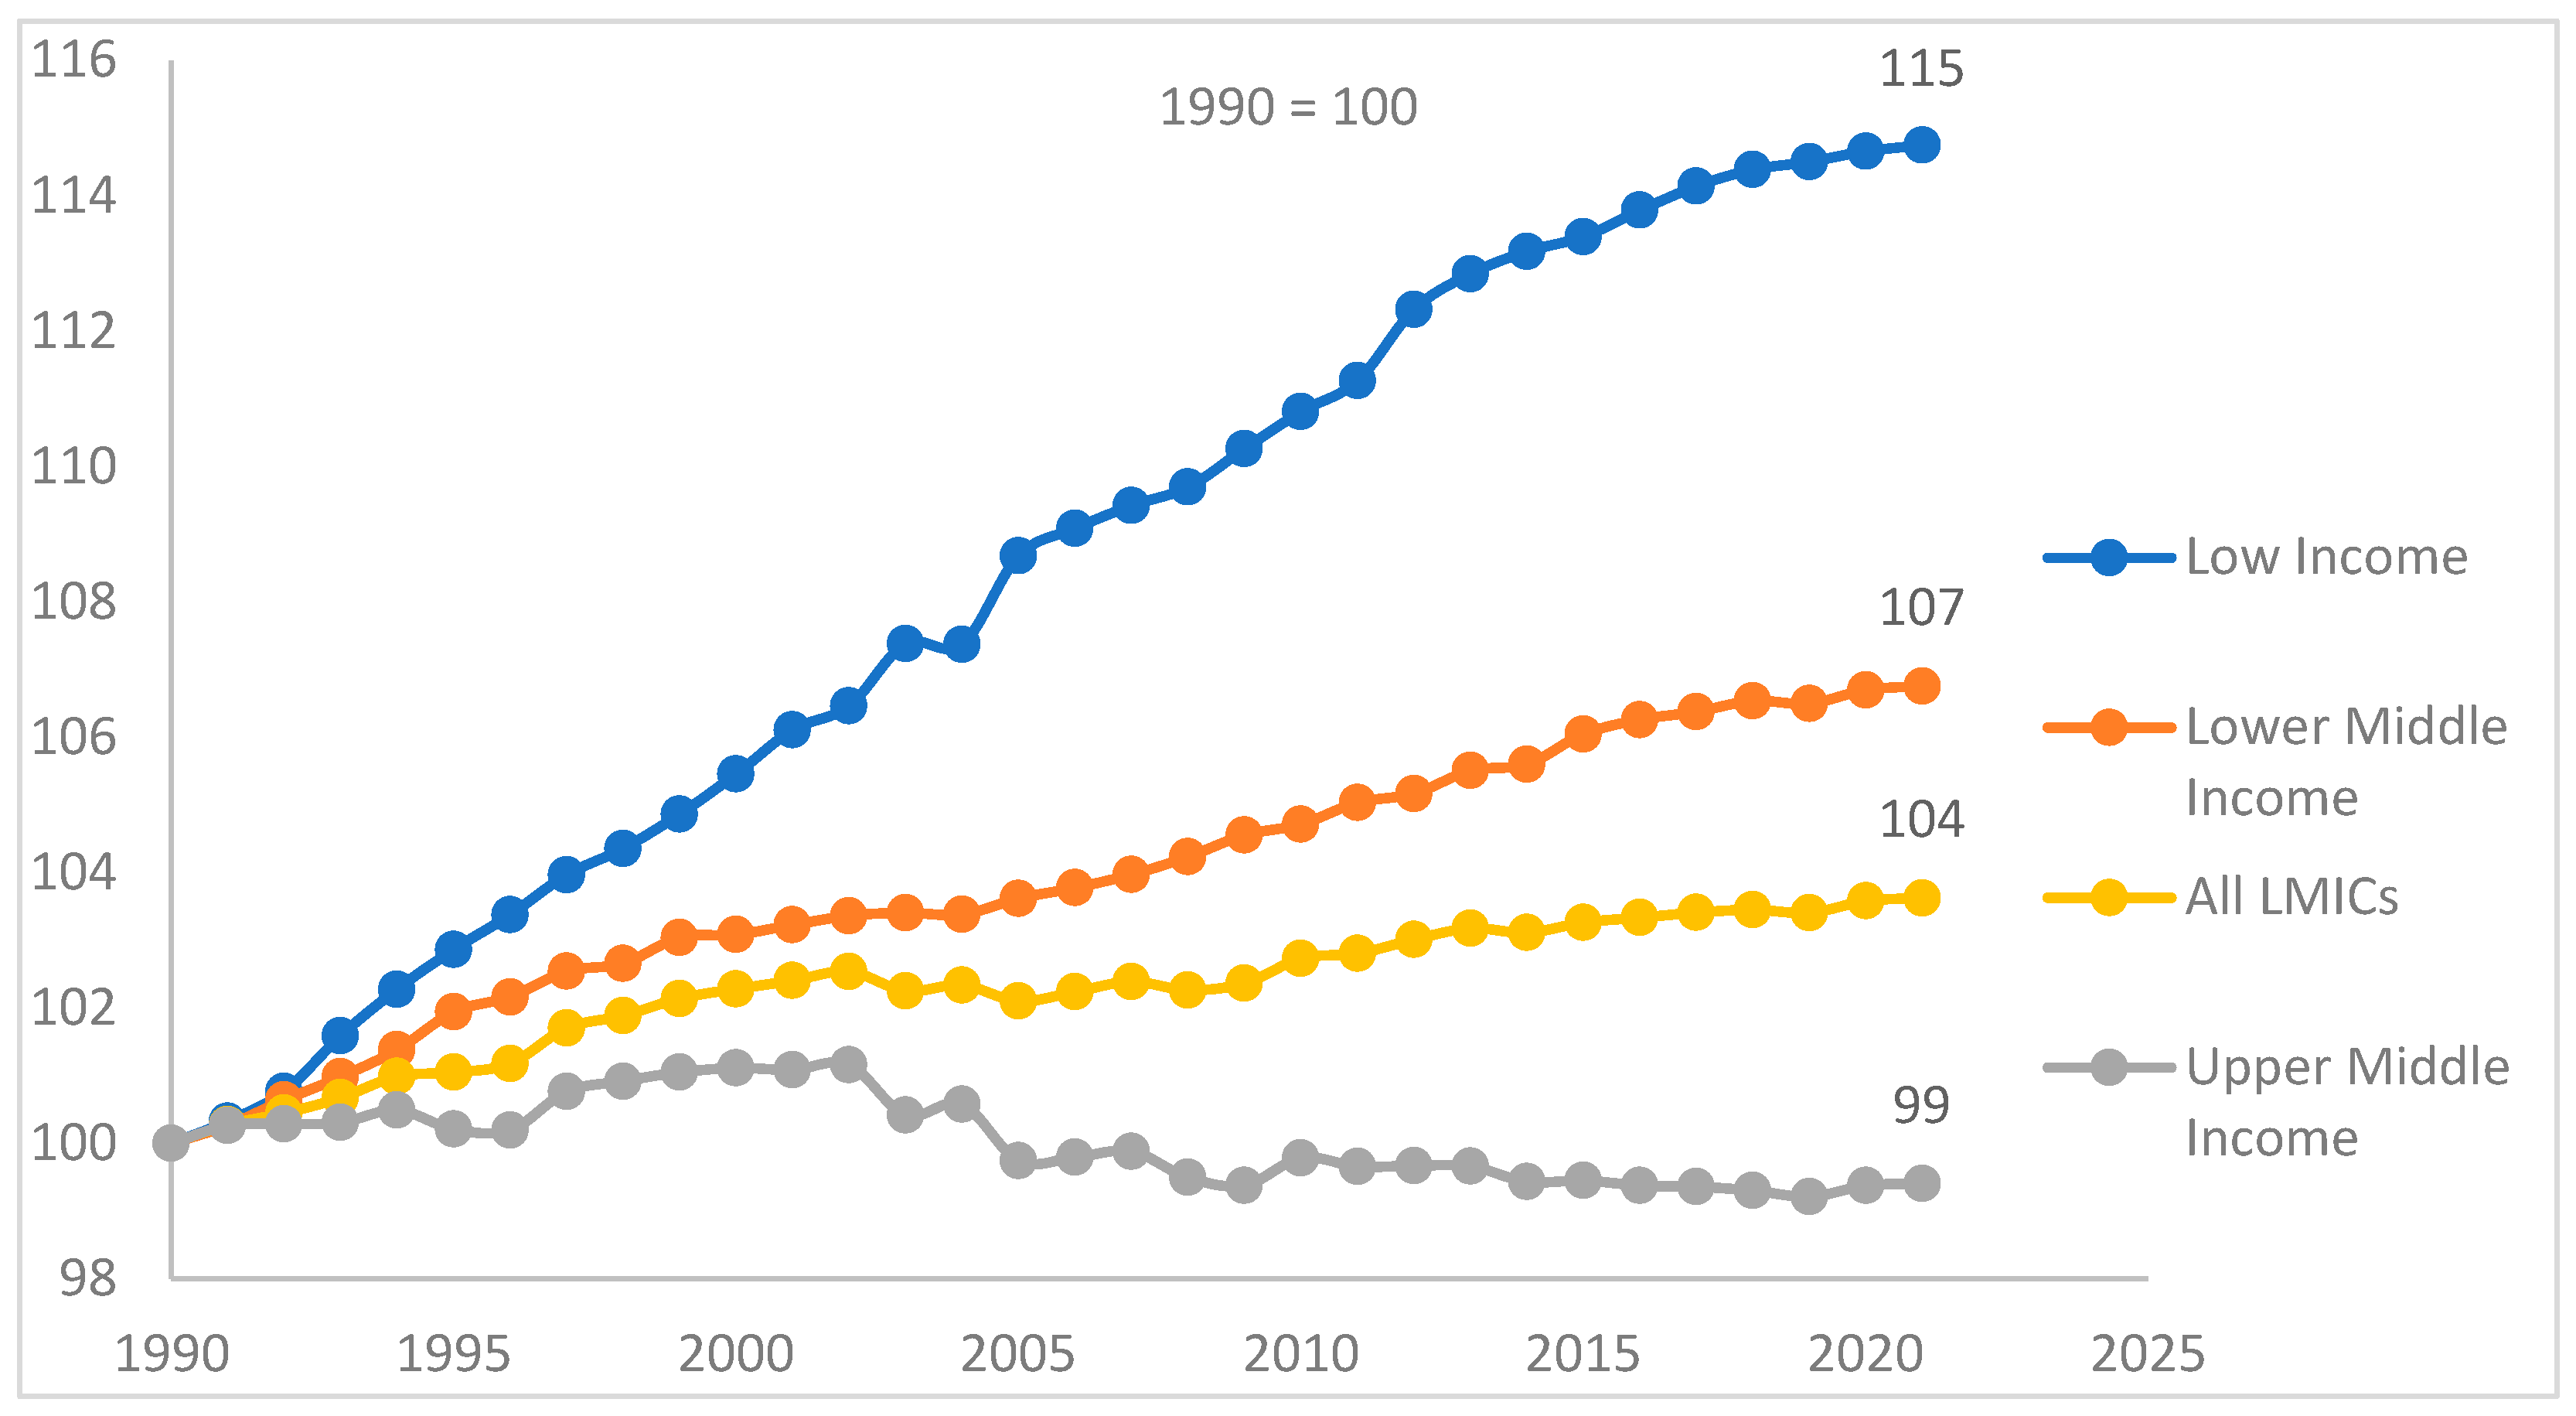
Figure 1. Agricultural land expansion in low- and middle-income countries (LMICs) in 1990–2021. Agricultural land refers to the share of land area that is arable, under permanent crops, or under permanent pastures. Data are presented for 127 LMICs (24 low-income, 50 lower-middle-income, and 53 upper-middle-income) as classified following the World Bank Country and Lending Groups, https://datahelpdesk.worldbank.org/knowledgebase/articles/906519-world-bank-country-and-lending-groups (accessed on 31 July 2025). Low-income economies are defined as those with a gross national income (GNI) per capita of $1135 or less in 2024; lower-middle-income economies are those with a GNI per capita between $1136 and $4495; and upper-middle-income economies are those with a GNI per capita between $4496 and $13,935. The data are from the World Bank, World Development Indicators, available at: https://databank.worldbank.org/source/world-development-indicators (accessed on 8 September 2025).
Land 14 02314 g001
Figure 2. Agricultural land expansion and GDP per capita in low- and middle-income countries (LMICs). Data are from the World Bank, World Development Indicators, available at: https://databank.worldbank.org/source/world-development-indicators (accessed on 8 September 2025).
Land 14 02314 g002
Figure 3. Agricultural value-added share of GDP and GDP per capita in low- and middle-income countries (LMICs). Data are from the World Bank, World Development Indicators, available at: https://databank.worldbank.org/source/world-development-indicators (accessed on 8 September 2025).
Land 14 02314 g003
Figure 4. Agricultural land intensity and GDP per capita in low- and middle-income countries (LMICs). Data are from the World Bank, World Development Indicators, available at: https://databank.worldbank.org/source/world-development-indicators (accessed on 8 September 2025).
Land 14 02314 g004
Figure 5. Trends in the components of the land identity for low- and middle-income countries (LMICs) from 2000 to 2021. GDP per capita is constant 2015 US$, Population is the total population, Agricultural value added (% GDP) is based on agriculture, forestry, and fishing value-added (constant 2015 US$), and Agricultural land intensity is agricultural land (km2) divided by 106 agriculture, forestry, and fishing value-added (constant 2015 US$). Data are presented for 122 LMICs (21 low-income, 50 lower-middle-income, and 51 upper-middle-income) and are from the World Bank, World Development Indicators, available at: https://databank.worldbank.org/source/world-development-indicators (accessed on 8 September 2025).
Land 14 02314 g005
Figure 6. Trends in the components of the land identity for low-income countries from 2000 to 2021. GDP per capita is constant 2015 US$, Population is the total population, Agricultural value added (% GDP) is based on value-added agriculture, forestry, and fishing (constant 2015 US$), and Agricultural land intensity is agricultural land (km2) divided by 106 agriculture, forestry, and fishing value-added (constant 2015 US$). Data are presented for 21 low-income countries and are from the World Bank, World Development Indicators, available at: https://databank.worldbank.org/source/world-development-indicators (accessed on 8 September 2025).
Land 14 02314 g006
Table 1. Key components of the land identity for low- and middle-income countries (LMICs).
Income GroupAgricultural Land IntensityAgricultural Value Added
(% GDP)
GDP per CapitaPopulation
(Millions)
2000–2002 Average
Low76233.8637290.0
Lower Middle73720.115812169.2
Upper Middle93910.044752380.9
All LMICs82618.226284840.1
2019–2021 Average
Low52828.0700503.8
Lower Middle46715.723232967.8
Upper Middle4727.865892775.2
All LMICs47914.538276246.7
% Change 2000–2002 to 2019–2021
Low−30.8%−17.2%9.9%73.7%
Lower Middle−36.6%−21.8%47.0%36.8%
Upper Middle−49.8%−22.1%47.2%16.6%
All LMICs−41.9%−20.4%45.6%29.1%
Agricultural land intensity is agricultural land (km2) divided by 106 agriculture, forestry, and fishing value-added (constant 2015 US$), Agricultural value added (% GDP) is based on agriculture, forestry, and fishing value-added (constant 2015 US$), GDP per capita is constant 2015 US$, and Population is the total population. Data are presented for 122 LMICs (21 low-income, 50 lower-middle-income, and 51 upper-middle-income) and are from the World Bank, World Development Indicators, available at: https://databank.worldbank.org/source/world-development-indicators (accessed on 8 September 2025).
Table 2. Key components of the land identity by region.
RegionAgricultural Land IntensityAgricultural Value Added
(% GDP)
GDP per CapitaPopulation
(Millions)
2000–2002 Average
East Asia and the Pacific101722.12345 1812.2
Europe and Central Asia58116.82509 212.9
Latin America and Caribbean2939.24875 469.4
Middle East and North Africa7899.43603 293.5
South Asia23023.31688 1439.7
Sub-Saharan Africa122323.31535 612.4
2019–2021 Average
East Asia and the Pacific34216.240462094.8
Europe and Central Asia33010.15377241.8
Latin America and Caribbean1718.26388577.8
Middle East and North Africa39111.33917418.4
South Asia14316.529581894.5
Sub-Saharan Africa84619.219741019.5
% Change 2000–2002 to 2019–2021
East Asia and the Pacific−66.4%−26.6%72.5%15.6%
Europe and Central Asia−43.2%−39.8%114.3%13.6%
Latin America and Caribbean−41.4%−10.5%31.0%23.1%
Middle East and North Africa−50.5%20.1%8.7%42.6%
South Asia−37.9%−29.4%75.2%31.6%
Sub-Saharan Africa−30.8%−17.7%28.6%66.5%
Agricultural land intensity is agricultural land (km2) divided by 106 agriculture, forestry, and fishing value-added (constant 2015 US$), Agricultural value added (% GDP) is based on agriculture, forestry, and fishing value-added (constant 2015 US$), GDP per capita is constant 2015 US$, and Population is the total population. Data are presented for 122 low- and middle-income countries (20 in East Asia and the Pacific, 16 in Europe, 7 in Central Asia, 22 in Latin America and the Caribbean, 13 in the Middle East and North Africa, 8 in South Asia, and 43 in Sub-Saharan Africa) and are from the World Bank, World Development Indicators, available at: https://databank.worldbank.org/source/world-development-indicators (accessed on 8 September 2025).
Disclaimer/Publisher’s Note: The statements, opinions and data contained in all publications are solely those of the individual author(s) and contributor(s) and not of MDPI and/or the editor(s). MDPI and/or the editor(s) disclaim responsibility for any injury to people or property resulting from any ideas, methods, instructions or products referred to in the content.