Article

Effects of Vegetation Restoration on Soil Fungal Communities During Early Post-Construction Phase of a Desert Steppe Photovoltaic Power Station

1
Institute of Plant Protection, Ningxia Academy of Agricultural and Forestry Sciences, Yinchuan 750002, China
2
Jiangsu Provincial Key Lab for Organic Solid Waste Utilization, Jiangsu Collaborative Innovation Center for Solid Organic Wastes, Educational Ministry Engineering Center of Resource-Saving Fertilizers, Nanjing Agricultural University, Nanjing 210095, China
3
Institute of Forestry and Grassland Ecology, Ningxia Academy of Agricultural and Forestry Sciences, Yinchuan 750002, China
*
Author to whom correspondence should be addressed.
Land 2025, 14(12), 2306; https://doi.org/10.3390/land14122306 (registering DOI)
Submission received: 29 October 2025 / Revised: 18 November 2025 / Accepted: 20 November 2025 / Published: 23 November 2025
(This article belongs to the Section Land Use, Impact Assessment and Sustainability)

Abstract

Expansion of photovoltaic infrastructure in arid regions raises concerns about soil microhabitat degradation. Very few studies have systematically compared these recovery alternatives in reshaping the soil fungal communities during early recovery. This study investigated short-term effects (less that two-year recovery) of PV infrastructure and restoration (natural/artificial) on soil fungal diversity and enzymatic activities in Ningxia desert steppe. A total of 243 soil samples were analyzed to assess fungal diversity, composition, enzyme activities, and co-occurrence networks. The restoration method significantly affected soil fungal α-diversity and β-diversity in the experimental solar park. Specifically, at each recovery site, soil depth showed significant effect on fungal α-diversity. However, on a fine scale, artificial restoration significantly increased fungal species richness across soil depths. Ascomycota dominated across different sites, followed by Basidiomycota and Mucoromycota. Shared core genera Fusarium, Mortierella, and Geminibasidium were determined in both recovery sites. Sucrase/phenol oxidase (natural) and catalase/sucrase (artificial) were identified as key fungal drivers according to Random Forest models. Co-occurrence analysis suggested neither artificial restoration nor natural restoration has attained the level of natural habitats. Networks of artificial subsoil and natural topsoil were closest to natural habitat. These results emphasize the impact of restoration and PV shading on fungal communities via spatial heterogeneity and enzyme dynamics during initial recovery stage, providing insights for semi-arid ecosystem management under PV development.

1. Introduction

Photovoltaic (PV) power generation has become a pivotal solution for mitigating energy crises and reducing carbon emissions worldwide. Desert steppe regions, characterized by abundant solar radiation and extensive vacant land, have been recognized as prime locations for solar power station development in recent years. However, large-scale construction of solar power stations imposes substantial impacts on local ecosystems, leading to changes in regional microclimates, vegetation degradation, soil quality decline, and disruption of mesofauna activities [1,2,3,4,5,6,7,8,9]. Specifically, PV modules can significantly alter the photosynthetically active radiation and radiative flux balance, thereby reducing soil surface albedo and modifying soil moisture content [10]. In arid ecosystems, a great proportion of precipitation can be redistributed, leading to a soil moisture gradient directing from the dripline to the shade underneath [11,12]. Meanwhile, local human activities and fragile environmental conditions can impose significant impacts on ecological vulnerability [13,14]. Although ecological restoration is widely adopted to rehabilitate degraded ecosystems [15], the fine-scale effects of PV installations on soil microhabitats—particularly changes in microbial community dynamics and extracellular enzymatic activities—remain understudied.
Most studies predominantly focus on macroscale ecological responses related to revegetation and microclimate changes, overlooking fine-scale changes in soil microbial communities and enzymatic activities across spatial gradients [16,17]. Various vegetation responses to PV shading have been documented for the mixed impacts of fixed-tilt PV panels on the yield of crops and fruits in different agrivoltaics systems, ranging from 39% loss to 47% increase in yield changes worldwide [18,19,20,21]. An overall decrease in soil temperature due to the shading of PV panels has been demonstrated in various regions worldwide [22]. Shading effects on soil temperature and moisture in fixed-tilt PVs are more significant than in the tracking PVs [3,7,9]. One example suggested that in desert regions, both the fixed-tilt and tracker PV systems had led to less drastic soil temperature changes and higher soil moisture than other conditions with full sunlight exposure [23]. Particularly in arid and semi-arid areas, such microclimatic changes could potentially contribute to improving water use efficiency, crop resilience, and yield stability in agrivoltaics ecosystems [24]. Soil microbe responses to fixed-tilt PV panels are less documented than vegetation responses and microclimate changes.
Soil microbial communities play a central role in maintaining arid ecosystem stability and functionality [25]. These microorganisms can rapidly adapt to environmental changes through coordinated adjustments in reproduction and metabolism [26]. Alterations in microbial community composition and diversity act as sensitive indicators of ecosystem stability and functionality, directly influencing essential ecosystem processes such as plant diversity and productivity, nutrient cycling, and carbon assimilation [27,28,29,30,31]. Loss of critical microorganisms has been linked to impaired ecosystem functions [32,33], highlighting the critical importance of microbial community recovery in ecosystem restoration [34]. Similarly, soil enzymes, including phosphatase, urease, and dehydrogenase, are established indicators of soil health [35], being widely used to assess the impacts of environmental disturbances and agricultural practices on soil ecosystems [15,36]. Meanwhile, soil enzymatic activities have been recognized as alternative parameters for evaluating soil fertility, given the advantages of being relatively easy to operate, fast in detection, and low in cost [37,38]. In arid ecosystems, these enzymes can play a vital role in nutrient cycling [39]. Additionally, these enzymatic activities are also heavily dependent on soil environmental factors such as temperature and moisture [40]. Despite the recognized importance of soil microbiomes and enzymes in arid ecosystem functioning, the impacts of photovoltaic infrastructure on soil microbial communities and soil enzymes remain underexplored.
China’s Loess Plateau is one of the country’s most economic important and ecologically fragile regions. This is a region with abundant resources in solar and wind power, now serving as the national energy sector, and it continues to expand and diversify. Meanwhile, it has been demonstrated that the country’s highest ecological vulnerabilities were concentrated in Inner Mongolia, Ningxia Hui, Gansu, and northern Shaanxi provinces [41]. The construction of photovoltaic power plants not only mitigates microclimatic changes but also cause various impacts on terrestrial ecosystems [42]. Given the facts of water deficient and oligotrophic environmental conditions of the Loess Plateau, the distinct plant–microbe interactions would be strongly correlated with the assembly of soil microbial communities and the activities of extracellular enzymes [43]. Moreover, the temporal dynamics of these microbial–enzymatic interactions under different ecological restoration models, especially the contrasting effects of artificial versus natural restoration on soil micro-environmental recovery, remain unexplored. Given the complex interaction between soil microbial communities and enzymatic activities, elucidating their co-variation patterns across restoration strategies is essential for understanding soil micro-environment restoration in post-construction desert steppe ecosystems.
To address these critical questions raised above, the objectives of this study were to (1) characterize the disparities in spatial dynamics of soil fungal diversity in response to PV panel shadings at both artificial (AR) and natural restoration (NR) experimental sites, (2) elucidate the association between fungal community structures and soil enzymatic activities in PV-affected desert steppes under different restoration regimes, and (3) evaluate the photovoltaic effects on fungal network attributes under different restoration regimes. To address these aspects, we conducted experiments at two distinct sites located in the Loess Plateau shortly after the establishment of photovoltaic infrastructure. The study aimed to discern whether fungal communities exhibit similar responses to the environmental changes in the short term. Soil samples were collected from both AR and NR ecosystems. Through amplicon sequencing and network analysis, the network complexity and stability were evaluated both vertically and horizontally. The short-term (less than two years) resilience of soil fungal communities following photovoltaic infrastructure was also evaluated as compared to the undisturbed natural habitat in the neighborhood of the experimental areas.

2. Materials and Methods

2.1. Study Sites

This study was conducted in a solar park located in Ningdong Industrial Base, Ningxia Hui Autonomous Region (the west of the Loess Plateau in northwest China, 106°43′48″ N, 37°55′58″ E, average elevation 1418.4 m). The photovoltaic (PV) power station was mainly located in a desert steppe zone, with an expansive area of approximately 4000 hectares. The average annual precipitation in this area over the past few decades is 255.2 mm, with an average annual evaporation of approximately 2088.2 mm. The average annual temperature as 6.7–8.8 °C. The average annual wind speed is 2.6 m/s, with an extreme wind speed over 17 m/s. The 250 MW photovoltaic station has been in operation since 2022. Given the advantages in cost-effectiveness, durability, and simplicity, fixed solar brackets were predominantly installed in this area, covering over 90% of the solar park. The field experiment was conducted in 2023 and 2024, mainly focusing on the photovoltaic facilities with fixed brackets.

2.2. Experimental Design and Sample Collection

The study designated two types of vegetation restoration measures. The two restoration measures consisted of an artificial restoration and a natural recovery. The artificial restoration site was established in 2023 as a monoculture plantation was adopted using bush clover (Lespedeza bicolor). In 2024, two research sites were randomly selected in the PV power plant with equal degree of construction disturbance, including one site as the artificial restoration site with bush clover planted (A site) and one site as the natural restoration site (N site) adjacent to the A site. An undisturbed area next to the research area was selected as the control. Soil samples were collected in 2024 following a randomized complete block design (RCBD), with 12 representative plots per site. Each treatment was replicated three times inside each sampling site. The experimental solar park was equipped with a two-string fixed-tilt PV array system. The line transect sampling was conducted. Within each sampling site, a 1 m × 1 m quadrat sampling micro-patch was arranged for each horizontal observation point (HOP), including the HOP#1 at the front dripline, the HOP#2 at partial shaded point between the two driplines, the HOP#3 at the fully shaded mid-dripline, and the HOP#4 at the open interspace between two panel arrays (Figure 1). The undisturbed area was designated as the negative control outside the PV panel-installed area. Each sample plot consisted of three sets of soil samples at different depths: 0–5 cm (T layer), 5–10 cm (M layer), and 10–20 cm (B layer). Three replicated samples were collected at each depth. A total of 12 sampling plots were designated in each experimental site. The soil samples belonging to the same treatment of each site were mixed thoroughly. All soil samples were screened through a 2 mm sieve and homogenized thoroughly. A portion of the processed soil samples was sealed using a zipper bag and stored at −20 °C temporarily for DNA extraction. Another set of subsamples were placed in sealed plastic bags and stored at 4 °C for the determination of enzymatic activity analyses.

2.3. Soil Enzymatic Activity

Urease (UE) content (mg/d/g) was quantified using the colorimetric method [44]. Sucrase (SC) content (mg/d/g) was measured utilizing the DNS method. Alkaline phosphatase (ALP) activity was assessed using the method developed by Tabatabai and Bremner [45]. Catalase (CAT) activity was determined following the method developed by Kadhum and Hadwan [46]. Cellulase activity was assayed using the Semenov et al. [47]-developed method. Dehydrogenase activity was determined using the method described by Gong [48]. Polyphenol oxidase (PPO) activity was evaluated by the colorimetric method [49].

2.4. DNA Extraction, PCR Amplification, Libraries Preparation and Sequencing

Total soil microbial DNA was extracted from approximately 0.25 g soil samples using the TIANamp Soil DNA Kit (Tiangen Biotech; Beijing, China) following the manufacturer’s instructions. The concentration and purity of the extracted DNA were determined using a spectrophotometer. The DNA was diluted to a final concentration of 1 ng μL−1 with sterile water. The fungal ITS1 region was amplified using primer pair ITS1F (5’-CTTGGTCATTTAGAGGAAGTAA-3’) and ITS2R (5’-GCTGCGTTCTTCATCGATGC-3′). PCR reaction was conducted in 25 μL reactions, with 15 μL Phusion® High-Fidelity PCR Master Mix (New England Biolabs Inc., Ipswich, MA, USA), 0.2 μM of forward and reverse primers, and about 10 ng template DNA. The PCR conditions were as follows: initial denaturation at 98 °C for 1 min, 30 cycles of denaturation at 98 °C for 10 s, annealing at 50 °C for 30 s, extension at 72 °C for 30 s, and final extension at 72 °C for 5 min. PCR products were verified using 2% agarose gel electrophoresis. DNA libraries were constructed and indexed using the TruSeq® DNA PCR-Free Sample Preparation Kit (Illumina, San Diego, CA, USA). The library quality was determined by the Qubit 2.0 Fluorometer (Thermo Scientific, Wilmington, DE, USA). Paired-end sequencing (200 bp reads) of each library was performed on an Illumina NovaSeq platform, aiming for a sequencing depth of 2–5 million reads by Shanghai Lingen Biotechnology Co., Ltd. (Shanghai, China).

2.5. Sequencing Data Analysis

Paired-end reads were assigned to samples based on the barcodes and truncated by cutting off the barcodes and primer sequences. FLASH (v1.2.7) [50] was used to splice the reads of each sample with a strict filtering process until the chimera sequence was removed and the final effective raw tags were obtained. Processed sequencing data were analyzed following the EasyAmplicon pipeline [51]. All sequences were clustered to Amplicon Sequence Variants (ASVs) at 97% similarity using UPARSE algorithm at USEARCH 11 software [52]. Representative sequences were selected with the highest occurrence frequency in ASVs and species annotation analysis was performed using the blast method in QIIME (v1.9.1) and the UNITE database (v7.2). Rarefaction was used to standardize the number of sequences of each amplicon library size obtained from sequencing. Data analysis was conducted using vegan (v2.5.6), pheatmap (v1.0.12), dplyr (v1.1.4), and other packages in R environment [53] using RStudio version 2023.03.1 [54]. Microbial diversities were calculated using the USEARCH v11 pipeline (http://cryptick-lab.github.io/NGS-Analysis/_site/usearch-v11.html, accessed on 19 November 2025). Statistical differences in α-diversity indices were performed using Tukey’s Honestly Significant Difference (HSD) test. Plots were created using the ggplot2 (v3.4.2) [55]. p-value less than 0.05 was considered statistically significant for all pairwise comparison analyses unless indicated otherwise. Comparisons among microbial communities based on the Bray–Curtis distance in different sampling groups were performed using the vegan package. The fungal functional guild was determined using FUNGuild v1.0 [56]. To identify the key environmental factors driving the composition dynamics of microbial communities, a Random Forest (RF) model and Spearman correlation analysis based on the PCA dimensionality reduction analysis in the randomForest R package (v4.7-1.1) were conducted. Microbial co-occurrence network analysis was performed using the ggClusterNet v2.0 package [57].

3. Results

3.1. Effects of Restoration Measures and Solar Panel Shading on Soil Fungal Diversity

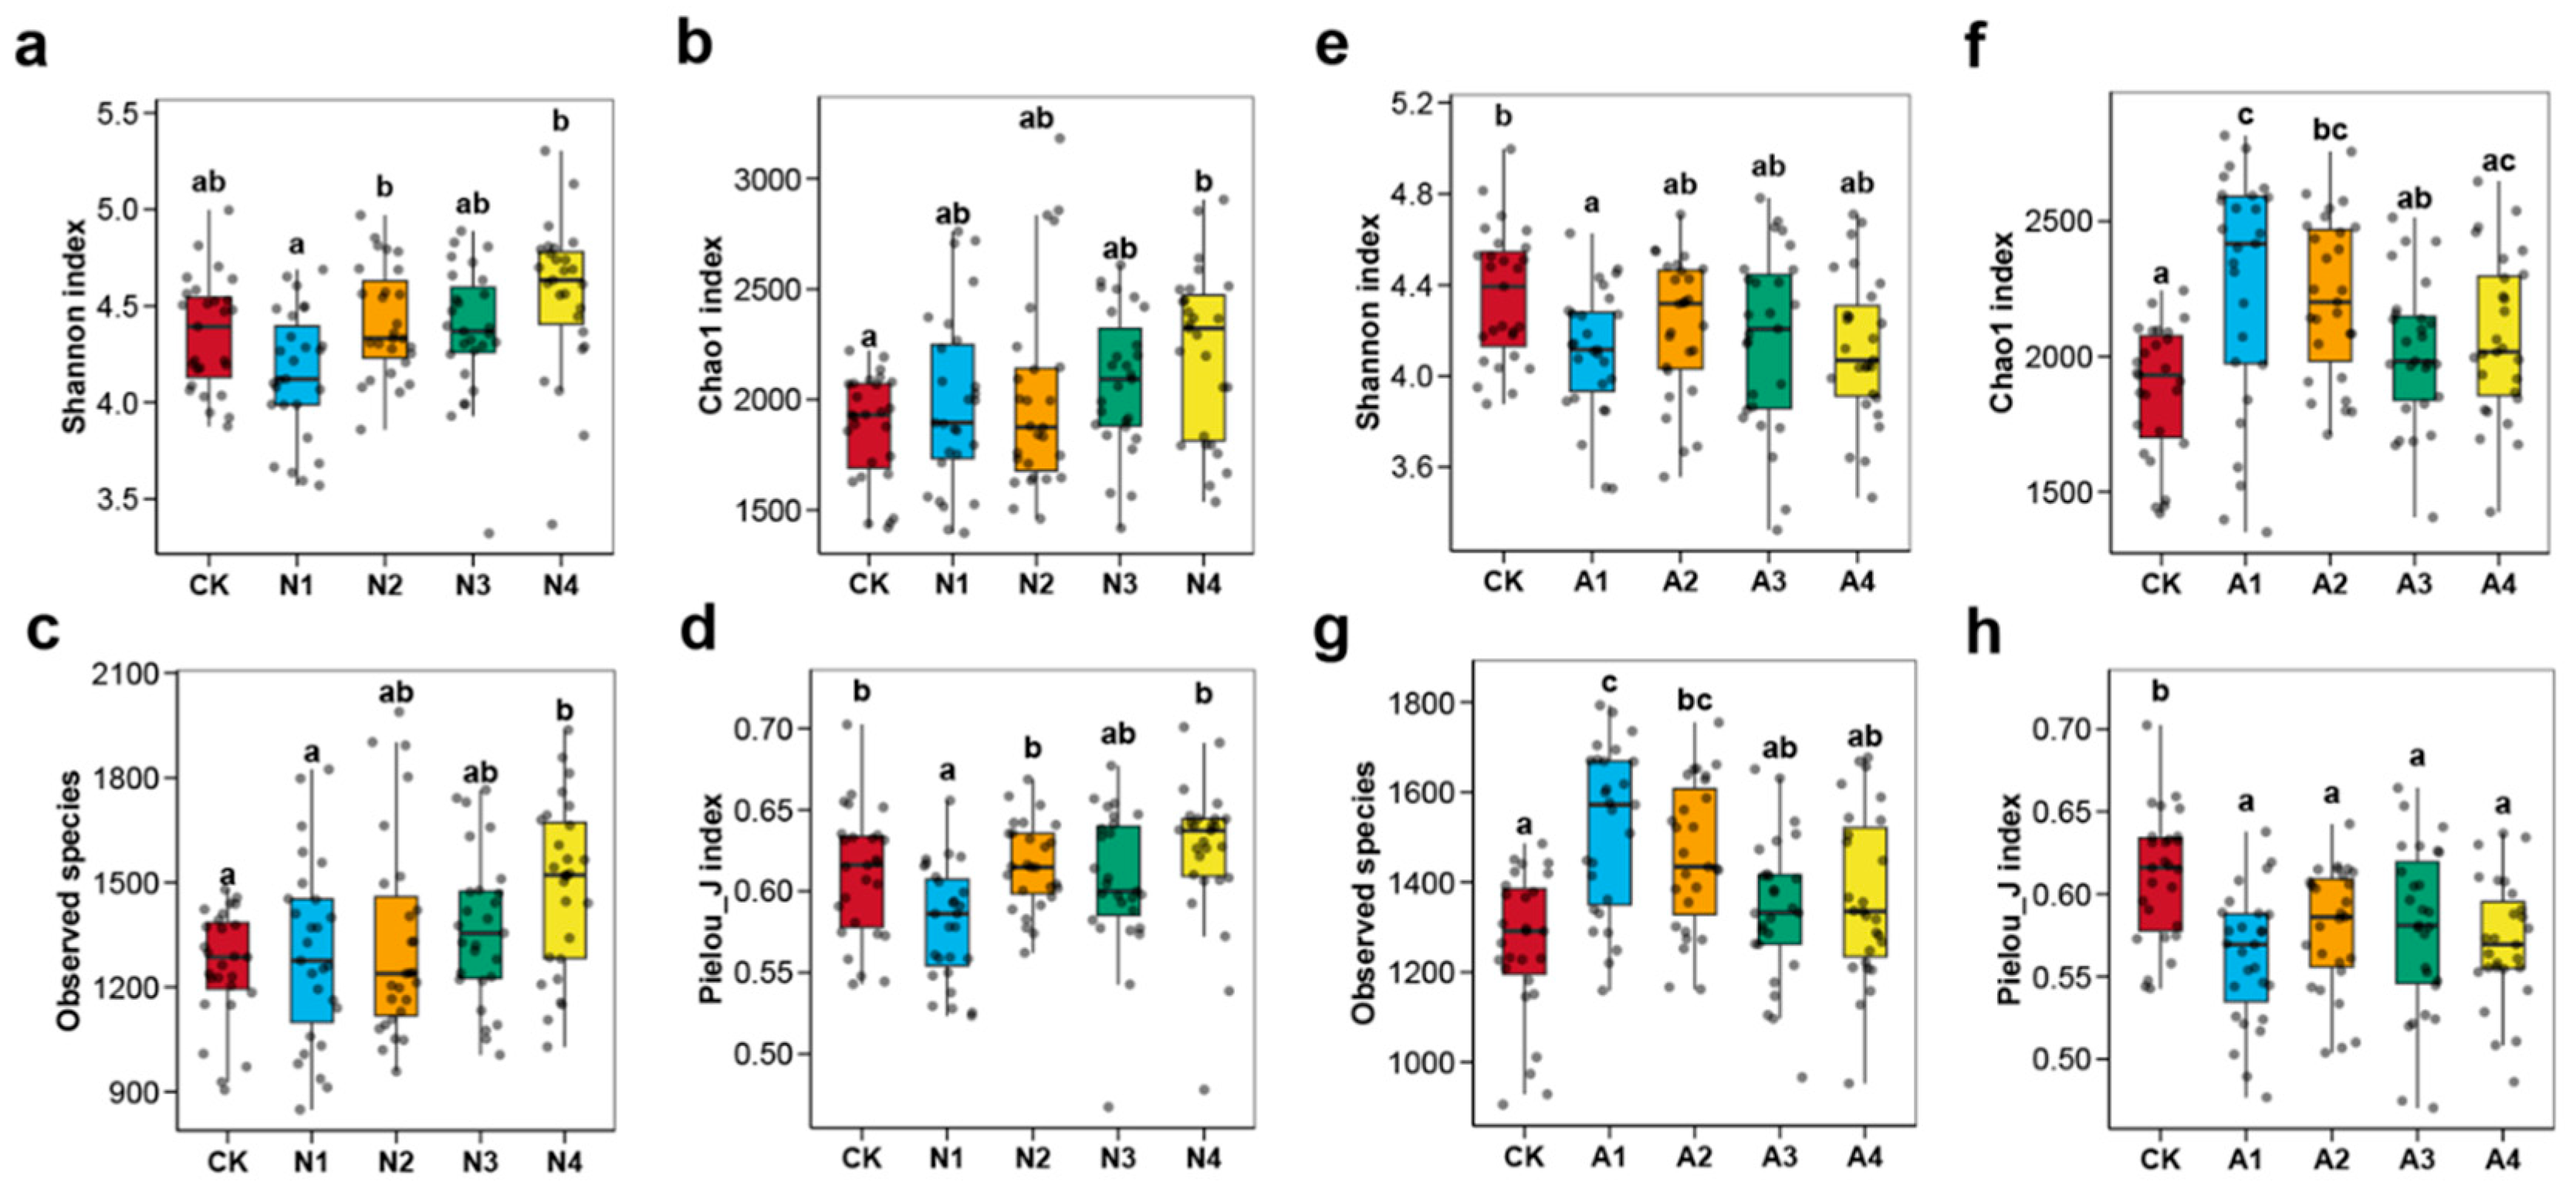
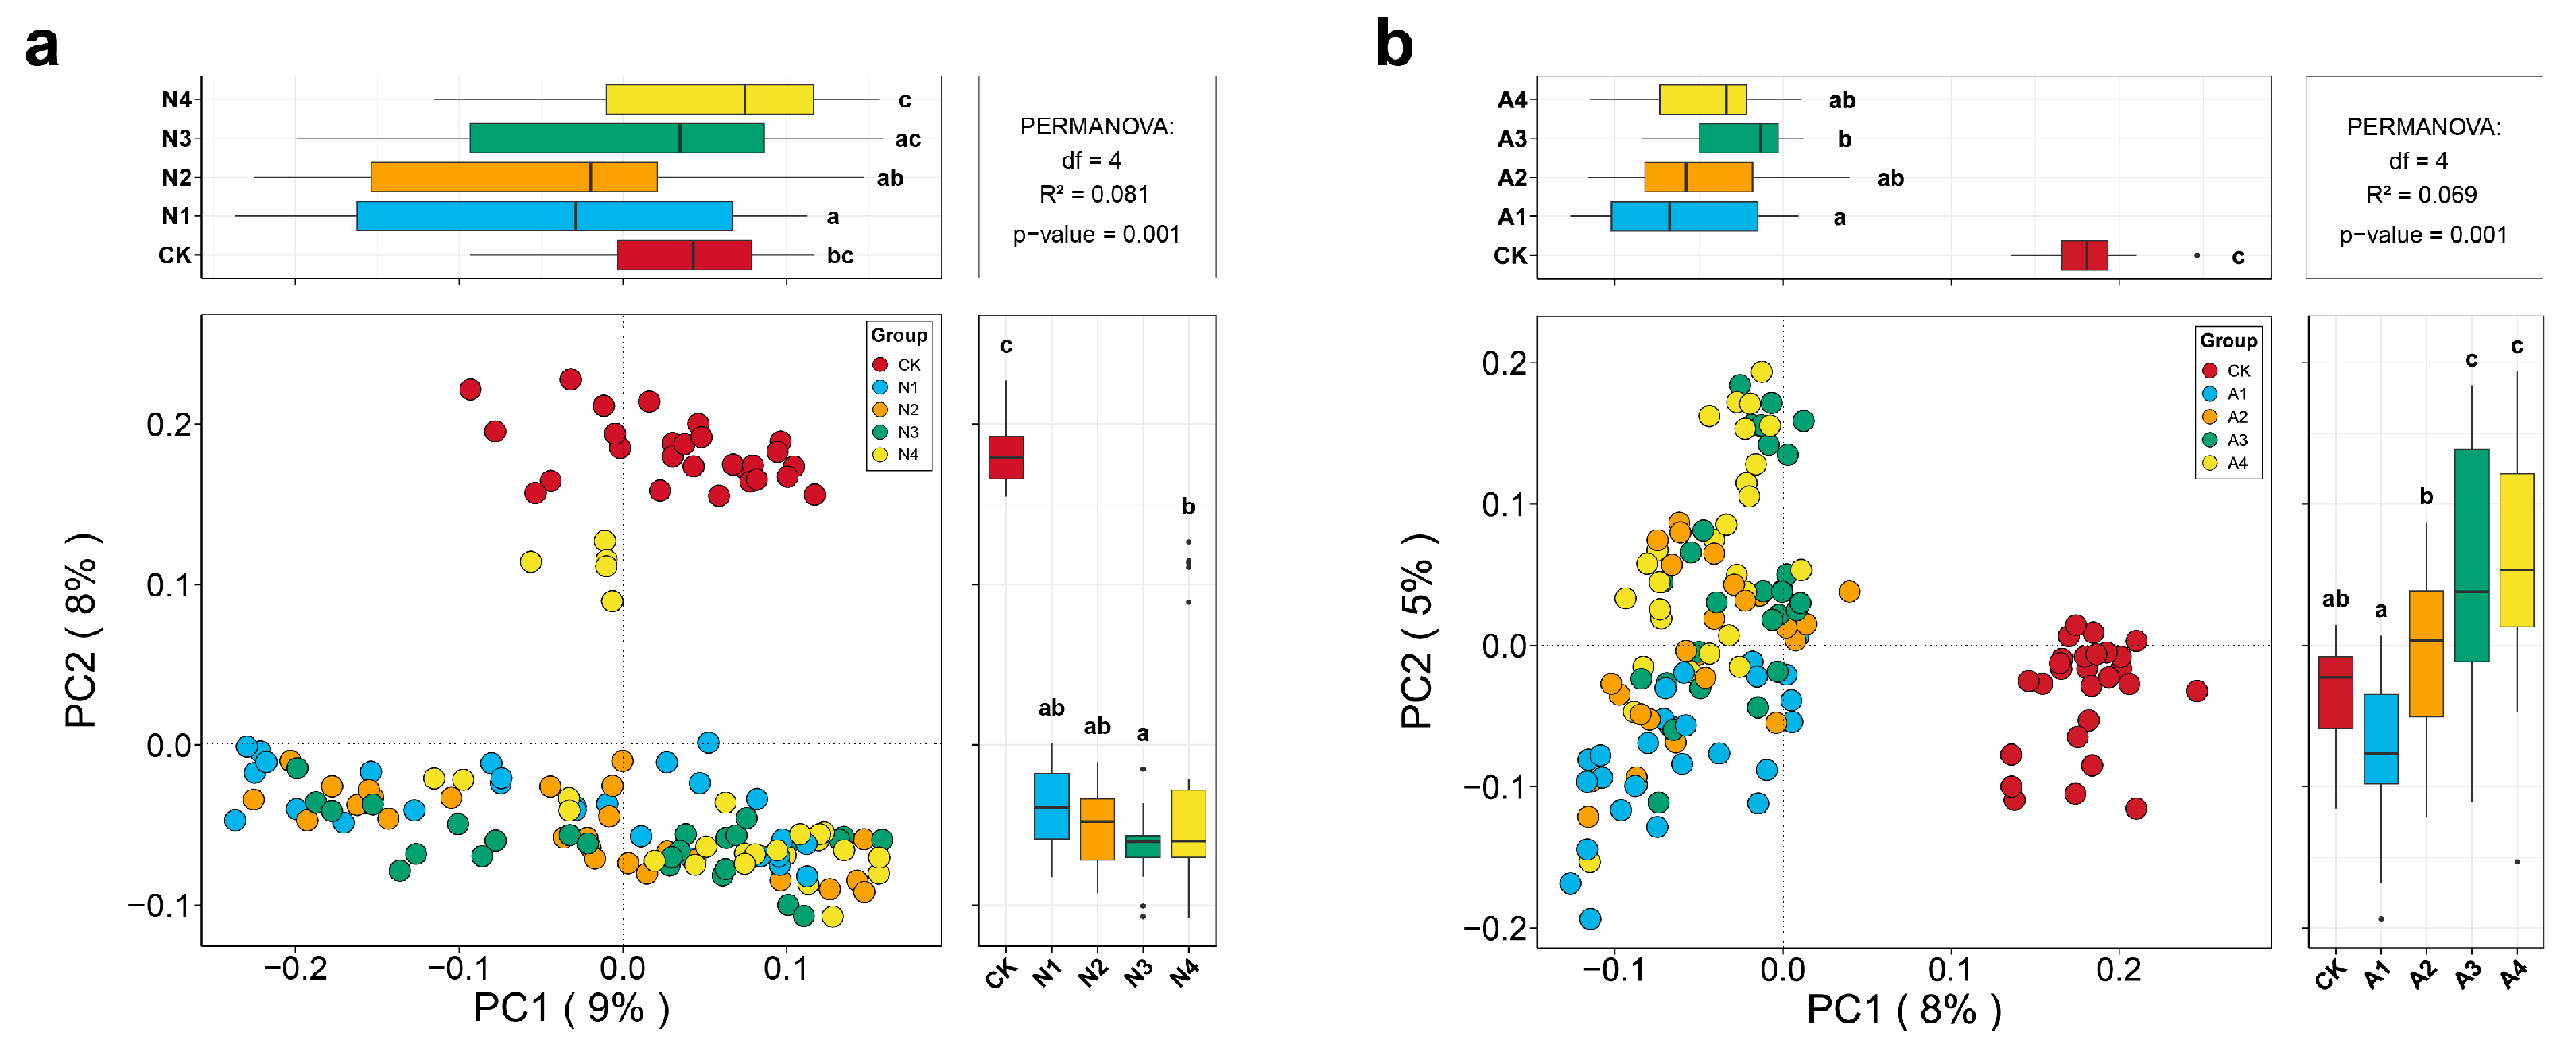
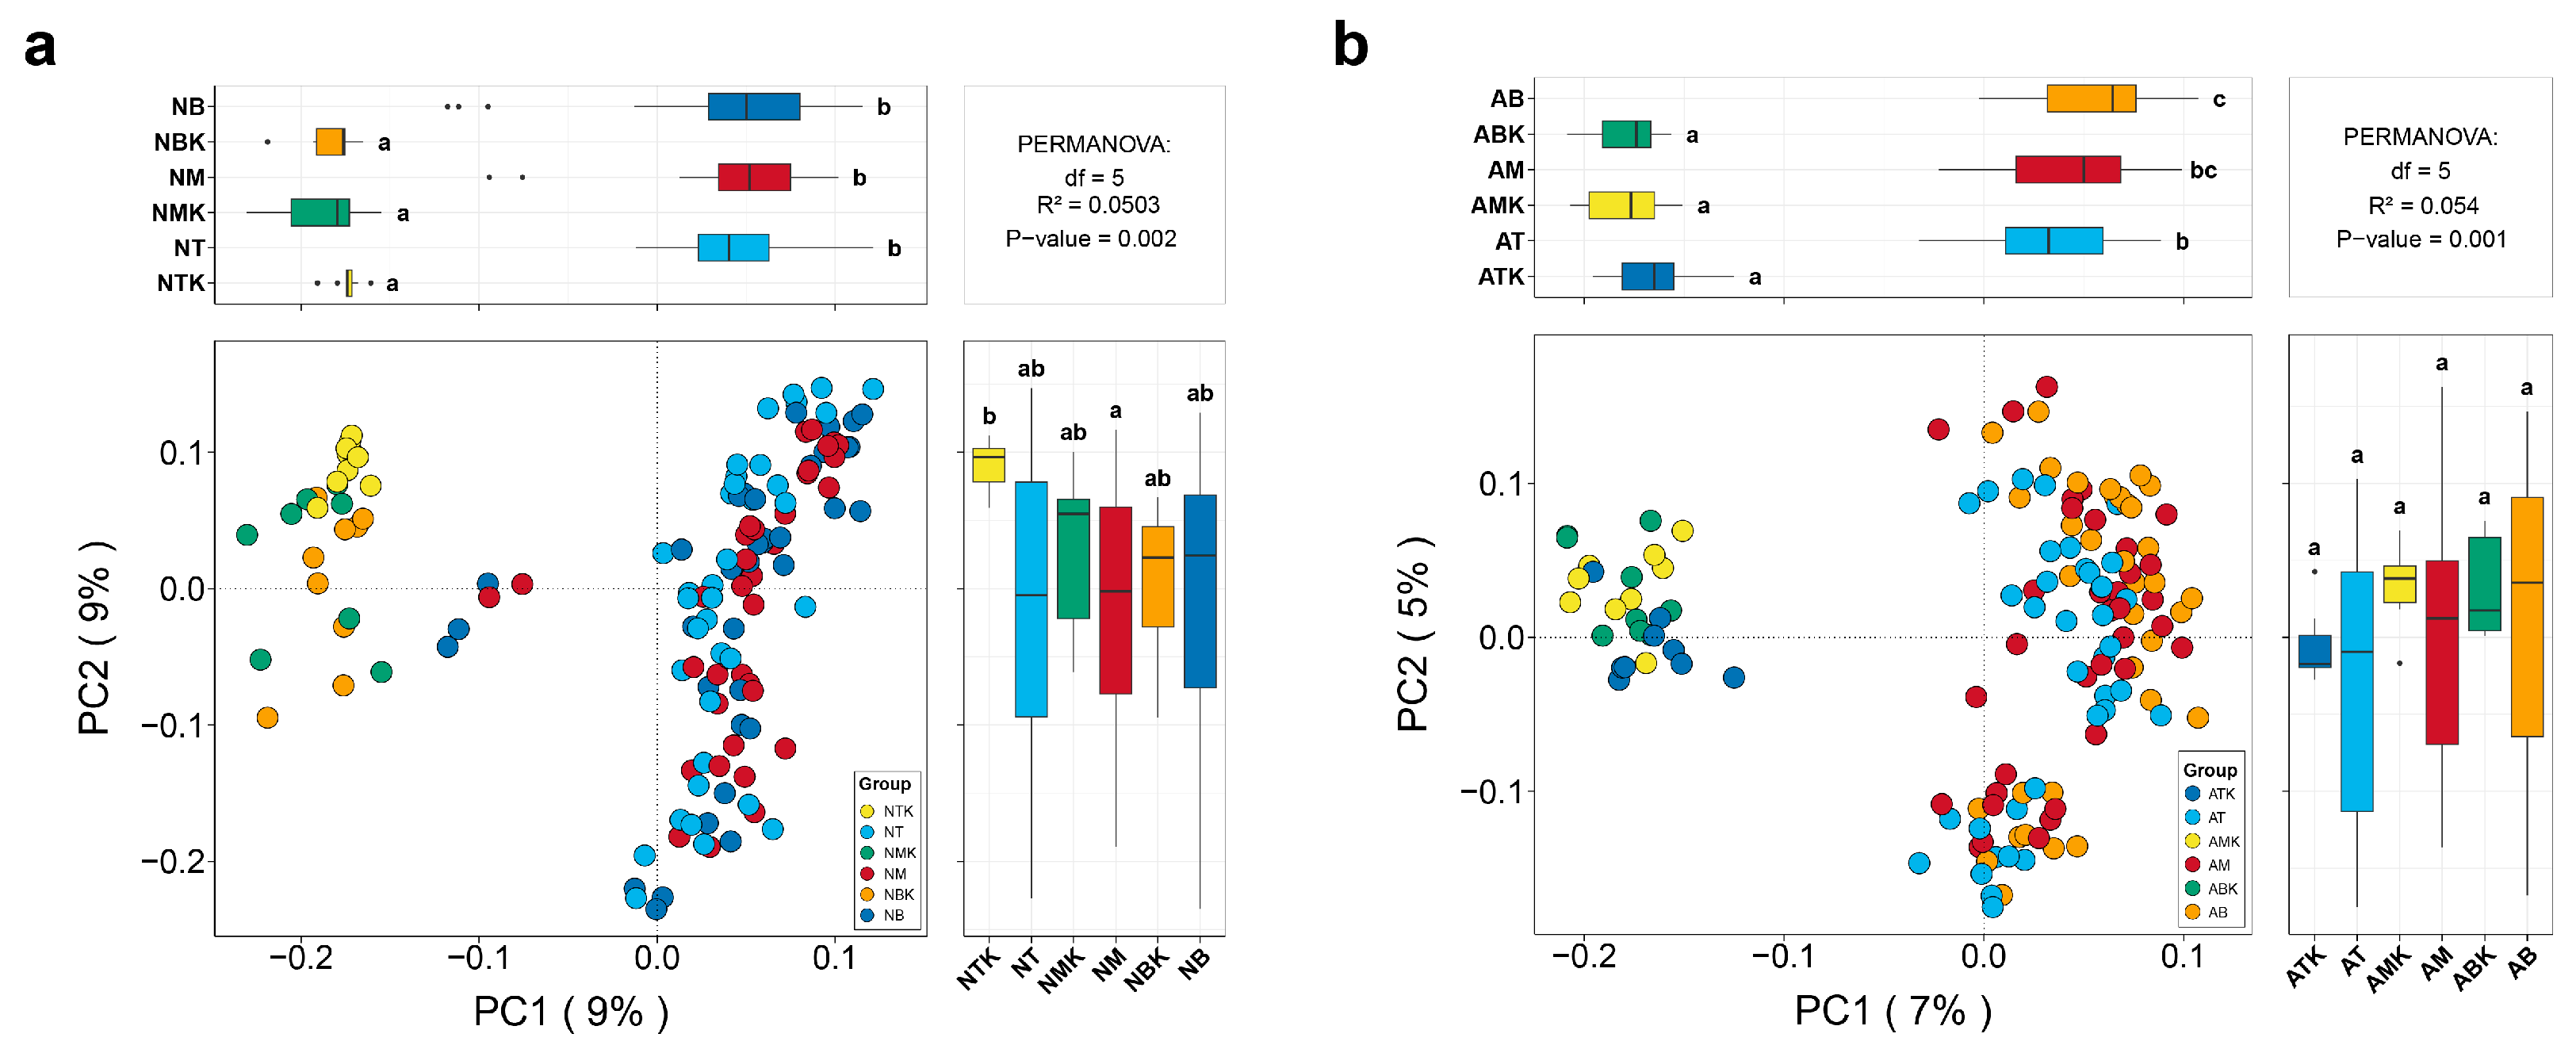
A total of 243 samples were obtained from three experimental sites, with each containing three soil depths and four panel shading gradients either underneath or between the solar panels. Two-way ANOVA analysis was performed analyzing the effects of restoration method and spatial variants on alpha indices. Results indicated that the restoration method significantly affects the fungal alpha diversity in the experimental solar park (Two-way ANOVA, n = 243, p < 0.05, Table S1). PV shading showed no significant effect on fungal alpha diversity at both restoration sites (Two-way ANOVA, n = 135, p > 0.05, Figure 2, Table S2). Soil depth only showed significant effects on the Observed Species, Chao1, and Pielou J indices at both restoration sites (Two-way ANOVA, n = 135, p > 0.05, Figure 3, Table S3). In particular, a statistically significant increase in species richness at the artificial restoration site was determined across all three soil depths (Figure 3g). However, the interaction between soil depth and restoration method did not show any significant effect on fungal alpha diversity at either restoration site (Two-way ANOVA, n = 135, p > 0.05, Table S2). PERMANOVA (Adonis) analysis based on Bray–Curtis distance matrix revealed alterations in the fungal community structure due to the construction of PV panels (Figure 4 and Figure 5). The beta diversity of soil fungal community exhibited both vertically and horizontally distinct spatial patterns between the control site and restoration sites.

3.2. Effects of Restoration Measures and Solar Panel Shadings on the Compositions and Structures of Soil Fungal Communities in Semi-Arid Area Ecosystem

Ascomycota, Basidiomycota, and Mucoromycota were the top three predominant fungal phyla among all treatment groups (Figure S1). Ascomycota was the most abundant phylum among all treatment groups in both experimental stations, accounting for over 80% of the observed fungal taxa. Basidiomycota exhibited an overall greater abundance in both experimental stations than in the control area. A solar irradiance related horizontal heterogeneity effect on the relative abundance of dominant genera along the transect line was determined across different observation points along the transect line. Both vertical and horizontal effects on the compositional structure of the soil fungal community were discussed accordingly.
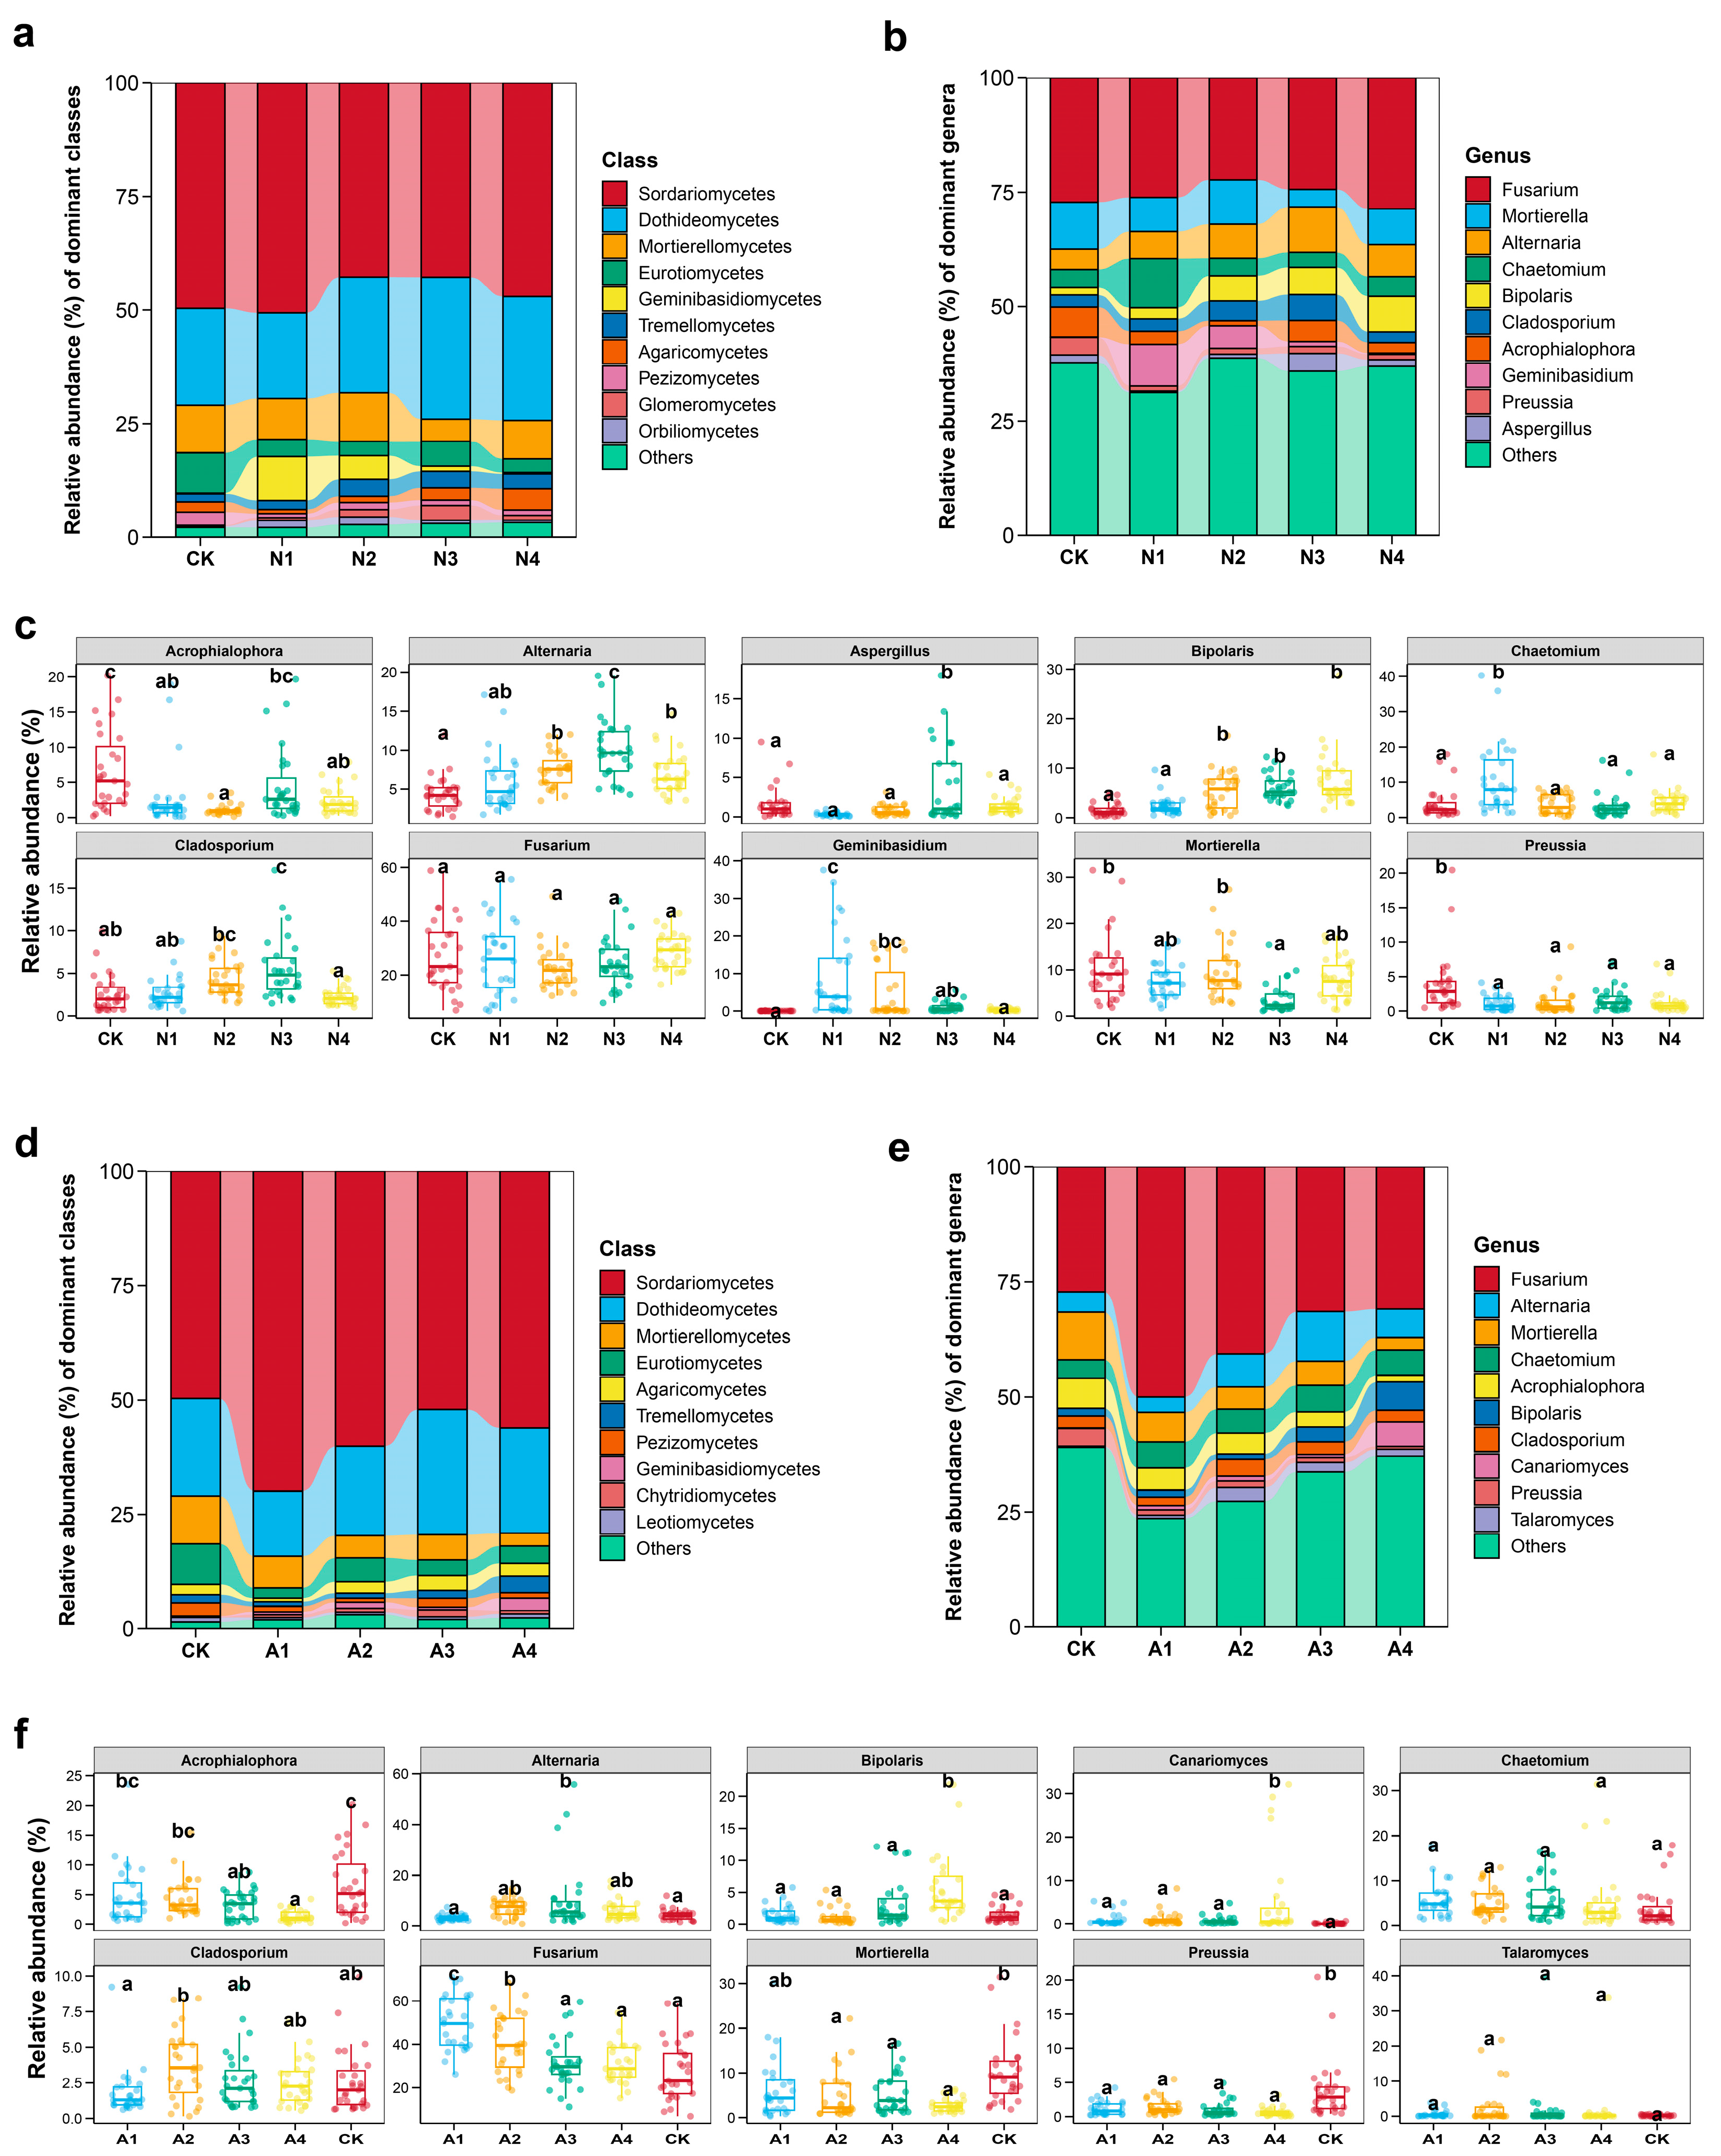
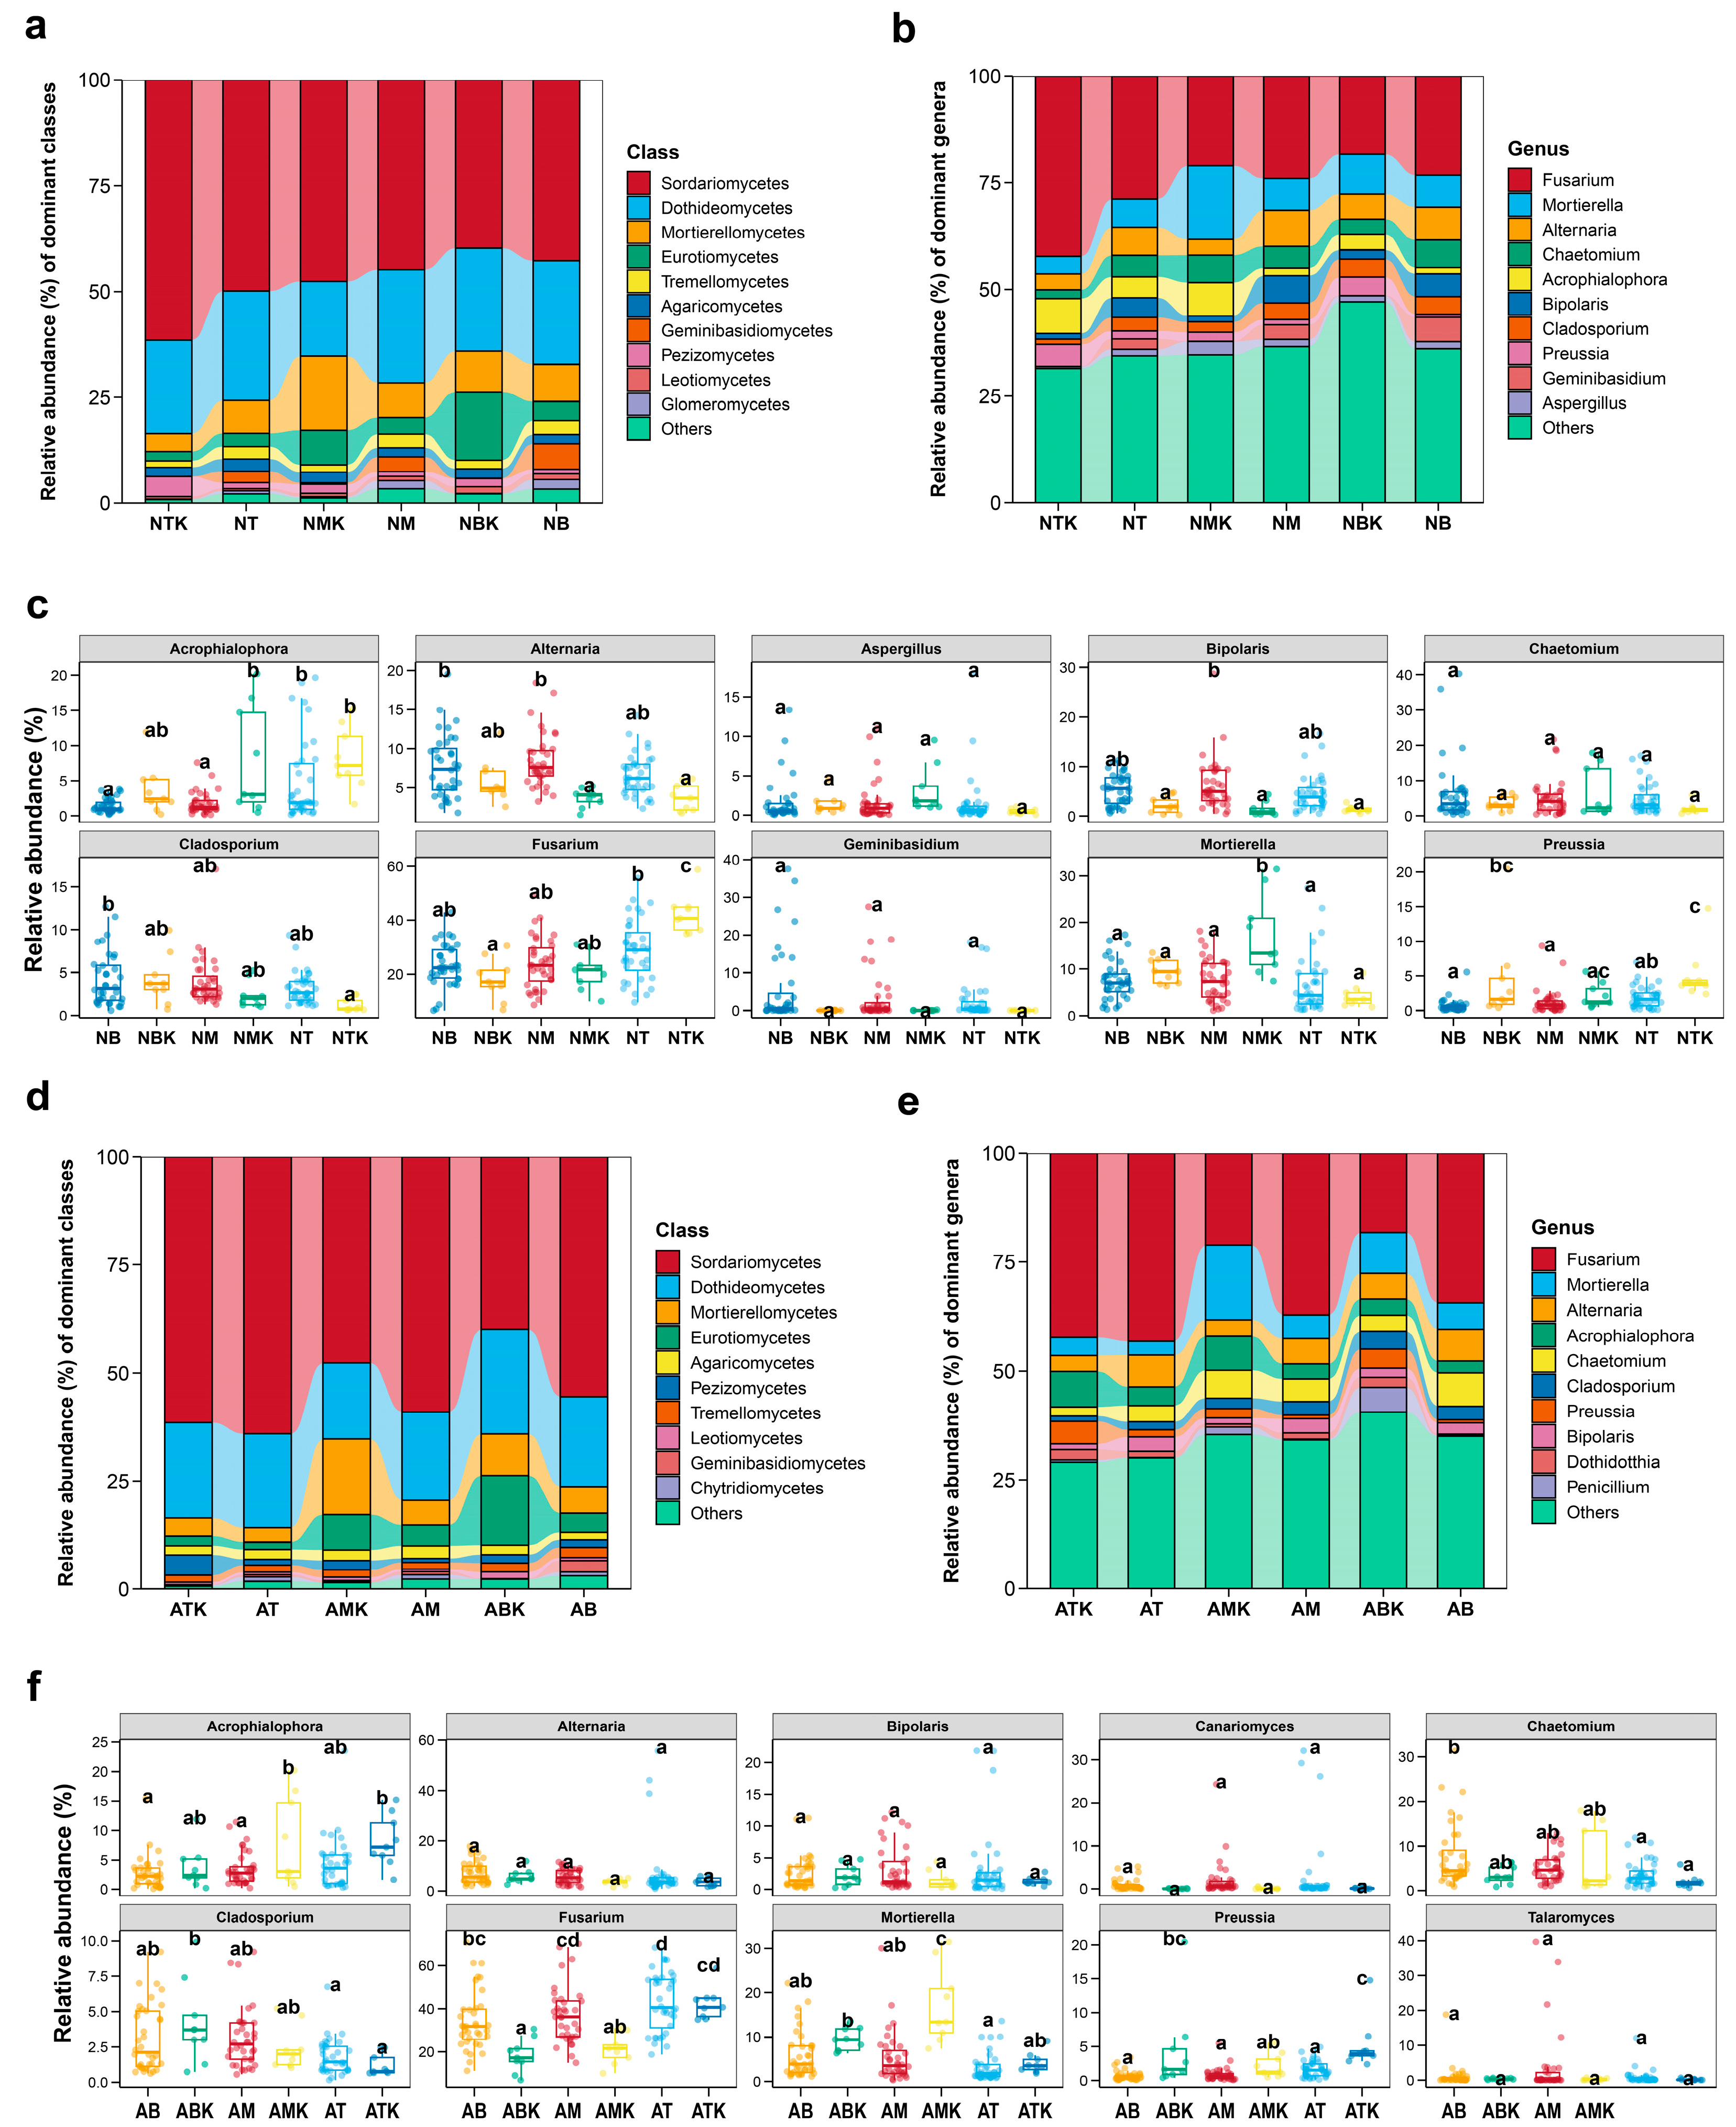
The variations in relative abundances of the top ten dominant fungal genera among treatment groups were discussed in detail (Figure 6 and Figure 7). To specify the horizontal heterogeneity effects on soil fungal diversity, eight dominant fungal genera were shared between the natural and artificial restoration regimes (Figure 6). Aspergillus and Geminibasidium were the unique foil fungal genera at the natural restoration site. Meanwhile, Canariomyces and Talaromyces served as the unique fungal genera that were ranked as the top dominant fungal genera at the artificial restoration site. In addition, a negative correlation was observed between the solar irradiance and relative abundance of two fungal genera at the natural restoration site, including Alternaria, Bipolaris, and Cladosporium (Figure 6c). In contrast, a positive correlation between the solar irradiance and relative abundances of Acrophialophora and Fusarium was observed (Figure 6f). Under the natural restoration regime, Fusarium and Mortierella showed no horizontal heterogeneity along the transect line (Figure 6b,c). However, a significant horizontal heterogeneity on relative abundance of Alternaria and Bipolaris was determined in the shade, showing an enrichment of both genera relative to the control. A stronger horizontal heterogeneity effect was observed at the artificial restoration site. An overall increased Fusarium abundance was determined in the artificial restoration area, as compared to the control (Figure 6e). Meanwhile, a descending relative abundance of Fusarium was also determined, which was positively correlated with the irradiation availability along the transect line. In general, Fusarium, Mortierella and Acrophialophora were less abundant in the artificial restoration area than in the natural habitat (Figure 6f).
The vertical heterogeneity on soil fungal diversity was also discussed under both restoration regimes. Fusarium became less predominant as the soil depth increased in the control group. In comparison, such soil depth-related descending trend of Fusarium abundance was less significant in both restoration treatments (Figure 7b,e). Alternaria and Bipolaris were relatively less abundant across all three soil depths in the natural restoration station than the control group (Figure 7c). The vertical heterogeneity effect on the relative abundance of dominant fungal organisms was more significant in the natural habitat than in the PV restoration sites (Figure 7). At the artificial restoration site, Sordariomycetes was more abundant at all soil depths as compared to the control treatment (Figure 7d). On the contrary, Mortierellomycetes and Eurotiomycetes were more abundant in the corresponding control than in the artificial restoration group (Figure 7d). At the Genus level, Fusarium was significantly more abundant in the artificial restoration site than the control group at both the M and B soil depths (Figure 7f). Pairwise comparisons were performed between the PV and non-PV areas (Figure S2). Relative abundances of Bipolaris and Geminibasidium were significantly higher in all the soil depths of the natural restoration site as compared to the corresponding controls. At the 0–5 cm soil depth, Chaetomium was significantly enriched in both restoration experimental areas (Figure S2a,d). Mortierella, Penicillium, Aspergillus, and Laburnicola were significantly impaired, whereas Geminibasidium was significantly enriched at the 10–20 cm soil depth in both restored PV areas as compared to the controls (Figure S2c,f). Specifically, at the 0–5 cm soil depth, Acrophialophora and Preussia were more abundant in the non-PV areas, whereas Mortierella, Aspergillus, and Penicillium were more abundant at the 5–10 cm soil depth of the non-PV areas as compared to the controls (Figure S2b,e). At the 10–20 cm soil depth, Gibellula, Penicillium, and Preussia were significantly more abundant in the non-PV areas than the control (Figure S2c,f).
In addition, the relative abundances of shared core taxa across treatments were also discussed. In general, the shared core fungal taxa were more abundant in the PV research stations than in the natural habitat, independent of restoration measures (Figure S3). Such treatment effect was more significant at the 5–10 cm and 10–20 cm soil depths than at the 0–5 cm soil depth, showing an increased relative abundance of the shared species in both PV research stations (Figure S3c,d). Regarding the shade-related horizontal heterogeneity on the fungal diversity, the shared species exhibited a greater relative abundance in both PV research stations than in the natural habitat (Figure S3a,b). Additionally, a contradictory trend of the relative abundance of shared core species was observed along the transect line in both PV research stations. The shared core species was the least abundant in the interspace soil between panel arrays in the artificial restoration research area (Figure S3b).

3.3. Key Enzyme Drivers of Fungal Community Dynamics Under Different Restoration Regimes

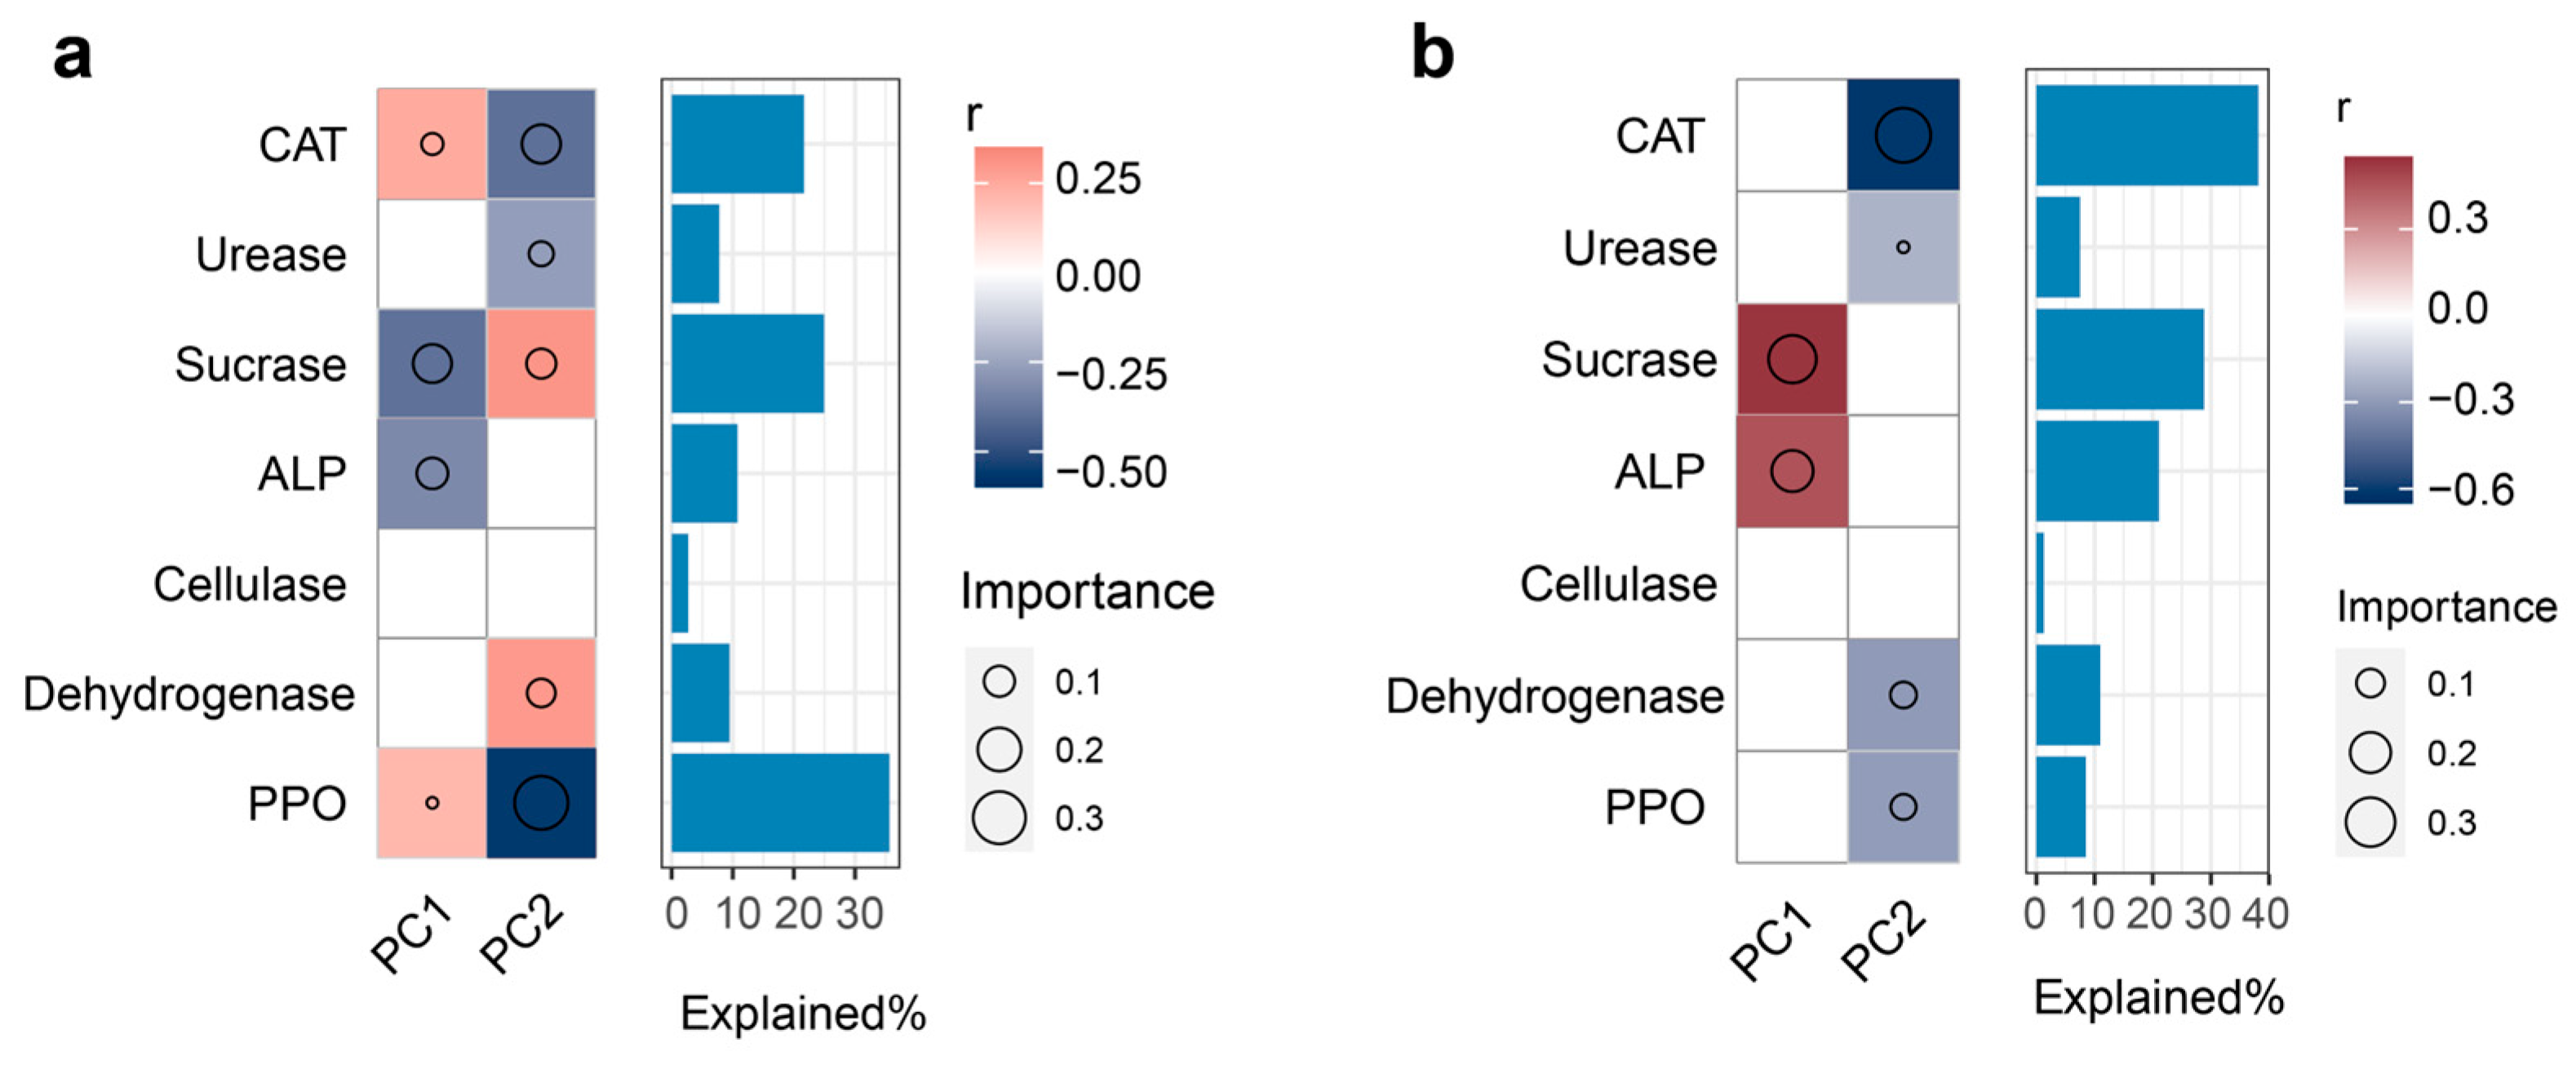
Soil enzymatic activities were analyzed between treatment groups for both restoration experimental sites. Different restoration regimes can potentially affect soil enzymatic activities both vertically and horizontally (Figures S4 and S5). Activities of sucrase and dehydrogenases significantly decreased in the ecological restoration areas as compared to the control area (Figure S4c,f). The cellulase showed an overall greater activity in both restoration areas than the control (Figure S4e). Different restoration regimes showed different impacts on catalase (CAT), urease, alkaline phosphatase (ALP), dehydrogenases, and phenol oxidase (PPO) (Figure S4). In general, a majority of the enzymatic activities significantly decreased at HOP#1 located at the front dripline, regardless of restoration regimes (Figure S4). Meanwhile, the vertical heterogeneity effect on enzymatic activities related to ecological restoration regimes were also discussed (Figure S5). Soil depth exhibited no significant effect on soil enzymatic activities across all experimental treatments. Sucrase, ALP and dehydrogenases showed significantly decreased bioactivities in both restoration experimental stations as compared to the control. In contrast, cellulase had greater activities under both restoration regimes, regardless of soil depth. In the natural restoration site, bioactivities of urease, ALP, dehydrogenases and phenol oxidase were significantly higher than those in the artificial restoration experimental station. Random Forest (RF) models were used to identify the enzyme serving as main environmental predictors that influence soil fungal community under different restoration regimes (Figure 8). Sucrase and phenol oxidase acted as the main drivers for shaping fungal community in the natural restoration site. The fungal community at the artificial restoration site was predominantly driven by both the catalase and sucrase. At the natural restoration site, ALP was positively correlated with fungal community variations, whereas dehydrogenase was to the opposite (Figure 8a). Phenol oxidase activity explained approximately 39% of the variations in fungal community according to the RF regression analysis. Catalase was classified as the key predictor in the artificial restoration site, which was positively correlated with the PC2 factor (Figure 8b).

3.4. Correlations Between the Predicted Biomarkers and the Soil Enzymatic Activities

Soil enzyme assays can be a sufficient alternative for assessing soil fertility, as they rely on soil enzymatic activities that not only reflect the intensity of soil biochemical reactions but also serve as reliable indicators of soil properties. The dominant biomarkers at the Genus level were predicted specifically in both horizontal and vertical scales under both restoration regimes (Figure 9). The correlations between dominant biomarkers and enzymatic activity were also predicted based on Spearman correlation analysis and Random Forest Modeling. Geminibasidium was the shared dominant biomarker between both restoration experimental stations in the horizontal scale. Meanwhile, in the vertical scale, Chionaster, Collariella, Fusarium, and Spiromastigoides were shared by both restoration experimental stations. Regarding the PV-related horizontal heterogeneity in fungal communities, Arthobotrys, Chionaster, Geminibasidium, and Leucosphaerina were identified as the shared dominant biomarkers that were significantly correlated with soil enzymatic activities. Similar results were applied to the vertical heterogeneity effects in fungal biomarkers, including Collariella, Malbranchea, and Spiromastigoides.
Along the horizontal transect, Leucosphaerina, negatively correlated with catalase and phenol oxidase, was classified as the main biomarker that accounted for approximately 37% of the variations in enzymatic activities in the natural restoration site (Figure 9a). A total of nine fungal genera were identified for their significant correlations with soil enzymatic activities. Both catalase and phenol oxidase were identified for their significant correlations with six dominant biomarkers. In particular, Orbilia was positively correlated with catalase, ALP, phenol oxidase, and dehydrogenase. Ceratobasidium was negatively correlated with catalase, phenol oxidase, and urease. Setophoma was only negatively correlated with cellulase. In the artificial restoration site, Alternaria, was classified as the main biomarker that predicted for approximately 38% of the variations in the enzymatic activities when considering the horizontal heterogeneity effects on fungal diversity (Figure 9b). Only dehydrogenase was identified for its significant correlations with over four dominant biomarkers. Specifically, Olpidium was positively correlated with catalase, phenol oxidase, and urease, whereas Collariella and Malbranchea were both negatively correlated with dehydrogenase. At the vertical scale, predominant biomarkers were also predicted for both restoration regimes. At the natural restoration site, Preussia was identified as the core biomarker, with approximately 37% of explanatory proportion for the variations in enzymatic activities (Figure 9c). Preussia, Arthrobotrys, and Chionaster showed significant correlations with over four soil enzymes, with catalase exhibiting the most significant correlations with all three fungal genera. Meanwhile, catalase, ALP, phenol oxidase, and dehydrogenase were significantly correlated with over four dominant biomarkers. Spiromastigoides was only negatively correlated with ALP and dehydrogenase. However, at the artificial restoration site, dominant biomarkers exhibited relatively low relevance to soil enzymatic activities (Figure 9d). Only dehydrogenase was identified for its significant correlation with six core biomarkers. Malbranchea and Collariella were predicted to account for approximately 42% and 37% of explanatory proportion for the variations in enzymatic activities, respectively. Fusarium was identified for its significant correlations with five enzymes except for ALP and cellulase.

3.5. Impacts of Restoration Measures and Solar Panel Shadings on Soil Microbial Co-Occurrence Networks

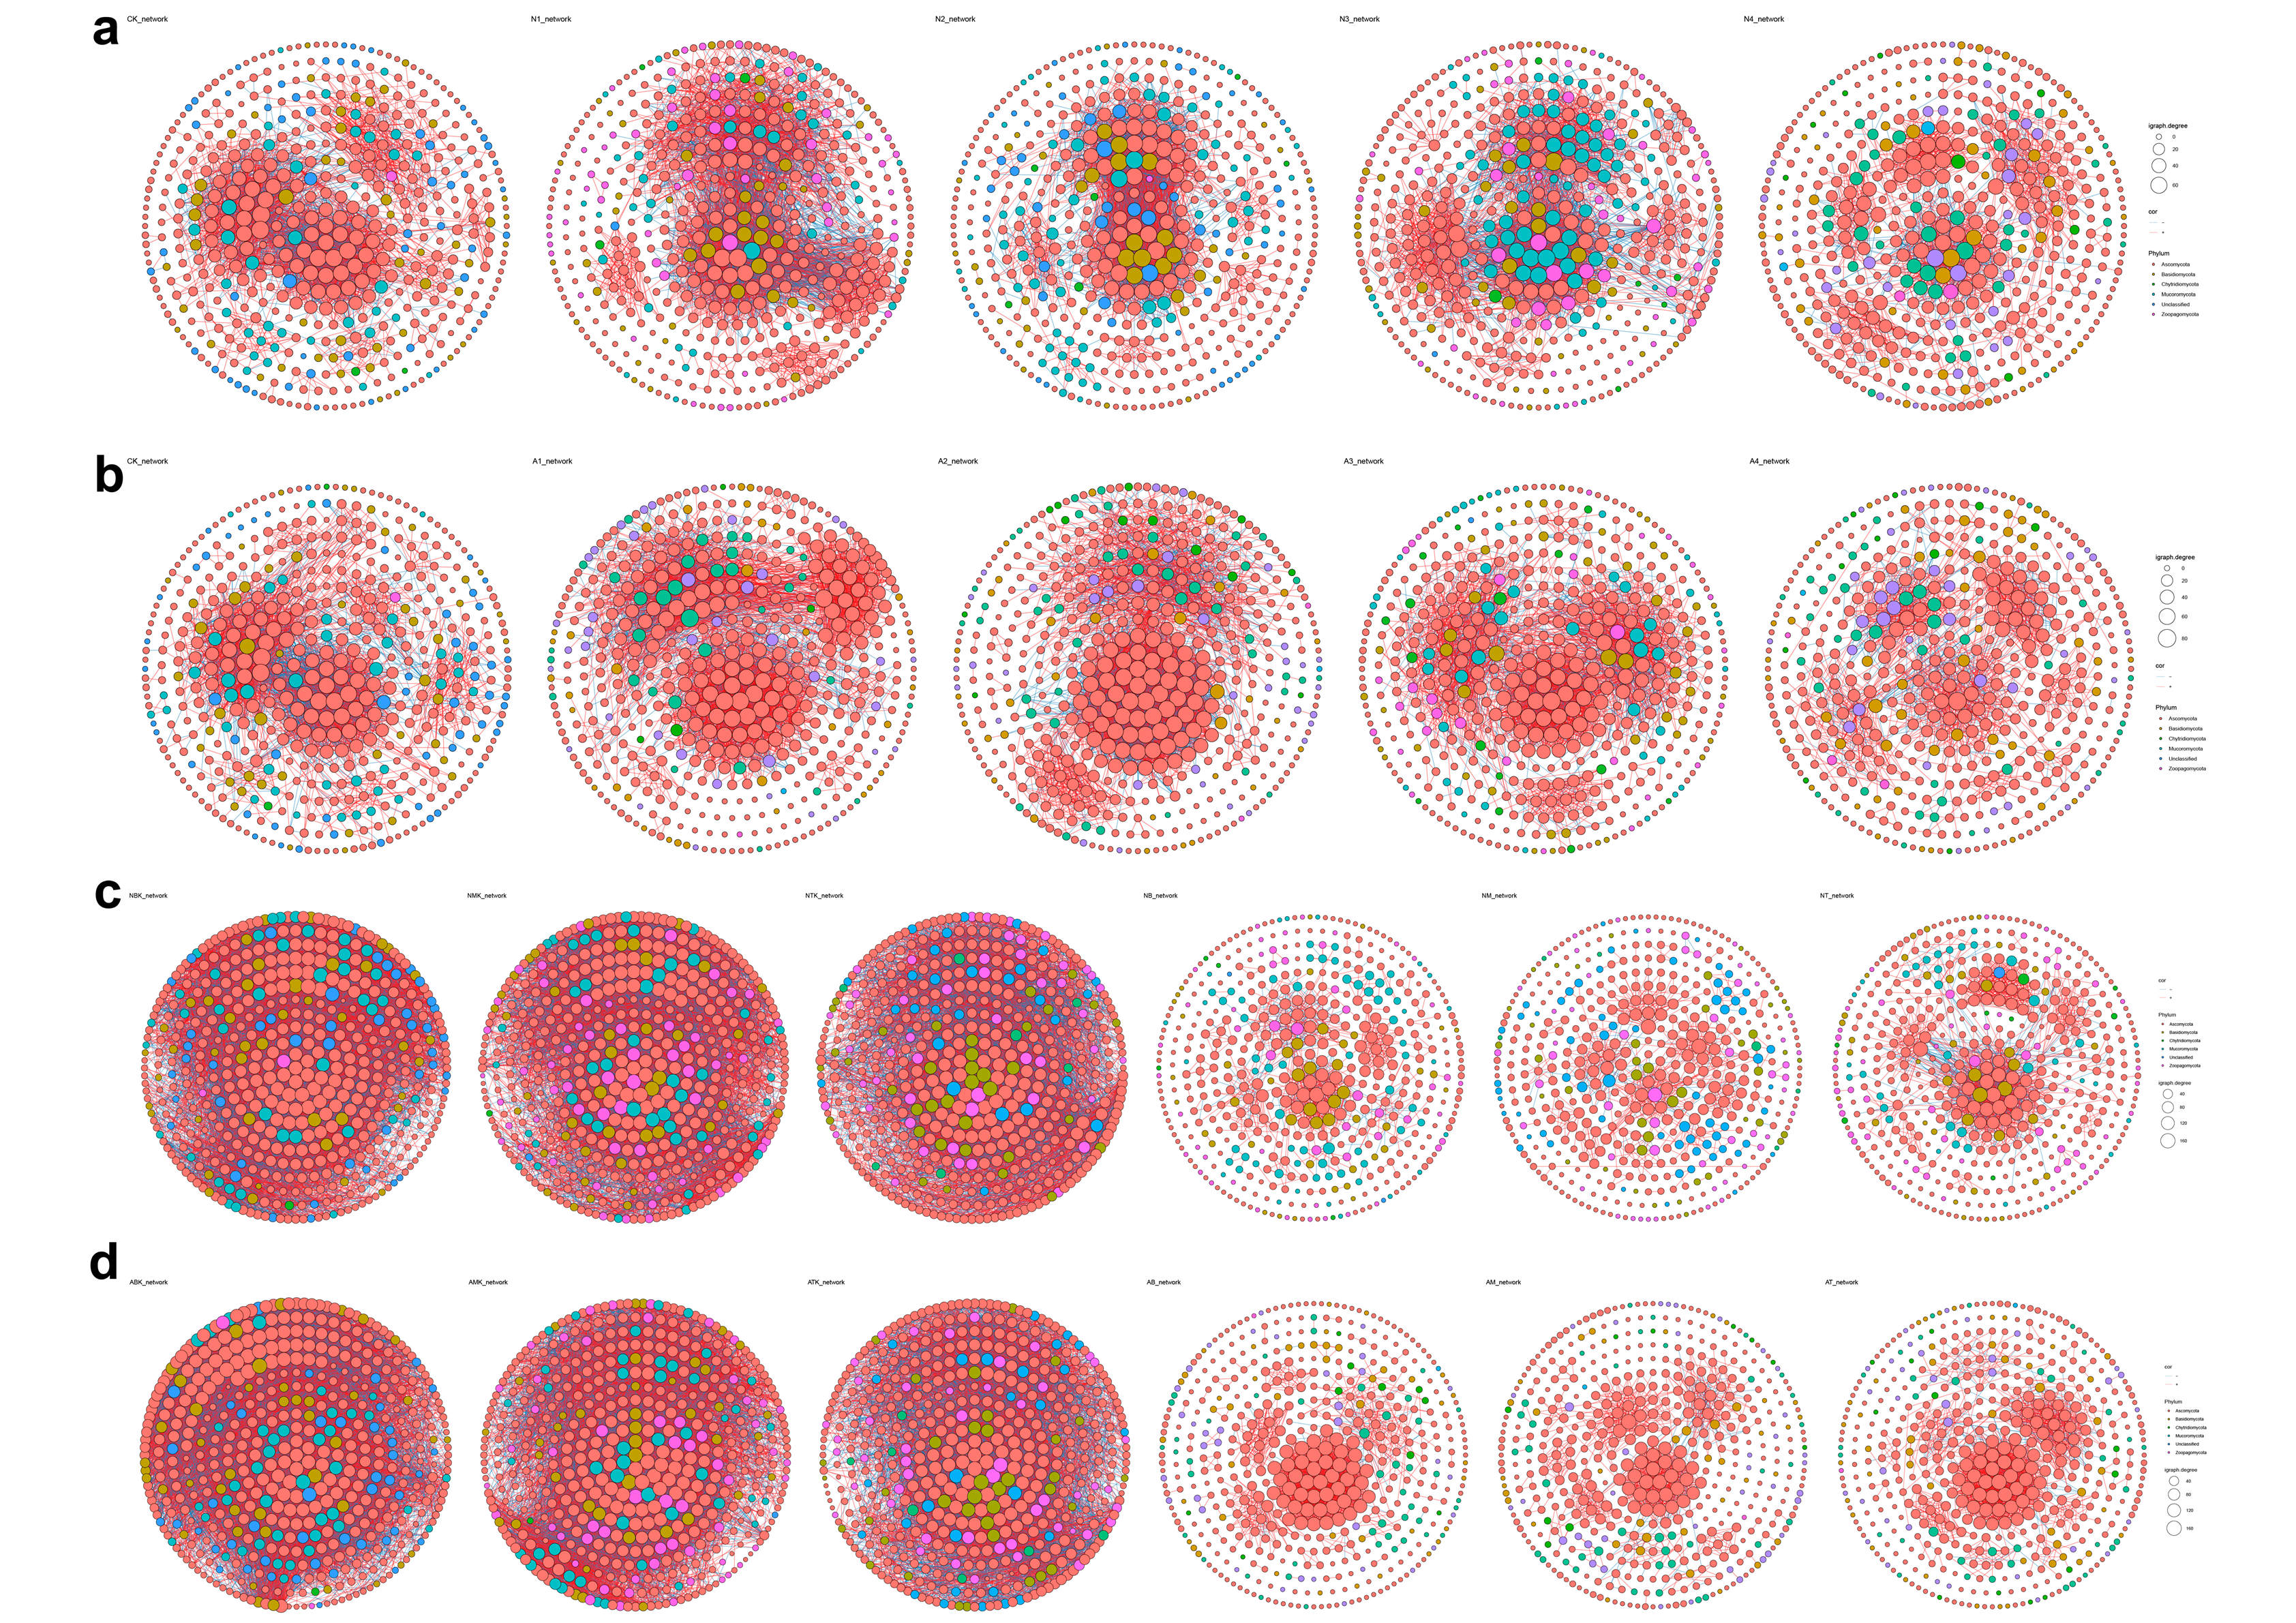
To explore the responses of soil microbial interactions to restoration regimes and PV shading, co-occurrence networks were constructed for fungal communities in both vertical and horizontal dimensions, with topological properties (density, average degree, average path length, etc.) analyzed to characterize structural differences (Figure 10, Table S4). Significant differences in network properties were observed between the restored groups and the controls. The control networks showed high density, single connectivity, short path length, and low centralization, indicating tight and stable interactions. In contrast, both recovery sites showed increased network diameter, path length, and clustering coefficient relative to the controls. However, less stable and more fragmented networks were identified in both recovery sites, suggesting a high dependence on key nodes and low resistance to disturbance. The artificial recovery area exhibited sparse and fragmented networks, with interactions dependent on a few keystone nodes. The natural recovery area showed significantly lower connectance, smaller edge numbers, and decreased density.
Vertical variations in network topology across soil layers between different recovery regimes were analyzed. Significant differences in network structure were observed between soil layers of the recovery sites and the corresponding controls. The cluster numbers, network diameters, and average path length were greater in both restored PV sites relative to the controls. Regarding the overall topology, the control networks exhibited a decreasing trend in connectance, average degree, and clustering coefficient from subsoils to topsoils. Both recovery sites showed a descending trend in density and average degree as soil depth increased. Among artificial restoration layers, the network structures of both top and middle layers remained significantly different from the corresponding controls, while the subsoils had the most similar network structure to the controls. Meanwhile, in the natural recovery area, the topsoil had a relatively intact network with partially restored interactions. The midsoil showed the lowest connectivity, longest path length, and highest centralization, and the subsoil had a sparse network but with incipient improvements in microbial interactions.
A horizontal heterogeneity effect was observed at both restored PV sites, with greater node and edge numbers in the shaded areas than in the non-shaded area. In general, PV shading positively affected the network connectivity and clustering coefficient relative to the control groups, but the network remained structurally unstable, characterized by fragmentation and dependence on core nodes. Network topologies of both recovery sites exhibited a similar pattern relative to the controls, with artificial recovery site showing greater spatial variations in the PV-shaded regions. In the artificial restoration areas, the A2 region had the highest network density, maximum clustering coefficient, and shortest average path length, which was identified as the functional core zone of this area. A1 and A3 regions served as transition zones, with moderate connectivity and intermediate structural stability. In contrast, the A4 had the sparsest network, longest average path length, and highest centralization. In the natural recovery area, all shaded regions exhibited higher density, short path lengths, and greater clustering coefficients, whereas N4 had sparse network, greater clustering, and lower centralization as compared to the shaded regions.
Additionally, spatial heterogeneity effects on network robustness, vulnerability, and negative/positive cohesion were also analyzed in both horizontal and vertical scales (Figures S6 and S7). Along the horizontal transect, both negative/positive cohesion and vulnerability of the natural restored PV area exhibited significant increase as compared to the non-PV area. However, a descending trend in robustness was identified in both restored PV areas as compared to the non-PV area. In the artificial restoration site, negative/positive cohesion and vulnerability exhibited greater variations among different observation points along the horizontal transect line (Figure S6). In the vertical scale, an overall decrease in the robustness and vulnerability were identified in both restored PV areas as compared to the non-PV area, regardless of soil depths (Figure S7). Disparities in negative/positive cohesion between the restored PV areas and non-PV area exhibited distinct patterns between top and bottom soil depths, showing a significant decrease in negative/positive cohesion at 0–5 cm soil depth in both restored PV areas.

4. Discussion

Contrasting patterns of fungal alpha diversity metrics between natural and artificial restoration measures highlighted the differential responses of soil fungi to PV infrastructures in desert steppe PV ecosystems. At the natural restoration site, the lack of significant effect on species richness may reflect their adaptability to arid conditions or dependence on different nutritional resources [58], which remained relatively unaffected by PV shading during early recovery phase. Spatial variations in fungal diversity were more significant at the artificial restoration site as compared to the non-PV area. Horizontally, the overall fungal species richness was significantly enriched at the artificial restoration site, whereas species evenness decreased relative to the non-PV area. Spatial variations in fungal α-diversity became more significant as soil depth increased. These findings align with previous studies suggesting that soil depth may mediate microbial responses to environmental changes [59]. The stability of Shannon diversity indices across treatments indicates that while species composition shifted, overall functional redundancy within microbial communities remained intact during early restoration period. Beta diversity analysis revealed that PV infrastructure significantly altered fungal community compositions under both restoration regimes, which was contrary to a prior study on grassland PV ecosystem [60]. Such discrepancies can be primarily attributed to contrasting climates and habitat conditions. Specifically, Bai et al. [60] targeted warm meadow grassland under a mid-temperate continental monsoon climate, whereas our study focuses on an arid desert steppe characterized by scarce precipitation and xerophytic vegetation. Notably, no significant variations in compositional structure were observed across soil depths or horizontal sampling points in either restoration area. Collectively, our findings indicate that PV infrastructure significantly affected the overall soil fungal beta diversity during the initial recovery period, whereas PV-panel shading did not. However, this short-term timeframe inherently imposes limitations on capturing long-term ecological processes. Fungal community succession and enzyme activity dynamics are typically slow, with continuous processes that unfold over decades. Although this resilience may mitigate potential declines in ecosystem functionality, long-term rigorous monitoring is essential to determine its durability in the face of ongoing PV infrastructure development.
The dominance of Ascomycota, Basidiomycota, and Mucoromycota reflects their ecological adaptability to arid conditions. The consistent presence of these taxonomic groups indicates their fundamental roles in nutrient cycling and organic matter decomposition, which are critical to desert steppe ecosystem functioning. Fungal community compositions differed significantly between PV and non-PV stations, with no spatial heterogeneity effects on the fungal β-diversity across restoration regimes. Ascomycota was the most dominant phylum in different fungal communities, followed by Mucoromycota and Basidiomycota. Previously, studies have confirmed that Ascomycota was most commonly found in photovoltaic ecosystems [60,61]. Ascomycota and Basidiomycota also exhibit competitive interactions [62], with Ascomycota being oligotrophic and Basidiomycota preferring copiotrophic conditions [63,64]. For example, natural revegetation in climax forest ecosystems has been shown to enrich Basidiomycota and reduce Ascomycota [65]. However, our study suggests Ascomycota may be enriched under artificial revegetation in PV ecosystems. A notable distinction in this work is that Mucoromycota abundance exceeded that of Basidiomycota. This is relevant given the recent taxonomic revision of the polyphyletic Zygomycota into Mucoromycota and Zoopagomycota [66,67]. Mucoromycota are fast-growing saprotrophs and plant-associated fungi, frequently detected at high elevations or in rhizospheres due to their low-temperature tolerance and biocomposting capabilities [68,69]. Differential fungal responses to restoration regimes and PV shadings indicated niche specialization during early ecological restoration following large-scale PV construction. At the Genus level, Fusarium, Preussia, Arthrobotrys, Mortierella, Geminibasidium, and Alternaria were identified as predominant biomarkers under different restoration regimes, with significant correlations to multiple soil enzymes. Fusarium, Mortierella, and Preussia were less abundant in artificial restoration areas but correlated with soil enzymes vertically across restoration regimes. Fusarium and Mortierella exhibit multifunctionality, with variable trophic modes enabling adaptation to environmental changes [70]. Alternaria and Mortierella offer potential benefits to plants in arid soils [71,72]. Geminibasidium and Preussia can contribute to organic matter decomposition and nutrient cycling during soil recovery [73,74]. In this study, Geminibasidium emerges as a shared biomarker of both restoration regimes associated with PV shading effect. Such shared biomarkers represent resilient functional guilds with conserved metabolic capabilities. For example, mycorrhizal and soil fungi often possess expanded genomes for oxidative stress tolerance, encoding enzymes such as cellulase, catalase, and superoxide dismutase [75,76,77]. This metabolic plasticity supports proliferation across PV-induced microclimates, particularly in shaded niches where fluctuating soil oxygen and light availability impose selective pressures.
Soil enzymes respond more rapidly to environmental changes than other soil indicators [78]. The artificial restoration site exhibited higher cellulase and phenol oxidase activities than the control. Soil depth-related enzymatic variation was greater in the control, indicating more homogeneous enzyme distribution under restoration management. The mechanisms by which these enzymes drive shifts in fungal communities involve their specific roles in key soil processes. Dehydrogenase activity reflects the oxidative stress response of microbial communities to environmental disturbances, directly influencing energy acquisition processes and thereby shaping fungal community composition [79,80]. Meanwhile, polyphenol oxidase plays a critical role in carbon cycling by decomposing complex phenolic compounds in soil organic matter [49]. Its activity regulates the availability of carbon resources, ultimately driving fungal community assembly [49,81]. Correlations between biomarkers and enzymes, which depended on restoration measures and spatial heterogeneity, provide a basis for hypothesizing mechanisms underlying microbial-mediated ecosystem processes. For example, Arthrobotrys (a Genus encompassing nematode-trapping fungi and latent saprophytes) [82,83] correlated significantly with phenol oxidase under natural restoration. In the context of soil redox dynamics, negative correlations between Chionaster/Leucosphaerina and phenol oxidase in the natural recovery site suggest these fungi occupy niches less favorable to (or potentially inhibited by) conditions promoting high phenol oxidase activity. Such evidences highlight how microbial community composition regulates carbon cycling processes during natural recovery. Catalase supports microbial aerobic activity [84] and oxygen supply in aerobic bioremediation [85]. Lower catalase activity under PV panels likely stems from shading-induced redox imbalances. This may be explained by stabilized microclimates (e.g., reduced temperature fluctuations and elevated humidity) and suppressed oxygen diffusion [86]. These factors may compromise soil oxidative stress resilience and organic matter turnover.
Microorganisms and their enzymes are critical to soil health, and PV construction can subtly but significantly alter soil thermal, moisture, and physicochemical properties [87]. During early revegetation, microbial physiological activities and community structures may shift with resource availability [88,89]. Enzyme activity varied with vegetation restoration, and catalase was one of the main factors driving soil fungal community composition in a desert ecosystem [90]. Our identification of catalase, phenol oxidase, dehydrogenase, and sucrase as key drivers highlights the importance of enzymatic activities in reshaping soil microbial communities of solar parks. These drivers may be influenced by vegetation types, soil amendments, and irrigation practices, all of which modify substrate availability and microbial–plant interactions [91]. Results suggested that sucrase content significantly decreased at both recovery sites relative to non-PV areas, which was consistent with prior desert ecosystem studies [92]. Dehydrogenase can be used as a sensitive marker of soil degradation and soil microbial activity in degraded soil [93], serving as an indicator of oxidative metabolism and soil health [15]. In this study, its positive correlation with fungal communities in the natural recovery site likely reflects roles in microbial oxidative activities [94]. Phenol oxidase decomposes complex organic macro-molecules and indicates phenolic dynamics in soils [95], with Basidiomycetes and Ascomycetes serving as primary producers during early restoration in desertified alpine meadows [96]. Our study implied that dehydrogenase and phenol oxidase collectively shape fungal communities, highlighting multifaceted restoration-mediated soil microbial dynamics. Soil depth is critical to PV ecosystem restoration, with upper layer (0–5 cm) strongly affected by surface-related processes (solar irradiance, shading, precipitation, and litter deposition) and deeper layers (5–20 cm) responding more prominently to enzyme changes driven by PV construction and restoration. Variations in microbial community composition and diversity across soil depths and shading gradients highlight the need to consider both vertical and horizontal heterogeneity in PV ecosystem management. Correlations between microbial biomarkers and enzymes demonstrate their synergistic role in sustaining desert steppe PV ecosystems functionality, necessitating long-term monitoring to forecast soil functional resilience under sustained energy infrastructure. Meanwhile, future studies will integrate soil physiochemical indicators to decipher the complex cascades of environmental changes, microbial community reassembly, and functional enzymatic responses in PV ecosystems.
Co-occurrence network analysis revealed positive edge dominance at both sites, confirming cooperative microbial networks where cooperation prevails over competition [97]. Our results suggest reduced niche competition under resource enrichment. Overall network integrity was maintained, which aligns with evidence that positive co-occurrence enhances ecosystem multifunctionality under perturbation [98]. Greater ratio between positive and negative edges at both restoration sites indicates that revegetation promotes microbial interconnectivity, likely via increased plant density and root exudation. Within these networks, keystone taxa play pivotal but distinct ecological roles (FUNGuild analysis, Figure S8). For instance, Fusarium encompasses both pathogenic strains and beneficial endophytes, capable of causing plant disease while also potentially enhancing stress tolerance [99,100,101]. Mortierella species are generally considered beneficial symbionts, contributing to plant growth promotion and nutrient acquisition [102,103]. These diverse functional attributes collectively sustain the stability and multifunctionality of the soil ecosystem during the restoration process in arid PV settings. Contrary to the control groups, peak average degree in topsoil of both restored sites emphasizes precipitation as a “biotic homogenizer”, enhancing microbial dispersal in the upper soil layers during early ecological recovery [104,105]. This moisture-driven network restructuring may reflect adaptive resilience to desert steppe climate fluctuations. In contrast, PV shading reduced network complexity at the artificial restoration site (e.g., fewer nodes and edges), suggesting artificial vegetation combined with shading disrupts cross-niche connectivity. Vertical stratification revealed distinct network architectures between restoration strategies, indicating divergent microhabitat responses to PV installation and restoration at different soil depths. Higher average degree and connectance in the artificial recovery site imply more frequent microbial interactions, enhancing short-term disturbance adaptability [106]. Greater fungal richness coupled with higher subsoil network clustering coefficient in artificial recovery area indicates microbial communities form functionally independent sub-modules to adapt to relatively stable but resource-limited deep microhabitats [98]. Higher subsoil clustering coefficient and modularity in restored sites also reflect pronounced local species aggregation and lower community stability during early post-disturbance recovery [98]. This observation also aligns with studies suggesting microbial diversity does not guarantee network complexity [107]. Notably, our findings contrast with a prior claim that soil depth does not affect fungal diversity or composition in revegetated deserts [90], providing critical insights for deciphering fungal community assembly and optimizing PV ecosystem restoration.
A trade-off between microbial resistance and resilience is well-documented [108]. Hernandez et al. [109] noted that cohesion may decrease with increasing stress. Our results suggest reduced cohesion in revegetated PV areas during early restoration in the horizontal scale, with disparity between natural and artificial restoration cohesions supporting the stress gradient hypothesis [110]. This indicates more cooperative rather than competitive interactions during artificial early recovery. Specifically, the subsoil of artificial recovery area has a structure closest to the natural state, whereas the network of upper layer in natural recovery area is relatively intact and partially reinstated. Both restoration sites exhibited sparse and fragmented networks, reflecting weak structural stability and low ecological efficiency, with functional recovery not yet achieving overall synergy. This result also copes with evidence that increased network recovery does not ensure community stability [110,111]. PV shading associated spatial variations in soil fungal networks also suggest a core functionally active zone underneath the panel and a most vulnerable zone between panel arrays. A synchronous vegetation survey found lower coverage and density under PV panels than between panel arrays (unpublished data). These findings directly guide revegetation density layout tailored to PV landscapes. While short-term observations limit definitive conclusions on density adjustment strategies, the study identifies key monitoring areas for long-term preservation of microbial network integrity during ecological restoration.
While most ecological restoration research focuses on long-term (over five years) effectiveness, studies addressing short-term (1–2 years post-construction) soil microbial dynamics remain scarce. Short-term microbial and enzymatic responses provide pivotal insights into the initial efficacy of restoration measures, as these indicators are directly related to nutrient cycling initiation and microhabitat modification. Fungal dynamic shifts serve as early bioindicators of restoration success, which cannot be captured in long-term studies alone. Elucidating these short-term microbial–enzyme interactions thus fill the gap in current restoration ecology, enabling the refinement of early-stage management strategies. However, fungal community succession and enzyme activity dynamics are typically slow, continuous processes that unfold over decades. The current results primarily reflect the initial responses of fungal communities and enzyme activities to restoration measures in PV ecosystem, rather than long-term stable trends. This limitation implies that our conclusions regarding the effectiveness of different restoration regimes should be interpreted within the context of early recovery (less than 2 years), and long-term monitoring data will validate the persistence of microbial responses and provide guidance for sustainable PV ecosystem management in arid steppe regions. Additionally, such studies will unravel the temporal dynamics of fungal community, enzyme activity, and soil development processes overlooked in this current work. Future research should also integrate lab–field experiments to elucidate causal mechanisms, optimizing plant–microbial symbioses for carbon/nutrient cycling, and incorporating socio-economic factors (e.g., land use and maintenance practices) to assess anthropogenic impacts. These integrated approaches will not only help disentangle soil microbiome complexity and mitigate inherent ecological trade-offs in arid PV ecosystems but also provide a scientific basis for sustaining the long-term functional resilience of human-modified landscapes, ultimately supporting the synergistic development of renewable energy and ecological restoration in arid steppes.

5. Conclusions

This study provides novel insights into the short-term (<2 years) spatial dynamics of soil microbial communities and enzymatic activities in response to PV construction and ecological restoration in desert steppe ecosystems during initial recovery phases. As a preliminary ecological assessment of PV ecosystem restoration, our findings reveal distinct effects of restoration regimes on soil fungal diversity: natural restoration stabilized fungal alpha diversity, while artificial restoration enhanced fungal richness but reduced evenness in the horizontal scale. PV infrastructure altered fungal beta diversity and highlighted vertical microhabitat complexity via depth-dependent fungal compositional shifts and core genera (e.g., Fusarium, Preussia, Arthrobotrys) that correlated with enzymes linked to nutrient cycling. Ascomycota dominated fungal communities (consistent with prior PV ecosystem studies), while Mucoromycota abundance exceeded that of Basidiomycota, serving as a distinct pattern from natural climax ecosystems. Enzymatic activities, particularly dehydrogenase and polyphenol oxidase, emerged as critical drivers of early-stage fungal community reassembly, emphasizing the interactions between microbial metabolism and ecosystem function. Co-occurrence network analyses revealed that neither artificial recovery nor natural recovery has attained the ecological integrity of natural habitats, with both exhibiting challenges related to fragmentation and dependence on key nodes in the networks. However, they differ in their vertical stratifications. Microbial networks of subsoil in the artificial restoration site and the upper layer in the natural restoration site are closest to natural habitats during early restoration. Additionally, the rain lines under PV panels are regions with relatively high ecological risks, thereby requiring strategic attention during restoration. Moreover, a core functionally active zone underneath the panel and a most vulnerable zone between panel arrays were identified. However, short-term observations limit definitive conclusions on plant coverage adjustment strategies; this study pinpoints key monitoring areas under the panels for long-term preservation of microbial network integrity during ecological restoration. These findings suggest that synergistic approaches combining artificial vegetation and natural succession, as a long-term goal of ecological restoration, could mitigate PV-induced ecological disruptions by promoting microbial resilience and nutrient cycling. Collectively, this work clarifies fungal community assembly in response to PV construction at initial recovery stage and provides a scientific basis for balancing renewable energy development and ecological conservation. Future research will focus on long-term monitoring of fungal–enzymatic interactions to evaluate the sustainability of restoration strategies in arid PV landscapes, while delivering integrated scientific insights to underpin interdisciplinary decision-making regarding PV infrastructure and revegetation configuration.

Supplementary Materials

The following supporting information can be downloaded at: https://www.mdpi.com/article/10.3390/land14122306/s1, Figure S1: Compositional structure of soil fungal community at phylum level. (a) Treatment groups along the transect line at natural restoration site. (b) Treatment groups of three soil depths at natural restoration site. (c) Treatment groups along the transect line at artificial restoration site. (d) Treatment groups of three soil depths at natural restoration site; Figure S2: Differences in the relative abundances of dominant fungal genera between the PV and non-PV areas in the vertical scale (p < 0.05). Figure (a,d) represents the 0–5 cm soil depth, (b,e) represents the 5–10 cm soil depth, (c,f) represent the 10–20 cm soil depth. The error bars refer to the standard errors of the means; Figure S3: Differences in relative abundance of shared core species between treatment groups. (a) Treatment groups along the transect line at natural restoration site. (b) Treatment groups along the transect line at natural restoration site. (c) Treatment groups of three soil depths at natural restoration site. (d) Treatment groups of three soil depths at artificial restoration site. Pairwise comparison was conducted using Tukey’s HSD test. Different letters indicate statistically significant differences (p < 0.05); Figure S4: Soil enzyme activities related to the horizontal heterogeneity effect in the natural (N) and artificial (A) restoration experimental stations. (a) Catalase activity; (b) Urease activity; (c) Sucrase activity; (d) Alkaline phosphatase activity; (e) Cellulase activity; (f) Dehydrogenases activity (g) Phenol oxidase activity. Data expressed as means ± SEM. * indicates statistical significance as compared to control (one-way ANOVA, post hoc Student’s t-test, p < 0.05); Figure S5: Soil enzyme activities related to the vertical heterogeneity effect in the natural (N) and artificial (A) restoration experimental stations. (a) Catalase activity; (b) Urease activity; (c) Sucrase activity; (d) Alkaline phosphatase activity; (e) Cellulase activity; (f) Dehydrogenases activity (g) Phenol oxidase activity. Data expressed as means ± SEM. * indicates statistical significance as compared to control (one-way ANOVA, post hoc Student’s t-test, p < 0.05); Figure S6: Parameters of co-occurrence networks related to horizontal heterogeneity effects. Figure (a–c) represents network indices at natural restoration site; figure (d–f) represents network indices at artificial restoration site; Figure S7: Parameters of co-occurrence networks related to vertical heterogeneity effects. Figure (a–c) represents network indices at natural restoration site; figure (d–f) represents network indices at artificial restoration site; Figure S8: Fungal functional groups inferred by FUNGuild. Figure (a,c) represents network indices at natural restoration site; figure (b,d) represent network indices at artificial restoration site; Table S1: Two-way ANOVA analysis of treatment effects on soil fungal communities’ alpha diversity indices. Analyses integrated data from all three experimental sites (control, natural restoration, and artificial restoration) (p < 0.05, n = 243). Effects of restoration measures, soil depth/shading gradient, and their interactive effects were all examined (p < 0.05, n = 243); Table S2: Two-way ANOVA analysis of treatment effects on soil fungal communities’ alpha diversity indices. Analyses integrated data from the control and one restoration site) (p < 0.05, n = 135). Horizontal effects on fungal diversity were also examined. Effects of restoration measures, soil depth/shading gradient, and their interactive effects were all examined (p < 0.05, n=135); Table S3: Two-way ANOVA analysis of treatment effects on soil fungal communities’ alpha diversity indices. Analyses integrated data from the control and one restoration site) (p < 0.05, n = 135). Vertical effects on fungal diversity were also examined. Effects of restoration measures, soil depth/shading gradient, and their interactive effects were all examined (p < 0.05, n = 135); Table S4: The network properties of the co-occurrence networks of soil fungal communities in the natural (N) and artificial (A) restoration sites. K represents the control treatment as the undisturbed natural ecosystem. Number 1–4 correspond to different observation points along the horizontal transect line.

Author Contributions

Z.W., W.Z., B.J. and Q.J. were responsible for the conception and design of the study; W.Z. and B.J. executed the sample collection; W.Z. and G.N. conducted the data validation and formal analysis; W.Z. prepared the original writing of the manuscript; W.Z. and G.N. conducted a critical editing and review of the manuscript; funding acquisition was through Q.J., Z.W., W.Z. and B.J. All authors have read and agreed to the published version of the manuscript.

Funding

This study was supported by the Key R&D Program of Ningxia (China) (2023BCF01019), Seed Grant of Ningxia Academy of Agriculture and Forestry Sciences (China) (NKYJ-22-04), and Grant of Ningxia Forestry and Grassland Bureau (China) (HLBY-2025-JF026).

Data Availability Statement

Raw sequence reads were submitted to the BIG submission portal in the BioProject archive under project number PRJCA043648.

Acknowledgments

We would like to thank Ming Meng and Bingrao Wang for their help with sample collections.

Conflicts of Interest

The authors declare no conflicts of interest.

References

  1. Liu, Z.; Peng, T.; Ma, S.; Qi, C.; Song, Y.; Zhang, C.; Li, K.; Gao, N.; Pu, M.; Wang, X.; et al. Potential benefits and risks of solar photovoltaic power plants on arid and semi-arid ecosystems: An assessment of soil microbial and plant communities. Front. Microbiol. 2023, 14, 1190650. [Google Scholar] [CrossRef]
  2. Turney, D.; Fthenakis, V. Environmental impacts from the installation and operation of large-scale solar power plants. Renew. Sustain. Energy Rev. 2011, 15, 3261–3270. [Google Scholar] [CrossRef]
  3. Wu, C.; Liu, H.; Yu, Y.; Zhao, W.; Liu, J.; Yu, H.; Yetemen, O. Ecohydrological effects of photovoltaic solar farms on soil microclimates and moisture regimes in arid Northwest China: A modeling study. Sci. Total Environ. 2022, 802, 149946. [Google Scholar] [CrossRef]
  4. Liu, Y.; Zhang, J.; Mu, R.; Wang, D.; Wang, Z.; An, J.; Li, X. Effects of Two Ecological Governance Measures for Photovoltaic Power Stations on Plant Growth and Soil Nutrients. Plants 2025, 14, 797. [Google Scholar] [CrossRef]
  5. Lambert, Q.; Bischoff, A.; Cueff, S.; Cluchier, A.; Gros, R. Effects of solar park construction and solar panels on soil quality, microclimate, CO effluxes, and vegetation under a Mediterranean climate. Land Degrad. Dev. 2021, 32, 5190–5202. [Google Scholar] [CrossRef]
  6. Huang, Y.; Yesilonis, I.; Szlavecz, K. Soil microarthropod communities of urban green spaces in Baltimore, Maryland, USA. Urban For. Urban Green. 2020, 53, 126676. [Google Scholar] [CrossRef]
  7. Li, Y.; Armstrong, A.; Simmons, C.; Krasner, N.Z.; Hernandez, R.R. Ecological impacts of single-axis photovoltaic solar energy with periodic mowing on microclimate and vegetation. Front. Sustain. 2025, 6, 1497256. [Google Scholar] [CrossRef]
  8. Armstrong, A.; Waldron, S.; Whitaker, J.; Ostle, N.J. Wind farm and solar park effects on plant-soil carbon cycling: Uncertain impacts of changes in ground-level microclimate. Glob. Chang. Biol. 2014, 20, 1699–1706. [Google Scholar] [CrossRef] [PubMed]
  9. Suuronen, A.; Muñoz-Escobar, C.; Lensu, A.; Kuitunen, M.; Guajardo Celis, N.; Espinoza Astudillo, P.; Ferrú, M.; Taucare-Ríos, A.; Miranda, M.; Kukkonen, J.V.K. The Influence of Solar Power Plants on Microclimatic Conditions and the Biotic Community in Chilean Desert Environments. Environ. Manag. 2017, 60, 630–642. [Google Scholar] [CrossRef] [PubMed]
  10. Li, Y.; Kalnay, E.; Motesharrei, S.; Rivas, J.; Kucharski, F.; Kirk-Davidoff, D.; Bach, E.; Zeng, N. Climate model shows large-scale wind and solar farms in the Sahara increase rain and vegetation. Science 2018, 361, 1019–1022. [Google Scholar] [CrossRef]
  11. Yavari, R.; Zaliwciw, D.; Cibin, R.; McPhillips, L. Minimizing environmental impacts of solar farms: A review of current science on landscape hydrology and guidance on stormwater management. Environ. Res. Infrastruct. Sustain. 2022, 2, 032002. [Google Scholar] [CrossRef]
  12. Tanner, K.E.; Moore-O’Leary, K.A.; Parker, I.M.; Pavlik, B.M.; Hernandez, R.R. Simulated solar panels create altered microhabitats in desert landforms. Ecosphere 2020, 11, e03089. [Google Scholar] [CrossRef]
  13. Lioubimtseva, E.; Cole, R. Uncertainties of Climate Change in Arid Environments of Central Asia. Rev. Fish. Sci. 2006, 14, 29–49. [Google Scholar] [CrossRef]
  14. Wang, Z.; Xiong, H.; Zhang, F.; Qiu, Y.; Ma, C. Sustainable development assessment of ecological vulnerability in arid areas under the influence of multiple indicators. J. Clean. Prod. 2024, 436, 140629. [Google Scholar] [CrossRef]
  15. Bhaduri, D.; Sihi, D.; Bhowmik, A.; Verma, B.C.; Munda, S.; Dari, B. A review on effective soil health bio-indicators for ecosystem restoration and sustainability. Front. Microbiol. 2022, 13, 938481. [Google Scholar] [CrossRef] [PubMed]
  16. Wu, W.; Chen, H.; Li, C.; Lu, G.; Ye, D.; Ma, C.; Ren, L.; Li, G. Assessment of the ecological and environmental effects of large-scale photovoltaic development in desert areas. Sci. Rep. 2024, 14, 22456. [Google Scholar] [CrossRef]
  17. Dilixiati, B.; Wang, H.; Gong, L.; Wei, J.; Lei, C.; Dang, L.; Zhang, X.; Gu, W.; Zhang, H.; Zhang, J. Land Use Dynamics and Ecological Effects of Photovoltaic Development in Xinjiang: A Remote Sensing and Geospatial Analysis. Land 2025, 14, 1294. [Google Scholar] [CrossRef]
  18. Marrou, H.; Guilioni, L.; Dufour, L.; Dupraz, C.; Wery, J. Microclimate under agrivoltaic systems: Is crop growth rate affected in the partial shade of solar panels? Agric. For. Meteorol. 2013, 177, 117–132. [Google Scholar] [CrossRef]
  19. AL-agele, H.A.; Proctor, K.; Murthy, G.; Higgins, C. A Case Study of Tomato (Solanum lycopersicon var. Legend) Production and Water Productivity in Agrivoltaic Systems. Sustainability 2021, 13, 2850. [Google Scholar] [CrossRef]
  20. Barron-Gafford, G.A.; Pavao-Zuckerman, M.A.; Minor, R.L.; Sutter, L.F.; Barnett-Moreno, I.; Blackett, D.T.; Thompson, M.; Dimond, K.; Gerlak, A.K.; Nabhan, G.P.; et al. Agrivoltaics provide mutual benefits across the food–energy–water nexus in drylands. Nat. Sustain. 2019, 2, 848–855. [Google Scholar] [CrossRef]
  21. Fagnano, M.; Fiorentino, N.; Visconti, D.; Baldi, G.M.; Falce, M.; Acutis, M.; Genovese, M.; Di Blasi, M. Effects of a Photovoltaic Plant on Microclimate and Crops’ Growth in a Mediterranean Area. Agronomy 2024, 14, 466. [Google Scholar] [CrossRef]
  22. Zheng, J.; Luo, Y.; Chang, R.; Gao, X. An observational study on the microclimate and soil thermal regimes under solar photovoltaic arrays. Sol. Energy 2023, 266, 112159. [Google Scholar] [CrossRef]
  23. Yue, S.; Guo, M.; Zou, P.; Wu, W.; Zhou, X. Effects of photovoltaic panels on soil temperature and moisture in desert areas. Environ. Sci. Pollut. Res. 2021, 28, 17506–17518. [Google Scholar] [CrossRef]
  24. Wallace, J.S. Increasing agricultural water use efficiency to meet future food production. Agric. Ecosyst. Environ. 2000, 82, 105–119. [Google Scholar] [CrossRef]
  25. Zhang, C.; Lei, S.; Wu, H.; Liao, L.; Wang, X.; Zhang, L.; Liu, G.; Wang, G.; Fang, L.; Song, Z. Simplified microbial network reduced microbial structure stability and soil functionality in alpine grassland along a natural aridity gradient. Soil Biol. Biochem. 2024, 191, 109366. [Google Scholar] [CrossRef]
  26. Luo, S.-P.; He, B.-H.; Zeng, Q.-P.; Li, N.-J.; Yang, L. Effects of seasonal variation on soil microbial community structure and enzyme activity in a Masson pine forest in Southwest China. J. Mt. Sci. 2020, 17, 1398–1409. [Google Scholar] [CrossRef]
  27. Pedrinho, A.; Mendes, L.W.; de Araujo Pereira, A.P.; Araujo, A.S.F.; Vaishnav, A.; Karpouzas, D.G.; Singh, B.K. Soil microbial diversity plays an important role in resisting and restoring degraded ecosystems. Plant Soil 2024, 500, 325–349. [Google Scholar] [CrossRef]
  28. Bissett, A.; Brown, M.V.; Siciliano, S.D.; Thrall, P.H. Microbial community responses to anthropogenically induced environmental change: Towards a systems approach. Ecol. Lett. 2013, 16, 128–139. [Google Scholar] [CrossRef]
  29. Wagg, C.; Hautier, Y.; Pellkofer, S.; Banerjee, S.; Schmid, B.; van der Heijden, M.G. Diversity and asynchrony in soil microbial communities stabilizes ecosystem functioning. eLife 2021, 10, e62813. [Google Scholar] [CrossRef] [PubMed]
  30. Delgado-Baquerizo, M.; Reich, P.B.; Trivedi, C.; Eldridge, D.J.; Abades, S.; Alfaro, F.D.; Bastida, F.; Berhe, A.A.; Cutler, N.A.; Gallardo, A.; et al. Multiple elements of soil biodiversity drive ecosystem functions across biomes. Nat. Ecol. Evol. 2020, 4, 210–220. [Google Scholar] [CrossRef]
  31. Mori, A.S.; Isbell, F.; Fujii, S.; Makoto, K.; Matsuoka, S.; Osono, T. Low multifunctional redundancy of soil fungal diversity at multiple scales. Ecol. Lett. 2016, 19, 249–259. [Google Scholar] [CrossRef]
  32. Philippot, L.; Raaijmakers, J.M.; Lemanceau, P.; van der Putten, W.H. Going back to the roots: The microbial ecology of the rhizosphere. Nat. Rev. Microbiol. 2013, 11, 789–799. [Google Scholar] [CrossRef] [PubMed]
  33. Handa, I.T.; Aerts, R.; Berendse, F.; Berg, M.P.; Bruder, A.; Butenschoen, O.; Chauvet, E.; Gessner, M.O.; Jabiol, J.; Makkonen, M.; et al. Consequences of biodiversity loss for litter decomposition across biomes. Nature 2014, 509, 218–221. [Google Scholar] [CrossRef]
  34. Allison, S.D.; Martiny, J.B. Colloquium paper: Resistance, resilience, and redundancy in microbial communities. Proc. Natl. Acad. Sci. USA 2008, 105 (Suppl. S1), 11512–11519. [Google Scholar] [CrossRef] [PubMed]
  35. Wyszkowska, J.; Wyszkowski, M. Activity of Soil Dehydrogenases, Urease, and Acid and Alkaline Phosphatases in Soil Polluted with Petroleum. J. Toxicol. Environ. Health Part A 2010, 73, 1202–1210. [Google Scholar] [CrossRef] [PubMed]
  36. Karaca, A.; Cetin, S.C.; Turgay, O.C.; Kizilkaya, R. Soil Enzymes as Indication of Soil Quality. In Soil Enzymology; Shukla, G., Varma, A., Eds.; Springer: Berlin/Heidelberg, Germany, 2011; pp. 119–148. [Google Scholar]
  37. Piotrowska-Długosz, A.; Kobierski, M.; Długosz, J. Enzymatic Activity and Physicochemical Properties of Soil Profiles of Luvisols. Materials 2021, 14, 6364. [Google Scholar] [CrossRef]
  38. Bueis, T.; Turrión, M.B.; Bravo, F.; Pando, V.; Muscolo, A. Factors determining enzyme activities in soils under Pinus halepensis and Pinus sylvestris plantations in Spain: A basis for establishing sustainable forest management strategies. Ann. For. Sci. 2018, 75, 34. [Google Scholar] [CrossRef]
  39. Hu, R.; Wang, X.-P.; Zhang, Y.-F.; Shi, W.; Jin, Y.-X.; Chen, N. Insight into the influence of sand-stabilizing shrubs on soil enzyme activity in a temperate desert. Catena 2016, 137, 526–535. [Google Scholar] [CrossRef]
  40. Wolińska, A.M.; Stępniewska, Z. Dehydrogenase Activity in the Soil Environment. In Dehydrogenases; Canuto, R.A., Ed.; IntechOpen: London, UK, 2012. [Google Scholar]
  41. Zhang, X.; Zheng, Y.; Yang, Y.; Ren, H.; Liu, J. Spatiotemporal evolution of ecological vulnerability on the Loess Plateau. Ecol. Indic. 2025, 170, 113060. [Google Scholar] [CrossRef]
  42. Chen, H.; Wu, W.; Li, C.; Lu, G.; Ye, D.; Ma, C.; Ren, L.; Li, G. Ecological and environmental effects of global photovoltaic power plants: A meta-analysis. J. Environ. Manag. 2025, 373, 123785. [Google Scholar] [CrossRef]
  43. Cui, Y.; Fang, L.; Guo, X.; Han, F.; Ju, W.; Ye, L.; Wang, X.; Tan, W.; Zhang, X. Natural grassland as the optimal pattern of vegetation restoration in arid and semi-arid regions: Evidence from nutrient limitation of soil microbes. Sci. Total Environ. 2019, 648, 388–397. [Google Scholar] [CrossRef]
  44. Alef, K.; Nannipieri, P. 7—Enzyme activities. In Methods in Applied Soil Microbiology and Biochemistry; Alef, K., Nannipieri, P., Eds.; Academic Press: London, UK, 1995; pp. 311–373. [Google Scholar]
  45. Tabatabai, M.A.; Bremner, J.M. Use of p-nitrophenyl phosphate for assay of soil phosphatase activity. Soil Biol. Biochem. 1969, 1, 301–307. [Google Scholar] [CrossRef]
  46. Kadhum, M.A.; Hadwan, M.H. A precise and simple method for measuring catalase activity in biological samples. Chem. Pap. 2021, 75, 1669–1678. [Google Scholar] [CrossRef]
  47. Semenov, A.M.; Batomunkueva, B.P.; Nizovtseva, D.V.; Panikov, N.S. Method of determination of cellulase activity in soils and in microbial cultures, and its calibration. J. Microbiol. Methods 1996, 24, 259–267. [Google Scholar] [CrossRef]
  48. Gong, P. Dehydrogenase activity in soil: A comparison between the TTC and INT assay under their optimum conditions. Soil Biol. Biochem. 1997, 29, 211–214. [Google Scholar] [CrossRef]
  49. He, Y.; Wang, Z.; Zhu, J.; Lin, X.; Qi, J. Soil Carbon Sequestration: Role of Fe Oxides and Polyphenol Oxidase Across Temperature and Cultivation Systems. Plants 2025, 14, 927. [Google Scholar] [CrossRef] [PubMed]
  50. Magoč, T.; Salzberg, S.L. FLASH: Fast length adjustment of short reads to improve genome assemblies. Bioinformatics 2011, 27, 2957–2963. [Google Scholar] [CrossRef] [PubMed]
  51. Liu, Y.X.; Chen, L.; Ma, T.; Li, X.; Zheng, M.; Zhou, X.; Chen, L.; Qian, X.; Xi, J.; Lu, H.; et al. EasyAmplicon: An easy-to-use, open-source, reproducible, and community-based pipeline for amplicon data analysis in microbiome research. Imeta 2023, 2, e83. [Google Scholar] [CrossRef]
  52. Edgar, R.C. Search and clustering orders of magnitude faster than BLAST. Bioinformatics 2010, 26, 2460–2461. [Google Scholar] [CrossRef]
  53. Oksanen, J.; Blanchet, F.G.; Friendly, M.; Kindt, R.; Legendre, P.; McGlinn, D.; Minchin, P.; O’Hara, R.; Simpson, G.; Solymos, P.; et al. Vegan: Community Ecology Package; R package Version 2.5-6; Community Ecol. Package Version. 2019. Available online: https://www.mcglinnlab.org/publication/2019-01-01_oksanen_vegan_2019/ (accessed on 19 November 2025).
  54. RStudioTeam. RStudio: Integrated Development Environment for R; RstudioTeam: Boston, MA, USA, 2023. [Google Scholar]
  55. Wickham, H.; Chang, W.; Henry, L.; Pedersen, T.L.; Takahashi, K.; Wilke, C.; Woo, K.; Yutani, H.; Dunnington, D. R Package “ggplot2”, v3.4.4. Elegant Graphics for Data Analysis; The R Foundation: Vienna, Austria, 2023.
  56. Nguyen, N.H.; Song, Z.; Bates, S.T.; Branco, S.; Tedersoo, L.; Menke, J.; Schilling, J.S.; Kennedy, P.G. FUNGuild: An open annotation tool for parsing fungal community datasets by ecological guild. Fungal Ecol. 2016, 20, 241–248. [Google Scholar] [CrossRef]
  57. Wen, T.; Xie, P.; Yang, S.; Niu, G.; Liu, X.; Ding, Z.; Xue, C.; Liu, Y.-X.; Shen, Q.; Yuan, J. ggClusterNet: An R package for microbiome network analysis and modularity-based multiple network layouts. iMeta 2022, 1, e32. [Google Scholar] [CrossRef]
  58. Purahong, W.; Wubet, T.; Lentendu, G.; Schloter, M.; Pecyna, M.J.; Kapturska, D.; Hofrichter, M.; Krüger, D.; Buscot, F. Life in leaf litter: Novel insights into community dynamics of bacteria and fungi during litter decomposition. Mol. Ecol. 2016, 25, 4059–4074. [Google Scholar] [CrossRef]
  59. Lambert, Q.; Gros, R.; Bischoff, A. Ecological restoration of solar park plant communities and the effect of solar panels. Ecol. Eng. 2022, 182, 106722. [Google Scholar] [CrossRef]
  60. Bai, Z.; Jia, A.; Bai, Z.; Qu, S.; Zhang, M.; Kong, L.; Sun, R.; Wang, M. Photovoltaic panels have altered grassland plant biodiversity and soil microbial diversity. Front. Microbiol. 2022, 13, 1065899. [Google Scholar] [CrossRef] [PubMed]
  61. Zhao, L.; Xu, S.; Zhao, J.; Chen, S.; Liu, X.; Zheng, X.; Wang, X.; Zhu, Z.; Gao, F.; Fu, B.; et al. Soil microbial networks’ complexity as a primary driver of multifunctionality in photovoltaic power plants in the northwest region of China. Front. Microbiol. 2025, 16, 1579497. [Google Scholar] [CrossRef]
  62. Huang, C.; Wu, X.; Liu, X.; Fang, Y.; Liu, L.; Wu, C. Functional fungal communities dominate wood decomposition and are modified by wood traits in a subtropical forest. Sci. Total Environ. 2022, 806, 151377. [Google Scholar] [CrossRef]
  63. Sterkenburg, E.; Bahr, A.; Brandström Durling, M.; Clemmensen, K.E.; Lindahl, B.D. Changes in fungal communities along a boreal forest soil fertility gradient. New Phytol. 2015, 207, 1145–1158. [Google Scholar] [CrossRef]
  64. Yang, W.; Zhang, D.; Cai, X.; Xia, L.; Luo, Y.; Cheng, X.; An, S. Significant alterations in soil fungal communities along a chronosequence of Spartina alterniflora invasion in a Chinese Yellow Sea coastal wetland. Sci. Total Environ. 2019, 693, 133548. [Google Scholar] [CrossRef] [PubMed]
  65. Yang, W.; Diao, L.; Wang, Y.; Yang, X.; Zhang, H.; Wang, J.; Luo, Y.; An, S.; Cheng, X. Responses of soil fungal communities and functional guilds to ~160 years of natural revegetation in the Loess Plateau of China. Front. Microbiol. 2022, 13, 967565. [Google Scholar] [CrossRef] [PubMed]
  66. Adamczyk, M.; Hagedorn, F.; Wipf, S.; Donhauser, J.; Vittoz, P.; Rixen, C.; Frossard, A.; Theurillat, J.-P.; Frey, B. The Soil Microbiome of GLORIA Mountain Summits in the Swiss Alps. Front. Microbiol. 2019, 10, 1080. [Google Scholar] [CrossRef]
  67. Spatafora, J.W.; Chang, Y.; Benny, G.L.; Lazarus, K.; Smith, M.E.; Berbee, M.L.; Bonito, G.; Corradi, N.; Grigoriev, I.; Gryganskyi, A.; et al. A phylum-level phylogenetic classification of zygomycete fungi based on genome-scale data. Mycologia 2016, 108, 1028–1046. [Google Scholar] [CrossRef]
  68. Frey, B.; Rime, T.; Phillips, M.; Stierli, B.; Hajdas, I.; Widmer, F.; Hartmann, M. Microbial diversity in European alpine permafrost and active layers. FEMS Microbiol. Ecol. 2016, 92, fiw018. [Google Scholar] [CrossRef]
  69. Bonfante, P.; Venice, F. Mucoromycota: Going to the roots of plant-interacting fungi. Fungal Biol. Rev. 2020, 34, 100–113. [Google Scholar] [CrossRef]
  70. Porras-Alfaro, A.; Bayman, P. Hidden fungi, emergent properties: Endophytes and microbiomes. Annu. Rev. Phytopathol. 2011, 49, 291–315. [Google Scholar] [CrossRef]
  71. Ndinga-Muniania, C.; Mueller, R.C.; Kuske, C.R.; Porras-Alfaro, A. Seasonal variation and potential roles of dark septate fungi in an arid grassland. Mycologia 2021, 113, 1181–1198. [Google Scholar] [CrossRef]
  72. Legeay, J.; Basiru, S.; Ziami, A.; Errafii, K.; Hijri, M. Response of Alternaria and Fusarium Species to Low Precipitation in a Drought-Tolerant Plant in Morocco. Microb. Ecol. 2024, 87, 127. [Google Scholar] [CrossRef]
  73. Nguyen, H.D.T.; Nickerson, N.L.; Seifert, K.A. Basidioascus and Geminibasidium: A new lineage of heat-resistant and xerotolerant basidiomycetes. Mycologia 2013, 105, 1231–1250. [Google Scholar] [CrossRef] [PubMed]
  74. Noh, H.; Cho, H.U.; Kim, S.H. Preussia jejuensis sp. nov., P. koreensis sp. nov., and P. isomera, Coprophilous Fungi Isolated from Horse Dung in Seopjikoji, Jeju Island in the Republic of Korea. Mycobiology 2025, 53, 200–213. [Google Scholar] [CrossRef]
  75. Branco, S.; Schauster, A.; Liao, H.-L.; Ruytinx, J. Mechanisms of stress tolerance and their effects on the ecology and evolution of mycorrhizal fungi. New Phytol. 2022, 235, 2158–2175. [Google Scholar] [CrossRef] [PubMed]
  76. Helal, G.A.; Khalil, R.R.; Galal, Y.G.; Soliman, S.M.; Abd Elkader, R.S. Studies on cellulases of some cellulose-degrading soil fungi. Arch. Microbiol. 2021, 204, 65. [Google Scholar] [CrossRef] [PubMed]
  77. Asemoloye, M.D.; Ahmad, R.; Jonathan, S.G. Transcriptomic responses of catalase, peroxidase and laccase encoding genes and enzymatic activities of oil spill inhabiting rhizospheric fungal strains. Environ. Pollut. 2018, 235, 55–64. [Google Scholar] [CrossRef]
  78. Neemisha; Sharma, S. Soil Enzymes and Their Role in Nutrient Cycling. In Structure and Functions of Pedosphere; Giri, B., Kapoor, R., Wu, Q.-S., Varma, A., Eds.; Springer Nature: Singapore, 2022; pp. 173–188. [Google Scholar]
  79. Tang, X.; Yang, J.; Lin, D.; Lin, H.; Xiao, X.; Chen, S.; Huang, Y.; Qian, X. Community assembly of ectomycorrhizal fungal communities in pure and mixed Pinus massoniana forests. J. Environ. Manag. 2024, 362, 121312. [Google Scholar] [CrossRef]
  80. Guo, H.; Liu, W.; Xie, Y.; Wang, Z.; Huang, C.; Yi, J.; Yang, Z.; Zhao, J.; Yu, X.; Sibirina, L.A. Soil microbiome of shiro reveals the symbiotic relationship between Tricholoma bakamatsutake and Quercus mongolica. Front. Microbiol. 2024, 15, 1361117. [Google Scholar] [CrossRef]
  81. Ge, S.; Gao, J.; Chang, D.; He, T.; Cai, H.; Wang, M.; Li, C.; Luo, Z.; E, Y.; Meng, J.; et al. Biochar contributes to resistance against root rot disease by stimulating soil polyphenol oxidase. Biochar 2023, 5, 55. [Google Scholar] [CrossRef]
  82. Niu, X.-M.; Zhang, K.-Q. Arthrobotrys oligospora: A model organism for understanding the interaction between fungi and nematodes. Mycology 2011, 2, 59–78. [Google Scholar] [CrossRef]
  83. Zhang, F.; Boonmee, S.; Bhat, J.D.; Xiao, W.; Yang, X.-Y. New Arthrobotrys Nematode-Trapping Species (Orbiliaceae) from Terrestrial Soils and Freshwater Sediments in China. J. Fungi 2022, 8, 671. [Google Scholar] [CrossRef] [PubMed]
  84. García-Gil, J.C.; Plaza, C.; Soler-Rovira, P.; Polo, A. Long-term effects of municipal solid waste compost application on soil enzyme activities and microbial biomass. Soil Biol. Biochem. 2000, 32, 1907–1913. [Google Scholar] [CrossRef]
  85. Kaushal, J.; Mehandia, S.; Singh, G.; Raina, A.; Arya, S.K. Catalase enzyme: Application in bioremediation and food industry. Biocatal. Agric. Biotechnol. 2018, 16, 192–199. [Google Scholar] [CrossRef]
  86. Sun, J.; Cui, W.; Wang, W.; Yang, X. The microclimatic and ecohydrological effects of photovoltaic facilities in arid/semi-arid regions of China: An integrated modeling study. J. Environ. Manag. 2025, 382, 125395. [Google Scholar] [CrossRef]
  87. Chen, S.; Wang, W.; Xu, W.; Wang, Y.; Wan, H.; Chen, D.; Tang, Z.; Tang, X.; Zhou, G.; Xie, Z.; et al. Plant diversity enhances productivity and soil carbon storage. Proc. Natl. Acad. Sci. USA 2018, 115, 4027–4032. [Google Scholar] [CrossRef]
  88. Lladó, S.; López-Mondéjar, R.; Baldrian, P. Drivers of microbial community structure in forest soils. Appl. Microbiol. Biotechnol. 2018, 102, 4331–4338. [Google Scholar] [CrossRef] [PubMed]
  89. Yang, Y.; Cheng, H.; Liu, L.; Dou, Y.; An, S. Comparison of soil microbial community between planted woodland and natural grass vegetation on the Loess Plateau. For. Ecol. Manag. 2020, 460, 117817. [Google Scholar] [CrossRef]
  90. Zhang, Y.; Cao, H.; Zhao, P.; Wei, X.; Ding, G.; Gao, G.; Shi, M. Vegetation Restoration Alters Fungal Community Composition and Functional Groups in a Desert Ecosystem. Front. Environ. Sci. 2021, 9, 589068. [Google Scholar] [CrossRef]
  91. Acosta-Martínez, V.; Zobeck, T.M.; Gill, T.E.; Kennedy, A.C. Enzyme activities and microbial community structure in semiarid agricultural soils. Biol. Fertil. Soils 2003, 38, 216–227. [Google Scholar] [CrossRef]
  92. Zhang, Z.-S.; Dong, X.-J.; Liu, Y.-B.; Li, X.-R.; Jia, R.-L.; Hu, Y.-G.; He, M.-Z.; Huang, L. Soil oxidases recovered faster than hydrolases in a 50-year chronosequence of desert revegetation. Plant Soil 2012, 358, 275–287. [Google Scholar] [CrossRef]
  93. Garcia, C.; Hernandez, T.; Costa, F. Potential use of dehydrogenase activity as an index of microbial activity in degraded soils. Commun. Soil Sci. Plant Anal. 1997, 28, 123–134. [Google Scholar] [CrossRef]
  94. Camiña, F.; Trasar-Cepeda, C.; Gil-Sotres, F.; Leirós, C. Measurement of dehydrogenase activity in acid soils rich in organic matter. Soil Biol. Biochem. 1998, 30, 1005–1011. [Google Scholar] [CrossRef]
  95. Sinsabaugh, R.L. Phenol oxidase, peroxidase and organic matter dynamics of soil. Soil Biol. Biochem. 2010, 42, 391–404. [Google Scholar] [CrossRef]
  96. Liu, L.; Zeng, K.; Wu, N.; Zhang, X.; Sun, F.; Chen, D.; Gao, W.; Zhou, J.; Zhao, J.; You, C.; et al. Variation in physicochemical and biochemical soil properties among different plant species treatments early in the restoration of a desertified alpine meadow. Land Degrad. Dev. 2019, 30, 1889–1903. [Google Scholar] [CrossRef]
  97. Zhao, M.; Jiang, M.; Qin, L.; Hu, N.; Meng, J.; Wang, M.; Wang, G. The recovery of soil eukaryotic alpha and beta diversity after wetland restoration. Sci. Total Environ. 2024, 925, 171814. [Google Scholar] [CrossRef]
  98. Gao, C.; Xu, L.; Montoya, L.; Madera, M.; Hollingsworth, J.; Chen, L.; Purdom, E.; Singan, V.; Vogel, J.; Hutmacher, R.B.; et al. Co-occurrence networks reveal more complexity than community composition in resistance and resilience of microbial communities. Nat. Commun. 2022, 13, 3867. [Google Scholar] [CrossRef]
  99. Zai, X.; Cordovez, V.; Zhu, F.; Zhao, M.; Diao, X.; Zhang, F.; Raaijmakers, J.M.; Song, C. C4 cereal and biofuel crop microbiomes. Trends Microbiol. 2024, 32, 1119–1131. [Google Scholar] [CrossRef]
  100. Wei-Ye, L.; Hong-Bo, G.; Ke-Xin, B.; Alekseevna, S.L.; Xiao-Jian, Q.; Xiao-Dan, Y. Determining why continuous cropping reduces the production of the morel Morchella sextelata. Front. Microbiol. 2022, 13, 903983. [Google Scholar] [CrossRef]
  101. Li, X.; Chen, D.; Carrión, V.J.; Revillini, D.; Yin, S.; Dong, Y.; Zhang, T.; Wang, X.; Delgado-Baquerizo, M. Acidification suppresses the natural capacity of soil microbiome to fight pathogenic Fusarium infections. Nat. Commun. 2023, 14, 5090. [Google Scholar] [CrossRef] [PubMed]
  102. Büttner, H.; Rassbach, J.; Schultz, C.; Popp, J.; Gressler, M.; Hertweck, C. Beneficial Soil Fungus Kills Predatory Nematodes with Dehydropeptides Translocating into the Animal Gut. J. Am. Chem. Soc. 2024, 146, 34702–34710. [Google Scholar] [CrossRef] [PubMed]
  103. Büttner, H.; Niehs, S.P.; Vandelannoote, K.; Cseresnyés, Z.; Dose, B.; Richter, I.; Gerst, R.; Figge, M.T.; Stinear, T.P.; Pidot, S.J.; et al. Bacterial endosymbionts protect beneficial soil fungus from nematode attack. Proc. Natl. Acad. Sci. USA 2021, 118, e2110669118. [Google Scholar] [CrossRef]
  104. Wang, J.; Tian, D.; Knapp, A.K.; Chen, H.Y.H.; Luo, Y.; Li, Z.; Hou, E.; Huang, X.; Jiang, L.; Niu, S. Precipitation manipulation and terrestrial carbon cycling: The roles of treatment magnitude, experimental duration and local climate. Glob. Ecol. Biogeogr. 2021, 30, 1909–1921. [Google Scholar] [CrossRef]
  105. Sun, L.-J.; Qi, Y.-C.; Dong, Y.-S.; He, Y.-T.; Peng, Q.; Liu, X.-C.; Jia, J.-Q.; Guo, S.-F.; Cao, C.-C. Interactions of water and nitrogen addition on soil microbial community composition and functional diversity depending on the inter-annual precipitation in a Chinese steppe. J. Integr. Agric. 2015, 14, 788–799. [Google Scholar] [CrossRef]
  106. Araújo, M.B.; Rozenfeld, A.; Rahbek, C.; Marquet, P.A. Using species co-occurrence networks to assess the impacts of climate change. Ecography 2011, 34, 897–908. [Google Scholar] [CrossRef]
  107. Tu, Q.; Yan, Q.; Deng, Y.; Michaletz, S.T.; Buzzard, V.; Weiser, M.D.; Waide, R.; Ning, D.; Wu, L.; He, Z.; et al. Biogeographic patterns of microbial co-occurrence ecological networks in six American forests. Soil Biol. Biochem. 2020, 148, 107897. [Google Scholar] [CrossRef]
  108. de Vries, F.T.; Liiri, M.E.; Bjørnlund, L.; Bowker, M.A.; Christensen, S.; Setälä, H.M.; Bardgett, R.D. Land use alters the resistance and resilience of soil food webs to drought. Nat. Clim. Change 2012, 2, 276–280. [Google Scholar] [CrossRef]
  109. Hernandez, D.J.; David, A.S.; Menges, E.S.; Searcy, C.A.; Afkhami, M.E. Environmental stress destabilizes microbial networks. ISME J. 2021, 15, 1722–1734. [Google Scholar] [CrossRef] [PubMed]
  110. Du, Y.; Yang, Y.; Wu, S.; Gao, X.; He, X.; Dong, S. Core microbes regulate plant-soil resilience by maintaining network resilience during long-term restoration of alpine grasslands. Nat. Commun. 2025, 16, 3116. [Google Scholar] [CrossRef] [PubMed]
  111. Yuan, M.M.; Guo, X.; Wu, L.; Zhang, Y.; Xiao, N.; Ning, D.; Shi, Z.; Zhou, X.; Wu, L.; Yang, Y.; et al. Climate warming enhances microbial network complexity and stability. Nat. Clim. Change 2021, 11, 343–348. [Google Scholar] [CrossRef]
Figure 1. Experimental design for distribution of sampling points in the solar park. Number 1–4 correspond to different observation points (HOP) along the horizontal transect line (RED line).
Land 14 02306 g001
Figure 2. The Alpha diversity metrics for soil fungal communities of different horizontal observation points at natural (N, figure (ad)) and artificial (A, figure (eh)) restoration sites. Different letters indicate statistically significant differences (p < 0.05).
Land 14 02306 g002
Figure 3. The Alpha diversity metrics for soil fungal communities of different soil depths at natural (N, figure (ad)) and artificial (A, figure (eh)) restoration sites. K represents the control group in natural habitat outside the solar park. Different letters indicate statistically significant differences (p < 0.05).
Land 14 02306 g003
Figure 4. Principal coordinate analysis (PCoA) of fungal communities based on Bray–Curtis dissimilarity matrices across horizontal observation points at both natural (N, figure (a)) and artificial (A, figure (b)) restoration sites. Results of Tukey’s HSD test on the Beta diversity distance among treatment groups are presented in the side boxes. Different letters represent statistical significance at p < 0.05.
Land 14 02306 g004
Figure 5. Principal coordinate analysis (PCoA) of fungal communities based on Bray–Curtis dissimilarity matrices across three soil depths at both natural (N, figure (a)) and artificial (A, figure (b)) restoration sites. K represents the control group in natural habitat outside the solar park. Results of Tukey’s HSD test on the Beta diversity distance among treatment groups are presented in the side boxes. Different letters represent statistical significance at p < 0.05.
Land 14 02306 g005
Figure 6. The compositional structure of soil fungal community at Class and Genus levels. Fungal community structure at the Class (a) and Genus (b) level at the natural restoration site along the transect sampling line. Fungal community structure at the Class (d) and Genus (e) level at the artificial restoration site along the transect sampling line. Differences in the relative abundance of dominant genera between treatment groups of the natural restoration site (figure (c)) and artificial restoration site (figure (f)). Different letters indicate statistically significant differences between treatments (p < 0.05).
Land 14 02306 g006
Figure 7. The compositional structure of soil fungal community at Class and Genus levels. Fungal community structure at the Class (a) and Genus (b) level at the natural restoration site across three soil depths. Fungal community structure at the Class (d) and Genus (e) level at the artificial restoration site across three soil depths. Differences in the relative abundance of dominant genera between treatment groups of the natural restoration site (figure (c)) and artificial restoration site (figure (f)). Different letters indicate statistically significant differences between treatments (p < 0.05).
Land 14 02306 g007
Figure 8. Heatmap of Spearman correlation between the enzyme activities and the principal component key factors of soil fungal community based on the Random Forest Regression analysis. (a) Natural restoration site; (b) artificial restoration site. Statistically significant correlations were marked down with colored squares. Red and blue colors represent positive and negative correlations, respectively. The circle suggests that the corresponding factor was predicted as the key factor that potentially determines the abundance of the particular fungal taxa. The diameter of each circle corresponds to the degree of the importance of the factor. The main environmental predictors for the variation in fungal community were identified. The bar chart on the right represents the estimated importance of variables, and higher explanatory proportion indicated more important variables.
Land 14 02306 g008
Figure 9. Heatmap of Spearman correlation between the enzyme activity and the relative abundances biomarkers based on the Random Forest Regression analysis regarding the spatial heterogeneity effects. Figure (a,c) represent analysis for the natural restoration site; Figure (b,d) represent analysis for the artificial restoration site. (a,b) showed the horizontal heterogeneity effects on the Random Forest Regression analysis. (c,d) showed the vertical heterogeneity effects on the Random Forest Regression analysis. Statistically significant correlations were marked down with colored squares. Red and blue colors represent positive and negative correlations, respectively. The circle suggests that the corresponding factor was predicted as the key factor that potentially determining the abundance of the particular fungal taxa. The diameter of each circle corresponds to the degree of the importance of the factor. The bar chart on the right represents the estimated importance of variables, and higher explanatory proportion indicated more important variable.
Land 14 02306 g009
Figure 10. The microbial co-occurrence networks of all treatment groups. Each node shows one fungal taxon. Color of the node corresponds to the specific taxonomic group. Color of the edge corresponds to either negative (blue) or positive (orange) correlations between two taxa. Figure (a,c) represent networks of the natural restoration. Figure (b,d) represent networks of the artificial restorations site. Figure (a,b) are networks in horizontal scale; figure (c,d) are networks in vertical scale. The control treatment (first three subfigures) is shown in both figure (c,d) for direct comparison with different restoration methods.
Land 14 02306 g010
Disclaimer/Publisher’s Note: The statements, opinions and data contained in all publications are solely those of the individual author(s) and contributor(s) and not of MDPI and/or the editor(s). MDPI and/or the editor(s) disclaim responsibility for any injury to people or property resulting from any ideas, methods, instructions or products referred to in the content.