Article

From Socialism to Market Economy in Central Europe’s Mountains: Interactions Between Population and Land Cover Changes in the Polish Carpathians

1
Institute of Biology and Earth Sciences, University of the National Education Commission, Podchorążych 2 St., 30-084 Kraków, Poland
2
Institute of Law and Administration, University of the National Education Commission, Podchorążych 2 St., 30-084 Kraków, Poland
3
Faculty of Geology, Geophysics and Environmental Protection, AGH University, Mickiewicza 30, 30-059 Kraków, Poland
*
Author to whom correspondence should be addressed.
Land 2025, 14(12), 2302; https://doi.org/10.3390/land14122302
Submission received: 13 October 2025 / Revised: 13 November 2025 / Accepted: 18 November 2025 / Published: 21 November 2025
(This article belongs to the Section Landscape Ecology)

Abstract

The socio-economic transformations that occurred across Central Europe in the 1990s profoundly influenced spatial development, as reflected in changes in population density and land cover, particularly in mountainous regions. This study investigates the relationship between population dynamics and land cover changes in the Polish Carpathians during the 20-year period following 1989, i.e., a time of major political and economic transformation. The research was conducted using detailed data based on 36 variables for 2250 statistical units at the lowest administrative level, combined with GIS-based analyses and statistical modelling. Results show that population density increased in more than 75% of administrative units, although the magnitude and direction of change varied considerably, both vertically and horizontally. The strongest growth occurred in the northern part of the study area, in the Foothills while depopulation was observed at higher elevations and in the eastern parts of the region. Land cover changes affected about 90% of administrative units, with built-up and infrastructural areas expanding mainly at the expense of heterogeneous agricultural land. At the same time, forest and shrub vegetation increased due to agricultural abandonment and natural regeneration. Principal component and mixed-model analyses identified topography, settlement location, and transport accessibility as the most significant drivers linking population and land cover changes. The findings highlight the lasting influence of historical spatial structures and initial demographic patterns on present-day development ways, illustrating how post-socialist transformation and EU integration have reshaped population distribution and land use in mountainous regions.

1. Introduction

The socio-economic changes that took place in the 1990s throughout Central Europe had a significant impact on regional development (e.g., [1,2,3,4,5]). The transition from the centrally planned to free-market economy triggered numerous processes related to employment, housing, lifestyle, and migration. These, in turn, were reflected in the geographical landscape through changes in land use and land cover (LULC). Many studies demonstrated that the collapse of socialism led to unprecedented rates of farmland abandonment. For example, more than 32% of the farmland used in Estonia during socialism was abandoned between 1990 and 1993 [6], while in one region of Latvia bordering Estonia; this value was estimated even up to 50% [7]. A similar situation was observed in Ukrainian Carpathians, where 30% of the farmland was abandoned after 1991 [4]. In Slovakia (areas mostly located in the Carpathians), 50% of the traditional agricultural landscapes functioning before 1989 are still under regular management, although 34% is partly abandoned and 16% is completely abandoned [8]. In the Polish part of the Carpathians c.a., 14% of agricultural lands were abandoned and began to be covered by secondary forest successions [9].
Mountain areas are highly sensitive to both socio-economic and environmental changes. Their steep slopes, limited agricultural land resources, and strong dependence on human activity make them particularly responsive to demographic and land use pressures. Consequently, transformations in mountain landscapes often serve as indicators of broader development trends. For this reason, the mountainous part of Poland located within the Carpathian Mountains was selected for detailed analysis.
The political transformation that began in Eastern Europe in 1989 initiated many processes that resulted in similar outcomes across different parts of the Carpathian region, e.g., [10,11]. In the early 1990s, a systematic shift from work in semi-subsistence farming towards other branches of the economy had begun and the collapse of state-owned farms and industrial plants was accompanied by rapid development of services, e.g., [11,12,13], including tourism [14]. In this stage, agriculture underwent deep structural changes associated with market liberalisation, privatisation, and the withdrawal of state support. This period was marked by a decline in agricultural output and employment, fragmentation of farms, and limited access to capital and technology [15,16]. The situation gradually improved with the introduction of precision instruments such as SAPARD and PHARE, which stimulated investment in infrastructure and farm modernisation, particularly in more developed regions [16].
The accession of eight post-socialist countries to the European Union in 2004 (Czech Republic, Estonia, Latvia, Lithuania, Hungary, Poland, Slovenia, Slovakia, and Bulgaria with Romania in 2007) represented a turning point that stabilised the sector through the Common Agricultural Policy, removal of customs barriers and direct payments, significantly contributing to the economic development of the region [17,18]. Subsequent years brought an increase in production efficiency, technological advancement, and farm consolidation, while income disparities between regions gradually narrowed [16,19]. Economic changes were accompanied by the development of communication infrastructure and housing, both in urbanised and rural areas [20,21], especially in former agricultural territory surrounding bigger towns [22].
Demographic trends after 1989 in the Polish part of the Carpathians have mirrored those observed across the region. Research from Slovakia, Romania, Ukraine, and Hungary shows consistent depopulation of high-mountain and peripheral areas, suburban growth in foothills, and agricultural land abandonment accompanied by forest expansion. A parallel trend is the ageing of rural populations and the growing importance of tourism and the second-home phenomenon [23,24,25,26].
The literature review allows us to detect certain gaps that deserve research attention. Previous studies were mostly based on a “case study” approach using the following: 1/the test polygons (e.g., [8,9]), 2/catchments (e.g., [27,28]), or 3/villages/communes (e.g., [29,30,31]) that are supposed to represent the entire region. As a result, the most valuable works, such as meta-analyses, are based on varied source data (e.g., [11,32]). According to the authors, there is a lack of articles that would investigate the influence of natural and human-related factors on the LULC changes (and their interactions) in the transition period in relation to the region as a whole, using homogeneous and complete data. This gap was the reason for this study.
The twenty-year study period was chosen because it fully covers the first phase of Poland’s political and economic transformation after 1989—from turbulent post-socialist transition to the stabilisation period in the early years of European Union membership. This period covers the timespan from the communism collapse, through the accession of the post-socialist countries to the EU in 2004, until the end of the first financial perspective of the EU budget in which Poland, together with the newly acceded countries, fully participated (2007–2013). Consistent demographic and land cover data are available for this timeframe, and the chosen period allows for the identification of long-term structural changes rather than short-term fluctuations. Moreover, it corresponds to the temporal scope adopted in similar studies conducted in Central and Eastern Europe, which facilitates comparative analyses [23,33,34,35,36,37,38].
The novelty of this study is that statistical and physio-geographic data were analysed at the lowest administrative level (villages/towns) for the entire part of the Polish Carpathians, using complete and homogeneous data.
Taking the above into account, an attempt was made to identify changes in the geographical space, focusing on two elements that reflect, fairly well, the final interactions between environmental, socio-economic and cultural elements of geographical space (e.g., [39]), namely population density and LULC. Therefore, the goal of this study is to evaluate the interaction between spatial and temporal changes in population and LULC structure in the Polish part of the Carpathians after the political transformation in 1989.

2. Study Area

The study area covers the Polish part of the Carpathians, which constitutes approximately 10% of the entire Carpathian range (the Romanian, Slovakian, and Ukrainian parts account for 50%, 21%, and 10%, respectively) while the remaining sections include Serbia, the Czech Republic, Austria, and Hungary, the boundaries of the region slightly depending on the adopted classification. This region in Poland (about 20,000 km2) consists of several subregions—foothills, middle and high mountains, and intermontane basins (e.g., Nowy Sącz Basin)—that differ in both natural (climate, relief, land cover structure) and anthropogenic conditions such as land use and settlement patterns. These differences have influenced the type and direction of natural and socio-economic processes, shaping the development and functioning of the region both historically and in the present day.
The Foothills cover the northern part of the study area (46%). This subregion is characterised by low relief (100–200 m of relative height), dominated by domed hills and long convex–concave slopes (10–20°) [40]. The elevation of hilltops reaches up to 600 m a.s.l. Favourable soil fertility led to the early transformation of this region for agricultural purposes, and settlement areas have been developing since the 13th century [41]. Today, the Carpathian Foothills remain predominantly agricultural in character.
The central part of the Polish Carpathians (48%) comprises the medium–high mountain subregion (the Beskidy). This area is characterised by steeper concave–convex slopes [40], hillside gradients of 20–50°, greater relative heights (300–800 m), and elevations exceeding 1000 m a.s.l. Higher and steeper slopes are forested, whereas lower and gentler ones are used as grasslands or arable fields. Settlements are mainly located in river valleys (on non-flooded terraces) and on gentle slopes.
South of the Beskidy lies the large Orawa–Podhale Basin (Podhale), surrounding the high mountains (the Tatra Mts.) to the north and covering about 6% of the Polish Carpathians. The basin has similar natural and settlement conditions to the medium–high mountain areas to the north, although its relative heights are lower [42]. The Tatra Mountains subregion has no permanent settlements but is one of the most popular tourist destinations in Poland, with the highest peak reaching 2499 m a.s.l. (Rysy).
Poland has a three-tier system of administrative division, and these administrative units served as the basic reference polygons for the analysis. The study area was extended several kilometres north of the physico-geographical boundary to include the southern part of the Fore-Carpathian Basins (Figure 1). This adjustment allowed the inclusion of the largest and most important cities in the region (Kraków and Rzeszów), as well as several key district towns (e.g., Bielsko-Biała, Tarnów, Przemyśl) located along the border between the Fore-Carpathian Basins and the Carpathian Foothills.

Historical Background Until 1989—Starting Point

From the late 18th to the early 20th century, almost the entire study area was part of the Austro-Hungarian Empire as its northern peripheral province, called Galicia—(see Figure 1). The westernmost part of the study area, however, belonged to the industrialised region of Silesia which, until 1918, was part of the Kingdom of Prussia. Moreover, Galicia was historically divided into Western and Eastern Galicia, due to cultural and political factors.
The economic development of the western part of Galicia was stimulated by its proximity to industrialised areas and to the city of Kraków, which served important administrative functions [44]. In contrast, the marginalisation of Eastern Galicia resulted partly from natural conditions that hindered agricultural development and from its peripheral location relative to major urban and industrial centres. These differences led to long-term disparities in regional development along the east–west axis, which have been reflected in the density of population, observed since the beginning of the 19th century [45].
In addition to these historical and political conditions, other factors determined the contemporary east–west diversification of population density, which had consequences for settlement activities after World War II. The eastern part of the study area (historical Eastern Galicia) was inhabited mainly by people of Ruthenian origin (partly identifying with Ukraine). After World War II, Poland’s eastern border was redefined, and most of Galicia became part of the Ukrainian Soviet Socialist Republic (USSR). The Ruthenian population remaining in Poland was resettled either to the USSR or to the territories incorporated into Poland after the war (in the west and north-east), from which the German population had been displaced.
The post-war border changes accelerated the peripheralisation and depopulation of the eastern part of the study area. Although the central authorities attempted to revive this region economically by building communication and living infrastructure (including the construction of Poland’s largest dam, large state farms in abandoned villages, and tourist facilities [46,47]), these efforts were time-consuming and costly, and their economic effects remained moderate [48]. Consequently, population growth in this part of the region remained low to end of collapse of socialism in Europe.
In contrast, the western part of the Polish Carpathians benefitted from historical and political circumstances that created more favourable conditions for economic development, which is reflected in the population density. Historically, this region was economically linked with the industrialised areas of Zagłębie and Silesia. Until the late 19th century, it experienced slow but steady economic growth, primarily based on industry. After World War I, when many European countries—including Poland—regained independence, the western part of the historical Western Galicia became an important industrial district of the reborn Polish state. Following World War II and the westward shift in Poland’s borders, the entire region continued to develop through heavy industry.

3. Materials and Methods

3.1. Geodatabase Development

In order to reach the goal of this study, the geodatabase was developed and analysed using statistical methods. The main parts of the geodatabase (Table 1) included information on the following: (1) spatial distribution of the basic administrative units and their main characteristics, (2) population characteristics in administrative units, (3) land cover structure in administrative units, (4) terrain conditions within the administrative units and geographical regions, and (5) spatial distribution of the road network. A brief explanation of the main parts of the geodatabase is presented below.

3.1.1. Basic Administrative Units

Poland has a three-tier administrative division system. The highest level consists of voivodeships (województwa), corresponding to provinces or regions (16 units in total; unchanged in 2024). The intermediate level is formed by counties (powiaty), of which there were 379 across the country in 2011 (380 as of 1 January 2024). The lowest level comprises communes (gminy), which serve as basic local government units responsible for administrative management and statistical data collection. In 2011, Poland had 2479 communes, including 302 urban, 621 urban–rural, and 1556 rural ones (2477 communes as of 1 January 2024). Each commune typically encompassed several villages (sołectwa) and sometimes small towns in rural areas (on average, about 16 per commune in 2011) or a single town (miasto) in urban areas, such as Kraków [49,50].
In this study, statistical data were analysed at the level of individual villages and towns, i.e., the lowest spatial units available, rather than at the aggregated commune level. This approach provided higher spatial resolution and enabled a more detailed assessment of local-scale demographic and land cover changes. The source of data for the administrative division was Statistics Poland. In this study, the list of administrative units compiled for statistical purposes was selected. The research was carried out in 2175 villages and 79 towns, defined in 2250 statistical units in 2011 (in several cases, two villages constituted a single statistical unit).

3.1.2. Data Related to Population

The direction and scale of socio-economic changes are ultimately reflected in changes in population data [39]; therefore, changes in population density were used for detailed analysis. The source of the database for this data was the Local Data Bank [51]. Statistical analyses used the number of men and women in administrative units for two periods: 1989 and 2011. The administrative units were linked to the data characterising the population using the unique ID number of the administrative unit (TERYT).

3.1.3. Data Related to Land Cover

The Corine Land Cover (CLC), developed by the European Environment Agency [52] was the source of the database for land cover analysis. The goal of the programme is to document land cover structure and changes in the European Union and associated countries [53,54]. Land cover is registered using a 3-levelled system. The first level registers 5 main classes of land cover (artificial surfaces, agricultural areas, forests and semi-natural areas, wetlands and water bodies). The second—regional level registers 15 classes (13 in research area), whereas the third level registers 44 classes (28 classes were classified in study area in 2012 and 27 in 1990). The second level of data was used in the study.
Five editions of maps were developed (1990, 2000, 2006, 2012, and 2018). Each class of land cover is strictly defined; therefore, the data is fully comparable throughout the entire territory of base execution.

3.1.4. Other Raster and Vector Data

The land cover and population distribution are determined by natural elements of the environment. To take this influence into account, variables describing the terrain properties were also calculated (Table 2). The source data was SRTM (Shuttle Radar Topography Mission) digital elevation model (DEM) with resolution 3” (60–65 × 90 m) [55].
The spatial distribution and the typology of the road network were obtained from the OpenStreetMap [56]. A physio-geographical region encompasses areas with similar environmental conditions. The boundaries were obtained from the geodatabase of the programme of identification, cataloguing, and evaluation of Polish landscapes, part of the implementation of the European Landscape Convention [43].

3.2. Statistical Analyses

In the first stage a matrix of 36 variables for 2250 statistical units (Table 2) was created using QGIS software (version 2.18.28). The matrix with 81,000 records was then the source database for statistical analyses. Typical statistical methods (listed below) for similar studies were used, e.g., [4,8,22,57,58].
Using Statistica (version 13.0) software, the overall changes in the population density and land cover were analysed and presented in boxplots and cartographs. The direction and magnitude of the changes in land cover classes in the administrative units were detected applying the cross-correlation method. Spatial distribution of the changes in the land cover was presented on a map resulting from the map algebra analysis performed in QGIS software (3.28.4 version).
The SAS/STAT software in versions 14.2 and OnDemand for Academics was used for the factors identification. The factors determining population density and land cover changes were identified with the Principal Component Analysis (PCA) [59] using proc factor procedures. Finally, the factors affecting the interaction between land cover changes and population density were determined [60] by use of the proc mixed procedure. This procedure fits a variety of mixed linear models to the data and enables the use of these fitted models to make statistical inferences about the analysed data [61]. This processing enables the analysis of variables if they are cross-correlated.

4. Results

4.1. Population Density in 1989 and Its Changes in the Timespan 1989–2011

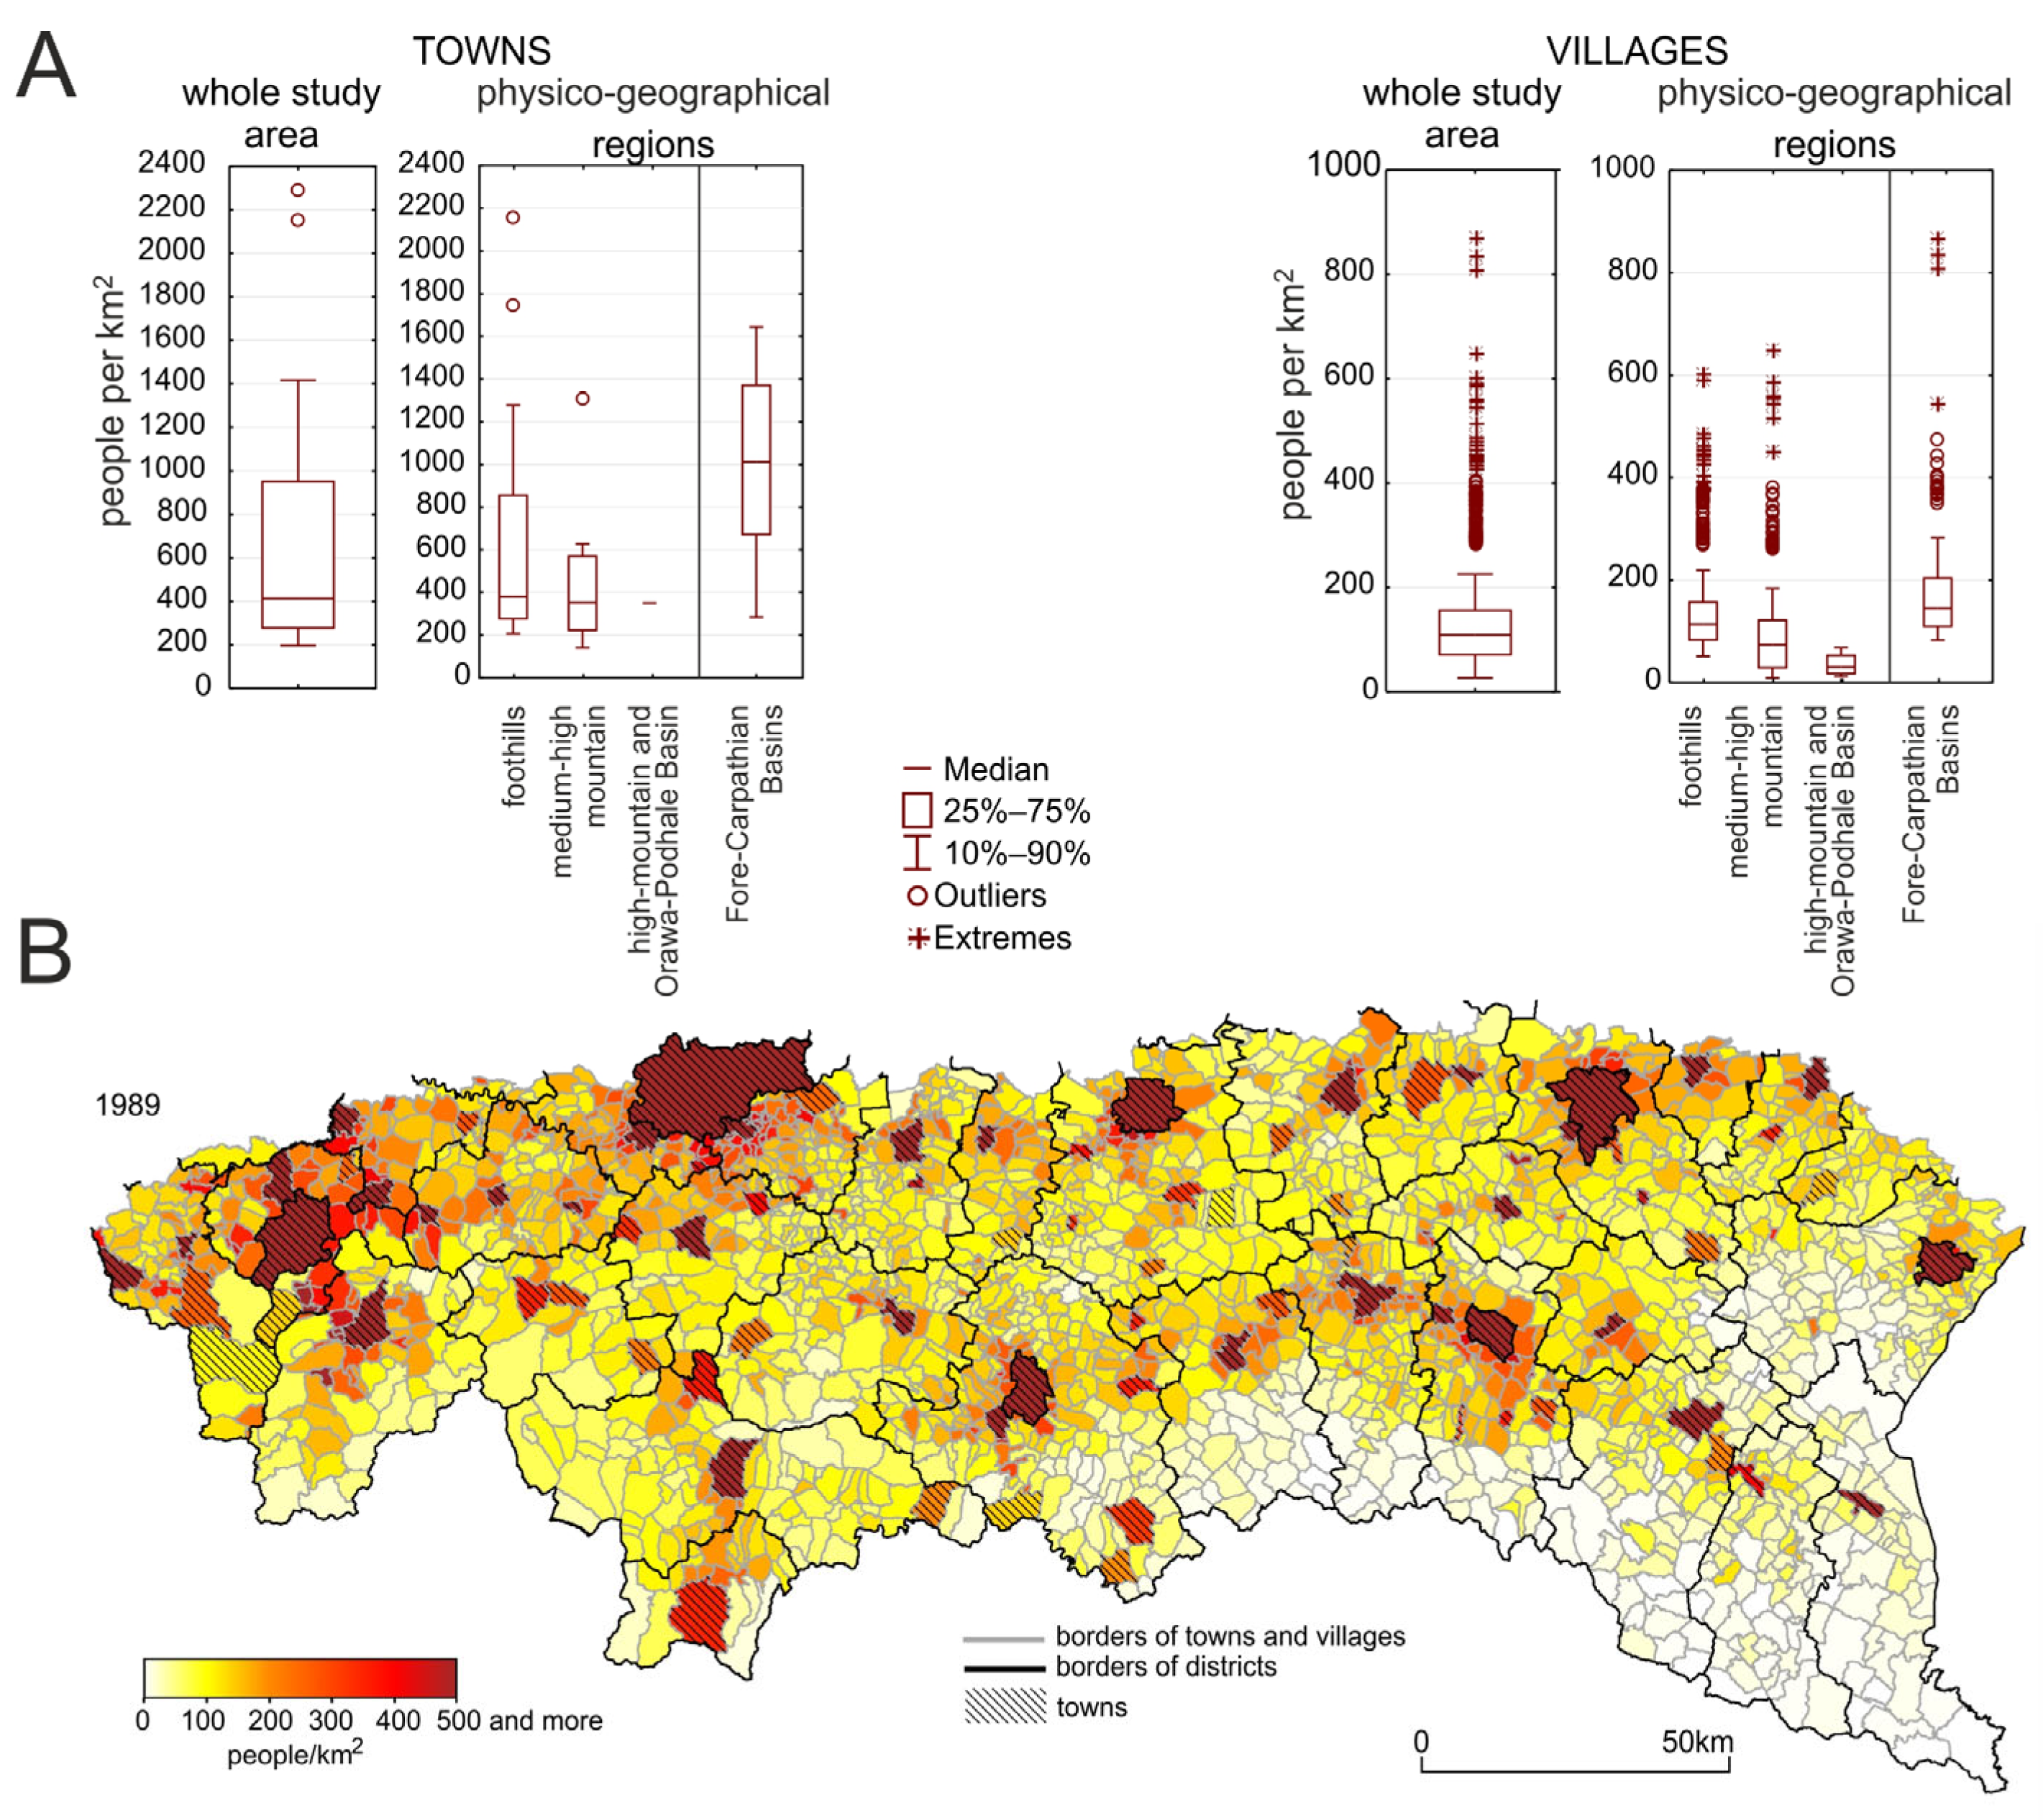
The considerable variation in this variable justified a separate analysis for the main administrative units, namely villages and towns. For 80% of villages (N = 2175), population density ranged between 27 (Q10) and 226 (Q90) people per km2, with 10% of villages exceeding 226 people per km2 and reaching a maximum of 870 people per km2. These settlements were located primarily near towns. Overall, the northern part of the Carpathians (Foothills) was more densely populated. The median population density in Foothill villages amounted to 117 people per km2, with values ranging from 51 (Q10) to 219 (Q90) people per km2. In the medium-elevation mountain areas (Beskidy), the median density was 71 people per km2, ranging from 8 (Q10) to 181 (Q90). The lowest densities were recorded in the southeastern part of Polish Carpathians, which could be explained by conglomeration of historical, political, social, and environmental conditions that did not favour settlement development in this region [42,62,63,64].
A greater diversity in population density was observed among Carpathian towns. In 2011, 80% of the towns (N = 79) had densities ranging from 197 (Q10) to 1417 (Q90) people per km2, with a median of 413. About 10% exceeded 1417 people per km2, reaching a maximum of 2288. In the northern Foothills (41 towns), the median density amounted to 380 people per km2, while in the Beskidy area (21 towns) it was similar, at 352. Population density varied more in the northern areas, as shown by the interquartile range—579 people per km2 in the Foothills versus 346 in the Beskidy (Figure 2).
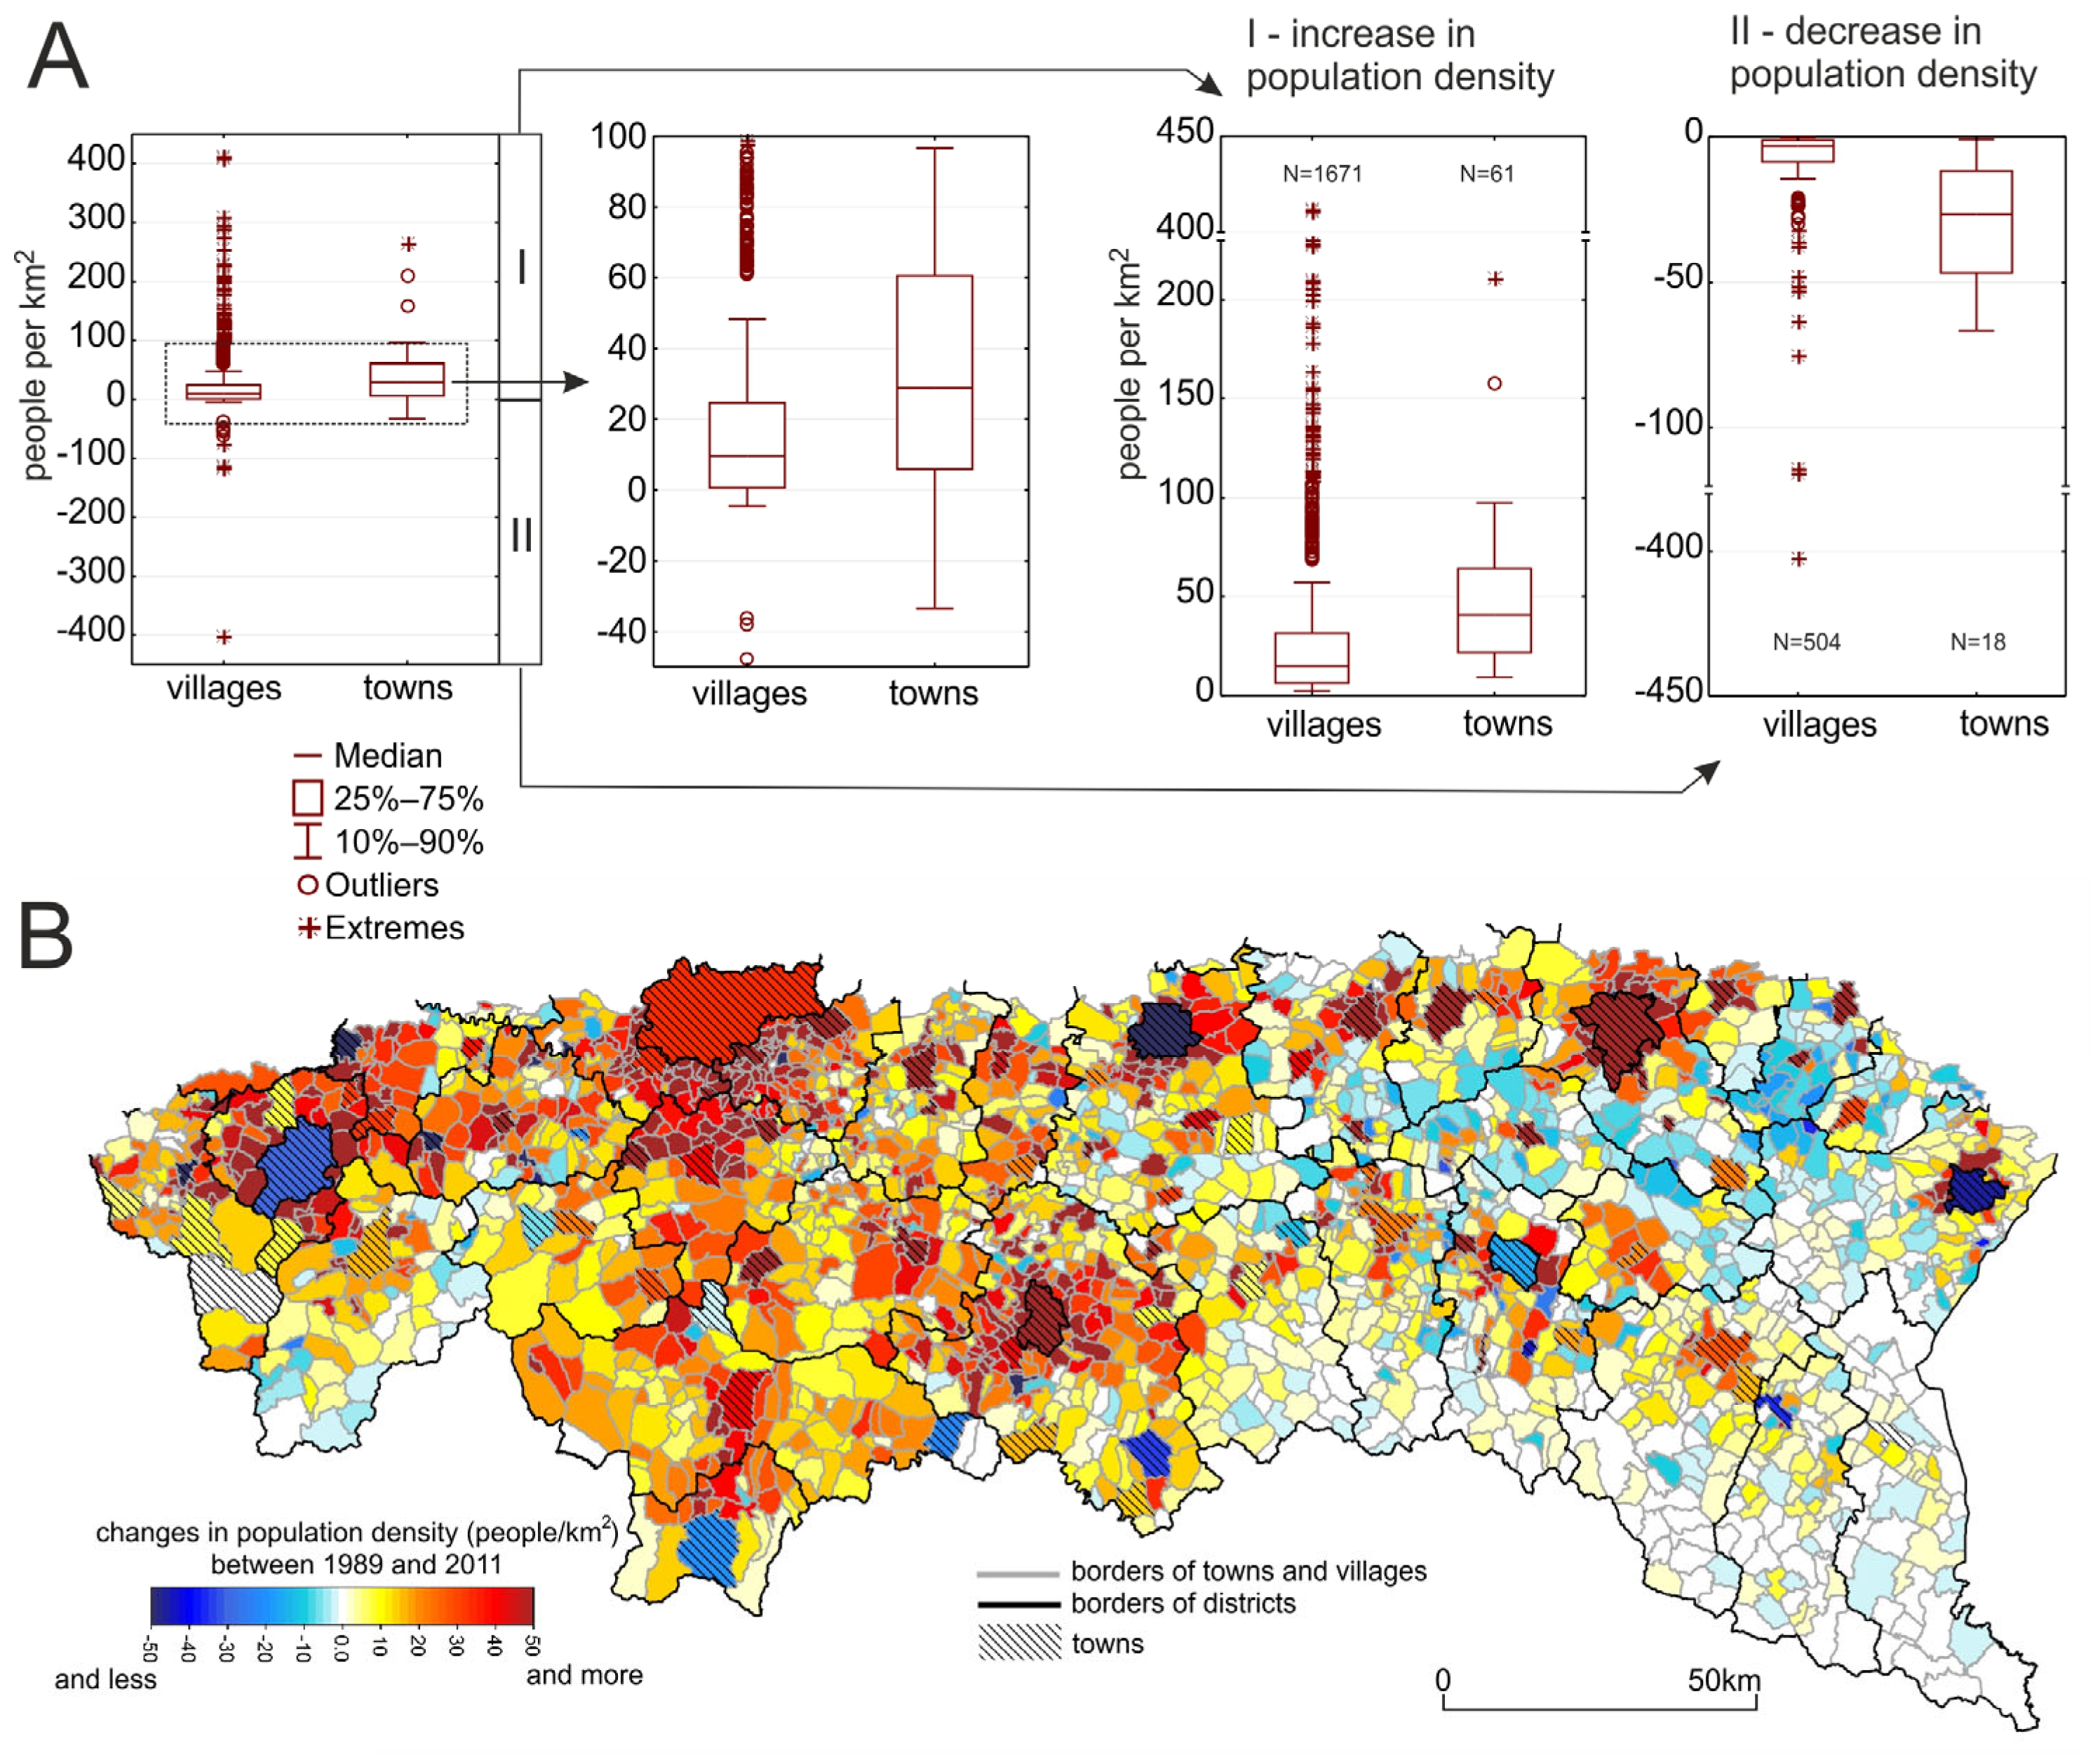
In more than 70% of all administrative units, population density increased between 1989 and 2011. The median change amounted to 9.7 people per km2 for villages (N = 2175) and 28.9 people per km2 for towns (N = 79). However, notable internal differences were observed. In 1671 villages and 61 towns, population density rose, with 90% of these increases being below 57 people per km2 (villages) and 97 people per km2 (towns). The median increases reached 15 people per km2 in villages and 47 people per km2 in towns. Several villages recorded significantly higher increases, identified as outliers and extreme values (Figure 3A). A decline in population density occurred in 504 villages and 18 towns. For 90% of these units, the decrease exceeded 8.7 people per km2 (villages) and 6.7 people per km2 (towns), although some villages experienced more substantial declines (Figure 2).

4.2. Land Cover in 1990 and It Changes in the Timespan 1990–2012

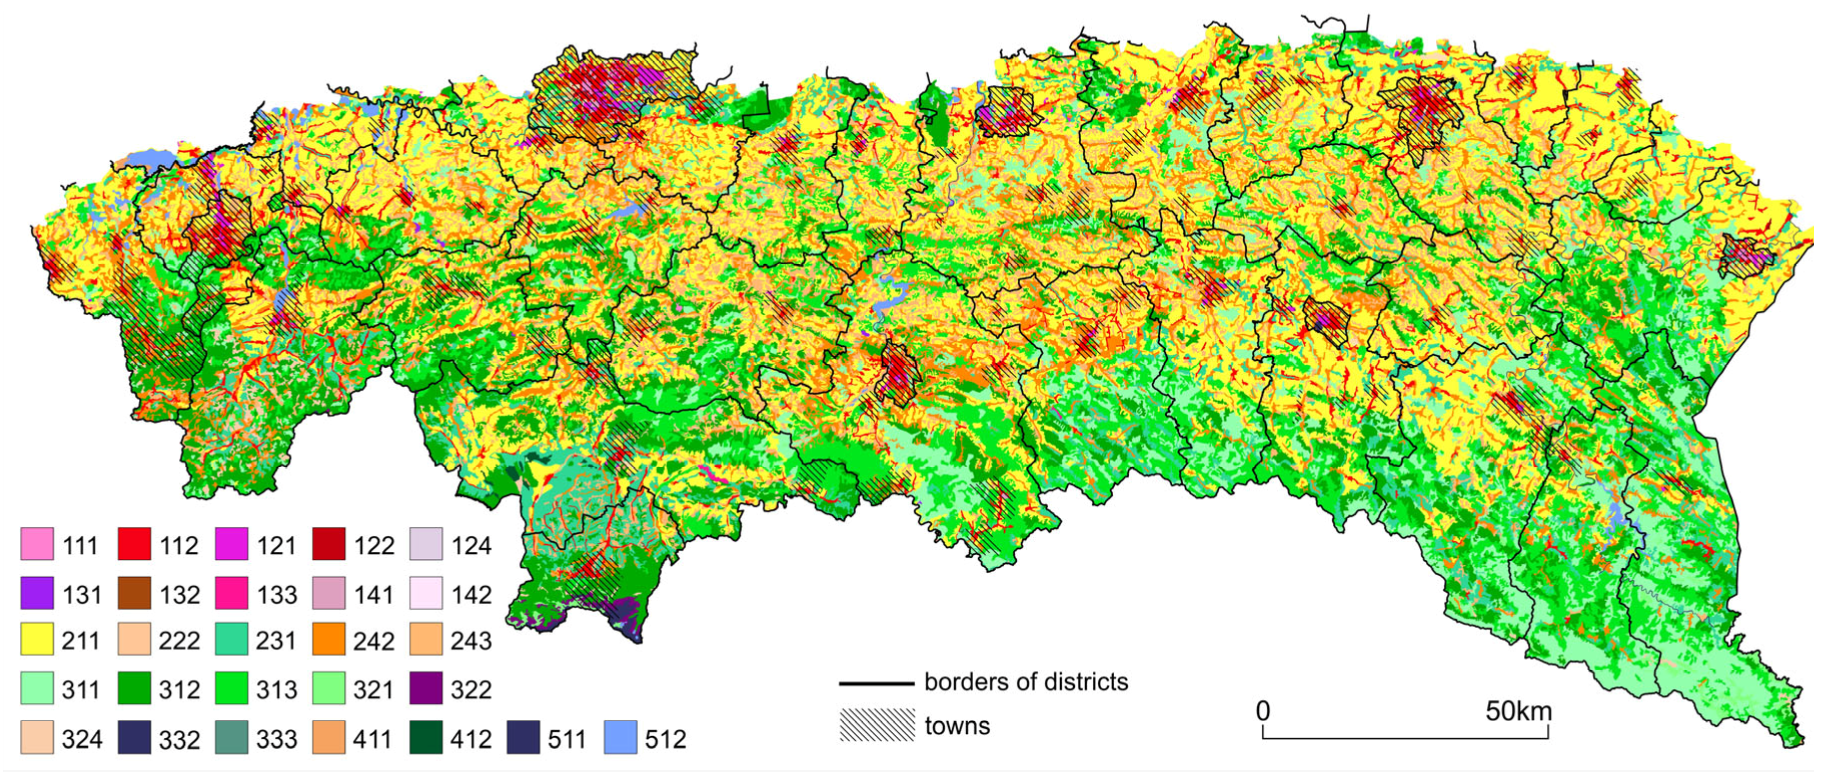
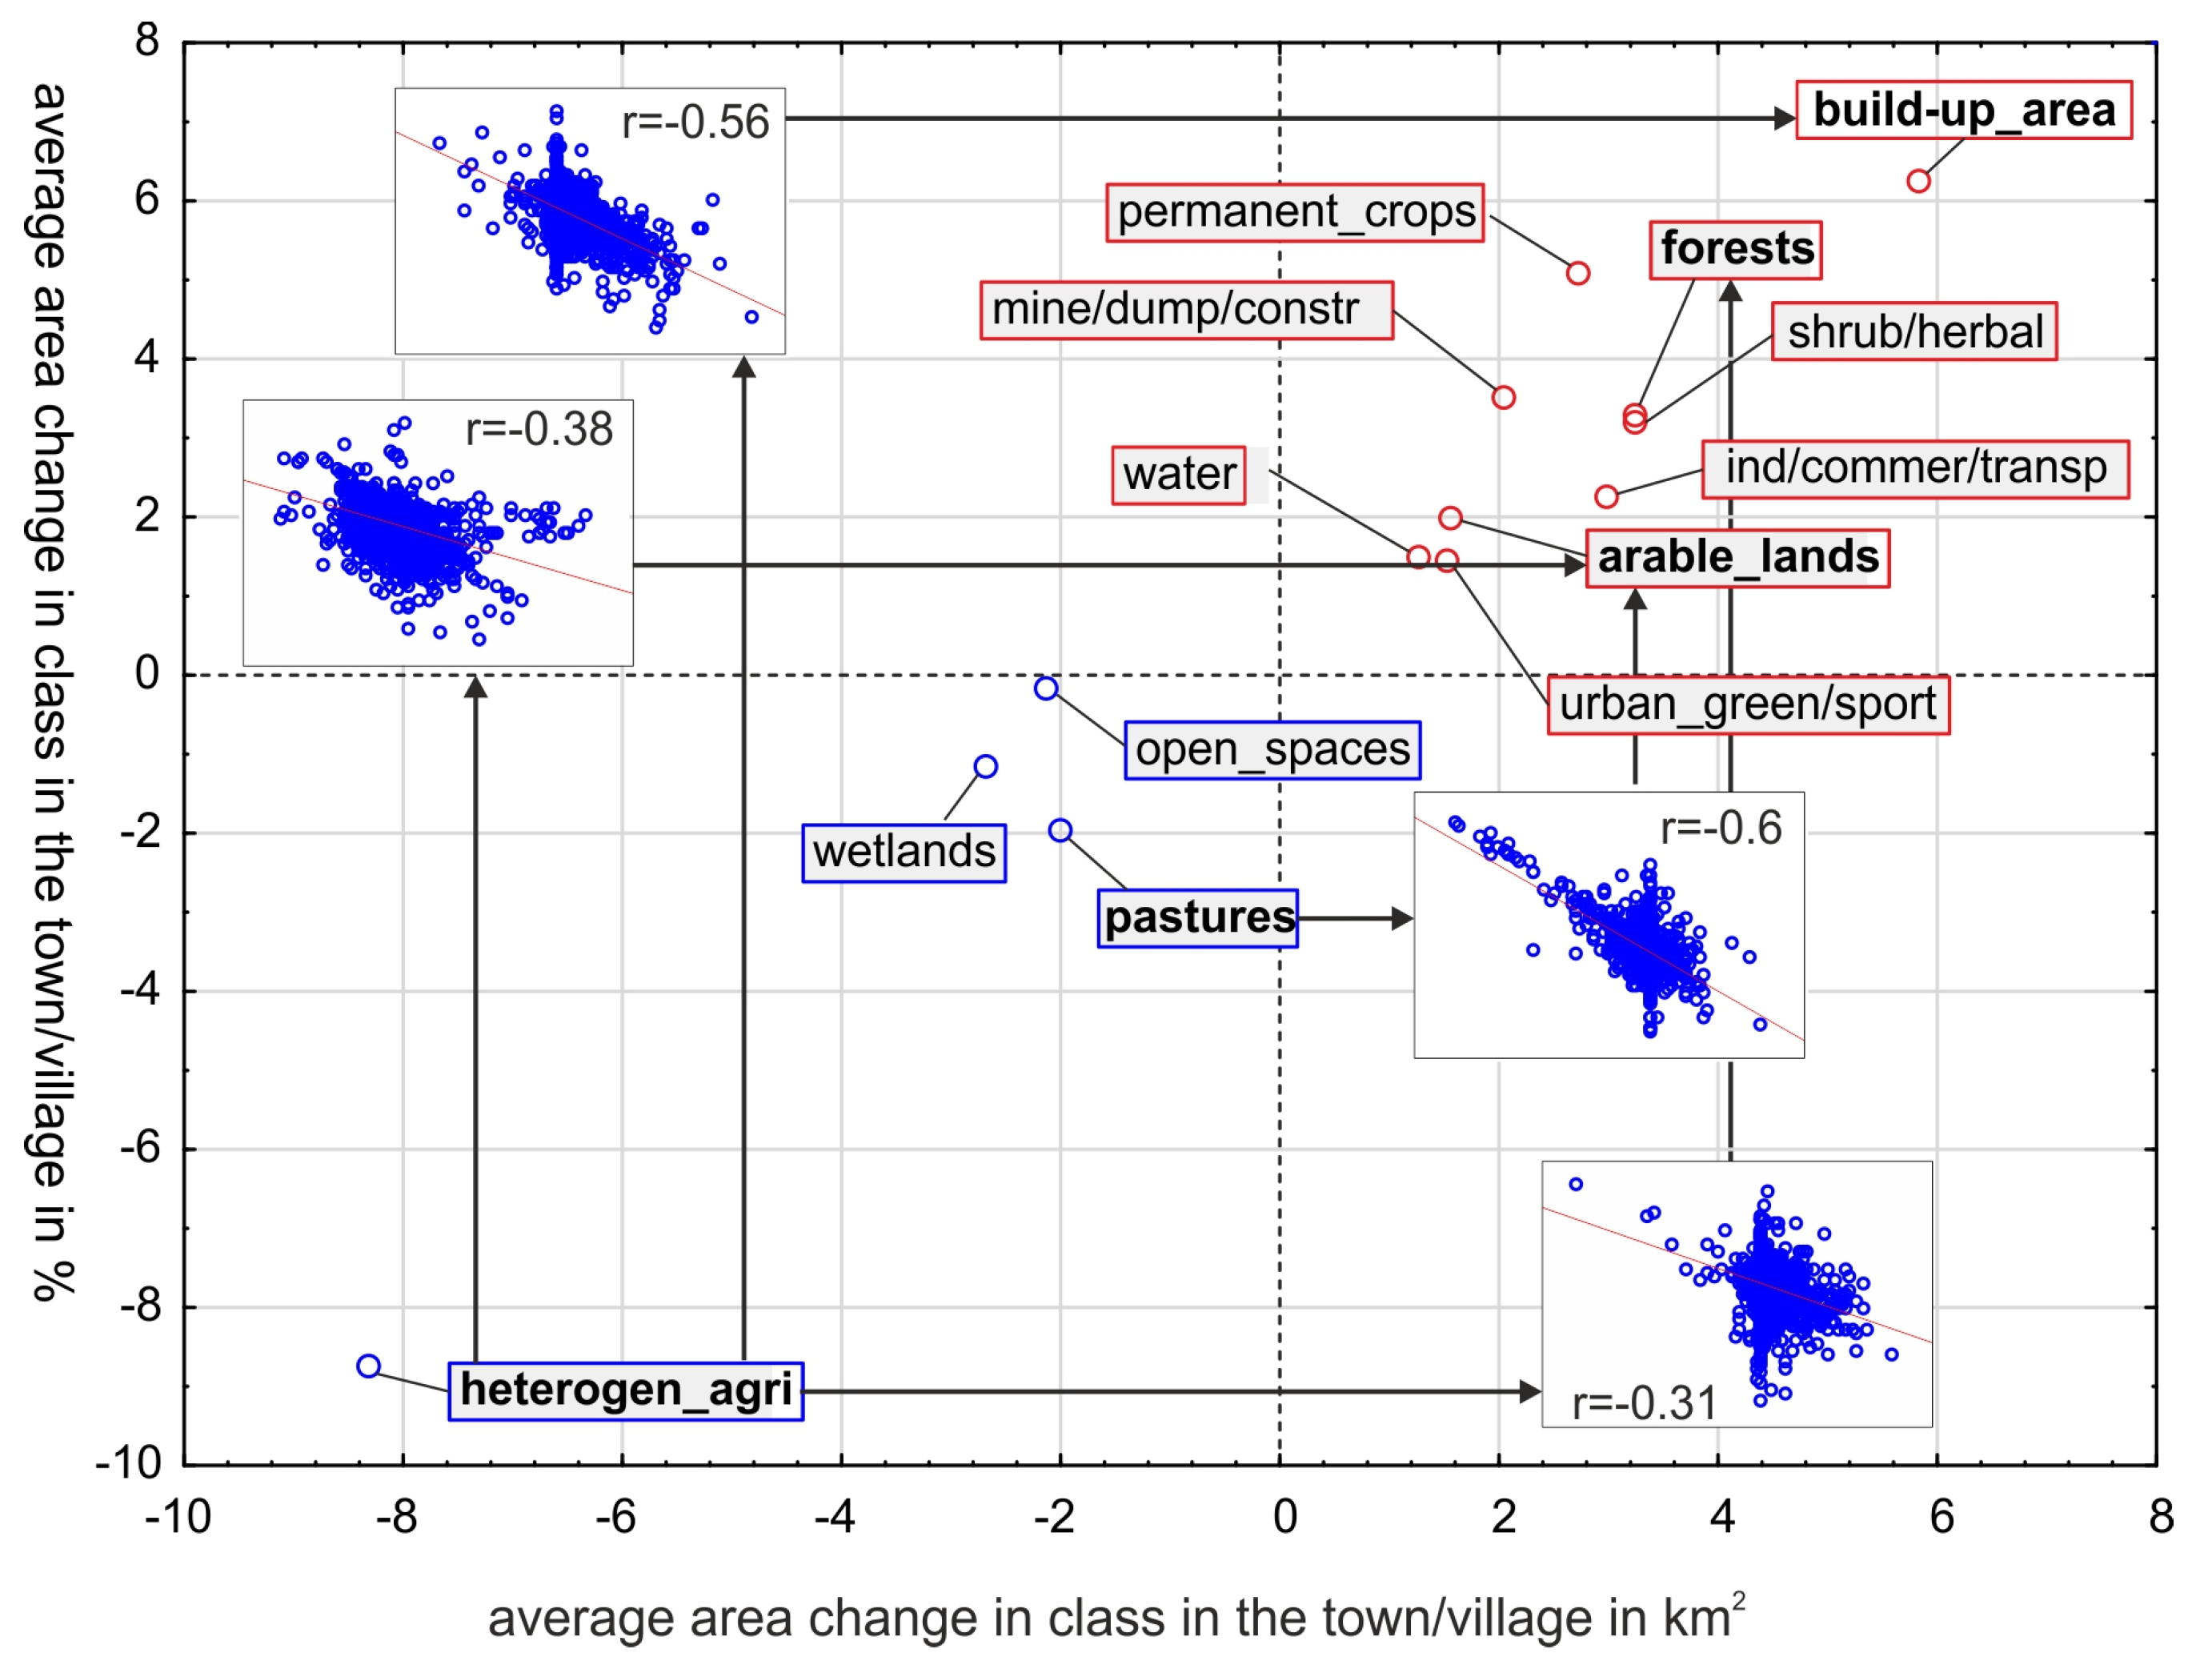
Of the 13 land cover classes distinguished in 1990 at the second level of the CLC database, nine classes showed an increase in area, while four recorded a decrease (Figure 4; Table 2). The area of urban fabric doubled over the period analysed. Industrial, commercial and transport units (an increase of 35%), mine, dump and construction sites (an increase of 146%), and artificial, non-agricultural vegetated areas (mainly green urban areas and sport and leisure facilities) also expanded by 15%.
Another group of land cover types in which the occupied area increased included classes closely related to agriculture, i.e., arable land (an increase of 5%, although significant spatial variability was observed) and permanent crops (an increase of 69%). At the same time, a decrease in the area of pastures and heterogeneous agricultural areas was observed (by 16% and 34%, respectively).
Classes associated with semi-natural vegetation, such as forest and shrub and/or herbaceous vegetation associations, increased by 7% and 68%, respectively. Conversely, the area of open spaces with little or no vegetation and wetlands decreased by 4% and 19%, respectively; however, these classes generally accounted for only a small share of the total land cover structure. The increase in the area occupied by water bodies (by 21%) was clearly related to the construction of several large dam reservoirs (e.g., Klimkówka, Czorsztyn) on the major rivers of the Carpathians.
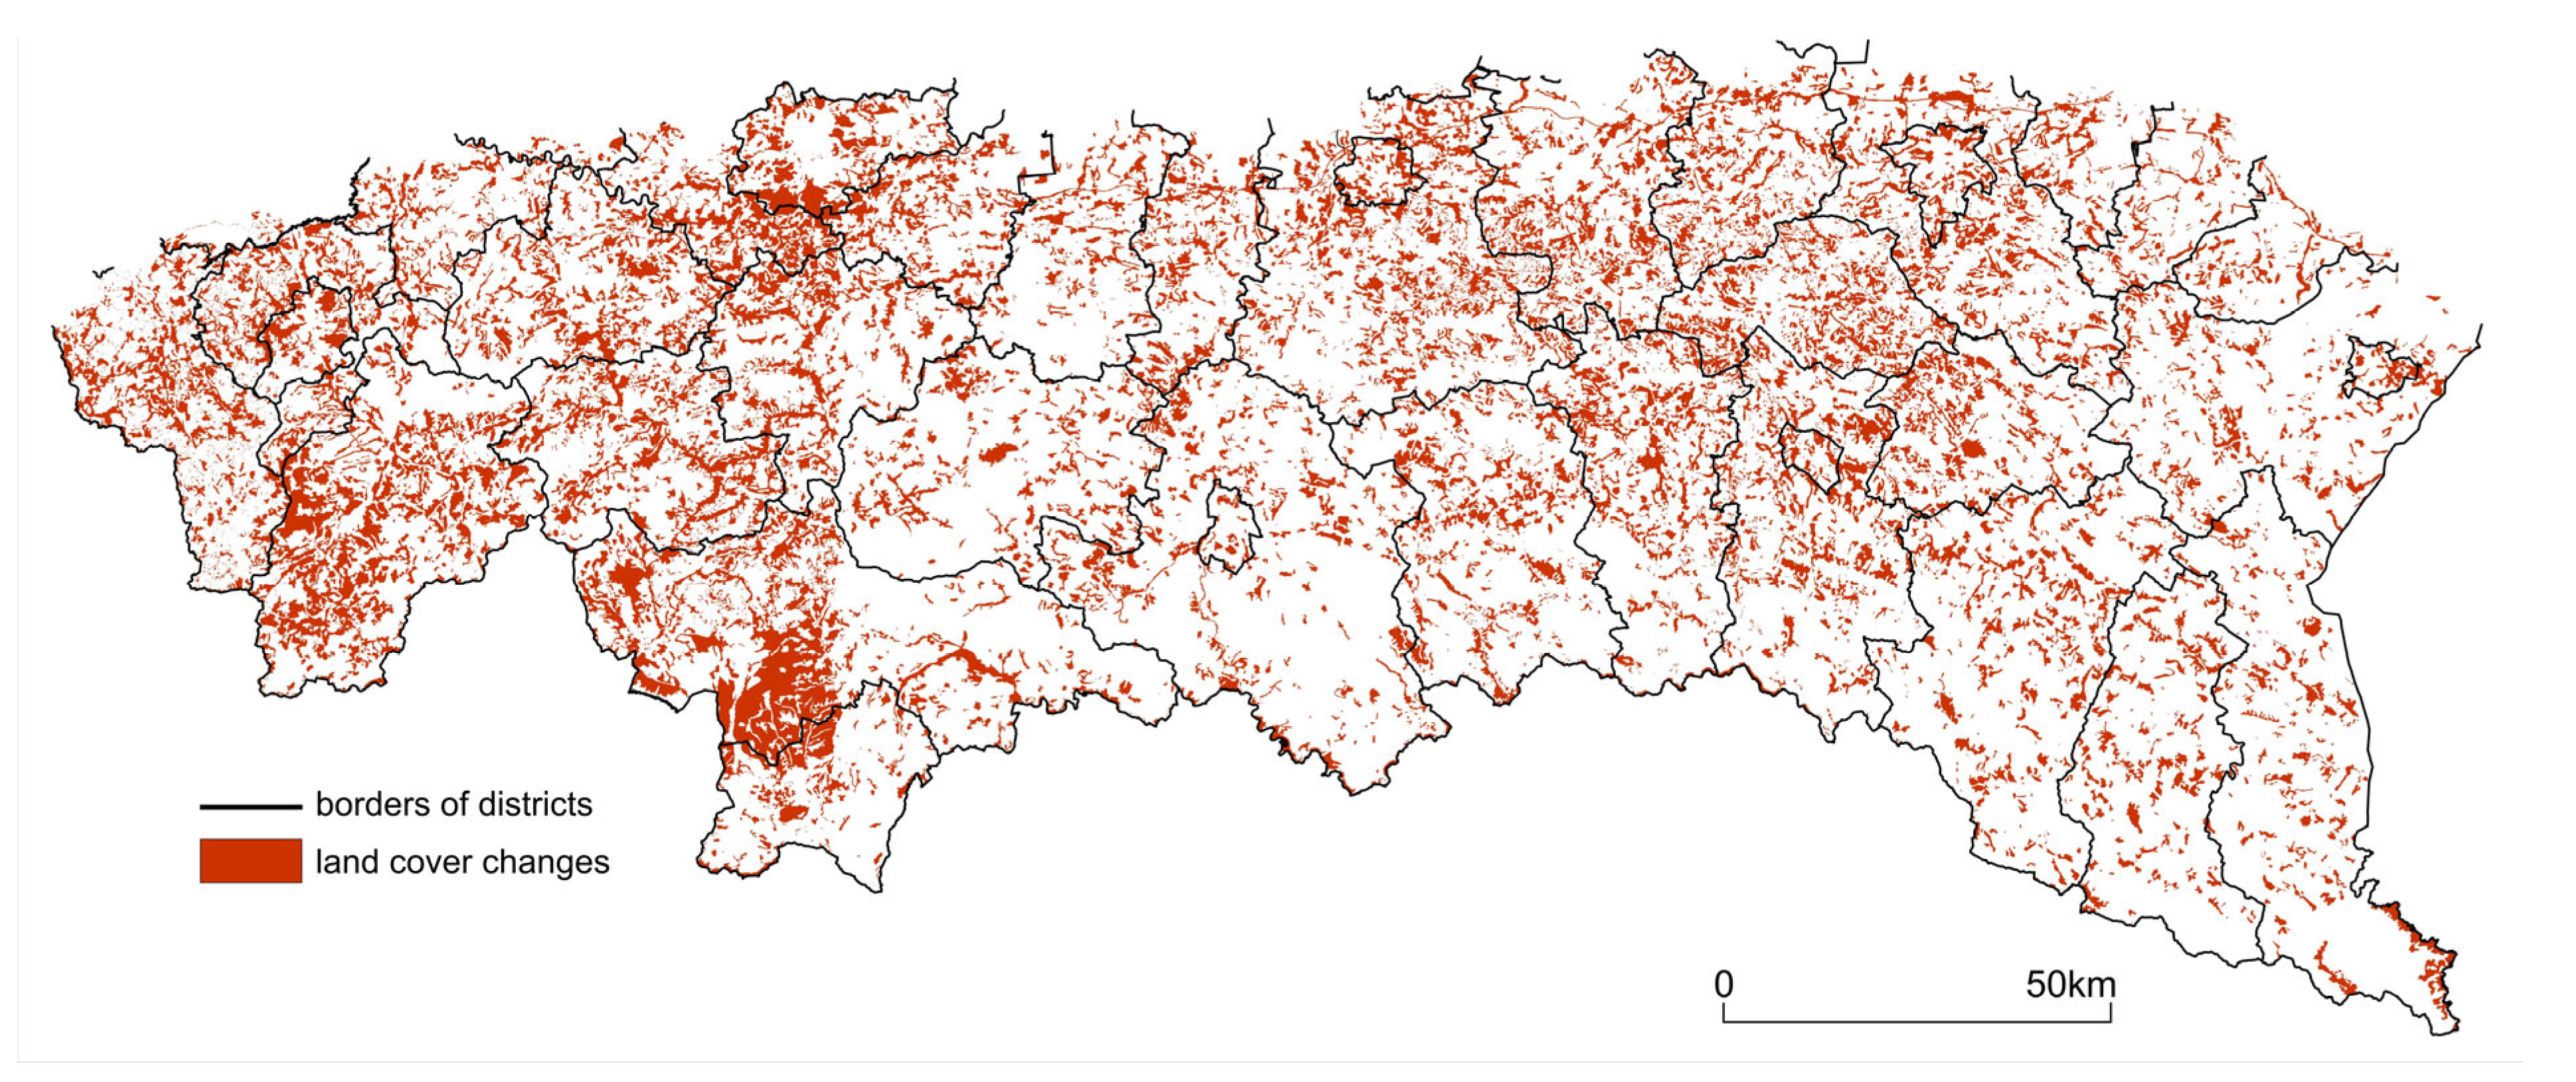
Land cover changes between 1990 and 2012 are presented in Figure 5. In general, changes were detected across 20% of the study area, and 90% of the administrative units experienced some change in land cover structure. Smaller-scale changes occurred in the southern and eastern parts of the region, which are mostly forested, whereas more substantial changes were observed in the western part, in contrast to the eastern areas.
Average changes in the land cover classes in villages and towns in the Polish Carpathians in the years 1990–2012 are presented in a synthetic way in Figure 6. Comparison of the changes using absolute (km2—axis X) and relative (%—axis Y) measures, allowed to demonstrate the direction and magnitude (expressed by Pearson correlation coefficient) of land cover changes.

4.3. The Interaction Between Population Density and Land Cover Changes

4.3.1. Factors Determining the Changes in the Population Density

Section 4.1 provided general information on changes in population density. To better understand the genesis of these changes, which indirectly reflect contemporary socio-economic processes, the relationships between the variables were examined (Table 2). The correlation between the response variable (percentage change in population density in 1989–2011) and the explanatory variables was analysed. For detailed interpretation, seven statistically significant (p < 0.05) variables with the highest and seven with the lowest correlation coefficients are presented (Table 3).

4.3.2. Factors Affecting the Interaction Between Population Density and Land Cover Changes

In the Polish Carpathians as Whole
In order to investigate the interactions between population, land cover changes, and the components affecting population distribution within the study area, a Principal Component Analysis (PCA) was performed. The relationships between changes in population density—expressed as the percentage change in population density within administrative units calculated for the 1989–2011 period—and the remaining variables were examined:
-
Percentage changes in each land cover class. The changes were related to the total share of a given class within an administrative unit and its area, which allowed the assessment of relative changes in each land cover class.
-
Variables describing natural environmental and infrastructural components influencing population distribution, such as landform characteristics, location, and distance-related conditions (see Table 2 for details).
The data listed in Table 4 indicate that eight variables were strongly related (r > 0.9) with the relationship between population and land cover changes in the study area. These variables can be grouped into three main components influencing the observed changes: topography, settlement location, and transport accessibility. These factors determine the spatial accessibility of the area, and their mutual relationships shape the level of urbanisation, which in turn affects the interaction between population density and land cover changes at the regional scale.
In the Main Geographical Region
Due to the strong correlation identified between population density changes and the physical and geographical characteristics of the administrative units, as well as the pronounced vertical and horizontal differentiation of the study area, further calculations were conducted in accordance with the established physical and geographical regionalisation [43], following the east–west division.
The relationships between population density changes (expressed as differences in population density between 1989 and 2011) and other variables were calculated (Table 5). To minimise the internal variation in population density changes, logarithmic transformations were applied. Population density changes were analysed in both relative and absolute terms (absolute meaning the proportion of change relative to the initial state). Log-transformed values were included in subsequent analyses because they best approximated a normal distribution.
A mixed model [61] was used to build the model. Two main assumptions were made: (1) the explanatory variables were invariant, and (2) the response variable (Y) represented the difference in population density between 1989 and 2011. The values presented in Table 5 indicate the direction and magnitude of land cover changes relative to population density changes. For example, a value of two means that land cover changes were twice as large as the corresponding population density changes. Positive and negative values indicate the direction of the relationship.

5. Discussion

Changes in population density are not uniform throughout the study area, and this parameter varies spatially (Figure 3A,B). Most villages located in the eastern part of the study area have negative values (for 75% of the units, the decrease in population density exceeded −8, with a median value of –3 people·km−2), in contrast to the administrative units located in the remaining parts of the area.
The explanation for this pattern lies in historically conditioned political circumstances. The changes initiated in the 1990s triggered a gradual shift from agriculture and industry to services. As a result, by the early 21st century, the western part of the Polish Carpathians had become a major national centre for the development of services and modern technologies [65], which was reflected in its increasing population density. The same transformation led to depopulation in the eastern part of the Polish Carpathians. This process was driven by migration and a decline in natural population growth caused by the ageing of society [64,66]. These trends were further intensified by the expansion of the service sector in urban areas, which resulted in the migration of young people to larger cities [67], as well as by the collapse of agricultural activity [68]. This process is visible across the entire study area during the analysed period, through the growth of suburban zones around Kraków, Rzeszów, and other major towns. This suburban expansion occurs largely at the expense of the populations from peripheral regions [69,70].
In the 21st century, however, the development of tourism and the influx of EU subsidies contributed to the gradual economic activation of the eastern Beskidy [71]. Nevertheless, compared with other parts of the Carpathians, this eastern region still remains the area with the lowest population density.
The results of land cover changes during the period 1990–2012 indicate a significant (more than twofold) increase in the area of polygons classified as built-up (urban fabric), mainly at the expense of heterogeneous agricultural areas. This change can be explained by the fact that heterogeneous agricultural areas in the Polish Carpathians form a mosaic of small family farms, widely scattered and composed of numerous small homesteads [9]. In these areas, the concentration of new buildings/housing estates, particularly around major towns, led to their reclassification as urban fabric after approximately 20 years.
The area of arable land also increased, primarily at the expense of heterogeneous agricultural areas too. This occurred in areas of low attractiveness for residential construction, which are typically characterised by economic stagnation. In such areas, a reduction in agricultural buildings and agriculture-related facilities was observed; the resulting lands of this class were classified as arable land. An increase in class arable land was also recorded at the expense of pastures, although these changes are likely related to the classification procedures of the CLC database rather than to actual land cover changes observed in the field [72].
The last land cover class that visible expanded was forest. This process resulted from the abandonment of agriculture in less favourable areas and reflects an advanced stage of forest succession.
Factors determining changes in population density can be described in terms of stimulants and destimulants. Among the stimulants, the highest correlation was observed for road density, which is consistent with general models linking regional economic development with internal transport and communication infrastructure [73,74,75]. A similarly high correlation of population density changes was recorded for macroregions, defined as natural units sharing similar physical and geographical characteristics (landform, soils, climate, water conditions, vegetation, etc.). This relationship, which links socio-economic dynamics with physical and geographical features, indicates that regional development largely depends on natural conditions.
Two further stimulants are represented by geographical longitude and minimum altitude (m a.s.l.). The longitude as a stimulant is determined by historical relations and the presence of more developed areas, i.e., industrialised areas in the west of the region contrary to the eastern part of the study area (mentioned at the beginning of this chapter). Altitude is related to the areas located at the lowest altitude, which have more favourable conditions for the development of settlement and, therefore, were historically inhabited first [63]. Consequently, these areas still experience high dynamics of population density change. The role of the terrain condition is also partially confirmed by the stimulant closely related to the previous one, namely the distance from the country border. The southern border of Poland runs along the main Carpathian ridge (Figure 1) with lower predisposition for settlement activities [76,77]. As a result, the dynamics of population density change increase northwards, from the border towards the central and northern parts of the study area. Among the demographic stimulants, the most significant were initial population density (in 1989) and its derivative—the gender index (the gender index reflects urbanisation processes and indicates the level of economic activity [78]). Both stimulants demonstrate the influence of initial demographic conditions.
Destimulants are closely related to the location and its consequence, i.e., communication accessibility. Five of the lowest correlation values represent variables related to distances from the main roads and from the centre of the nearest district town (main roads in the study area constitute only 7% of all roads). Roads connect the most important centres of southern Poland with the main towns of the study area. These roads connect the key centres of southern Poland with the major towns of the region and generally follow historical trade and communication routes, along which larger towns developed during the early stages of Carpathian settlement. Today, most of these towns have the status of district capitals and serve as local administrative and service centres of the lowest level [79]. The increase in distance from these small, but significant in the spatial structure settlement units and roads results in the growth of the peripherality of the area, as illustrated by the values of the destimulants. The high value of the last two destimulants, i.e., the latitude and latitude of the maximum elevation in the administrative unit, is opposite to the stimulants: elevation m a.s.l. and distance from the southern state border. The closer a location is to the northern boundary of the study area, the gentler the terrain gradients and elevations, resulting in more favourable conditions for land management, a longer settlement history, and better-developed infrastructure.
The PCA indicates that eight variables strongly correlate (r > 0.9) with the relationship between population and land cover changes in the Polish Carpathians. These variables can be grouped into three main categories:
(a)
Topography, represented by the average slope gradient;
(b)
Location, described by the centroid of the village or town and the position of its maximum elevation;
(c)
Transport accessibility, reflected by the total length of all roads and the distance to major roads or motorway entrances/exits.
The relief, represented in this case by the slope gradient, is a physical–geographical feature of the landscape and is of primary importance—it explains the relationship between population and land cover changes for the remaining seven variables. The slope gradient in villages and towns is a natural factor influencing settlement attractiveness. Historically, in the Polish Carpathians, the most favourable areas—those with gentle slopes—were settled first. When these areas were exhausted, new villages were established in less favourable locations, often with steeper slopes (but also with unfavourable water access, aspects, soils, etc.). Hence, areas with steep slopes and low agricultural potential were the last to be chosen for settlement. Villages in these least attractive areas continued to be established until the 18th century, mainly due to a shortage of arable land and overpopulation in the historical region of Galicia [41,63].
The changes observed over the analysed period of approximately 20 years reflect this historical pattern: the greatest transformations occur in areas that are currently the most peripheral—those distant from major urban centres and main roads (depopulation and abandonment of agriculture)—as well as around large towns (e.g., development of suburbs in former agricultural areas). These patterns are confirmed by the variables represented by the X and Y coordinates and by the indicators of accessibility to main roads.
All variables demonstrate that location has been and remains of key importance. It should be emphasised that the PCA results correspond closely with the identified stimulants and destimulants.
The interactions between the changes in population density and land cover changes in the geographical regions, direction and their magnitude, are important to be aware of during the final step of analysis. Considering built-up areas, changes in population density corresponded closely to changes in built-up land within each major physico-geographical unit. This relationship can be explained by the fact that the Fore-Carpathian Basins and Foothills include the region’s largest cities, with expanding suburban zones surrounding them [70,80]. In the Beskidy, Tatra Mountains, and Podhale, which are popular tourist destinations, the so-called second homes played an important role in the expansion of built-up areas [81]. These are houses constructed by residents of large Polish cities (e.g., Warsaw or Kraków) and used only during holidays or intentionally built for short-term rental to tourists [82].
The analysis revealed some interesting regional differences that occur in the Beskidy in relation to eastern and western parts. In the eastern part, a one-unit change in population density corresponded to nearly a sixfold change in built-up areas. In the eastern part of the Beskidy, there is a historically low increase in population density (or even depopulation, see Figure 2 and Figure 3), which influences a decrease in built-up areas. As a result, attributes of some polygons are shifted, in this case, from partially inhabited built-up areas to agricultural or forest areas [83]. Therefore, after a detailed analysis, it was determined that the key role at this point was played by the change in the status of the polygons in, and not by, the actual changes in the structure. In the western part, the increase in built-up areas resulted from a more urban and industrial spatial structure, as well as from the expansion of tourism-oriented zones and the development of second homes.
Within the commercial and transport class, changes in transport development had the strongest impact on overall variations in this CLC category. Since the 1990s, the study area has experienced a steady development of the main road network whereas the area covered by industrial and commercial units has not changed significantly [70,84]. These changes resulted from the construction of numerous city bypasses and roads connecting the major transport corridors in the study area, which has been carried out since the beginning of the 1990s. This development generally occurred within and around the major towns of the region. As a consequence, the expansion of the transport network took place mainly in areas with low population growth, which were already characterised by relatively well-developed infrastructure. The largest towns of the region are located on the border of the Carpathians, hence the negative value for the Foothills. The high value for the Beskidy (E) indicates, on the one hand, major demographic problems of the region, and on the other hand, extensive investments aimed at economic activation of this part of the Carpathians (implemented largely under the EU cohesion policy) [85]. There is also a strong relationship between changes in population density and CLC classes such as mines, landfills, and construction sites (note that quarries are the most frequent type of mine). In the Carpathians, following numerous infrastructure investments, the number of sites where the aggregates used in construction are extracted has increased (although these are mostly reactivated old locations). The most intensely studied relationship is visible in the Foothills where, apart from quarries, gravel pits are exploited in riverbeds. The Carpathians (in fact mainly in the Foothills) and the Fore-Carpathian Basins contain 17% of Poland’s natural aggregate resources. Their extraction increased from about 60 million tonnes in 1990 to 80 million tonnes in 2004 and to 250 million tonnes in 2011. Moreover, for example, only in 2011 was the largest increase in mining of aggregate in the country recorded in the eastern part (Foothills E) of the study area [86].
The relationship between changes in arable lands and population density was also diagnosed. Generally, the abandonment of agriculture areas from the most disadvantaged areas is well documented in the Polish Carpathians [9,28,30,82,87,88]. Arable land decreases with increasing slope gradients and elevation a.s.l., and this process accelerated rapidly with the beginning of the political changes in the 1990s [30]. The strong fragmentation and dispersion of agricultural parcels also played an important role here. A certain inhibition of this phenomenon, and even densification of agricultural land and reuse of previously set-aside fields, was recorded after Poland’s accession to the EU in connection with the launch of the system of subsidies for farmers. The relationship between changes in arable lands and population density is positive (+) only in the western part of the Foothills. The entire Foothills are characterised by favourable natural conditions for agriculture (e.g., gentle slopes, climate, fertile soils), stimulating a relatively slow decline in agriculture. In this case, the east–west differences result from the varying rates of change in population density. A similar relationship was observed for pastures. In this case, grasslands constitute a transitional stage between arable lands (after the cessation of cultivation) and the CLC shrub and/or herbaceous vegetation associations. It should also be noted that the opposite process also took place in the study area. After Poland’s accession to the EU, some of the abandoned arable lands (classified as pastures in 1990) were reused, which was related to the possibility of obtaining financial subsidies [89].
The heterogeneous agricultural areas class recorded the greatest loss. Built-up areas increased, among others, at the expense of this class (see Section 4.2). The slight increase in the share of this class in relation to population changes, observed in the western part of the study area (both in the Foothills and Beskidy), should be associated with the type of settlement pattern. In the western part, buildings are traditionally concentrated, whereas in the eastern part of the study area, the situation is the opposite—compact village centres are surrounded by scattered hamlets and farms [90]. Therefore, building density is higher and more spatially dispersed in the eastern part than in the western part, which explains the decrease in the area of this class in relation to population density changes.
Changes in forest cover in the Polish Carpathians have been well documented since the 18th century [28,91,92,93]. A systematic increase in forestation has been observed in the study area, mainly as a result of agricultural withdrawal. This process is particularly pronounced in the Beskidy. In the analysed case, changes in forest cover showed positive values only in the Fore-Carpathian Basins and in the western part of the Foothills, i.e., in those areas with relatively low nominal forest cover. Therefore, a relatively small increase resulted in a positive relationship with population density growth. A similar situation applies to the class shrub and/or herbaceous vegetation associations, which should be considered together with forests. In the Carpathians, this is a transitional stage between the regression phase of agriculture, where abandoned fields undergo a natural regeneration processes; but they are not forests yet.
The relationship between changes in population density and water areas mainly concerns artificial reservoirs, as the parameters of Carpathian rivers usually do not meet the minimum mapping unit width for linear features (100 m). However, the increase in the area of these features is very small (by 121%), such that the relationship with the changes in population density should be associated with demographic processes and not with large-scale water management.
Finally, the input data should be critically examined. This study identifies several limitations related mainly to the input data and methodological constraints. Demographic statistics at the level of the lowest administrative units (villages and towns) are aggregated infrequently—after the data collected in 2011, the next available dataset refers to 2021. There is a complete lack of seasonal population data, which is particularly relevant in the context of the second-home phenomenon. Furthermore, although the applied statistical analyses and models identify relationships between variables, the causal direction of these interactions often remains a matter of interpretation. Vector data generated at an European level require an extra comment. Undeniably, CLC is the most unified database in Europe. The minimum mapping unit (MMU) for the CLC is 25 hectares for polygon phenomena and 100 m for linear phenomena [53]. Each class of land cover is strictly defined; therefore, the data is fully comparable across the whole of Europe. However, when several types of land cover are found in one polygon, the code of the dominant land cover type is assigned. Therefore, in cases in which the balance of land cover is close to 50/50% and the structure of the plots is strongly fragmented, a small change can affect the code of the whole polygon. This situation occurred in the study area, at the Orawa-Podhale Basin. The relatively small-scale reuse of arable land after Poland’s accession to the EU in 2004 (due to subsidies for farmers) resulted in code changes of a large polygon covering this region, from pasture in 1990 to arable land in 2012. As a result, the diagnosed changes were in fact smaller than the indicators for this part of study area show.

6. Summary

The analysis presented in this paper is based on the lowest level of statistical data units (villages and towns), which is novel because previous studies have focused on the data collected at the commune level or test polygons. This approach, although more time-consuming and labour-intensive, guarantees greater resolution of information and better detection of changes and also allows for a broader and more comprehensive view of the transformations that have occurred.
The research revealed that population distribution in the Polish part of the Carpathians is highly heterogeneous. The dualism of natural, political, and socio-economic factors determined the initial state of the research for 1989. From 1989 to 2011, the population increased in over 3/4 of the administrative units, but these changes were highly diversified vertically and horizontally, clearly performed by the stimulant values (Y coordinate) and destimulant values (X coordinate). Differences in the population distribution (east–west) were forced by historical contributions, in particular, migration movements related to the changes in Poland’s borders in the 20th century and political decisions, as well as the distance from large industrial centres located in the west of the study area. The north–south diversity should be related to natural conditions. The northern part of the study area features the best natural conditions (lower elevation a.s.l., less steep slopes, better soils and better infrastructure), which is why it was inhabited the earliest. These are also the most densely populated areas, where the largest and most important towns of the region are located. One of the main drivers of changes in population density turned out to be low altitude (a.s.l.) in a settlement unit, while the main destimulant was higher altitudes of villages/towns.
Along with population changes in 20% of the study area, changes in land cover have occurred and they concerned 90% of administrative units. There was a significant increase in the area occupied by settlement development, infrastructure and agricultural classes such as urban fabric, industrial, commercial, and transport units, and also mines, dumps, and construction sites. Areas covered by pastures and heterogeneous agricultural areas decreased, but at the same time, the areas of renaturalization classes such as forest and shrub and/or herbaceous vegetation associations increased.
The changes in land cover were the starting point to check if there is an interaction between spatial and temporal changes in population and the land cover structure in this part of the Carpathians. Detailed statistical analyses showed that the increase in built-up areas occurred at the expense of heterogeneous agricultural areas, thus determining the density of existing buildings. This process was stronger in the eastern part of the Carpathians, where traditional settlements were more dispersed and in the analysed period, they became denser rather than escalating to new areas.
We observed that greater population growth occurred in the areas with initially lower population density. Further analyses showed that population density changes in urban areas are greater than in rural areas, with road density being one of the most important stimulants. The greatest increase in population density in rural areas did not occur in typically agricultural areas, but around the largest towns. Throughout the study area, the initial situation in 1989 had a very strong impact on the condition of the population in 2011. The level of economic development at the beginning of the transformation in the 1990s is determined by gender index, which turned out to be one of the seven main stimulants in this study.
A strong relationship between changes in population density and distance from district capitals and the most important roads is observed. With increasing distance between villages and district towns, population density decreased, and similarly, the smaller the distance from transport infrastructure, the greater the increase in population density. In the northern and western parts of the study area, the development of the communication network took place in the areas where the initial population density was high and, as a result, its growth was relatively low compared to the unit area. At the same time, these were the areas with relatively well-developed infrastructure, mainly villages located around cities/major towns where, among others, ring roads and suburban settlements were built, and since the end of the 20th century, large shopping and service centres too. In the south-eastern part, the increase in the area occupied by communication and service infrastructure was up to 45 times greater than the change in population density. This is a consequence of the attempts to activate this area through increased investments along with the construction of roads, including those of the highest rank, connecting Poland with southern Europe and running through the Carpathians (e.g., Via Carpatia). The investments are followed by the development of open-pit mines, particularly evident in the eastern part of the Foothills, where gravel from riverbeds is being massively exploited.
The decline in agriculture reflects changes in population density in relation to changes in arable land area. Only in the western Foothills, this relation is positive and was mainly conditioned by the pace of population density changes (high initial density and relatively low growth) and not by the changes in area of agricultural land. A similar relationship exists in the case of pastures, with the difference being that a positive value is only recorded in the eastern part of the Foothills where grasslands are at a transitional stage between arable lands and shrub and/or herbaceous vegetation associations and forests.

7. Conclusions

Despite these limitations, the adopted approach provides a solid basis for analysing long-term structural processes in a mountainous environment undergoing socio-economic transformation. The results confirm the substantial impact of the initial stage on socio-economic development and illustrate a broader pattern in which more urbanised areas exhibit higher dynamics—an important finding for forecasting future development scenarios.
Although this study focuses on the Polish Carpathians, many of the observed processes reflect broader trends documented across the countries located within the Carpathian region. The economic transformation that began in the 1990s served as a common turning point, and the influence of historical socio-economic conditions is evident throughout the region.
The results obtained in this study can serve as a basis for broader policy recommendations. The development of suburban areas, even after the end of the transition period, should follow the principles of sustainability, and local governments should promote the prudent conversion of agricultural and green land for construction purposes. A key recommendation is to strengthen the development of peripheral rural areas and support them in order to counteract economic exclusion. It is also essential to enhance cross-border cooperation throughout the Carpathian region, linking integrated EU areas with those located outside the European Union. An example of an initiative addressing such challenges is the Carpathian Convention, which “promotes comprehensive policies and cooperation aimed at environmental protection and sustainable development throughout the region” [94].

Author Contributions

Conceptualisation, R.K., S.D. and T.B.; methodology, S.D. and T.B.; software, R.K. and S.D.; validation, R.K., S.D. and T.B.; formal analysis, R.K., S.D. and T.B.; investigation, R.K., S.D., T.B. and J.O.; resources, R.K.; data curation, R.K.; writing—original draft preparation, R.K., S.D. and T.B.; writing—review and editing, R.K., T.B. and J.O.; visualisation, R.K. and T.B.; supervision, R.K. and J.O.; project administration, R.K. and T.B.; funding acquisition, R.K. and T.B. All authors have read and agreed to the published version of the manuscript.

Funding

This research was funded by University of the National Education Commission in Krakow, grant number WPBU/2024/03/00111.

Data Availability Statement

The original data presented in the study are openly available and databases used in this paper are described in the references section.

Conflicts of Interest

The authors declare no conflicts of interest.

References

  1. Mathijs, E.; Swinnen, J.F. The economics of agricultural decollectivization in East Central Europe and the former Soviet Union. Econ. Dev. Cult. Chang. 1998, 47, 1–26. [Google Scholar] [CrossRef]
  2. Lerman, Z. Land reform and farm restructuring: What has been accomplished to date? Am. Econ. Rev. 1999, 89, 271–275. [Google Scholar] [CrossRef]
  3. Václavík, T.; Rogan, J. Identifying trends in land use/land cover changes in the context of post-socialist transformation in central Europe: A case study of the greater Olomouc region, Czech Republic. GIScience Remote Sens. 2009, 46, 54–76. [Google Scholar] [CrossRef]
  4. Baumann, M.; Kuemmerle, T.; Elbakidze, M.; Ozdogan, M.; Radeloff, V.C.; Keuler, N.S.; Prishchepov, A.V.; Kruhlov, I.; Hostert, P. Patterns and drivers of post-socialist farmland abandonment in Western Ukraine. Land Use Policy 2011, 28, 552–562. [Google Scholar] [CrossRef]
  5. Kupková, L.; Bičík, I.; Najman, J. Land cover changes along the iron curtain 1990–2006. Geografie 2013, 118, 95–115. [Google Scholar] [CrossRef]
  6. Peterson, U.; Aunap, R. Changes in agricultural land use in Estonia in the 1990s detected with multitemporal Landsat MSS imagery. Landsc. Urban Plan. 1998, 41, 193–201. [Google Scholar] [CrossRef]
  7. Nikodemus, O.; Bell, S.; Grı̄ne, I.; Liepiņš, I. The impact of economic, social and political factors on the landscape structure of the Vidzeme Uplands in Latvia. Landsc. Urban Plan. 2005, 70, 57–67. [Google Scholar] [CrossRef]
  8. Lieskovský, J.; Bezák, P.; Špulerová, J.; Lieskovský, T.; Koleda, P.; Dobrovodská, M.; Bürgi, M.; Gimmi, U. The abandonment of traditional agricultural landscape in Slovakia–Analysis of extent and driving forces. J. Rural Stud. 2015, 37, 75–84. [Google Scholar] [CrossRef]
  9. Kolecka, N.; Kozak, J.; Kaim, D.; Dobosz, M.; Ostafin, K.; Ostapowicz, K.; Wężyk, P.; Price, B. Understanding farmland abandonment in the Polish Carpathians. Appl. Geogr. 2017, 88, 62–72. [Google Scholar] [CrossRef]
  10. Kuemmerle, T.; Hostert, P.; Radeloff, V.C.; van der Linden, S.; Perzanowski, K.; Kruhlov, I. Cross-border comparison of post-socialist farmland abandonment in the Carpathians. Ecosystems 2008, 11, 614–628. [Google Scholar] [CrossRef]
  11. Munteanu, C.; Kuemmerle, T.; Boltiziar, M.; Butsic, V.; Gimmi, U.; Halada, L.; Kaim, D.; Király, G.; Konkoly-Gyuró, É.; Kozak, J.; et al. Forest and agricultural land change in the Carpathian region-A meta-analysis of long-term patterns and drivers of change. Land Use Policy 2014, 38, 685–697. [Google Scholar] [CrossRef]
  12. Bański, J. The consequences of changes of ownership for agricultural land use in Central European countries following the collapse of the Eastern Bloc. Land Use Policy 2017, 66, 120–130. [Google Scholar] [CrossRef]
  13. Bucała-Hrabia, A. Reflections on land use and land cover change under different socio-economic regimes in the Polish Western Carpathians. Reg. Environ. Change 2024, 24, 28. [Google Scholar] [CrossRef]
  14. Sachs, J. The economic transformation of Eastern Europe: The case of Poland. Econ. Plan. 1992, 25, 5–19. [Google Scholar] [CrossRef]
  15. Kuszewski, T.; Sielska, A. Efektywność sektora rolnego w województwach przed i po akcesji Polski do Unii Europejskiej [Polish agriculture sector performance by province before and after the country’s accession to the European Union]. Gospod. Nar. 2012, 254, 19–42. [Google Scholar] [CrossRef]
  16. Poczta, W. Przemiany w rolnictwie polskim w okresie transformacji ustrojowej i akcesji Polski do UE [Changes in Polish Agriculture in the Period of Political Transformation and Accession of Poland to the EU]. Wieś I Rol. 2020, 2, 57–77. [Google Scholar]
  17. Grešlová, P.; Štych, P.; Salata, T.; Hernik, J.; Knížková, I.; Bičík, I.; Jelečeka, L.; Prus, B.; Noszczyk, T. Agroecosystem energy metabolism in Czechia and Poland in the two decades after the fall of communism: From a centrally planned system to market oriented mode of production. Land Use Policy 2019, 82, 807–820. [Google Scholar] [CrossRef]
  18. Leśniewska-Napierała, K.; Nalej, M.; Napierała, T. The impact of EU grants absorption on land cover changes—The case of Poland. Remote Sens. 2019, 11, 2359. [Google Scholar] [CrossRef]
  19. Pawlak, K.; Poczta, W. Twenty Years of Poland’s EU Membership: What Is Progress in the Agri-Food Sector? Agriculture 2025, 15, 49. [Google Scholar] [CrossRef]
  20. Michniak, D.; Więckowski, M.; Stępniak, M.; Rosik, P. The impact of selected planned motorways and expressways on the potential accessibility of the Polish-Slovak borderland with respect to tourism development. Morav. Geogr. Rep. 2015, 23, 13–20. [Google Scholar] [CrossRef]
  21. Sroka, W.; Pölling, B.; Wojewodzic, T.; Strus, M.; Stolarczyk, P.; Podlinska, O. Determinants of farmland abandonment in selected metropolitan areas of Poland: A spatial analysis on the basis of regression trees and interviews with experts. Sustainability 2019, 11, 3071. [Google Scholar] [CrossRef]
  22. Grădinaru, S.R.; Iojă, C.I.; Onose, D.A.; Gavrilidis, A.A.; Pătru-Stupariu, I.; Kienast, F.; Hersperger, A.M. Land abandonment as a precursor of built-up development at the sprawling periphery of former socialist cities. Ecol. Indic. 2015, 57, 305–313. [Google Scholar] [CrossRef]
  23. Bičı́k, I.; Jeleček, L.; Štěpánek, V. Land-use changes and their social driving forces in Czechia in the 19th and 20th centuries. Land Use Policy 2001, 18, 65–73. [Google Scholar] [CrossRef]
  24. Munteanu, C.; Kuemmerle, T.; Boltiziar, M.; Lieskovský, J.; Mojses, M.; Kaim, D.; Konkoly-Gyuro, E.; Mackovcin, P.; Muller, D.; Ostapowicz, K.; et al. Nineteenth-century land-use legacies affect contemporary land abandonment in the Carpathians. Reg. Environ. Change 2017, 17, 2209–2222. [Google Scholar] [CrossRef]
  25. Bucała-Hrabia, A. Long-term impact of socio-economic changes on agricultural land use in the Polish Carpathians. Land Use Policy 2017, 64, 391–404. [Google Scholar] [CrossRef]
  26. Săvulescu, I.; Mihai, B.A.; Vîrghileanu, M.; Nistor, C.; Olariu, B. Mountain arable land abandonment (1968–2018) in the Romanian Carpathians: Environmental conflicts and sustainability issues. Sustainability 2019, 11, 6679. [Google Scholar] [CrossRef]
  27. Latocha, A. Land-use changes and longer-term human–environment interactions in a mountain region (Sudetes Mountains, Poland). Geomorphology 2009, 108, 48–57. [Google Scholar] [CrossRef]
  28. Kroczak, R.; Fidelus-Orzechowska, J.; Bucała-Hrabia, A.; Bryndal, T. Land use and land cover changes in small Carpathian catchments between the mid-19th and early 21st centuries and their record on the land surface. J. Mt. Sci. 2018, 15, 2561–2578. [Google Scholar] [CrossRef]
  29. Kanianska, R.; Kizeková, M.; Nováček, J.; Zeman, M. Land-use and land-cover changes in rural areas during different political systems: A case study of Slovakia from 1782 to 2006. Land Use Policy 2014, 36, 554–566. [Google Scholar] [CrossRef]
  30. Bucała-Hrabia, A. From communism to a free-market economy: A reflection of socio-economic changes in land use structure in the Vicinity of the city (Beskid Sądecki, Western Polish Carpathians). Geogr. Pol. 2017, 90, 65–79. [Google Scholar] [CrossRef]
  31. Ortyl, B.; Kasprzyk, I. Land abandonment and restoration in the Polish Carpathians after accession to the European Union. Environ. Sci. Policy 2022, 132, 160–170. [Google Scholar] [CrossRef]
  32. MacDonald, D.; Crabtree, J.R.; Wiesinger, G.; Dax, T.; Stamou, N.; Fleury, P.; Gutierrez Lazpita, J.; Gibon, A. Agricultural abandonment in mountain areas of Europe: Environmental consequences and policy response. J. Environ. Manag. 2000, 59, 47–69. [Google Scholar] [CrossRef]
  33. Cegielska, K.; Noszczyk, T.; Kukulska, A.; Szylar, M.; Hernik, J.; Dixon-Gough, R.; Jombach, S.; Valánszki, I.; Filepné Kovács, K. Land use and land cover changes in post-socialist countries: Some observations from Hungary and Poland. Land Use Policy 2018, 78, 1–18. [Google Scholar] [CrossRef]
  34. Feranec, J.; Hazeu, G.; Christensen, S.; Jaffrain, G. Corine land cover change detection in Europe (case studies of the Netherlands and Slovakia). Land Use Policy 2007, 24, 234–247. [Google Scholar] [CrossRef]
  35. Petrişor, A.-I.; Sirodoev, I.; Ianoş, I. Trends in the national and regional transitional dynamics of land cover and use changes in Romania. Remote Sens. 2020, 12, 230. [Google Scholar] [CrossRef]
  36. Lennert, J.; Farkas, J.Z.; Kovács, A.D.; Molnár, A.; Módos, R.; Baka, D.; Kovács, Z. Measuring and predicting long-term land cover changes in the functional urban area of Budapest. Sustainability 2020, 12, 3331. [Google Scholar] [CrossRef]
  37. Veith, T.; Jebavý, M. Landscape changes of Prague outskirts from 1990 to 2012. Hortic. Sci. 2017, 44, 156–161. [Google Scholar] [CrossRef]
  38. Wnęk, A.; Kudas, D.; Stych, P. National level land-use changes in functional urban areas in Poland, Slovakia, and Czechia. Land 2021, 10, 39. [Google Scholar] [CrossRef]
  39. Lados, G.; Nagy, D.; Horeczki, R. Economic and demographic dynamics in Central European border regions between 2014–2020. Deturope 2024, 16, 99–120. [Google Scholar] [CrossRef]
  40. Starkel, L. Charakterystyka rzeźby polskich Karpat i jej znaczenie dla gospodarki ludzkiej [An outline of the relief of the Polish Carpathians and its impertance for human management]. Probl. Zagospod. Ziem Górskich 1972, 10, 75–150. [Google Scholar]
  41. Wojciech Solarz, M. Village names as a source of knowledge of the past: Toponyms in the Olszynka Valley in the Ciężkowickie Foothills. Acta Univ. Lodziensis. Folia Geogr. Socio-Oeconomica 2016, 25, 63–81. [Google Scholar]
  42. Łajczak, A.; Wałek, G.; Zarychta, R. Relief of the Orawa-Nowy Targ Basin, Western Carpathians. Geogr. Pol. 2024, 97, 447–472. [Google Scholar] [CrossRef]
  43. Solon, J.; Borzyszkowski, J.; Bidłasik, M.; Richling, A.; Badora, K.; Balon, J.; Brzezińska-Wójcik, T.; Chabudziński, Ł.; Dobrowolski, R.; Grzegorczyk, I.; et al. Physico-geographical mesoregions of Poland: Verification and adjustment of boundaries on the basis of contemporary spatial data. Geogr. Pol. 2018, 91, 143–169. [Google Scholar] [CrossRef]
  44. Dorocki, S.; Struś, P. Przestrzenne zróżnicowanie dynamiki rozwoju lokalnego w Małopolsce na podstawie wybranych cech społeczno-gospodarczych [Spatial differentiation of the dynamics of local development in Malopolska based on selected socio-economic factors]. Stud. Ind. Geogr. Comm. Pol. Geogr. Soc. 2017, 31, 7–25. [Google Scholar]
  45. Żukowski, R. Historical path dependence, institutional persistence, and transition to market economy: The case of Poland. Int. J. Soc. Econ. 2004, 31, 955–973. [Google Scholar] [CrossRef]
  46. Pawlusiński, R.; Piziak, B. Tourism potential and possibilities of its exploitation in the Subcarpathian (Podkarpackie) voivedeship. Folia Geogr. 2009, 49, 223–237. [Google Scholar]
  47. Dorocki, S. Tourist regions as places of development of innovativeness. Curr. Issues Tour. Res. 2014, 4, 50–57. [Google Scholar]
  48. Rachwał, T. Effects of restructurings of industrial enterprises in south-east Poland. Stud. Ind. Geogr. Comm. Pol. Geogr. Soc. 2006, 9, 98–115. [Google Scholar] [CrossRef]
  49. Statistics Poland (Główny Urząd Statystyczny—GUS). Mały Rocznik Statystyczny Polski 2012 [Concise Statistical Yearbook of Poland 2012]; Statistics Poland: Warsaw, Poland, 2012; Available online: https://stat.gov.pl/download/gfx/portalinformacyjny/pl/defaultaktualnosci/3328/1/14/1/maly_rocznik_statystyczny_polski_2012.pdf (accessed on 9 November 2025).
  50. Statistics Poland (Główny Urząd Statystyczny—GUS). Powierzchnia i Ludność w Przekroju Terytorialnym w 2024 Roku [Area and Population in the Territorial Profile in 2024]; Statistics Poland: Warsaw, Poland, 2024; Available online: https://stat.gov.pl/download/gfx/portalinformacyjny/en/defaultaktualnosci/3286/4/18/1/area_and_population_in_the_territorial_profile_in_2024.pdf (accessed on 9 November 2025).
  51. Statistics Poland, Local Data Bank. Available online: https://bdl.stat.gov.pl/bdl/start (accessed on 10 September 2023).
  52. The European Environment Agency. 2023. Available online: https://www.eea.europa.eu/en (accessed on 1 September 2023).
  53. Heymann, Y. CORINE Land Cover: Technical Guide; Office for Official Publications of European Commision: Brussels, Belgium, 1994. [Google Scholar]
  54. Bossard, M.; Feranec, J.; Otahel, J. CORINE Land Cover Technical Guide: Addendum 2000; European Environment Agency: Copenhagen, Denmark, 2000. [Google Scholar]
  55. Śleszyński, P. Wykorzystanie danych georadarowych SRTM-3 w analizie zróżnicowania ukształtowania terenu Polski [Use of SRTM-3 georadar data in the analysis of differentiation of the Poland’s surface relief]. Przegląd Kartogr. 2009, 41, 237–252. [Google Scholar]
  56. OpenStreetMap, Map Database. 2023. Available online: https://download.geofabrik.de/ (accessed on 1 September 2023).
  57. Gellrich, M.; Baur, P.; Koch, B.; Zimmermann, N.E. Agricultural land abandonment and natural forest re-growth in the Swiss mountains: A spatially explicit economic analysis. Agric. Ecosyst. Environ. 2007, 118, 93–108. [Google Scholar] [CrossRef]
  58. Dorocki, S. The Use of SAS Studio Software in the Analysis And Visualisation of Spatial Data on Historical Changes in Land Use and Land Cover in South-East Poland in the Twentieth Century. Stud. Hist. Oeconomicae 2025, 43, 184–208. [Google Scholar] [CrossRef]
  59. Harman, H.H. Modern Factor Analysis, 3rd ed.; University of Chicago Press: Chicago, IL, USA, 1976. [Google Scholar]
  60. Box, G.E.P.; Tiao, G.C. Bayesian Inference in Statistical Analysis; John Wiley & Sons: New York, NY, USA, 1973. [Google Scholar]
  61. SAS/STAT® 14.2 User’s Guide, The MIXED Procedure. Available online: https://documentation.sas.com/doc/en/statcdc/14.2/statug/statug_mixed_details.htm (accessed on 11 February 2025).
  62. Dobrowolska, M. Procesy Osadnicze w Dorzeczu Wisłoki i Białej Dunajcowej w Tysiącleciu [Settlement Processes in the Wisłoka and Biała Dunajcowa Basins in Last Millennium]; Wydawnictwo Naukowe Wyższej Szkoły Pedagogicznej: Kraków, Poland, 1985. [Google Scholar]
  63. Soja, M. Population Growth Cycles in the Polish Carpathian Mountains During the 19th and 20th Centuries; Jagiellonian University in Kraków: Kraków, Poland, 2008. [Google Scholar]
  64. Dzieciuchowicz, J.; Janiszewska, A. Demographic Situation in Poland After 1990; Łódź University Press: Łódź, Poland, 2014. [Google Scholar]
  65. Brezdno, P. Wybrane aspekty przemian strukturalnych i innowacyjności przemysłu Śląska-ujęcie przestrzenne [Selected aspects of the structural changes and the innovativeness of Silesian industry—A spatial perspective]. Stud. Ind. Geogr. Comm. Pol. Geogr. Soc. 2015, 29, 123–146. [Google Scholar]
  66. Kurek, S.; Wójtowicz, M.; Gałka, J. Functional Urban Areas in Poland: Demographic Trends and Migration Patterns; Springer Nature: Berlin/Heidelberg, Germany, 2020. [Google Scholar]
  67. Gorzelak, G. Polskie regiony w procesie integracji europejskiej [Polish regions in the European integration process]. Stud. Reg. Lokal. 2002, 2–3, 55–73. [Google Scholar]
  68. Klepacki, B.; Żak, A. Agrarian transformations in the territory of Poland before and after integration into the European Union. J. Agribus. Rural Dev. 2013, 4, 95–113. [Google Scholar]
  69. Szymańska, D.; Grzelak-Kostulska, E.; Hołowiecka, B. Polish towns and the changes in their areas and population densities. Bull. Geography. Socio-Econ. Ser. 2009, 11, 15–29. [Google Scholar] [CrossRef]
  70. Gałka, J.; Warych-Juras, A. Suburbanization and migration in Polish metropolitan areas during political transition. Acta Geogr. Slov. 2018, 58, 63–72. [Google Scholar] [CrossRef]
  71. Bajgier-Kowalska, M.; Tracz, M.; Uliszak, R. Modeling the state of agritourism in the Malopolska region of Poland. Tour. Plan. Dev. 2019, 19, 196–218. [Google Scholar] [CrossRef]
  72. Dorocki, S.; Kroczak, R.; Bryndal, T. Zmiany pokrycia terenu w polskich Karpatach na przełomie XX i XXI w. a poziom rozwoju lokalnego [Changes in the land cover in the Polish Carpathians at the turn of the 20th and 21st century in relation to local development level]. Przedsiębiorczość-Eduk. 2019, 15, 214–229. [Google Scholar] [CrossRef]
  73. Glover, D.R.; Simon, J.L. The effect of population density on infrastructure: The case of road building. Econ. Dev. Cult. Change 1975, 23, 453–468. [Google Scholar] [CrossRef]
  74. Quinn, P. Road density as a proxy for population density in regional-scale risk modeling. Nat. Hazards 2013, 65, 1227–1248. [Google Scholar] [CrossRef]
  75. Wolny, A.; Źróbek, R. The interdependence between suburban enclaves and the road network in the development process: A case study in Poland. Geogr. Pol. 2017, 90, 41–57. [Google Scholar] [CrossRef]
  76. Knippenberg, H.; Markusse, J. 19th and 20th century borders and border regions in Europe: Some reflections. In Nationalising and Denationalising European Border Regions, 1800–2000: Views from Geography and History; Springer: Dordrecht, The Netherlands, 1999; pp. 1–19. [Google Scholar]
  77. Kroczak, R.; Bryndal, T.; Biały, S.; Pylypovych, O.; Andreychuk, Y.; Rutar, A. Granica państwa a spójność danych dla potrzeb analiz hydrologicznych. Studium przypadku dla zlewni Wiaru na pograniczu polsko-ukraińskim [A state border and the integrity of data for hydrological analysis. A case study of the River Wiar catchment on the Poland-Ukraine borderland]. Przegląd Geogr. 2020, 92, 69–92. [Google Scholar]
  78. Bański, J.; Pantylej, W.; Janicki, W.; Flaga, M.; Wesołowska, M. Współczesne przekształcenia społeczno-gospodarcze a potencjał ludnościowy wschodniej Polski [Impact of socio-economic transformation on population potential in the Eastern Poland]. Stud. Obsz. Wiej./Rural. Stud. 2014, 36. Available online: https://rcin.org.pl/dlibra/publication/66220/edition/48400?language=en (accessed on 9 November 2025).
  79. Kwiatek-Sołtys, A. Small Towns’ Development Problems, Annales Universitatis Paedagogicae Cracoviensis 178, Studia Geographica 8; Wydawnictwo Naukowe Uniwersytetu Pedagogicznego: Kraków, Poland, 2015. [Google Scholar]
  80. Raźniak, P.; Winiarczyk-Raźniak, A. Influence of the societal security level on population migrations in Poland. Procedia-Soc. Behav. Sci. 2014, 120, 2–12. [Google Scholar] [CrossRef]
  81. Faracik, R.; Kurek, W.; Mika, M.; Pawlusiński, R. Turystyka w Karpatach Polskich w świetle współczesnych kierunków rozwoju [Tourism in the Polish Carpathian Mountains in the light of contemporary directions in tourism development]. In Gospodarka i Przestrzeń; Domański, B., Kurek, W., Eds.; Instytut Geografii i Gospodarki Przestrzennej UJ: Kraków, Poland, 2009; pp. 77–98. [Google Scholar]
  82. Bucała, A. The impact of human activities on land use and land cover changes and environmental processes in the Gorce Mountains (Western Polish Carpathians) in the past 50 years. J. Environ. Manag. 2014, 138, 4–14. [Google Scholar] [CrossRef]
  83. Śleszyński, P.; Gibas, P.; Sudra, P. The problem of mismatch between the CORINE Land Cover data classification and the development of settlement in Poland. Remote Sens. 2020, 12, 2253. [Google Scholar] [CrossRef]
  84. Kurek, S.; Rachwał, T.; Wójtowicz, M. Industrial and commercial suburbanization in post-socialist city: The Kraków Metropolitan Area (Poland). Ann. Univ. Paedagog. Cracoviensis Stud. Geogr. 2014, 5, 55–76. [Google Scholar]
  85. Kudełko, J. Koncepcja inteligentnej specjalizacji na przykładzie regionu podkarpackiego [The concept of smart specialization on the example of the Podkarpackie region]. Pr. Nauk. Uniw. Ekon. We Wrocławiu 2017, 475, 136–147. [Google Scholar]
  86. Szuflicki, M.; Malon, A.; Tymiński, M. Bilans Zasobów Złóż Kopalin w Polsce wg. Stanu na 31.12.2011 [Balance of Mineral Deposits in Poland, Data from 31.12.2011]; The Polish Geological Institute—National Research Institute: Warszawa, Poland, 2012. [Google Scholar]
  87. Kijowska-Strugała, M.; Demczuk, P. Impact of land use changes on soil erosion and deposition in a small Polish Carpathians catchment in last 40 years. Carpathian J. Earth Environ. Sci. 2015, 10, 261–270. [Google Scholar]
  88. Ortyl, B.; Ćwik, A.; Kasprzyk, I. What happens in a Carpathian catchment after the sudden abandonment of cultivation? CATENA 2018, 166, 158–170. [Google Scholar] [CrossRef]
  89. Milczarek-Andrzejewska, D.; Zawalińska, K.; Czarnecki, A. Land-use conflicts and the common agricultural policy: Evidence from Poland. Land Use Policy 2018, 73, 423–433. [Google Scholar] [CrossRef]
  90. Zaborski, B. O Kształtach wsi w Polsce i ich Rozmieszczeniu [Distribution and Shapes of Villages in Poland]; Wydawnictwo PAU: Kraków, Poland, 1926. [Google Scholar]
  91. Kozak, J. Zmiany Powierzchni Lasów w Karpatach Polskich na tle Innych gór Świata [Changes of Forest Cover in the Polish Carpathians in Relation to Other Mountains of the World]; Wydawnictwo Uniwersytetu Jagiellońskiego: Kraków, Poland, 2005. [Google Scholar]
  92. Affek, A. Dynamika Krajobrazu: Uwarunkowania i Prawidłowości na Przykładzie Dorzecza Wiaru w Karpatach (XVIII-XXI Wiek) [Landscape Dynamics: Determinants and Patterns on the Example of the Wiar River Basin in the Carpathians (18th–21st Century)]; IGiPZ PAN: Warsaw, Poland, 2016; Volume 251. [Google Scholar]
  93. Ostafin, K.; Dobosz, M. Mapy lasów Karpat Polskich od 1860 do 2013 r. [Maps of the Polish Carpathians forest from 1860 to 2013 year]. In FORECOM. Podręcznik Użytkownika; Kozak, J., Kaim, D., Eds.; Instytut Geografii i Gospodarki Przestrzennej UJ: Kraków, Poland, 2016; pp. 13–19. [Google Scholar]
  94. Carpathian Convention Secretariat. Framework Convention on the Protection and Sustainable Development of the Carpathians. Available online: www.carpathianconvention.org (accessed on 9 November 2025).
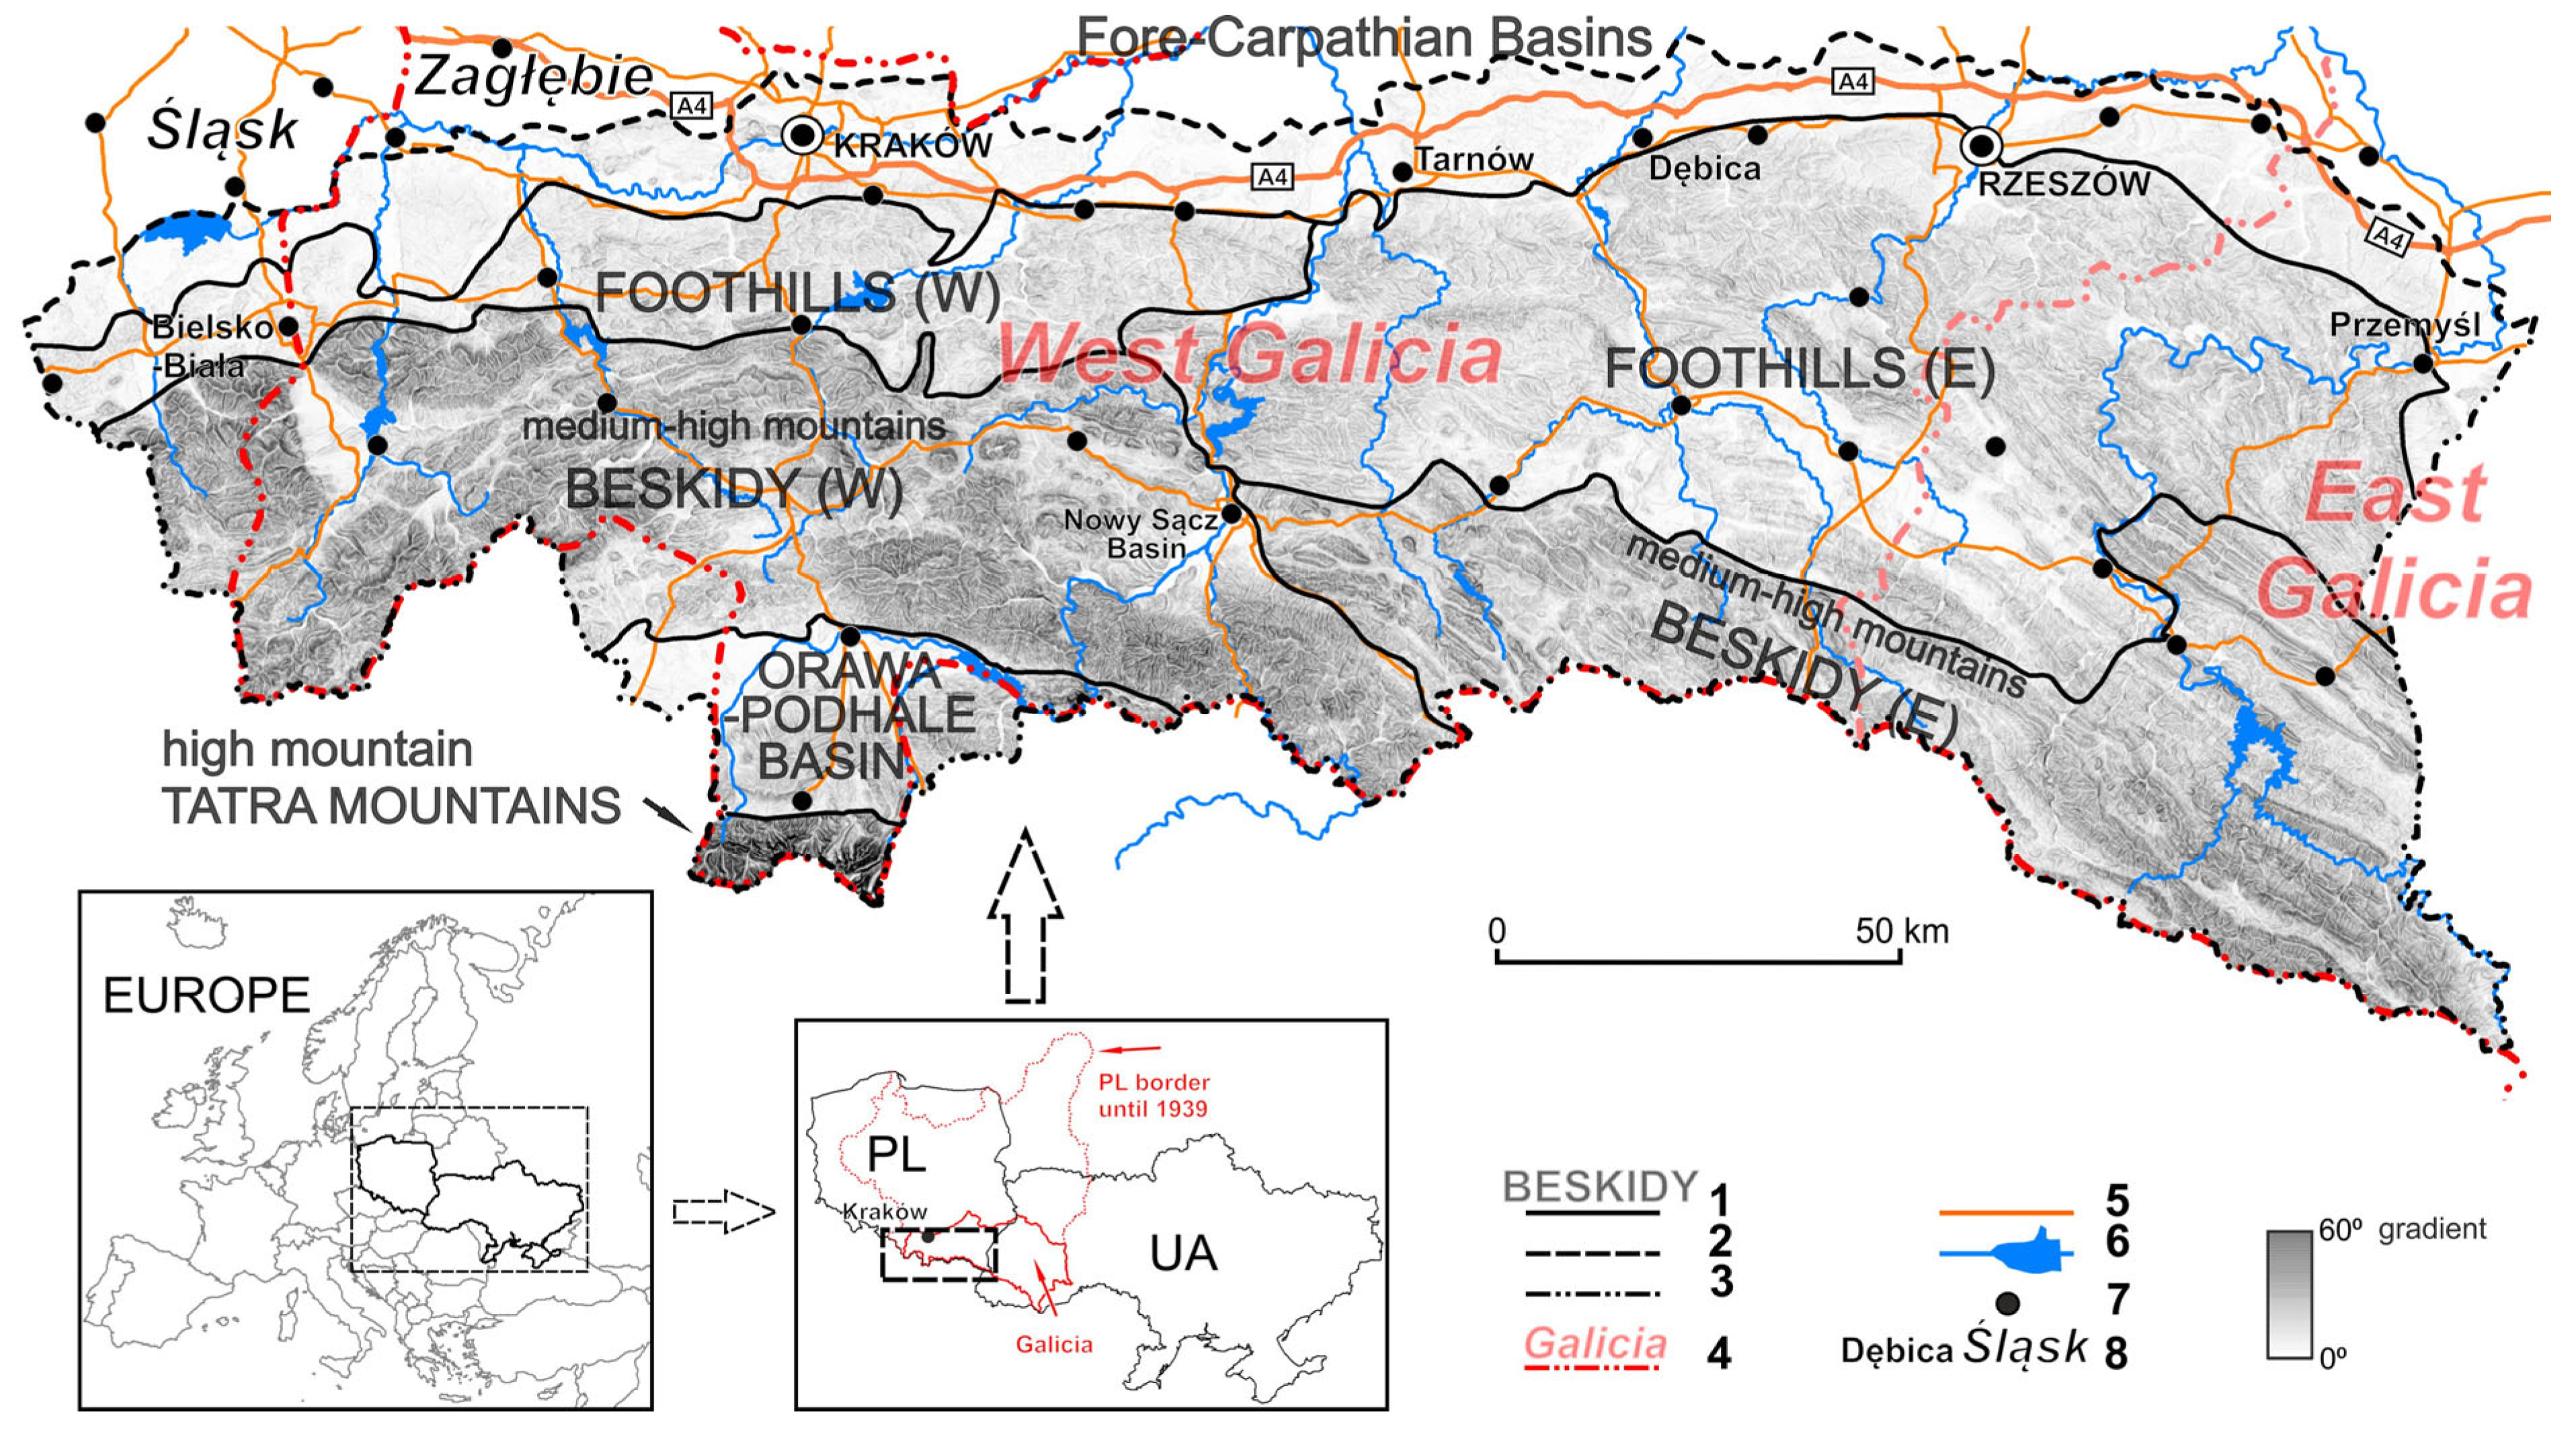
Figure 1. The study area. 1—boundary of the physico-geographical macroregions in the Carpathian and their names (after [43]); 2—north boundary of the study area; 3—east, west, and south boundary of the study area (and boundary of Poland); 4—historical boundaries and names of historical regions (red colour); 5—main roads; 6—main rivers and artificial reservoirs; 7—district capitals; 8—names of towns and regions.
Land 14 02302 g001
Figure 2. Statistics of the population density (people per km2) in town and villages in the Carpathians—(A), and spatial diversity of the population density in 1989—(B).
Land 14 02302 g002
Figure 3. Changes in the population density (people per km2) between 1989 and 2011. Statistics in relation to town and villages in the Carpathians—(A), and spatial diversity—(B).
Land 14 02302 g003
Figure 4. Land cover after CLC data in the Polish Carpathians at the third level in 1990. 111—Continuous urban fabric; 112—Discontinuous urban fabric; 121—Industrial or commercial units; 122—Road and rail networks and associated land; 124—Airports; 131—Mineral extraction sites 132—Dump sites; 133—Construction sites; 141—Green urban areas; 142—Sport and leisure facilities; 211—Non-irrigated arable land; 222—Fruit trees and berry plantations; 231—Pastures; 242—Complex cultivation patterns; 243—Land principally occupied by agriculture, with significant areas of natural vegetation; 311—Broad-leaved forest; 312—Coniferous forest; 313—Mixed forest; 321—Natural grassland; 322—Moors and heathland; 324—Transitional woodland/shrub; 332—Bare rocks; 333—Sparsely vegetated areas; 411—Inland marshes; 412—Peatbogs; 511—Water courses; 512—Water bodies.
Land 14 02302 g004
Figure 5. Changes in the land cover in the Polish Carpathians between 1990 and 2012.
Land 14 02302 g005
Figure 6. The changes in land cover classes in the Polish Carpathians in the years 1990–2012 related to the administrative units (village/town). Red increase/blue decrease.
Land 14 02302 g006
Table 1. The sources of information.
DataRange of InformationSourceType of Data
basic information about administrative unitsName of the basic administrative unitStatistics Poland—administrative units for statistical purposes (SIMC) for 2011vector
Label (unique number) according to TERYT *
Type of administrative unit (town/village)
Boundary of the administrative units (country/province/district/sub-district/town and village)
Area [m2]
physico-
geographical data
Boundaries of the physico-geographical regionsPhysico-geographical mesoregions of Poland
populationWomen and men in 1989Local Data Bank (Statistics Poland)statistical data
Women and men in 2011
land coverCorine Land Cover 1990Copernicus Land Monitoring Servicevector
Corine Land Cover 2012
roadsRoad network and their ranks **OpenStreetMap (OSM)
reliefElevation (m a.s.l) and slope gradient (°) dataShuttle Radar Topography Mission (SRTM)raster (geotiff)
* TERYT—used in Poland, the unique ID number (based on international standards) of administrative units. **—based at condition from 2012 but with fully passable A4 motorway.
Table 2. Variables used for characterisation of each administrative unit and their abbreviations used in tables/graphs.
Name of VariableAbbreviation Used in Tables/GraphsName of VariableAbbreviation Used in Tables/Graphs
RELIEF CONDITIONSLAND COVER cont.
Highest altitude a.s.l. in the village/towns [m]max_elev_mNatural grassland
(code CLC—321)
Shrub and/or herbaceous vegetation associations
(code CLC—32)
268 (168)
shrub/herbal
Minimum altitude a.s.l. in the village/towns [m]min_elev_m
Average altitude a.s.l. in the village/towns [m]avg_elev_mMoors and heathland (code CLC—322)
X coordinate of the point with maximum elevation within the village/townmax_elev_x
Y coordinate of the point with maximum elevation within the village/townmax_elev_yTransitional woodland/shrub
(code CLC—324)
X coordinate of min elevation in the village/townmin_elev_x
Y coordinate of min elevation in the village/townmin_elev_yBare rocks
(code CLC—332)
Open spaces with little or no vegetation
(code CLC—33)
27 (96)
open_spaces
Average slope within the village/town (in degrees)avg_slopeSparsely vegetated areas
code CLC—333)
Physico-geographical regionmacroregion
LAND COVERBurnt areas
(code CLC—334)
Level 3
(code CLC)
Level 2 (code CLC)
Area in km2 in 1990. In brackets () there are the changes in % between 1990 and 2012 (1990 =100%)
Inland marshes
(code CLC—411)
Inland wetlands
(code CLC—41)
26 (81)
wetlands
Peatbogs
(code CLC—412)
Continuous urban fabric
(code CLC—111)
Urban fabric
(code CLC—11)
854 (191)
build-up_areaWater courses
(code CLC—511)
Inland waters
(code CLC—51)
220 (121)
water
Discontinuous urban fabric
(code CLC—112)
Water bodies
(code CLC—512)
Industrial or commercial units
(code CLC—121)
Industrial, commercial and transport units
(code CLC—12)
111 (135)
ind/commer/transpPOPULATION
Road and rail networks and associated land
(code CLC—122)
populationpop
Airports
(code CLC—124)
gender index (women/men)gender
Mineral extraction sites (code CLC—131)Mine, dump and construction sites
(code CLC—13)
24 (246)
mine/dump/constrpopulation densitypop_dens
Dump sites
(code CLC—132)
LOCATION AND DISTANCE
Construction sites
(code CLC—133)
X coordinate of the centroid of the village/town in the metric coordinate systemcentr_X
Green urban areas
(code CLC—141)
Artificial, non-agricultural vegetated areas
(code CLC—14)
39 (115)
urban_green/sportY coordinate of the centroid of the village/town in the metric coordinate systemcentr_Y
Sport and leisure facilities
(code CLC—142)
distance from the village/town centroid to the centre of nearest district capitaldist_to_district
Non-irrigated arable land
(code CLC—211)
Non-irrigated arable land
(code CLC—21)
6549 (105)
arable_landsshortest straight-line distance from the village/town centre to the motorwaydist_to_mw
Fruit trees and berry plantations
(code CLC—222)
Permanent crops (code CLC—22)
32 (169)
orchardsshortest straight-line distance from the village/town centre to the nearest motorway entrance/exitdist_to_mw_exit
Pastures
(code CLC—231)
Pastures
(code CLC—23)
1494 (84)
pasturesdistance from the village/town centroid to the nearest domestic or express road dist_to_road_expr
Complex cultivation patterns
(code CLC—242)
Heterogeneous agricultural areas
(code CLC—24)
5109 (66)
heterogen_agridistance from the village/town centroid to the nearest regional roaddist_to_road_reg
Land principally occupied by agriculture, with significant areas of natural vegetation
(code CLC—243)
distance from the centroid of the village/town to the nearest road (regional, motor way, domestic or express)dist_to_road_all
total length of all roads within the village/town (including local, residential, tourist, unpaved, etc.)roads
density of all roads in the village/town (including local, residential, tourist, unpaved, etc.) (km/km2)roads_dens
Broad-leaved forest
(code CLC—311)
Forest
(code CLC—31)
8748 (107)
forestsdistance to the country borderdist_to_border
Coniferous forest
(code CLC—312)
Mixed forest
(code CLC—313)
Table 3. Stimulants and destimulants affecting changes in population density (statistically significant p < 0.05)—dependent variable: the percentage change in population density in 1989–2011.
StimulantsDestimulants
Name of FeatureR-ValueName of FeatureR-Value
road_dens0.16828max_elev_x−0.22926
macroreg0.16736centr_X−0.2284
pop_dens_890.06446dist_to_road_expr−0.20945
dist_to_border0.0492to_district_ctr−0.15221
centr_Y0.03869dist_to_road_all−0.12562
gender_890.02531dist_to_road_reg−0.07577
min_elev_m0.02325dist_to_mw_exit−0.0719
Abbreviations of stimulants and destimulants are explained in Table 2.
Table 4. The most important variables affecting the changes between population and land cover in the Polish Carpathians (statistically significant > 0.9).
The Name of the VariableZ-Value
1Average slope within the village/town (in degrees)0.99109
2Total length of all roads within the village/town (in metres)0.976961
3Y coordinate of the centroid of the village/town in the metric coordinate system0.965396
4X coordinate of the point with maximum elevation within the village/town0.961845
5X coordinate of the centroid of the village/town in the metric coordinate system0.961749
6Y coordinate of the point with maximum elevation within the village/town0.961386
7Shortest straight-line distance from the village/town centre
to the nearest motorway
0.948599
8Shortest straight-line distance from the village/town centre to
the nearest motorway entrance/exit
0.946885
Table 5. The interactions between the changes in population density and land cover changes in the geographical regions (the values in the table show the direction (+ or −) and their magnitude).
VariableFore-
Carpathian Basins
FoothillsFoothills
Together
Medium–High Mountain (Beskidy)High-Mountain (Tatry) and Orawa-Podhale Basin (Podhale)Medium–High Mountain (Beskidy), High Mountain and Orawa-Podhale Basin Together
Part WPart EPart WPart E
delta_build-up_area0.660.680.320.610.95-5.990.220.79
delta_ind/commer/transp0.53−0.54−0.55−0.70−0.7445.5121.420.20
delta_mine/dump/constr−0.47−0.350.390.52−2.19−7.04−0.50−1.99
delta_arable_lands−0.290.18−0.110.08−0.03−6.52−0.13−0.19
delta_pastures−0.05−0.090.060.17−0.12−6.01−0.08−0.27
delta_heterogen_agri−0.140.15−0.24−0.010.01−6.50−0.33−0.21
delta_forests0.420.18−0.68−0.29−0.90−5.41−0.04−0.49
delta_shrub/herbal0.420.06−0.77−0.40−0.74−5.93−0.72−0.27
delta_water0.210.43−0.46−0.34−0.37−4.71−0.35−0.13
Abbreviations of variables are explained in Table 2.
Disclaimer/Publisher’s Note: The statements, opinions and data contained in all publications are solely those of the individual author(s) and contributor(s) and not of MDPI and/or the editor(s). MDPI and/or the editor(s) disclaim responsibility for any injury to people or property resulting from any ideas, methods, instructions or products referred to in the content.