Article

Research on Restorative Benefits and Stress Relief Approaches in Urban Green Space for Different Stress Threshold Groups

College of Architecture and Environment, Sichuan University, Chengdu 610065, China
*
Author to whom correspondence should be addressed.
Land 2025, 14(11), 2293; https://doi.org/10.3390/land14112293
Submission received: 20 October 2025 / Revised: 16 November 2025 / Accepted: 17 November 2025 / Published: 20 November 2025
(This article belongs to the Special Issue Urban Spatial Planning for Health and Well-Being)

Abstract

Urban green spaces, as vital land use components, play a crucial role in promoting public mental health and well-being. This study investigates the differential restorative benefits and stress relief pathways in urban green spaces for populations with varying stress thresholds. This study employed a controlled experiment (pre-test–free activity–post-test) with 120 park users, integrating subjective scales (DASS-21, SRRS, etc.). We innovatively stratified participants by stress threshold to analyze recovery mechanisms. Key findings reveal: (1) Park visits were associated with significant restorative benefits across all stress groups (p < 0.05), yet the recovery patterns and potential pathways appear to be stress-threshold-dependent. (2) Our findings suggest distinct patterns: low-stress individuals benefit via cognitive-behavioral routes (environmental awareness, dynamic activities), while medium-high stress groups rely more on physiological regulation (environmental enclosure, static relaxation). (3) Crucially, these mechanisms suggest stratified landscape design strategies: multi-sensory interactive spaces for low-stress, static rest areas for medium-stress, and low-interference, high-enclosure meditative environments for high-stress individuals. However, given the single-group pre-post design, observed benefits should be interpreted as associations and plausible pathways rather than definitive causal effects. By introducing stress threshold stratification into restorative landscape research, this study provides actionable, evidence-based guidelines for optimizing urban green space planning and design. It offers a crucial scientific foundation for creating healthier, more inclusive, and sustainable urban environments that effectively address diverse mental health needs and contribute to public health promotion through sustainable land use practices.

1. Introduction

1.1. Literature Review on Restorative Environments and Stress Thresholds

Rapid urbanization has reduced residents’ access to nature, contributing to rising mental health risks [1,2]. Fast-paced lifestyles, high population density, and limited public spaces place urban dwellers under widespread stress. According to the Urban Stress Survey Report, 30.24% of respondents experience stress multiple times daily, and 43.3% feel it exceeds their coping capacity [1]. Chronic stress may relate to anxiety, depression, and other psychological disorders if unaddressed.
Urban green spaces, as a form of second nature, help reconnect people with the natural world [3]. Their restorative potential was noted as early as the mid-19th century by Olmsted [4]. A restorative environment renews an individual’s physical and mental resources, which is vital for maintaining well-being [4]. The World Health Organization has confirmed the mental and physical health benefits of parks and green spaces [4]. Research shows that urban parks improve well-being [5], enhance mood [6], restore attention [7], and reduce psychological stress [8,9,10,11], making them key restorative environments [6,12,13,14]. These effects arise from the interaction between physical features and individual cognitive, emotional, and behavioral responses [15].
Two major theories explain psychological recovery in natural settings: Stress Reduction Theory (SRT) and Attention Restoration Theory (ART). SRT, proposed by Ulrich [12], suggests that natural landscapes capture attention, reduce negative thoughts, and help restore physiological balance. ART, introduced by Kaplan [13], posits that natural environments restore and enhance cognitive function, alleviating mental fatigue.
In recent years, international research on green space and mental health has progressively shifted from a focus on the “presence-or-absence effect” to an in-depth exploration of the “dose–response” relationship, with growing attention to the phenomenon of the “stress threshold”. Multiple studies indicate that the positive impact of green space on mental health is not a simple linear relationship but instead exhibits clear tipping points or saturation effects. For example, Zhang et al. [14], based on street view imagery and machine learning methods, found that when the level of green space exposure exceeds approximately 0.35, its effect on alleviating psychological stress gradually diminishes, suggesting a “diminishing returns” phenomenon in green space’s stress-reduction benefits. A review study by Beute et al. [15] further pointed out that certain vegetation features (such as excessive density) may even have negative psychological impacts on some populations, reinforcing the view that green space benefits have an “optimal range”.
In different geographical and social contexts, this threshold effect exhibits significant situational dependency. The study by Li et al. [16] revealed that the pathways through which green space in residential areas, activity spaces, and transportation spaces affects mental health are varied, indicating that green space benefits are strongly moderated by spatial context. Yoo et al.’s [17] research in New York found that the impact of green space on mental health is more pronounced in communities with high social vulnerability, suggesting that socioeconomic factors may moderate the “stress threshold” at which green space becomes effective. Concurrently, a longitudinal study by Galera et al. [18] showed that the protective effect of high green space exposure against psychological distress is particularly prominent among groups with lower socioeconomic status, further supporting the population-based differences in green space benefits.
Notably, a discrepancy often exists between subjective perceptions of green space and objective measurement indicators, with perceived metrics often demonstrating stronger explanatory power for mental health. Research has confirmed that perceived green space is more predictive of alleviating anxiety than objective metrics [19], while the composite exposure indicator framework developed by Xia et al. [20] showed that assessments incorporating subjective factors can more accurately predict health-related outcomes such as environmental satisfaction. This subject-objective discrepancy suggests that an individual’s environmental awareness capabilities and behavioral preferences may influence their “stress threshold” level and sensitivity to green space stimuli.
However, existing research has significant limitations. First, it lacks a systematic analysis of populations with different stress levels, particularly an in-depth exploration of the “stress threshold” concept. Second, there is a lack of longitudinal evidence on how green space affects individuals at different stages of stress, especially those with varying stress thresholds. The ‘stress threshold’ is defined as the critical level of stress an individual can endure before negative effects manifest. For the purposes of this research, “stress threshold” is operationalized as a categorical measure of recent stress severity, derived from baseline scores on the DASS-21 Stress Subscale. This definition allows us to explore the varying restorative effects of urban parks on individuals across different stress levels. [21]. Therefore, investigating how urban park green space exerts differential restorative effects on individuals with different stress thresholds is not only instructive for optimizing park design but also of great value for enhancing urban public health. Future research urgently needs to integrate longitudinal designs, neuroscience methods, and multi-dimensional exposure assessments to systematically reveal the mechanisms through which green space affects populations with different stress thresholds, providing a scientific basis for precision environmental interventions [22].

1.2. Research Objectives and Implications

Synthesizing the current state of international research on stressed populations, this study addresses the increasingly urgent need for stress relief among urban residents. Taking typical park green spaces in the Sanjiang New Area of Yibin City as its research subject, this study employs restorative environment theory [23,24] and experimental methods to investigate the restorative benefits of park green spaces on populations with different stress thresholds and their underlying pathways, thereby constructing a benefit impact model. The main objectives of this research include:
(1)
To verify the universal restorative benefits of urban park visitation;
(2)
To analyze the differences in the experience of restorative benefits among groups with different stress thresholds;
(3)
To establish a precise stress relief mechanism targeting groups with different stress thresholds.
In terms of theoretical innovation, this study overcomes the limitations of traditional research that focuses on single environmental factors [22,24] by innovatively introducing individual stress state as a key moderating variable. This design is based on the systematic review by Beute et al. [15], which pointed out significant differences in how various populations respond to green space features; it is also inspired by the study of Yoo et al. [17], which found that social vulnerability significantly moderates the relationship between green space and mental health. Methodologically, we adopt an assessment system combining multi-dimensional subjective scales, a design that draws on the multi-dimensional measurement framework for environmental awareness [25], significantly enhancing the scientific rigor and reliability of the research.
This study establishes an intrinsic link between stress threshold and restorative benefits, demonstrating systematic differences in responses to green space features. Specifically, individuals with a high stress threshold require stronger environmental stimuli to activate recovery, consistent with research on green space morphology [26]. Conversely, those with a low stress threshold exhibit greater sensitivity to subtle environmental cues [27].
These findings contribute to the literature in two significant ways. They empirically validate the role of park green spaces in stress modulation while addressing a critical gap concerning individual differences in restorative environment research. Moreover, by introducing the “stress threshold” concept, they expand the theoretical framework of healthy landscapes [28,29,30,31].
The constructed pathway model provides a novel research paradigm for environmental psychology and a theoretical foundation for precision landscape interventions. By supporting findings on the neural mechanisms of green space exposure, our work offers an empirical basis for future environmental design targeted at specific stress sensitivities, which is vital for advancing personalized urban mental health strategies.

2. Materials and Methods

2.1. Selection of Research Samples

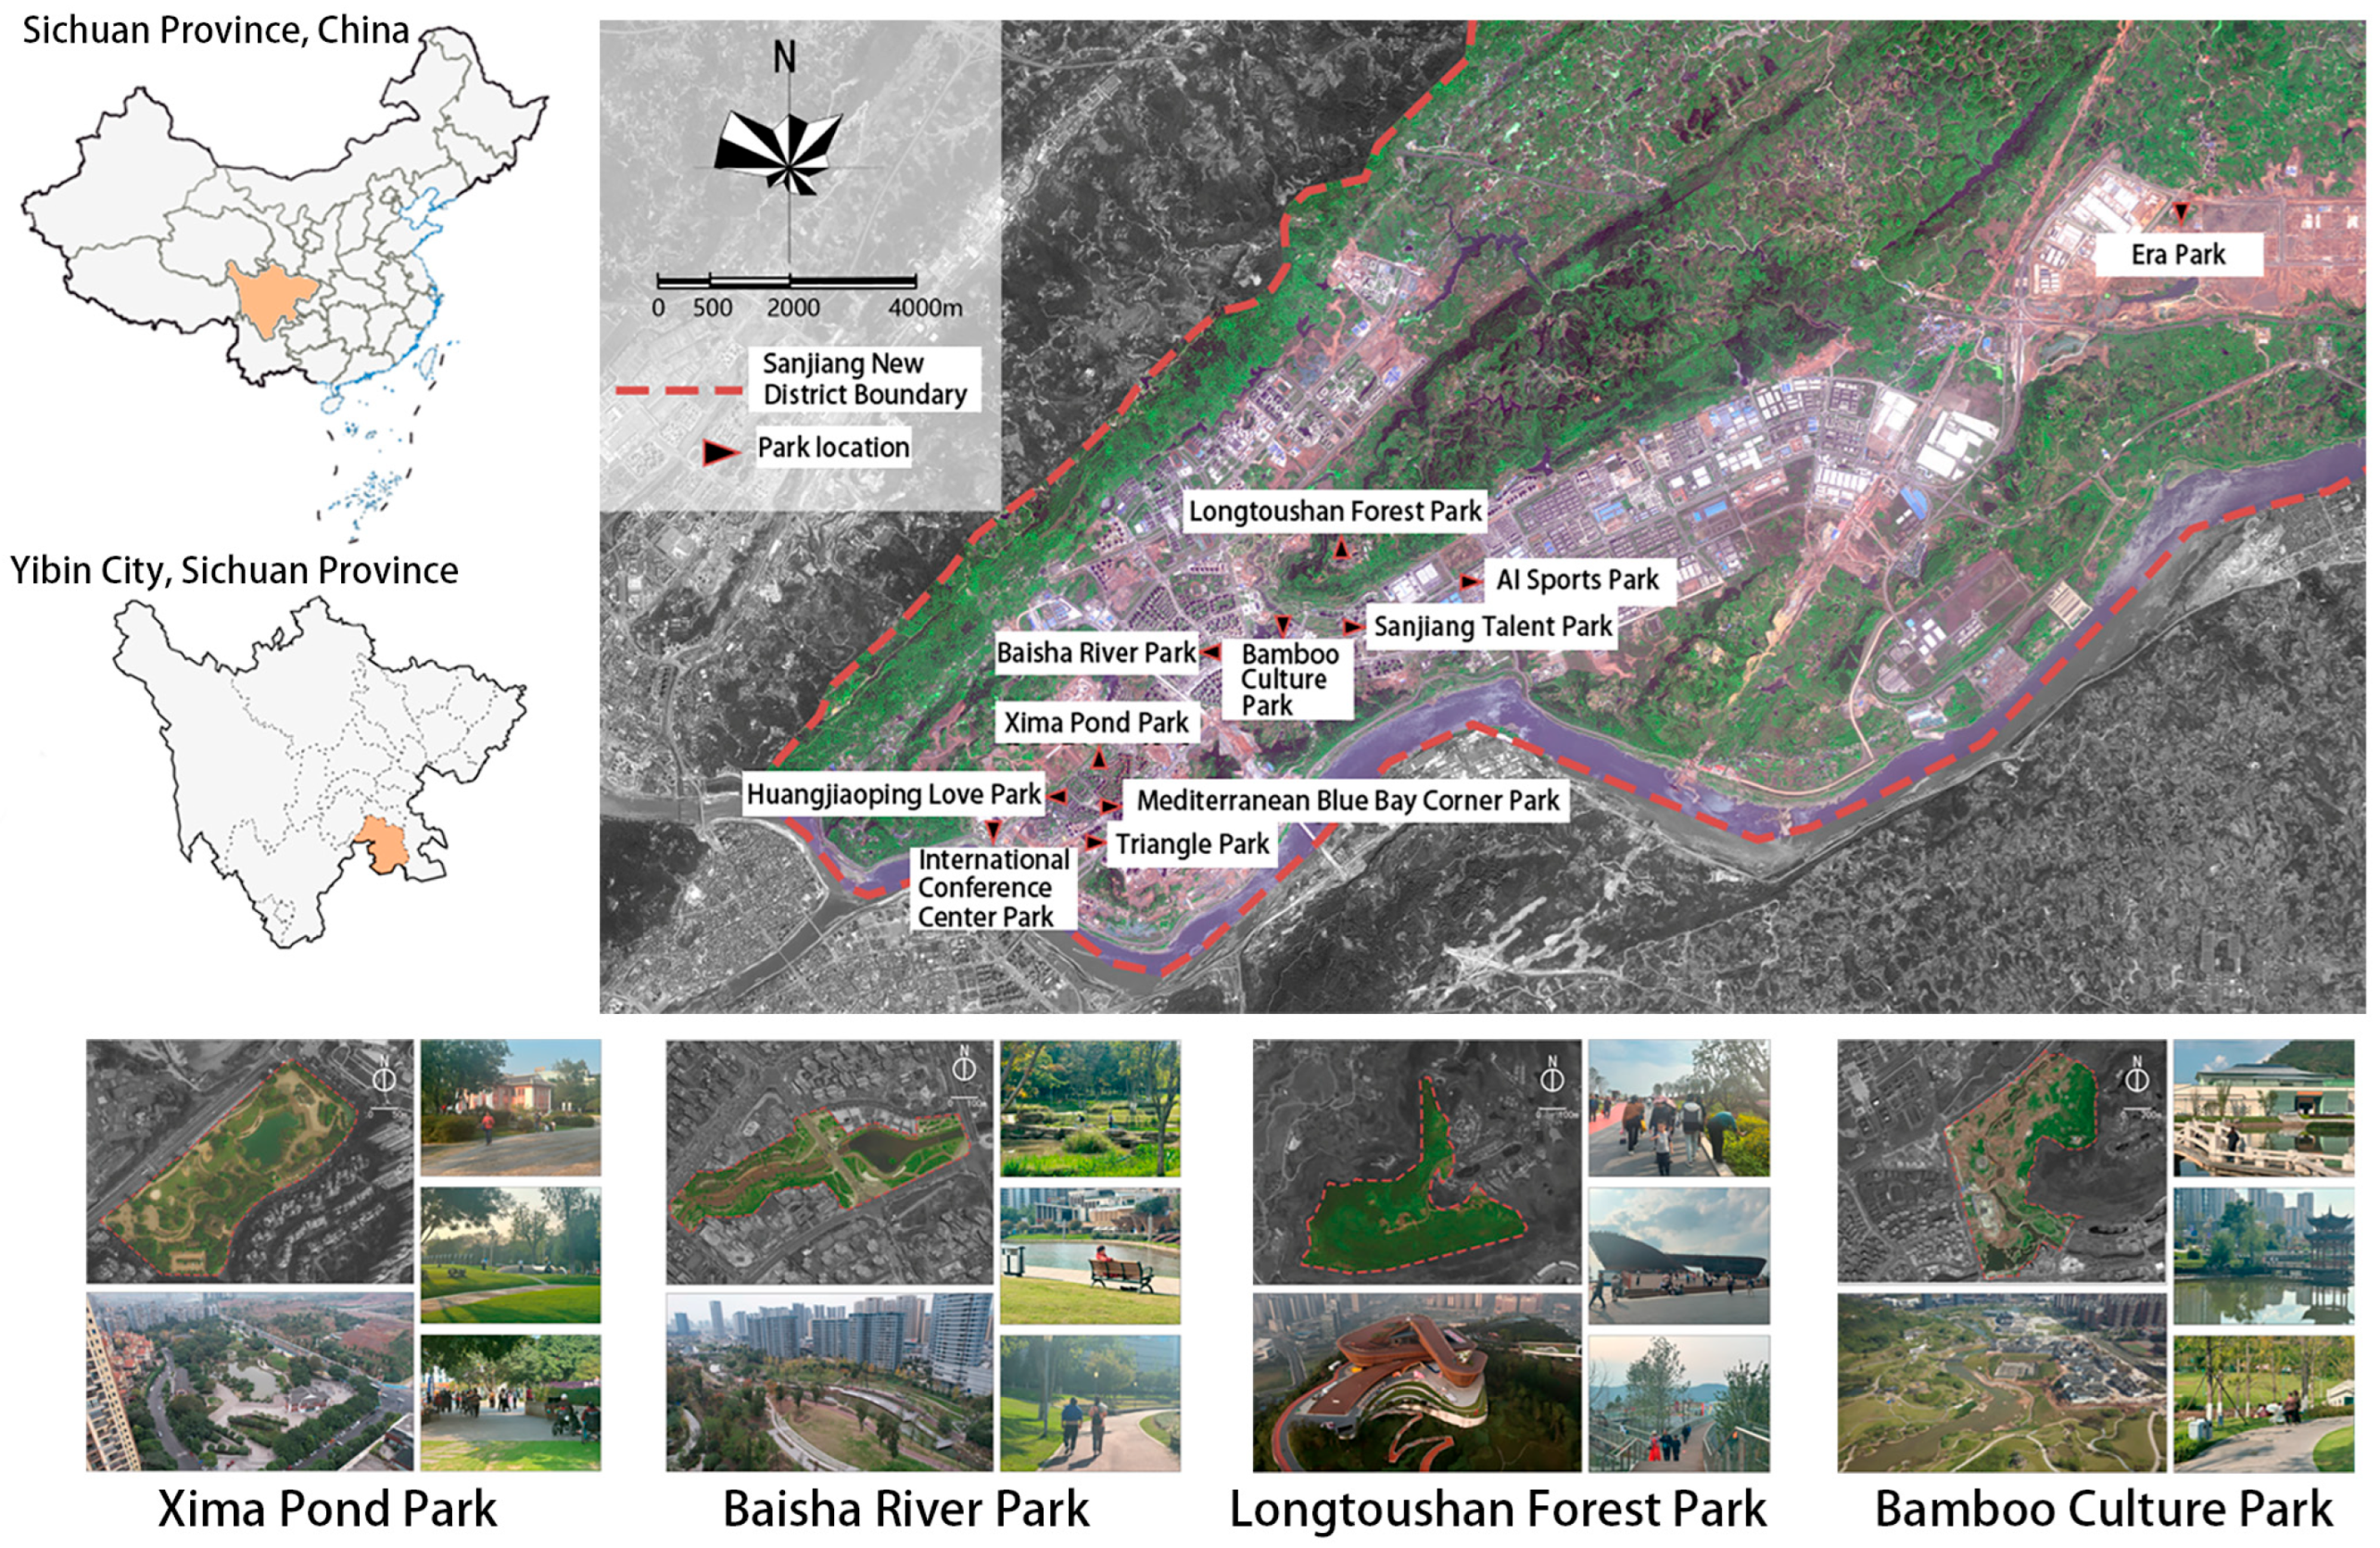
This study uses urban parks as a case study to explore the effects of their environment on the restorative benefits experienced by urban residents. The map below illustrates the geographical location of the Sanjiang New Area within Yibin’s main urban district, along with the distribution of its parks and green spaces, as shown in Figure 1.
This version reorganizes the sentences for better flow and uses more common academic phrasing.
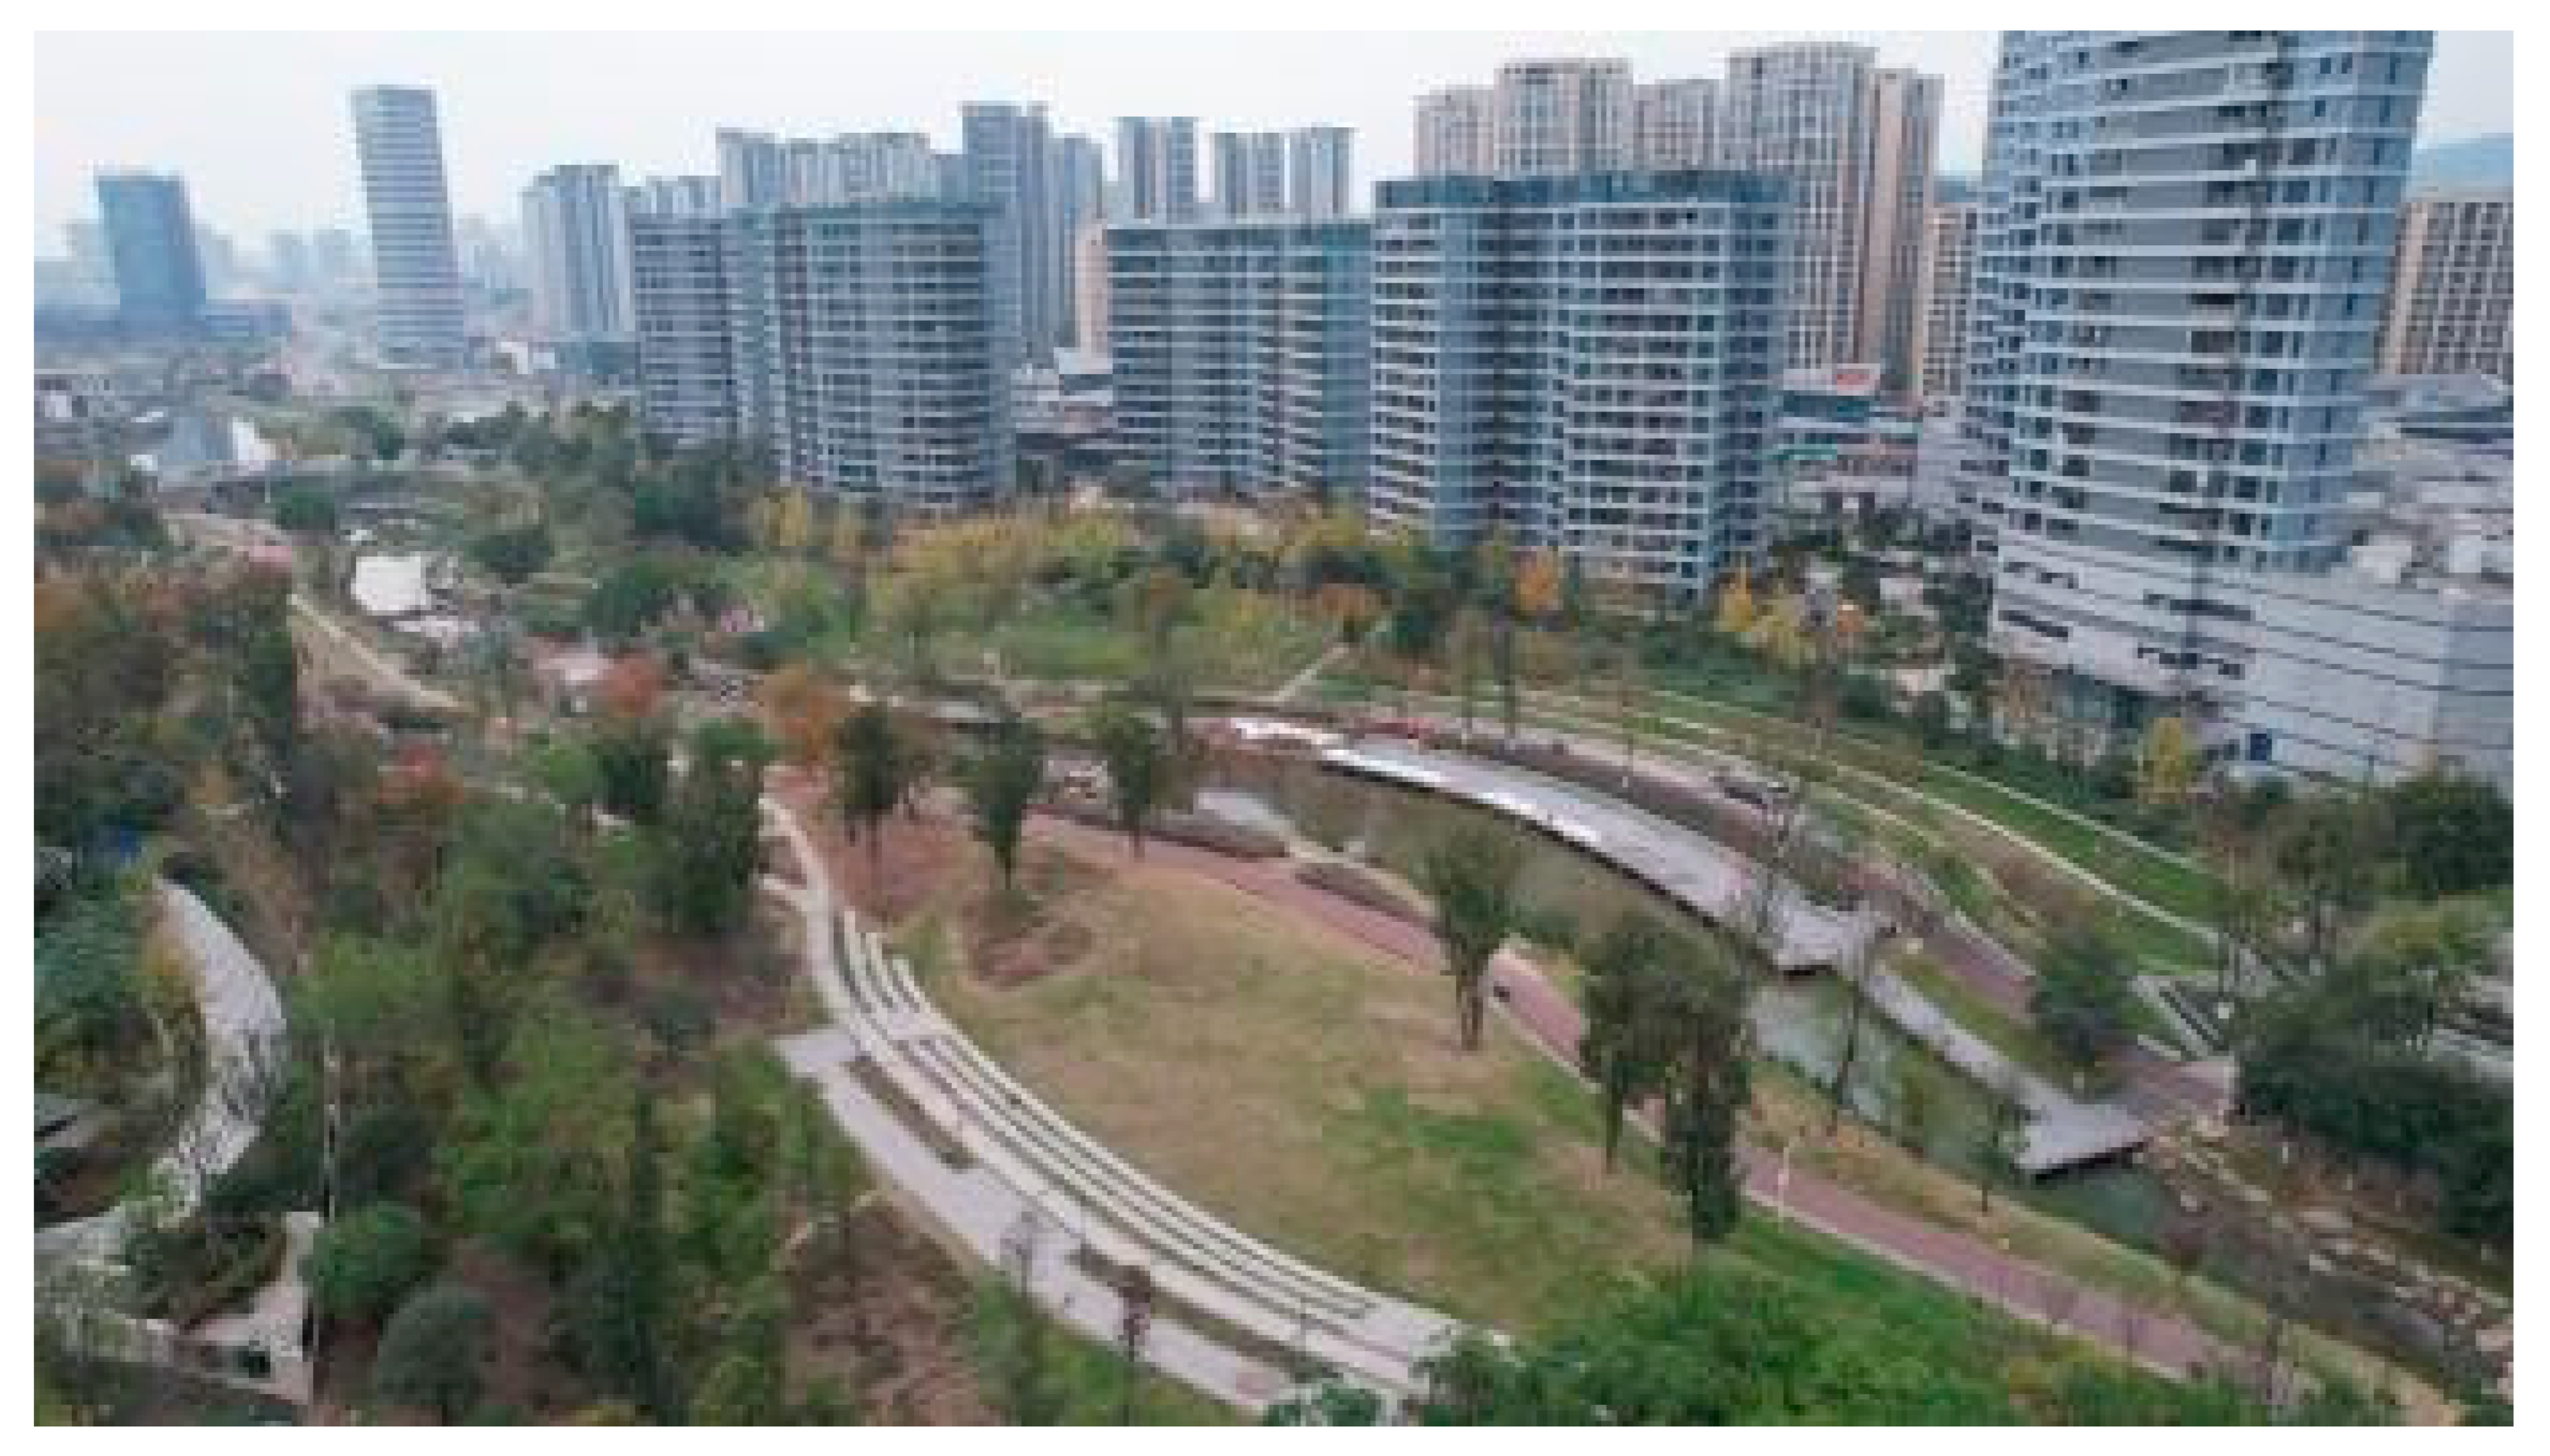
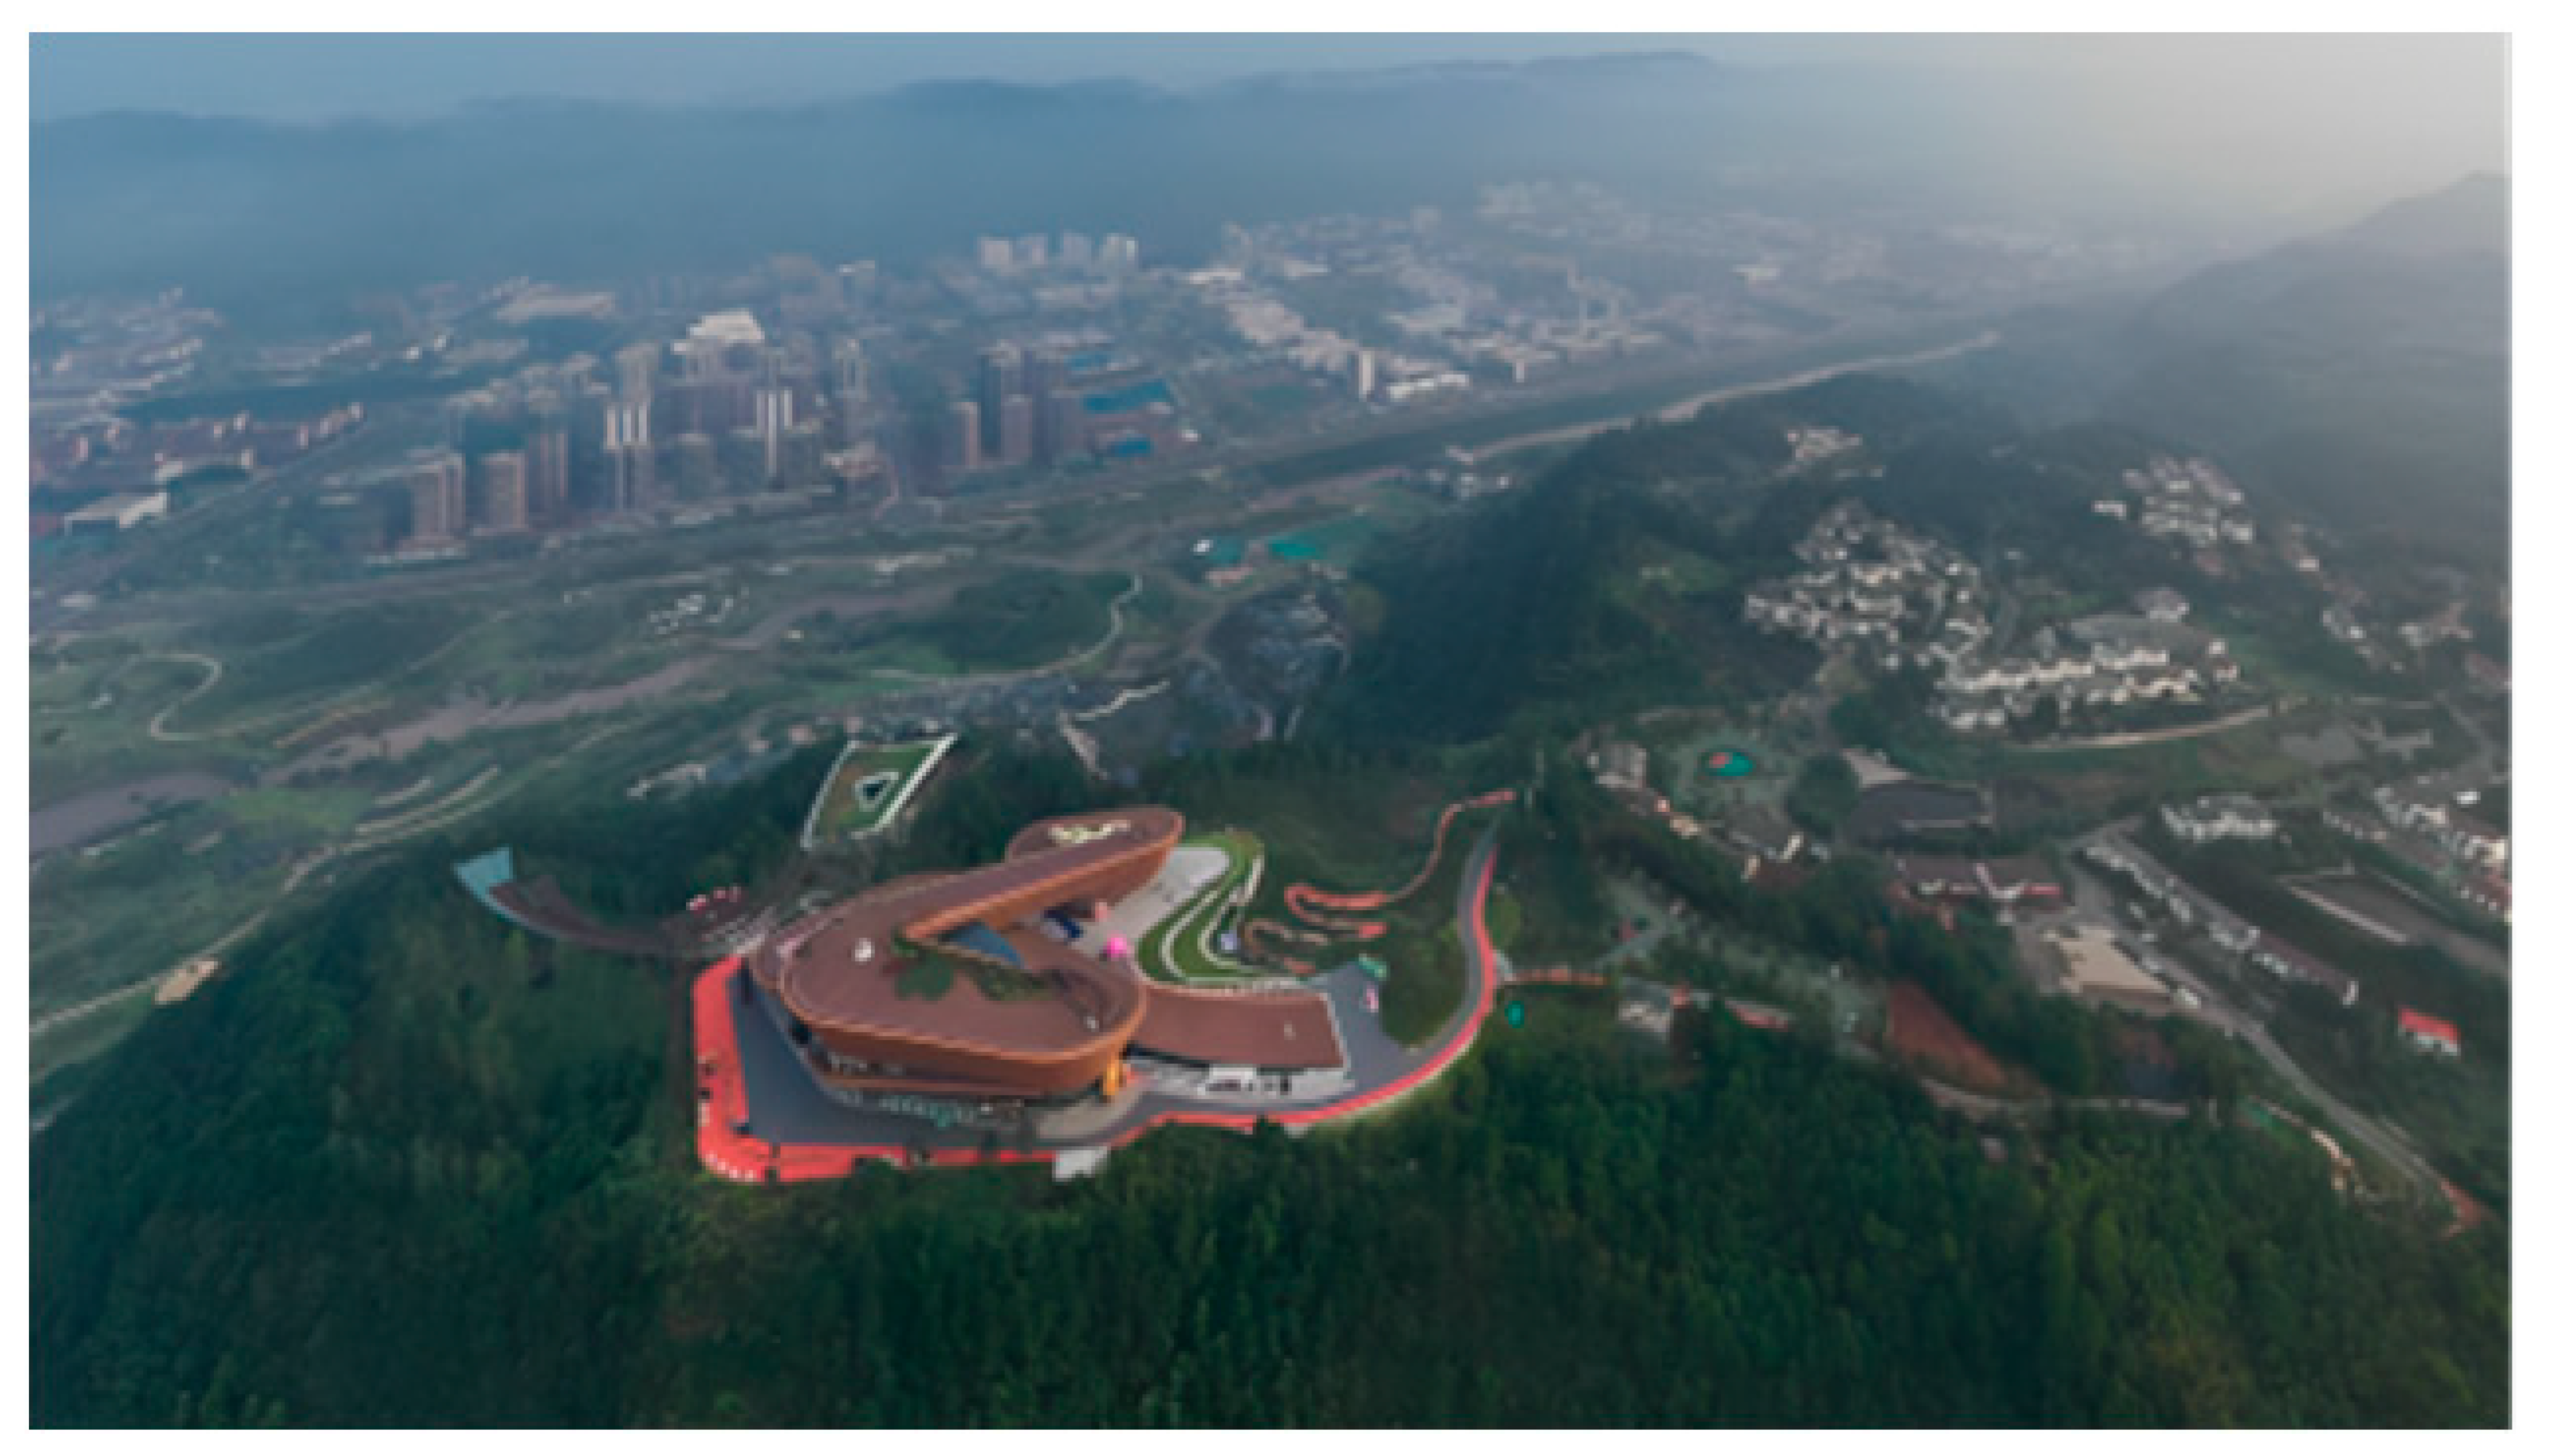
Based on preliminary field investigations, four urban parks in the Sanjiang New Area of Yibin City were selected as study sites to ensure the feasibility, representativeness, and logistical convenience of the research. The selection was based on the following criteria: proximity to residential areas with accessible transportation; a pleasant internal environment with well-developed supporting facilities to accommodate a range of visitor activities; and a sufficient flow of visitors to facilitate experimental data collection. The selected parks are Ximachi Park, Baishahe Park, Longtoushan Forest Park, and Bamboo Culture Park. Further details of these parks are provided in Table 1.

2.1.1. Subjective Scale Measurement

(1).
Stress Condition
A random sampling method was used to select participants, ensuring a balanced distribution in terms of gender, occupation, age, and educational background to minimize the influence of confounding variables and enhance the generalizability of the data. Participants were required to complete the stress items from the Depression Anxiety Stress Scales (DASS-21) [32,33], which were used to categorize individuals into different stress threshold groups. This section consists of seven descriptive items, rated on a four-point scale (0—Does not apply, 1—Sometimes applies, 2—Often applies, 3—Almost always applies). The specific items of the scale are shown in Appendix A Table A1. Using the same DASS-21 scale for both group classification and outcome measurement may introduce common method bias. Therefore, we also employed multiple other measures and dimensions, such as the Self-Restoration Scale, to mitigate this issue.
(2).
Self-assessment Recovery Scale
The second part of this study employed the Self-Rating Restoration Scale (SRRS) [34,35,36] to assess participants’ subjective restorative benefits. Integrating two theoretical frameworks of restorative environments, the SRRS features clear semantics and concise items, minimizing participant fatigue and enhancing research applicability. Prior research has established its strong reliability and validity in evaluating restorative environments [34]. The scale comprises four dimensions—Emotional,” Physical,” Cognitive,” and Behavioral”—each with two items, totaling eight. Following Lin Na et al.’s methodology, reverse scoring was applied to the physical dimension to improve scale effectiveness [36]. Responses were recorded on a nine-point Likert scale (1 = Strongly disagree to 9 = Very strongly agree). The specific items are listed in Appendix A Table A2.
(3).
Environmental Awareness
Another component of the study gathered participants’ environmental awareness of the urban park post-experiment using a 16-item questionnaire. These items were selected based on six key landscape architecture elements: topography, water features, paths and spaces, vegetation, buildings, and garden facilities [37]. Each item was adapted from validated instruments in prior research and included a descriptive explanation to aid comprehension [37,38,39,40,41,42]. Responses were rated on a seven-point Likert scale (1 = Strongly disagree to 7 = Very strongly agree). The full list of items is provided in Appendix A Table A3.
(4).
Activity Preferences
The part of the questionnaire aims to systematically record the behavioral activity characteristics of the subjects within the park. Based on preliminary field observations and existing research findings [43,44], this study categorizes typical activities in urban parks into three major types: static behaviors, dynamic behaviors, and transit behaviors. Participants were required to evaluate the degree of correspondence between each type of activity and their own actual behavior during the experiment, using a seven-point scale (1—Strongly disagree, 2—Disagree, 3—Somewhat disagree, 4—Neutral, 5—Agree, 6—Strongly agree, 7—Very strongly agree). The specific items of the scale are presented in Appendix A Table A4. Behavioral activities were assessed via self-report rather than direct observation, which may introduce recall bias and limit the precision of behavioral quantification. Although this approach allowed for ecological validity, future studies could benefit from objective tracking (e.g., accelerometers, GPS) to capture duration and intensity of activities.

2.1.2. Experimental Procedure

The experiment was primarily divided into three stages: pre-test, activity, and post-test.
(1) Pre-test stage (6 min): Upon arrival at the experimental park green space, participants were informed of the study’s purpose and specific procedures by the researchers, and their informed consent was obtained (3 min). Subsequently, with the researchers’ assistance, they completed the pre-test questionnaire (3 min).
(2) Activity stage (25 min): Participants freely chose their activities within the park green space (e.g., sitting quietly, exercising, socializing). Researchers recorded the types of activities without intervention to ensure ecological validity.
(3) Post-test stage (7 min): After the activity stage concluded, the post-test stage began. Participants sat quietly and completed the post-test questionnaire with the researchers’ assistance (7 min). (Changes in the proportion of stress levels from pre-test to post-test were used to assess the perceived changes).
Upon completion of the questionnaires, the experiment concluded. The experimental flow is illustrated in Figure 2.

2.2. The Impact of Park Green Space Environment on Different Stress Threshold Populations

2.2.1. Data Collection

We recorded each participant’s park location, testing time, weather conditions (sunny/cloudy), and basic demographic information (gender, age). The experiment was conducted between September and December 2023 across four urban parks in Sanjiang New Area. Field tests were carried out on clear days during two time slots: 9:00–11:00 AM and 3:00–5:00 PM. Participants were recruited via local community notices and social media platforms, with eligibility criteria including local residency and no recent consumption of alcohol, coffee and medication for 12 h prior to testing. Prior to the experiment, researchers explained the study’s purpose and procedures, obtained informed consent, and confirmed participants’ full understanding of the requirements. A total of 120 participants (30 per park) were enrolled. All 120 questionnaires were valid (100% response and validity rates) [34].
The basic demographic information of the study participants is as follows. In terms of gender distribution, there were 56 male participants, accounting for 46.7%, and 64 female participants, accounting for 53.3%, with a slightly higher number of females than males. Regarding age distribution, the participants were primarily concentrated in the 18–24 and 25–40 age groups, which constituted 35% and 36.7% of the total sample, respectively. The remaining participants were distributed across other age groups: 6 participants were under 18 (5.0%), 21 were in the 41–60 age group (17.5%), and 7 were over 60 (5.8%).
To account for the clustering effect of participants across parks and testing dates, we used cluster-robust standard errors in the structural equation modeling to control for intra-group correlation.

2.2.2. Identification of Stress Threshold Populations

The DASS-21 (Depression Anxiety Stress Scale-21) is a brief, self-report instrument designed to assess the severity of negative emotional states—depression, anxiety, and stress—experienced over the past week. The scale comprises 21 items distributed equally across three subscales: depression, anxiety, and stress [32]. In this study, “stress threshold” refers to the stress level measured by the baseline DASS-21 Stress Subscale, which was used to categorize participants. Although an individual’s stress state can fluctuate over time, the DASS-21 assesses the severity of stress over the past week, providing a relatively stable indicator for experimental grouping. While the stress threshold may change longitudinally, this study treats it as a baseline moderating variable to examine differences in restorative pathways among groups with different stress levels. It has been extensively validated and suggests strong reliability and validity, establishing it as one of the most widely used tools in psychological research.
In this study, “stress threshold” refers to an individual’s self-reported stress level measured at baseline, reflecting a state-like rather than a trait-like construct. While stress states can fluctuate over time, the DASS-21 scale captures stress severity over the past week, providing a stable indicator for experimental grouping. We acknowledge that stress thresholds may vary longitudinally, but the present study treats it as a baseline moderator for examining differential restorative pathways.
Since only the stress dimension of the DASS-21 scale was retained, its classification criteria are based on the scoring rules for the stress dimension and the classification standards from clinical consensus [33]. The specifics are as follows:
The raw score is the sum of the scores from the 7 items in the stress dimension (each item is scored on a 4-point scale from 0 to 3, resulting in a raw score range of 0–21). The final score is calculated by multiplying the raw score by 2 (converting it to a final score range of 0–42, which is consistent with the logic of the standard DASS-21 total score).
Based on the stress status scale completed by the sample population, individuals are classified into five stress threshold levels according to their stress scores: Normal stress (0–14), Mild stress (15–18), Moderate stress (19–25), Severe stress (26–33), and Extremely severe stress (34 and above). These levels correspond to the severity of an individual’s stress-related emotions over the past week, ranging from low-frequency experiences to high-frequency, persistent manifestations. The specific classification criteria are shown in Table 2.
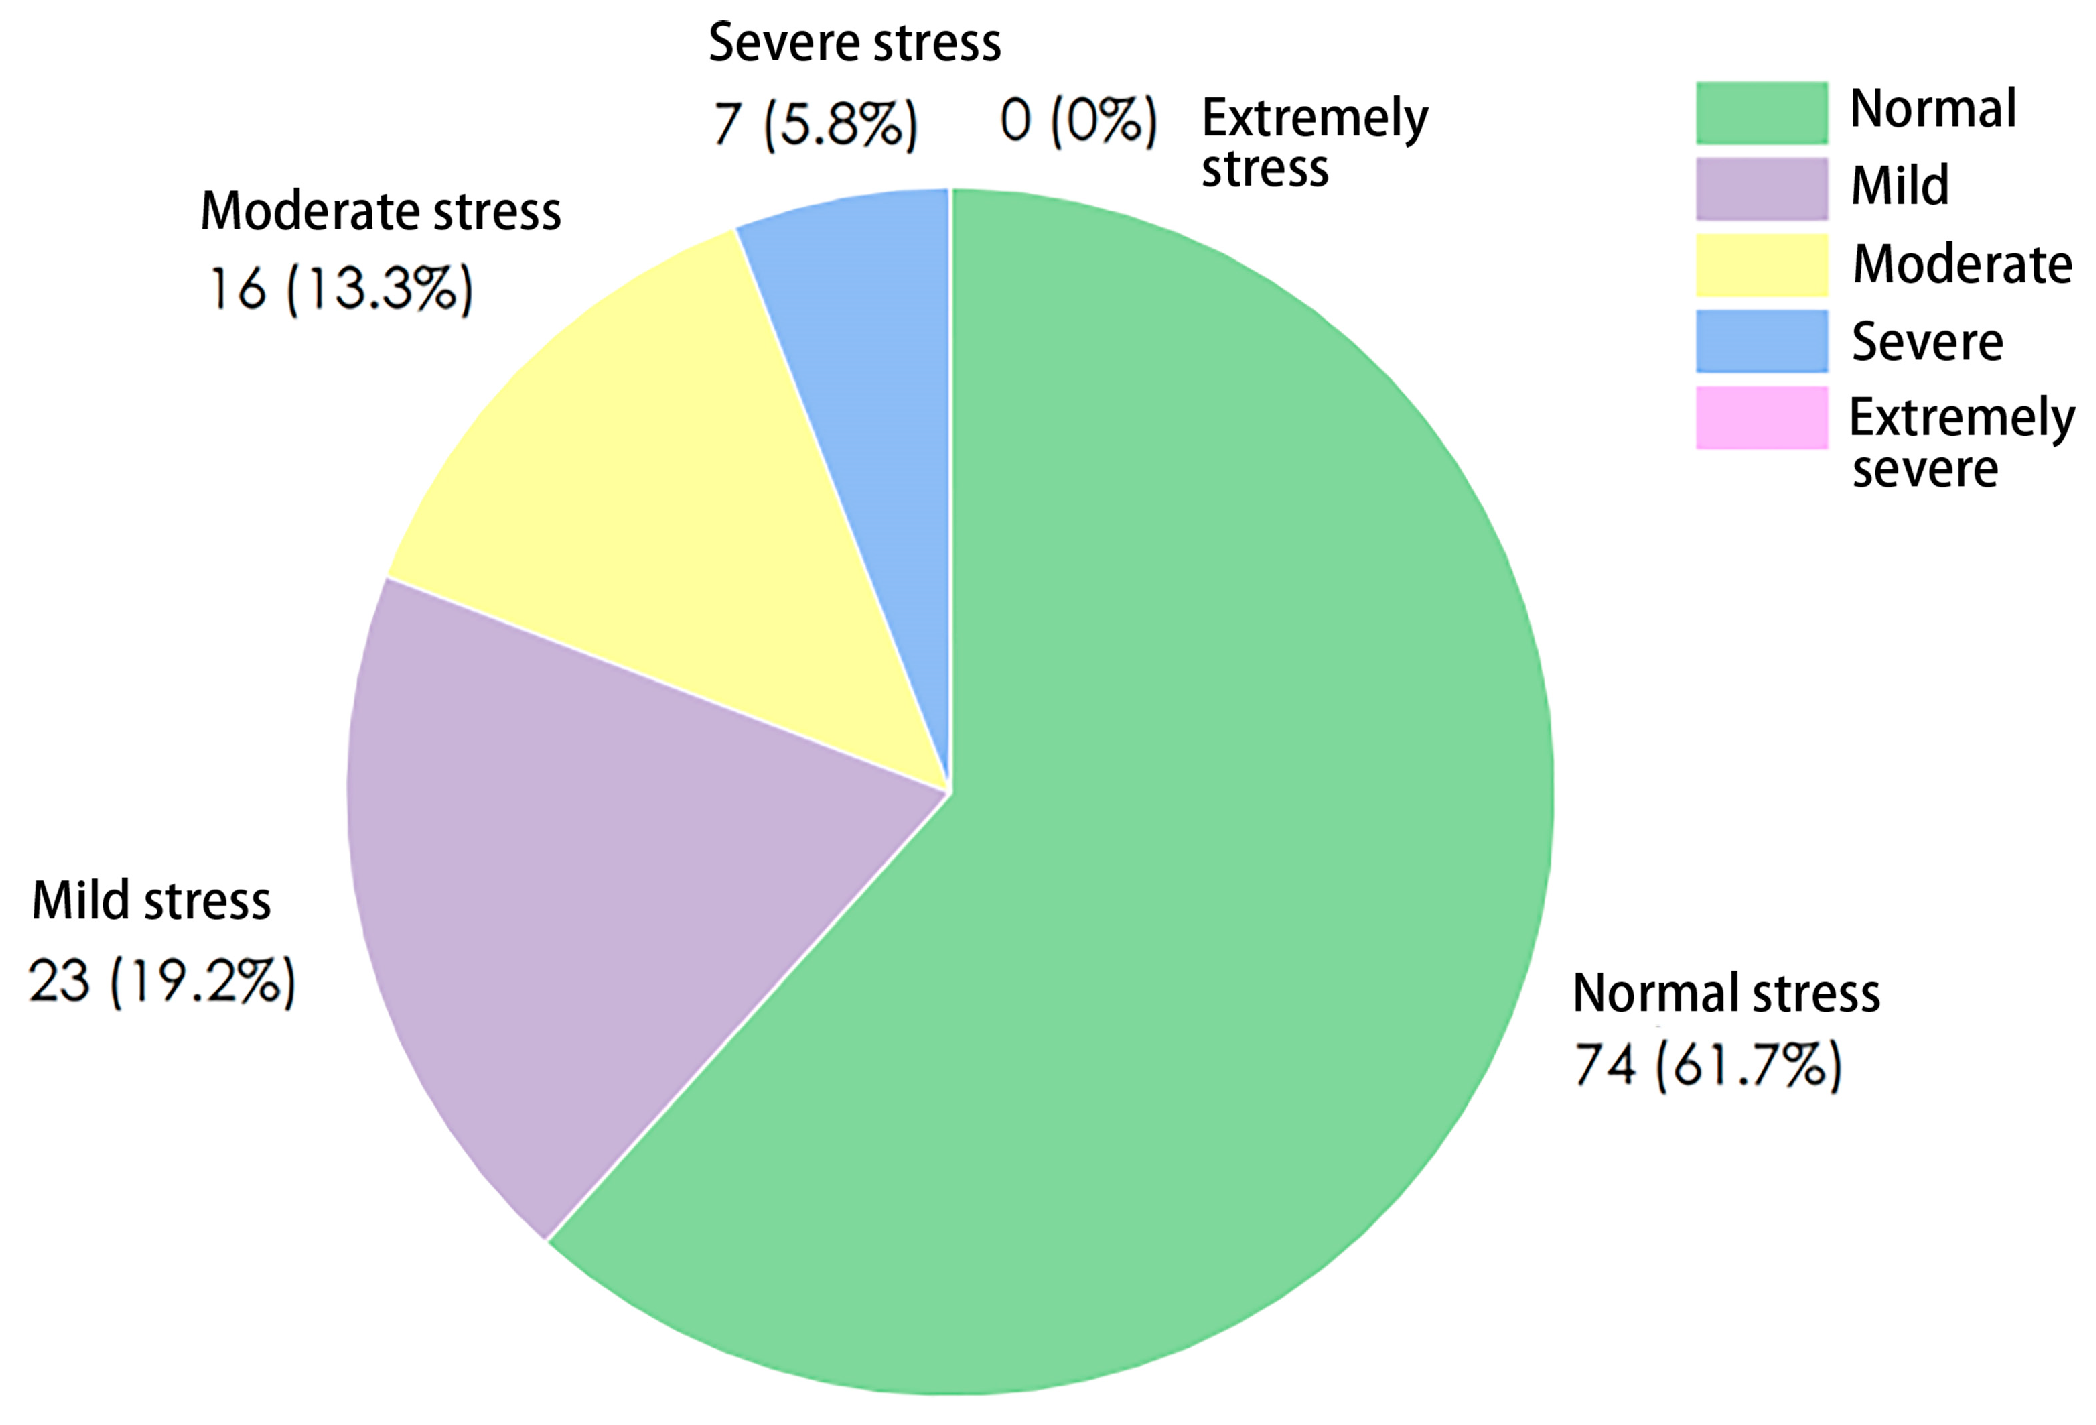
The threshold grading of the 120 subjects is shown in Figure 3, the majority were classified under the normal stress threshold, with a total of 74 individuals, accounting for 61.7%; 23 participants were under mild stress, comprising 19.2%; 16 were under moderate stress, making up 13.3%; 7 were under severe stress, representing 5.8%; and there were no participants under the extremely severe stress category.

3. Results

3.1. The Benefits of Stress Relief in Park Green Spaces for Crowds

3.1.1. Subjective Scale Results

(1).
Self-assessment of recovery situation
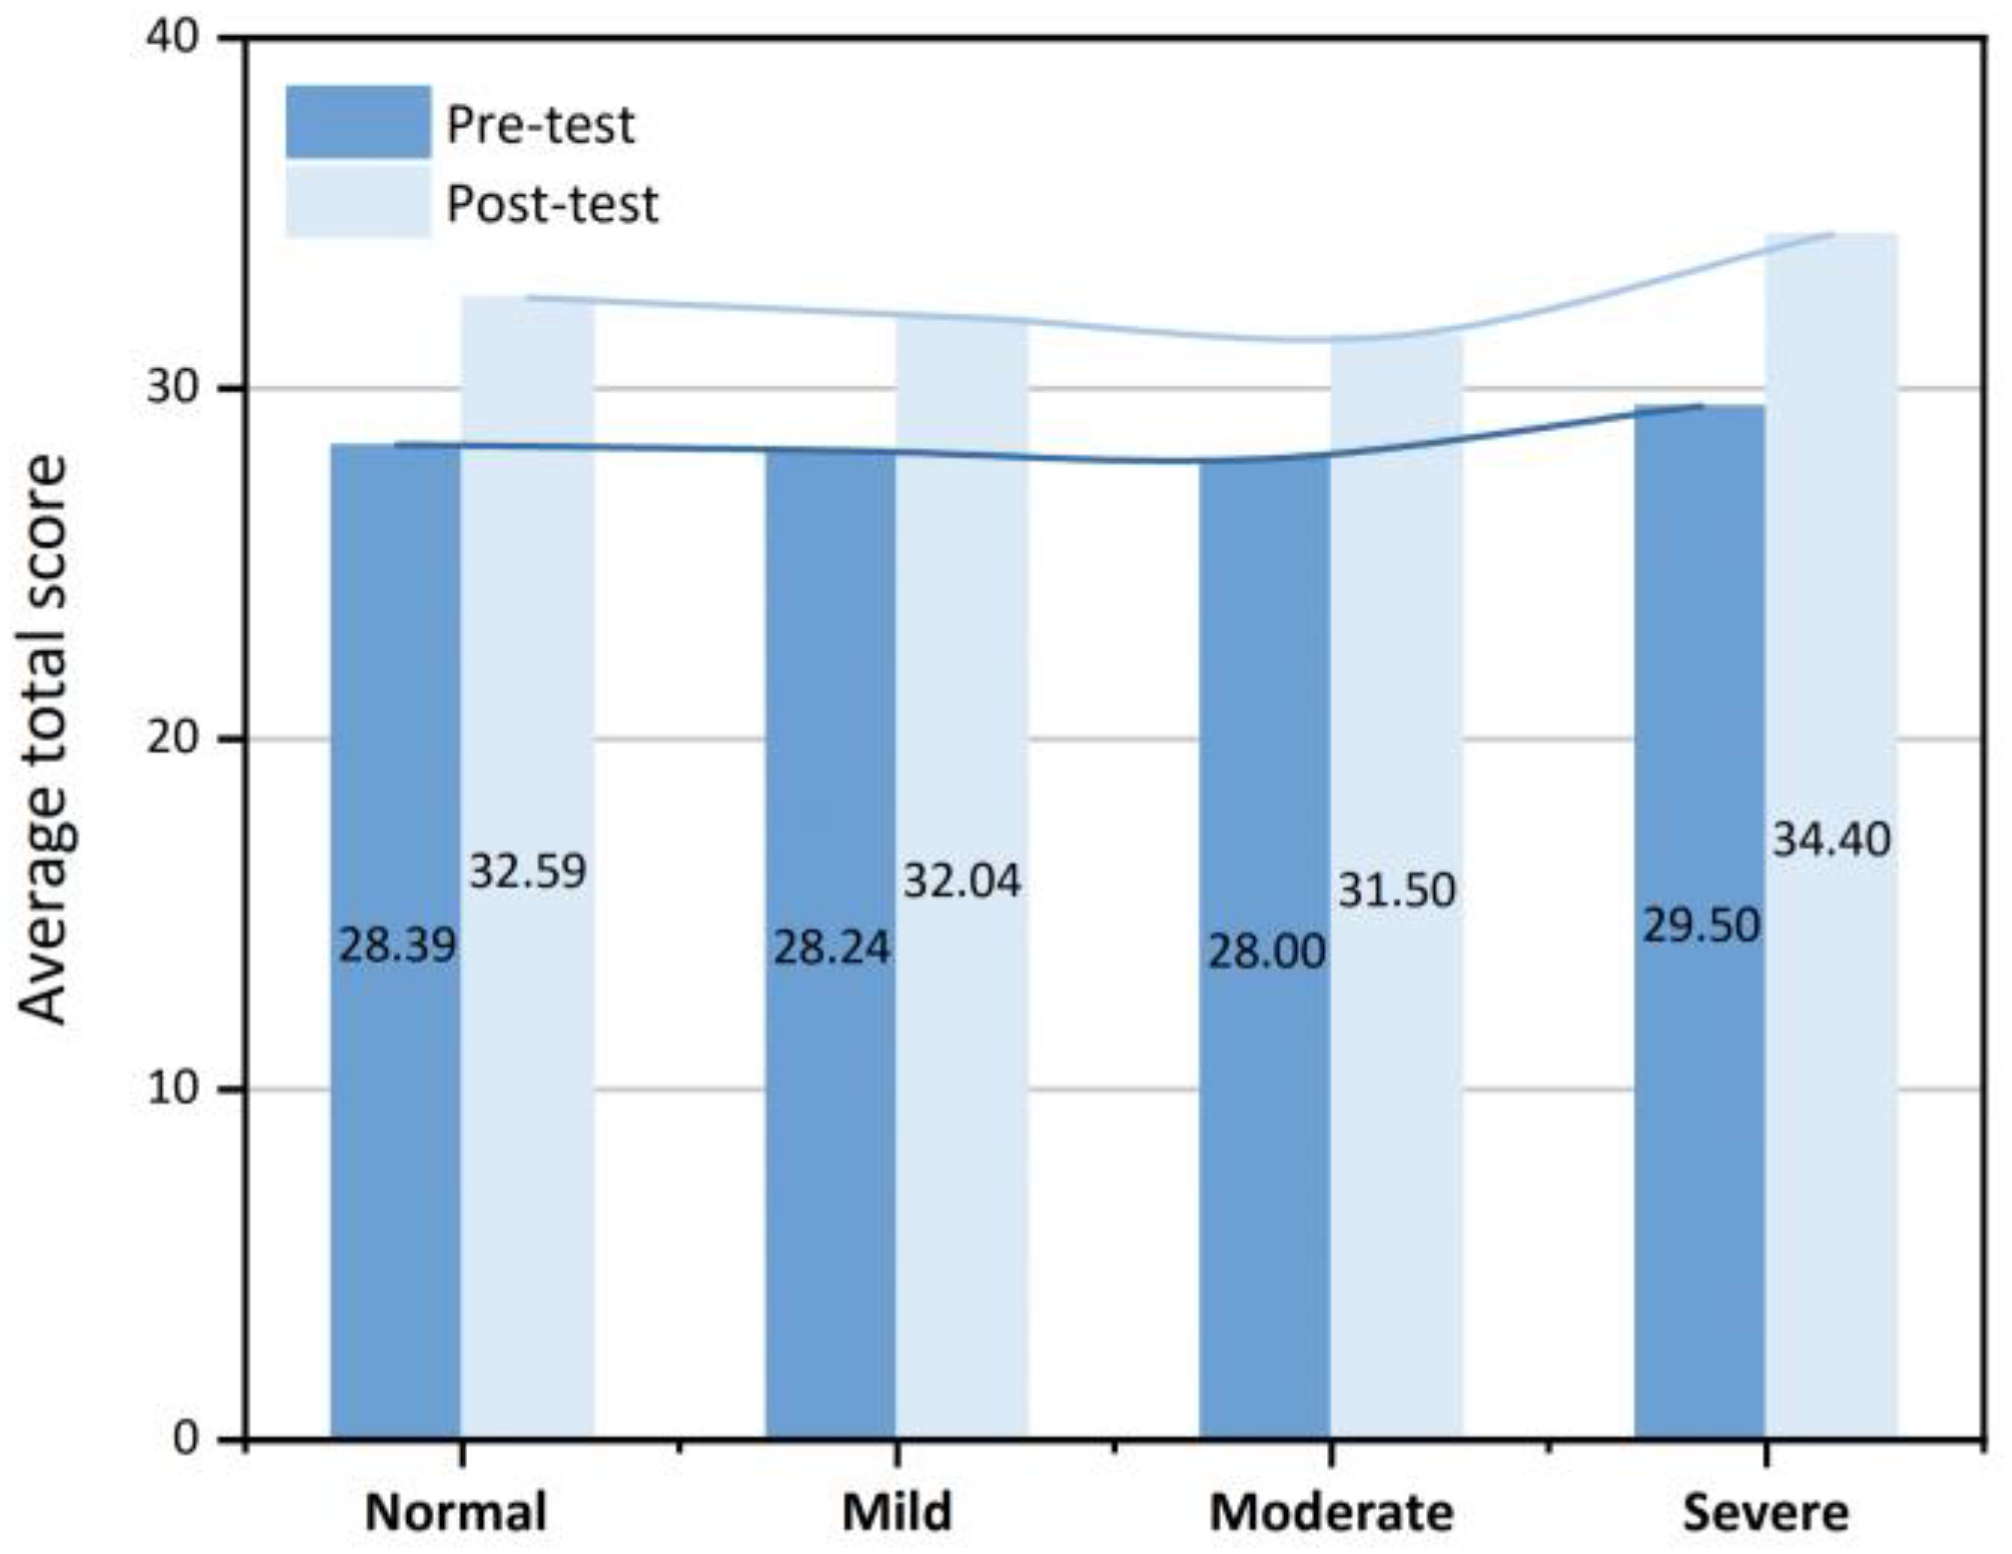
A statistical analysis was conducted on the results of the self-rated restoration scale among the participants, as shown in Figure 4. Figure 4 displays the mean total scores on the self-rated restoration scale across four stress threshold groups, where higher scores indicate better environmental restorative benefits. The mean total scores on the self-rated restoration scale across stress threshold groups were as follows: Severe (29.5), Normal (28.39), Mild (28.24), and Moderate (28). This finding may suggest that individuals with varying stress levels perceive environmental restorative benefits differently. Paired t-tests revealed a significant increase in SRRS total scores from pre-test to post-test across all stress groups (all p < 0.05), confirming the universal restorative benefit of park visits. Specifically, the normal stress group showed an average increase of 4.2 points (t = 5.32, p < 0.001), the mild group 3.8 points (t = 4.87, p < 0.001), the moderate group 3.5 points (t = 3.94, p < 0.001), and the severe group 4.9 points (t = 4.12, p = 0.006).
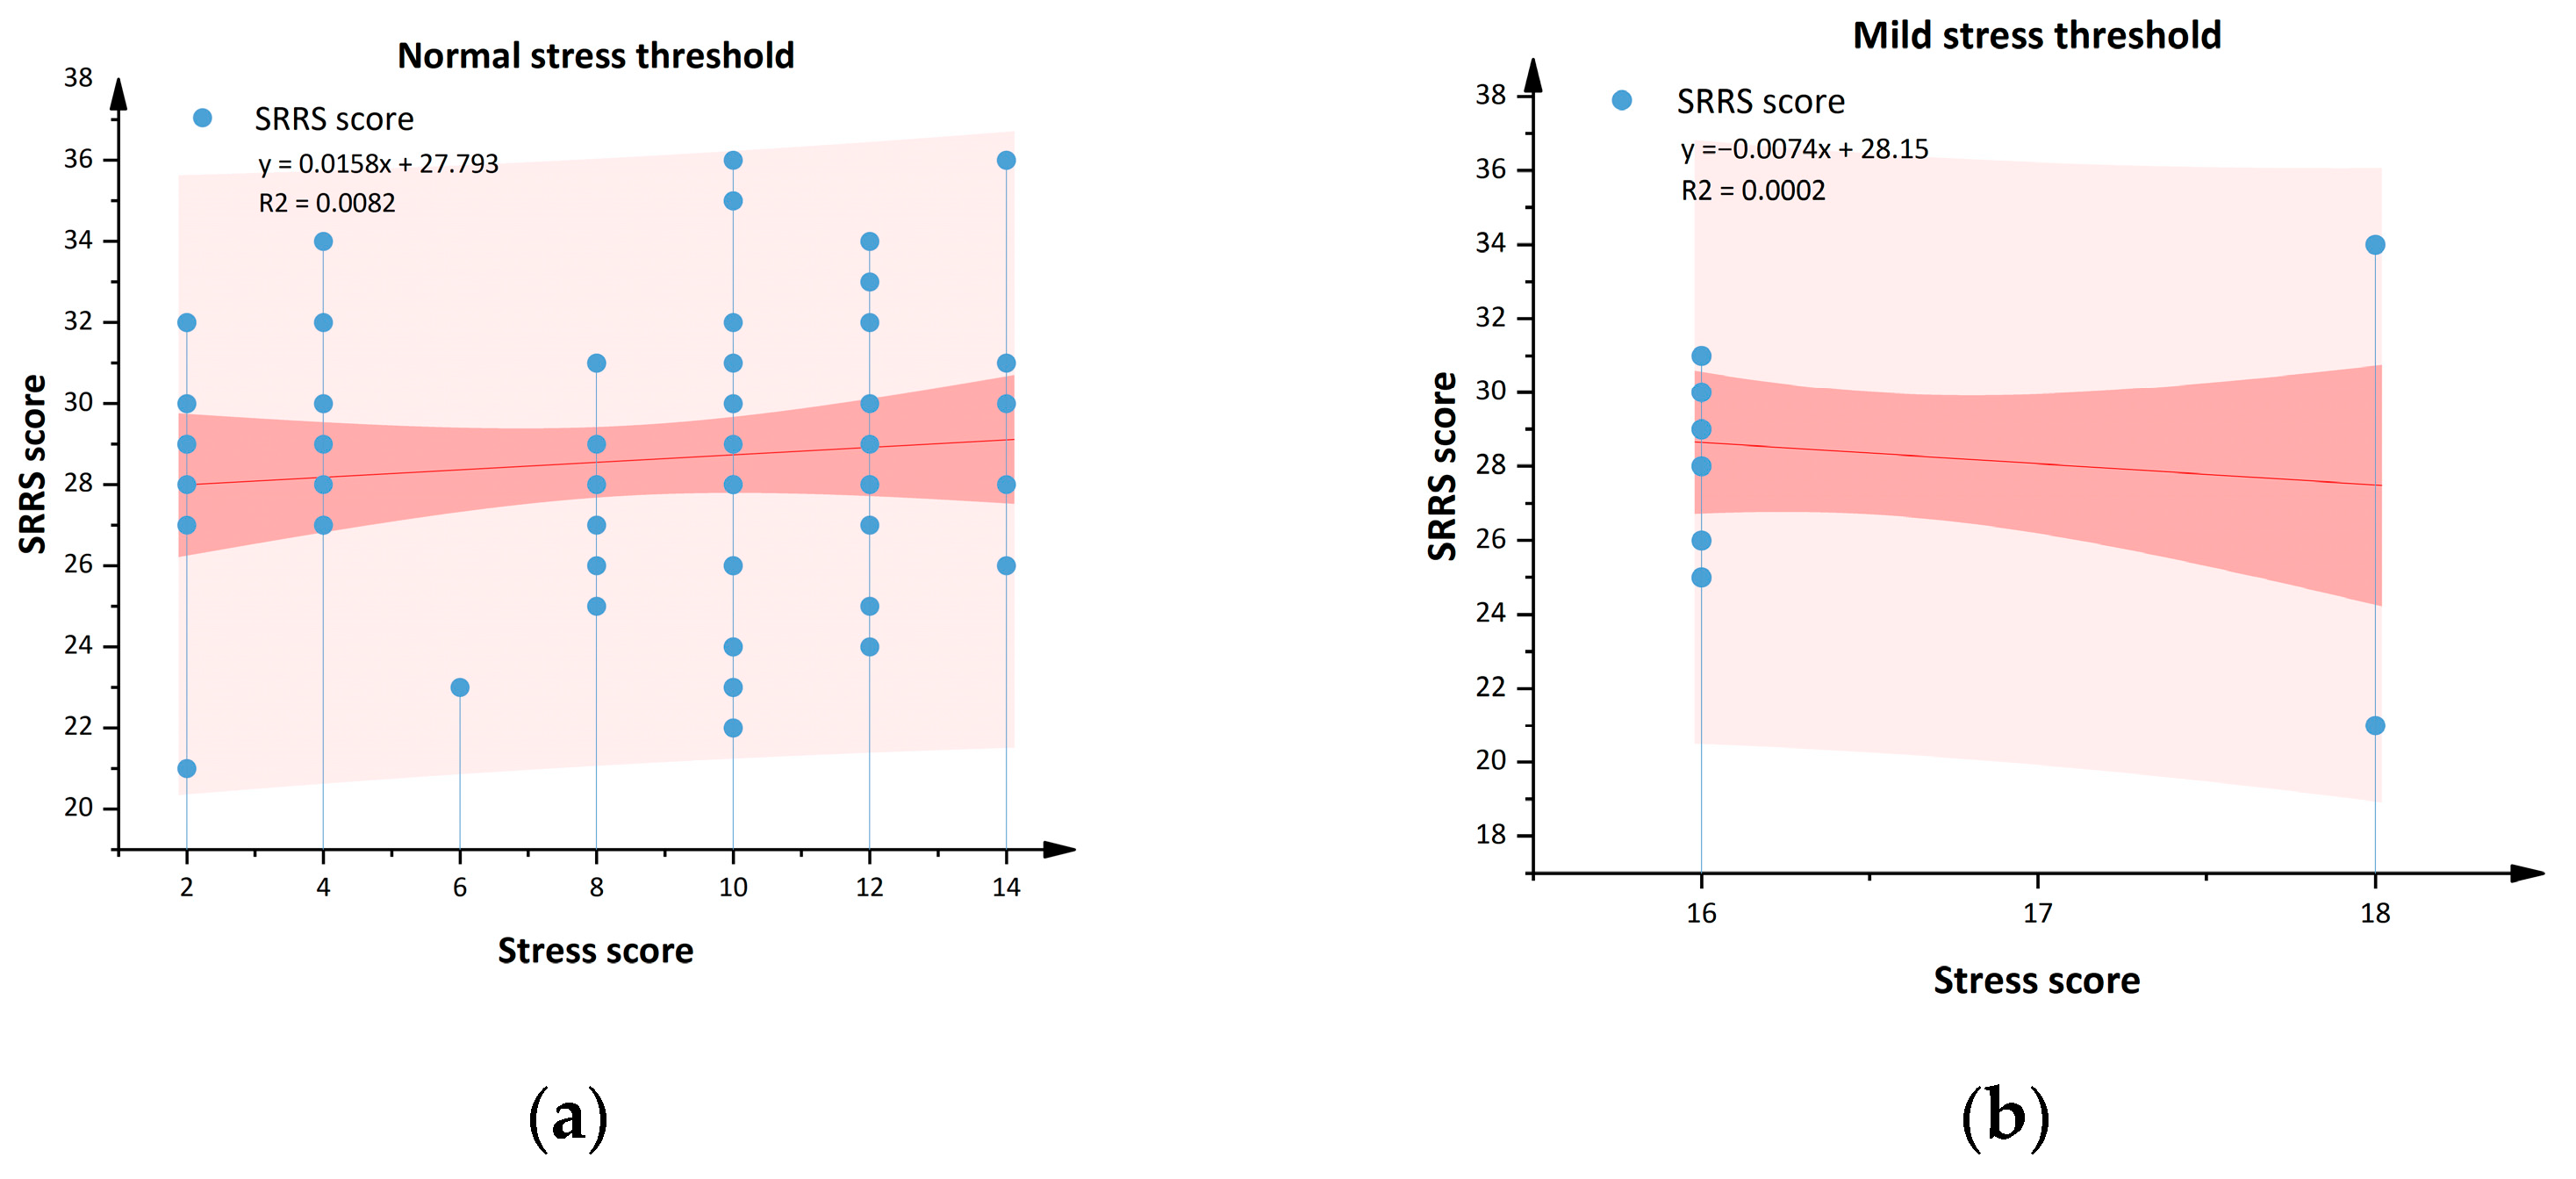
The stress threshold and self-rated restoration scale scores were subjected to Pearson correlation analysis in IBM SPSS 27 software, yielding the regression analysis results shown in Figure 5.
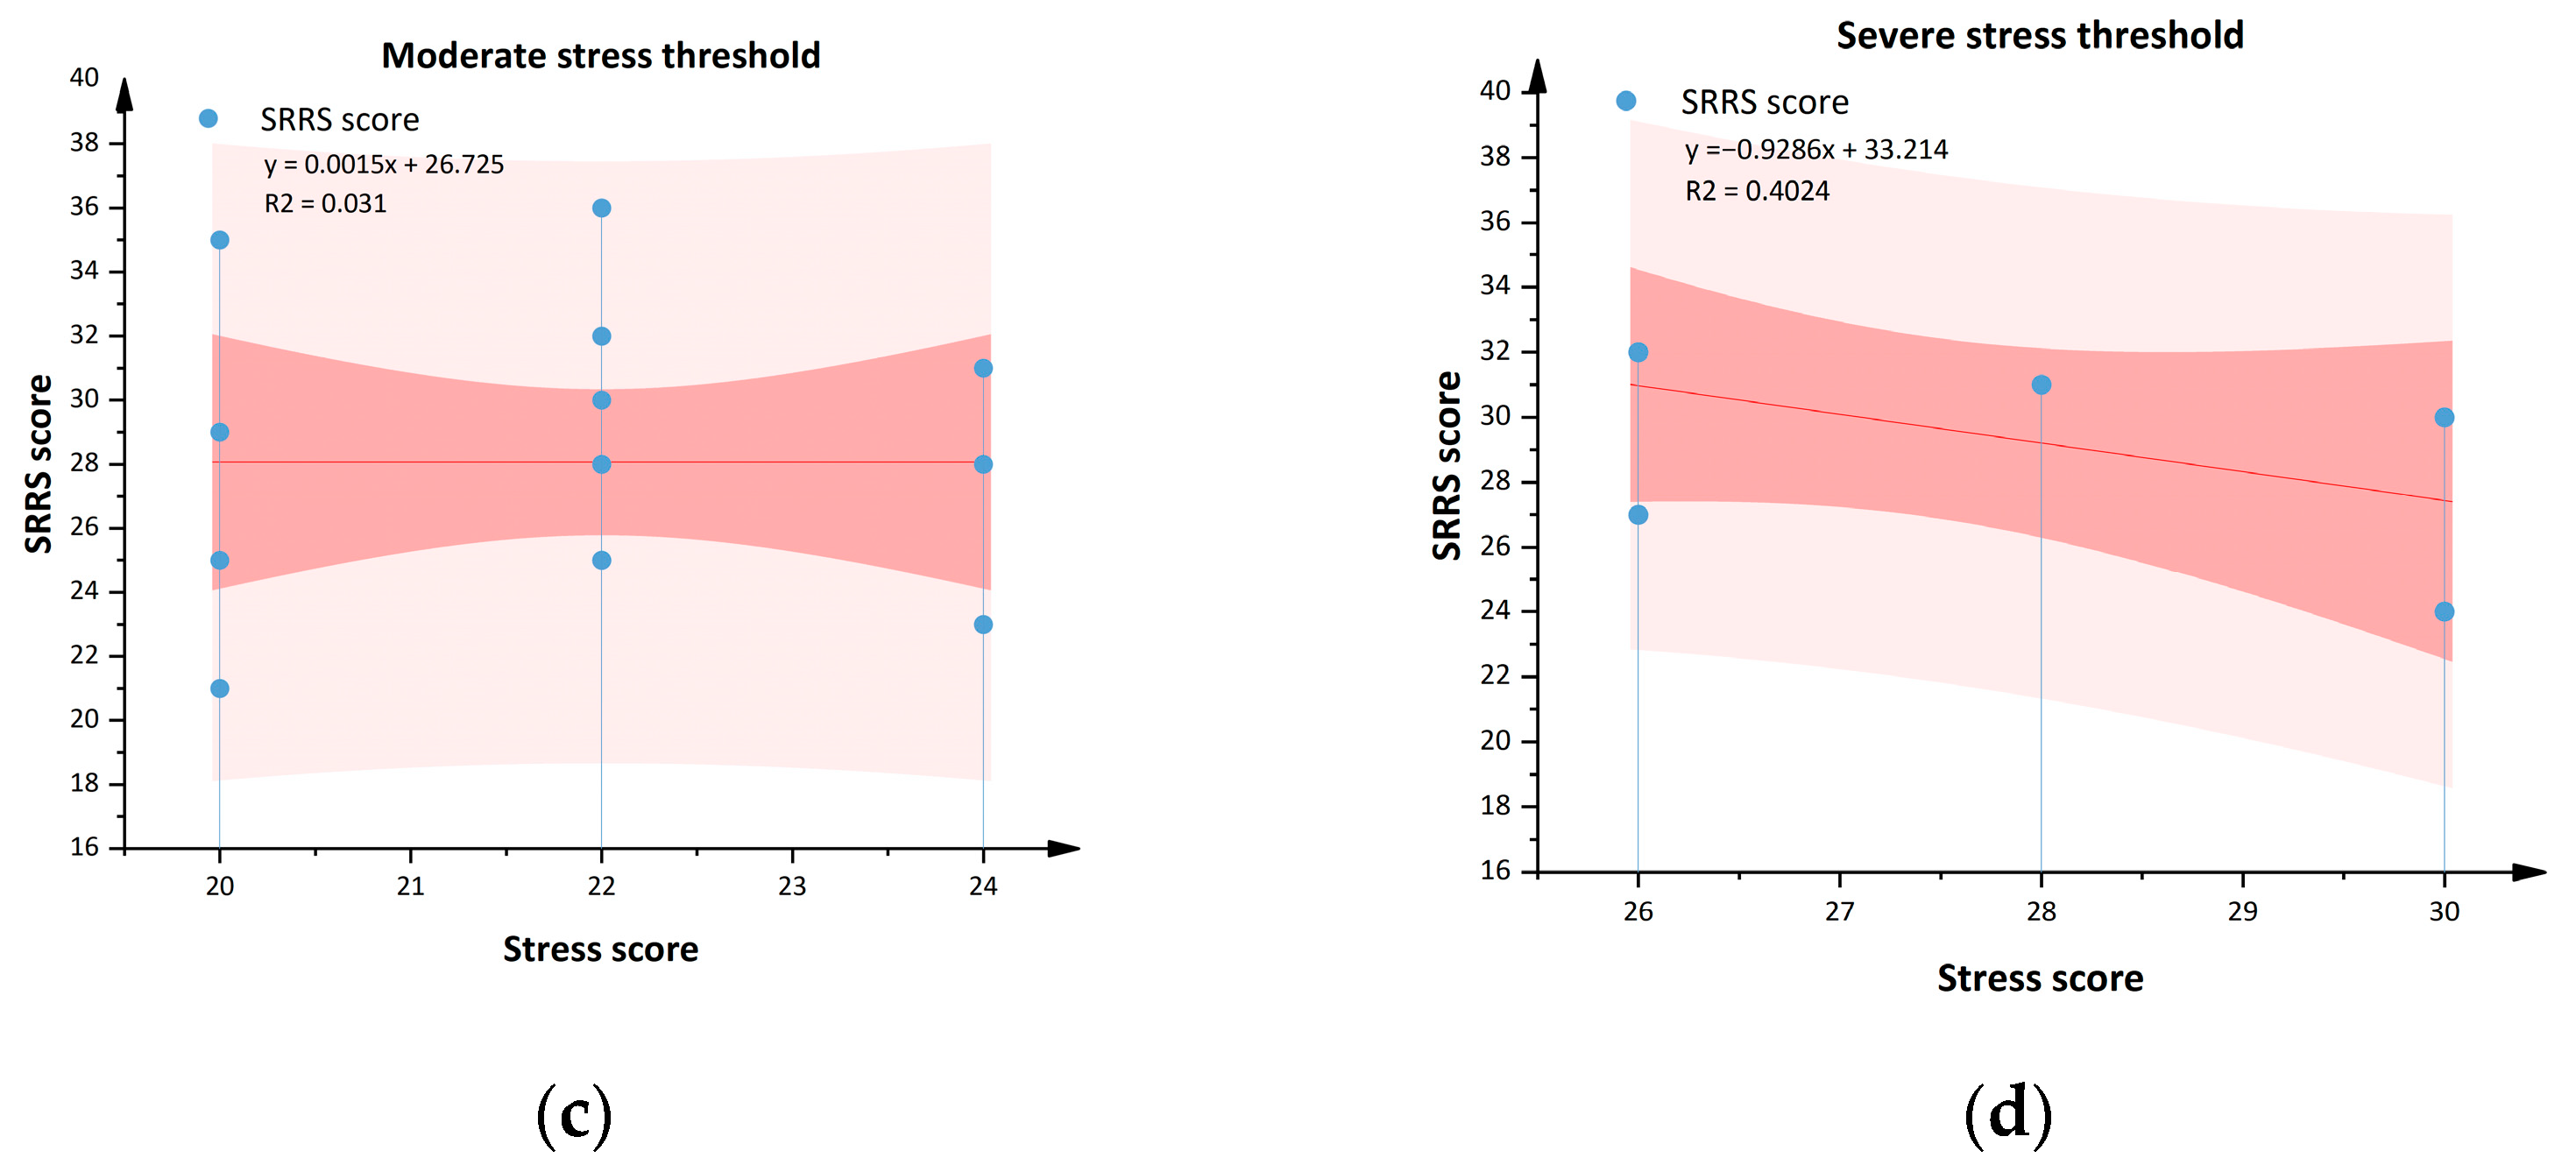
As illustrated in the figure, within the normal stress threshold range (a), subjects’ restorative benefits show a slight increase, though this correlation is not statistically significant. In contrast, among individuals with mild to severe stress (b–d), a negative correlation emerges between stress level and restorative benefits: higher stress levels are associated with poorer restorative benefits. This suggests that the relationship between stress threshold and self-reported restoration scores may be more complex than anticipated, potentially moderated or mediated by latent variables such as individual psychological state, environmental design, or activity preferences.
The study further indicates that the restorative benefits of park green spaces are not determined by stress threshold alone, but rather result from multiple interacting factors. To explore this, self-reported restoration scores were categorized into four dimensions—emotional, physiological, cognitive, and behavioral—and subjected to regression analysis against the stress thresholds of the respective population groups.
(2).
The four dimensions correspond to different changes in stress threshold awareness
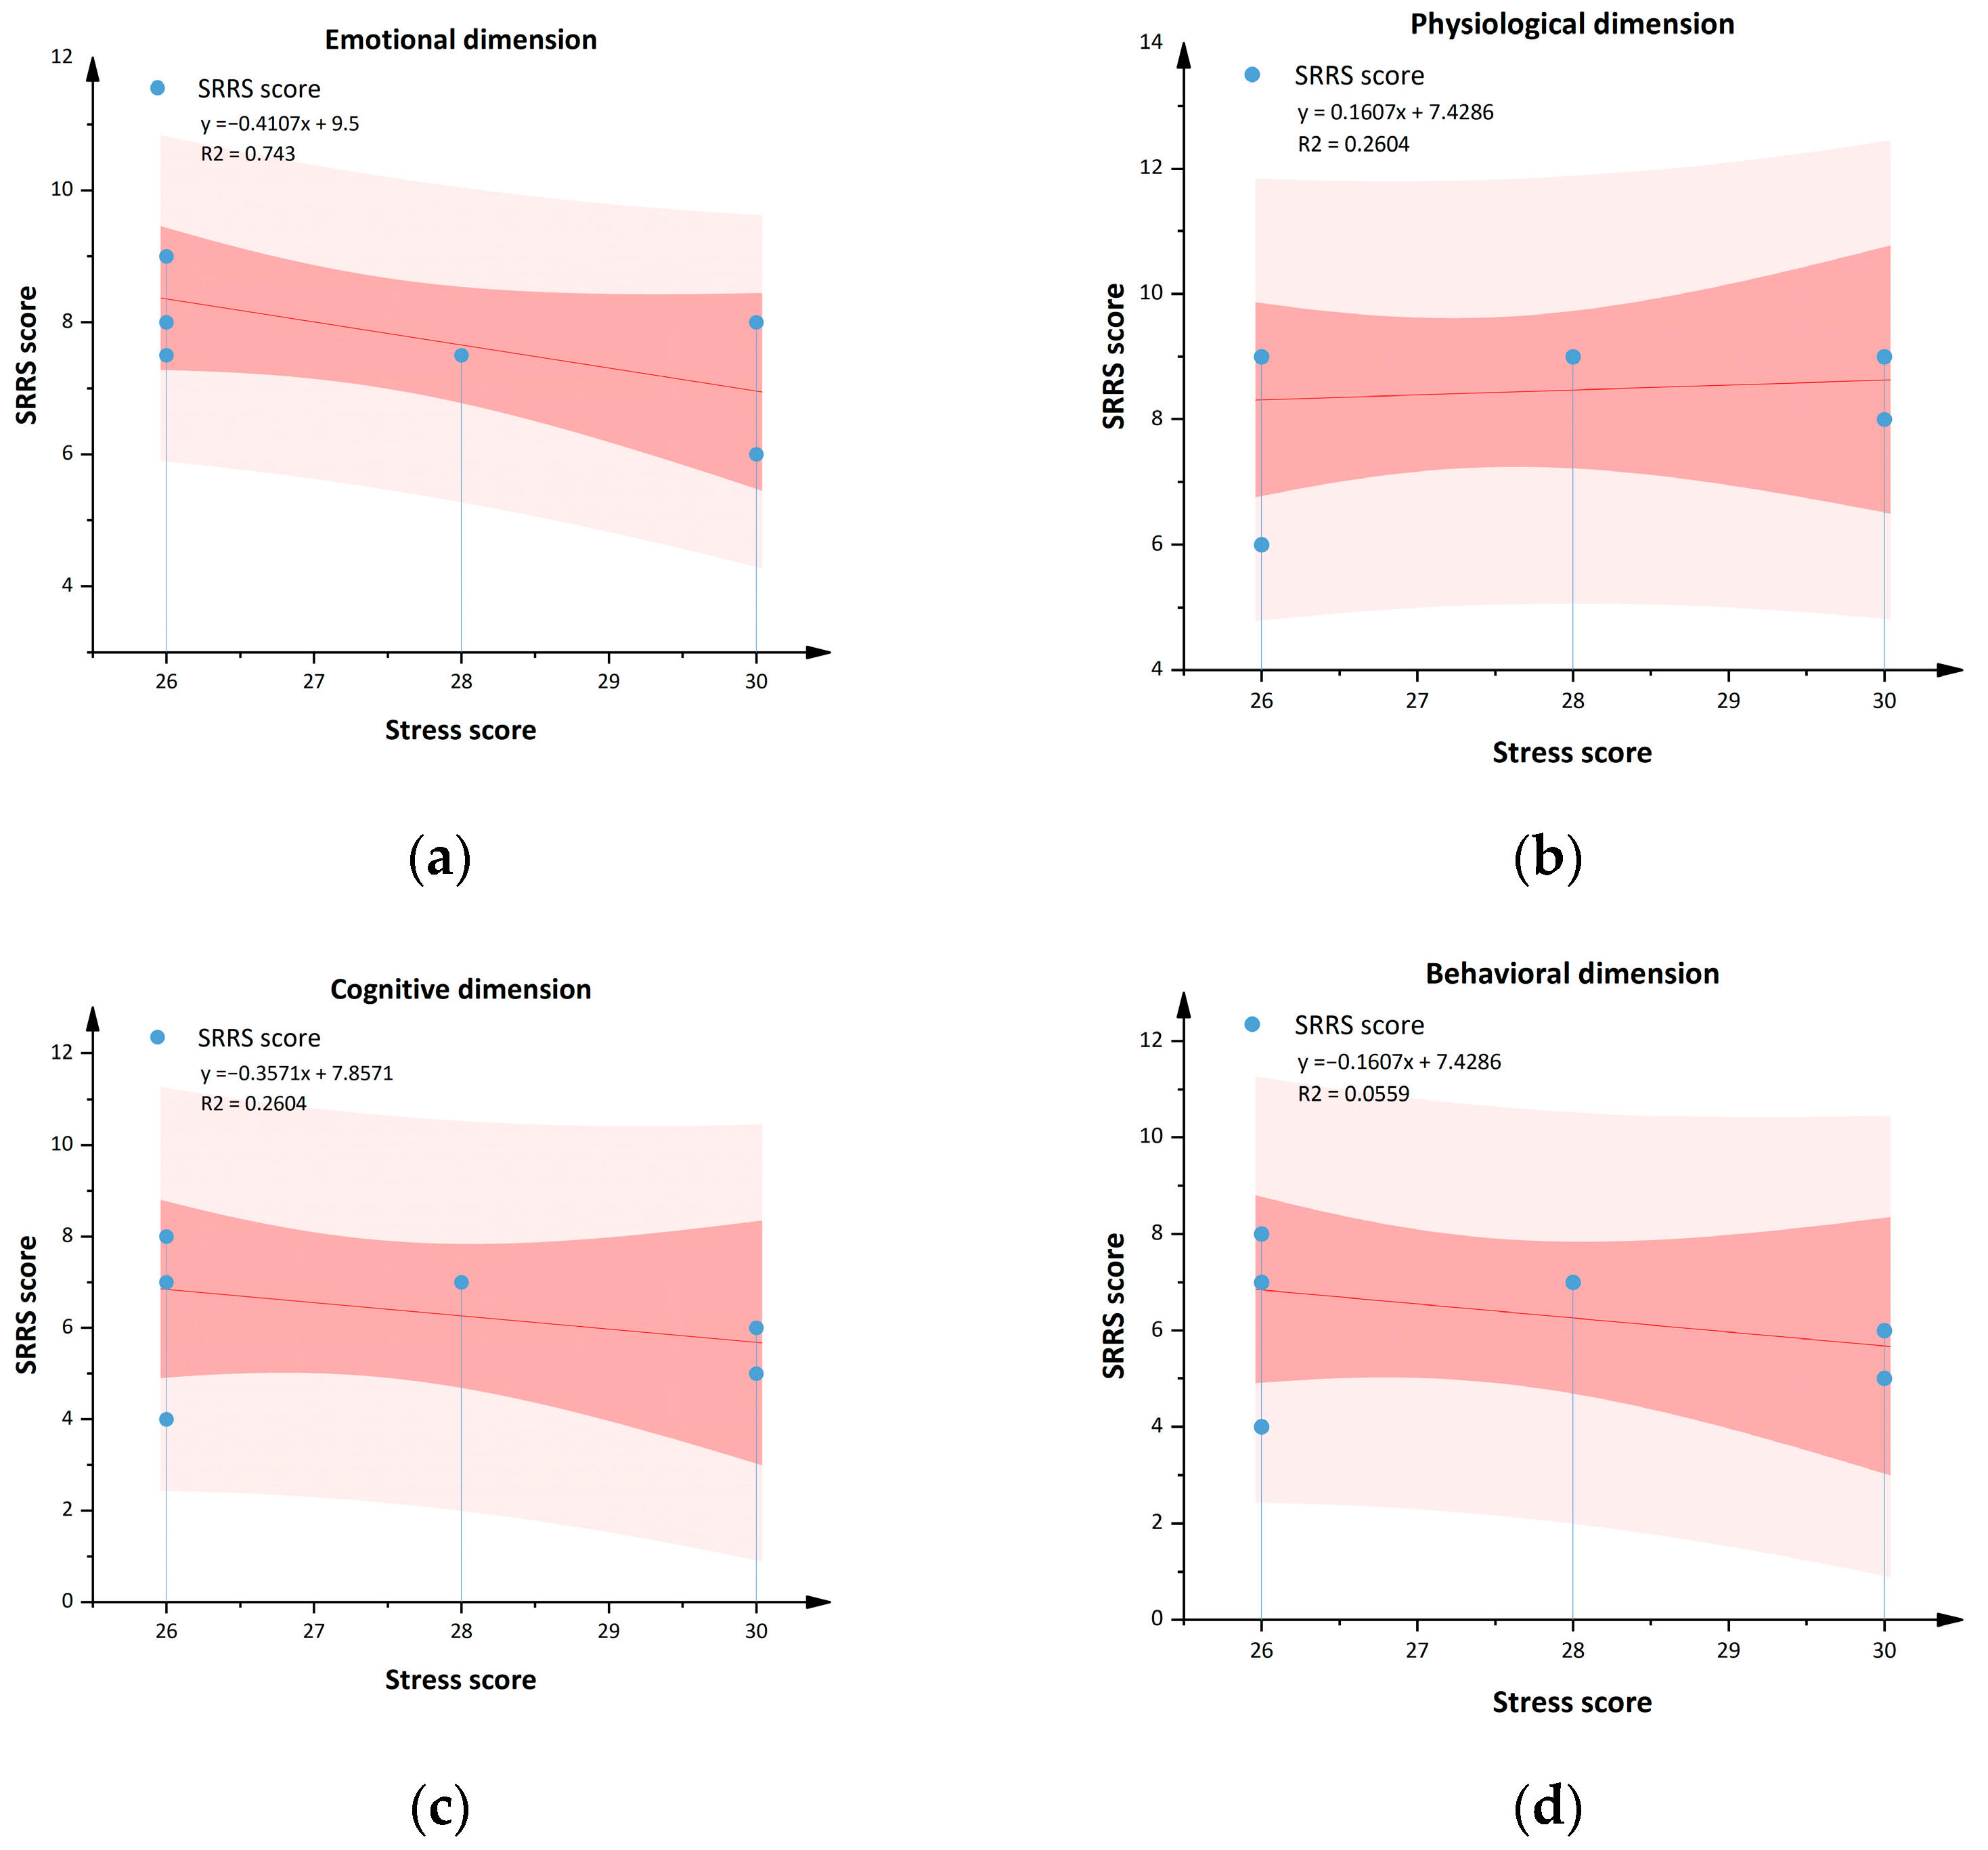
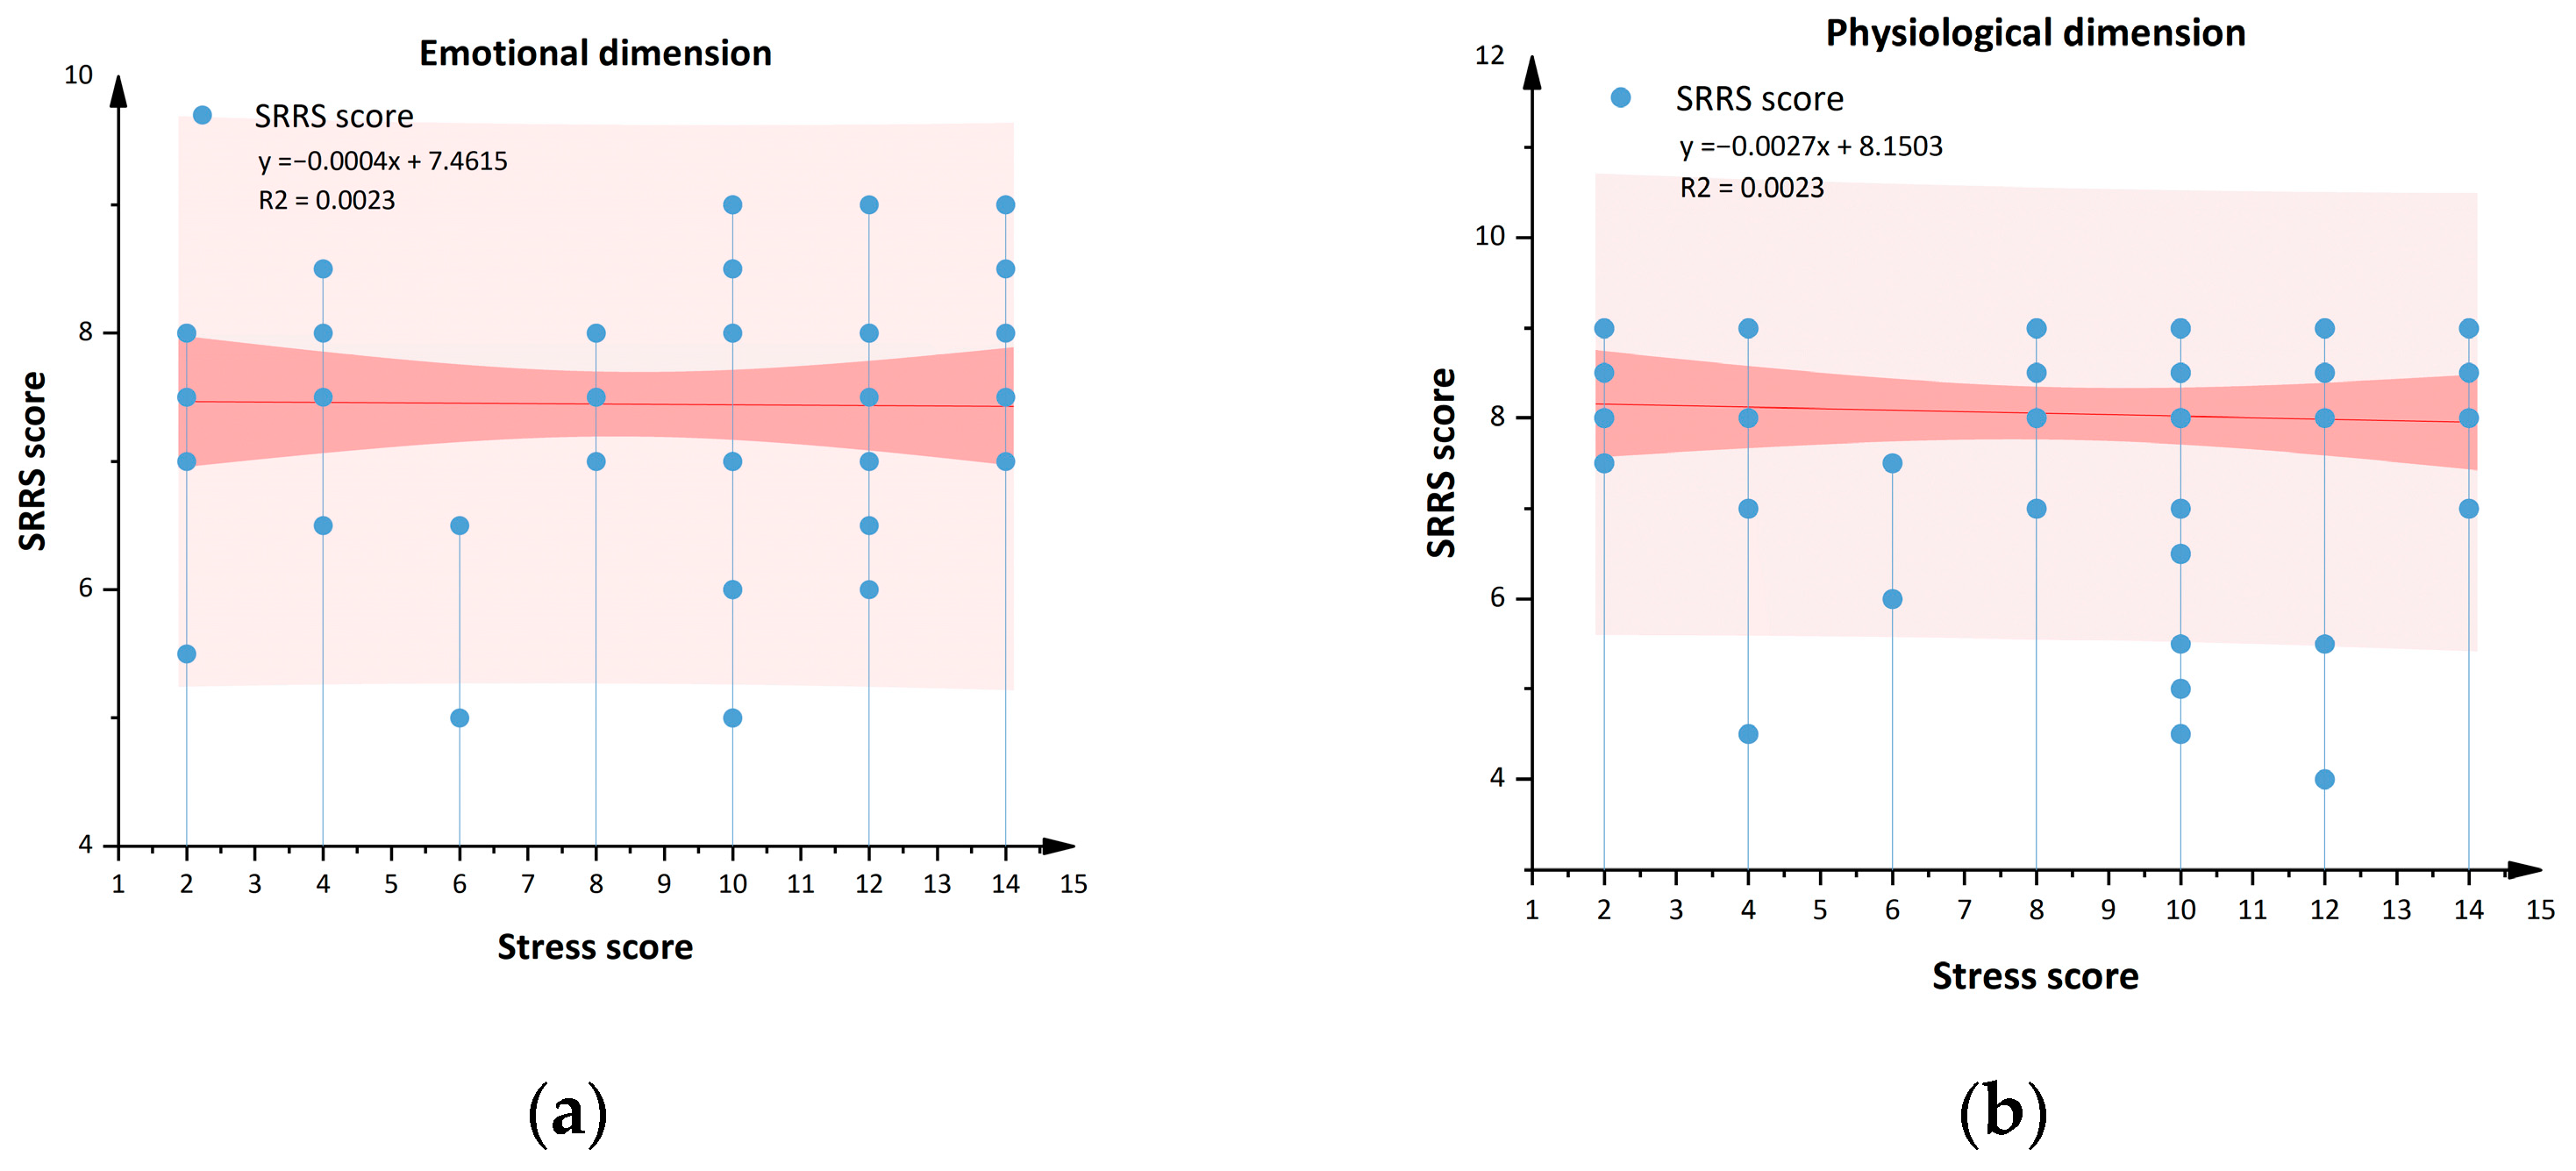
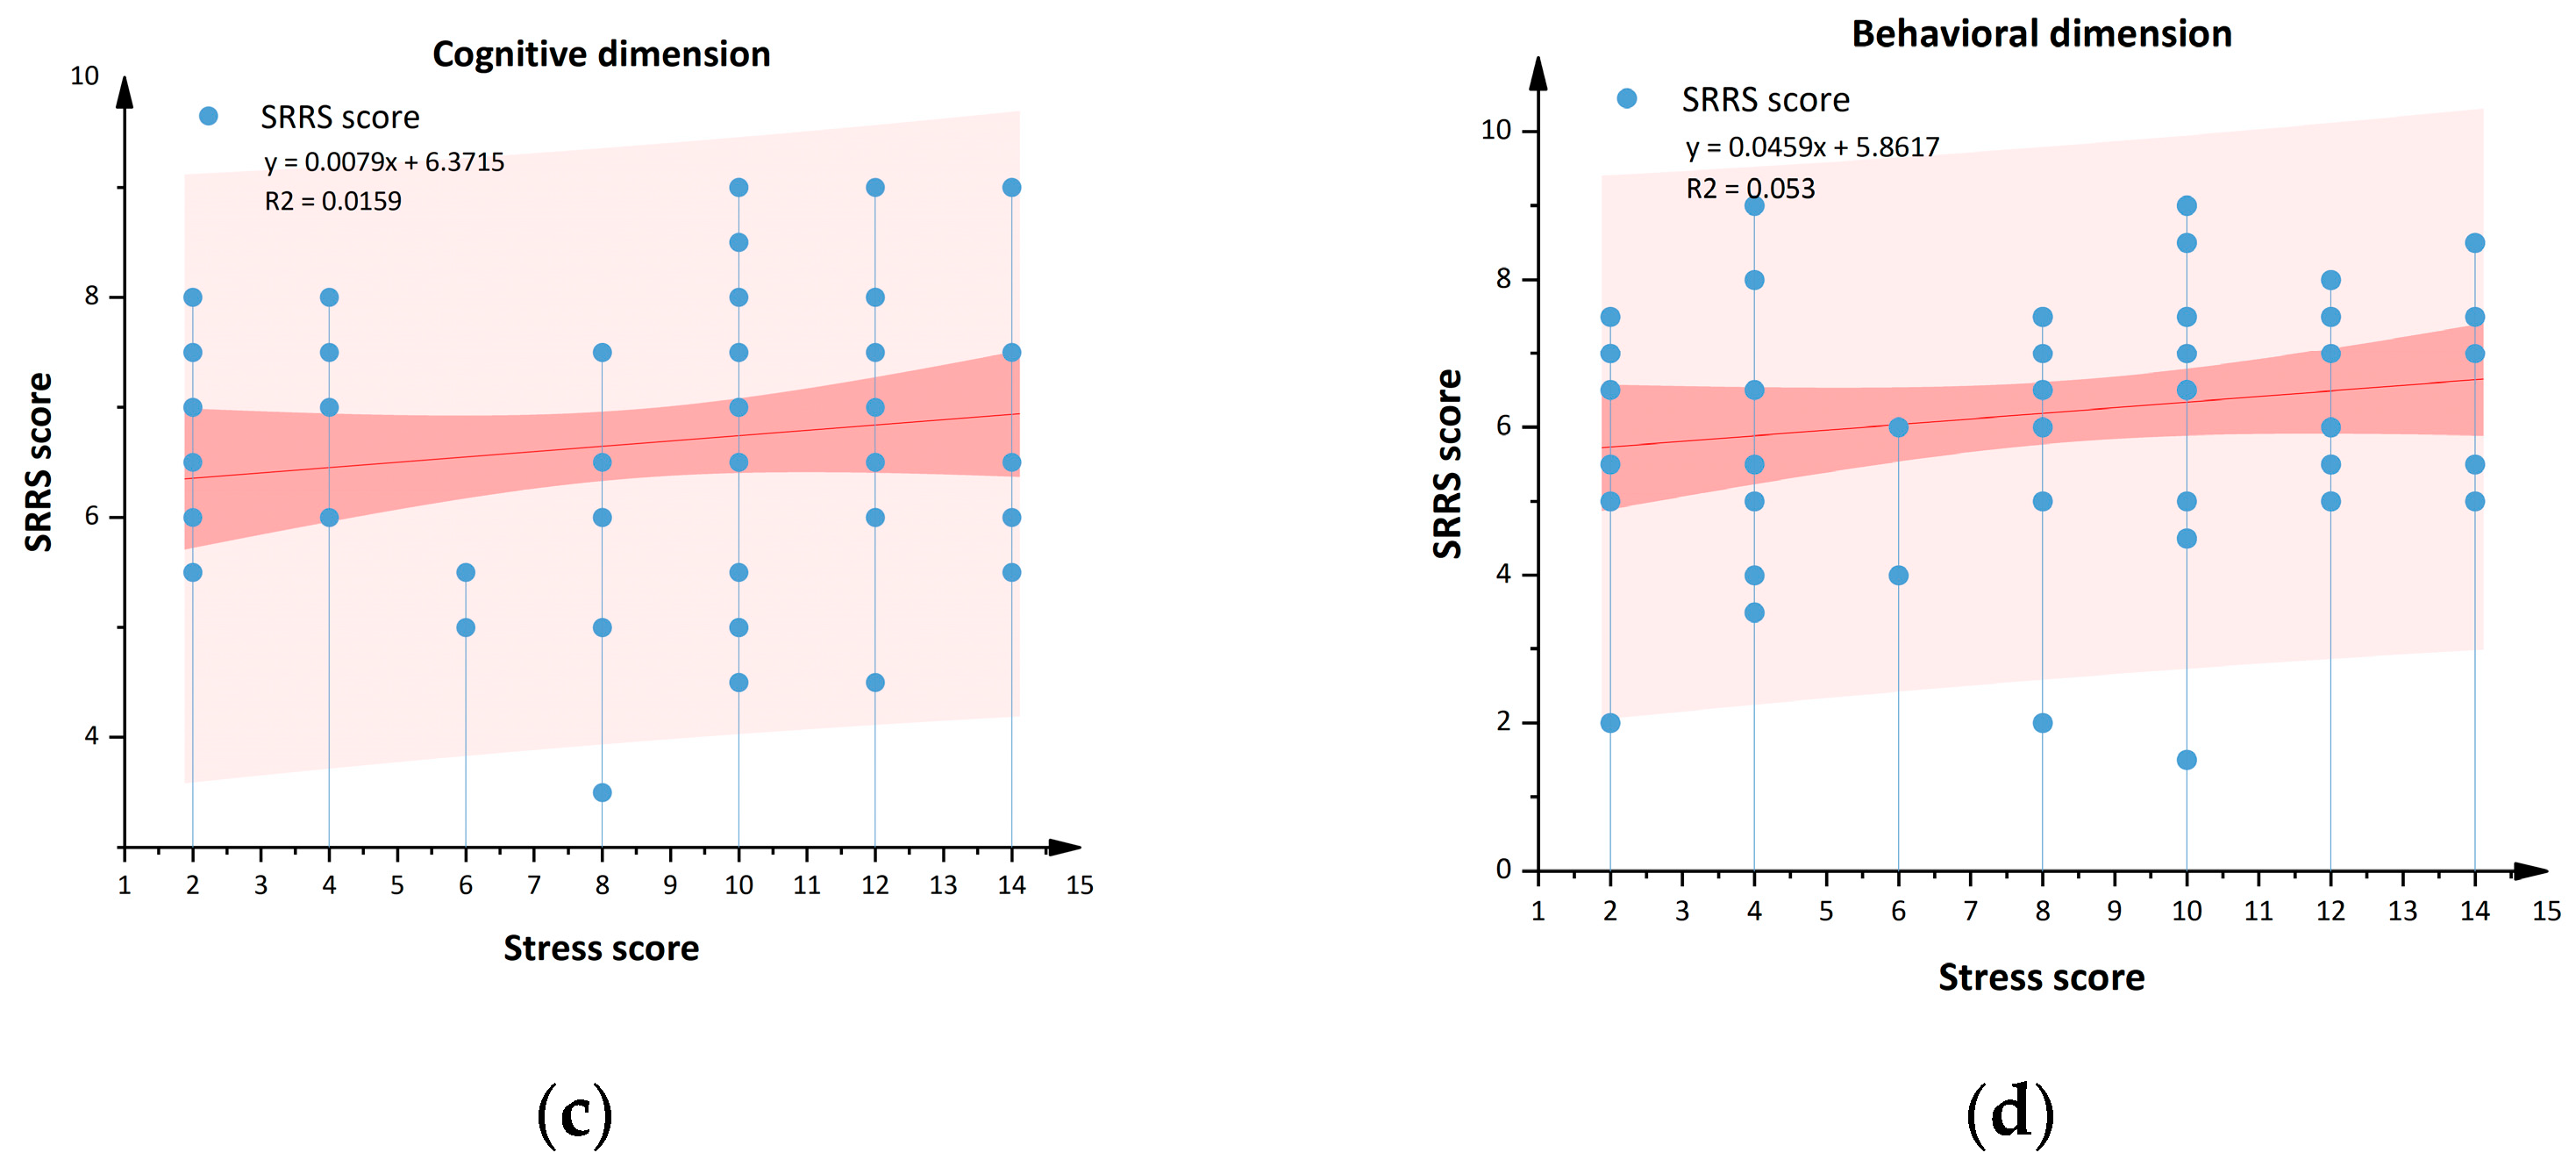
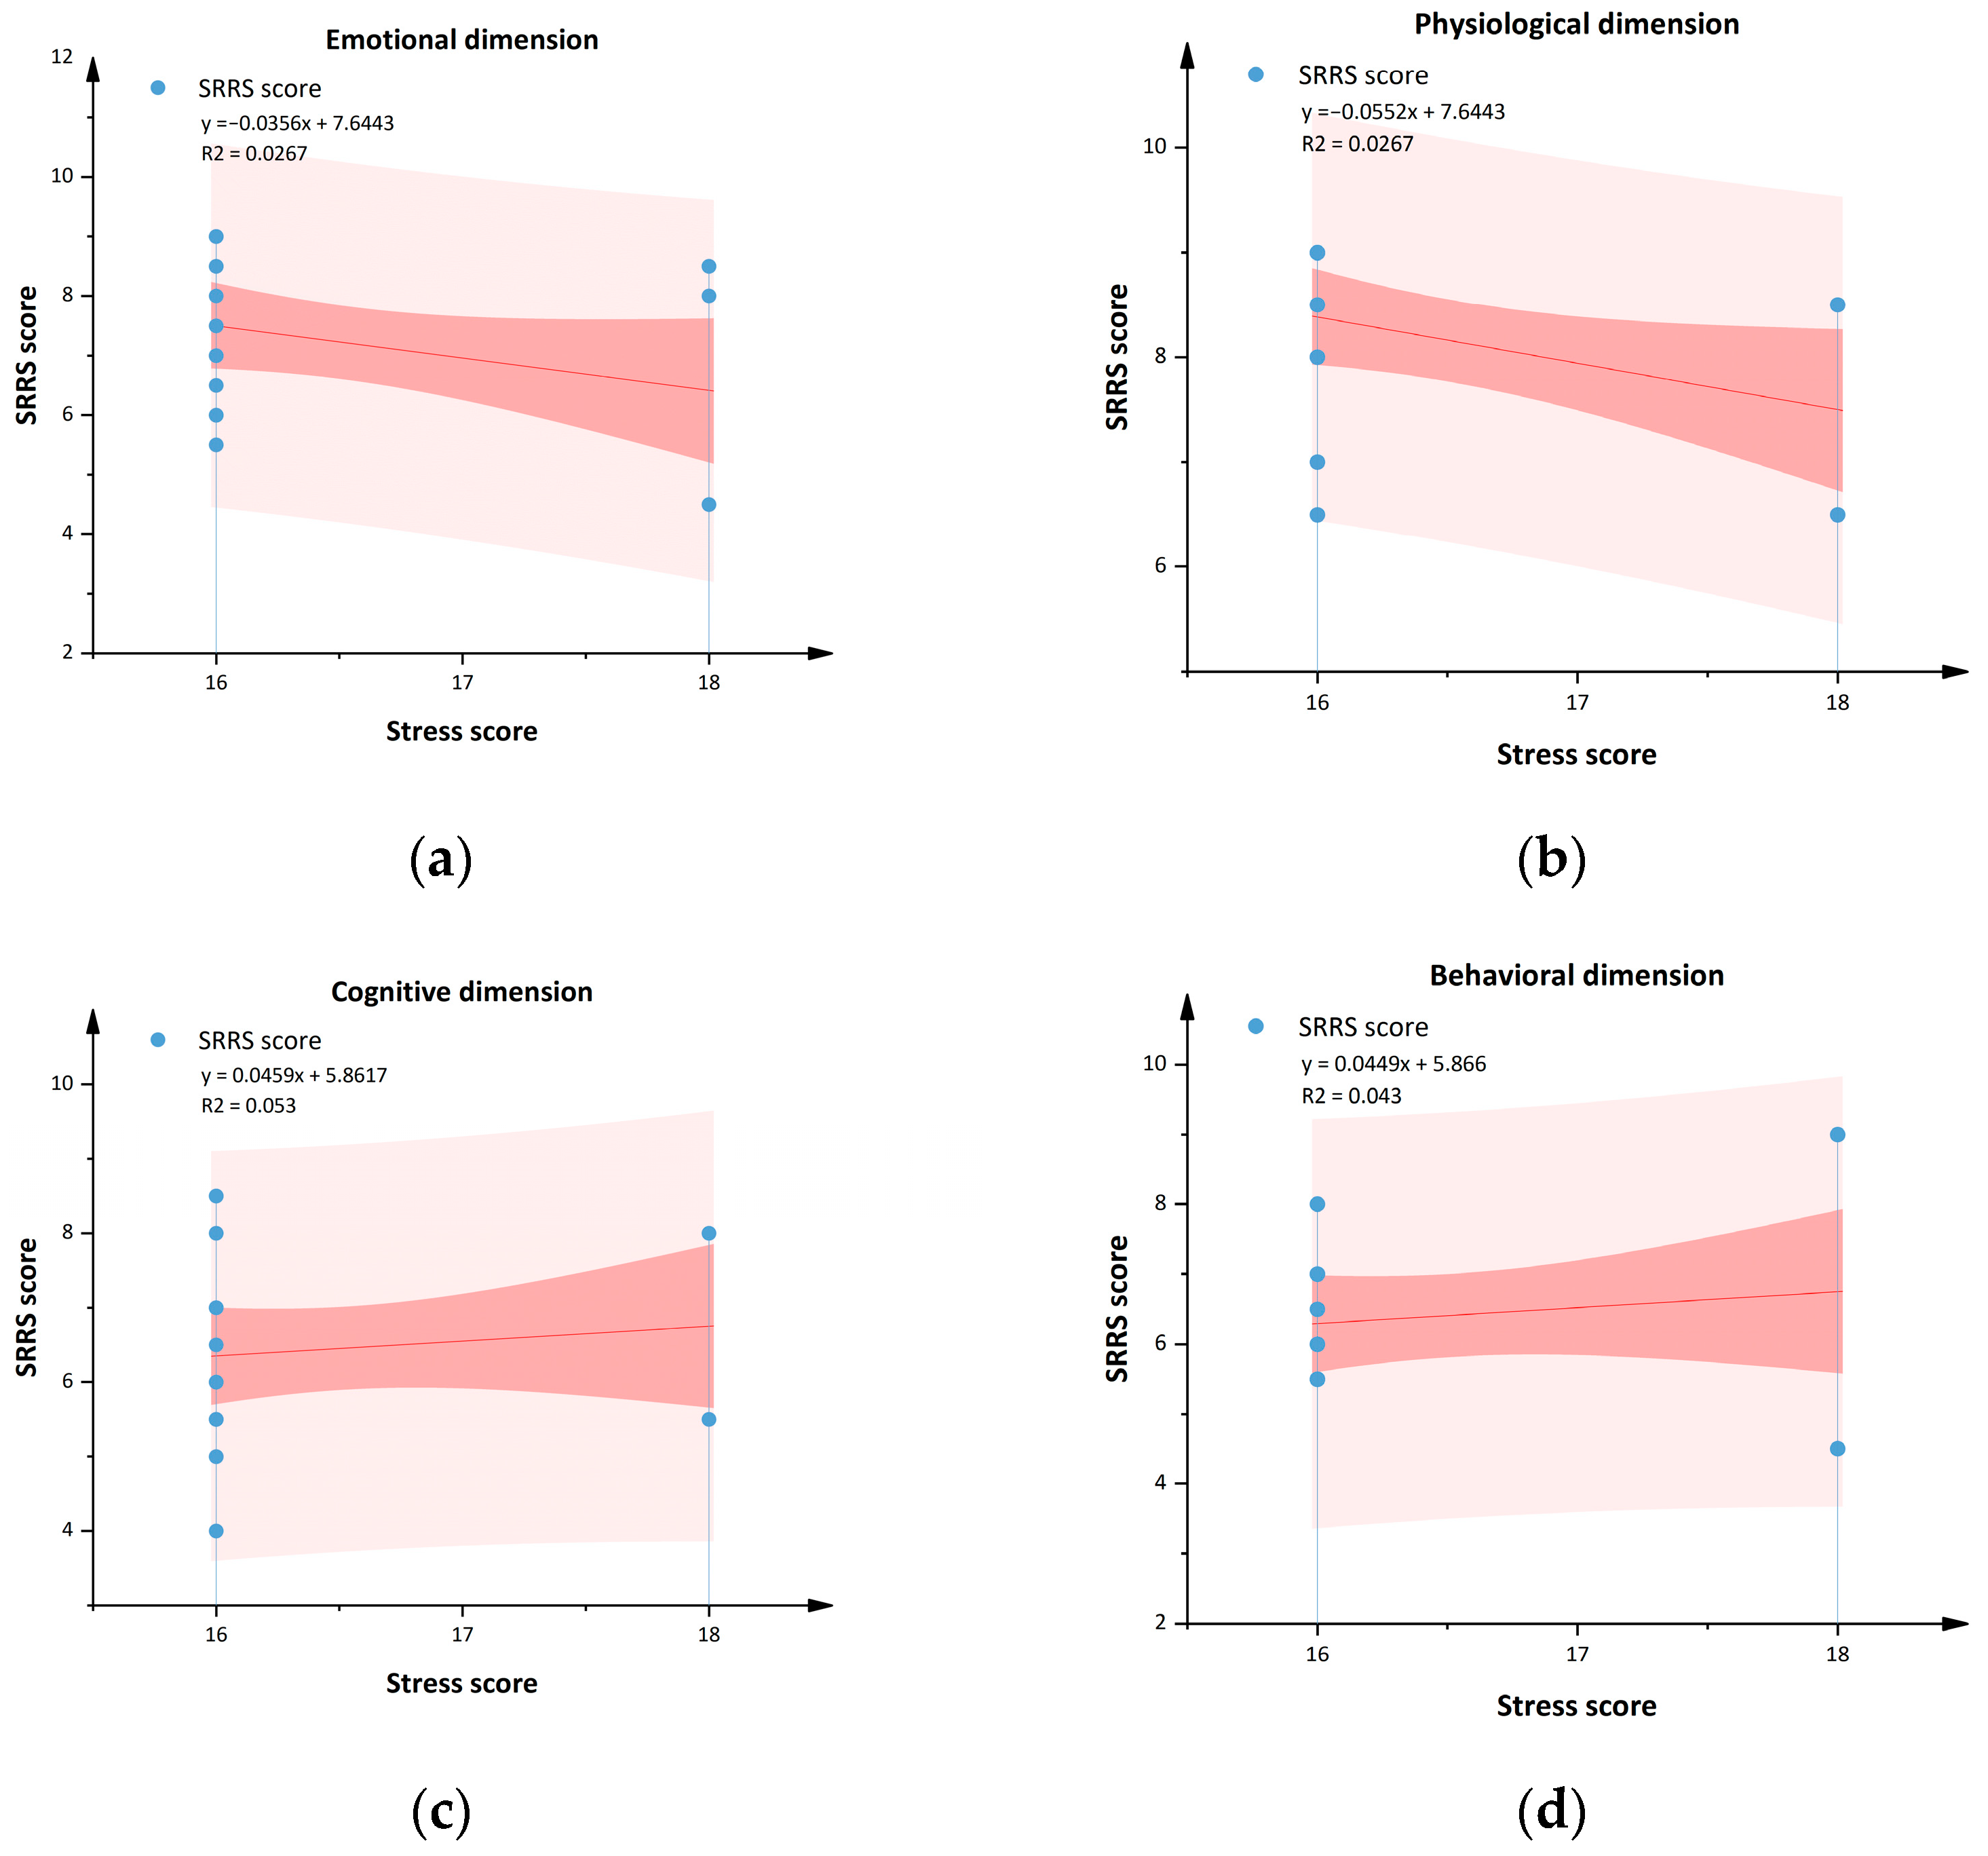
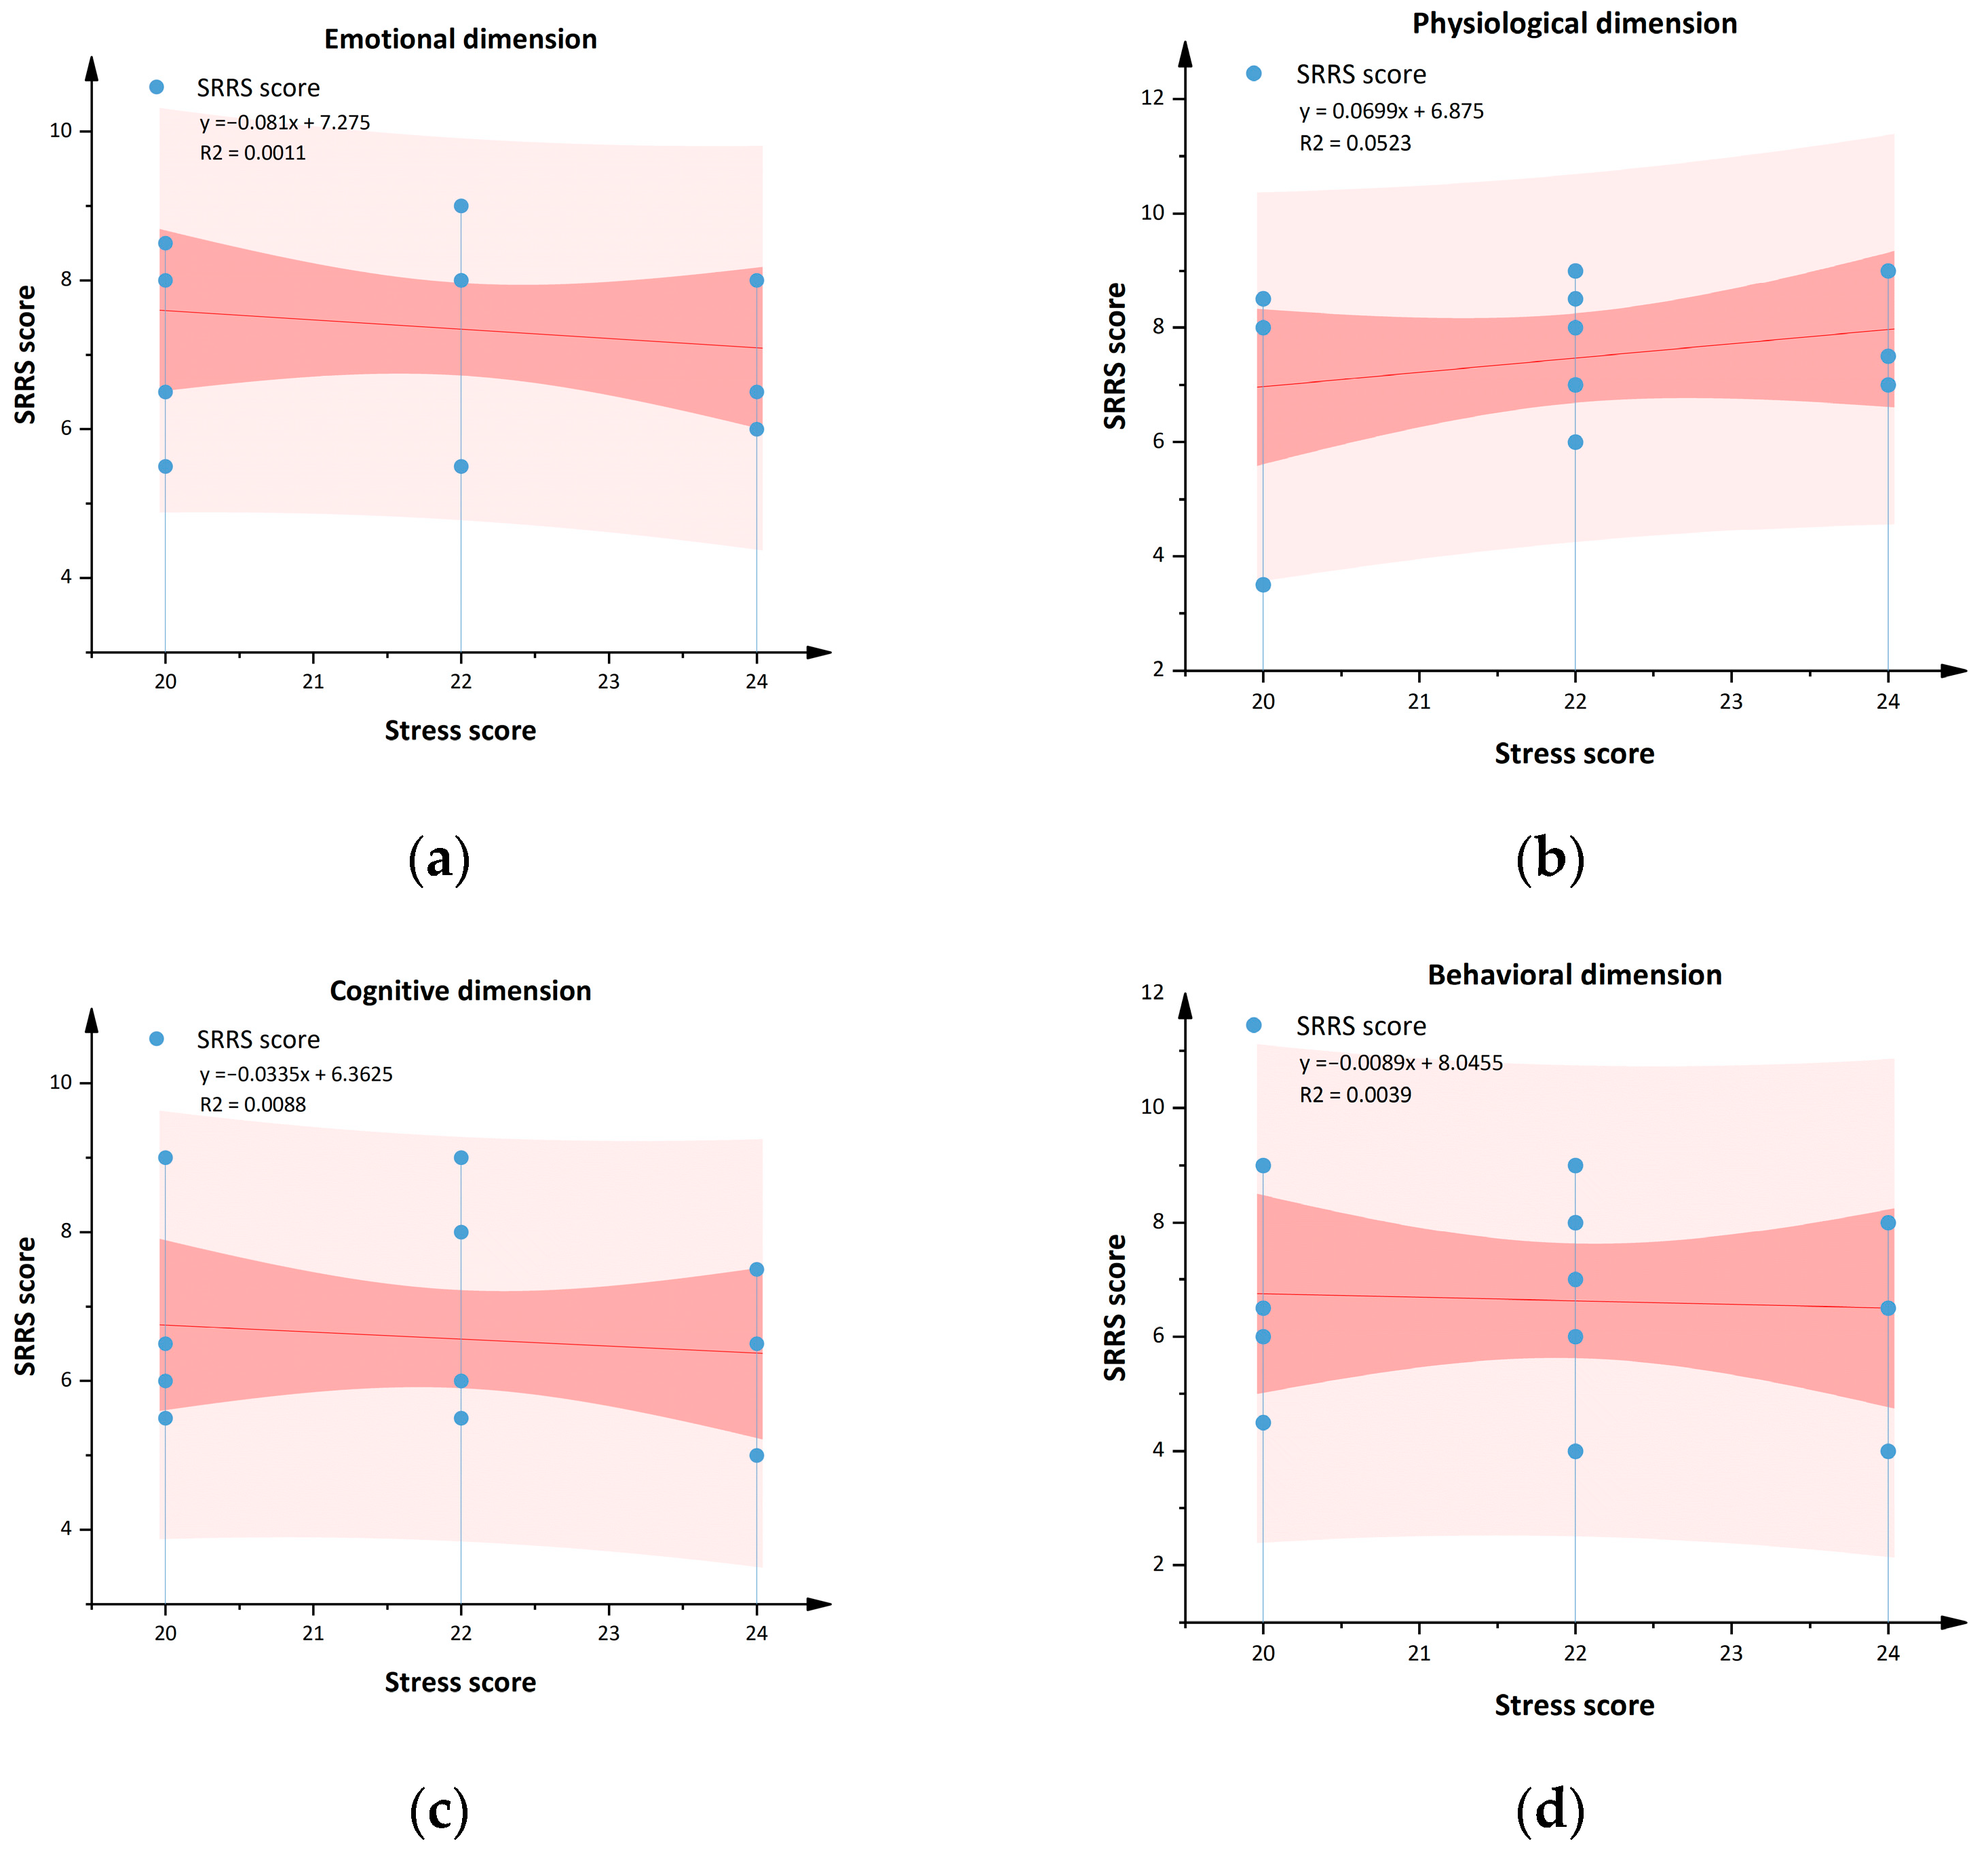
To further explore whether there is a deeper underlying mechanism between stress threshold and self-rated restoration, a detailed statistical analysis was conducted on the participants’ self-rated restoration scale results. The data were categorized and analyzed across four dimensions: emotional, physiological, cognitive, and behavioral. The regression analysis results for different stress threshold groups are presented in Figure 6, Figure 7, Figure 8 and Figure 9.
Among individuals with normal stress thresholds, restorative effects showed no significant correlation at the emotional and physiological levels. However, a slight positive correlation was observed at the cognitive and behavioral levels. This suggests that the benefits gained by the normal stress group in park environments are primarily reflected in cognitive and behavioral aspects. Appropriate interaction with natural settings can enhance their subjective initiative, improve sensory cognition, and increase activity capacity.
Figure 7. Mild stress threshold population 4-dimensional evenly distributed trend (Figure source: drawn by the author). (a) Trend of emotional dimension distribution. (b) Trend of ptysiological dimension distribution. (c) Trend of cognitive dimension distribution. (d) Trend of behavioral dimension distribution.
Land 14 02293 g007
Among the population with a mild stress threshold, a non-significant positive trend in restorative benefits was observed at the cognitive and behavioral level, while negative correlations appeared in the other dimensions. This suggests that for individuals with mild stress, the benefits gained maybe from park environments are primarily reflected in the behavioral domain. Specifically, appropriate outdoor interaction can enhance their activity capacity; however, it may also relate to negative impacts on their emotional and cognitive states.
Figure 8. Moderate stress threshold population 4-dimensional evenly distributed trend (Figure source: drawn by the author). (a) Trend of emotional dimension distribution. (b) Trend of ptysiological dimension distribution. (c) Trend of cognitive dimension distribution. (d) Trend of behavioral dimension distribution.
Land 14 02293 g008
Among the population with a moderate stress threshold, no significant correlation in restorative benefits was observed at the cognitive level, while a slight positive correlation appeared at the physiological level. Negative correlations were found in the emotional and behavioral dimensions. This indicates that for individuals with moderate stress, the benefits derived from park environments are mainly attributed to physiological stimulation.
Figure 9. Severe stress threshold population 4-dimensional evenly distributed trend (Figure source: drawn by the author). (a) Trend of emotional dimension distribution. (b) Trend of ptysiological dimension distribution. (c) Trend of cognitive dimension distribution. (d) Trend of behavioral dimension distribution.
Land 14 02293 g009
Among individuals with a high stress threshold, restorative benefits exhibited a slight positive correlation at the physiological level, while negative correlations were observed across all other dimensions. These results indicate that although park environments may confer certain benefits to this population, individuals with excessively high stress levels should limit their duration of activity and engage in less complex or demanding tasks.
Although the severe stress group showed the highest total SRRS score, this may be driven primarily by heightened physiological sensitivity. In contrast, their emotional, cognitive, and behavioral restorative benefits decreased as stress levels increased, indicating a possible “decoupling” between physiological and psychological restoration under extreme stress.
A comprehensive analysis indicates that park-based green space activities exert significant stress-reduction and restorative environmental effects on participants. Across all stress threshold groups, this positive benefit was consistently observed, with participants generally experiencing stress relief and psychophysiological recovery following park activities. However, an in-depth analysis of recovery patterns within different stress threshold groups reveals critical differences: although individuals with normal to moderate stress levels showed relatively lower overall restorative benefits, their restorativeness—encompassing emotional, cognitive, behavioral, and physiological dimensions—demonstrated a slight upward trend with increasing stress levels, and negative effects were limited. In contrast, while individuals with high stress levels exhibited the highest overall recovery scores, their restorative benefits—particularly in emotional, cognitive, and behavioral domains—significantly decreased as stress levels increased. This finding highlights a marked divergence in recovery trends between the high-stress group and other stress threshold populations, suggesting that the benefits of park environments diminish as stress intensifies.

3.1.2. Environmental Awareness Capability

To explore the environmental awareness and behavioral activity preferences among different stress threshold groups, a correlation analysis was conducted on three influencing factors. After importing the environmental awareness and behavioral activity data into IBM SPSS 27 software, they were analyzed separately in relation to stress thresholds. The Pearson correlation test includes two indicators: a significance level of p < 0.05 indicates a significant correlation between the variables; the correlation coefficient determines the strength of the relationship. Generally, an absolute correlation value greater than 0.3 is considered to indicate a moderate or stronger correlation, while a value greater than 0.5 suggests a strong correlation. A positive value denotes a positive correlation, and a negative value indicates a negative correlation.
Correlation analysis between environmental awareness factors and stress threshold groups (Table 3) indicates that most environmental factors are significantly associated with specific stress levels, with varying correlation directions. Key findings include:
Plant color was weakly positively correlated with mild stress (r = 0.249).
Plant variety showed weak positive correlations with mild (r = 0.285) and moderate stress (r = 0.185).
Plant scent exhibited a weak negative correlation with normal stress (r = −0.200).
Plant layering was moderately positively correlated with mild (r = 0.233), moderate (r = 0.352), and severe stress (r = 0.365).
Water landscape appreciation was weakly positively correlated with mild (r = 0.303) and moderate stress (r = 0.243).
Terrain form showed a weak positive correlation with severe stress (r = 0.192).
Rest facility comfort was weakly negatively correlated with normal (r = −0.211) and severe stress (r = −0.205).
Paving comfort had a weak negative correlation with normal stress (r = −0.192), but weak positive correlations with mild (r = 0.254) and moderate stress (r = 0.239).
Several factors—including architectural aesthetics, building quantity, rest facility landscape orientation, path guidance, activity space area, and the number and variety of fitness and recreational facilities—showed no significant linear correlations with any stress threshold (p > 0.05). However, this does not preclude the possibility of nonlinear relationships, which warrant further investigation.
Overall, the associations between environmental awareness factors and stress levels are complex, including both positive and negative correlations, and vary by stress severity. Some factors are only correlated with specific stress levels. Although certain variables did not show significant linear associations, their potential nonlinear or interactive effects merit deeper exploration in future research.

3.1.3. Preference for Behavioral Activities

Correlation analysis between types of behavioral activities and stress threshold groups (Table 4) indicates that most behavioral activity dimensions do not exhibit significant linear correlations with stress levels (p > 0.05), though nonlinear or interactive effects cannot be ruled out. Specific findings include:
Relaxation and reflection showed a weak positive correlation with mild stress (r = 0.198).
Nature contact and social interaction had no significant linear correlations with any stress threshold group (p > 0.05).
Free activities exhibited a weak negative correlation with severe stress (r = −0.221).
Facility-based activities and site-based activities were not significantly correlated with any stress threshold group (p > 0.05).
Walking was weakly positively correlated with moderate stress (r = 0.245).
Running showed a weak negative correlation with normal stress (r = −0.203).
Cycling had no significant linear correlation with any stress threshold group (p > 0.05).
In summary, only a few significant linear correlations were observed between behavioral activities and stress thresholds, with varying directions depending on the activity type and stress level. This suggests that complex, nonlinear relationships may exist between specific park behaviors and the restorative benefits experienced by individuals with different stress levels, warranting further investigation.
3.2. Influence Mechanisms of Environmental Restorative Benefits on Populations with Different Stress Thresholds

3.2.1. Model Building and Variable Definition

To explore the influence mechanism of urban park environmental awareness on individual restorative benefits, this study constructed a dual-path mediation model encompassing “Environmental awareness—Behavioral activities—Restorative benefits—Stress relief”. (Stress relief was modeled as the difference score of the DASS-21 stress subscale (post-test minus pre-test) and included as an observed variable in the structural equation model). The theoretical basis of this model is as follows: environmental awareness activates an individual’s attention restoration process through sensory stimuli such as sight and sound; behavioral activities regulates the consumption and recovery efficiency of psychological resources through the degree of person-environment fit; and restorative benefits, as a key mediating variable, reflect the individual’s comprehensive perceptual integration of the aforementioned restorative effects.
This study defines the latent variables and their observed indicators in the model as Table 5:
Based on the aforementioned research hypotheses and variable definitions, a conceptual model was ultimately constructed to test the effect of environmental awareness on restorative benefits (Figure 10).

3.2.2. Reliability and Validity Testing

Based on the valid data obtained from the questionnaire survey, this study used IBM SPSS 27 software to perform KMO and Bartlett’s test of sphericity on the variables in the measurement model. The test results showed that the KMO value was 0.745 (greater than the reference value of 0.6), and the significance level (sig.) of Bartlett’s test was less than 0.001 (less than the reference value of 0.05), indicating that the variables in this model are suitable for factor analysis.
We used Maximum Likelihood Estimation (ML) and reported standardized factor loadings, Composite Reliability (CR), Average Variance Extracted (AVE), and the Heterotrait-Monotrait ratio (HTMT). All factor loadings were greater than 0.6, CR > 0.8, AVE > 0.5, and HTMT < 0.9, indicating that the measurement model has good reliability and discriminant validity.
A model fit test was conducted, and the results are shown in Table 6. The Goodness-of-Fit Index (GFI), Comparative Fit Index (CFI), and Incremental Fit Index (IFI) are indicators of model similarity, for which larger values are generally better, with a recommended threshold of >0.8. The Root Mean Square Error of Approximation (RMSEA) is an indicator of model discrepancy, for which smaller values are better, generally requiring a value < 0.1. The reference range for the ratio of chi-square to degrees of freedom (χ2/df) is 1 to 3. In this study, all model fit indices met the requirements, indicating that the model passed the goodness-of-fit test. Although the TLI was slightly below the threshold, the overall model fit was still acceptable for the purposes of this research, which may be attributable to the limited sample size (n = 120). Future research could validate the model with a larger sample.
Additional fit indices: SRMR = 0.058, RMSEA 90% CI [0.042, 0.072]. The model suggests acceptable fit to the data, though some indices (CFI = 0.803, TLI = 0.892) are slightly below conventional thresholds, which may be attributable to the moderate sample size.

3.2.3. Path Analysis and Proposed Mediation Pathways

This study used Structural Equation Modeling (SEM) to evaluate the fit of the dual-path mediation model of “Environmental awareness—Behavioral activities—Restorative benefits—Stress relief.” The path analysis presented below elucidates the hypothesized relationships between variables, lending support to our theoretical model. Given the study’s cross-sectional, observational design, the identified pathways must be interpreted as exploratory and indicative of potential associations, not as definitive proof of causality. The analysis revealed that both environmental awareness and behavioral activities not only have a direct effect on stress relief but also exert an indirect effect through the core mediating variable of restorative benefits. The mediating effect accounted for 68% of the total effect, indicating that restorative benefits plays a dominant role in explaining the mechanism by which the environment and behavior influence stress relief. Furthermore, behavioral activities had a significant independent direct effect on stress relief (β = −0.23, p = 0.003), which further validates the pathway through which low-stress individuals achieve immediate stress reduction through dynamic behaviors (such as free activities), The path analysis results are shown in Table 7.
(1).
Standardized path coefficient
Main Effects Analysis:
The path coefficient from environmental awareness to restorative benefits was the strongest (β = 0.61, p < 0.001), indicating that naturalness factors (e.g., vegetation richness, water feature appreciation) are the core drivers for activating an individual’s restorative process. The effect of behavioral activities on restorative benefits was also significant (β = 0.42, p < 0.001) but weaker than that of environmental awareness, reflecting that behavioral activities must rely on the environmental foundation to fully exert their restorative benefits. Additionally, the direct effect of behavioral activities on stress relief was significant (β = −0.23, p = 0.003), highlighting the independent stress-reducing value of dynamic behaviors (such as exercise).
Mediation Effect Analysis:
The mediating effect of restorative benefits accounted for 68% of the total effect, indicating that environmental awareness and behavioral activities primarily influence stress relief indirectly through the psychological restoration mechanism. A further breakdown revealed that the effect of environmental awareness through the cognitive restoration pathway (β = 0.32) was stronger than through the physiological restoration pathway (β = 0.19). This suggests that psychological mechanisms, such as attention restoration, play a dominant role in environmental interventions. This result aligns with the framework of Attention Restoration Theory (ART), which posits that natural environments promote the rebuilding of psychological resources by reducing cognitive fatigue.
(2).
Analysis of group heterogeneity
To conduct an exploratory analysis, we proceeded to test the model’s invariance across different stress threshold groups. It must be particularly stressed that given the limited sample sizes in the moderate (n = 16) and severe (n = 7) stress groups, the subsequent results of the group comparisons are to be regarded as preliminary and exploratory. These findings warrant confirmation in future research with larger sample sizes. The differences in path effects among groups are shown in Table 8.
For populations with moderate to severe stress, the direct effect of environmental awareness was enhanced (β = −0.22, p = 0.008). This may be related to a simplification in behavioral choices being associated with depleted cognitive resources. Within the small samples of the moderate-to-severe stress groups, the path coefficient for environmental perception was remarkably high (β = 0.85), whereas that for behavioral activity was substantially attenuated (β = 0.29). This exploratory result potentially indicates that for highly stressed individuals, recovery is more dependent on direct environmental stimuli than on elaborate behavioral engagement. Concurrently, the behavioral activities pathway was significantly weakened (β = 0.29 vs. 0.51 for the normal-stress group), indicating that under high cognitive load, dynamic activities may exacerbate psychological burden, prompting these groups to turn to static forms of restoration.

3.2.4. Research Results

(1) Normal to Mild Stress Group: The effect of environmental awareness on restorative benefits was significantly positive (β = 0.65, p < 0.01); the effect of behavioral activities on restorative benefits was significantly positive (β = 0.51, p < 0.01), and its effect on stress relief was significantly negative (β = −0.51, p < 0.01); the effect of restorative benefits on stress relief was significantly negative (β = −0.31, p < 0.01) (Figure 11).
(2) Moderate to Severe Stress Group: The effect of environmental awareness on restorative benefits was significantly positive (β = 0.85, p < 0.01), and its effect on stress relief was significantly negative (β = −0.22, p < 0.05); the effect of behavioral activities on restorative benefits was significantly positive (β = 0.29, p < 0.05); the effect of restorative benefits on stress relief was significantly negative (β = −0.63, p < 0.01) (Figure 12).
In summary, for low-stress populations, the design should be suitable for multi-modal interactive spaces (e.g., fitness trails + social nodes) to promote the synergistic effect between dynamic behaviors and restorative benefits. In contrast, for high-stress populations, the priority should be to ensure low-interference environments (e.g., enclosed understory spaces) to reduce the complexity of behavioral choices; and to configure static restorative facilities (e.g., meditation pavilions) to strengthen the direct stress-relieving effect of environmental awareness.

3.3. Suggestions for Stress Relief Methods for Different Stress Threshold Populations

Based on a comprehensive analysis of subjective scale assessments and detailed analysis of stress relief pathways, the restorative benefits of park green spaces for alleviating different stress states exhibit the following core characteristics:
(1) Consistent Restorative Effect: Activities in urban park green spaces have a significant stress-reducing and restorative effect on participants. Subjects generally experience stress release and psychophysiological recovery after park activities.
(2) Stress-Threshold-Dependent Differential Benefits: Significant differences exist in the restorative benefits among populations with different stress thresholds. The overall restorative score was lowest for the moderate-stress group, while the severe-stress group had the highest score.
(3) Non-linear Shift in Restorative Benefit Patterns: An in-depth analysis of the restorative patterns within each stress-threshold group revealed that: although the normal-to-moderate stress groups had relatively low overall restorative benefits, their benefits across various domains showed a slight upward trend with increasing stress, with limited impact from negative effects. In contrast, while the severe-stress group had the highest overall restorative score, their restorative benefits actually decreased as their stress levels increased.
(4) Differentiated Effects of environmental awareness and Behavioral Activities:
Environmental Awareness Elements: These showed significant and varied correlations with different stress thresholds. Plant color, species, layering, water feature appreciation, topography, and the quantity of fitness equipment were primarily positively correlated with mild/moderate stress. Plant layering showed a strong positive correlation with severe stress (r = 0.365). Plant fragrance, comfort of rest facilities, and pavement comfort were negatively correlated with normal or severe stress. The normal-to-mild stress group tended to achieve restorative benefits in visually complex green spaces, while the moderate-to-severe stress group was better suited to quiet, open, and private spaces.
Behavioral Activities: These showed few significant linear correlations with stress thresholds. Among static behaviors, “relaxing and thinking” was positively correlated with mild stress (r = 0.198). Among dynamic behaviors, “free activities” were negatively correlated with severe stress (r = −0.221). Among transit behaviors, “walking” was positively correlated with moderate stress (r = 0.245), while “running” was negatively correlated with normal stress (r = −0.203). The normal-to-mild stress group achieved restorative benefits through dynamic activities that stimulate the mind and body, whereas the moderate-to-severe stress group was better suited to alleviating stress through static behaviors.
Based on these findings, the following stratified planning and design strategies for urban green spaces are proposed for different stress-threshold populations:
(1) Normal to Mild Stress Population: It is recommended to achieve stress release through multi-sensory cognitive activities (e.g., listening to natural sounds, observing plant colors and layers, tactile experiences) combined with light dynamic behaviors (e.g., walking, using fitness equipment, social interaction). Such activities can synergistically enhance emotional pleasure, cognitive focus, and physiological relaxation, creating a positive feedback loop with environmental elements like water features and plant diversity.
(2) Moderate Stress Population: Given their limited overall restorative benefits, the strategy should focus on low-intensity, non-social static activities (e.g., sitting quietly, meditating). Emphasis should be placed on using visual stimuli from the natural environment, such as topographical variations and plant layering, to promote subjective feelings of physiological regulation. Expectations for the magnitude of improvement in emotional or cognitive domains should be managed appropriately.
(3) Severe Stress Population: Although this group shows the highest overall recovery level and their subjective physiological responses are highly sensitive to the environment, strenuous activities (e.g., free activities, running) should be avoided. Low-arousal behaviors such as deep breathing and meditation in open, plant-layer-rich areas are recommended. This design can maximize their high sensitivity to achieve a rapid perceived reduction in stress. Key Consideration: The duration and intensity of activities must be strictly controlled to avoid the risk of diminished restorative benefits as stress levels potentially increase further. Table 9 provides the corresponding pressure relief methods for populations with different pressure thresholds.

4. Discussion

The findings of this study provide evidence in support of the fundamental tenets of both Stress Recovery Theory (SRT) and Attention Restoration Theory (ART), which posit that natural environments can effectively promote psycho-physiological recovery [28,29]. Regardless of initial stress levels, subjects exhibited increased scores on the restorative benefits Scale. This consistently confirms the universal effectiveness of urban parks as restorative environments.
However, the most significant finding of this study is the revelation of a non-simple linear relationship between restorative benefits and stress thresholds, which distinguishes it from the majority of studies that treat populations as a homogeneous whole. Specifically, for individuals with normal to moderate stress levels, restorative benefits slightly increased with rising stress levels. This aligns with the expectations of SRT, suggesting that individuals possess sufficient psychological resources to respond positively to restorative cues in the environment (e.g., natural elements). In contrast, the high-stress group exhibited a high sensitivity but low benefit” pattern, where despite a strong potential for recovery, their subjective restorative benefits, particularly in the emotional, cognitive, and behavioral dimensions, significantly decreased as stress levels increased. We propose two possible explanations for this paradoxical phenomenon observed in the high-stress group:
(1) Cognitive Resource Depletion and Failure of Attention Capture: According to ART, the prerequisite for restoration is the individual’s ability to be captivated by the soft fascination” of the environment, thereby entering a state of involuntary attention.” However, individuals under extreme stress may have their cognitive resources consumed by persistent negative thoughts, making it difficult to shift their attention to the external natural environment. Consequently, they may not subjectively experience adequate emotional and cognitive relaxation.
(2) Stress Threshold Saturation and Emotional Blunting: According to SRT, the emotional response systems of individuals under chronic high stress may be in a state of burnout,” leading to a higher response threshold to restorative stimuli and thus diminished subjective restorative benefits. This suggests that high-stress populations may require more potent or targeted environmental intervention strategies. We acknowledge that the use of the same DASS-21 scale for both group classification and outcome measurement may introduce same-method bias. However, the convergence of findings across multiple measurement scales and the theoretical consistency of our results with established frameworks (SRT and ART) strengthen the validity of our conclusions.

5. Conclusions

Furthermore, this study has several limitations that suggest promising directions for future research.
(1) Limited Representativeness in Region and Park Type: The model was developed based on four urban parks in Yibin City, which may constrain its generalizability to other regions with different land use patterns and cultural contexts. Future studies should validate and refine the model across diverse geographical settings, park typologies, and climatic conditions.
(2) Inference of Causality and Mechanisms: The single-group pre-post design, while useful for detecting associations, cannot fully rule out the influence of confounding variables (e.g., the mere passage of time, expectation effects). Therefore, the identified pathways and mechanisms should be considered plausible and indicative rather than conclusively causal. Future studies with control groups and randomized controlled trials are needed to establish causality.
(3) Behavioral Data Quantification: While the non-interventional approach captured authentic behaviors, it limited the depth of quantitative behavioral data. Future research could employ controlled behavioral interventions to precisely delineate the mechanisms linking specific activities to restorative benefits. Additionally, the small sample size in the high-stress group (n = 7) necessitates caution in interpreting those findings, and future work should prioritize recruiting larger, more balanced samples. Due to the small sample size in the moderate and severe stress groups (n = 23), the path coefficients (e.g., environmental awareness → restorative benefits β = 0.85) should be considered exploratory findings and require further validation in future large-sample studies.
(4) Mental Health Dimensions: This study focused primarily on stress, offering a unidimensional perspective on mental health. Subsequent investigations would benefit from incorporating multidimensional indicators—such as anxiety, depression, and subjective well-being—to construct a more comprehensive model of restorative benefits. Another limitation is the reliance on self-reported measures without objective physiological data (e.g., heart rate variability, cortisol levels). Future studies should incorporate biomarkers to more robustly validate the claimed physiological regulation pathways, especially for high-stress groups.
(5) Spatial Scale of Analysis: Using the entire park as the unit of analysis may have overlooked micro-scale environmental effects. Future work should examine specific landscape settings (e.g., quiet corners, activity plazas) through fixed-point observation and spatial analysis to identify the precise design features that drive restorative benefits.
In conclusion, this study affirms the universal restorative value of urban parks while critically advancing the discourse on sustainable urban development. Its key innovation lies in identifying the individual stress threshold as a pivotal moderator, revealing a non-linear relationship between stress levels and restorative benefits. This finding challenges homogenized approaches to green space design and underscores the necessity for precision planning tailored to population-specific mental health needs.
Our findings compellingly advocate for precision design” in urban parks—creating differentiated landscapes that cater to diverse psychological profiles. This approach is not merely an aesthetic preference but a strategic imperative for optimizing land use efficiency and fostering inclusive, healthy, and sustainable cities. The empirical evidence and quantitative benchmarks provided here equip urban planners, landscape architects, and policymakers with actionable tools to enhance the restorative efficacy of green spaces, thereby maximizing the public health return on urban land investment.
By framing green space as a vital health-promoting land use, this research contributes directly to Sustainable Development Goal 3 (Good Health and Well-being) and Goal 11 (Sustainable Cities and Communities). It suggests how strategic landscape design and land use planning can function as powerful levers for enhancing urban livability and mental well-being at the population level.

Author Contributions

Conceptualization, Z.X.; methodology, Y.L.; software, Y.L. and Z.X.; validation, Y.L.; formal analysis, Y.L. and Z.X.; investigation, Y.L.; resources, Y.L.; data curation, Z.X.; writing—original draft preparation, Z.X.; writing—review and editing, Y.L.; visualization, J.Y.; supervision, Y.L.; project administration, J.Y. All authors have read and agreed to the published version of the manuscript.

Funding

This research received no external funding.

Institutional Review Board Statement

This study does not involve any personal identifiers, human experimental data, or any sensitive or commercial information. Prior to the experiments, informed consent was obtained from all participants, and their data were anonymized. Therefore, in accordance with the guidelines of the Institute of Science and Technology Development, Sichuan University, for this category of research, this study is exempt from ethical review and approval.

Informed Consent Statement

Informed consent was obtained from all subjects involved in the study.

Data Availability Statement

Data is contained within the article. The original contributions presented in this study are included in the article. Further inquiries can be directed to the corresponding author(s).

Conflicts of Interest

The authors declare no conflicts of interest.

Appendix A

The specific items of the scales involved in Section 2.1.1, Subjective Scale Measurement, are presented in Appendix A.
Table A1. Specific items on stress conditions (DASS-21 Emotional Self-Assessment Scale stress items).
ItemsDescriptive LanguageDegree of Evaluation
Difficult to be quietI find it hard to maintain inner peace.Four-level scale
OverreactingI often react excessively to things.
Energy consumptionI feel drained of energy and completely exhausted.
anxious and unsettledI feel anxious and unsettled.
Difficult to relaxI notice that it is hard for me to relax.
Cannot tolerate work obstructionI find anything that hinders me from continuing my work intolerable.
Easy to be angeredI realize that I can be easily angered.
Table A2. Self-Rating Recovery Scale (SRRS) Specific Items.
DimensionItemsDegree of Evaluation
In this environment, how would you describe your emotional changes?Dissatisfied ———— good-temperedNine-level scale
Anxious ———— Relaxed
In this environment, how would you describe your physiological changes? (reverse scoring)My breathing is speeding up (very ———— not)
My palms are sweating (very ———— not)
In this environment, how would you describe your cognitive changes?I am very interested in this environment (not ———— very).
My attention was drawn to the environment (not ———— very).
In this environment, how would you describe the changes in your behavior?I want to come here more often (not ———— very)
I want to stay here a little longer (not ———— very)
Table A3. Environmental awareness Specific Items.
ItemsDescriptive LanguageDegree of Evaluation
Plant colorThe colors of the plants in the park are rich.Seven-level scale
Plant speciesThe park has a variety of plant species.
Plant aromaThe plants in the park smell fragrant and pleasant.
Plant hierarchyThe plants in the park are planted in a staggered and orderly manner, making it beautiful.
Water landscape appreciationThe water scenery in the park is beautiful and attractive.
Terrain morphologyThe terrain in the park has variations, requiring going up and down slopes or using stairs.
Architectural aestheticsThe buildings in the park are aesthetically pleasing.
Number of buildingsThe number of buildings in the park is sufficient.
Number of fitness and recreational facilitiesThe number of fitness and entertainment facilities in the park is sufficient.
Types of fitness and entertainment facilitiesThe park has a wide variety of fitness and entertainment facilities.
Number of rest facilitiesThe number of rest facilities in the park is sufficient.
Comfort of rest facilitiesThe relaxation facilities in the park are comfortable to use.
The landscape orientation of the rest facilitiesThe recreational facilities in the park have good aesthetics and views.
Road GuidanceThe pathways in the park are clearly marked and defined.
Event venue areaThe activity area in the park meets the needs for activities.
Pavement comfortThe tiles and roads laid in the park are comfortable to walk on.
Table A4. Specific items of behavioral activities.
Activity TypeSpecific Activities and BehaviorsDegree of Evaluation
Static behaviorRelax your mind: activities such as meditation, sitting quietly, reading books, breathing exercises, picnicking, and camping.Seven-level scale
Contact with nature: activities such as enjoying the scenery, observing plants, observing animals, listening to the sounds of birds, and the sound of flowing water.
Social interactions: such as chatting with people, gathering with friends to play chess, cards, tea tasting, and other activities.
Dynamic behaviorFacility activities: Activities conducted using various recreational or fitness facilities in the park.
Venue activities: such as using the park’s space for fitness activities like jumping rope, dancing, and practicing Tai Chi.
Leisure activities: such as playing, taking photos, looking after children, and other activities.
Traffic behaviorWalking
Running
Riding

References

  1. Qiu, L.; Chen, H.; Gao, T. A Review of Research on Urban Green Space Planning and Management Integrating Biodiversity and Landscape Cognitive Assessment. Chin. Landsc. Archit. 2016, 32, 92–97. [Google Scholar]
  2. Nielsen, T.S.; Hansen, K.B. Do green areas affect health? Results from a Danish survey on the use of green areas and health indicators. Health Place 2007, 13, 839–850. [Google Scholar] [CrossRef] [PubMed]
  3. Kaplan, R.; Kaplan, S. The Experience of Nature: A Psychological Perspective; Cambridge University Press: New York, NY, USA, 1989. [Google Scholar]
  4. Zhao, H.; Wu, J.P. Theoretical and Assessment Research on Restorative Environments. Chin. J. Health Psychol. 2010, 18, 117–121. [Google Scholar]
  5. The WHO Regional Office for Europe. Urban Green Space Interventions and Health: A Review of Impacts and Effectiveness; World Health Organization: Bonn, Germany, 2017. [Google Scholar]
  6. Hodson, C.B.; Sander, H.A. Green urban landscapes and school-level academic performance. Landsc. Urban Plan. 2017, 160, 16–27. [Google Scholar] [CrossRef]
  7. Holt, E.W.; Lombard, Q.K.; Best, N.; Smiley-Smith, S.; Quinn, J.E. Active and passive use of green space, health, and wellbeing amongst university students. Int. J. Environ. Res. Public Health 2019, 16, 424. [Google Scholar] [CrossRef]
  8. Kaplan, S. The restorative benefits of nature: Toward an integrative framework. J. Environ. Psychol. 1995, 15, 169–182. [Google Scholar] [CrossRef]
  9. Kelz, C.; Evans, G.W.; Röderer, K. The restorative effects of redesigning the schoolyard: A multimethodological, quasi-experimental study in rural Austrian middle schools. Environ. Behav. 2013, 47, 119–139. [Google Scholar] [CrossRef]
  10. Yang, T.; Barnett, R.; Fan, Y.; Li, L. The effect of urban green space on uncertainty stress and life stress: A nationwide study of university students in China. Health Place 2019, 59, 102199. [Google Scholar] [CrossRef]
  11. Liu, C.; Li, S.H.; Chen, S.Y. Study on the Moderating Effect of University Campus Green Space Visits on Emotions Under Multiple Influencing Factors: A Case Study of Three Universities in Beijing. Landsc. Archit. 2018, 25, 46–52. [Google Scholar]
  12. Scopelliti, M.; Giuliani, M.V. Choosing restorative environments across the lifespan: A matter of place experience. J. Environ. Psychol. 2004, 24, 423–437. [Google Scholar] [CrossRef]
  13. Wang, Q.; Zhang, Y.L.; Zhao, R.L. Study on the Effects of Four Types of Campus Green Landscapes on College Students’ Physiological and Psychological Indicators. Chin. Landsc. Archit. 2020, 36, 92–97. [Google Scholar]
  14. Zhang, T.; Wang, L.; Zhang, Y.; Hu, Y.; Zhang, W. Assessing the nonlinear impact of green space exposure on psychological stress perception using machine learning and street view images. Front. Public Health 2024, 12, 1402536. [Google Scholar] [CrossRef]
  15. Beute, F.; Marselle, M.R. How do different types and characteristics of green space impact mental health? A scoping review. People Nat. 2023, 5, 1839–1876. [Google Scholar] [CrossRef]
  16. Li, H.; Chen, R.N.; Wu, J.Y.; Ta, N. How green space quantity and quality across different geographic contexts impact mental health. Cities 2025, 168, 106439. [Google Scholar] [CrossRef]
  17. Yoo, E.H.; Roberts, J.E.; Eum, Y.; Li, X.J.; Konty, K. Exposure to urban green space may both promote and harm mental health in socially vulnerable neighborhoods: A neighborhood-scale analysis in New York City. Environ. Res. 2022, 204, 112292. [Google Scholar] [CrossRef]
  18. Galera, C.; Navarro, M.C.; Galesne, C.; Retuerto, N.; Bentivegna, F.; Flouri, E. Neighborhood green space and psychological distress: A longitudinal study of socioeconomic disparities in mental health outcomes. Environ. Int. 2025, 204, 109799. [Google Scholar] [CrossRef]
  19. Rieves, E.S.; Freis, S.M.; Friedman, N.P.; Reid, C.E. Is greenspace in the eye of the beholder? Exploring perceived and objective greenspace exposure effects on mental health. J. Environ. Psychol. 2024, 100, 102468. [Google Scholar] [CrossRef]
  20. Xia, T.Y.; Zhao, B.; Yu, J.P.; Gao, Y.J.; Wang, X.Y.; Mao, Y.H.; Zhang, J.G. Making residential green space exposure evaluation more accurate: A composite assessment framework that integrates objective and subjective indicators. Urban For. Urban Green. 2024, 95, 128290. [Google Scholar] [CrossRef]
  21. Akpinar, A. How is high school greenness related to students’ restoration and health? Urban For. Urban Green. 2016, 16, 1–8. [Google Scholar] [CrossRef]
  22. Yuan, X.; Zuo, J.; Huisingh, D. Green universities in China-what matters? J. Clean. Prod. 2013, 61, 36–45. [Google Scholar] [CrossRef]
  23. Astell-Burtt Feng, X.Q.; Kolt, G.S. Large-scale investment in green space as an intervention for physical activity, mental and cardiometabolic health: Study protocol for a quasi-experimental evaluation of a natural experiment. BMJ Open 2015, 6, e009803. [Google Scholar] [CrossRef]
  24. CJJ/T85-2017; Urban Green Space Classification Standards. Ministry of Housing and Urban-Rural Development of the People’s Republic of China: Beijing, China, 2018.
  25. Liu, L.H.; Qu, H.Y.; Ma, Y.M.; Wang, K.; Qu, H.X. Restorative benefits of urban green space: Physiological, psychological restoration and eye movement analysis. J. Environ. Manag. 2022, 301, 113930. [Google Scholar] [CrossRef]
  26. Zheng, L.W.; Kwan, M.P.; Liu, Y. Greenspace morphology and mental well-being: A mobility-based study on urban stress and emotion. Ecol. Indic. 2025, 178, 114090. [Google Scholar] [CrossRef]
  27. Tyrväinen, L.; Ojala, A.; Korpela, K.; Lanki, T.; Tsunetsugu, Y.; Kagawa, T. The influence of urban green environments on stress relief measures: A field experiment. J. Environ. Psychol. 2014, 38, 1–9. [Google Scholar] [CrossRef]
  28. Ulrich, R.S.; Simons, R.F.; Losito, B.D.; Fiorito, E.; Miles, M.A.; Zelson, M. Stress recovery during exposure to natural and urban environments. J. Environ. Psychol. 1991, 11, 201–230. [Google Scholar] [CrossRef]
  29. Kaplan, S.; Talbot, J.F. Psychological benefits of a wilderness experience. In Behavior and the Natural Environment; Altman, I., Wohlwill, J.F., Eds.; Springer: Boston, MA, USA, 1983; pp. 163–203. [Google Scholar]
  30. Hartig, T.; Evans, G.W.; Jamner, L.D.; Davis, D.S.; Gärling, T. Tracking restoration in natural and urban field settings. J. Environ. Psychol. 2003, 23, 109–123. [Google Scholar] [CrossRef]
  31. Liu, C.; Li, S.H. A Review of Restorative Natural Environment Research from a Multidisciplinary Perspective. Chin. Landsc. Archit. 2020, 36, 55–59. [Google Scholar] [CrossRef]
  32. Yao, Y.N.; Huang, Q.Y.; Li, S.H. Research on the Relationship Between Green Spaces in the Work Environment and Physical and Mental Health: A Case Study of the IT Industry Workforce in Beijing. Chin. Landsc. Archit. 2018, 34, 15–21. [Google Scholar]
  33. Han, T.; Ma, W.D.; Gong, H. Analysis of Negative Emotions and Influencing Factors among College Students during Home Quarantine for COVID-19. J. Xi’an Jiaotong Univ. (Med. Ed.) 2021, 42, 132–136. [Google Scholar]
  34. Han, K.T. A reliable and valid self-rating measure of the restorative quality of natural environments. Landsc. Urban Plan. 2003, 64, 209–232. [Google Scholar] [CrossRef]
  35. You, D.; Liu, Y.Q.; Ai, J.B.; Huang, Q.T.; Lan, S.R. Relationship between Campus Green Space Usage Characteristics and Perceived Environmental Restorative Quality. J. Shanghai Jiao Tong Univ. (Agric. Sci. Ed.) 2018, 36, 66–73. [Google Scholar]
  36. Lin, N.; Xie, Y.S.; Zhuo, Z.X. Measurement and Application of the Self-Reported Recovery Scale in Urban Park Environments. J. Southwest For. Univ. (Soc. Sci.) 2018, 2, 66–71. [Google Scholar]
  37. Ding, S.G. Introduction to Landscape Architecture; China Architecture & Building Press: Beijing, China, 2008; Volume 12, pp. 84–122. [Google Scholar]
  38. Zhang, Y.Y. Research on Healing Environment Design of Community Parks; Qingdao University of Technology: Qingdao, China, 2018. [Google Scholar]
  39. Huang, S. A Study on the Construction of Healthy Urban Park Landscapes Based on NVivo Qualitative Analysis. Master’s Thesis, Fujian Agriculture and Forestry University, Fuzhou, China, 2022. [Google Scholar] [CrossRef]
  40. Tan, S.H.; Peng, H.Y. A Study on the Influencing Factors of Miniature Parks in Alleviating Mental Stress of Crowds. Chin. Landsc. Archit. 2016, 32, 65–70. [Google Scholar]
  41. Peng, H.Y. Mechanism of Restorative Environmental Impact and Spatial Optimization of Community Parks. Ph.D. Thesis, Chongqing University, Chongqing, China, 2017. [Google Scholar]
  42. Zhang, S.F.; Cheng, L.L.; Liu, B.X. Study on the Elderly-Friendly Health Benefits of Community Parks and Their Planning and Design Influencing Factors: A Case Study of Hangzhou. Archit. Cult. 2020, 46–49. [Google Scholar]
  43. Malik, M.; Bigger, J.T.; Camm, A.J.; Kleiger, R.E.; Malliani, A.; Moss, A.J.; Schwartz, P.J. Heart rate variability: Standards of measurement, physiological interpretation, and clinical use. Eur. Heart J. 1996, 17, 354–381. [Google Scholar] [CrossRef]
  44. Liu, J.; Guo, X.; Hong, X.C. A Study on Individual Factors Influencing Perceptions of the Restorative Benefits of Urban Park Soundscapes. Chin. Landsc. Archit. 2022, 38, 40–45. [Google Scholar] [CrossRef]
Figure 1. Schematic Diagram of the Distribution of Major Parks and Green Spaces in Sanjiang New Area (Figure source: Drawn by the author).
Land 14 02293 g001
Figure 2. Schematic diagram of the experimental process (Figure source: drawn by the author).
Land 14 02293 g002
Figure 3. Stress threshold statistics of subjects (Figure source: drawn by the author).
Land 14 02293 g003
Figure 4. Average total score of the self-assessment recovery scale for the stress threshold population (Figure source: drawn by the author).
Land 14 02293 g004
Figure 5. Correlation analysis between stress threshold and total score of self-assessment recovery scale (Figure source: drawn by the author). (a) Correlation analysis of SRRS scores in the normal stress threshold population. (b) Correlation analysis of SRRS scores in the mild stress threshold population. (c) Correlation analysis of SRRS scores in the moderate stress threshold population. (d) Correlation analysis of SRRS scores in the severe stress threshold population.
Land 14 02293 g005aLand 14 02293 g005b
Figure 6. Normal stress threshold population 4-dimensional evenly distributed trend (Figure source: drawn by the author). (a) Trend of emotional dimension distribution. (b) Trend of ptysiological dimension distribution. (c) Trend of cognitive dimension distribution. (d) Trend of behavioral dimension distribution.
Land 14 02293 g006aLand 14 02293 g006b
Figure 10. Environmental awareness—Behavioral activities—Restorative benefits—Stress Relief” Path analysis (Figure source: drawn by the author). Note: ** At the 0.01 level, the correlation is significant, * At the 0.05 level, the correlation is significant.
Land 14 02293 g010
Figure 11. Stress relief pathways for individuals with normal to mild stress (Figure source: drawn by the author). Note: ** At the 0.01 level, the correlation is significant, * At the 0.05 level, the correlation is significant.
Land 14 02293 g011
Figure 12. Stress relief pathways for individuals with moderate to severe stress (Figure source: drawn by the author). Note: ** At the 0.01 level, the correlation is significant, * At the 0.05 level, the correlation is significant.
Land 14 02293 g012
Table 1. Details and Characteristics of the Four Urban Parks in Yibin City (Table source: Made by the author).
Name of ParkAreaTypeCharacteristicsAerial Photograph
Xima Pond ParkApproximately 5.4 hectaresCommunity ParkWell-equipped with service facilities and attracting a large number of users, featuring comprehensive fitness amenities, profound historical and cultural heritage, and children’s playgrounds designed to facilitate popular science education and edutainment during family outings, with diverse activity nodes.Land 14 02293 i001
Baisha River ParkApproximately 6.6 hectaresComprehensive ParkAs a waterfront linear park, it features convenient transportation access, well-equipped service facilities, open water surfaces and lawns in the plaza section, comprehensive fitness amenities, permeable concrete main walkways along the riverside section, diverse activity nodes, and beautiful scenery.Land 14 02293 i002
Longtoushan Forest ParkApproximately 100 hectaresThematic ParkLongtoushan Forest Park is based on Longtoushan Mountain, with the “Eye of Three Rivers” project located at its summit. Covering an area of approximately 100 mu, it serves as an urban reception hall integrating leisure and sightseeing, popular science education, ecological study tours, and parent–child interaction.Land 14 02293 i003
Bamboo Culture ParkApproximately 108 hectaresThematic ParkLocated at the foot of Longtoushan Mountain, the park is a comprehensive park themed around bamboo, featuring a favorable landscape of mountains and water, complete functional facilities, a commercial street along Changcui Road, and adjacency to the Yibin Museum.Land 14 02293 i004
Table 2. DASS-21 Stress Component Scale Criteria.
Stress Score0~1415~1819~2526~3334+
Threshold gradingNormal stressMild stressModerate stressSevere stressExtremely severe stress
Table 3. The test results of the correlation between stress threshold and environmental awareness.
Environmental AwarenessNormal StressMild StressModerate StressSevere Stress
Plant colorRelevance−0.0470.249 **0.0890.114
Significance0.6080.0060.3360.214
Plant speciesRelevance−0.1570.285 **0.185 *0.112
Significance0.0860.0020.0440.225
Plant aromaRelevance−0.200 *−0.008−0.064−0.106
Significance0.0290.9340.4900.247
Plant hierarchyRelevance−0.1230.233 *0.352 **0.365 **
Significance0.1790.010<0.001<0.001
Water landscape appreciationRelevance−0.1480.303 **0.243 **0.078
Significance0.107<0.0010.0080.398
Terrain morphologyRelevance−0.1000.1210.0920.192 *
Significance0.2750.1900.3170.036
Architectural aestheticsRelevance−0.144−0.0110.0050.018
Significance0.1170.9070.9530.843
Number of buildingsRelevance−0.1640.0210.059−0.034
Significance0.0730.8180.5220.715
Number of fitness and recreational facilitiesRelevance−0.0430.186 *0.1300.033
Significance0.6410.0420.1580.716
Types of fitness and entertainment facilitiesRelevance−0.1110.1390.018−0.054
Significance0.2290.1310.8490.562
Number of rest facilitiesRelevance−0.1700.1510.037−0.119
Significance0.0640.0990.6840.197
Comfort of rest facilitiesRelevance−0.211 *−0.019−0.130−0.205 *
Significance0.0210.8360.1580.025
The landscape orientation of the rest facilities.Relevance−0.0990.021−0.0470.044
Significance0.2840.8200.6080.630
Road GuidanceRelevance−0.1120.0700.1660.160
Significance0.2230.4470.0700.081
Event venue areaRelevance−0.0800.0550.009−0.157
Significance0.3860.5530.9180.087
Paving comfortRelevance−0.192 *0.254 **0.239 **−0.072
Significance0.0360.0050.0090.434
Note: ** At the 0.01 level, the correlation is significant, * At the 0.05 level, the correlation is significant.
Table 4. Test results of the correlation between stress threshold and behavioral activity.
Behavioral ActivitiesNormal StressMild StressModerate StressSevere Stress
Static behaviorRelax your thoughtsRelevance−0.0340.198 *0.0900.084
Significance0.7110.0300.3280.364
Connect with natureRelevance−0.1370.1310.072−0.039
Significance0.1370.1530.4340.674
Social interactionRelevance−0.1070.1020.038−0.040
Significance0.2460.2680.6790.667
Dynamic behaviorFacility activitiesRelevance0.138−0.065−0.0140.068
Significance0.1330.4830.8760.459
Venue activitiesRelevance0.036−0.0320.042−0.024
Significance0.6940.7320.6520.795
free activityRelevance−0.058−0.035−0.116−0.221 *
Significance0.5300.7030.2080.015
Traffic behaviorWalkingRelevance−0.0630.0730.245 **0.103
Significance0.4920.4260.0070.265
RunningRelevance−0.203 *−0.0520.081−0.119
Significance0.0260.5730.3800.195
RidingRelevance−0.0380.0850.082−0.124
Significance0.6780.3570.3750.176
Note: ** At the 0.01 level, the correlation is significant, * At the 0.05 level, the correlation is significant.
Table 5. Definition of latent variables and their observed indicators.
Latent VariableManifest VariablesData Source
Environmental awarenessVegetation richness, plant strata, water body appreciation, terrain variabilityEnvironmental Awareness Questionnaire
Behavioral activitiesStatic activities (relaxing/social), dynamic activities (fitness/free activities)Behavior Activity Scale
Restorative benefitsEmotional recovery, physical recovery, cognitive recovery, behavioral recoverySRRS Scale
Stress reliefDASS-21 Emotional Self-Assessment Scale stress itemsPost-experiment test data
Table 6. Overview table of model fit tests.
Adaptation IndicatorsX2/dfRMSEAGFICFIIFITLI
Test value2.180.0570.8460.8030.9010.892
Adaptation evaluationAcceptableAcceptable RangeAcceptable RangeAcceptableAcceptableApproaching Threshold
Table 7. Path Analysis.
PathβpDirection of Effect
Environmental awareness → Restorative benefits0.61<0.001Significant positive correlation
Behavioral activities → Restorative benefits0.42<0.001Significant positive correlation
Restorative benefits → Stress relief−0.57<0.001Significantly negative correlation
Environmental awareness → Stress relief−0.160.021Significantly negative correlation
Behavioral activities → Stress relief−0.230.003Significantly negative correlation
Table 8. Differences in path effects among groups with different stress thresholds.
Stress GroupsEnvironmental Awareness Effect (β)Behavioral Activities Effect (β)Proportion of Intermediaries
Normal to mild stress0.65 ** (p < 0.01)0.51 ** (p < 0.01)72%
Moderate to severe stress0.85 ** (p < 0.01)0.29 * (p < 0.05)58%
Note: ** At the 0.01 level, the correlation is significant, * At the 0.05 level, the correlation is significant.
Table 9. Stress relief methods for populations with different stress thresholds.
Stress ThresholdEnvironmental Restoration Benefits PerformanceWays to Relieve Stress and Obtain BenefitsSuggestions for Park Area/Facility PlanningSupporting Statistical Evidence
Normal to mildSignificantMulti-sensory cognitive activities (e.g., listening to birdsong, observing plant colors, touching leaves) and light dynamic behaviors (e.g., walking, using fitness equipment, social interaction) help release stress. These activities simultaneously enhance emotional pleasure, cognitive focus, and physiological relaxation, creating a positive feedback loop with environmental elements such as water features and plant diversity.Interactive communication areas, walking paths, and fitness equipment zones should be provided, and natural landscapes should be designed to enhance sensory experiences—for example, by adding interactive water features and aromatic plant trails.Behavioral activity → restoration β = 0.51 *; behavioral activity → stress relief β = −0.23; plant color/diversity is positively correlated with mild stress.
ModerateWeakenGiven the limited overall restorative benefits, the priority should be low-intensity, non-social, static activities (e.g., sitting quietly or meditating). The focus should be on regulating heart rate and blood pressure through natural visual stimuli like topography and plant layering. However, expectations for major emotional or cognitive improvements should be tempered.Set up quiet seating areas and light activity zones to ensure there is sufficient quiet space and avoid excessive noise.environmental awareness → restoration β = 0.85; environmental awareness → stress relief β = −0.22; plant stratification is strongly positively correlated with severe stress (r = 0.365 *).
SevereRelatively significantThis group achieves the highest overall restoration but is highly sensitive physiologically to environmental stimuli. Strenuous activities (e.g., running) should be avoided. Instead, low-arousal behaviors like deep breathing and meditation in richly planted open areas are recommended to leverage their sensitivity for rapid de-stressing. However, as further stress may reduce restorative benefits, both the duration and intensity of activities must be carefully controlled.Provide a dedicated quiet meditation area, designed as a private and quiet space to minimize distractions.Free activity is negatively correlated with severe stress (r = −0.221 *); a trend of restorative benefits decreasing as stress levels increase.
Note: ** At the 0.01 level, the correlation is significant, * At the 0.05 level, the correlation is significant.
Disclaimer/Publisher’s Note: The statements, opinions and data contained in all publications are solely those of the individual author(s) and contributor(s) and not of MDPI and/or the editor(s). MDPI and/or the editor(s) disclaim responsibility for any injury to people or property resulting from any ideas, methods, instructions or products referred to in the content.