Article

The Impact of Whole Region Comprehensive Land Consolidation on Ecological Vulnerability: Evidence from Township Panel Data in Zhejiang Province

1
School of Economics and Management, Zhejiang A&F University, Hangzhou 311300, China
2
School of Economics, Zhongnan University of Economics and Law, Wuhan 430073, China
3
School of Management, Sichuan Agricultural University, Chengdu 610031, China
*
Authors to whom correspondence should be addressed.
These authors contributed equally to this work.
Land 2025, 14(11), 2291; https://doi.org/10.3390/land14112291
Submission received: 26 October 2025 / Revised: 12 November 2025 / Accepted: 18 November 2025 / Published: 20 November 2025
(This article belongs to the Section Land Socio-Economic and Political Issues)

Abstract

A systematic assessment of the impact and mechanisms of Land Consolidation policy on ecological environment can provide valuable insights for optimizing territorial spatial development and restoring ecological functions, both in China and globally. Utilizing 2015–2022 township-level panel data from Zhejiang Province, this study employs satellite remote sensing to construct an Ecological Vulnerability (EV) index. We empirically examine the impact of Whole Region Comprehensive Land Consolidation (WRCLC) on EV and its transmission channels by applying a multi-period Difference-in-Differences (DID) model and a mediating effect model. The results indicate that the implementation of WRCLC pilot policies significantly reduces EV, a finding that remains robust after parallel trend tests, placebo tests, and other robustness checks. The mediating effects within the “Element-Pattern-Effect” framework indicate that the transition of land elements toward ecological functions and the absence of significant land use conflicts at the pattern level are key mechanisms driving these outcomes. Furthermore, the study reveals that WRCLC exerts a significant negative spatial spillover effect on adjacent areas. It is therefore recommended to promote this policy, providing valuable insights for land consolidation initiatives in other Chinese provinces and developing countries worldwide.

1. Introduction

EV refers to the propensity of an ecosystem and its components to suffer damage and loss in the face of external disturbances within a specific temporal and spatial scale [1]. Reducing regional Ecological Vulnerability (EV) is both a critical pathway for achieving harmonious coexistence between humans and nature, and an essential prerequisite for securing ecological safety barriers and enhancing regional developmental resilience. Land serves as the spatial substrate for the ecological environment. Changes in the spatial pattern of land use directly influence the structural and functional integrity of ecosystems, thereby directly acting upon EV [2]. However, since the Industrial Revolution, intensive and extensive global land expansion has severely constrained the self-organizing capacity of ecosystems [3]. Statistics indicate that approximately 32% of the global forest area has been lost [4]. Furthermore, from 2015 to 2019, the world lost at least 100 million hectares of healthy and productive land annually. By 2030, restoring 1.5 billion hectares of degraded land globally will be necessary to meet the Land Degradation Neutrality (LDN) target under the Sustainable Development Goals [5]. As the world’s largest developing country, China has experienced nearly a threefold expansion of urban areas since its industrialization and urbanization accelerated, which has likewise severely degraded its ecological environment [6]. As of 2017, areas highly sensitive to ecological environmental changes accounted for 3.9 million square kilometers, representing 40.6% of the national territory, while ecologically fragile zones constituted over 60% of China’s land area [7]. This situation underscores the urgency of reconciling land use efficiency with ecological sustainability.
Against this backdrop, in response to the pervasive issues of “fragmented cropland protection, disordered spatial layout, and inefficient resource utilization” in traditional land consolidation. Zhejiang Province in China took a pioneering step by launching the Whole Region Comprehensive Land Consolidation (WRCLC) pilot policy in 2018. This initiative aims to alleviate land use conflicts and restore ecosystem integrity (The specific measures of this policy are outlined in Table 1). Implemented primarily at the township level, the policy seeks to systematically reconfigure resilient territorial spaces characterized by “contiguous farmland, intensive and efficient construction land, and interconnected ecological corridors.” By 2023, the program had achieved significant outcomes: the reclamation of 53,000 mu (approximately 666.7 square meters) of rural construction land, the addition of 87,000 mu of new cropland, the creation of 330,000 mu of high-standard farmland, the implementation of ecological restoration projects covering 140,000 mu, and the comprehensive remediation of 71 abandoned mines [8]. This pilot policy has now been extended from Zhejiang to nationwide trials. Therefore, a systematic assessment of the impact of the WRCLC pilot policy on EV can provide valuable insights for coordinating land use and ecological conservation, both for China and globally.
This study aims to leverage a multi-period Difference-in-Differences (DID) model and township-level panel data from Zhejiang Province (2015–2022) to empirically verify the causal relationship between the WRCLC policy and EV. To ensure a comprehensive assessment, ecological vulnerability at the township level is measured using the “Sensitivity-Resilience-Pressure” (SPR) model, which incorporates 11 distinct indicators. Building upon the baseline regression, the study further conducts parallel trend tests, robustness checks, and an extended analysis of spillover effects to ensure the credibility and rigor of the findings. By offering policy insights for Chinese policymakers on how land consolidation models can promote ecological protection, this research also provides practical lessons for other economically developed regions worldwide seeking to balance economic development with environmental conservation.

2. Literature Review and Theoretical Analysis

2.1. Literature Review

Land consolidation initiatives were introduced earlier in Europe, with early research primarily focusing on consolidation models, resource integration, and functional aspects [9,10,11]. As research progressed, scholarly attention gradually shifted toward comprehensive land management measures, including infrastructure development, natural landscape preservation, and environmental protection [12,13]. Concurrently, corresponding legal frameworks and operational procedures have been continuously refined [14], significantly facilitating the effective implementation of land consolidation. These developments provide valuable Western experience for China’s land consolidation practices. In 2008, land consolidation was formally elevated to the level of national strategy in China, marking the beginning of its large-scale implementation.
Current research, both domestic and international, on land use and ecological vulnerability has primarily concentrated on three key aspects: First, concerning the conceptual definition and measurement of EV. Numerous scholars have established the concept of EV, defining it as the propensity of ecosystems and their components to suffer damage and loss when exposed to external disturbances. As research has deepened, frameworks for assessing EV have been developed, including the Pressure-State-Response (PSR) model [15,16], the Vulnerability-Scoring-Diagnosis (VSD) model [17,18], and the Sensitivity-Resilience-Pressure (SRP) model [19,20]. Measurement methodologies have also evolved from linear models like the Analytic Hierarchy Process (AHP) and Principal Component Analysis (PCA) to comprehensive evaluation models incorporating the entropy method and machine learning techniques [21,22,23]. Furthermore, with advancements in satellite remote sensing technology, research indicators have begun to integrate interdisciplinary metrics such as landscape pattern indices and ecosystem service values [24]. The scale of analysis has progressively extended from provincial levels to prefectural cities, counties, and river basins [25,26]. However, most existing studies rely on cross-sectional data for measurement and have not yet refined the scale of analysis to the township level. This limitation hinders the ability to uncover the dynamic mechanisms through which small-scale spatial heterogeneity shapes EV and falls short of meeting the need for granular assessment of grassroots land use policies like WRCLC. Second, regarding the relationship between land use and EV. Most studies indicate that extensive land development patterns—such as disordered urban expansion, the conversion of cropland to non-grain uses, and inefficient sprawl of industrial land—degrade the ecological environment by fragmenting ecological corridors, intensifying habitat fragmentation, and undermining carbon sequestration functions [27,28,29,30]. Additionally, research suggests that the spatial fragmentation of land use structure is a significant factor contributing to increased EV [31]. Third, concerning the coupling and coordination between land use and the ecological environment. In response to the incompatibility between land use and the ecological environment, some scholars, drawing on landscape ecology and the theory of regional human-earth systems, have qualitatively discussed compatible models for land use and ecological sustainability [32]. Within landscape ecology, scholars have systematically explored sustainable land use frameworks, positing that the adjustment of land elements and the optimization of land use patterns are crucial mechanisms for mitigating the environmental degradation caused by land use [33].
In summary, while the academic community has undertaken valuable, multi-faceted, and broad-scale explorations into the relationship between land use and EV, several research gaps warrant further consideration. First, although existing studies have assessed EV at provincial, prefectural, and county levels, there is a notable lack of investigation at the township level. Furthermore, these studies have not comprehensively incorporated satellite-retrieved data to construct assessment frameworks, limiting their ability to capture fine-scale variations in EV with high precision. Second, research on the impact of land use on EV has predominantly focused on the negative environmental consequences of changes in land use structure. There is scarce literature examining the influence of the WRCLC pilot policy—an innovative institutional arrangement—on EV. Third, regarding the specific mechanisms, most current research discusses the pathways through which WRCLC improves the ecological environment only qualitatively. Few studies quantitatively investigate the mechanisms by which WRCLC affects EV, thereby failing to reveal the practical logic and operational efficacy of the policy.

2.2. Theoretical Review

As a land use institution in China’s new developmental phase, WRCLC incorporates core principles from landscape ecology theory. It emphasizes the holistic advancement of land consolidation across all elements, regions, processes, and chains, aiming to resolve the historical conflicts between land use and the ecological environment [34,35]. Its mechanism for reducing ecological vulnerability can be analyzed using the “Element-Pattern-Effect” framework of spatial conflict theory [36]. At the element level, WRCLC focuses on the restoration and expansion of ecological land. Relying on integrated restoration projects encompassing mountains, waters, forests, farmlands, lakes, and grasslands, it enhances the environmental resistance of the ecosystem. Specifically, through interventions such as returning farmland to forest, wetland regeneration, and mine re-greening, policies increase the scale and connectivity of ecological patches like forests and wetlands. This optimizes vegetation community structure and soil erosion resistance, thereby solidifying the physical barriers of the ecosystem against extreme climate events and human disturbances and strengthening its overall risk resilience. At the pattern level, WRCLC adheres to the principle of planning-led and systematic design. Aligned with consolidation goals including the concentration of agricultural land, efficient agglomeration of construction land, and functional enhancement of ecological land, it restructures the spatial order of “Production-Living-Ecological” spaces to alleviate spatial conflicts in land use. For instance, fragmented croplands are integrated into contiguous farmland matrices, vacated industrial lands are repurposed and connected into greenway networks, and river systems and forest patches are linked to form ecological barriers. This spatial reorganization, characterized by “Concentrated Construction and Contiguous Protection,” reduces functional conflicts between urban expansion and ecological conservation, mitigates habitat fragmentation risks, enhances connectivity for material cycles and species migration, and consequently activates the ecosystem’s self-organizing capacity. At the effect level, driven by the coupling of enhanced elements and optimized patterns, the pilot policy amplifies ecological benefits through positive feedback mechanisms, ultimately achieving a multi-scale leap in ecosystem resilience. This process essentially accelerates the self-organization of the landscape ecosystem through human intervention, promoting its evolution from a low-efficiency equilibrium to a highly resilient state. Consequently, the theoretical hypothesis and framework (Figure 1) of this study are presented as follows:
H1: 
The WRCLC pilot policy contributes to the reduction of EV.
H2: 
The WRCLC pilot policy reduces EV through the restructuring of land elements, without intensifying land use conflicts.

3. Materials and Methods

3.1. Study Area

Zhejiang Province is situated in the southern wing of the Yangtze River Delta on the southeastern coast of China, spanning latitudes 27°02′ N to 31°11′ N and longitudes 118°01′ E to 123°10′ E. The region experiences a monsoon-influenced humid climate, characterized by moderate temperatures, distinct seasonal variations, ample sunshine, and abundant rainfall. The mean annual temperature ranges from 15 °C to 18 °C, annual sunshine duration ranges from 1100 to 2200 h, and average annual precipitation falls between 1100 and 2000 mm. With a land area of 105,500 square kilometers, mountains account for 74.6%, water bodies for 5.1%, and flat land for 20.3%, leading to the common description “70% mountains, 10% water, and 20% farmland.” This topography accentuates the challenges of economic development amid scarce land resources.
Confronted with the constraints of limited land resources and economic development, Zhejiang Province pioneered township-level WRCLC across the province in 2018. This was followed by the rollout of four additional batches of WRCLC pilots in 2019, 2020, 2021, and 2022 (Figure 2). The first and second batches of provincial-level WRCLC and ecological restoration pilot sites, announced on June 6, 2019, and September 11, 2020, respectively, comprised a total of 497 townships. In 2021, the Ministry of Natural Resources released a list of national-level WRCLC pilot sites, which included 42 from Zhejiang Province. Consequently, the total number of WRCLC pilot sites in Zhejiang reached 539. After excluding pilot sub-districts and townships with severely missing data, a final sample of 278 pilot townships was retained for analysis.

3.2. Variable Selection

(1)
Dependent Variables
Following established research [37,38] and considering the ecological context of Zhejiang Province, we constructed an evaluation index system for assessing the EV of townships in Zhejiang from 2015 to 2022. This system is structured along the three dimensions of “Sensitivity-Resilience-Pressure,” with indicator weights determined using the entropy method. Ecological sensitivity refers to the degree to which an ecosystem is susceptible to external disturbances and stress [39]. Zhejiang Province is located in a monsoon climate zone characterized by concentrated and intense precipitation. Furthermore, the widespread hilly and mountainous terrain in the region increases the likelihood of geological hazards. Therefore, both topographic and climatic factors are essential in assessing ecological sensitivity. On this basis, this study selects four indicators—elevation and slope, which reflect the topography of townships, as well as temperature and precipitation, which reflect climatic conditions—to comprehensively evaluate the ecological sensitivity at the township level. Ecological resilience denotes the capacity of an ecosystem to recover from external environmental changes and disturbances [40]. This indicator is closely related to ecosystem integrity and diversity. Therefore, this study selects metrics from both the landscape and vegetation dimensions to represent ecological resilience. At the landscape level, the Contagion Index (CONTAG) and Shannon’s Diversity Index (SHDI), which reflect landscape diversity and complexity, as well as the Patch Density (PD), which indicates landscape fragmentation, are chosen. At the vegetation level, the NDVI and NPP indices are selected to characterize the vegetation coverage of the area. Ecological pressure reflects the magnitude of external stress imposed on the ecosystem, an indicator closely linked to human activities. As a major coastal economic province in China, Zhejiang has long experienced a tension between economic development and ecological conservation, which significantly influences the increase in ecological pressure and vulnerability. Therefore, this study selects population density and the level of economic development to represent ecological pressure, with the latter measured by the mean nighttime light intensity. The specific indicator evaluation system is shown in Table 2.
(2)
Independent Variables
The core explanatory variable in this study is the WRCLC pilot policy, which is represented by a Difference-in-Differences (DID) estimator—specifically, the interaction term between a treatment group dummy ( t r e a t ) and a time dummy ( p o s t ). This variable is constructed based on the WRCLC pilot information released by the Zhejiang Provincial Department of Natural Resources and China’s Ministry of Natural Resources. Here, t r e a t is a dummy variable for the treatment group: it is assigned a value of 1 if a township implemented the WRCLC pilot, and 0 otherwise. p o s t is a time dummy variable for the pilot period: it takes the value of 1 for the pilot initiation year and all subsequent years, and 0 otherwise.
(3)
Control Variables
Drawing on established research [41,42,43], this study selects control variables at both the township and county levels. The township-level control variables include: Enterprise density (units/sq km): Represented by the ratio of the number of industrial enterprises to the total administrative area within a township. Wind Speed (m/s): Indicated by the near-surface wind speed at 10 m height in the region. Atmospheric Pressure (hPa): Represented by the annual average surface pressure in the region. Relative Humidity (%): Captured by the annual average relative humidity in the region. The county-level control variables comprise: Economic Development Level (10,000 yuan): Measured as the county’s Gross Domestic Product (GDP) per capita. Industrial Structure: Represented by the proportion of secondary industry output value in the county’s GDP. Degree of Government Intervention: Measured by the ratio of local government fiscal expenditure to the county’s GDP. Education Development Level: Indicated by the proportion of total enrollment in regular secondary and primary schools to the county’s year-end total population. Agricultural Development Level: Represented by the proportion of the added value of agriculture, forestry, animal husbandry, and fishery in the county’s GDP. Population Density (10,000 persons/sq km): Calculated as the county’s year-end total population divided by its land area. Technological Innovation Level (items/10,000 persons): Measured by the number of patent grants per 10,000 people in the county.
(4)
Mediating Variables
This study selects mediating variables at the element and pattern levels, respectively. Elements indicators: Land consolidation inevitably alters the composition of production, living, and ecological spaces. Since a township’s ecological vulnerability is intrinsically linked to the structure of these spaces, this study selects the “Dynamic Degree of Production-Living-Ecological Spaces” to represent the impact of WRCLC at the element level. This metric effectively captures the rate of spatial transition within a region. Following the approach of Chen et al. [44], PLE spaces in Zhejiang Province are classified into six types: cropland area, impervious surface area, grassland area, forest area, shrub area, and water body area. Referencing the study by Guo et al. [45], this paper employs the annual summation of the single-type dynamic degree of PLE spaces to represent this indicator, which captures the quantitative changes of PLE spaces over the time series. Furthermore, considering the pathway of ecological space change driven by the WRCLC, ecological space is extracted from the broader PLE spaces. Specifically, grassland area, forest area, shrub area, and water body area are selected as the land type areas constituting the ecological space. Pattern indicators: To determine whether the land consolidation process induces significant land use disruptions or interest conflicts, thereby increasing ecological vulnerability, this study selects land use conflict (LUC) to represent the impact of WRCLC on the pattern level. LUC refers to the competition and disputes over rights and interests concerning land use patterns and structures among various stakeholders during the process of land utilization [46]. Following the methodology established by Meng et al. [47], this study constructs an identification model based on the complexity, vulnerability, and stability of land use to measure the LUC index across eight periods from 2015 to 2022 in Zhejiang Province. The formulas for calculating the indicators are listed in Table 3.

3.3. Data Source

The EV index was calculated using data sourced from Landsat remote sensing imagery, the Geospatial Data Cloud, and the Emission Database for Global Atmospheric Research. Township-level panel data were generated through processing and analysis with ArcGIS10.8 and Fragstats 4.2 software. The list of townships designated as WRCLC pilot zones in Zhejiang Province was obtained from the official websites of the Zhejiang Provincial Department of Natural Resources and the Ministry of Natural Resources. Township-level socioeconomic data were derived from the China County Economic Statistical Yearbook (Township Volume) for the years 2016 to 2023. Meteorological variables, including temperature, wind speed, atmospheric pressure, and humidity, were sourced from the dataset published by Zhang and Hu [48] on the National Cryospheric Desert and Polar Data Center platform. Slope data were obtained from the 500-m resolution DEM dataset shared by the GEBCO organization. County-level control variables were collected from the Zhejiang Statistical Yearbook (2016–2023). Missing values in the yearbook data were addressed using linear interpolation. Data on new agricultural business entities were acquired from the “Tianyancha” platform. Data on township land adjustment areas were gathered from the “Supplemental Cultivated Land Projects and Parcel Information Disclosure” section of the Ministry of Natural Resources website. Descriptive statistics for all variables are presented in Table 4.

3.4. Research Methods

3.4.1. The Entropy Method

The EV indicator in this study was calculated using the entropy method. The specific computational procedure is as follows:
Step 1: Arrange the n evaluation indicators from m samples in sequence to form a raw data matrix X = x i j m × n (1 ≤ i m , 1 ≤ j n ), where X i j denotes the j -th indicator of the i -th sample.
Step 2: Normalize the data. Since the original dataset comprises variables with divergent measurement units, making direct comparisons invalid. To address this issue, the min-max normalization method was selected for its superior performance, for positive indicators X i j = x i j min { x i j } max { x i j } min { x i j } ( i = 1 , 2 , m ; j = 1 , 2 , , n ) , for negative indicators X i j = max { x i j } x i j max { x i j } min { x i j } ( i = 1 , 2 , m ; j = 1 , 2 , , n ) .
Step 3: Calculate the proportion matrix of the indicator system. Normalize the data for each indicator to obtain the normalized matrix Z = z i j m × n , where z i j is calculated as shown in Equation (1).
z i j = x i j i = 1 m x i j
Step 4: Calculate the entropy value for each indicator, as defined in Equation (2), wherein, should a value of x i j be zero and thus preclude logarithmic computation, the mean difference method is applied by adding 1 to the value before performing the logarithm.
e j = 1 l n m i = 1 m x i j l n x i j ( i = 1 , 2 , 3 , m )
Step 5: Calculate the degree of divergence. The divergence in indicator weight is inversely proportional to the entropy value e j and directly proportional to the divergence coefficient h j . Consequently, a larger value of h j signifies a higher importance for the j -th indicator. The calculation formula for the indicator’s divergence coefficient is given by Equation (3).
h j = 1 e j ( j = 1 , 2 , 3 , n )
Step 6: Calculate the indicator weights using the entropy method. The weight W j of the j -th evaluation indicator with respect to the comprehensive evaluation score of the overall objective is calculated as shown in Equation (4).
w j = h j j = 1 n e j ( j = 1 , 2 , 3 , n )
Step 7: Calculate the comprehensive score for each sample, as shown in Equation (5).
F i = j = 1 n w j x i j

3.4.2. The Multi-Period Difference-in-Differences Model

The core research question of this study is to examine the impact of the WRCLC policy on regional EV. Treating the WRCLC pilot policy as a quasi-natural experiment, a Difference-in-Differences (DID) model is employed to compare the changes in EV between pilot areas (the treatment group) and non-pilot areas (the control group) before and after the policy implementation, thereby isolating the net effect of the WRCLC policy on the treatment group’s EV.
In practice, the WRCLC pilot policy in Zhejiang Province was initiated in 2019, which is consequently designated as the policy shock year. Within the sample period of this study, the treatment group for the WRCLC pilot policy comprises 278 townships, while the control group consists of 387 townships.
Based on this framework, the Difference-in-Differences model for assessing the impact of the WRCLC pilot policy on EV is constructed as follows:
V u l n e r a b i l i t y i t = α + β d i d i t + φ C o n t r o l i t + δ i + ϕ t + ε i t
In the equation, i and t denote the township and year, respectively. The dependent variable V u l n e r a b i l i t y i t represents the regional EV. d i d i t signifies the core explanatory variable WRCLC pilot policy. The coefficient β captures the net effect of WRCLC on EV. C o n t r o l i t refers to the set of control variables, encompassing both township-level and county-level factors. δ i and ϕ t represent the unit fixed effects and year fixed effects, respectively. ε i t is the stochastic error term.

3.4.3. The Mediating Model

To examine the mediating roles of the dynamic degree of PLE spaces, the dynamic degree of ecological space, and LUC in the impact of WRCLC on EV, this study employs a causal mediation analysis framework. Following the methodological approach advocated by Jiang [49], the analysis focuses on establishing the causal effect of the WRCLC policy on these three potential mechanisms. This approach is adopted to circumvent the endogeneity problems that may arise from including the mediating variables directly in the baseline regression, as is common in the traditional stepwise method. The specific model specifications are as follows:
V u l n e r a b i l i t y i t = α + β d i d i t + φ C o n t r o l i t + δ i + ϕ t + ε i t
M e d i t = α + β d i d i t + δ C o n t r o l i t + δ i + ϕ t + ε i t
In the equation, M e d i t represents the mediating variable in this study, which includes the dynamic degree of PLE spaces, the dynamic degree of ecological space, and LUC. All other variables are consistent with those defined in Equation (6).

4. Results

4.1. Spatio-Temporal Characteristics of EV in Zhejiang Province

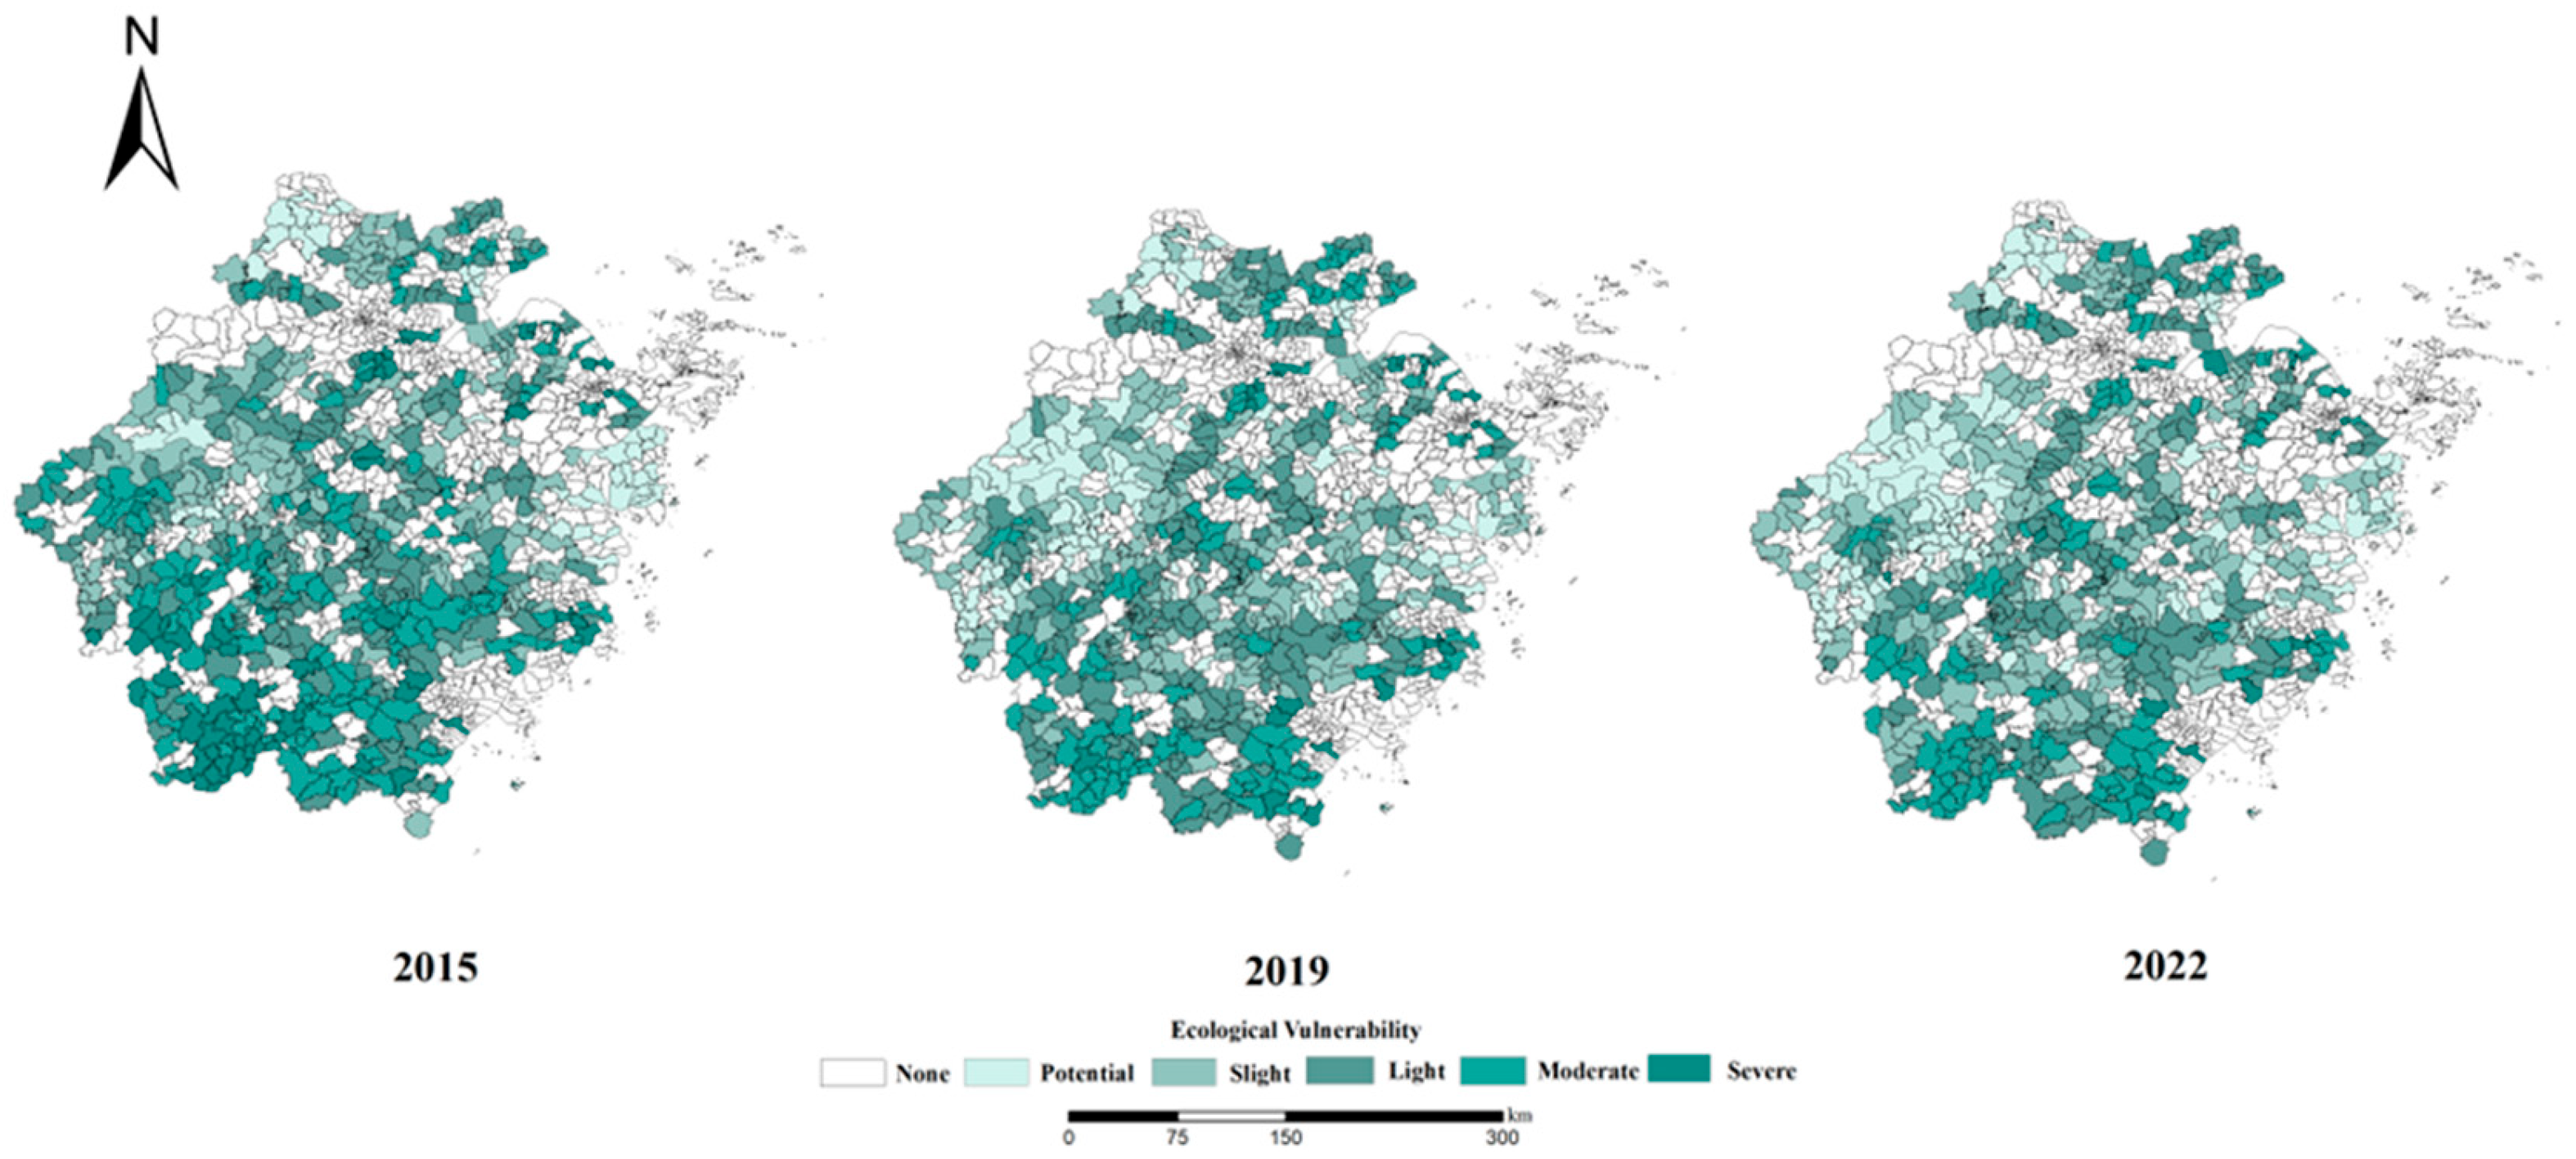
Based on the calculated EV index (EVI), the township-level EVIs for Zhejiang Province in 2015, 2019, and 2022 are visualized in Figure 3. Using the Natural Breaks (Jenks) method, the EVIs within the study area were classified into five distinct grades: Potential Vulnerability (EVI < 0.194), Slight Vulnerability (0.194 ≤ EVI < 0.222), Mild Vulnerability (0.222 ≤ EVI < 0.253), Moderate Vulnerability (0.253 ≤ EVI < 0.295), and Severe Vulnerability (0.295 ≤ EVI < 0.456). Overall, a marked improvement in EV is observed across Zhejiang Province in 2022 compared to 2015. Areas characterized by severe vulnerability have notably decreased, while the spatial extent of potential and slightly vulnerable areas has expanded. At a local scale, the most significant reduction in EV occurred in the Southwestern Zhejiang mountainous area, which shifted from being severely vulnerable in 2015 to moderately or mildly vulnerable by 2022. Similarly, the Qiandao Lake basin in Western Zhejiang exhibited improvement, transitioning from moderate/mild vulnerability to mild/slight vulnerability. Other regions also displayed varying degrees of decline in EV. These observations indicate an overall reduction in EV during the implementation of WRCLC in Zhejiang Province. However, whether this can be attributed to the policy effects of WRCLC requires further empirical verification in the subsequent analysis.

4.2. Baseline Regression

Table 5 reports the baseline regression results examining the impact of the WRCLC pilot policy on EV. Column (1) presents the estimates controlling for individual and time fixed effects, without including any control variables. Column (2) adds township-level control variables to the specification in column (1). Column (3) further incorporates county-level control variables based on column (2). The results in column (3) show that the coefficient on the WRCLC pilot policy is negative and statistically significant at the 1% level, indicating that the policy has significantly reduced EV. This finding provides preliminary support for Hypothesis 1 of this study.

4.3. Parallel Trend Test

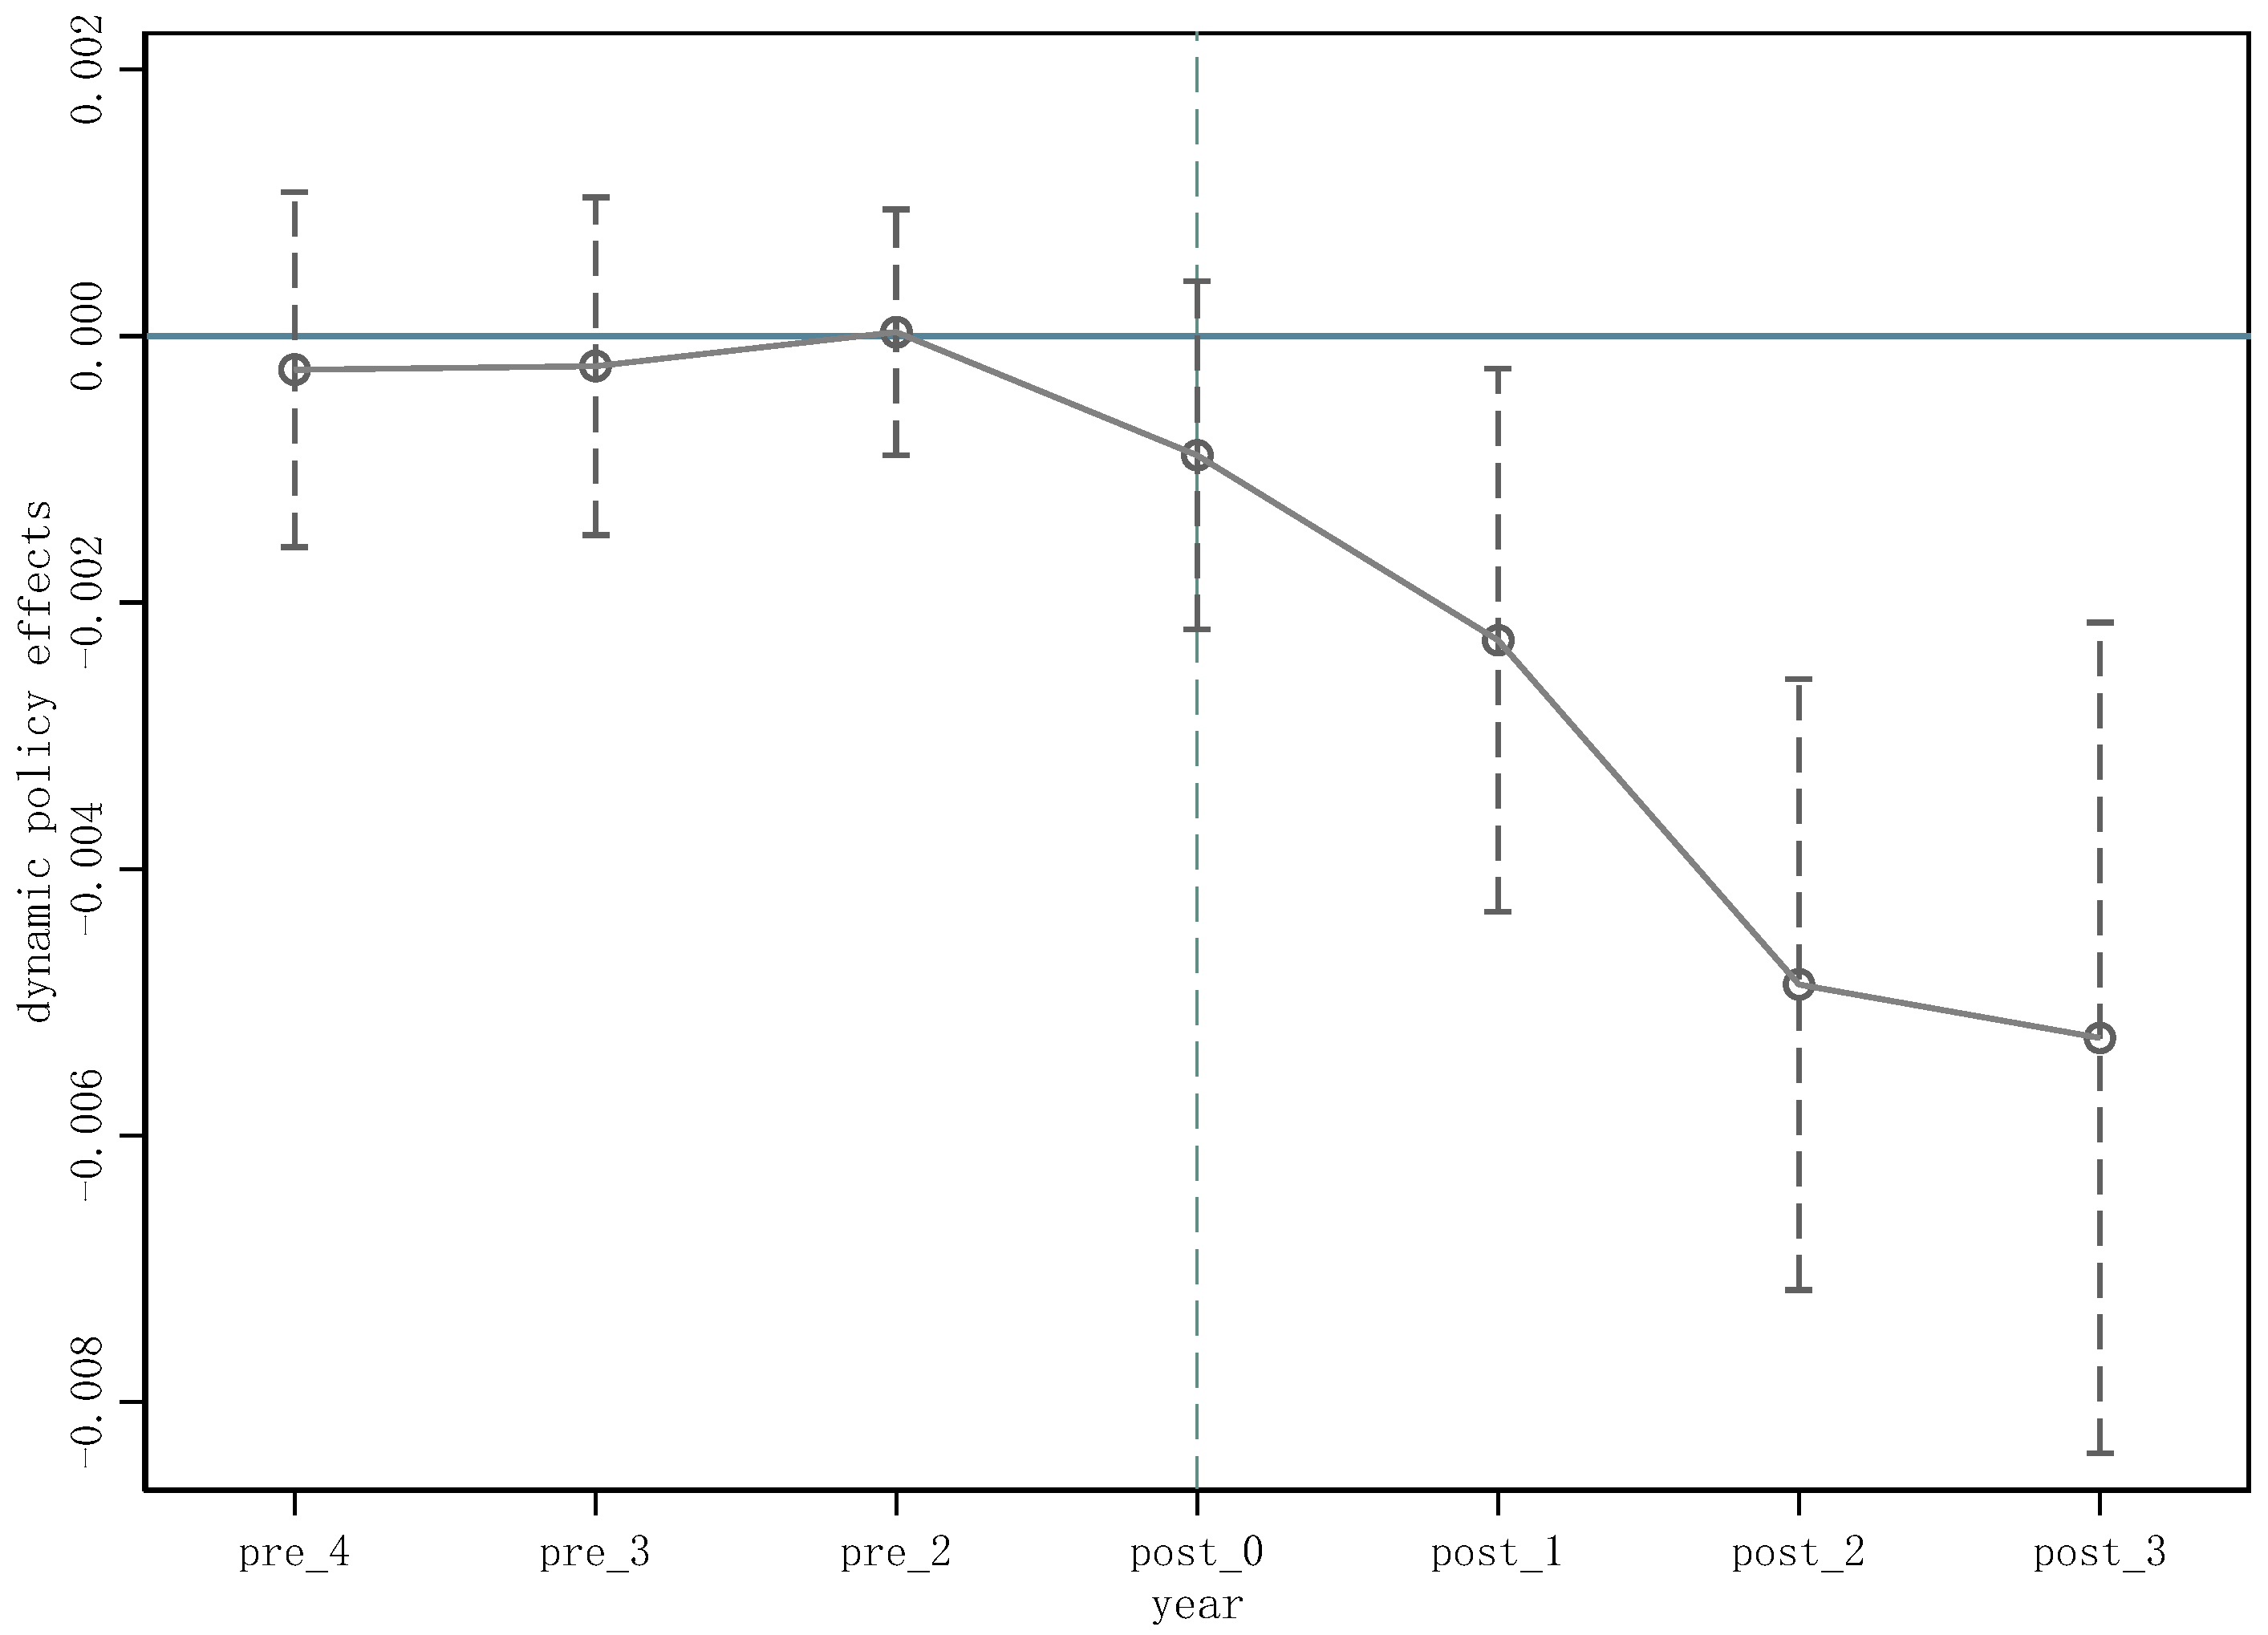
The Difference-in-Differences (DID) approach requires that the treatment and control groups exhibit parallel trends prior to the policy intervention, a prerequisite verified by the pre-trend test. Given the varying implementation times of the policy across different pilot townships, this study sets the time dummy variable according to the actual policy implementation year for each township. Figure 4 presents the results of the pre-trend test. In the figure, the dashed lines represent the confidence interval, while the solid black line depicts the trajectory of the regression coefficients across years. As shown, using the year before the WRCLC policy implementation (2018) as the base period, the coefficients for the time dummy variables in all pre-treatment periods are statistically insignificant. In contrast, following the policy implementation, the coefficient for the WRCLC pilot policy becomes significantly negative, and its confidence interval excludes zero. This confirms that the parallel trends assumption holds and that the WRCLC policy effectively reduces EV in the pilot areas.

4.4. Robustness Test

4.4.1. The Mixed Placebo Test

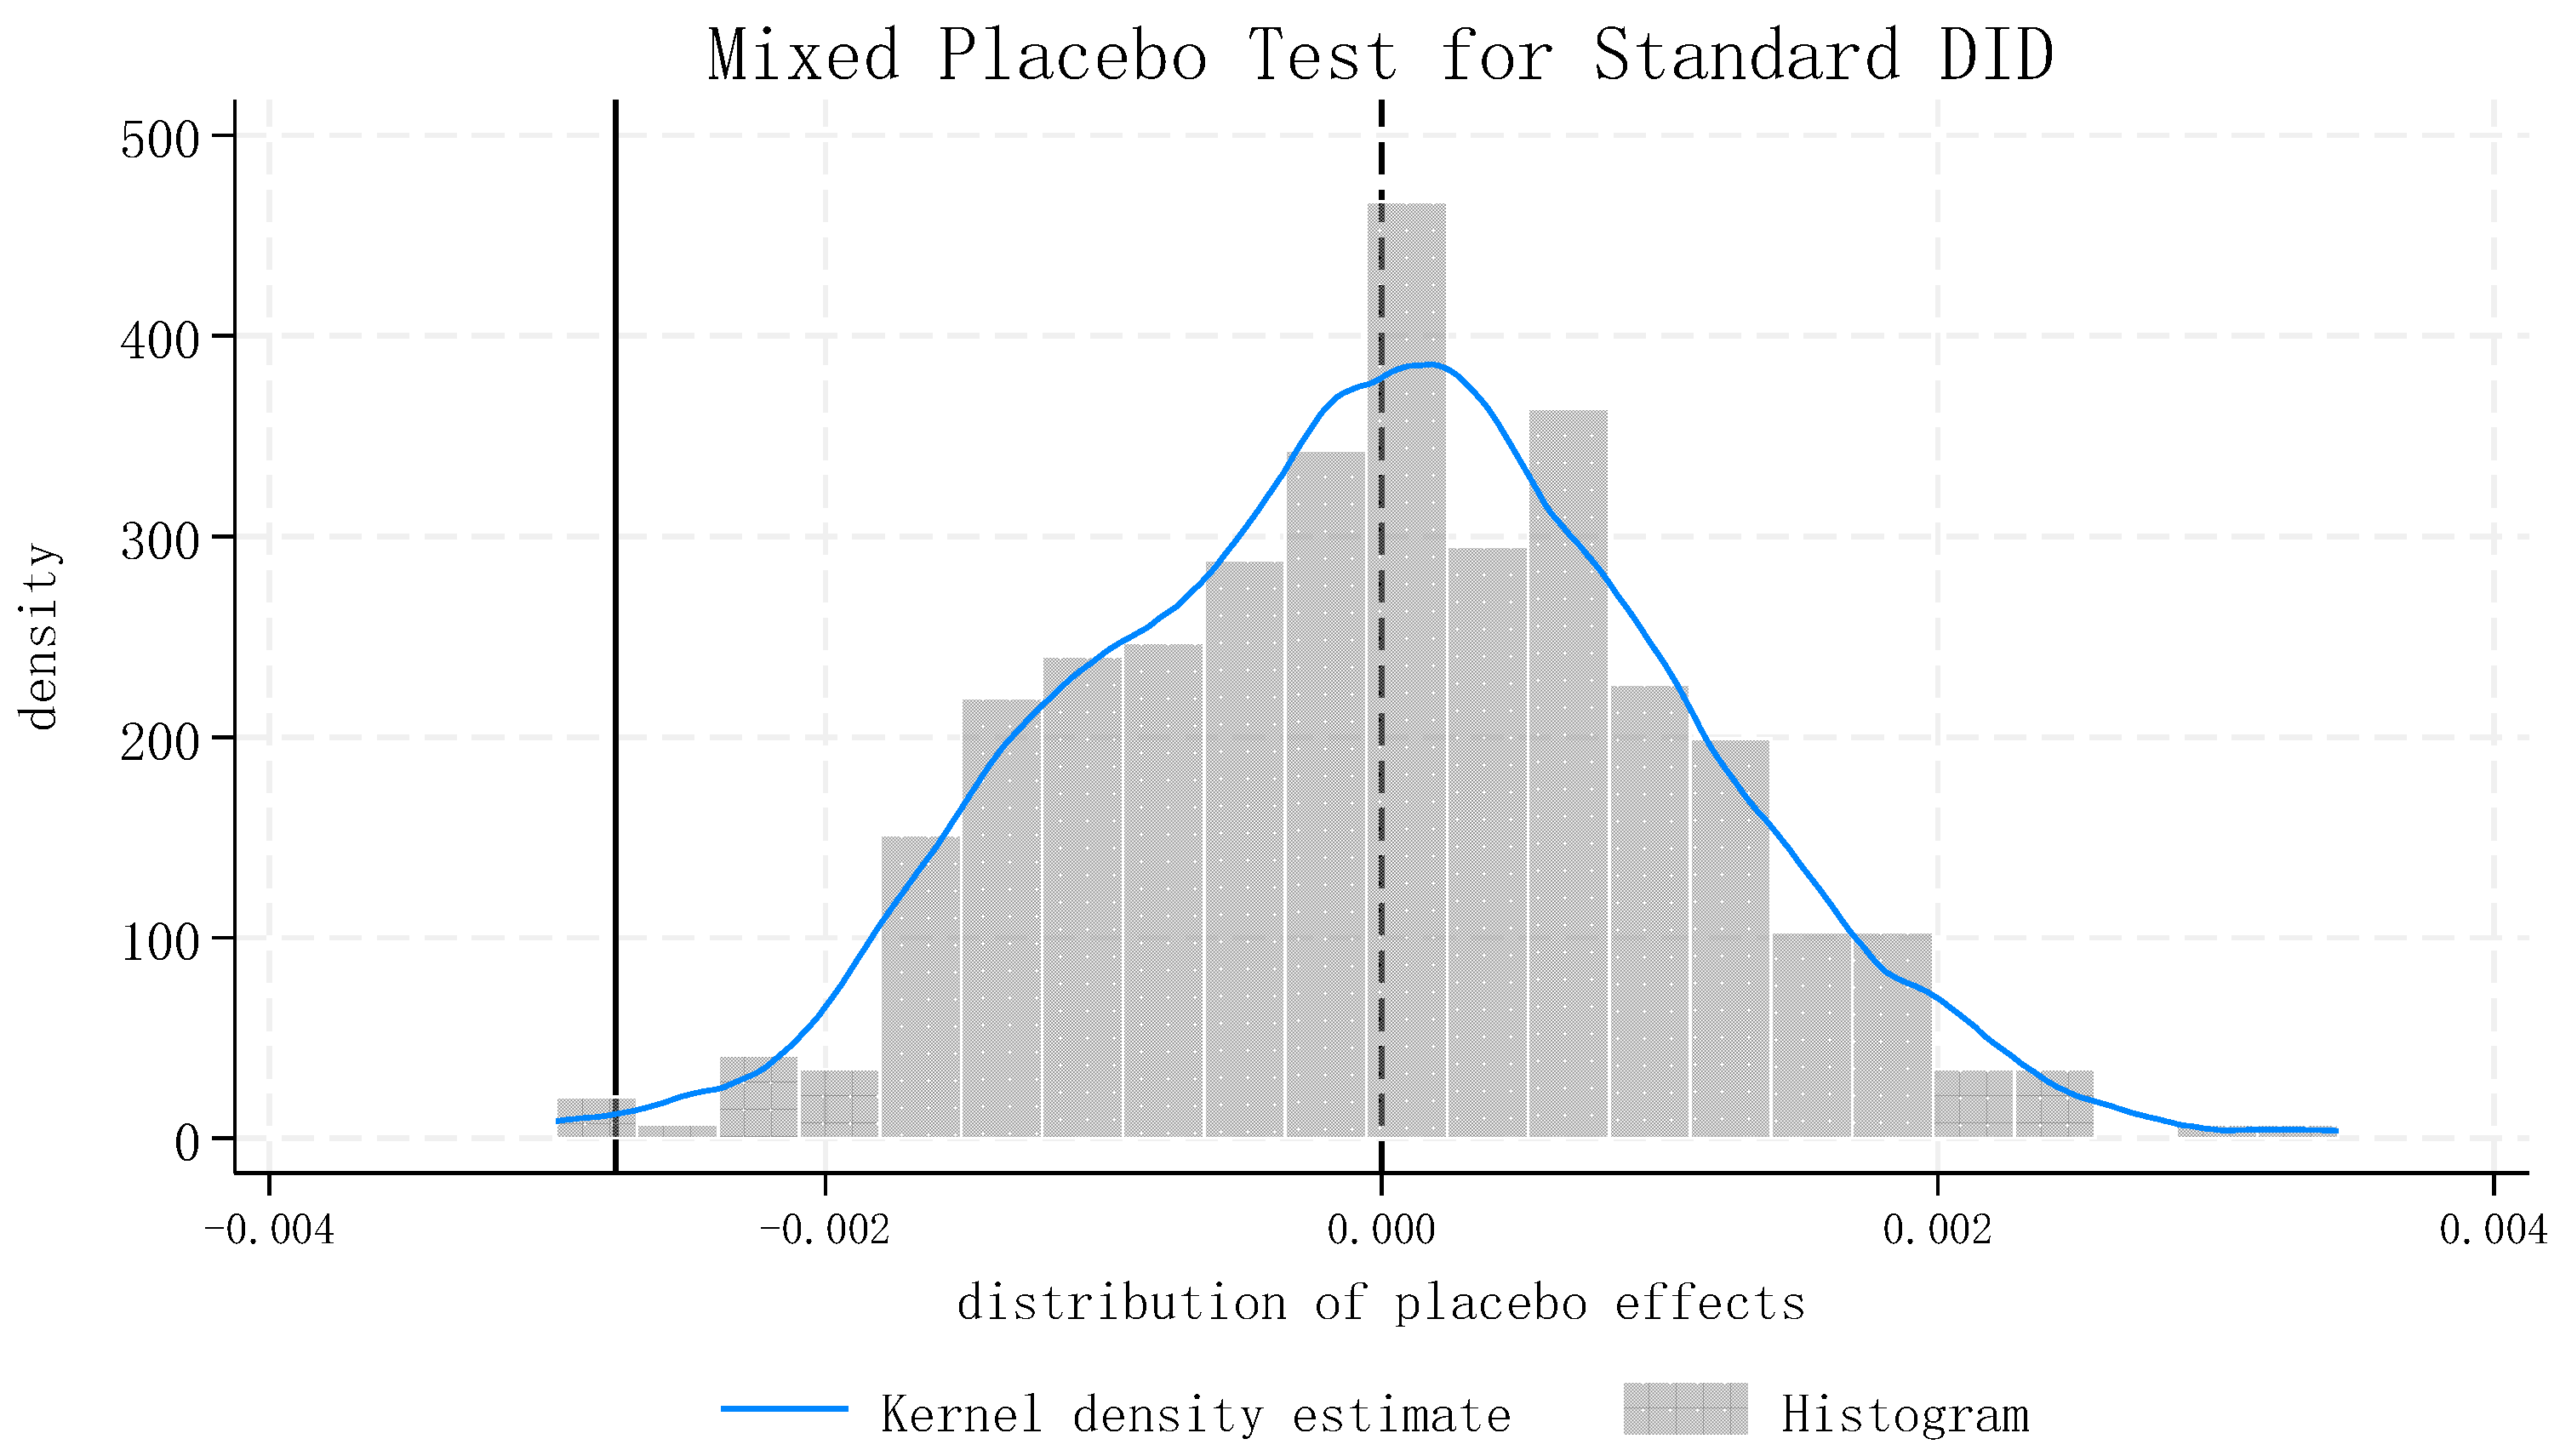
To further verify the robustness of the estimation results, a mixed placebo test was conducted for counterfactual inference. This involved constructing both a “pseudo treatment time” in the temporal dimension and “pseudo treatment townships” in the spatial dimension from the entire sample. Regression analyses were performed on 500 randomly drawn samples to generate the distribution of the placebo effects. As shown in the kernel density plot and histogram of the placebo effects reported in Figure 5, the actual treatment effect estimate (−0.002755) is located in the right tail of the distribution. Furthermore, Table 6 reports the two-sided and one-sided p-values from the placebo test. Both the two-sided p-value and the left-sided p-value reject the null hypothesis of a zero treatment effect at the 5% and 1% significance levels, respectively. This result provides strong evidence supporting the robustness of our findings.

4.4.2. Winsorization

To mitigate potential estimation errors caused by extreme outliers in the regression sample, all variables except the core explanatory variable were winsorized at the 1st and 99th percentiles. Values beyond the upper percentile and below the lower percentile were replaced. The regression results after this winsorization treatment are presented in Column (1) of Table 7. It shows that the result remains statistically significant and positive after the adjustment, confirming the robustness of the finding.

4.4.3. Addressing Sample Self-Selection

To mitigate potential self-selection bias, as the selection of townships for the WRCLC pilot may not be random, Propensity Score Matching (PSM) was employed to match samples. This study selected all the control variables mentioned previously as covariates. A Logit model was used to estimate the propensity score of being selected for the WRCLC pilot based on these covariates. Using these scores, 1:1 caliper nearest neighbor matching (with a caliper of 0.05) was performed for cross-sectional matching. The estimation results, presented in Column (2) of Table 7, indicate that the coefficient for the impact of WRCLC on EV remains significantly negative at the 1% level, confirming the robustness and significance of the findings reported earlier.

4.4.4. Policy Lag Effect

To account for the potential lag in the effects of the WRCLC policy implementation, this study replaces the original core explanatory variable with its one-period lagged term. The estimation results, presented in Column (3) of Table 7, show that the coefficient of the lagged core explanatory variable remains significantly negative. This finding is consistent with our primary conclusions, indicating that the significant inhibitory effect of WRCLC on EV persists even after considering the policy’s lagged impact.

4.5. Machanism Inspection

Mediating mechanism of landscape “Elements”. As shown in Column (1) of Table 8, the coefficient of the core explanatory variable is significantly positive at the 5% level, indicating that the implementation of the WRCLC pilot policy has positively promoted the expansion of PLE space area. Therefore, along the dimension of PLE space dynamic degree, the implementation of the WRCLC policy significantly contributes to the reduction of EV by optimizing the configuration of PLE spaces. From Column (2) of Table 8, the core explanatory variable is positive and statistically significant at the 5% level, demonstrating that the WRCLC policy has also actively increased the area of ecological space. Comparing these results with those in Column (1) suggests that the expansion of ecological space plays a crucial role in the elemental pathway through which WRCLC reduces regional EV. Consequently, in the dimension of ecological space dynamic degree, the implementation of the WRCLC pilot policy facilitates the decline of regional EV by augmenting the ecological space area and enhancing the overall risk resilience of the ecosystem.
The mediating mechanism of landscape “Pattern”. Column (3) of Table 8 reveals that the coefficient of the core explanatory variable is negative and statistically insignificant. This suggests that the WRCLC pilot policy, during its process of adjusting land areas, has not intensified LUC in the pilot areas. This finding implies that the processes of agricultural land consolidation, construction land management, and ecological restoration in the WRCLC pilot zones have not compromised land use stability or increased surface vulnerability, thereby validating Hypothesis 2 of this study.

5. Further Analysis

Given that ecological effects exhibit spatial spillovers [50], and the WRCLC process may influence EV in both local and neighboring areas through factor mobility and industrial linkages, it is essential to further investigate its spatial relevance. Accordingly, this study constructs a geographical distance matrix as the spatial weight matrix. First, Moran’s I was employed to calculate the spatial autocorrelation coefficient of EV. The test results, as shown in Table 9, indicate that Moran’s values for the study years are all greater than 0 and pass the significance test. This suggests a strong spatial association in ecological vulnerability across the study period.
Furthermore, model selection tests—including the LM-error, Robust LM-error, LM-lag, Robust LM-lag, LR and Wald tests—were conducted. The results, presented in Table 10, show that all statistics are significant, suggesting that the Spatial Durbin Model (SDM) is the most appropriate for subsequent spatial econometric analysis.
The SDM is constructed as follows:
V u l i t = α 0 + ρ j = 1 n W i j × V u l i t + α 2 d i d i t + α 3 Z i t + β 2 j = 1 n W i j × d i d i t + β 3 j = 1 n W i j × Z i t + δ i + ϕ t + ε i t
In the equation, ρ denotes the spatial autoregressive coefficient of the dependent variable; W i j represents the geographical distance matrix constructed for the townships in this study; β 2 and β 3 are the spatial lag coefficients of the core explanatory variable and control variables, respectively. All other variable definitions remain consistent with those in Equation (1).
The regression results of the SDM are presented in Table 11. As shown in column (1), both the WRCLC policy and its spatial lag term exhibit statistically significant negative effects, indicating that WRCLC significantly reduces EV not only within the implementing township but also in the surrounding areas. Furthermore, by decomposing the spatial spillover effects into direct, indirect, and total effects, the indirect effect reveals a coefficient of −0.004 for WRCLC, which is significant at the 10% level. This demonstrates that the implementation of WRCLC generates significant positive spatial spillovers to neighboring regions, meaning that while reducing local EV, it also contributes to the reduction of EV in adjacent areas.

6. Discussion and Policy Implications

6.1. Discussion

In terms of the above findings, this study expands the theoretical and practical research on the ecological effects of land consolidation. Traditional land consolidation primarily focused on economic outcomes, largely neglecting to integrate ecological considerations into its framework. As an innovative land management institution in China’s new era, WRCLC explicitly incorporates ecological restoration as a core objective. The mitigating effect of WRCLC on EV revealed in this study contributes to the research system of EV and provides evidence for enhancing the ecological effectiveness of land consolidation practices. Furthermore, findings integrated with spatial conflict theory demonstrate that WRCLC reduces EV by optimizing the structure of production-living-ecological spaces, without intensifying LUC in the pilot areas. These conclusions are significant for China in exploring new land consolidation models that foster synergistic human-natural development in the new period, and also offer valuable insights for developing countries and regions in formulating scientifically sound land consolidation measures.

6.2. Policy Implications

(1)
The WRCLC program should be continuously advanced, with pilot projects prioritized in areas experiencing severe ecological imbalance and environmental degradation. Concurrently, a more scientific and holistic benefit assessment framework must be established to conduct long-term tracking studies, enabling a comprehensive evaluation of the projects’ sustained impacts on regional ecological conditions and socio-economic development. During policy implementation, it is crucial to delineate ecological protection redlines, optimize ecological corridor networks, and focus on enhancing ecosystem connectivity and biodiversity. Furthermore, greater emphasis should be placed on integrating ecological elements into land consolidation initiatives—for instance, incorporating ecological buffer zones in agricultural land remediation and increasing green space ratios during urban-rural construction land rehabilitation—thereby expanding the capacity for ecological functionality.
(2)
The importance of “process management” and “chain optimization” during land consolidation must be emphasized to ensure that every phase—from planning and implementation to management—is dedicated to maintaining and constructing a functional, complementary, and structurally balanced land use spatial pattern. The underlying rationale for how WRCLC balances land use lies in its shift from “reactive remediation” of potential LUC to “proactive prevention and real-time regulation,” thereby averting irreversible damage to ecosystems caused by high-intensity conflicts. Consequently, local governments must adopt a holistic perspective throughout the consolidation process, ensuring that newly added and restored ecological spaces are effectively integrated into the original ecological network. This enhances the integrity and connectivity of ecological land, generating a synergistic “1 + 1>2” effect that amplifies overall ecological benefits.
(3)
Deepening the integration of landscape ecology theory and land consolidation practices is essential. Territorial spatial planning develops conservation patterns by optimizing PLE spaces, thereby safeguarding ecological security and achieving sustainable development. Its core intent aligns with the fundamental principles of landscape ecology, whose theories and methods were already extensively applied during the first round of territorial spatial planning. Under the current new round of territorial spatial planning, efforts should be intensified to foster interdisciplinary convergence between landscape ecology and other fields. This can be achieved by leveraging big data analytics and remote sensing cloud computing to enhance observational accuracy, and by breaking through traditional research paradigms—extending beyond the traditional ecology-centered approach to include environmental, social, and humanistic dimensions. Such integration will propel land consolidation’s transition from an engineering-focused model toward the optimization of human-land systems. Ultimately, this synergy will create a mutual reinforcement between theoretical and methodological innovation in ecological governance and practical efficacy enhancement in spatial planning, providing robust scientific support for WRCLC in China.

7. Conclusions

Grounded in landscape ecology theory and spatial conflict theory, this study employed a multi-period Difference-in-Differences approach from a township-level perspective to empirically examine the impact of Whole Region Comprehensive Land Consolidation (WRCLC) on Ecological Vulnerability (EV) and its underlying mechanisms. The findings reveal that WRCLC exerts a significant negative effect on EV. Furthermore, mechanism analysis demonstrates that the ecological transformation of land use structure and the increased land use intensity at the element level, coupled with the non-salience of spatial pattern conflicts, serve as crucial pathways through which WRCLC reduces EV. Further analysis reveals that WRCLC exerts a significant negative spatial spillover effect on adjacent areas. Based on the above conclusions, the following policy implications are proposed:
Although this study concludes that the WRCLC policy significantly reduces regional EV, it acknowledges two main limitations. First, the research is confined to Zhejiang Province and does not examine WRCLC pilot initiatives implemented in other provinces. Consequently, it cannot assess the effectiveness of the policy in those regions, making it difficult to demonstrate the generalizability of the findings. Future research should expand the study area to a national scale to investigate the overall effect of WRCLC on EV. Second, due to data availability constraints, the observation period in this study concludes in 2022. Once subsequent data are released, integrating the latest time-series data for longitudinal extension will be essential to verify the robustness of our conclusions.

Author Contributions

Conceptualization, H.L.; methodology, H.L.; software, H.S. and B.L.; validation, D.X.; formal analysis, H.L.; resources, H.L.; data curation, H.S.; writing—original draft preparation, H.S.; writing—review and editing, B.L.; visualization, H.S.; supervision, H.L.; project administration, D.X.; funding acquisition, H.L. All authors have read and agreed to the published version of the manuscript.

Funding

This research was funded by the National Natural Science Foundation of China General Program (Grant number 72503226).

Data Availability Statement

The data used in this study are available for sharing from the corresponding author upon reasonable request from qualified researchers.

Conflicts of Interest

The authors declare no conflicts of interest.

References

  1. Beroya-Eitner, M.A. Ecological vulnerability indicators. Ecol. Indic. 2016, 60, 329–334. [Google Scholar] [CrossRef]
  2. Wang, L.; Liu, X.; Lei, J.; Ma, J.; Zhang, L.; Liu, X. How the land use change impact on ecological vulnerability in the Lanzhou-Baiyin Section of the Yellow River Basin, China. Environ. Sustain. Indic. 2025, 27, 100779. [Google Scholar] [CrossRef]
  3. Xu, L.; Huang, Q.; Ding, D.; Mei, M.; Qin, H. Modelling urban expansion guided by land ecological suitability: A case study of Changzhou City, China. Habitat Int. 2018, 75, 12–24. [Google Scholar] [CrossRef]
  4. Estoque, R.C.; Dasgupta, R.; Winkler, K.; Avitabile, V.; Johnson, B.A.; Myint, S.W.; Gao, Y.; Ooba, M.; Murayama, Y.; Lasco, R.D. Spatiotemporal pattern of global forest change over the past 60 years and the forest transition theory. Environ. Res. Lett. 2022, 17, 084022. [Google Scholar] [CrossRef]
  5. Gichuki, L.; Brouwer, R.; Davies, J.; Vidal, A.; Kuzee, M.; Magero, C.; Walter, S.; Lara, P.; Christiana, O.; Ben, G. Reviving Land and Restoring Landscapes; IUCN: Gland, Switzerland, 2019. [Google Scholar]
  6. Yan, Y.; Liu, T.; Wang, N.; Yao, S. Urban sprawl and fiscal stress: Evidence from urbanizing China. Cities 2022, 126, 103699. [Google Scholar] [CrossRef]
  7. Wen, Z.; Zhao, H.; Liu, L.; Ou-Yang, Z.Y.; Zheng, H. Impacts of land use change on soil water conservation function in Hainan Province, China. Chin. J. Appl. Ecol. 2017, 28, 4025–4033. [Google Scholar] [CrossRef]
  8. Zhou, Y.; Li, P.; Zhang, Q.; Cheng, G. Socio-economic impacts, challenges, and strategies for whole-region comprehensive land consolidation in China. Land Use Policy 2025, 150, 107461. [Google Scholar] [CrossRef]
  9. Demetriou, D.; Stillwell, J.; See, L. Land consolidation in Cyprus: Why is an integrated planning and decision support system required? Land Use Policy 2012, 29, 131–142. [Google Scholar] [CrossRef]
  10. Yaslioglu, E.; Akkaya Aslan, S.T.; Kirmikil, M.; Gundogdu, K.S.; Arici, I. Changes in farm management and agricultural activities and their effect on farmers’ satisfaction from land consolidation: The case of Bursa–Karacabey, Turkey. Eur. Plan. Stud. 2009, 17, 327–340. [Google Scholar] [CrossRef]
  11. Muchová, Z.; Jusková, K. Stakeholders’ perception of defragmentation of new plots in a land consolidation project: Given the surprisingly different Slovak and Czech approaches. Land Use Policy 2017, 66, 356–363. [Google Scholar] [CrossRef]
  12. Asiama, K.O.; Bennett, R.M.; Zevenbergen, J.A. Land consolidation on Ghana’s rural customary lands: Drawing from The Dutch, Lithuanian and Rwandan experiences. J. Rural. Stud. 2017, 56, 87–99. [Google Scholar] [CrossRef]
  13. Kupidura, A.; Łuczewski, M.; Home, R.; Kupidura, P. Public perceptions of rural landscapes in land consolidation procedures in Poland. Land Use Policy 2014, 39, 313–319. [Google Scholar] [CrossRef]
  14. Werdiningtyas, R.; Wei, Y.; Western, A.W. The evolution of policy instruments used in water, land and environmental governances in Victoria, Australia from 1860–2016. Environ. Sci. Policy 2020, 112, 348–360. [Google Scholar] [CrossRef]
  15. Xue, L.; Wang, J.; Zhang, L.; Wei, G.; Zhu, B. Spatiotemporal analysis of ecological vulnerability and management in the Tarim River Basin, China. Sci. Total Environ. 2019, 649, 876–888. [Google Scholar] [CrossRef] [PubMed]
  16. Talukdar, A.; Kundu, P.; Bhattacharjee, S.; Dey, S.; Dey, A.; Biswas, J.K.; Chaudhuri, P.; Bhattacharya, S. Microplastics in mangroves with special reference to Asia: Occurrence, distribution, bioaccumulation and remediation options. Sci. Total Environ. 2023, 904, 166165. [Google Scholar] [CrossRef]
  17. Gong, J.; Jin, T.; Cao, E.; Wang, S.; Yan, L. Is ecological vulnerability assessment based on the VSD model and AHP-Entropy method useful for loessial forest landscape protection and adaptative management? A case study of Ziwuling Mountain Region, China. Ecol. Indic. 2022, 143, 109379. [Google Scholar] [CrossRef]
  18. Cao, J.; Yang, Y.; Deng, Z.; Hu, Y. Spatial and temporal evolution of ecological vulnerability based on vulnerability scoring diagram model in Shennongjia, China. Sci. Rep. 2022, 12, 5168. [Google Scholar] [CrossRef] [PubMed]
  19. Wu, G.; Tian, J.; Feng, X.; Ren, Y.; Bao, W.; He, C.; Yu, T.; Wu, J. Spatiotemporal variation and driving factors of ecological vulnerability in arid and semi-arid regions: A case study of Ningxia, China. Catena 2025, 259, 109378. [Google Scholar] [CrossRef]
  20. Han, X.; Wang, P.; Wang, J.; Qiao, M.; Zhao, X. Evaluation of human-environment system vulnerability for sustainable development in the Liupan mountainous region of Ningxia, China. Environ. Dev. 2020, 34, 100525. [Google Scholar] [CrossRef]
  21. Pickett, S.T.A.; McGrath, B.; Cadenasso, M.L.; Felson, A.J. Ecological resilience and resilient cities. Build. Res. Inf. 2014, 42, 143–157. [Google Scholar] [CrossRef]
  22. Fei, L.; Bin, M.; Yibin, W. Agricultural land system transition based on resilience and vitality: A case study on the Loess Plateau (Yulin, China). J. Rural. Stud. 2025, 117, 103643. [Google Scholar] [CrossRef]
  23. Wu, J.Y.; Liu, H.; Li, T.; Ou-Yang, Y.; Zhang, J.H.; Zhang, T.J.; Huang, Y.; Gao, W.L.; Shao, L. Evaluating the ecological vulnerability of Chongqing using deep learning. Environ. Sci. Pollut. Res. 2023, 30, 86365–86379. [Google Scholar] [CrossRef] [PubMed]
  24. Duarte, G.T.; Santos, P.M.; Cornelissen, T.G.; Ribeiro, M.C.; Paglia, A.P. The effects of landscape patterns on ecosystem services: Meta-analyses of landscape services. Landsc. Ecol. 2018, 33, 1247–1257. [Google Scholar] [CrossRef]
  25. Xia, M.; Jia, K.; Zhao, W.; Liu, S.; Wei, X.; Wang, B. Spatio-temporal changes of ecological vulnerability across the Qinghai-Tibetan Plateau. Ecol. Indic. 2021, 123, 107274. [Google Scholar] [CrossRef]
  26. Ao, Y.; Ding, Z.H.; Zhao, Y.H.; Ni, B.; Huang, F.X. Spatiotemporal evolution of ecological vulnerability and ecological resilience and construction of ecological zones in Hanjiang River Basin, China. Environ. Sci. 2025, 1–20. [Google Scholar] [CrossRef]
  27. Chu, V.H.Y.; Lam, W.F.; Williams, J.M. Building robustness for rural revitalization: A social-ecological system perspective. J. Rural. Stud. 2023, 101, 103042. [Google Scholar] [CrossRef]
  28. Laguna, E.; Carpio, A.J.; Vicente, J.; Barasona, J.A.; Triguero-Ocaña, R.; Jiménez-Ruiz, S.; Gómez-Manzaneque, A.; Acevedo, P. The spatial ecology of red deer under different land use and management scenarios: Protected areas, mixed farms and fenced hunting estates. Sci. Total Environ. 2021, 786, 147124. [Google Scholar] [CrossRef]
  29. Adams, E.A.; Kuusaana, E.D.; Ahmed, A.; Campion, B.B. Land dispossessions and water appropriations: Political ecology of land and water grabs in Ghana. Land Use Policy 2019, 87, 104068. [Google Scholar] [CrossRef]
  30. Li, J.; Ding, Y.; Jing, M.; Dong, X.; Zheng, J.; Gu, J. Quantitative Change or Qualitative Change: The Impact of Whole-Region Comprehensive Land Consolidation on Cultivated Land Security—Based on Panel Data from Townships in Zhejiang Province. Land 2024, 13, 2158. [Google Scholar] [CrossRef]
  31. Talukdar, S.; Eibek, K.U.; Akhter, S.; Ziaul, S.K.; Islam, A.R.M.T.; Mallick, J. Modeling fragmentation probability of land-use and land-cover using the bagging, random forest and random subspace in the Teesta River Basin, Bangladesh. Ecol. Indic. 2021, 126, 107612. [Google Scholar] [CrossRef]
  32. Lu, H.; Ding, Y.; Zhang, J.; Wu, W.; Xu, D. Carbon reduction effect of comprehensive land consolidation and its configuration paths at the township level: A case study of Zhejiang Province, China. J. Environ. Manag. 2025, 373, 123855. [Google Scholar] [CrossRef] [PubMed]
  33. Wang, Y.; Zang, L.; Araral, E. The impacts of land fragmentation on irrigation collective action: Empirical test of the social-ecological system framework in China. J. Rural. Stud. 2020, 78, 234–244. [Google Scholar] [CrossRef]
  34. Dai, X.L.; Zhao, J.M. Comprehensive land consolidation path from the perspective of watershed ecological units: A case study of the provincial pilot in Tangtang Town, Fengan County, Guangdong Province. Planners 2024, 40, 83–90. [Google Scholar]
  35. Yang, G.Q.; Sun, X.Y. Changes, evolution logic and policy orientation of land consolidation policy in China from the perspectives of supply-demand and resilience. Rural. Econ. 2024, 3, 44–53. [Google Scholar]
  36. Wiens, J.A.; Chr, N.; Van Horne, B.; Anker Ims, R. Ecological mechanisms and landscape ecology. Oikos 1993, 66, 369–380. [Google Scholar] [CrossRef]
  37. Chen, M.; Xu, X.; Tan, Y.; Lin, Y. Assessing ecological vulnerability and resilience-sensitivity under rapid urbanization in China’s Jiangsu province. Ecol. Indic. 2024, 167, 112607. [Google Scholar] [CrossRef]
  38. Facchini, F.; Villamayor-Tomas, S.; Corbera, E.; Ravera, F.; Pocull-Bellés, G.; Codina, G.L. Socio-ecological vulnerability in rural Spain: Research gaps and policy implications. Reg. Environ. Change 2023, 23, 26. [Google Scholar] [CrossRef]
  39. Zou, T.; Chang, Y.; Chen, P.; Liu, J. Spatial-temporal variations of ecological vulnerability in Jilin Province (China), 2000 to 2018. Ecol. Indic. 2021, 133, 108429. [Google Scholar] [CrossRef]
  40. Xue, F.; Zhang, N.C.; Xia, C.Y.; Zhang, J.; Wang, C.Y. Spatial assessment and driving forces of urban ecological resilience: A case study of Tongzhou District, Beijing, China. Acta Ecol. Sin. 2023, 43, 6810–6823. [Google Scholar]
  41. Wang, D.; Chen, S. The effect of pilot climate-resilient city policies on urban climate resilience: Evidence from quasi-natural experiments. Cities 2024, 153, 105316. [Google Scholar] [CrossRef]
  42. Sun, M.; Wang, M.X. Mechanisms and effects of digital economy development on ecological resilience. Environ. Sci. 2025, 46, 4602–4614. [Google Scholar] [CrossRef]
  43. Cui, Z.; Li, E.; Li, Y.; Deng, Q.; Shahtahmassebi, A.R. The impact of poverty alleviation policies on rural economic resilience in impoverished areas: A case study of Lankao County, China. J. Rural. Stud. 2023, 99, 92–106. [Google Scholar] [CrossRef]
  44. Chen, M.J.; Wang, Q.R.; Bai, Z.K.; Shi, Z.Y. Transformation of “production-living-ecological spaces” and its carbon storage effects under the carbon neutrality vision: A case study of Guizhou Province, China. China Land Sci. 2021, 35, 101–111. [Google Scholar]
  45. Guo, C.Y.; Gao, J.H.; Fan, P.F.; Yao, F. Land use transition and hotspot detection based on grid scale: A case study of Yongcheng City, China. China Land Sci. 2016, 30, 43–51. [Google Scholar]
  46. Campbell, D.J.; Gichohi, H.; Mwangi, A.; Chege, L. Land use conflict in Kajiado district, Kenya. Land Use Policy 2000, 17, 337–348. [Google Scholar] [CrossRef]
  47. Meng, J.J.; Jiang, S.; Laba, Z.M.; Zhang, W.J. Spatiotemporal analysis of land use conflicts in the middle reaches of Heihe River based on landscape pattern. Sci. Geogr. Sin. 2020, 40, 1553–1562. [Google Scholar] [CrossRef]
  48. Zhang, L.; Hu, Y.Y.; Zhao, Y.B.; Che, T. ChinaMet: A High-Resolution and Multi-Element Meteorological Forcing Dataset for China Based on Multi-Source Data Fusion; National Cryosphere Desert Data Center: Lanzhou, China, 2025. [CrossRef]
  49. Jiang, T. Mediating effects and moderating effects in empirical research of causal inference. China Ind. Econ. 2022, 5, 100–120. [Google Scholar] [CrossRef]
  50. Ju, C.H.; Pei, W.M.; Zhang, H. Ecological security: A multi-scale perspective. J. Ecol. Rural. Environ. 2020, 36, 626–634. [Google Scholar] [CrossRef]
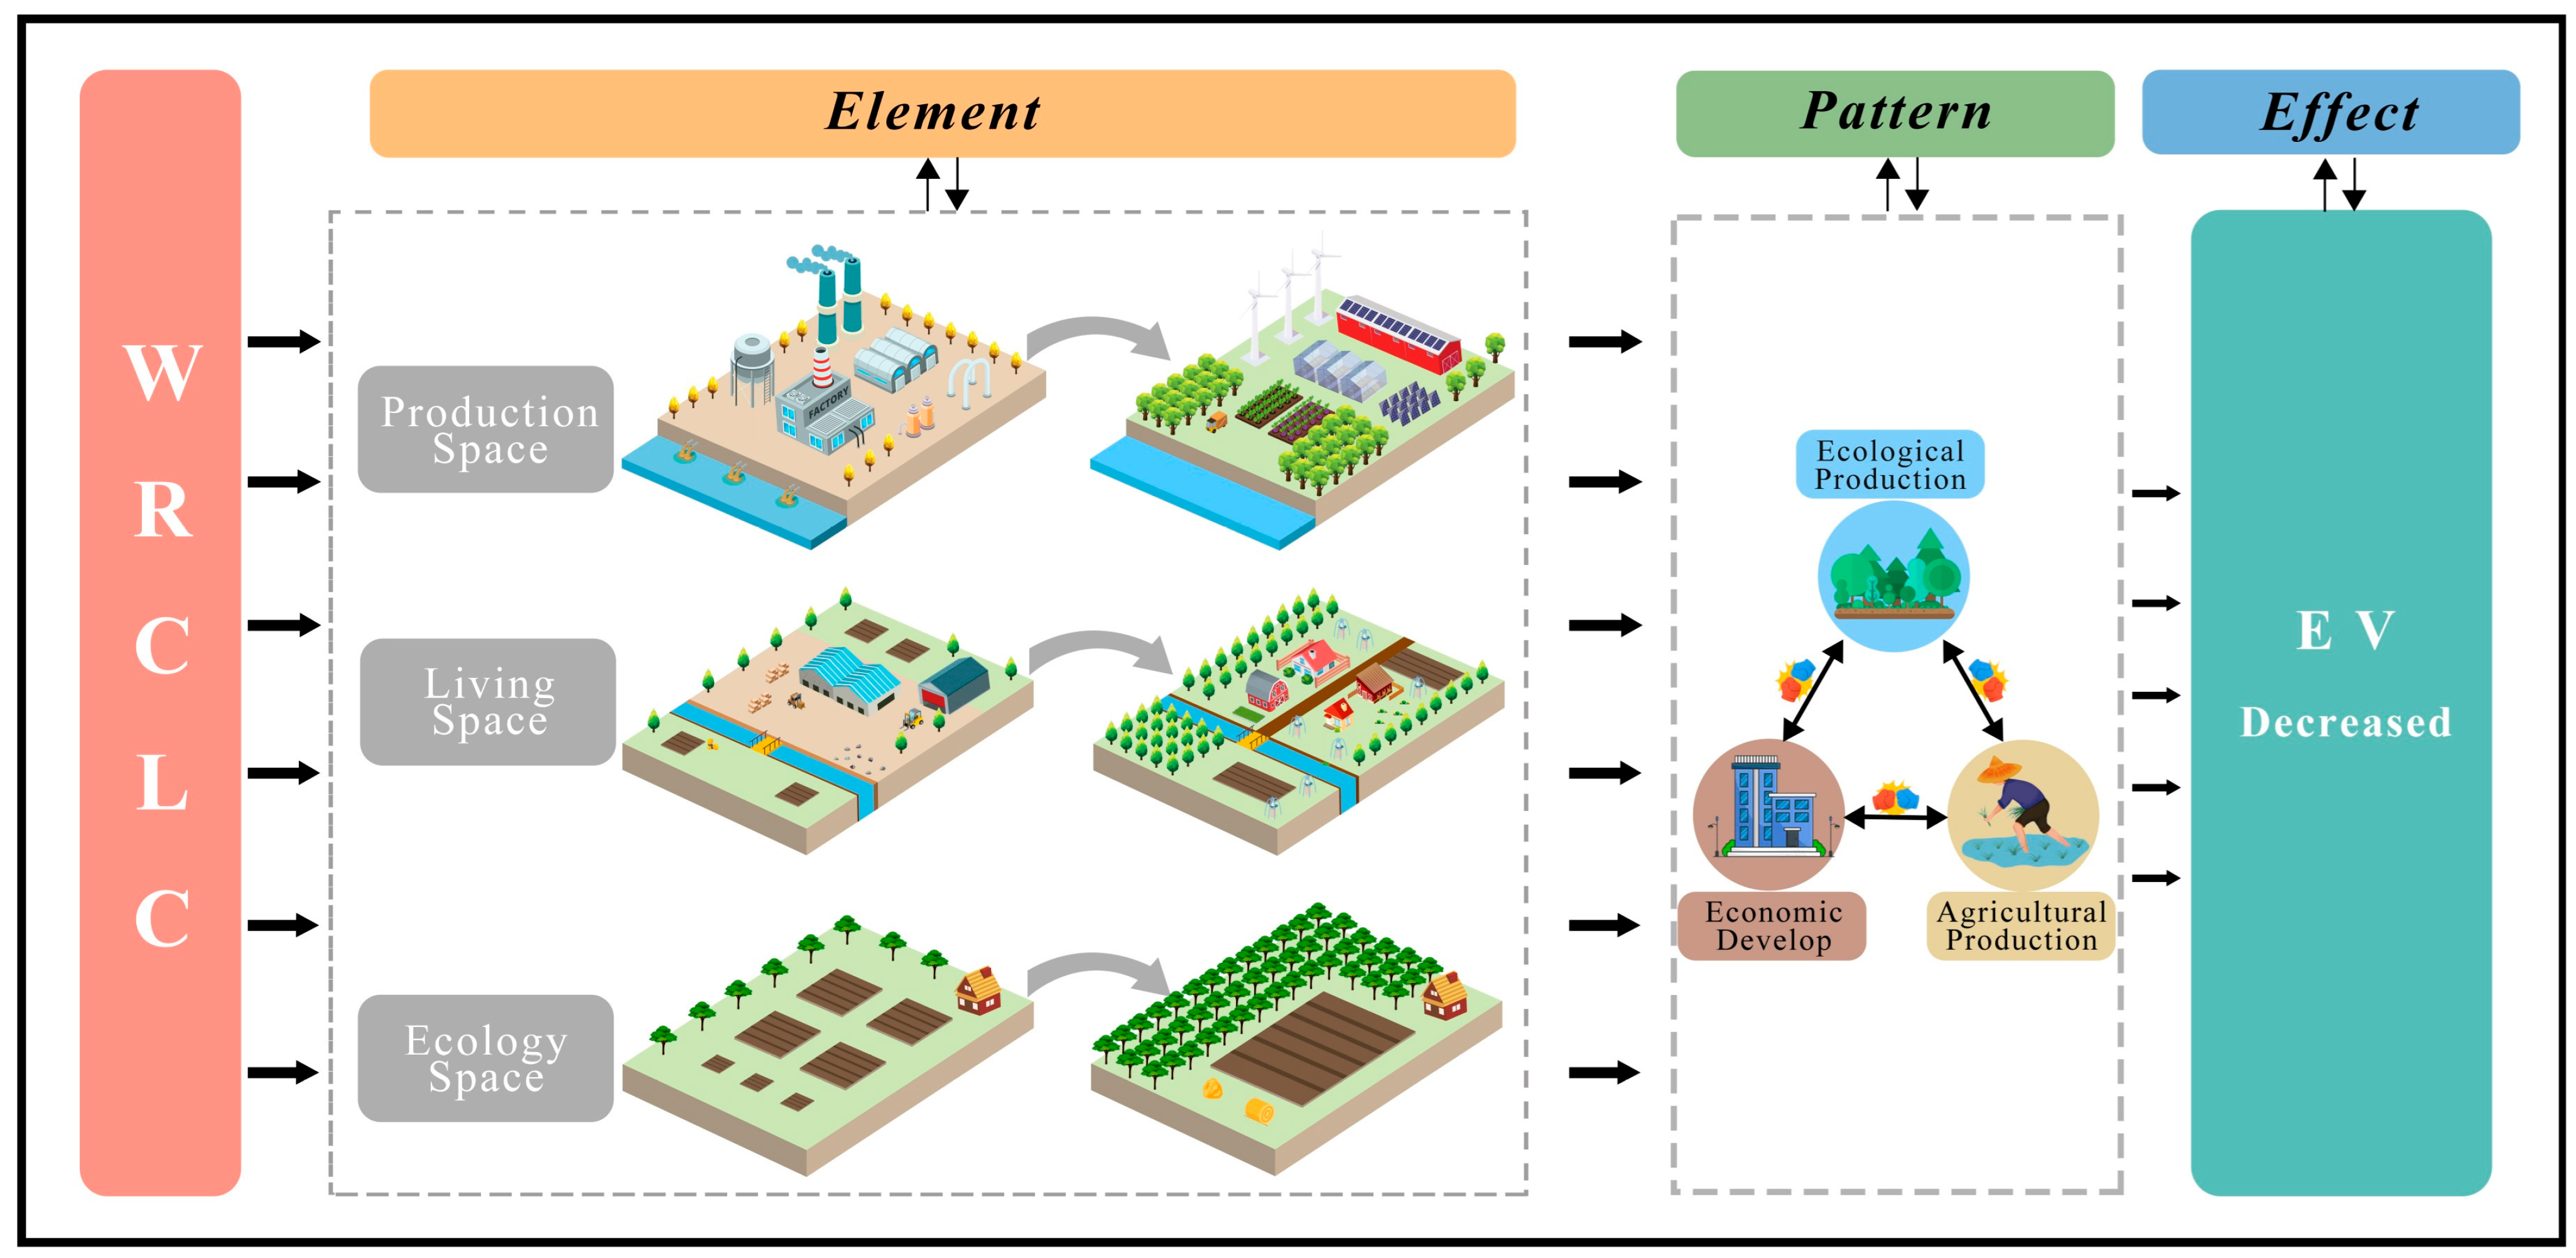
Figure 1. Theoretical analysis framework diagram.
Land 14 02291 g001
Figure 2. Pilot Project of WRCLC and Overview Map throughout Zhejiang Province (The basemap is from the Standard Map Service System of the Ministry of Natural Resources, China (Review No. GS (2019) 1822), and this applies to all maps throughout this study).
Land 14 02291 g002
Figure 3. Spatiotemporal Changes in Ecological Vulnerability in Zhejiang (2015–2022).
Land 14 02291 g003
Figure 4. Parallel Trend Test.
Land 14 02291 g004
Figure 5. The Mixed Placebo Test.
Land 14 02291 g005
Table 1. Key Policy Elements of WRCLC.
PolicyMeasurePurpose
The policy of WRCLC throughout Zhejiang
Province
Compile the village land use planTo provide a planning basis for conducting WRCLC and Ecological Restoration projects
Conducting comprehensive agricultural land consolidationImproving the quality and contiguity of farmland to facilitate the development of modern agriculture
Promote the consolidation of inefficiently and wastefully used construction landTo provide land element support for the integrated development of primary, secondary, and tertiary industries and for coordinated urban-rural development in rural areas
Comprehensively advancing the remediation and restoration of the eco-environmentTo promote the optimization of rural “Production-Living-Ecological” spaces and advance the development of an ecological civilization
Establish a democratic management mechanism for rural landEnsuring the protection of villagers’ legitimate interests during land consolidation
Table 2. EV evaluation index system.
PurposeSub-Objective TierElementIndicatorInfluence
Direction
Weight
EVEcological sensitivityTerrain factorDEM+0.144
Slope+0.070
Climate factortem+0.014
rain+0.064
Ecological
recovery
Landscape distributionCONTAG-0.068
SHDI-0.050
PD-0.122
Vegetation factorNDVI-0.032
NPP+0.043
Ecological
pressure
Human activitiesPopulation density+0.247
Economic development+0.146
Table 3. Mediating Variable Formulas and Descriptions.
Mediating VariableVariable NameFormulaDescription
Ecological
element
“PLE space” dynamics D w = i = 1 6 U i ( t + 1 ) U i t U i t × 1 2 × 100 % D w represents the dynamic degree of “PLE Space,” which is the cumulative sum of the annual changes in the area of six land types,
i represents the six land type areas ( i =1~6), U i t denotes the area of a specific land type in a given year, and U i ( t + 1 ) represents the area of that land type in the following year.
“ecological space” dynamics D w = i = 1 4 U i ( t + 1 ) U i t U i t × 1 2 × 100 % Based on the dynamic degree of “PLE Space,” the areas of two land types have been reduced.
Ecological
pattern
Land use conflicts L U C = C I + F I S I C I denotes the Complexity Index of land use; F I represents the Fragility Index of land use; S I stands for the Stability Index of land use.
Table 4. Descriptive statistical results.
VarNameObsMeanMinMax
EV53200.2410.1440.456
did53200.18701
enterprise density53200.040090.00070.83019
PRES5320990.366902.8931018.108
rhu532076.92670.99281.698
wind53201.6550.7134.825
agriculture53200.0990.0030.295
population53200.0520.0060.407
education53200.1050.0600.189
industry53200.4410.1280.695
GDP53207.8021.80526.737
innovation532042.5685.640262.046
government53200.2070.0460.713
Space53200.008−0.98918.050
Ecospace5320−0.014−1.00717.999
LUC53200.3350.0050.999
Table 5. Baseline regression results.
(1)(2)(3)
EVEVEV
did−0.002 **−0.002 **−0.003 ***
(0.001)(0.001)(0.001)
Enterprise density 0.0350.009
(0.028)(0.028)
wind 0.005 **0.000
(0.002)(0.002)
PRES 0.001 ***0.000 **
(0.000)(0.000)
rhu 0.002 ***0.002 ***
(0.000)(0.000)
agriculture 0.187 ***
(0.023)
population 0.190 ***
(0.036)
education −0.151 ***
(0.036)
industry 0.073 ***
(0.008)
GDP 0.001 **
(0.001)
innovation −0.000
(0.000)
government −0.037 ***
(0.008)
_cons0.254 ***−0.620 ***−0.380 **
(0.001)(0.200)(0.164)
ID_FEYESYESYES
YEAR_FEYESYESYES
N532053205320
R20.3790.4040.489
*** p < 0.01, ** p < 0.05. Standard errors in parentheses.
Table 6. The result of Hybrid Placebo Test.
Coefficientp-Value
Two-SidedLeft-SidedRight-Sided
did−0.0027550.01000.00600.9940
Table 7. Robustness Test.
(1)(2)(3)
WinsorizationPSMPolicy Lag Effect
did−0.003 ***−0.003 ***
(0.001)(0.000)
did−1 −0.004 ***
(0.001)
ControlsYESYESYES
ID_FEYESYESYES
YEAR_FEYESYESYES
N532052894655
R20.4890.9450.410
*** p < 0.01. Standard errors in parentheses.
Table 8. Mediating effect.
(1)(2)(3)
SpaceEcospaceLUC
did0.050 **0.052 **−0.000
(0.025)(0.025)(0.001)
ControlsYESYESYES
ID_FEYESYESYES
YEAR_FEYESYESYES
N532053205320
R20.0170.0150.323
** p < 0.05. Standard errors in parentheses.
Table 9. Spatial autocorrelation.
YearMoran’s IZp
20150.11647.6420.000
20160.09639.6830.000
20170.07731.6870.000
20180.08836.4800.000
20190.09940.6260.000
20200.09940.5660.000
20210.01041.0120.000
20220.01039.4680.000
Table 10. Specification Tests for Spatial Econometric Models.
Statisticp
LM-TestEVDirect effect
Spatial error:−0.006 ***−0.007 ***
Moran’s I(0.000)(0.000)
Lagrange multiplier−0.000 ***
Robust Lagrange multiplier(0.000)
Spatial lag:3.430 ***3.430 ***
Lagrange multiplier(0.038)(0.038)
Robust Lagrange multiplier0.000 ***0.000 ***
LR-Test(0.000)(0.000)
SDM-SAR53205320
SDM-SEMYESYES
Wald-TestYESYES
*** p < 0.01. Standard errors in parentheses.
Table 11. Regression results and effect decomposition of SDM.
(1)(2)(3)(4)
EVDirect effectIndirect effectTotal effect
did−0.006 ***−0.007 ***−0.004 *−0.011 ***
(0.000)(0.000)(0.002)(0.002)
W×did−0.000 ***
(0.000)
Rho3.430 ***3.430 ***3.430 ***3.430 ***
(0.038)(0.038)(0.038)(0.038)
sigma2_e0.000 ***0.000 ***0.000 ***0.000 ***
(0.000)(0.000)(0.000)(0.000)
N5320532053205320
ControlYESYESYESYES
ID_FEYESYESYESYES
Year_FEYESYESYESYES
*** p < 0.01, * p < 0.10. Standard errors in parentheses.
Disclaimer/Publisher’s Note: The statements, opinions and data contained in all publications are solely those of the individual author(s) and contributor(s) and not of MDPI and/or the editor(s). MDPI and/or the editor(s) disclaim responsibility for any injury to people or property resulting from any ideas, methods, instructions or products referred to in the content.