Article

Land Use Simulation and Carbon Storage Driving Mechanisms in Resource-Based Regions Under SSP-RCP Scenarios: An Integrated PLUS-InVEST and GWR-SEM Modeling Approach

1
School of Business, Xinyang Normal University, Xinyang 464000, China
2
School of Earth Atmosphere and Environment, Faculty of Science, Monash University, Melbourne 3800, Australia
3
School of Geographic Sciences, Xinyang Normal University, Xinyang 464000, China
4
Henan Key Technology Engineering Research Center of Microwave Remote Sensing and Resource Environment Monitoring, Xinyang 464000, China
*
Author to whom correspondence should be addressed.
Land 2025, 14(11), 2280; https://doi.org/10.3390/land14112280
Submission received: 21 October 2025 / Revised: 14 November 2025 / Accepted: 17 November 2025 / Published: 18 November 2025
(This article belongs to the Special Issue Land Space Optimization and Governance)

Abstract

Amid China’s dual-carbon goals and widening regional disparities, land-use/cover change (LUCC)-induced volatility in carbon storage (CS) has emerged as a binding constraint on emission reduction and the low-carbon transition in resource-based regions. Yet integrated historical-scenario assessments and rigorous evidence on spatial-heterogeneity mechanisms remain limited, which hampers targeted spatial governance. Using Shanxi Province, a resource-based province, as the study area, this study develops a coupled PLUS-InVEST framework under SSP-RCP scenarios. It integrates spatial autocorrelation, geographically weighted regression (GWR), and structural equation modeling (SEM) to characterize spatiotemporal responses of CS to LUCC and to identify underlying drivers. The results indicate that: (1) Regional CS follows an inverted U-shaped trajectory, initially increasing due to ecological restoration projects and subsequently declining owing to industrial development and urban expansion; (2) By 2030, forestland expansion under SSP126 is projected to enhance CS, whereas accelerated urbanization under SSP585 is expected to intensify CS losses; (3) Significant spatial clustering of CS remains consistent from historical periods to future projections, underscoring its sensitivity to topography, vegetation patterns, and human activities; and (4) CS is jointly shaped by natural and anthropogenic drivers, with DEM and slope providing stable protection, while population density and transport-network configuration cause ongoing disturbances. The study provides an integrated historical-scenario assessment and reveals the underlying mechanisms for resource-based regions, offering quantitative evidence to support optimization of the Ecological Conservation Redline, managing urban growth boundaries, and implementing zoned ecological restoration.

1. Introduction

Driven by rapid urbanization and intensive resource exploitation, land-use/cover change (LUCC) has become a critical factor substantially influencing terrestrial ecosystem carbon storage (CS). Ecosystem CS plays an essential role in mitigating global warming and sustaining the carbon cycle, yet it remains highly vulnerable to disturbances associated with land-use restructuring. Specifically, human activities—including deforestation, expansion of construction land, and transportation infrastructure development—significantly alter vegetation patterns and ecosystem structures, thereby affecting regional biomass distribution and CS. Meanwhile, urbanization and fossil fuel consumption further elevate greenhouse gas (GHG) emissions, intensifying pressures from global warming [1]. Existing research indicates that rapid land cover changes, such as mangrove deforestation, significantly reduce soil organic carbon content and increase regional carbon emissions, underscoring the critical need for maintaining ecosystem stability [2]. To address escalating climate change challenges and meet the emission reduction targets of the Paris Agreement, global efforts to accelerate carbon reduction and carbon neutrality initiatives are intensifying [3,4]. China has explicitly announced its “dual carbon” objectives, underscoring the strategic importance of ecosystem CS in climate governance [5,6]. Resource-based regions, characterized by long-term intensive development, limited ecological carrying capacity, and frequent LUCC, present some of the greatest challenges to achieving these targets [7,8]. Evidence shows that China’s terrestrial ecosystems offset roughly 7–15% of annual national emissions through carbon sinks, providing essential ecological support to the dual-carbon goals [9]. Meanwhile, LUCC reconfigures vegetation mosaics, disrupts habitat connectivity, and changes biomass spatial patterns, significantly affecting CS and carbon sink efficiency, both of which show heightened sensitivity and structural fragility in resource-based regions [10]. Accordingly, a LUCC-based assessment is warranted to characterize spatiotemporal evolution in CS, identify dominant drivers and threshold effects, and conduct forward-looking simulations under various policy scenarios. Such analysis provides empirical evidence and actionable pathways to advance ecological restoration in alignment with dual carbon objectives.
Land-use models are essential tools for analyzing processes of LUCC and their associated ecological impacts [11]. Traditional models, including CA [12], CA-Markov [13], CLUE-S [14], and FLUS [15], have been widely employed for land-use simulation. However, these models exhibit significant limitations regarding the identification of driving factors, patch generation, and scenario responsiveness. Particularly, the CA-Markov model depends excessively on historical trend extrapolation, which restricts its effectiveness in incorporating socioeconomic dynamics and policy interventions. Similarly, the FLUS model demonstrates limited accuracy in patch-scale simulation, constraining its applicability to complex land-use scenarios [16,17]. In contrast, the PLUS model utilizes a random forest algorithm to automatically identify and prioritize key driving factors, integrates an effective patch-generation mechanism, and applies a multi-objective constraint framework that enables flexible adaptation to varying socioeconomic and policy scenarios. Consequently, the PLUS model provides a more accurate representation of land-use transformations and spatial pattern dynamics, significantly enhancing its interpretability and practical applicability in diverse contexts [18].
Meanwhile, methods for assessing CS have continuously evolved from traditional field-based inventory techniques [19] through remote sensing applications [20], to the current simulation modeling frameworks [21]. Field sampling and biomass-conversion approaches deliver high accuracy but have limited spatial representativeness and incur high costs [22,23]. Remote-sensing retrievals provide broad coverage but are hindered by spatiotemporal inconsistencies and limited algorithmic robustness [24]. Given practical constraints related to accuracy, data availability, and computational cost, InVEST is commonly used for CS simulations due to its simplicity, efficiency, and ability to generate easily interpretable results. Its carbon sequestration module enables historical reconstruction and scenario projections for CS using land-class carbon densities and land-use layers [25,26].
However, converting “simulable LUCC” into “governable CS responses” hinges on effective scenario design. Existing PLUS-InVEST coupled applications predominantly rely on static extrapolation scenarios based on historical trends (e.g., natural development, farmland conservation, ecological priority), insufficiently accounting for the dynamic interplay among climate change, socioeconomic pathways, and policy feedbacks [27,28]. To address this gap, the Shared Socioeconomic Pathways (SSPs) [29] and Representative Concentration Pathways (RCPs) [30] under the Coupled Model Intercomparison Project Phase 6 (CMIP6) provide a unified, multivariable, integrated framework that includes population, economic activity, energy, and land use [31,32]. However, existing studies were predominantly conducted on global [33], national [34], or watershed scales [35]. At the provincial level, especially within resource-dependent regions, systematic investigations on how differences in the intensity of land-use conversion under varying SSP–RCP scenarios influence the scale of CS responses are still lacking. This specific research gap remains unaddressed in the current literature.
Existing LUCC projection models effectively elucidate how driving factors influence land expansion; however, they fall short in directly capturing the spatial heterogeneity of CS. To comprehensively explore the driving mechanisms underlying the spatiotemporal dynamics of CS, researchers commonly employ gray relational analysis [36] and geographical detector methods [37] to identify key drivers and their interactions. Nevertheless, these methods primarily rely on statistical correlations among variables, limiting their ability to clarify causal pathways or differentiate direct from indirect effects. In recent years, geographically weighted regression (GWR) and structural equation modeling (SEM) have been increasingly integrated into CS studies. Specifically, GWR characterizes spatial heterogeneity, while SEM elucidates causal structures among variables [38,39]. The integration of the GWR and SEM frameworks allows for a more precise characterization of spatial non-stationarity and a clear distinction between direct and indirect effects, thereby enhancing the capacity to analyze complex causal chains. Accordingly, the key research question of this study is whether, under different SSP–RCP scenarios, conversions of cropland and grassland into construction land at varying magnitudes result in significant differences in CS responses. We then identify the spatial heterogeneity and pathway structures associated with these differences.
Shanxi Province, a representative resource-dependent region in China, has historically relied on coal mining and heavy industry as primary drivers of its economic growth. This prolonged dependence has resulted in imbalances in land-use structure, ecosystem degradation, and a significant reduction in CS capacity [40]. At the same time, accelerated urbanization has intensified the conversion of cultivated land and grassland into built-up areas, thereby further constraining ecological space. Moreover, the distinctive topographic variability and ecological fragility of the Loess Plateau make CS particularly vulnerable to disturbances caused by LUCC, making Shanxi Province a highly relevant case study for assessing these dynamics. This indicates that differences in land conversion intensity under real-world conditions in Shanxi provide verifiable empirical evidence for analyzing relationships among scenario settings, conversion intensity, and the magnitude of CS responses. Given this context, Shanxi Province is selected as our study area, and an integrated analytical framework (SSP-RCP × PLUS-InVEST × GWR-SEM) is developed. More specifically, the SSP-RCP multi-scenario framework drives the PLUS model, facilitating the prediction of land-use transitions and simulation of spatial patterns. The InVEST model is then used to quantitatively assess changes in CS. Finally, the GWR-SEM method detects spatial heterogeneity and reveals the underlying causal mechanisms. This integrated approach establishes a systematic linkage across the full pathway—from climate and socioeconomic scenarios to land-use patterns, CS responses, and policy feedback loops. It involves quantitatively evaluating the spatiotemporal impacts of land-use transformations—particularly conversions from cultivated land and grassland to built-up land—on CS and carbon sequestration efficiency across multiple scenarios, and investigating potential threshold effects. Additionally, the study identifies spatial clustering patterns and temporal evolution trends of CS, distinguishing stable high-CS regions from ecologically vulnerable areas. Furthermore, an in-depth analysis of direct and indirect pathways, as well as critical interactions among various driving factors, is performed, providing robust scientific insights to inform differentiated land-use management and targeted carbon governance policies. Compared to previous studies that focus on static extrapolation and single-factor correlation analysis, this study integrates scenario simulation, dynamic processes, and causal mechanisms at the provincial scale. By comparing response magnitudes across different scenarios, the analysis provides direct empirical evidence addressing the previously identified knowledge gaps, thereby enhancing the interpretability and policy relevance of the results. Consequently, this approach offers actionable insights for optimizing territorial spatial planning and advancing the coordinated achievement of the dual carbon goals.

2. Methodology

2.1. Study Area

Shanxi Province, an essential national energy base and ecological functional zone in China, covers approximately 156,700 km2, consists of 11 prefecture-level cities, and is characterized by complex and diverse terrain (Figure 1). It is China’s largest coal reserve region, accounting for over one-quarter of the nation’s total reserves, thus serving as a pivotal hub for coal production and distribution. However, prolonged, and intensive coal mining activities and the associated infrastructure development, including open-pit mining and the construction of transportation networks, have substantially disrupted vegetation cover and altered land surfaces. These disturbances have triggered severe soil erosion and ecological degradation, significantly diminishing the CS capability of regional ecosystems. Considering Shanxi’s dual characteristics of resource dependence and ecological fragility, a thorough investigation into the impacts of LUCC on the regional CS is important. Such research provides valuable practical insights for enhancing regional ecological compensation frameworks and promoting green, low-carbon transitions, while also offering broader theoretical contributions and applicable paradigms for addressing global ecological and sustainability challenges.

2.2. Data

The datasets comprise land-use and driving factors, as detailed in Table 1:
(1)
Land-use: The data spanning from 2005 to 2020 are reclassified into six categories.
(2)
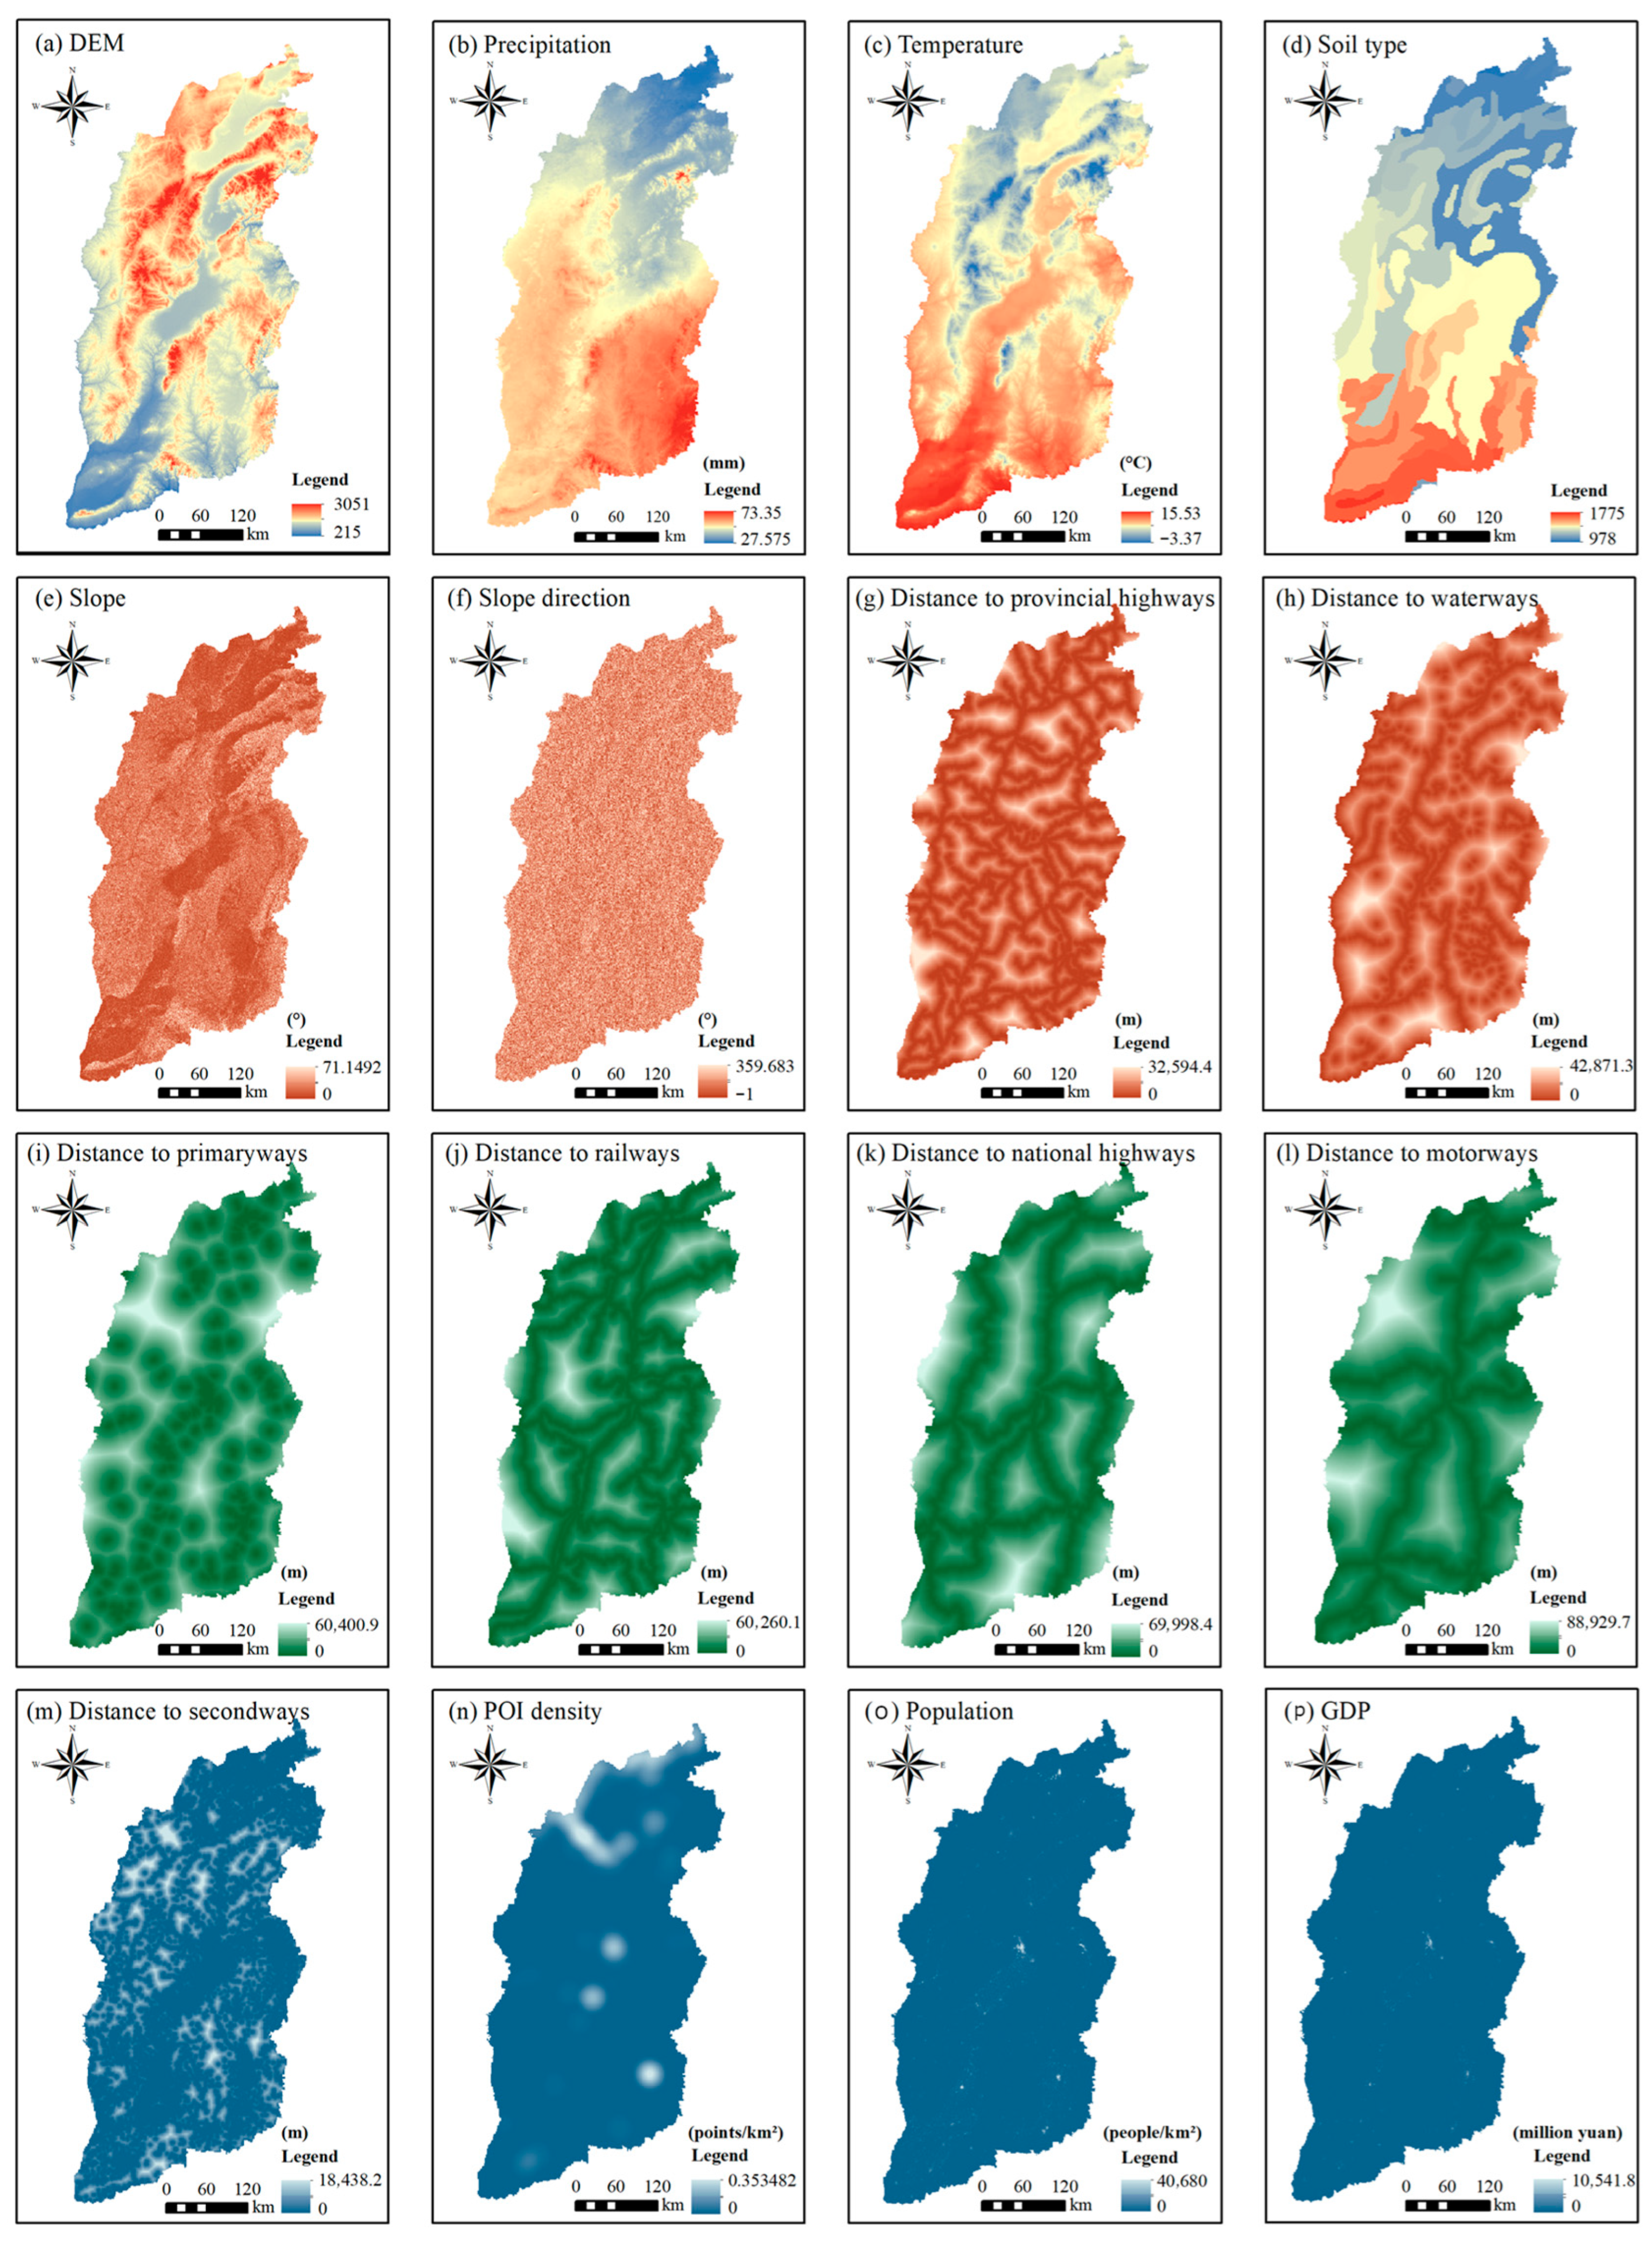
Driving-factors: They include climatic and environmental, socioeconomic, and POI data. The Euclidean distance method is employed to compute distance-related driving factors, such as proximity to roads and waterways. Kernel density estimation is applied to preprocess various POI-related driving factors (Figure 2).

2.3. Methods

2.3.1. PLUS Model

The PLUS model is an advanced tool for simulating LUCC. It integrates a driving-factor analysis framework based on the Land Expansion Analysis Strategy (LEAS) with a CA-based on Multiple Random Seeds (CARS). In this study, land-use data from 2010 and 2015 are utilized to train the model and identify patterns of land expansion. Subsequently, by combining climatic, socioeconomic, and POI data from Shanxi Province, a comprehensive driving-factor system is established. On this basis, the 2010 land cover serves as the initial reference for generating the 2020 land-use map. The simulation incorporates anticipated demand shifts, a transition matrix (Table 2), and neighborhood factor weights (Table 3). Neighborhood parameters are set according to the formulation proposed by Wang et al. (2019) [41]. The simulation results are validated by the Kappa coefficient and accuracy, which reach 92.17% and 94.52%, respectively, demonstrating high reliability and accuracy. To ensure spatial consistency between the PLUS and InVEST models, all spatial datasets are uniformly resampled to the 1 km resolution. In the meantime, along the temporal dimension, the analysis uses validated model parameters and sets the 2020 land-use map as the latest baseline, and simulates land-use pattern changes in Shanxi Province to 2030 under multiple scenarios. This preprocessing provides a unified, comparable dataset for subsequent CS estimation and ecological response analysis.

2.3.2. Scenario Setting Based on CMIP6

The CMIP6 framework serves as a prominent international platform for multi-model climate research, thereby significantly advancing global climate change assessments. Compared to CMIP5, CMIP6 introduces integrated SSPs and RCPs, emphasizing the importance of socioeconomic development trajectories in driving future climate scenarios. In this study, scenario setting and future LUCC projections utilize the Land-Use Harmonization dataset (LUH2) from CMIP6. Although LUH2 is a global-scale dataset, it explicitly considers China as a distinct region during its construction. Thus, the LUH2-China subset accurately reflects China’s land-use development trends under different scenarios [42]. LUH2 provides comprehensive historical and projected land-use data spanning from 2015 to 2100, encompassing eight scenario combinations derived from five SSPs and seven RCP targets, thereby effectively supporting multi-scenario LUCC simulations.
Drawing on a comprehensive evaluation of potential future development trajectories, the analysis adopts three representative scenarios—SSP126, SSP245, and SSP585—for simulations. The SSP126 scenario (SSP1-RCP2.6) reflects a green and sustainable development path, emphasizing inclusive socioeconomic transformation and low-emission conditions. This trajectory aligns with China’s long-term low-carbon strategy, embodied in its “dual-carbon” goals. The SSP245 scenario (SSP2-RCP4.5) represents a middle-of-the-road pathway that builds on existing socioeconomic structures and development paradigms. It emphasizes a balance between economic growth and ecological governance, consistent with China’s dual emphasis on “high-quality development” and the advancement of “ecological civilization” In contrast, the SSP585 scenario (SSP5-RCP8.5) denotes a high-emissions, resource-intensive pathway marked by continued reliance on fossil fuels, accelerated industrialization, and a sharp increase in greenhouse-gas emissions. It serves as an extreme case to assess the intensity of land-use transitions and the potential risks to CS under rapid economic expansion.
Considering the discrepancies between the LUH2 land classification system and the GlobeLand30 dataset, data harmonization and conversion are crucial for enhancing simulation accuracy and spatial compatibility. Following the established practices [43], the LUH2 data are first reclassified and resampled to align with the GlobeLand30 classification scheme and spatial resolution. Subsequently, GlobeLand30’s 2020 land-use data, featuring higher spatial accuracy, are adopted as the initial simulation layer, with corresponding land-use area values used to replace the original LUH2 estimates to reduce initial biases. Lastly, land-use area change rates derived from the LUH2 dataset are dynamically employed to calibrate land-use demand projections, facilitating robust scenario-based simulations of future land-use configurations. It is noteworthy that the reclassification and resampling processes may lead to a certain loss of detail regarding land-type transitions or introduce minor spatial biases. Nevertheless, these deviations do not substantially affect the overall trends of land-use change or alter the main conclusions of this research.

2.3.3. CS Estimation with InVEST

The carbon sequestration module in InVEST enables the spatially explicit analysis of LUCC-induced variations in ecosystem CS (Table 4). The total CS is calculated using the following equation [44]:
C i = C a b o v e + C b e l o w + C s o i l + C d e a d
C t o t a l = i = 1 n C i × A i
where i denotes the land-use type, Ci represents the corresponding carbon density—including aboveground biomass carbon (Cabove), belowground biomass carbon (Cbelow), soil organic carbon (Csoil), and dead organic matter carbon (Cdead). Ai refers to the area associated with each land-use type. Additionally, n is the total number of LUCC categories, and Ctotal denotes the total regional CS.

2.3.4. Spatial Exploratory Analysis

Moran’s I is employed to evaluate the spatial clustering intensity of attribute values across the province. The formula is given as follows:
I = n i = 1 n j = 1 n w i j y i y ¯ y j y ¯ i = 1 n j = 1 n w i j y i y ¯ 2
where n denotes the number of spatial units, yi and yj represent the attribute values, and wij denotes the spatial weight.
Hot spot clustering is conducted using Getis-Ord Gi* statistics to identify spatial patterns in ecosystem CS and to reveal spatial heterogeneity. This method evaluates local spatial associations based on Z-scores and corresponding p-values. High positive Z-scores indicate hot spots (areas of high sensitivity), whereas low negative Z-scores signify cold spots (areas of low sensitivity). The formula is expressed as follows.
G i * = j = 1 n w i j x j x ¯ j n w i j S n j = 1 n w i j 2 j = 1 n w i j 2 n 1
x ¯ = j = 1 n x j n
S = j = 1 n x j 2 n x ¯ 2
where xj represents the attribute value of spatial unit j; wij denotes the spatial weight; n is the total number of spatial units, and S is the standard deviation.

2.3.5. Analysis of CS Driving Mechanisms Based on GWR-SEM

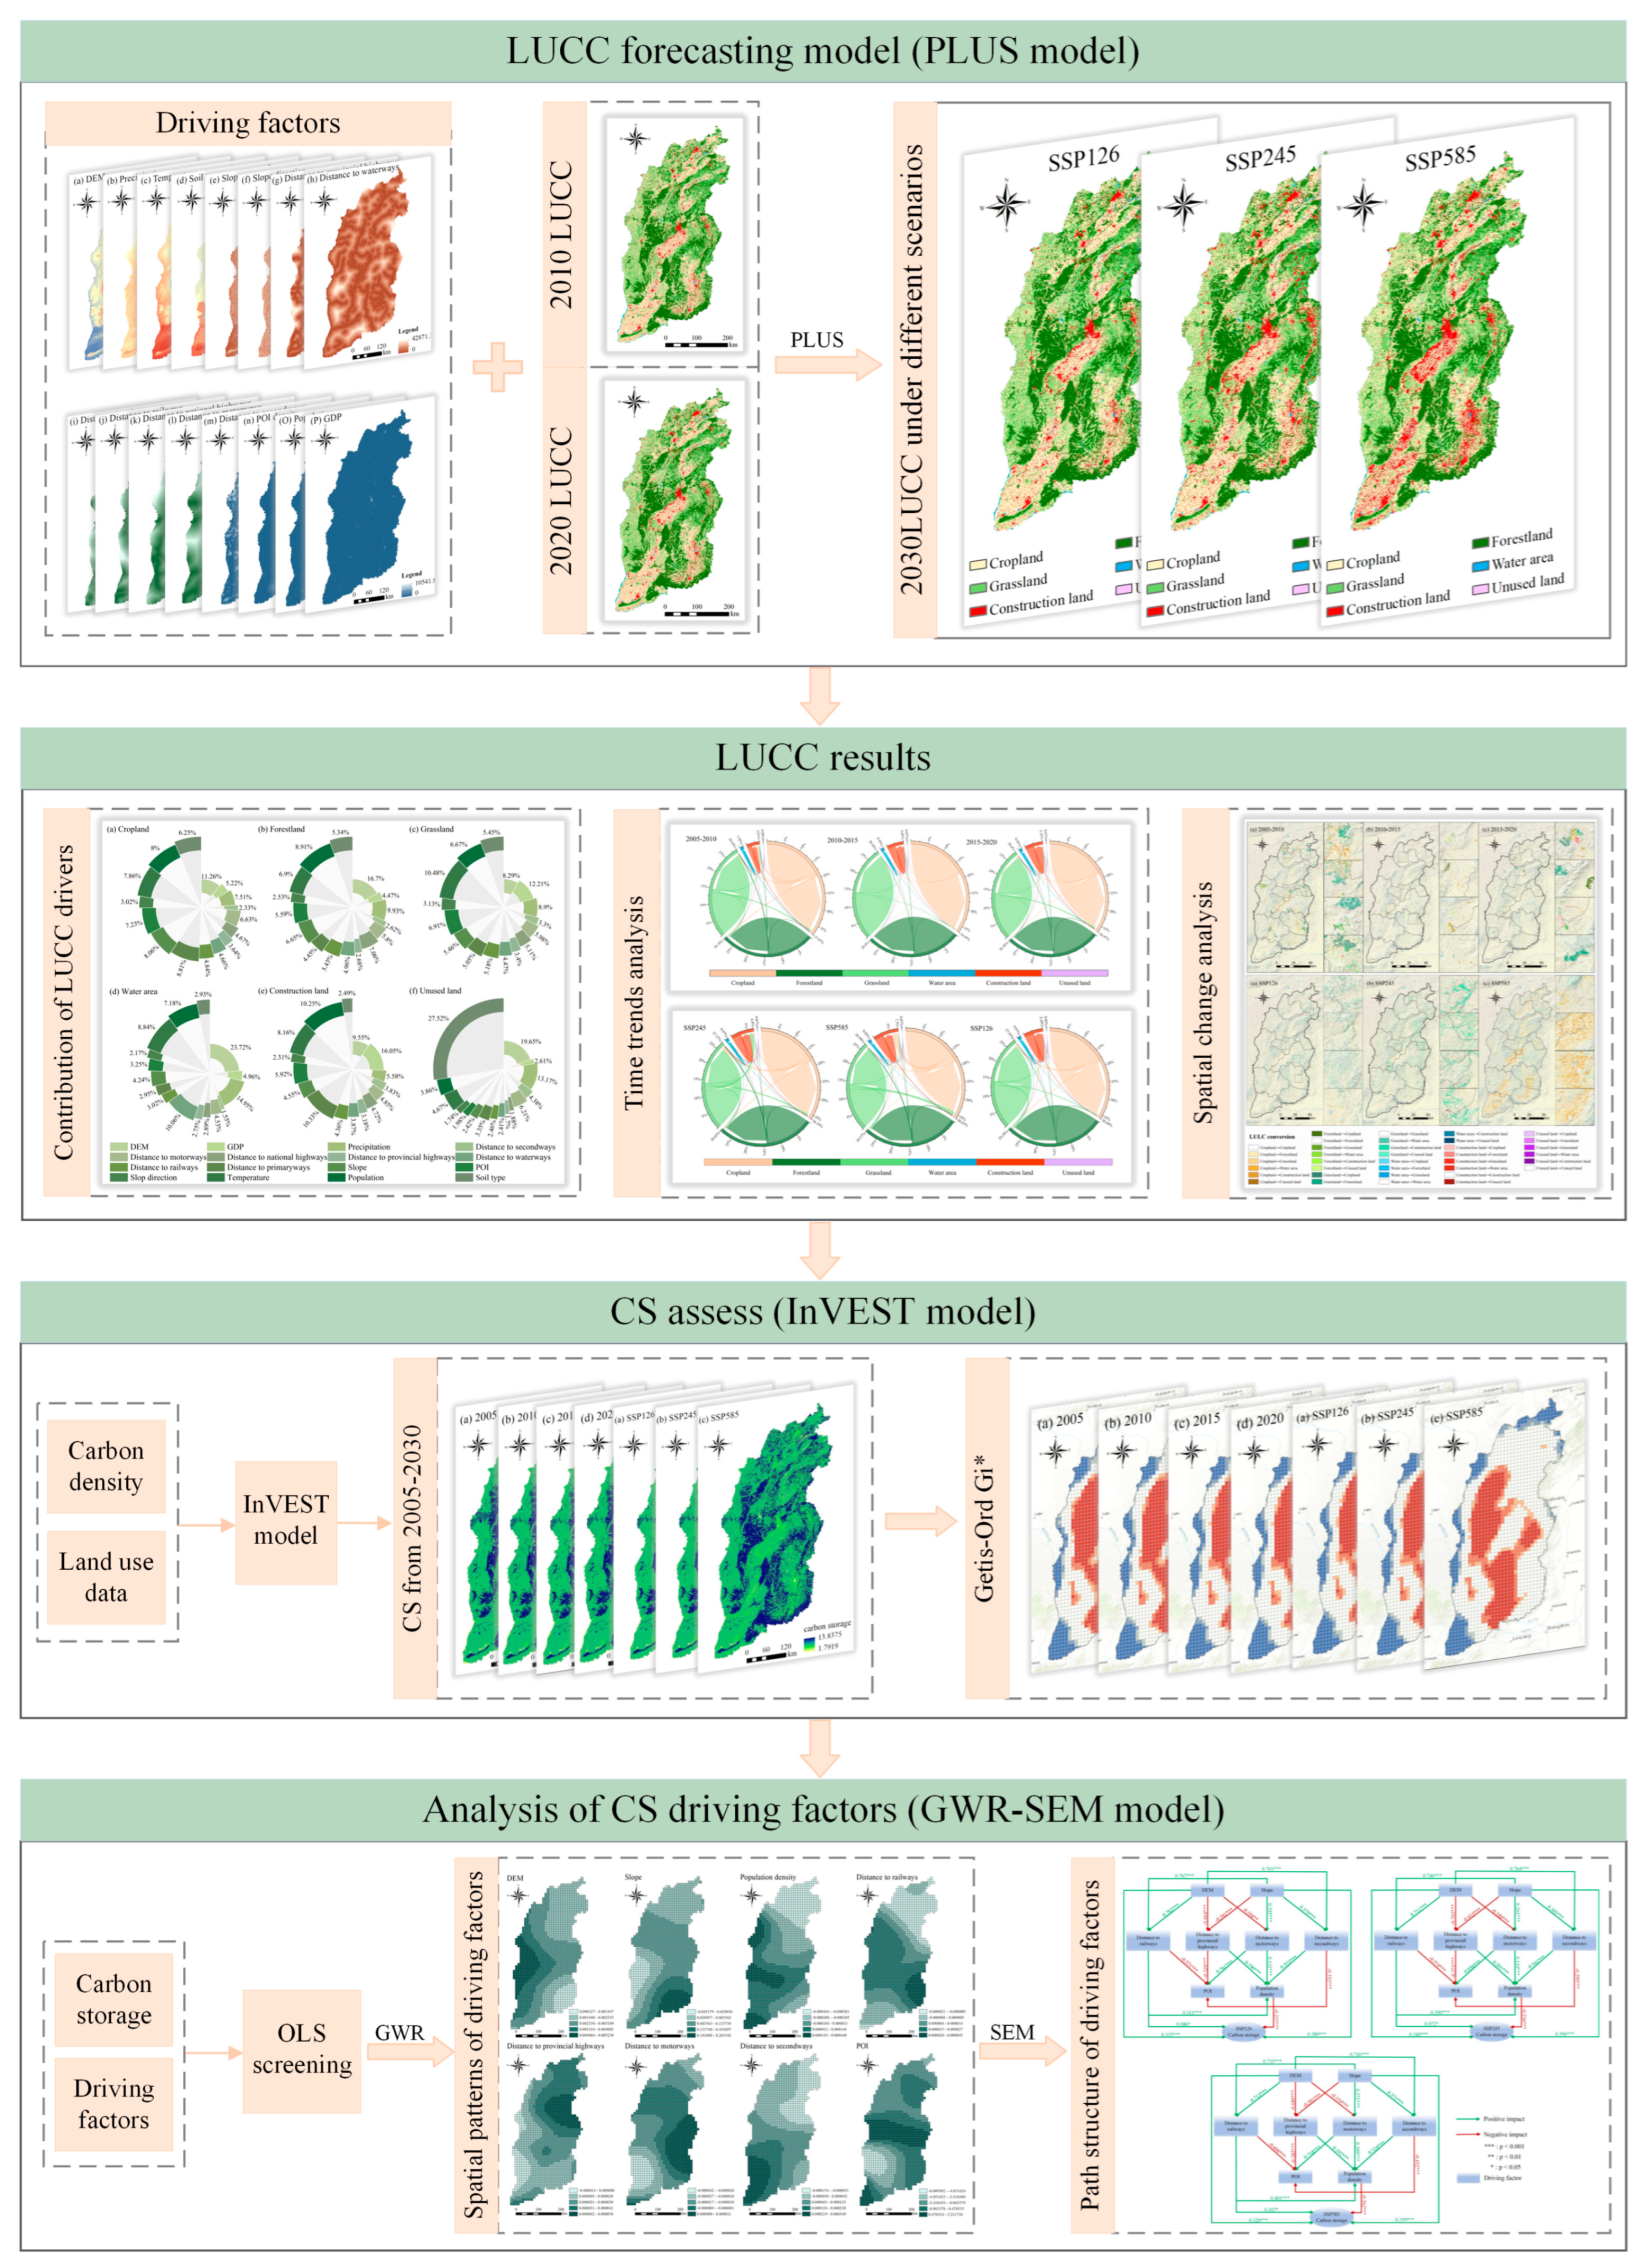
To identify key factors and their underlying mechanisms influencing the spatial distribution of CS, this study develops an integrated analytical framework combining GWR and SEM [45]. Specifically, GWR characterizes the spatially heterogeneous influences of driving factors on CS, while SEM further elucidates the direct and indirect path relationships among variables, thus enhancing explanatory power regarding causal structures. First, ordinary least squares (OLS) regression is used to screen variables and ensure model robustness. Variables with a variance inflation factor (VIF) above 5 or insignificant coefficients are excluded. The selected variables are then incorporated into the GWR model to estimate local regression coefficients for each factor, revealing spatial variations in their respective influence. Next, the local coefficients from GWR are used as inputs for SEM to identify the direct and indirect effects of each driving factor on CS. All variables are observed variables and are uniformly standardized to eliminate interference caused by differences in measurement units during model estimation. Ultimately, the integrated approach effectively identifies path-specific effects of each driving factor on CS, providing robust quantitative evidence for analyzing mechanisms underlying CS dynamics. The research framework is shown in Figure 3.

2.3.6. Uncertainty and Sensitivity Analysis

To enhance the robustness of the interpretation of model results, this study controls and evaluates the reliability of prediction outcomes at two levels. First, two replicate simulations of the PLUS model are conducted to assess the influence of random processes. The results indicate that variations in the Kappa coefficient and overall accuracy between replicate simulations remain within 0.5%, indicating minimal sensitivity of predictions to initial randomness. Scenario differences primarily occur in spatial patterns and relative trend changes, rather than in the dispersion of absolute-value errors. Second, regarding input parameters—including carbon density, transfer costs, and neighborhood weights—these parameters are derived from established literature values and regional empirical estimates rather than representing structural modifications in the model itself. Therefore, this study adopts a framework based on “relative change and spatial patterns” as the main indicator, ensuring methodological consistency and parameter definition uniformity across scenario comparisons. This approach prevents parameter variations from being misinterpreted as structural differences. Previous studies further confirm that the spatial structural consistency of PLUS model outputs typically outweighs sensitivity to absolute-value accuracy across varying spatial scales and regional contexts [46], which is consistent with the stability demonstrated by repeated simulations in this study.

3. Results

3.1. Analysis of Drivers of Land-Use Change

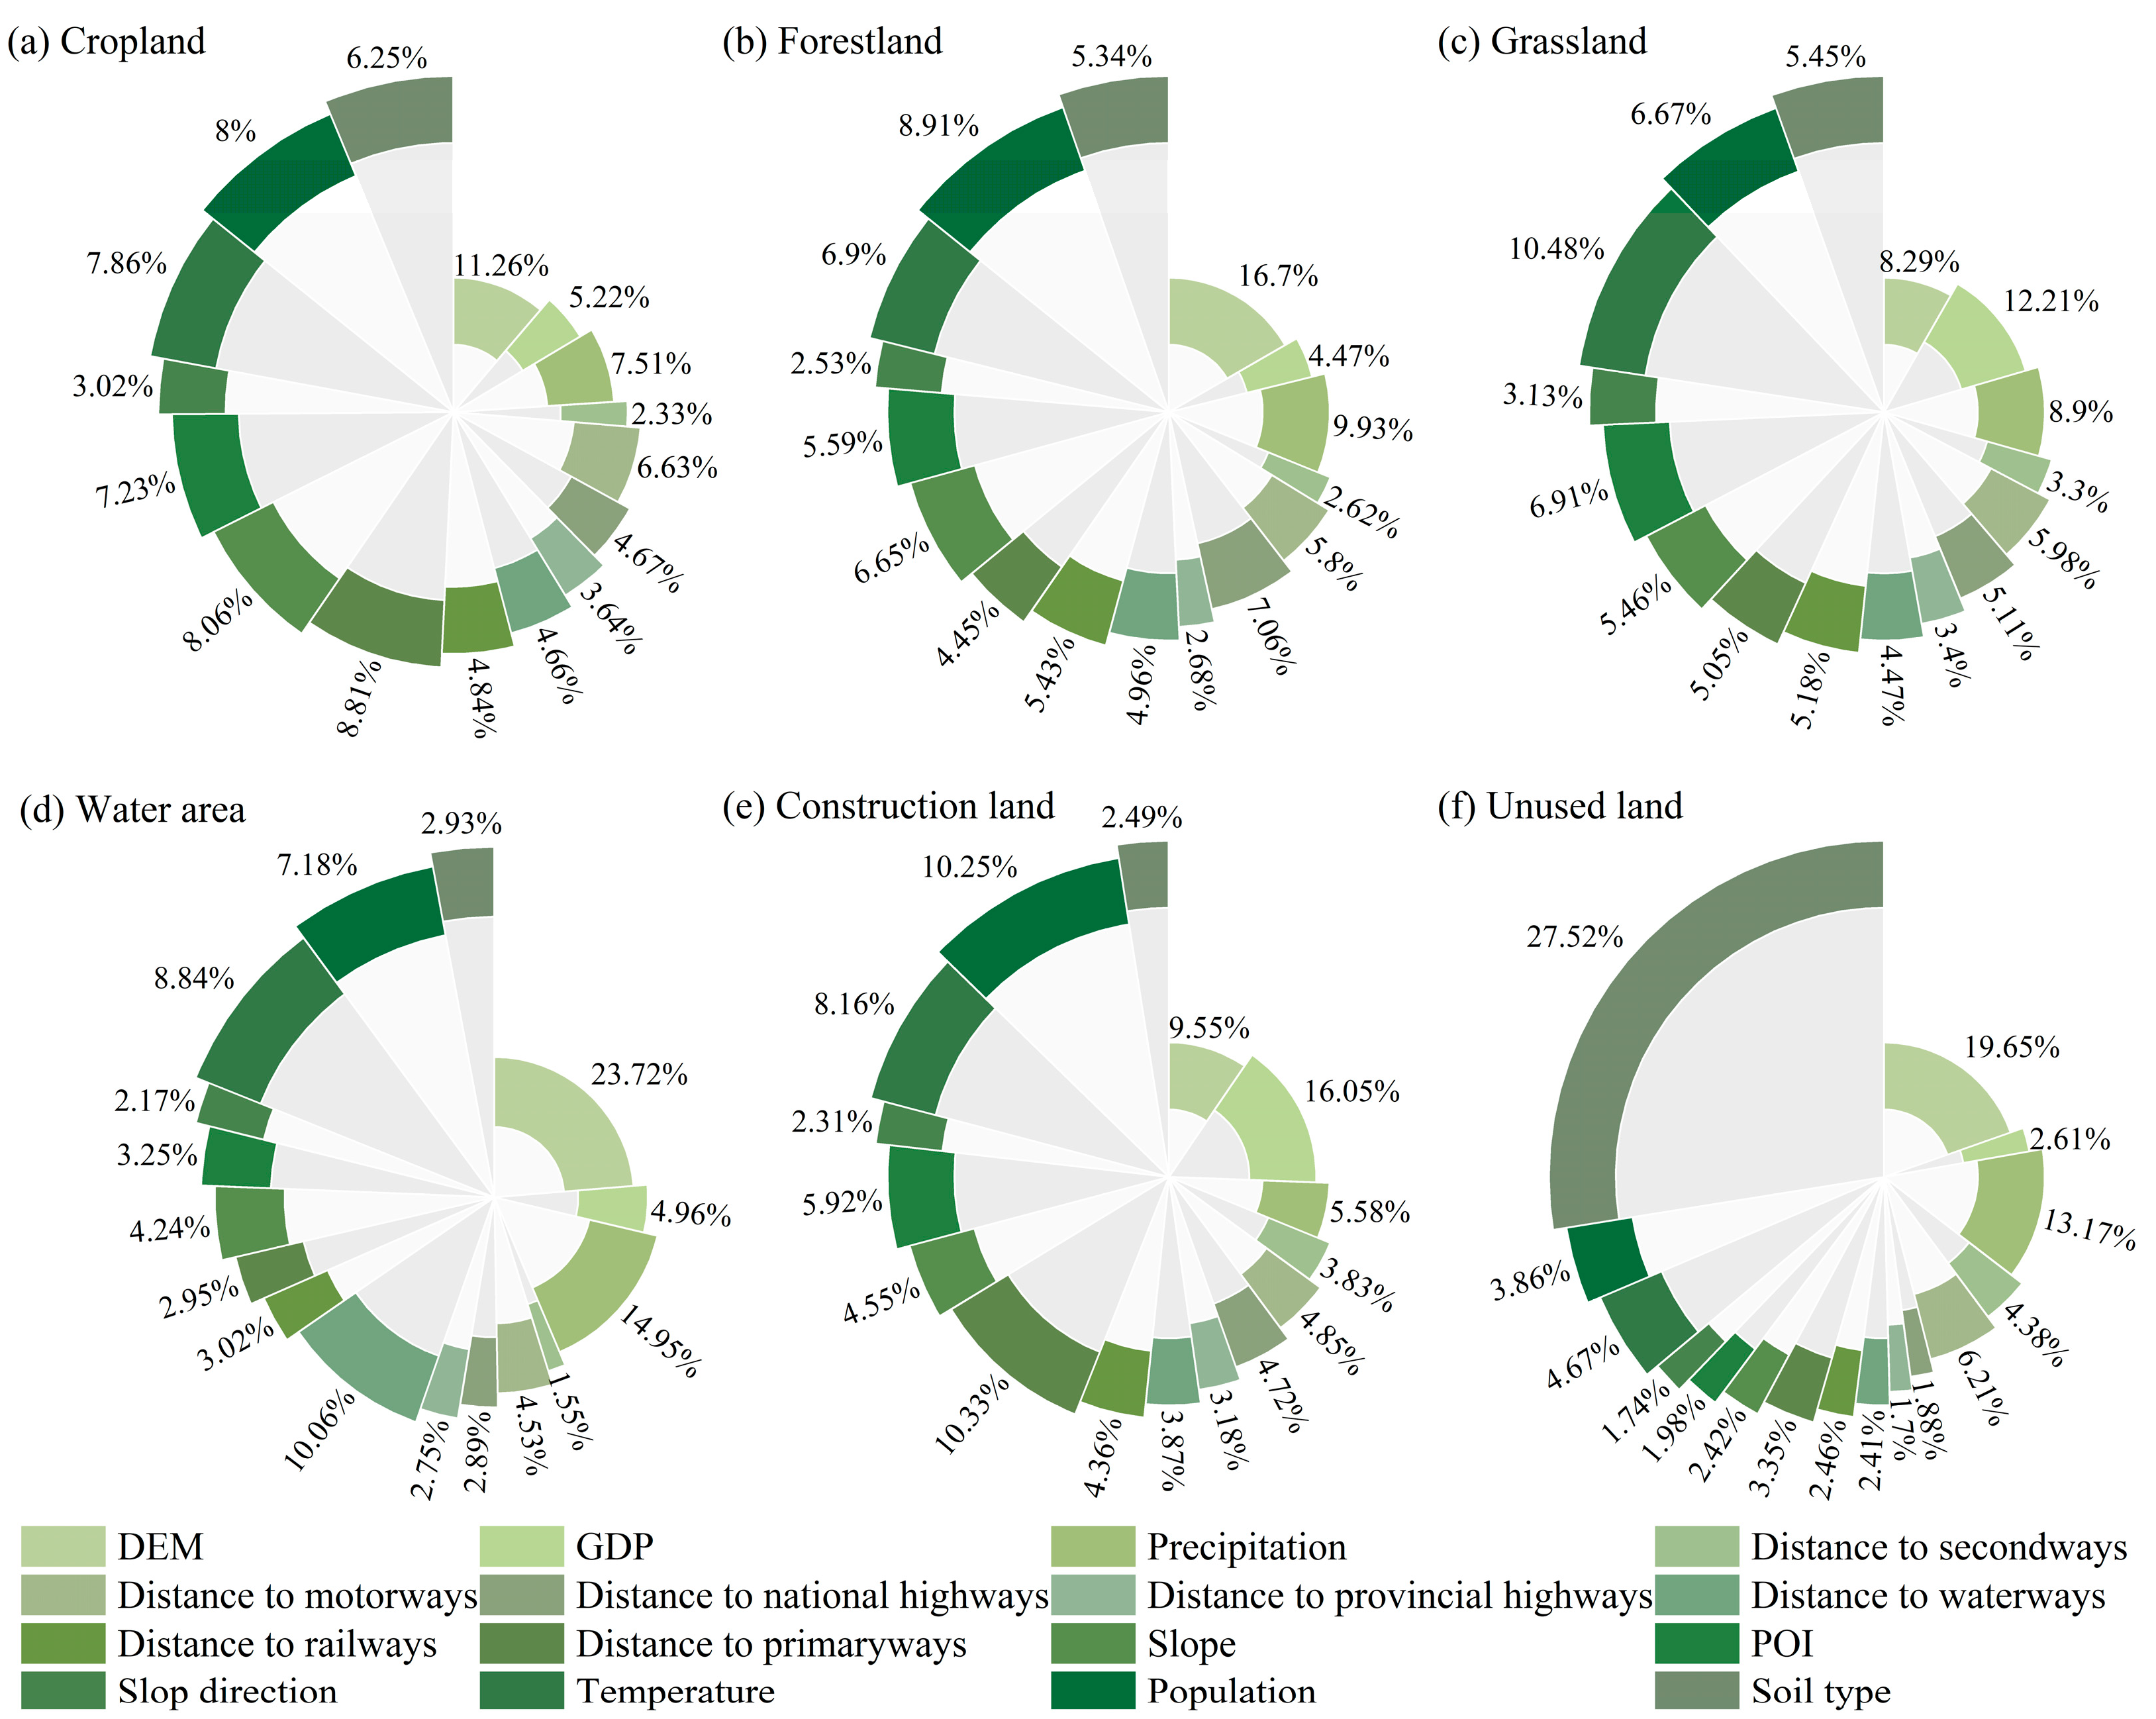
LUCC strongly influences regional ecosystem structure and function, to which resource-based regions are particularly sensitive. By applying the PLUS model with an embedded random forest, we identify the dominant drivers of land-use transitions in Shanxi Province and quantify their relative contributions (Figure 4). Results indicate that land-use dynamics reflect the combined effects of natural conditions and human activities, with the dominant drivers varying markedly across land-use classes.
Specifically, natural conditions, particularly DEM, slope, and temperature, primarily drive cropland conversion. DEM and slope set the basic constraints on land suitability for development. Temperature affects the sustainable use of cropland indirectly by influencing crop growth cycles and yield stability. Among socioeconomic variables, proximity to primary roads and population density strongly accelerate conversion from cropland to construction land, largely via urban expansion. Forestland transitions primarily depend on DEM, precipitation, population density, and proximity to national highways. Forests tend to occur at higher elevations with ample rainfall and limited human activity. The expansion of transportation infrastructure has increased accessibility, especially near urban–rural interfaces and along major arterial roads. This raises the likelihood that forestland will be converted to cropland or construction land. Grassland change reflects strong interactions between socioeconomic and natural drivers, with GDP, temperature, and precipitation being dominant. Urban expansion in high-GDP areas accelerates the conversion of grassland into construction land. Grassland ecosystems are highly sensitive to climate variability. Fluctuations in temperature and precipitation can destabilize them. Changes in water areas depend mainly on natural conditions, including DEM, precipitation, distance to waterways, and temperature. Water bodies are sensitive to environmental change and vulnerable to disturbances from tourism and water-management projects. These pressures increase the likelihood of conversion to other land-use types. Construction land expansion represents a prominent feature of current LUCC trends and is primarily driven by GDP, proximity to primary roads, and population density. Taken together, economic growth, transport accessibility, and population concentration drive urban spatial expansion. This underscores the dominant role of socioeconomic development in reshaping land-use patterns. Transitions involving unused land are constrained by soil types, DEM, and precipitation. Such land typically occurs at high elevations, in dissected terrain, or in arid zones with poor resource conditions and low development suitability, and soil type is the primary limiting factor. Even so, advances in ecological restoration and urban-fringe development reveal potential to convert unused land to forestland, grassland, or construction land.
In summary, land-use conversions display clear type-specific heterogeneity driven by diverse factors. These findings improve the understanding of LUCC dynamics and provide insights for improving regulatory mechanisms in resource-based regions.

3.2. Land-Use Dynamics and Multi-Scenario Modeling

3.2.1. Characteristics of LUCC from 2005 to 2020

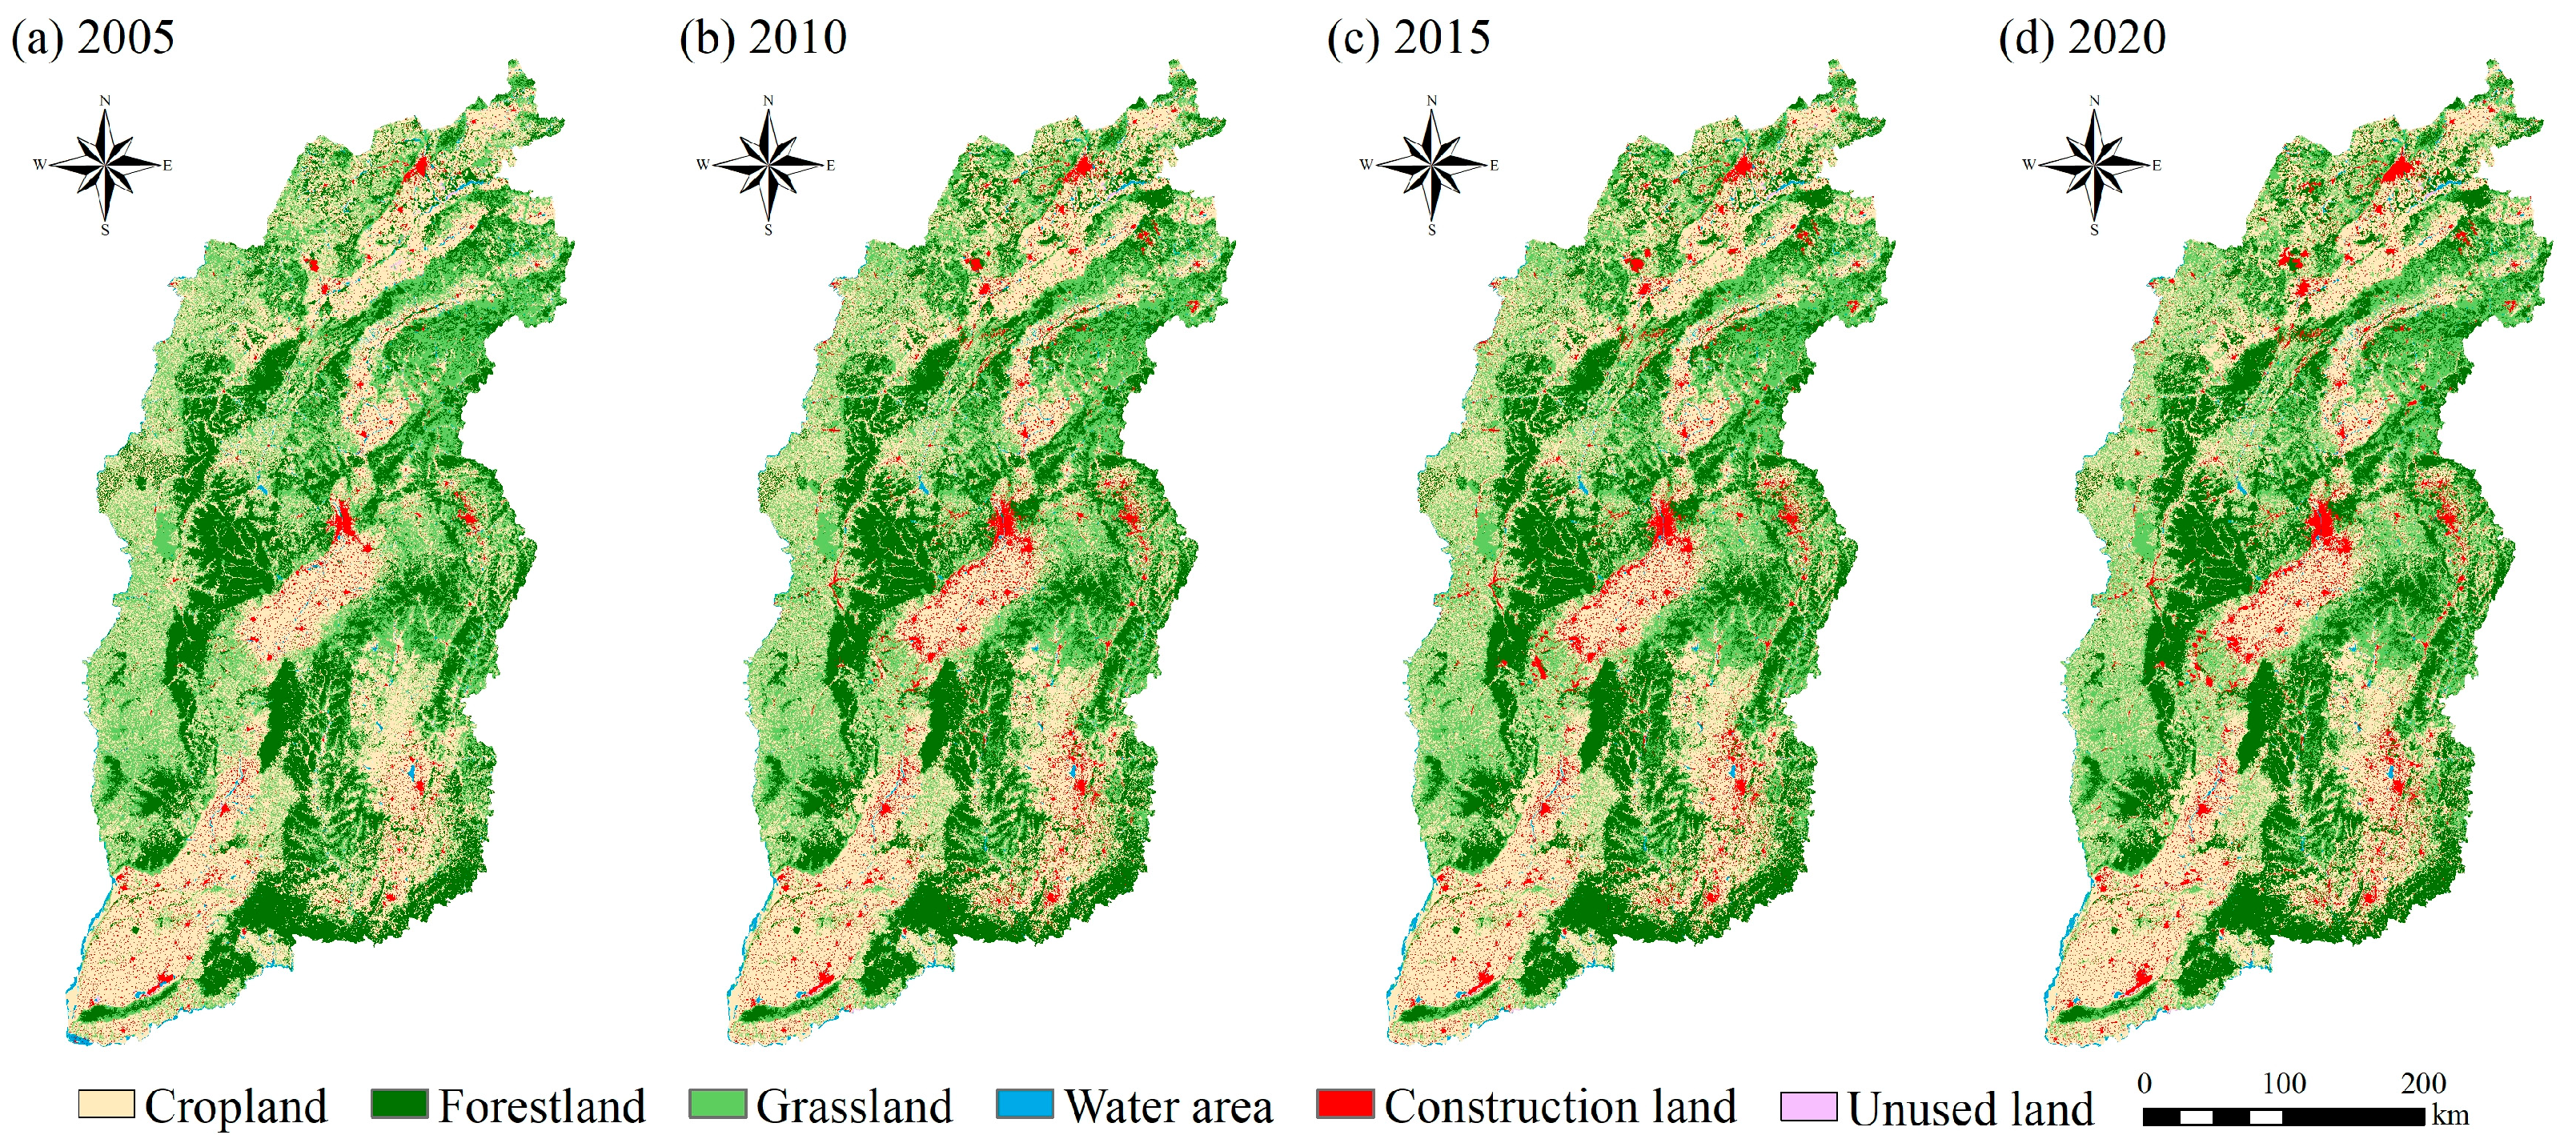
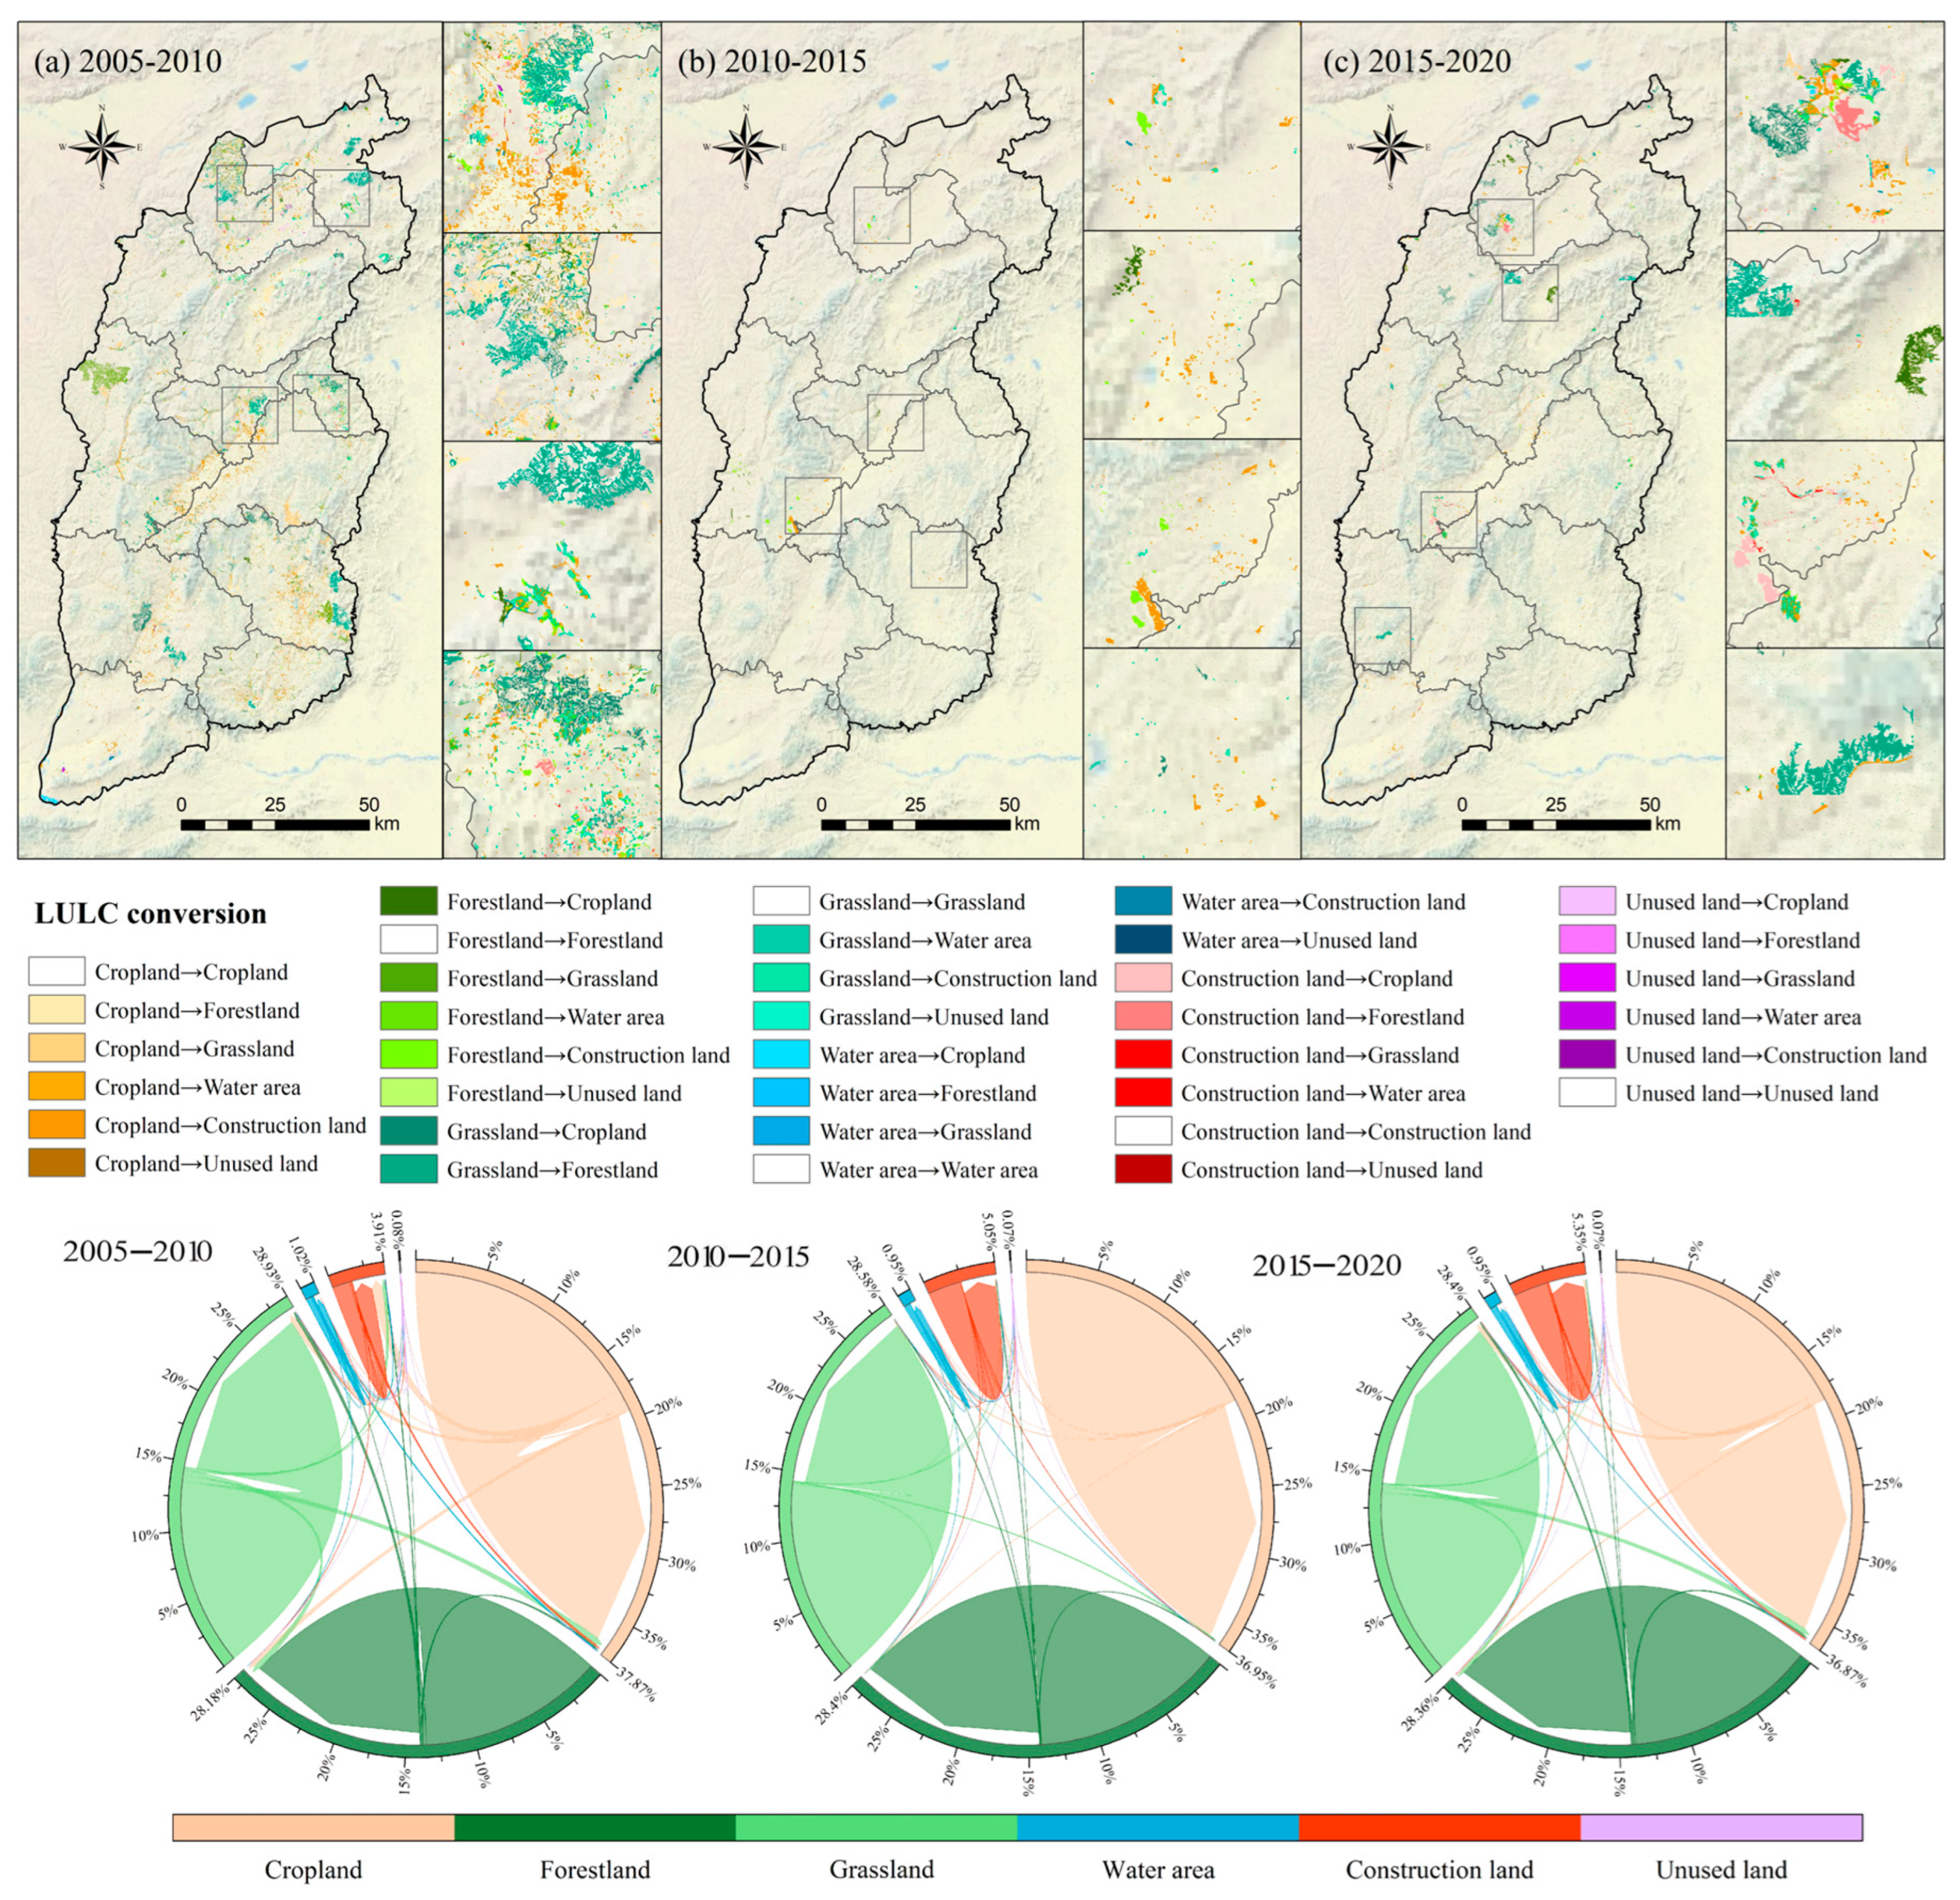
From 2005 to 2020, Shanxi Province’s land use is characterized by the predominance of cropland, followed by forestland and grassland, whereas construction land expands rapidly and water area and unused land contract overall (Table 5, Figure 5). Specifically, cropland consistently accounts for over 38% of the total area and is spatially concentrated in Yuncheng and Changzhi. Forestland and grassland each occupy approximately 29%, with forestland primarily distributed around Lvliang and Changzhi, and grassland mainly located in Datong and Xinzhou. Construction land constitutes less than 10% but shows significant concentration in Taiyuan and Datong. Structural adjustments are evident during this period: cropland and grassland continue to decline, with the sharpest decreases occurring between 2005 and 2010, at about 0.89% and 0.44% per year, respectively, followed by a subsequent slowdown. Forestland shows a fluctuating upward pattern (initial increase, subsequent decrease, then increase), growing by about 0.11% per year. Construction land maintains steady expansion, growing by about 4.17% per year, the fastest among all the land types. Water area shows an overall decline, decreasing at first and rebounding later. Unused land decreases concurrently but at a lower rate.
From 2005 to 2020, LUCC in Shanxi Province features sustained the expansion of construction land, the contraction of cropland and grassland, and a steady increase in forestland due to ecological restoration efforts (Figure 6). Construction land grows mainly in and around Taiyuan, Datong, and Changzhi. The principal drivers are urbanization, industrialization, and energy development. The surge peaks in 2005–2010, when new construction land forms clusters around Taiyuan and Datong. Over the same period, ecological programs expand forestland in the Lvliang and Taihang ranges. By contrast, grassland declines markedly in resource-rich areas such as Datong, Shuozhou, and Yangquan due to mineral extraction. From 2010 to 2015, the overall growth slows. Even so, cropland and forestland continue to be converted to construction land. Between 2015 and 2020, urban development accelerates again and intensifies grassland-to-construction conversions. At the same time, policy-guided restoration converts part of the degraded grassland to forestland. In terms of conversion flows, 2890.51 km2 of cropland is converted, nearly half to construction land. Over the same period, 1579.33 km2 of grassland is converted, mainly to cropland and forestland. Among the areas that become grassland, more than 60% were previously cropland, indicating strong spatial coupling between cropland and grassland.

3.2.2. Multi-Scenario LUCC Projections for 2030

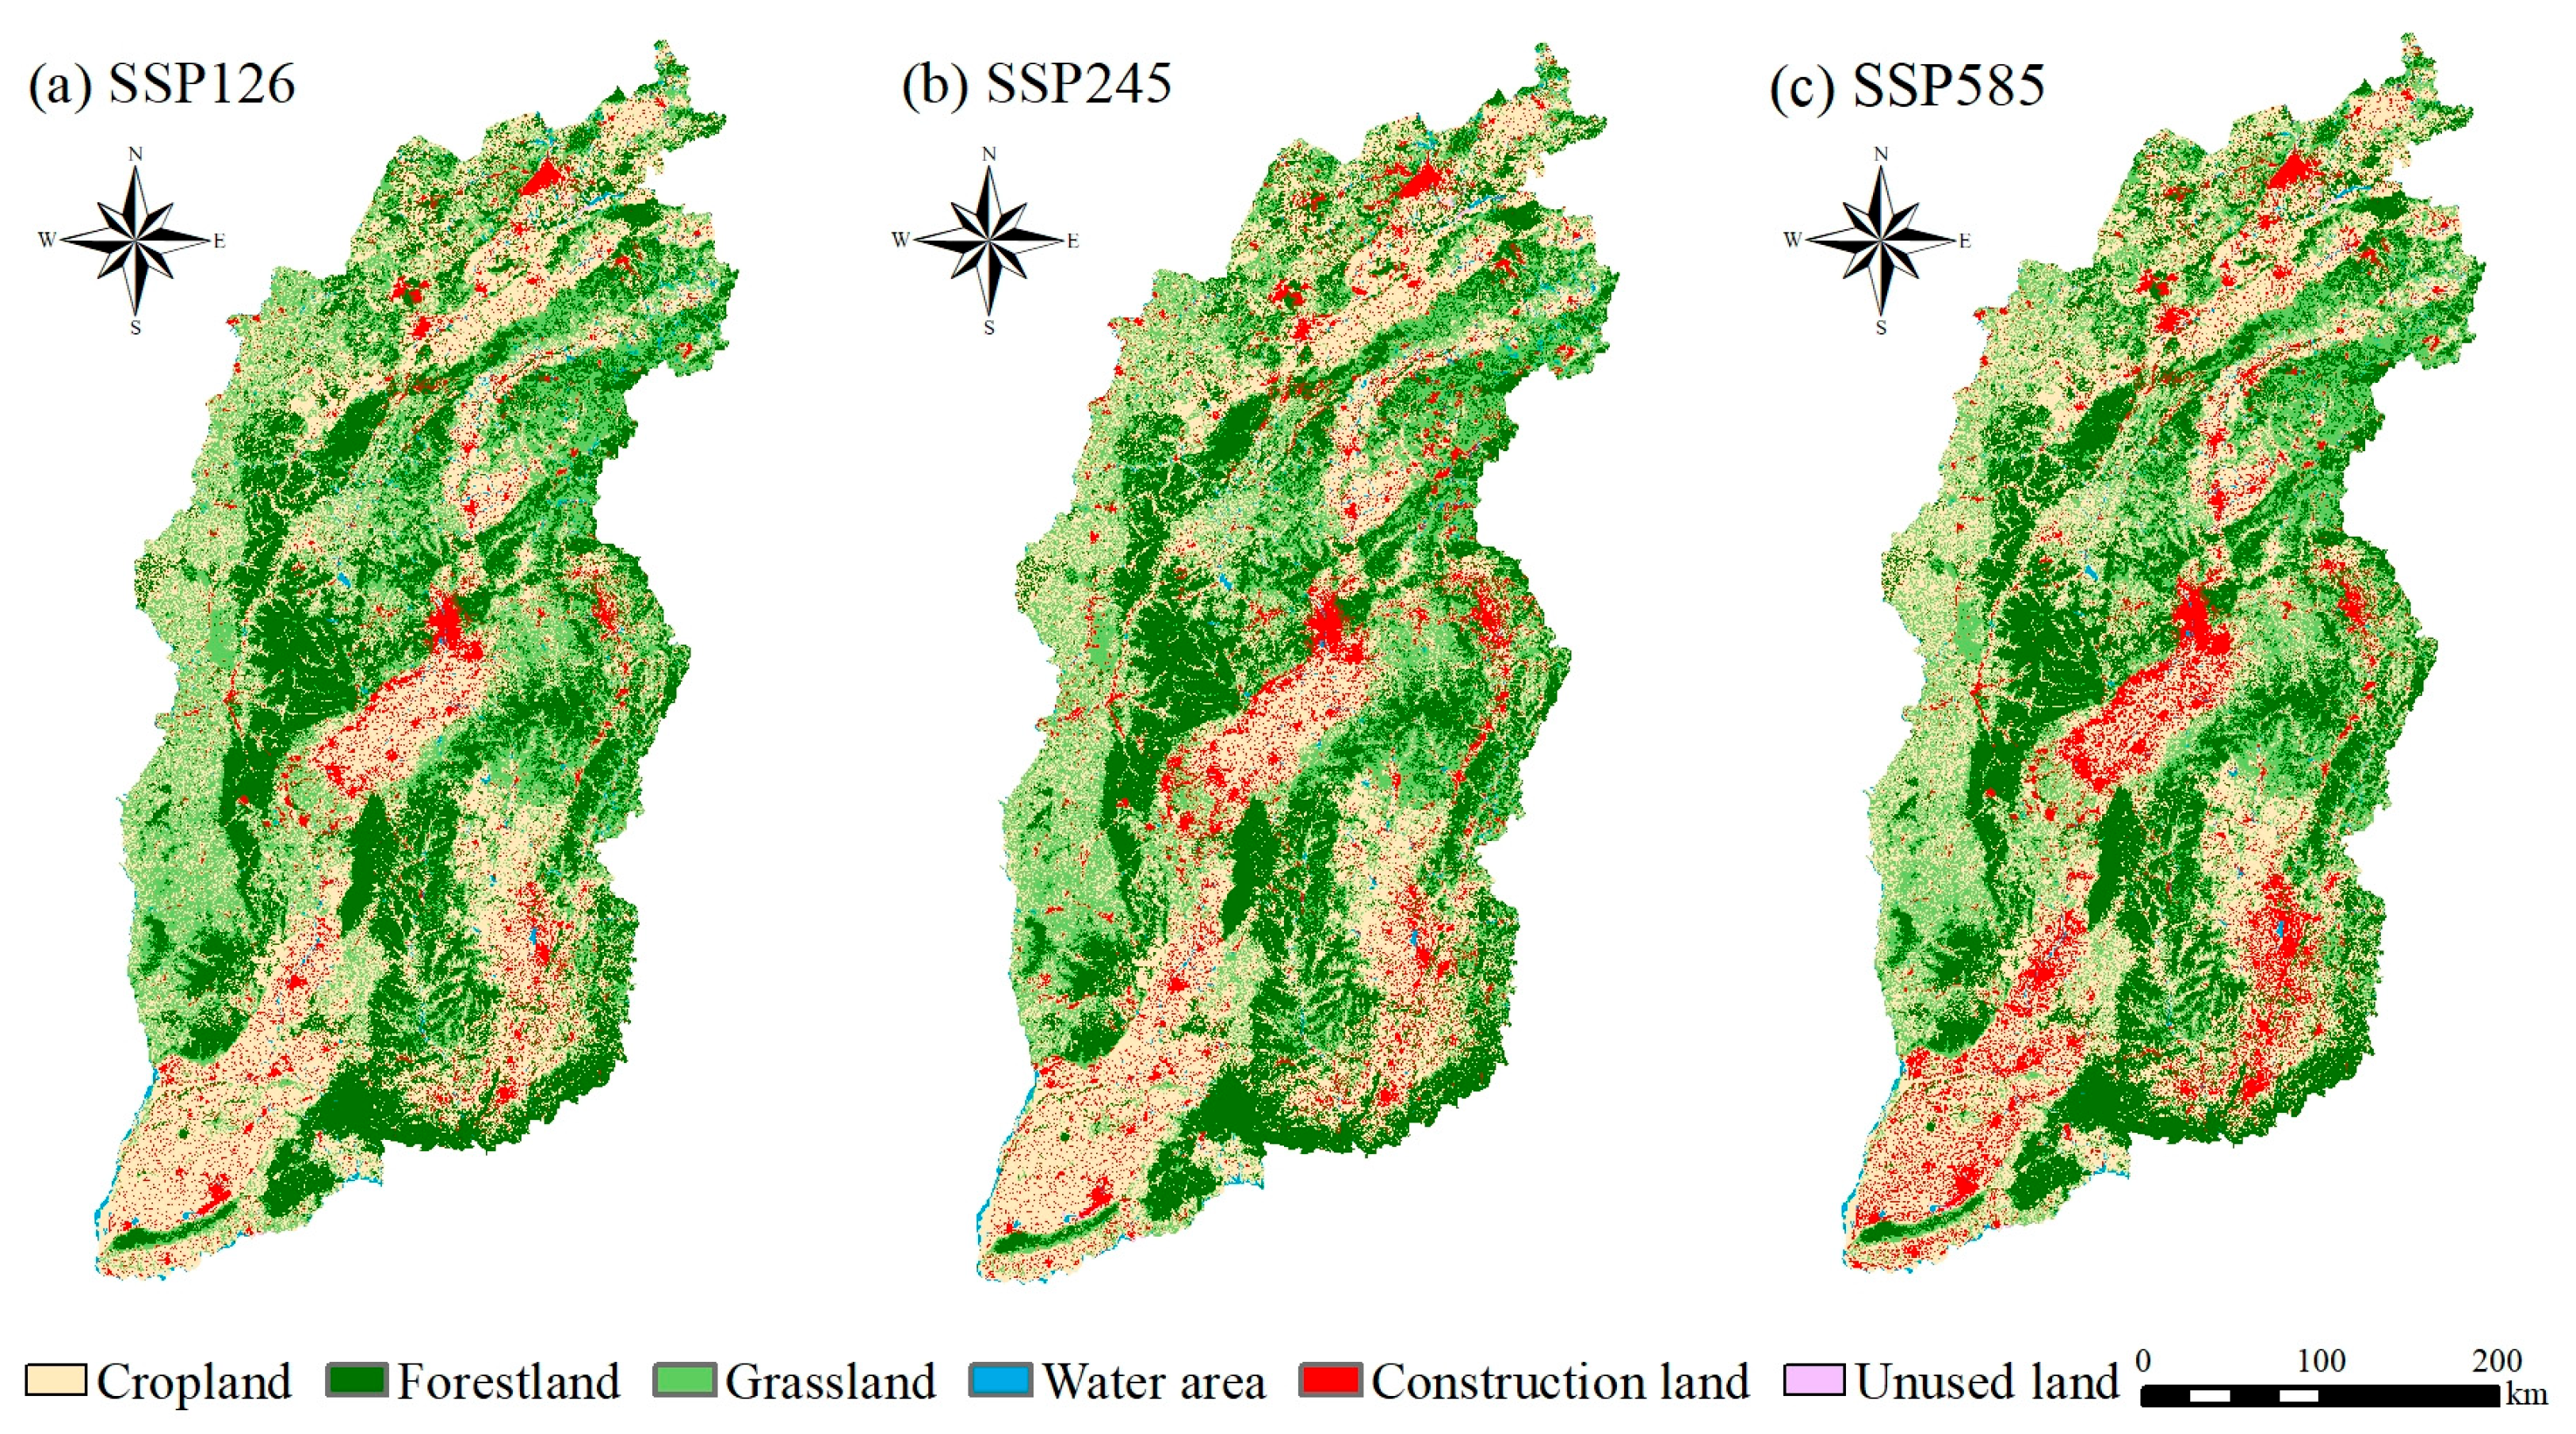
Figure 7 presents simulated land-use outcomes for Shanxi Province under SSP-RCP scenarios in 2030, and Table 6 reports the corresponding areas and changes. Under SSP126, forestland, water area, and construction land increase by 2871.33 km2, 195.60 km2, and 590.47 km2, respectively, while cropland, grassland, and unused land decrease by 2672.22 km2, 943.39 km2, and 41.81 km2. New construction land clusters along the axis linking Taiyuan, Datong, and Changzhi and its periphery; forestland expands in the Lvliang and Taihang ranges; grassland loss is concentrated in the Datong-Shuozhou area. Under SSP245, construction land increases by 4094.17 km2 relative to 2020, whereas cropland, grassland, and unused land decline by 2052.38 km2, 3077.34 km2, and 2.30 km2, and forestland and water area rise by 843.47 km2 and 194.39 km2, respectively. Growth in construction land further concentrates in the Taiyuan metropolitan area and in urban clusters of southern and southeastern Shanxi, and ecological restoration efforts narrow relative to the Ecological Priority scenario. Under SSP585, construction land increases by 6275.70 km2, while forestland edges up by 591.77 km2. Cropland, grassland, water area, and unused land decline by 2720.38 km2, 3977.55 km2, 166.87 km2, and 2.68 km2, respectively. Construction land expansion primarily tracks transportation corridors and resource development zones, and grassland contraction is strongest in the northern energy development belt, extending into hilly terrain in central and eastern Shanxi.
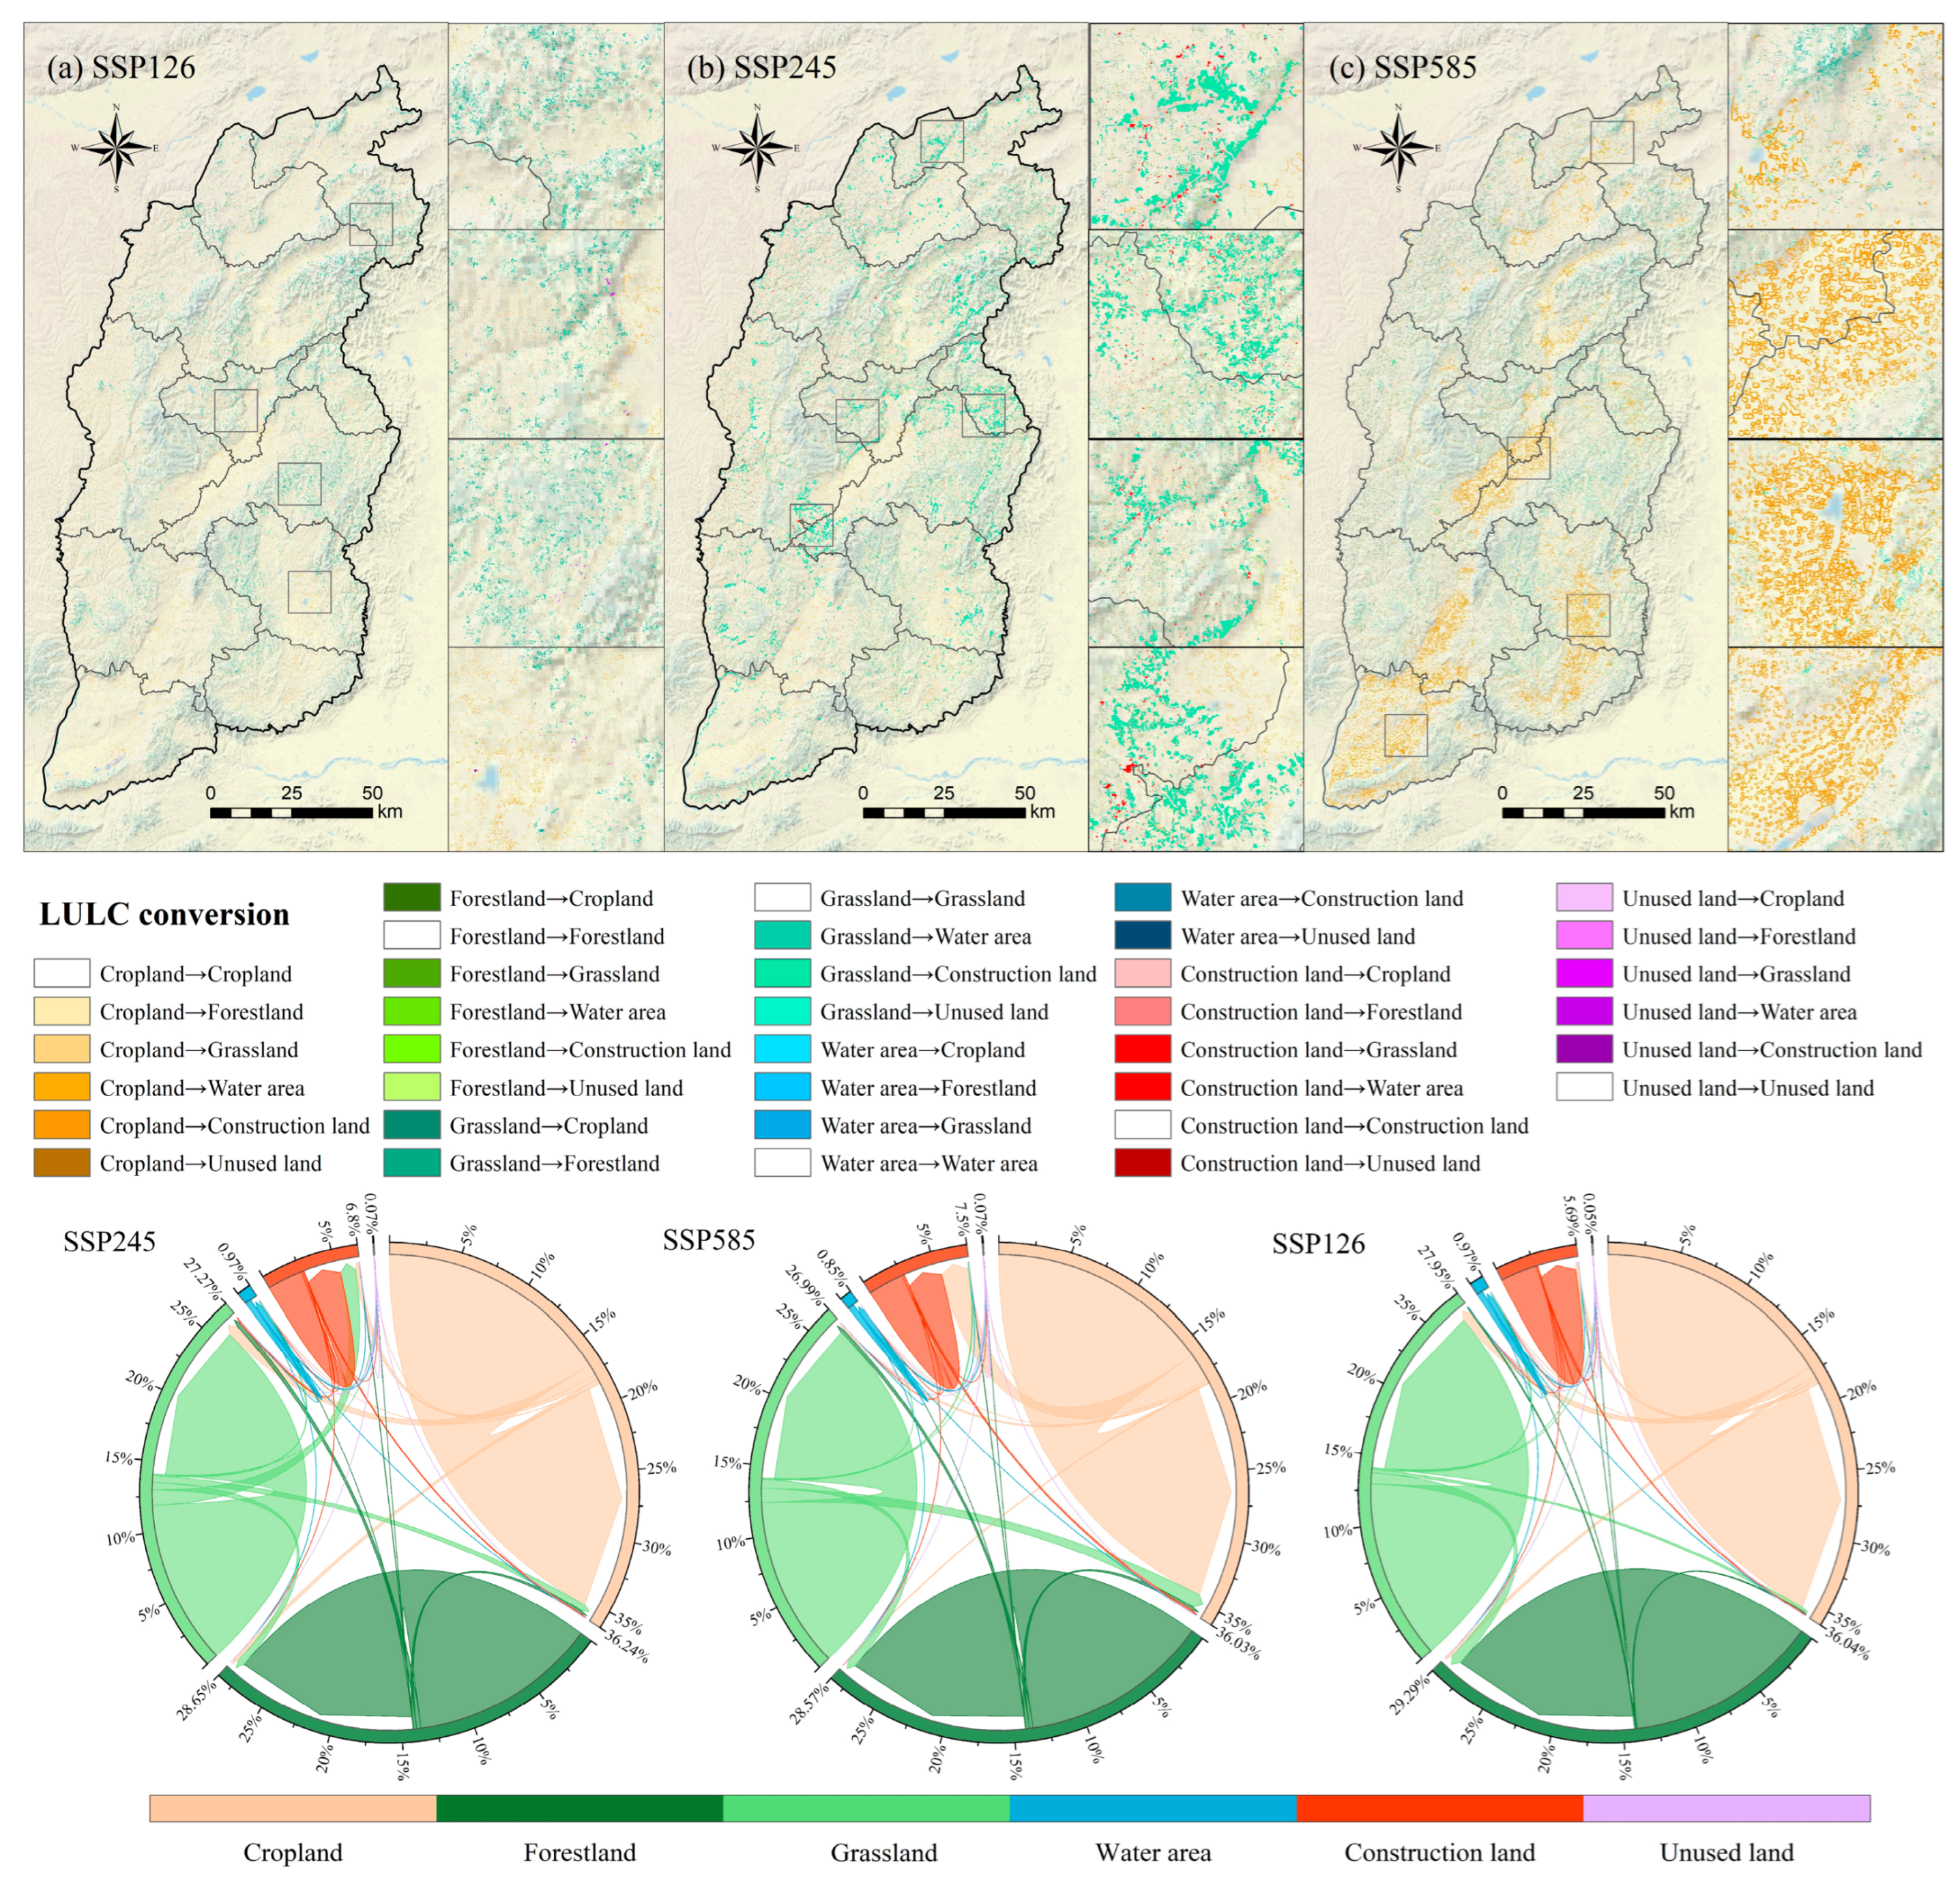
Figure 8 shows clear structural and spatial differences in land-use transitions across the scenarios. Under SSP126, an ecological-priority pathway leads to marked gains in forestland and water area. The Lvliang and Taihang mountain ranges, together with Yuncheng and Linfen within the Yellow River Basin, serve as the main zones for ecological land expansion. A pronounced shift from production and residential functions toward ecological functions emerges. Forestland and cropland account for 39.25% and 36.53% of the total area change, respectively. Under the SSP245 scenario, construction land expands significantly due to weakened ecological governance, while forestland experiences only modest growth (1.90%), and grassland and cropland decrease substantially. Land allocation favors industrial and urban development, with cropland comprising a relatively small share (20.00%) and construction land significantly expanding by 47.56%. Under the SSP585 scenario, prioritizing energy extraction and industrial expansion results in accelerated growth of construction land (72.90%), accompanied by further weakened ecological initiatives and minimal forestland expansion (only 1.33%). Grassland and cropland decrease sharply, exemplifying a typical land-use conversion in resource-based provinces driven by intensive economic growth. Additionally, water area and unused land exhibit the smallest changes across all the scenarios, suggesting relatively stable development boundaries and limited flexibility in land-use regulation.

3.3. Spatiotemporal Dynamics of CS

3.3.1. Dynamics of CS from 2005 to 2020

From 2005 to 2020, CS in Shanxi Province shows slight fluctuations, first increasing and then decreasing. Specifically, the total CS value is 1645.54 Tg in 2005, 1648.09 Tg in 2010, 1646.06 Tg in 2015, and 1645.72 Tg in 2020, reflecting a slight overall declining trend (Table 7). From 2005 to 2010, CS slightly increases by 2.55 Tg (0.16%), mainly driven by ecological restoration, afforestation, and industrial adjustments. During this period, forestland expansion, resulting primarily from cropland-to-forestland conversions, significantly contributes to CS growth. However, from 2010 onward, CS continuously decreases, particularly from 2010 to 2015, when the largest decline (2.03 Tg, or 0.12%) occurs. This decline is primarily results from intensified coal mining, renewed heavy industrial activities, accelerated urbanization, and related land-use conversions. Ongoing land conversions from high-carbon-density types (e.g., cropland and forestland) to low-carbon-density construction land further accelerate the decline. Over the 15-year period, CS exhibits a modest net increase of just 0.18 Tg (0.01%), indicating overall stability.
Given a relatively stable overall trajectory, phase-specific fluctuations are driven mainly by redistribution among cropland, forestland, and grassland, together with the outward expansion of construction land. Together, cropland, forestland, and grassland account for 62.79% of variation in CS over the 15 years. From 2005 to 2010, cropland CS declines notably by 23.67 Tg, whereas forestland and construction land CS increase markedly by 12.92 Tg and 22.48 Tg, respectively. Forestland expansion is thus the primary driver of CS increases during this phase, while the increase in construction land mainly arises from extensive cropland conversions, reflecting urbanization pressures typical in resource-based regions. Between 2010 and 2015, although overall land-use change moderates, construction land CS continues to increase significantly. Meanwhile, CS in forestland, cropland, and grassland decreases substantially, with forestland accounting for the largest share (46.52%) of the total CS reduction, followed by cropland (40.71%) and grassland (12.77%). Although CS from construction land increases, its lower carbon density cannot compensate for the losses from high-carbon lands, leading to a regional CS decline.
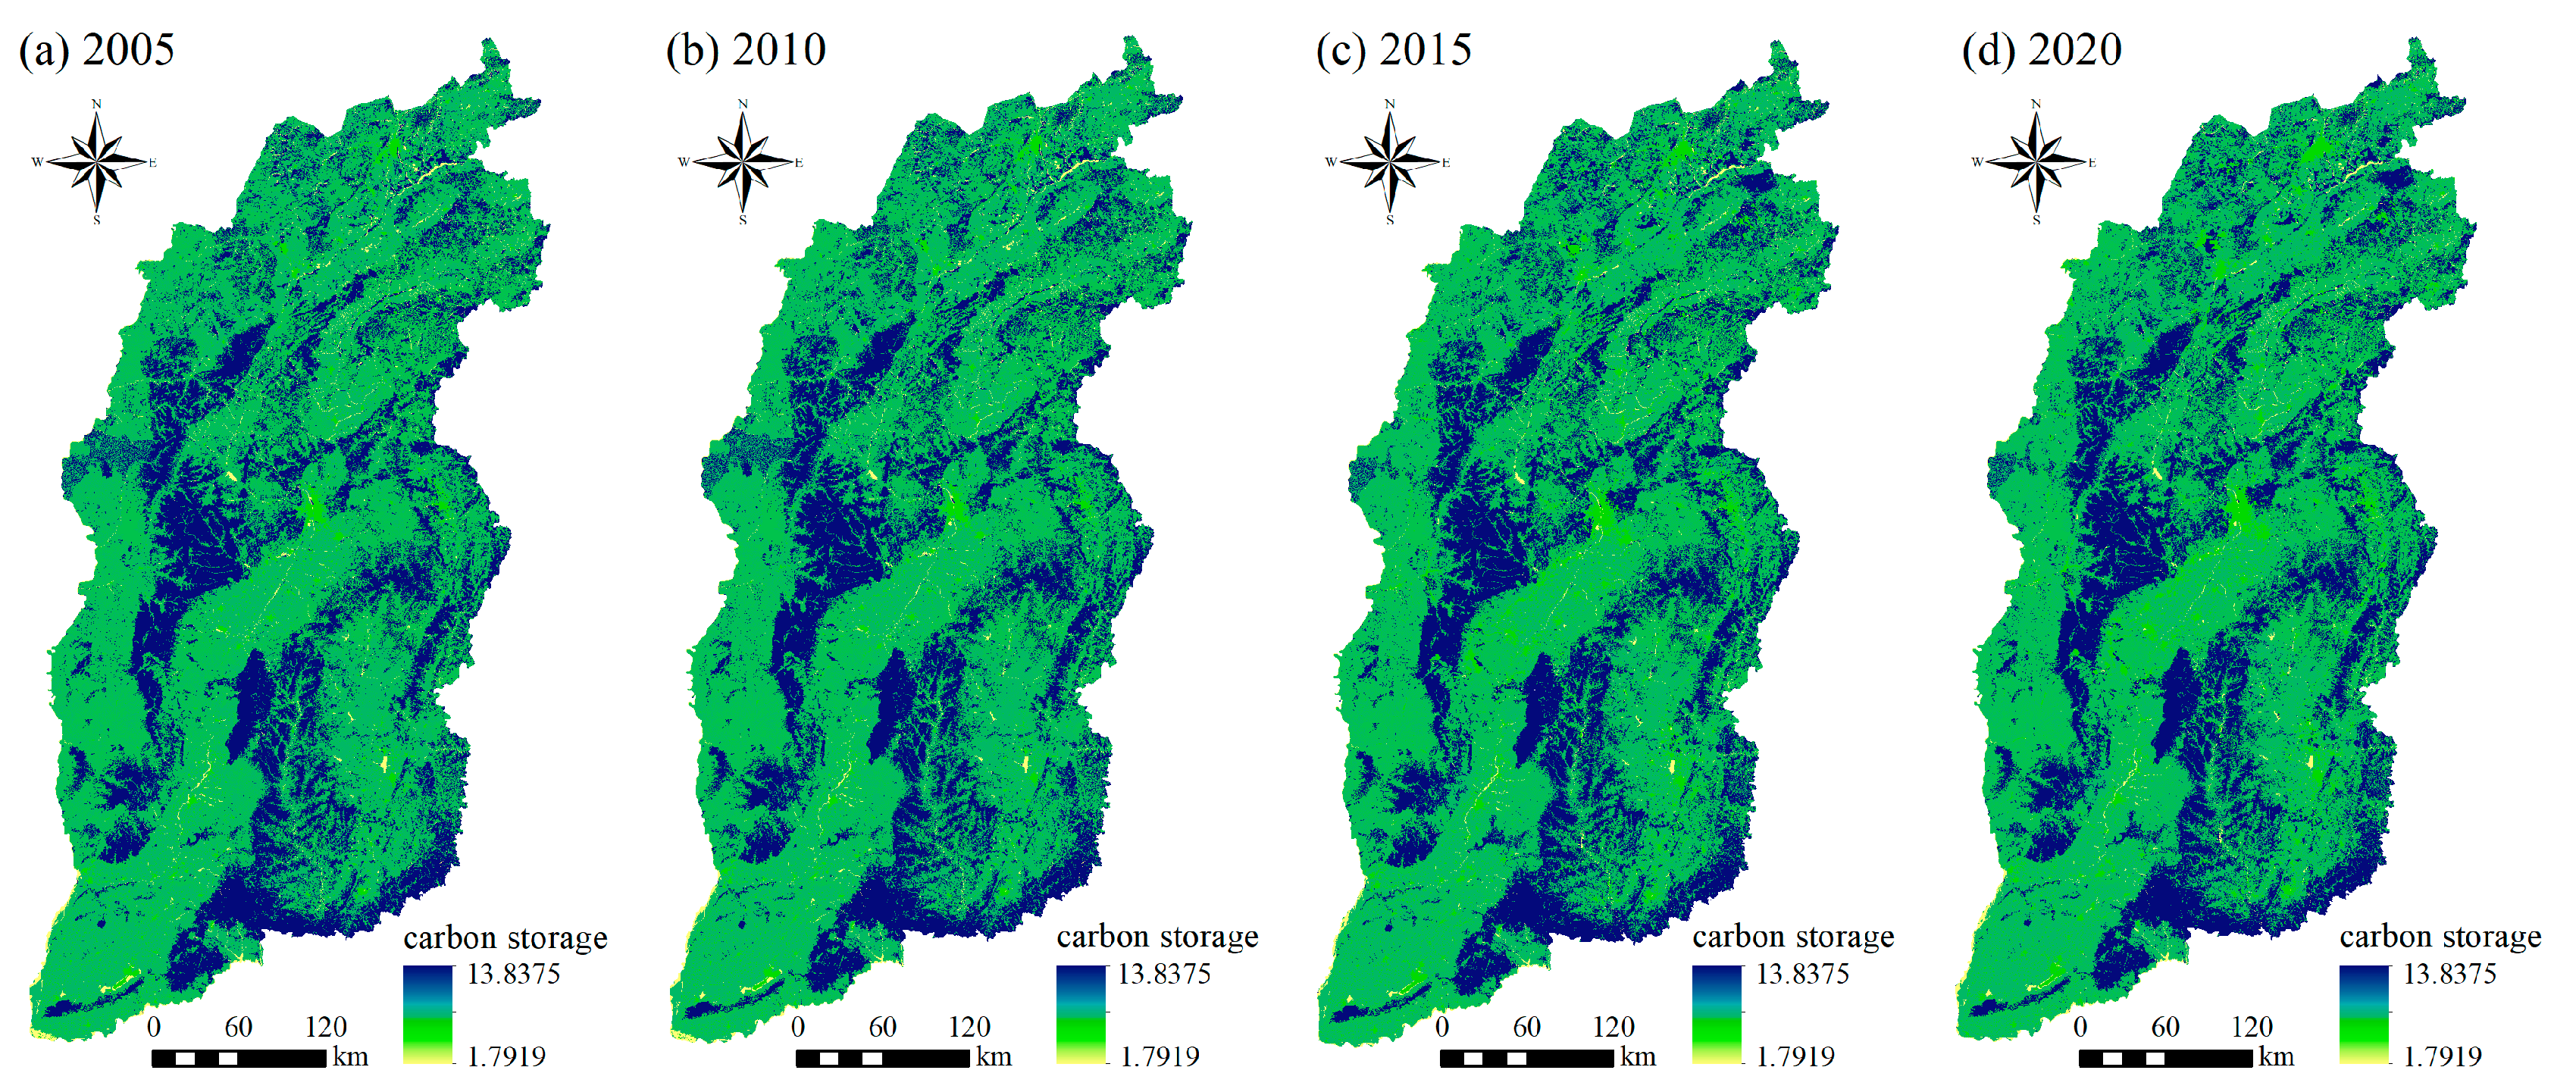
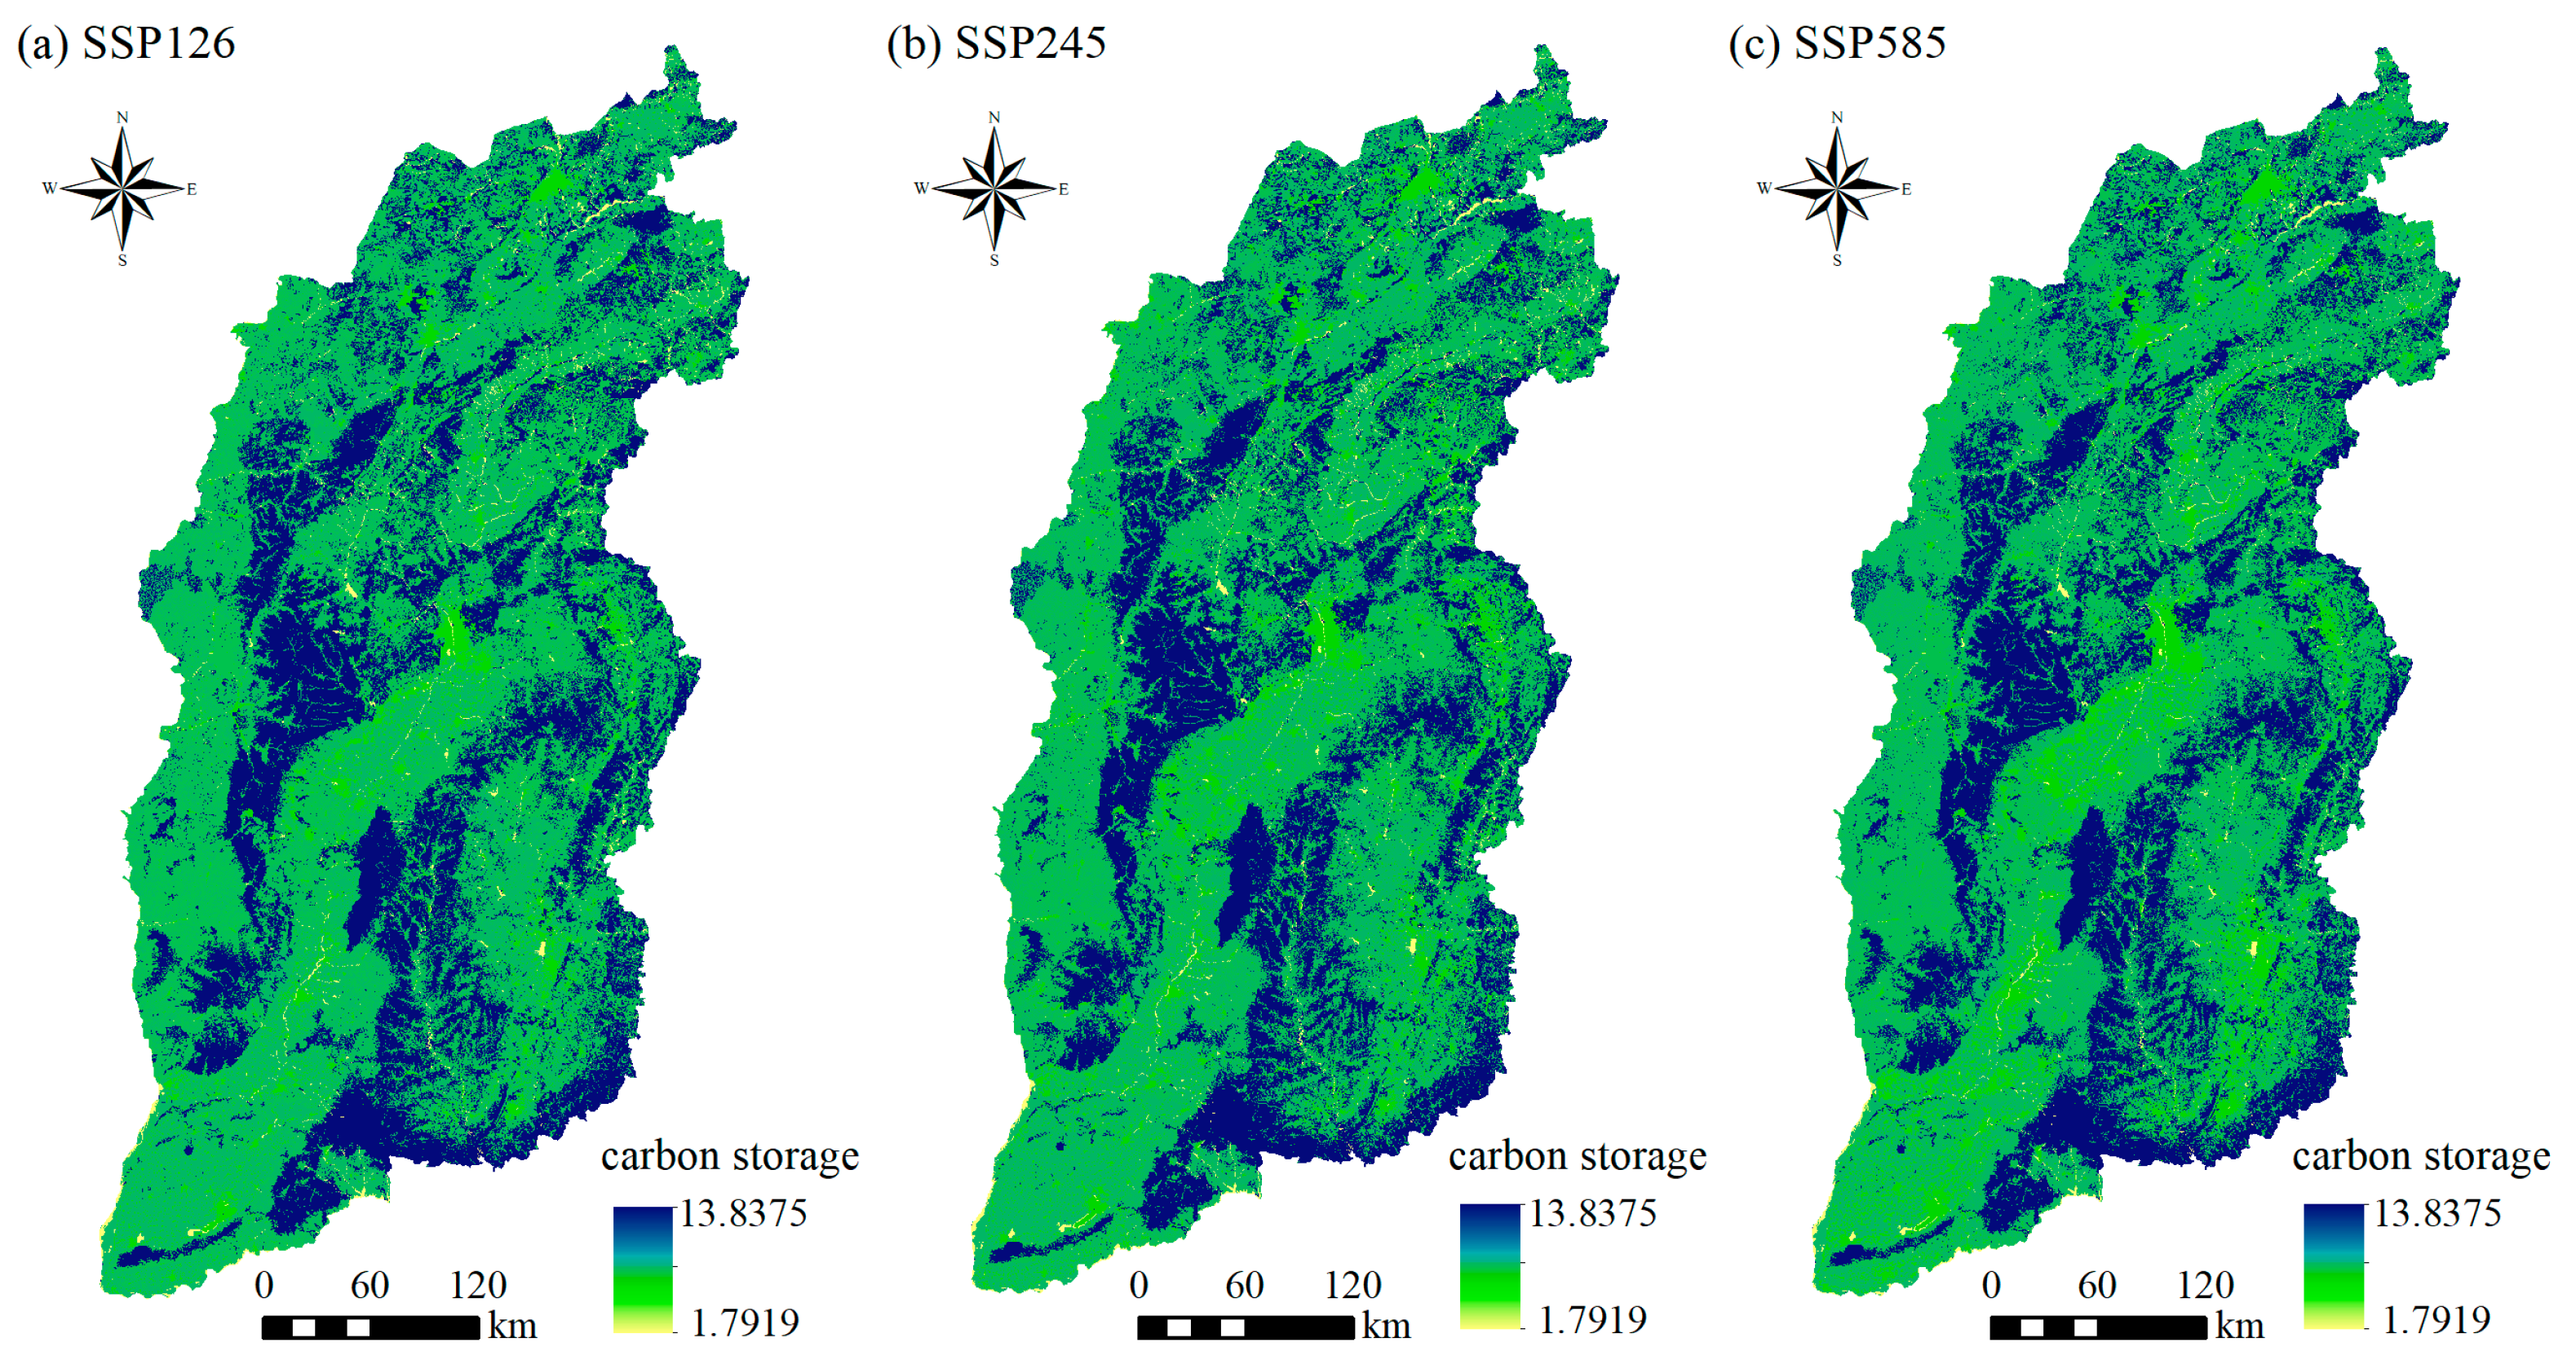
Spatially, CS in Shanxi shows a clear gradient with higher values in the west and south and lower values in the east and north (Figure 9). High-CS zones are concentrated in western and central Lvliang, western Linfen, the Taiyue Mountains, eastern Yuncheng and Xinzhou, and the Changzhi–Jincheng area. These areas feature mountainous terrains, dense forests, wetlands, and lakes, with limited human disturbance, high vegetation coverage, and strong ecosystem CS. Low-CS zones coincide with intensive human activity, notably in Taiyuan, Datong, and Yangquan. In Taiyuan, rapid urbanization and industrialization have converted large areas of agricultural and natural ecosystems to urban and industrial land, substantially reducing CS. In Datong and Yangquan, extensive coal mining and heavy industry have degraded vegetation and ecological quality, persistently suppressing CS.

3.3.2. CS Dynamics Under Multiple Scenarios in 2030

From a temporal perspective, projections of CS in Shanxi Province in 2030 exhibit significant differences across various scenarios (Table 8). Under the SSP126 scenario, provincial CS is projected to reach 1662.35 Tg, reflecting a modest increase of approximately 1.01% compared to the 2020 level. In contrast, under the SSP245 and SSP585 scenarios, CS is projected to decline slightly to 1644.21 Tg and 1641.81 Tg, respectively. Although these declines are relatively minor, they nonetheless suggest an emerging downward trend in the regional CS capacity. Consequently, only the SSP126 scenario yields positive CS growth, whereas the decreases under SSP245 and SSP585 suggest an increased risk of degradation in the regional CS function. This disparity clearly demonstrates that ecological policy interventions and green low-carbon transition (SSP126) are crucial for Shanxi Province to maintain and even enhance its regional carbon storage capacity. Conversely, the persistent high-intensity industrial development model (SSP585) may exacerbate the risk of carbon storage degradation, demanding high priority attention from policymakers.
CS dynamics across land-use types differ markedly under the three scenarios. Under SSP126, CS declines on cropland, grassland, and unused land, but increases on forestland, water, and construction land; forestland shows the largest gain and is the main contributor, reflecting effective restoration and forest expansion. Under SSP245, CS on cropland, grassland, and unused land continues to fall; forestland and water still rise but more slowly than under SSP126; CS on construction land rises sharply and becomes the primary driver, yet faster contraction of ecological land means gains do not offset losses, and the total CS drops below the 2020 level. Under SSP585, declines in cropland and grassland intensify, and water and unused land also fall; construction land records the largest gain and forestland edges up slightly, but overall compensation is limited, producing the largest reduction in CS and underscoring the strong suppression of regional CS capacity by high-intensity development.
From a spatial perspective, the projected CS distribution in Shanxi Province under all three scenarios for 2030 maintains a clear spatial gradient, with relatively high concentrations in the west and south and lower levels prevailing in the east and north (Figure 10). Under the SSP126 scenario, the majority of areas exhibit relatively stable CS, with limited spatial and temporal variation. The areas experiencing CS increases are primarily concentrated along the ecological restoration belt of the Lvliang and Taihang Mountains, whereas the areas with CS declines are predominantly situated in the central region, where urban expansion is most pronounced. Under SSP245, the extent of areas experiencing CS reductions expands significantly, particularly in Yangquan and Changzhi. However, parts of Datong and Lvliang show a trend of increasing CS. Under SSP585, the spatial distributions of CS gain and loss largely align with those under SSP245, although with slight spatial adjustments. Specifically, the areas with increasing CS are concentrated in northern Lvliang and western Linfen, whereas the declining areas are clustered within the Taiyuan metropolitan area, as well as in Yuncheng and Changzhi. These results highlight the pronounced weakening of CS functions in core urban agglomerations and surrounding regions under high-intensity development conditions.

3.3.3. Spatial Autocorrelation Analysis of CS

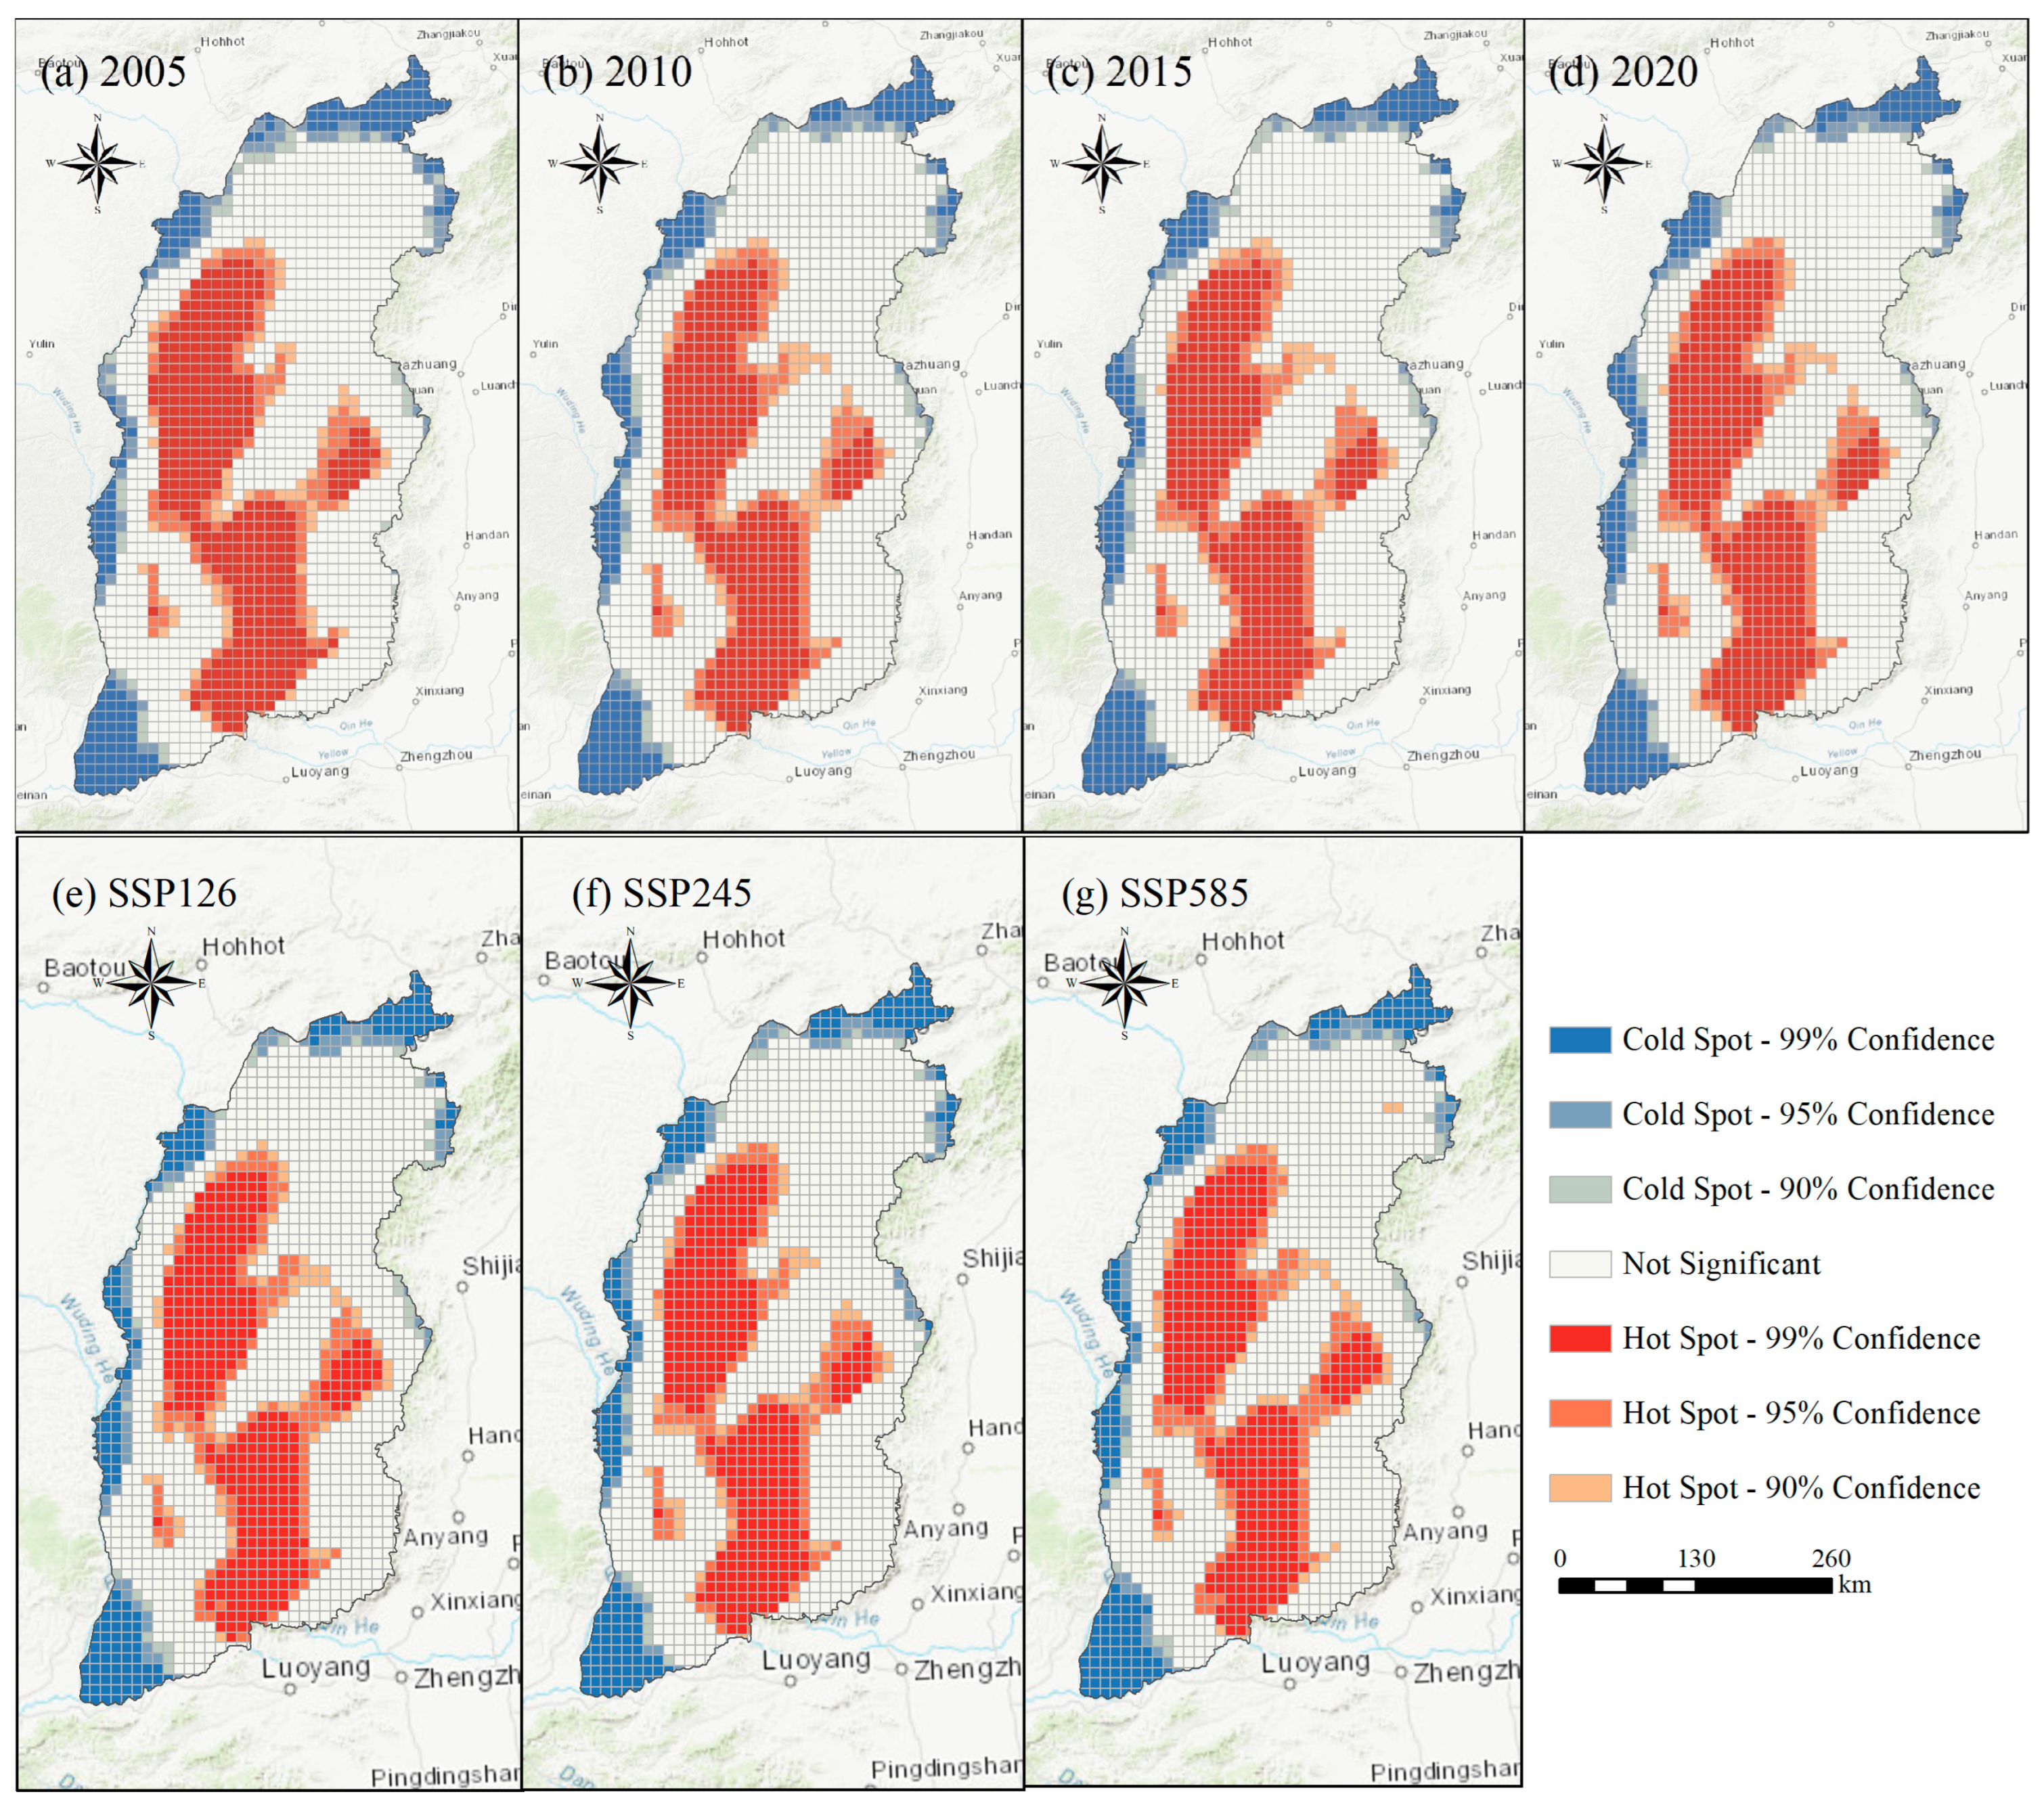
The spatial autocorrelation analysis of CS in Shanxi Province yields a Moran’s I value greater than 0.45, statistically significant at the p < 0.001 level, indicating pronounced spatial clustering. Subsequently, a hot spot analysis of CS is conducted to identify spatial clustering patterns of its changes from 2005 to 2020. The results (Figure 11) show that hot spot areas exhibit a fragmented yet clustered spatial pattern, while cold spot areas present a patchy and banded distribution. Specifically, hot spots exhibit relatively limited spatial shifts, with moderate expansion observed in Shanxi’s central and eastern regions, particularly in northeastern Taiyuan, northern Jinzhong, and central Linfen. Conversely, cold spot areas undergo contraction and expansion, with contraction primarily in northern Datong and expansion mainly in western Lvliang. Throughout the 15-year study period, hot spots are predominantly distributed across most parts of Taiyuan and Lvliang, central and western Xinzhou, central Jinzhong, central Linfen, and boundary regions among Changzhi, Linfen, Jincheng, and Yuncheng. These regions, characterized by dense forest coverage, form pronounced clusters of high CS values. In contrast, cold spot areas are concentrated primarily in northern Datong, western Xinzhou, western Lvliang, northwestern Linfen, and western Yuncheng. Notably, the northern part of Datong and the southwestern part of Yuncheng have consistently remained cold spots due to intensive resource-based industries and rapid urban expansion, resulting in severely fragmented ecological spaces and significantly reduced regional CS capacity. Consequently, it is essential to appropriately regulate urban expansion and industrial development in these areas, emphasizing ecological restoration and the enhancement of ecosystem functionality. In contrast, hot spot areas such as eastern parts of Lvliang and central areas of Xinzhou, benefiting from well-preserved forestland ecosystems and relatively limited human disturbance, should receive strengthened ecological conservation and vegetation restoration initiatives to further strengthen and improve regional ecosystem services.
Under the SSP126 scenario for 2030, the distribution of ecosystem CS hot and cold spots in Shanxi generally expands while the overall spatial pattern remains relatively stable (Figure 11e). Hot spots are concentrated in the central and northern province, with notable growth in central Jinzhong and northeastern Taiyuan, but weaken in northern Lvliang and Linfen. Cold spots retain banded and patchy forms, extending northeast in Yuncheng, shifting north in western Lvliang, and emerging as new small patches in Datong. Under SSP245, spatial changes are moderate (Figure 11f): 99% confidence hot spots shrink in southern Lvliang, the Jinzhong hot spot shifts southward, cold spots contract in western Lvliang, and those in Yangquan intensify from the 90% to the 95% confidence level. Under SSP585, spatial reconfiguration is more pronounced (Figure 11g): hot spots expand in central Jinzhong and increase slightly in southern Datong, but contract in central–eastern Linfen and western Jincheng; 99% confidence hot spots also decline in southern Lvliang. Cold spots expand in Yuncheng but contract in western Lvliang and southeastern Datong, reflecting marked spatial adjustments under high-intensity development.

3.4. Spatial Heterogeneity and Path Identification of CS Driving Mechanisms

3.4.1. Spatial Heterogeneity Characteristics of Driving Factors

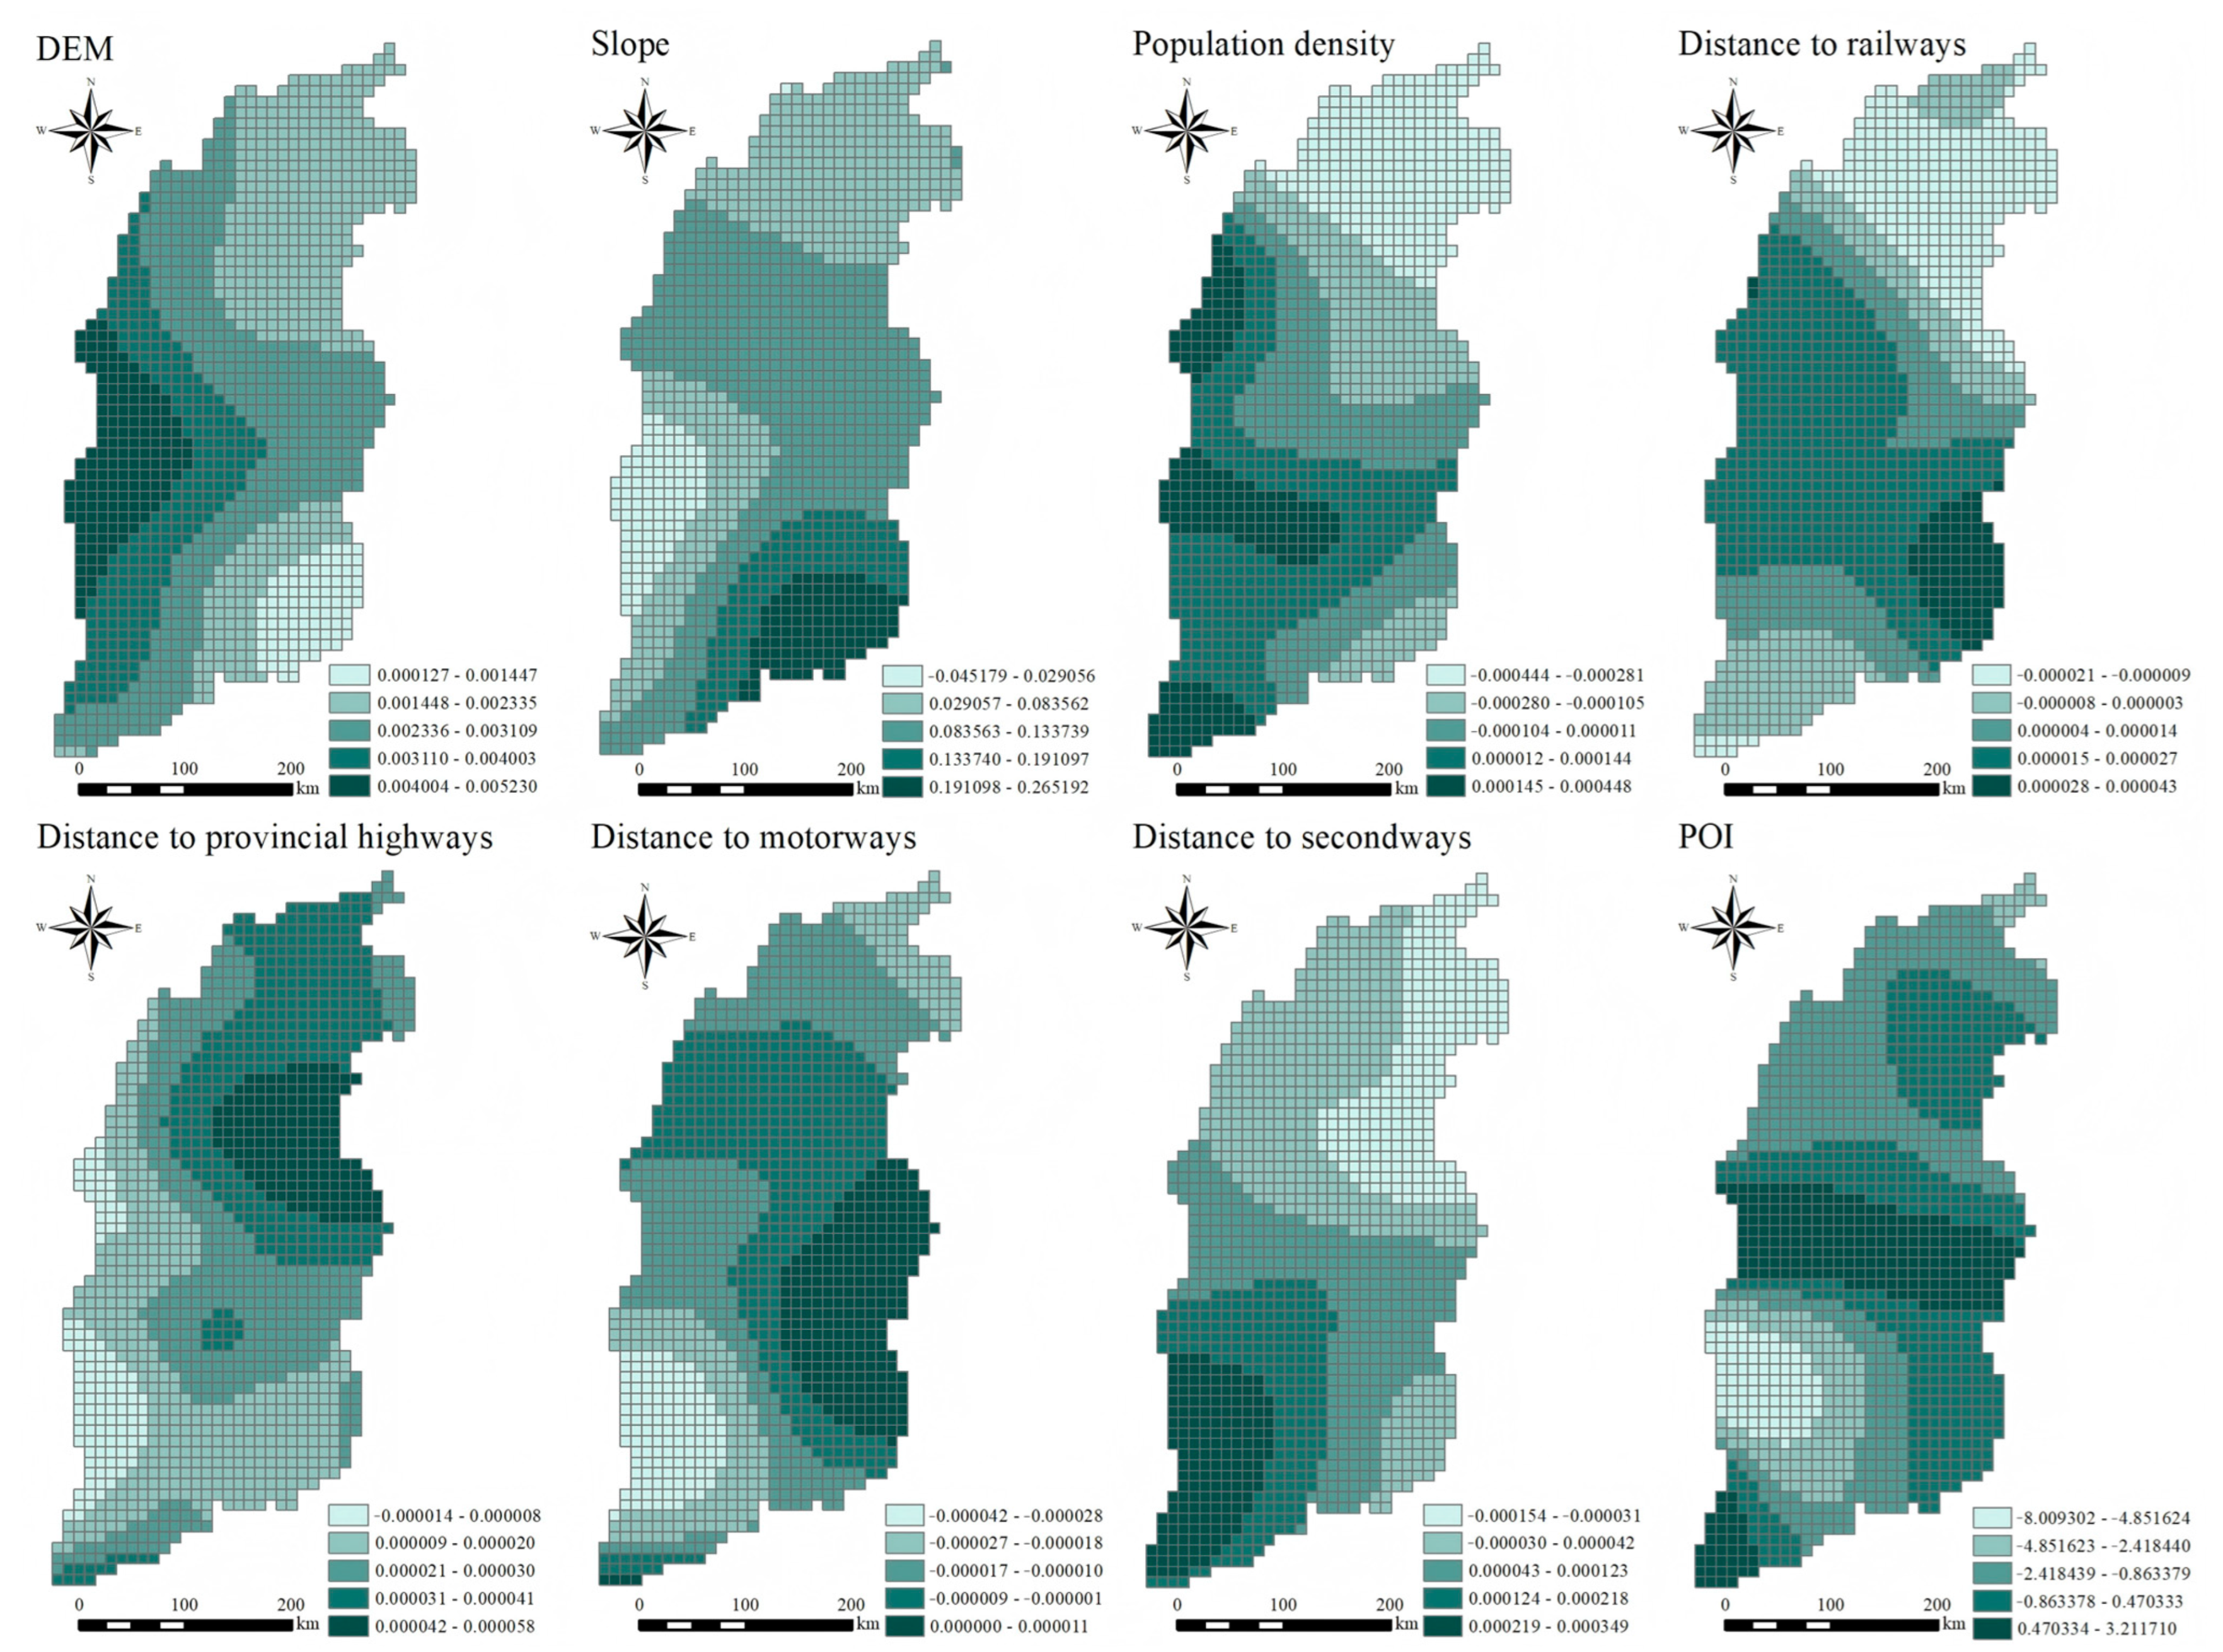
To thoroughly reveal spatial heterogeneity in the driving mechanisms of CS, this study applies GWR to visualize the spatial distribution of local regression coefficients for each driving factor, following initial variable selection via OLS regression (Figure 12). Considering that the SSP245 scenario more accurately reflects real-world trends in carbon emissions, LUCC, and socioeconomic development pathways, this study analyzes the factors related to the natural environment, socioeconomic conditions, and transportation networks within the SSP245 scenario.
DEM exhibits a consistent and positive influence overall, with high regression coefficients primarily concentrated in central mountainous regions, such as the Lvliang and Taihang Mountains. The spatial distribution shows a gradual intensification from the southeast toward central regions, followed by a decline toward the north. This indicates that higher-altitude areas characterized by intact vegetation and stable ecosystems effectively sustain CS. Similarly, slope demonstrates a significant positive effect on CS, gradually intensifying from the northwest to the southeast and prominently occurring in southern mountainous and central-eastern hilly areas. Regions with steep slopes experience restricted human development activities, preserving natural vegetation such as forests and shrublands, thereby enhancing CS capacity.
Population density reveals clear spatial differentiation regarding its influence on CS, demonstrating positive effects in the southwest and negative effects in the northeast. Moderate population concentrations in southwestern, southern, and certain central areas facilitate efficient ecological governance and infrastructure allocation, thus enhancing regional CS levels. Conversely, intensive land development associated with high population densities in northern and eastern regions significantly reduces ecological spaces, thereby decreasing CS capacity. Additionally, the density of POI demonstrates clear spatial differentiation, positively influencing central regions while negatively affecting southern and northern areas. Moderate POI concentrations in central regions facilitate coordinated spatial planning of green spaces and public services, thus enhancing CS. In contrast, higher POI densities in the southern and northern regions intensify urban expansion and ecological space compression, impairing CS functionality.
The influence of distance to railways on CS exhibits spatially differentiated characteristics, being positive in central regions but negative in southern and northern regions. In central areas, locations farther from railways experience reduced land development pressures, thereby maintaining higher ecological integrity and enhanced CS. Conversely, southern and northern regions along railway corridors primarily consist of agricultural and mountainous ecosystems, where proximity to railways is associated with improved natural vegetation conditions, leading to relatively higher CS levels. Distance to provincial highways exerts an overall positive effect on CS, though this influence diminishes spatially from the northeast toward the southwest. In northern and east-central regions, locations farther from provincial roads maintain higher vegetation coverage and lower land-use intensity, thus enhancing CS. Conversely, in south-central and western regions, provincial roads frequently overlap with urban expansion zones, intensifying land development pressures and weakening the beneficial effects associated with greater distances from provincial roads. Distance to motorways generally has a negative influence on CS, implying that increased distance from motorways corresponds to diminished CS capacity. Spatially, the intensity of this negative influence gradually decreases from southwest to northeast. Ecological disturbances caused by motorways are particularly pronounced in southwestern regions, while regression coefficients in eastern and central areas approach zero, indicating minimal motorway impacts on CS in these regions. Lastly, the impact of distance to secondways exhibits clear spatial differentiation, positively affecting CS in southern regions but negatively in northern regions. In southern and southwestern areas, secondways traverse forested landscapes, intensifying ecological fragmentation and human disturbance; thus, areas farther from these roads maintain higher ecological integrity and enhanced CS capacity. In contrast, secondways in northern regions often lie along interfaces between farmland and urbanized areas, and areas distant from roads typically coincide with lower ecological quality or urban fringe zones, limiting their CS potential.
Moreover, complex interactions exist between the aforementioned socioeconomic and transportation network factors and natural topographic elements, significantly influencing the spatial distribution of CS. For example, in northern and eastern Shanxi Province, urban expansion driven by high population density intensifies pressures on ecological systems, particularly near sensitive zones such as forestland and river basins, leading to increased fragmentation and ecological degradation, which significantly reduces local CS capacity. Conversely, regions characterized by favorable ecological conditions, such as the central hilly areas, can benefit from moderate population concentration, which facilitates more efficient resource allocation and ecological management, thus enhancing regional carbon sequestration capacity. Additionally, the ecological effects of transportation infrastructure depend significantly on terrain complexity and vegetation cover. Road construction in rugged terrains or densely vegetated areas often exacerbates landscape fragmentation and decreases CS potential, while in urbanized or agriculturally intensive plains, transportation infrastructure primarily impacts CS indirectly by facilitating land development and urban expansion. Consequently, these spatial interactions between anthropogenic activities and natural environmental features, under diverse socioeconomic scenarios, play a critical role in determining regional CS patterns.

3.4.2. Path Identification of CS Driving Mechanisms

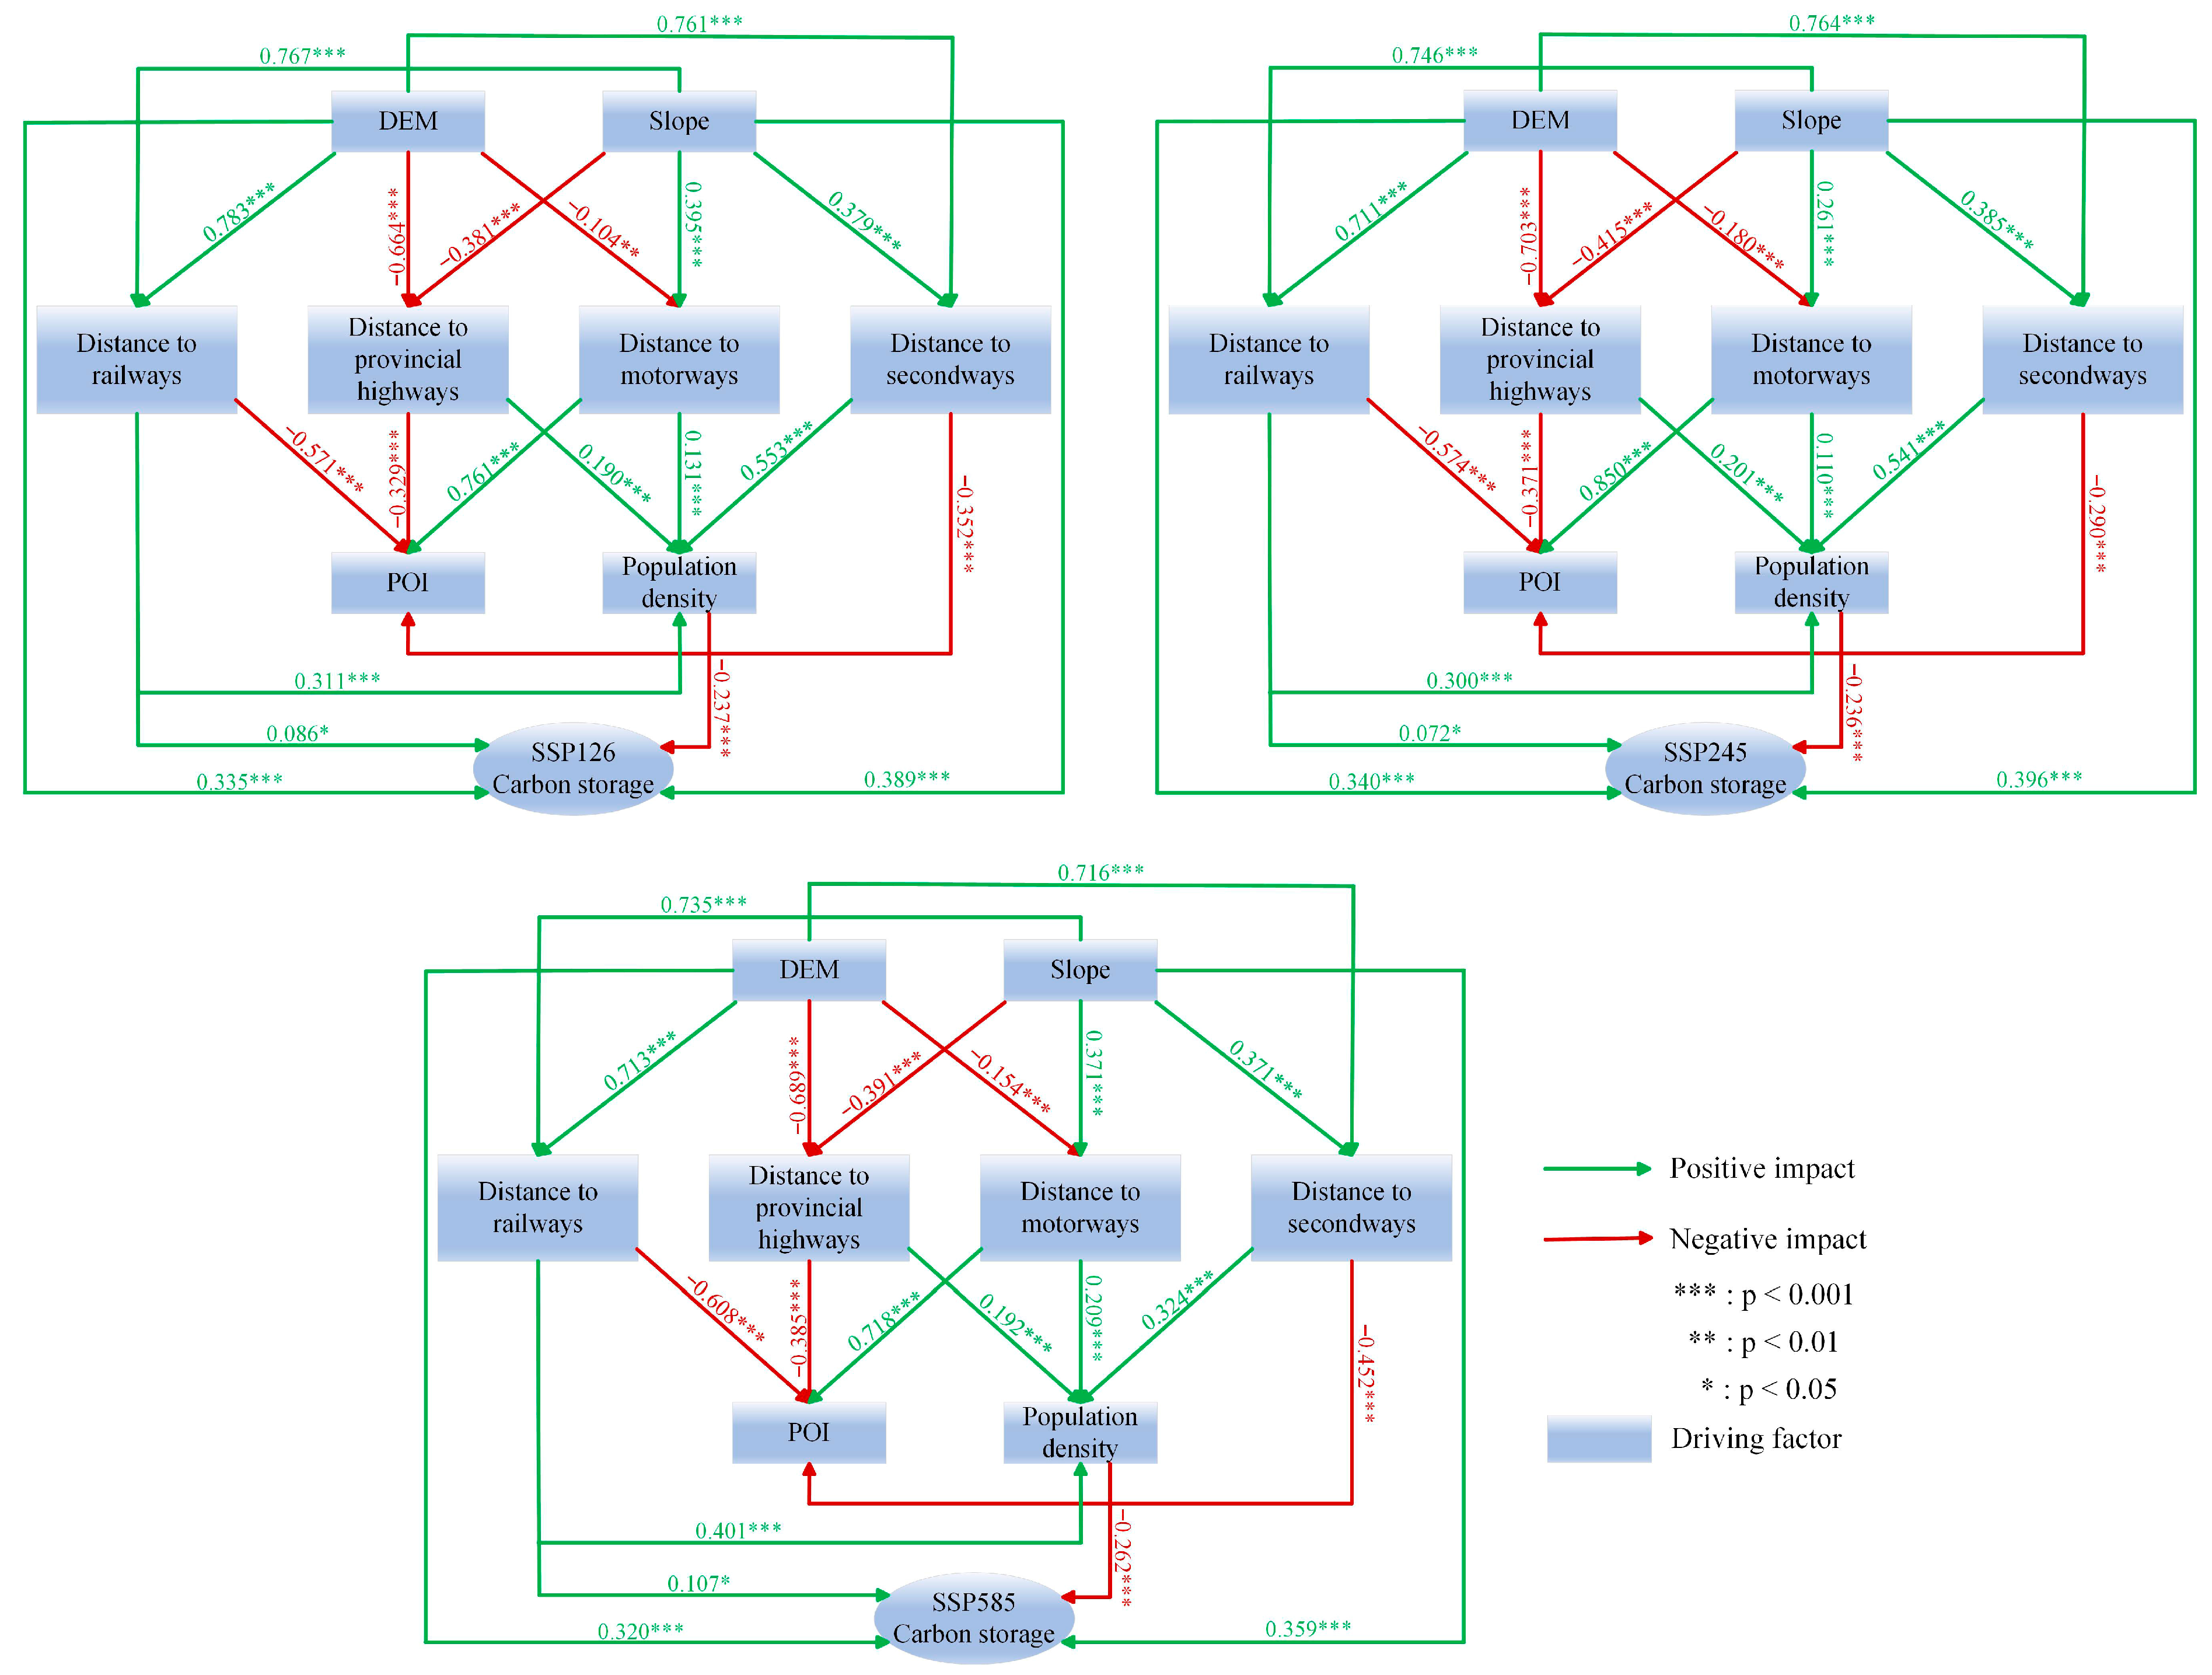
To systematically identify primary driving pathways influencing CS, this study employs SEM to characterize and compare structural relationships and key determinants under the scenarios SSP126, SSP245, and SSP585 (Figure 13). Driving factors exhibit significant differences in their direct impacts on CS across these scenarios. Specifically, DEM consistently exhibits a stable positive effect, with coefficients of 0.335, 0.340, and 0.320, respectively, indicating that higher-altitude regions generally possess greater ecosystem stability, lower human disturbance, and environments favorable for CS. Similarly, slope maintains a consistently positive influence, with coefficients of 0.389, 0.396, and 0.359, respectively. This result suggests that steeper terrains tend to restrict large-scale human development and agricultural activities, preserving intact vegetation ecosystems conducive to regional CS. In contrast, population density consistently exerts a negative impact, with coefficients of −0.237, −0.236, and −0.262, respectively. This finding illustrates that densely populated areas, characterized by intensified land-use activities and reduced vegetation coverage, significantly weaken ecosystem CS capacity. Distance to railways also demonstrates a positive relationship with CS (coefficients of 0.086, 0.072, and 0.107, respectively), indicating that regions farther from railways experience fewer ecological disturbances and thus maintain higher CS levels. DEM and slope significantly shape the distribution of regional transportation infrastructure, further influencing spatial patterns of population density and POI, thereby indirectly affecting regional CS. Specifically, higher elevation and steeper slopes lead to dispersed transportation networks, which in turn reduce regional population and POI densities, ultimately supporting higher CS capacity. In summary, under the SSP126, SSP245, and SSP585 scenarios, terrain factors such as elevation and slope consistently provide ecological conservation benefits, whereas human activities represented by population density and spatial configurations of transportation infrastructure persistently induce ecological disturbances. These findings uncover the intrinsic mechanism by which spatial patterns of regional CS emerge from the combined constraints imposed by natural environmental conditions and pressures exerted by human activities.

4. Discussion

4.1. Spatiotemporal Evolution of LUCC and Its Impact on CS from 2005 to 2020

Between 2005 and 2020, LUCC in Shanxi Province profoundly reshaped the spatial pattern of regional CS, following a dynamic trajectory characterized by an initial increase followed by a subsequent decline. This pattern closely aligns with the CS trends observed in the Yellow River Basin over the same period [47], reflecting the synergistic effects of policy implementation and ecological governance on CS dynamics. From 2005 to 2010, programs such as reforestation and ecological restoration contributed to increases in CS. However, since 2010, the intensification of urbanization and resource extraction has led to the continuous conversion of high carbon-density land types (e.g., cropland and forestland) into low carbon-density construction land, resulting in a substantial decline in CS. This phenomenon is not unique to Shanxi. Comparable patterns have been documented in other internationally recognized resource-dependent regions, including Silesia in Poland and the Ruhr area in Germany [48,49]. These cases illustrate a common structural contradiction faced by resource-based economies globally—namely, the inherent tension between industrial expansion and ecological conservation. Experience from these regions suggests that insufficient coordination between land development strategies and ecological policy frameworks during the urbanization process often leads to a weakening of regional ecological functions.

4.2. Spatiotemporal Evolution of LUCC and Its Impact on CS Under Multiple Scenarios

This study employs the SSP-RCP composite scenarios within the CMIP6 framework, systematically integrates key variables such as population, economic development, energy structure, and LUCC, while also incorporating policy and regulatory factors to enhance the foresight and policy applicability of the simulation results. This study finds that alternative socioeconomic development pathways exert significant influences on land-use structures and regional CS in Shanxi Province. Under the SSP126 scenario—driven by ecological protection and low-carbon policy priorities—the area of forestland expands substantially, effectively curbing the expansion of construction land and significantly enhancing regional CS capacity. This outcome is consistent with the findings of Wu et al. (2024) [50]. In contrast, under the SSP245 scenario, ongoing urban expansion continues to encroach upon cropland and grassland [51], resulting in a modest decline in CS. Notably, under the same scenario, CS in the Yellow River Basin increases considerably. This divergence may be attributed to Shanxi Province’s reliance on incremental land expansion rather than the redevelopment of the existing urban areas, leading to relatively low land-use efficiency. Moreover, insufficient efforts in ecological restoration have further con-strained improvements in the region’s CS capacity [52]. Furthermore, under the SSP585 scenario, the rapid expansion of construction land encroaches on ecological space and restricts forestland expansion, resulting in significant degradation of CS capacity [53,54]. In summary, CS dynamics under different socioeconomic pathways exhibit significant scenario-specific differentiation, highlighting the crucial role that land-use structural transformations and ecological policy implementation play in shaping regional CS capacity.

4.3. Spatial Heterogeneity and Path Structures of CS Driving Mechanisms

By integrating GWR and SEM, this study uncovers spatial heterogeneity and multi-path interactions underlying the driving mechanisms of CS in resource-based regions. Results indicate that terrain variables, notably DEM and slope, not only directly influence vegetation distribution patterns and LUCC, but also indirectly affect CS distribution by modulating transportation accessibility [55]. Specifically, under the SSP126 scenario, regions further away from railways exhibit significantly higher CS levels due to reduced human activity and greater ecosystem integrity compared with transportation-intensive areas [56]. However, as development scenarios progressively shift toward SSP245 and SSP585, socioeconomic factors such as population density and POI density exert an increasingly prominent impact, intensifying pressures on CS through continuous land occupation and compression of ecological spaces. Additionally, the direct and indirect influence pathways of each driving factor demonstrate clear scenario dependency and spatial variability. Notably, indirect pathways, whereby DEM and slope influence socioeconomic activities via transportation layout, exhibit pronounced spatial moderation effects [57]. LUCC not only reshapes the spatial structure of the regional CS system but also dynamically alters the mechanisms through which socioeconomic factors affect CS.

4.4. Exploring a New Development Model for Resource-Based Regions

As a representative resource-based region, Shanxi Province has long depended on carbon-intensive industries for growth. Its land-use pattern bears the imprint of intensive resource extraction, single-industry specialization, and uneven ecological restoration. The traditional development model prioritizes resource exploitation and urban expansion while neglecting the integrated management of ecosystem carrying capacity and CS functions. This oversight has led to ecological degradation, declined CS capacities, and continuous cropland loss, collectively constraining the region’s sustainable development potential.
Amid the progressing green transition and the ongoing implementation of the dual-carbon strategy, resource-based regions urgently need to overcome path dependence and adopt a coordinated development model that emphasizes ecological restoration, cropland conservation, and industrial restructuring. For ecologically sensitive zones such as the Lvliang and Taihang Mountains, characterized by considerable CS potential and ample opportunities for ecological restoration, targeted initiatives—including the rehabilitation of degraded forests, ecological enrichment planting, and mixed afforestation involving trees, shrubs, and grasses—should be implemented, tailored specifically to regional ecological degradation characteristics. In parallel, governance mechanisms related to ecological protection redlines should be strengthened to effectively mitigate the risks of further degradation in forestland and grassland ecosystems.
Drawing upon the ecosystem services assessment framework proposed by Córdoba Hernández and Camerin (2024) [58], it is recommended to establish a decision-support system based on spatial ecosystem services evaluation. This system should systematically incorporate quantitative ecosystem service assessments into regional spatial planning and land management decision-making processes. Such integration enables the accurate delineation of priority areas for ecological conservation and restoration, thereby facilitating scientifically sound optimization of land-use control measures. Building upon this foundation, further refinement of the farmland management mechanism—rooted in the principle of “equivalent quantity assurance” and guided by the objective of “quality enhancement”—is essential. This refinement would effectively improve the comprehensive productivity of farmland and enhance the CS capacity per unit area, achieving synergistic benefits between ecological conservation and food security. Simultaneously, for highly urbanized areas such as Taiyuan and Datong, compact urban development models should be promoted. Measures should include clearly defining urban growth boundaries, revitalizing existing land resources, and proactively implementing ecological renovations in older urban districts to foster land conservation and efficient utilization. Furthermore, the proactive advancement of green infrastructure construction is essential. This includes establishing urban ecological corridor networks, increasing urban green space coverage, promoting green roof technologies, and implementing stormwater management facilities. Collectively, these initiatives will significantly enhance urban ecological resilience, thus mitigating the potential adverse impacts of land-use changes on regional CS functions.
Simultaneously, it is critical to accelerate ecological compensation mechanisms, establish viable pathways to realize the value of ecological products, formulate robust green development policies, and systematically transition traditional high-energy industries toward green and low-carbon practices. Additionally, spatial constraints imposed by DEM and slope on land use, together with spatial moderation effects of population agglomeration on CS, suggest that future policies must comprehensively consider variations in geographic conditions and spatial patterns of socioeconomic development, guiding regions toward differentiated pathways for green transformation. Resource-based regions should thus systematically reshape their developmental strategies, promote intensive land utilization with strengthened ecological restoration, balance ecological security with development needs, and forge a new pathway toward green, balanced, and sustainable development.

4.5. Limitations and Prospects

Although this study systematically models the evolution of LUCC and CS dynamics in Shanxi Province and explores their future trajectories under multiple scenarios, several limitations should be noted. Firstly, although the analysis comprehensively incorporates natural and socioeconomic drivers, governance-related factors, such as policy interventions and the stringency of land-use regulation, are insufficiently addressed, which may potentially affect the accuracy and policy relevance of scenario simulations across different regions. Secondly, carbon density parameters are predominantly sourced from existing literature and regional empirical data, potentially introducing biases at the local scale. Furthermore, the static carbon density parameters utilized by the InVEST model inadequately capture dynamic spatial and temporal variations in carbon sequestration efficiency. Thirdly, in defining land conversion rules, the PLUS model assumes a static land transition matrix by default, insufficiently accounting for potential shifts in land-use preferences driven by policy changes or economic transformations, thus limiting its scenario responsiveness. Additionally, the study does not comprehensively consider potential future extreme climate scenarios (e.g., more severe SSP-RCP pathways), underscoring the need for further sensitivity analyses. Future research can address these limitations through three principal approaches. Firstly, incorporating institutional and governance variables into modeling frameworks can significantly improve scenario responsiveness and policy relevance. Secondly, enhanced field-based sampling and advanced remote sensing techniques are recommended to improve the accuracy of regional carbon-density parameters. Employing dynamic carbon density adjustments that account for climatic variables, soil properties, vegetation dynamics, and high-resolution remote sensing data can significantly enhance spatial accuracy and temporal precision in CS assessments. Thirdly, sensitivity analyses and multi-model comparative evaluations should be systematically conducted to strengthen the robustness and generalizability of simulation outcomes, particularly under diverse and extreme climate scenarios, thus validating and improving model reliability. Continuous refinement of the modeling framework and data inputs will provide stronger decision support for ecological-space optimization and CS management in resource-based regions.

5. Conclusions

Taking Shanxi Province as a representative resource-based region, this study integrates the PLUS and InVEST models with GWR and SEM methods to analyze the driving factors behind land-use conversion from 2005 to 2020, project land-use and CS dynamics under the SSP126, SSP245, and SSP585 scenarios for 2030, and elucidate the spatial heterogeneity and driving mechanisms of CS. The main conclusions are as follows:
(1)
From 2005 to 2020, Shanxi Province’s CS followed an initial upward trend before declining. Ecological restoration projects significantly boosted CS growth. Subsequently, accelerated industrial development and urbanization led to a marked decrease in regional CS, resulting in an overall pronounced inverted U-shaped trend. Spatially, CS demonstrates a clear gradient distribution, with higher values in the west and south and lower values in the east and north.
(2)
Projected LUCC and CS changes under different scenarios for 2030 vary significantly. CS increases slightly under the SSP126 scenario due to the expansion of ecological land. In contrast, under SSP245, which extends current development trends, CS shows a slight decline. Under SSP585, accelerated urbanization and industrialization results in the largest decrease in CS, significantly undermining the region’s ability to meet dual-carbon goals.
(3)
The spatial distribution of CS displays distinct clustering patterns across historical phases and future scenarios. Hot spots are primarily located in forested areas of the central and northern regions, whereas cold spots are mostly found in the western and peripheral urbanized zones. It is recommended that targeted strategies be strengthened within land-use planning and climate policymaking, emphasizing enhanced conservation measures in hot spot areas and improved governance approaches in cold spot regions.
(4)
SEM analysis further reveals that topographic factors, such as DEM and slope, have a stable positive ecological conservation effect on CS, while human activity factors, including population density and transportation networks, exert a persistent negative impact on CS. This suggests that natural environmental constraints and human activity pressures jointly influence the spatial distribution of regional CS. This conclusion also provides valuable insights and inspiration for broader regional-scale research.

Author Contributions

Conceptualization, T.Y., M.Y. and J.N.; methodology, M.Y. and X.L.; software, M.Y. and X.L.; investigation, T.Y., M.Y. and M.W.; data curation, T.Y., M.Y. and X.L.; writing—original draft preparation, T.Y. and M.Y.; writing—review and editing, T.Y. and J.N.; visualization, M.Y., X.L. and X.Z.; funding acquisition, T.Y. and J.N. All authors have read and agreed to the published version of the manuscript.

Funding

This work was supported by the National Social Science Fund of China (Grant No. 24BJY031), Key Project of the Natural Science Foundation of Henan Province (Grants No. 252300421290), Major Project of Fundamental Research on Philosophy and Social Sciences in Universities of Henan Province (Grants No. 2025-JCZD-31), Nanhu Scholars Program for Young Scholars of XYNU (Grants No. Nanhu-2025).

Data Availability Statement

The datasets used and/or analyzed during the current study available from the corresponding author on reasonable request.

Conflicts of Interest

The authors declare no conflicts of interest.

Abbreviations

The following abbreviations are used in this manuscript:
LUCCLand-use/cover change
CSCarbon Storage
PLUSPatch-generating Land-Use Simulation
GWRGeographically Weighted Regression
SEMStructural Equation Modeling
CMIP6Coupled Model Intercomparison Project Phase 6
SSPsShared Socioeconomic Pathways
RCPsRepresentative Concentration Pathways
LEASLand Expansion Analysis Strategy
CARSCA-based on Multiple Random Seeds

References

  1. Lempert, R.J. Measuring global climate risk. Nat. Clim. Change 2021, 11, 805–806. [Google Scholar] [CrossRef]
  2. Grellier, S.; Janeau, J.-L.; Hoai, N.D.; Kim, C.N.T.; Phuong, Q.L.T.; Thu, T.P.T.; Tran-Thi, N.-T.; Marchand, C. Changes in soil characteristics and C dynamics after mangrove clearing (Vietnam). Sci. Total Environ. 2017, 593, 654–663. [Google Scholar] [CrossRef] [PubMed]
  3. Figueres, C.; Schellnhuber, H.J.; Whiteman, G.; Rockström, J.; Hobley, A.; Rahmstorf, S. Three years to safeguard our climate. Nature 2017, 546, 593–595. [Google Scholar] [CrossRef]
  4. Sha, Z.; Bai, Y.; Li, R.; Lan, H.; Zhang, X.; Li, J.; Liu, X.; Chang, S.; Xie, Y. The global carbon sink potential of terrestrial vegetation can be increased substantially by optimal land management. Commun. Earth Environ. 2022, 3, 8. [Google Scholar] [CrossRef]
  5. Fu, B.; Li, B.; Gasser, T.; Tao, S.; Ciais, P.; Piao, S.; Balkanski, Y.; Li, W.; Yin, T.; Han, L. The contributions of individual countries and regions to the global radiative forcing. Proc. Natl. Acad. Sci. USA 2021, 118, e2018211118. [Google Scholar] [CrossRef]
  6. Zhao, X.; Ma, X.; Chen, B.; Shang, Y.; Song, M. Challenges toward carbon neutrality in China: Strategies and countermeasures. Resour. Conserv. Recycl. 2022, 176, 105959. [Google Scholar] [CrossRef]
  7. Deng, F.; Zhu, S.; Guo, J.; Sun, X. Exploring the quality of ecosystem services and the segmental impact of influencing factors in resource-based cities. J. Environ. Manag. 2025, 375, 124411. [Google Scholar] [CrossRef] [PubMed]
  8. Xu, L.; Yu, H.; Zhong, L. Sustainable futures for transformational forestry resource-based city: Linking landscape pattern and administrative policy. J. Clean. Prod. 2025, 496, 145087. [Google Scholar] [CrossRef]
  9. Piao, S.; Yue, H.; Wang, X.; Chen, F. Estimation of Carbon Sinks in Terrestrial Ecosystems in China: Methods, Progress and Prospects. Sci. China Earth Sci. 2022, 65, 641–651. [Google Scholar] [CrossRef]
  10. Wu, S.; Hu, S.; Frazier, A.E.; Hu, Z. China’s urban and rural residential carbon emissions: Past and future scenarios. Resour. Conserv. Recycl. 2023, 190, 106802. [Google Scholar] [CrossRef]
  11. Jana, A.; Jat, M.K.; Saxena, A.; Choudhary, M. Prediction of land use land cover changes of a river basin using the CA-Markov model. Geocarto Int. 2022, 37, 14127–14147. [Google Scholar] [CrossRef]
  12. Feng, Y.; Chen, S.; Tong, X.; Lei, Z.; Gao, C.; Wang, J. Modeling changes in China’s 2000–2030 carbon stock caused by land use change. J. Clean. Prod. 2020, 252, 119659. [Google Scholar] [CrossRef]
  13. Mokarram, M.; Pourghasemi, H.R.; Hu, M.; Zhang, H. Determining and forecasting drought susceptibility in southwestern Iran using multi-criteria decision-making (MCDM) coupled with CA-Markov model. Sci. Total Environ. 2021, 781, 146703. [Google Scholar] [CrossRef]
  14. Verburg, P.H.; Soepboer, W.; Veldkamp, A.; Limpiada, R.; Espaldon, V.; Mastura, S.S. Modeling the spatial dynamics of regional land use: The CLUE-S model. Environ. Manag. 2002, 30, 391–405. [Google Scholar] [CrossRef]
  15. Liu, X.; Liang, X.; Li, X.; Xu, X.; Ou, J.; Chen, Y.; Li, S.; Wang, S.; Pei, F. A future land use simulation model (FLUS) for simulating multiple land use scenarios by coupling human and natural effects. Landsc. Urban Plan. 2017, 168, 94–116. [Google Scholar] [CrossRef]
  16. Li, J.; Gong, J.; Guldmann, J.-M.; Li, S.; Zhu, J. Carbon dynamics in the northeastern qinghai–tibetan plateau from 1990 to 2030 using landsat land use/cover change data. Remote Sens. 2020, 12, 528. [Google Scholar] [CrossRef]
  17. Fu, F.; Deng, S.; Wu, D.; Liu, W.; Bai, Z. Research on the spatiotemporal evolution of land use landscape pattern in a county area based on CA-Markov model. Sustain. Cities Soc. 2022, 80, 103760. [Google Scholar] [CrossRef]
  18. Liang, X.; Guan, Q.; Clarke, K.C.; Liu, S.; Wang, B.; Yao, Y. Understanding the drivers of sustainable land expansion using a patch-generating land use simulation (PLUS) model: A case study in Wuhan, China. Comput. Environ. Urban Syst. 2021, 85, 101569. [Google Scholar] [CrossRef]
  19. Thom, D.; Keeton, W.S. Stand structure drives disparities in carbon storage in northern hardwood-conifer forests. For. Ecol. Manag. 2019, 442, 10–20. [Google Scholar] [CrossRef]
  20. Zellweger, F.; Flack-Prain, S.; Footring, J.; Wilebore, B.; Willis, K.J. Carbon storage and sequestration rates of trees inside and outside forests in Great Britain. Environ. Res. Lett. 2022, 17, 074004. [Google Scholar] [CrossRef]
  21. Zhang, X.; Lu, J.; Zhang, X. Spatiotemporal trend of carbon storage in China’s bamboo industry, 1993–2018. J. Environ. Manag. 2022, 314, 114989. [Google Scholar] [CrossRef]
  22. Fang, J.; Guo, Z.; Piao, S.; Chen, A. Terrestrial vegetation carbon sinks in China, 1981–2000. Sci. China Ser. D Earth Sci. 2007, 50, 1341–1350. [Google Scholar] [CrossRef]
  23. Wu, S.; Li, J.; Zhou, W.; Lewis, B.J.; Yu, D.; Zhou, L.; Jiang, L.; Dai, L. A statistical analysis of spatiotemporal variations and determinant factors of forest carbon storage under China’s Natural Forest Protection Program. J. For. Res. 2018, 29, 415–424. [Google Scholar] [CrossRef]
  24. Chu, X.; Zhan, J.; Li, Z.; Zhang, F.; Qi, W. Assessment on forest carbon sequestration in the Three-North Shelterbelt Program region, China. J. Clean. Prod. 2019, 215, 382–389. [Google Scholar] [CrossRef]
  25. Yang, D.; Liu, W.; Tang, L.; Chen, L.; Li, X.; Xu, X. Estimation of water provision service for monsoon catchments of South China: Applicability of the InVEST model. Landsc. Urban Plan. 2019, 182, 133–143. [Google Scholar] [CrossRef]
  26. Wu, H.; Guo, Z.; Peng, C. Land use induced changes of organic carbon storage in soils of China. Glob. Change Biol. 2003, 9, 305–315. [Google Scholar] [CrossRef]
  27. Wang, Z.; Zeng, J.; Chen, W. Impact of urban expansion on carbon storage under multi-scenario simulations in Wuhan, China. Environ. Sci. Pollut. Res. 2022, 29, 45507–45526. [Google Scholar] [CrossRef] [PubMed]
  28. Wang, Q.; Guan, Q.; Sun, Y.; Du, Q.; Xiao, X.; Luo, H.; Zhang, J.; Mi, J. Simulation of future land use/cover change (LUCC) in typical watersheds of arid regions under multiple scenarios. J. Environ. Manag. 2023, 335, 117543. [Google Scholar] [CrossRef] [PubMed]
  29. Lu, Z.; Li, W.; Yue, R. Investigation of the long-term supply–demand relationships of ecosystem services at multiple scales under SSP–RCP scenarios to promote ecological sustainability in China’s largest city cluster. Sustain. Cities Soc. 2024, 104, 105295. [Google Scholar] [CrossRef]
  30. Cui, Y.; Wu, C.; Niu, G.; Huang, G. Water yield service flow assessment under future SSP-RCP scenarios in the Yellow River Basin: Coupled effect of climate and land use change. J. Hydrol. 2025, 662, 133852. [Google Scholar] [CrossRef]
  31. Van Vuuren, D.P.; Kriegler, E.; O’Neill, B.C.; Ebi, K.L.; Riahi, K.; Carter, T.R.; Edmonds, J.; Hallegatte, S.; Kram, T.; Mathur, R. A new scenario framework for climate change research: Scenario matrix architecture. Clim. Change 2014, 122, 373–386. [Google Scholar] [CrossRef]
  32. Chen, Y.; Guo, F.; Wang, J.; Cai, W.; Wang, C.; Wang, K. Provincial and gridded population projection for China under shared socioeconomic pathways from 2010 to 2100. Sci. Data 2020, 7, 83. [Google Scholar] [CrossRef]
  33. Li, J.; Chen, X.; Kurban, A.; Van de Voorde, T.; De Maeyer, P.; Zhang, C. Coupled SSPs-RCPs scenarios to project the future dynamic variations of water-soil-carbon-biodiversity services in Central Asia. Ecol. Indic. 2021, 129, 107936. [Google Scholar] [CrossRef]
  34. Xiaojuan, L.; Xia, L.; Xun, L.; Hong, S.; Jinpei, O. Simulating the change of terrestrial carbon storage in China based on the FLUS-InVEST model. Trop. Geogr. 2019, 39, 397–409. [Google Scholar] [CrossRef]
  35. Pan, Z.; He, J.; Liu, D.; Wang, J. Predicting the joint effects of future climate and land use change on ecosystem health in the Middle Reaches of the Yangtze River Economic Belt, China. Appl. Geogr. 2020, 124, 102293. [Google Scholar] [CrossRef]
  36. Zheng, Z.; Shuang, Q. Scenario analysis under climate extreme of carbon peaking and neutrality in China: A hybrid interpretable machine learning model prediction. J. Clean. Prod. 2025, 495, 145086. [Google Scholar] [CrossRef]
  37. Ling, M.; Feng, Z.; Chen, Z.; Lan, Y.; Li, X.; You, H.; Han, X.; Chen, J. Evaluation of driving effects of carbon storage change in the source of the Yellow River: A perspective with CMIP6 future development scenarios. Ecol. Inform. 2024, 83, 102790. [Google Scholar] [CrossRef]
  38. Liu, K.; Wu, B.; Gao, F.; Chen, Y.; He, B.; Waheed, A.; Aili, A.; Xu, Z.; Han, F.; Xu, H. Dynamic simulation and key influencing factors of carbon storage in the water-depleted zones of an arid Inland River Basin: Insights from the Tarim River mainstream. Ecol. Inform. 2025, 90, 103286. [Google Scholar] [CrossRef]
  39. Zhang, K.; Fang, B.; Zhang, Z.; Xia, C.; Liu, Q.; Liu, K. Spatial optimisation based on ecosystem service spillover effect and cross-scale knowledge integration: A case study of the Yellow River Basin. J. Geogr. Sci. 2025, 35, 1080–1114. [Google Scholar] [CrossRef]
  40. Yu, Z.; Deng, X.; Cheshmehzangi, A.; Mangi, E. Structural succession of land resources under the influence of different policies: A case study for Shanxi Province, China. Land Use Policy 2023, 132, 106810. [Google Scholar] [CrossRef]
  41. Wang, B.S.; Liao, J.F.; Zhu, W.; Qiu, Q.Y.; Wang, L.; Tang, L.N. The weight of neighborhood setting of the FLUS model based on a historical scenario: A case study of land use simulation of urban agglomeration of the Golden Triangle of Southern Fujian in 2030. Acta Ecol. Sin. 2019, 39, 4284–4298. [Google Scholar]
  42. Liao, W.; Liu, X.; Xu, X.; Chen, G.; Liang, X.; Zhang, H.; Li, X. Projections of land use changes under the plant functional type classification in different SSP-RCP scenarios in China. Sci. Bull. 2020, 65, 1935–1947. [Google Scholar] [CrossRef]
  43. Wang, W.; Yu, H.; Tong, X.; Jia, Q. Estimating terrestrial ecosystem carbon storage change in the YREB caused by land-use change under SSP-RCPs scenarios. J. Clean. Prod. 2024, 469, 143205. [Google Scholar] [CrossRef]
  44. Wang, J.; Li, L.; Li, Q.; Wang, S.; Liu, X.; Li, Y. The spatiotemporal evolution and prediction of carbon storage in the Yellow River Basin based on the major function-oriented zone planning. Sustainability 2022, 14, 7963. [Google Scholar] [CrossRef]
  45. Qian, C.; Qiang, H.; Li, M. A novel Multiscale Geographically and Temporally Gravity-Weighted Regression Model: Algorithm Principle and an Application in Assessment of Forest Biomass in Karst Region. IEEE Trans. Geosci. Remote Sens. 2025, 63, 3000514. [Google Scholar] [CrossRef]
  46. Li, X.; Yu, L.; Sohl, T.; Clinton, N.; Li, W.; Zhu, Z.; Liu, X.; Gong, P. A cellular automata downscaling based 1 km global land use datasets (2010–2100). Sci. Bull. 2016, 61, 1651–1661. [Google Scholar] [CrossRef]
  47. Xu, C.; Zhang, Q.; Yu, Q.; Wang, J.; Wang, F.; Qiu, S.; Ai, M.; Zhao, J. Effects of land use/cover change on carbon storage between 2000 and 2040 in the Yellow River Basin, China. Ecol. Indic. 2023, 151, 110345. [Google Scholar] [CrossRef]
  48. Żuk, P.; Żuk, P.; Pluciński, P. Coal basin in Upper Silesia and energy transition in Poland in the context of pandemic: The socio-political diversity of preferences in energy and environmental policy. Resour. Policy 2021, 71, 101987. [Google Scholar] [CrossRef]
  49. Yuan, D.; Dong, J. Research on ecological restoration and its impact on society in coal resource-based areas: Lessons from the Ruhr area in Germany and the Liulin area in China. Geoforum 2024, 154, 104038. [Google Scholar] [CrossRef]
  50. Wu, H.; Yang, Y.; Li, W. Spatial optimization of land use and carbon storage prediction in urban agglomerations under climate change: Different scenarios and multiscale perspectives of CMIP6. Sustain. Cities Soc. 2024, 116, 105920. [Google Scholar] [CrossRef]
  51. Cheng, Y.; Liu, H.; Du, J.; Yi, Y. Quantifying biodiversity’s present and future: Current potentials and SSP-RCP-driven land use impacts. Earth’s Future 2025, 13, e2024EF005191. [Google Scholar] [CrossRef]
  52. Wang, H.; Wu, L.; Yue, Y.; Jin, Y.; Zhang, B. Impacts of climate and land use change on terrestrial carbon storage: A multi-scenario case study in the Yellow River Basin (1992–2050). Sci. Total Environ. 2024, 930, 172557. [Google Scholar] [CrossRef]
  53. Tang, J.; Song, P.; Hu, X.; Chen, C.; Wei, B.; Zhao, S. Coupled effects of land use and climate change on water supply in SSP–RCP scenarios: A case study of the Ganjiang river Basin, China. Ecol. Indic. 2023, 154, 110745. [Google Scholar] [CrossRef]
  54. Gao, F.; Xin, X.; Song, J.; Li, X.; Zhang, L.; Zhang, Y.; Liu, J. Simulation of LUCC dynamics and estimation of carbon stock under different SSP-RCP scenarios in Heilongjiang province. Land 2023, 12, 1665. [Google Scholar] [CrossRef]
  55. Cheng, Y.; Luo, P.; Yang, H.; Li, M.; Ni, M.; Li, H.; Huang, Y.; Xie, W.; Wang, L. Land use and cover change accelerated China’s land carbon sinks limits soil carbon. NPJ Clim. Atmos. Sci. 2024, 7, 199. [Google Scholar] [CrossRef]
  56. Huang, Z.; Li, X.; Mao, F.; Huang, L.; Zhao, Y.; Song, M.; Yu, J.; Du, H. Integrating LUCC and forest aging to project and attribute subtropical forest NEP in Zhejiang Province under four SSP-RCP scenarios. Agric. For. Meteorol. 2025, 365, 110462. [Google Scholar] [CrossRef]
  57. Qing, X.; Li, Y.; Li, W.; Lu, Z.; Yue, R. To refine differential land use strategies by developing landscape risk assessment for urban agglomerations in the Yellow River Basin of China. Environ. Impact Assess. Rev. 2026, 117, 108162. [Google Scholar] [CrossRef]
  58. Hernandez, R.C.; Camerin, F. The application of ecosystem assessments in land use planning: A case study for supporting decisions toward ecosystem protection. Futures 2024, 161, 103399. [Google Scholar] [CrossRef]
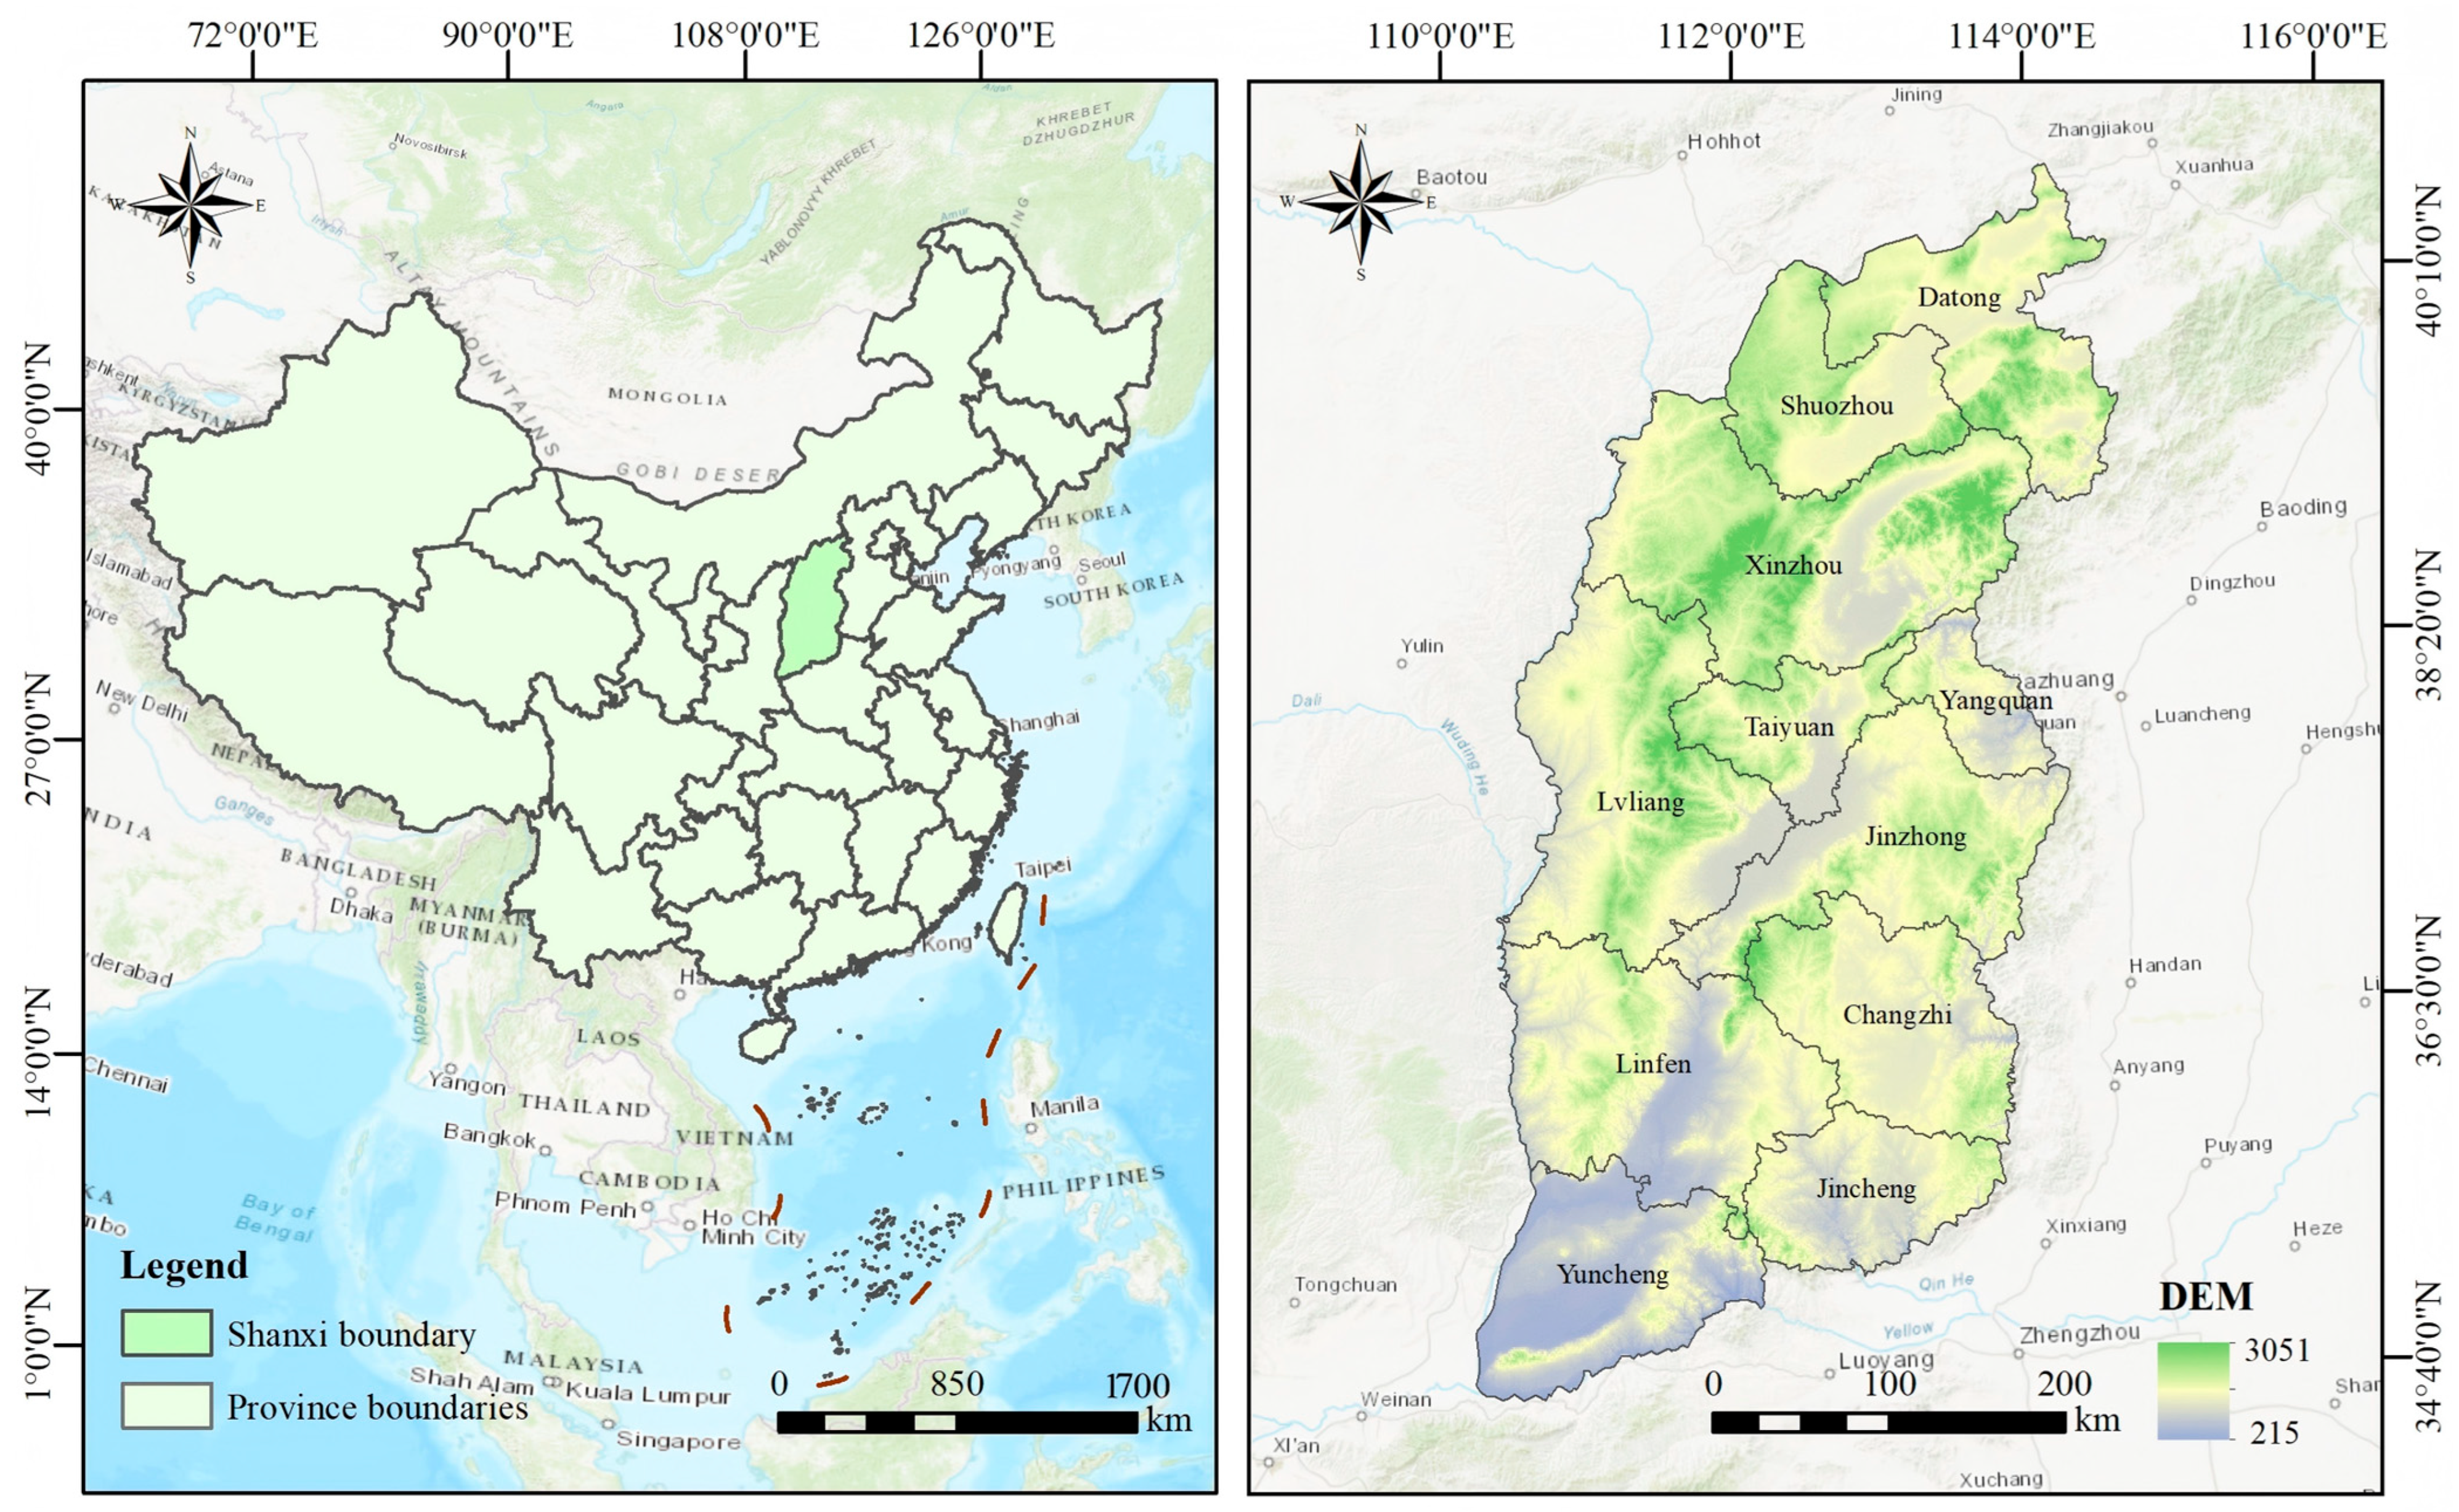
Figure 1. Study area.
Land 14 02280 g001
Figure 2. LUCC drivers.
Land 14 02280 g002
Figure 3. Research Framework.
Land 14 02280 g003
Figure 4. Contribution of LUCC drivers.
Land 14 02280 g004
Figure 5. Spatial distribution of LUCC from 2005 to 2020.
Land 14 02280 g005
Figure 6. Distribution of LUCC conversions from 2005 to 2020.
Land 14 02280 g006
Figure 7. Spatial distribution of LUCC under SSP-RCP scenarios in 2030.
Land 14 02280 g007
Figure 8. Distribution of LUCC conversions under SSP-RCP scenarios in 2030.
Land 14 02280 g008
Figure 9. Spatial distribution characteristics of CS in Shanxi province from 2005 to 2020.
Land 14 02280 g009
Figure 10. Spatial distribution characteristics of CS under multiple scenarios in 2030.
Land 14 02280 g010
Figure 11. Local spatial autocorrelation of CS distribution.
Land 14 02280 g011
Figure 12. Spatial distribution characteristics of CS driving factors.
Land 14 02280 g012
Figure 13. SEM of CS driving factors.
Land 14 02280 g013
Table 1. Data sources.
Data TypeData NameResolution/mData SourcesAccess Date
Land-use dataLand use30Resource and Environmental Science Data Platform
http://www.resdc.cn/
27 August 2025
Climate and environmental dataDEM30Geospatial Data Cloud
https://www.gscloud.cn/
27 August 2025
Slope30Based on DEM calculations-
Slope direction30
Average annual temperature1000Resource and Environmental Science Data Platform
http://www.resdc.cn/
28 August 2025
Average annual precipitation1000
Soil type1000
Socioeconomic dataPopulation density1000
GDP1000
Distance to railways1000National Earth System Science Data Center
https://data.cma.cn/
29 August 2025
Distance to provincial highways1000
Distance to national highways1000
Distance to motorways1000
Distance to primaryways1000
Distance to secondways1000
Distance to waterways1000
POI dataHotels-Open Street Map
https://www.openhistoricalmap.org/
30 August 2025
Shopping malls-
Financial industry-
Healthcare-
Government agencies-
Tourist attractions-
Science, education, and culture-
Catering services-
Table 2. Land-use transfer matrix.
SSP1_2.6SSP2_4.5SSP5_8.5
abcdefabcdefabcdef
a111110111111100010
b010000111010111010
c011100111111111011
d000100101101000100
e100010101011100010
f111111111111111111
Note: 1 indicates that land-use conversion is allowed, while 0 indicates it is not; a: cropland, b: forestland, c: grassland, d: water area, e: construction land, f: unused land.
Table 3. Neighborhood weight parameters.
Land-Use TypeCroplandForestlandGrasslandWater AreaConstruction LandUnused Land
Neighborhood weight0.280.130.600.020.990.01
Table 4. Carbon density (t/hm2).
Land-Use TypeCroplandForestlandGrasslandWater AreaConstruction LandUnused Land
Aboveground biomass2.5041.980.400.281.811.22
Belowground biomass0.3810.454.140.994.521.99
Soil organic matter86.3499.5380.1117.4866.0120.26
Dead organic matter0.951.790.081.160.260.91
Table 5. Land-use types and their trends from 2005 to 2020.
Land-Use Type200520102005–201020152010–201520202015–2020
Area
(km2)
Ratio
(%)
Area
(km2)
Ratio
(%)
Change
(%)
Area
(km2)
Ratio
(%)
Change
(%)
Area
(km2)
Ratio
(%)
Change
(%)
Cropland60,672.0338.70%58,046.4637.03%−4.3357,791.8136.87%−0.4457,781.5236.86%−0.02
Forestland43,761.9227.92%44,602.1128.45%1.9244,431.4328.34%−0.3844,472.7128.37%0.09
Grassland45,859.1629.25%44,850.0728.61%−2.2044,765.0228.56%−0.1944,279.8328.25%−1.08
Water area1734.681.11%1478.970.94%−14.741491.140.95%0.821504.210.96%0.88
Construction land4576.052.92%7672.374.89%67.678165.435.21%6.438608.215.49%5.42
Unused land155.850.10%110.000.07%−29.43111.770.07%7.06106.740.07%−9.37
Table 6. LUCC under SSP-RCP scenarios in Shanxi province in 2030 (km2).
Land-Use TypeSSP126SSP245SSP585
20302020–203020302020–203020302020–2030
Cropland55,109.30−2672.2255,729.14−2052.3855,061.14−2720.38
Forestland47,344.042871.3345,316.18843.4745,064.48591.77
Grassland43,336.44−943.3941,202.49−3077.3440,302.28−3977.55
Water area1699.81195.601698.60194.391337.34−166.87
Construction land9198.68590.4712,702.374094.1714,883.916275.70
Unused land64.93−41.81104.43−2.30104.06−2.68
Table 7. CS changes by land-use type in Shanxi province from 2005 to 2020 (Tg).
land-Use Type2005201020152020
Cropland547.08523.40521.11521.02
Forestland672.84685.76683.13683.77
Grassland388.56380.01379.29375.18
Water area3.452.942.972.99
Construction land33.2255.7059.2862.50
Unused land0.380.270.270.26
Table 8. Changes in CS by land-use type in 2030 (Tg).
Land-Use TypeSSP126SSP245SSP585
Cropland496.92502.51496.49
Forestland727.91696.74692.87
Grassland367.19349.11341.48
Water area3.383.382.66
Construction land66.7892.22108.06
Unused land0.160.250.25
Disclaimer/Publisher’s Note: The statements, opinions and data contained in all publications are solely those of the individual author(s) and contributor(s) and not of MDPI and/or the editor(s). MDPI and/or the editor(s) disclaim responsibility for any injury to people or property resulting from any ideas, methods, instructions or products referred to in the content.