Article

Spatial–Temporal Characteristics and Influencing Factors of Shrinking County Towns’ Resilience in China

1
Harbin Institute of Technology, School of Architecture and Design, Harbin 150006, China
2
Key Laboratory of National Territory Spatial Planning and Ecological Restoration in Cold Regions, Ministry of Natural Resources, Harbin 150006, China
*
Author to whom correspondence should be addressed.
Land 2025, 14(11), 2202; https://doi.org/10.3390/land14112202
Submission received: 9 October 2025 / Revised: 31 October 2025 / Accepted: 4 November 2025 / Published: 6 November 2025
(This article belongs to the Special Issue Planning for Sustainable Urban and Land Development, Second Edition)

Abstract

Enhancing shrinking county towns’ resilience (SCTR) is crucial for fostering high-quality development and supporting China’s new urbanization strategy. However, research on resilience in shrinking areas remains limited, particularly at the county level—characterized as an “urban-rural intermediary”. In this study, we develop an evaluation framework based on a coupled human–environment perspective. Using this framework, we assess SCTR across various regions and levels of shrinkage in China from 2013 to 2022, while analyzing the coupling coordination degree among subsystems. To address challenges such as nonlinearity, spatial heterogeneity, and interpretability in attribution analysis, we integrate the Geographically Weighted Random Forest (GWRF) model with the SHapley Additive exPlanation (SHAP) model. The results show a gradual increase in resilience throughout the study period. Spatially, a distinct East–West disparity emerges, with higher resilience in the East and lower resilience in the West, as delineated by the Hu Line. For extreme-shrinking counties, population decline has become a paramount constraint on their resilience. Key factors, including local fiscal revenue, GDP, the Gini coefficient, and urbanization levels, have a significant impact on SCTR. Notably, in counties undergoing severe or extreme shrinkage, population decline has become a critical barrier to resilience. This study provides scientific insights and policy recommendations for the development of a sustainable and resilient county-town system in China.

1. Introduction

Urban shrinkage has become a prominent field within urban development research [1,2,3]. This phenomenon is not limited to large cities; it is also distinctly evident in the development of small towns [4,5]. Unlike the more localized shrinkage observed in major cities [6,7,8], small towns tend to experience more extensive and holistic patterns of contraction [9,10]. In China, the world’s largest developing country, 53% of county towns experienced population contraction between 2010 and 2020 [11], with a reduction of over 40 million working-age individuals. This population decline in county towns has emerged as a critical issue, significantly hindering the coordinated regional development of China.
County towns serve as connectors, transitional zones, and intermediaries between urban and rural areas [12]. As such, they are exposed to multiple and often overlapping pressures, including climate change, resource depletion, and land loss caused by urban expansion [13]. However, population shrinkage has exacerbated these challenges, resulting in more complex and detrimental consequences [14,15]. This is particularly evident in population loss and the decline in economic vitality, which directly hinder the socio-economic development of rural areas [16,17]. Additionally, it gives rise to challenges such as an aging labor force, vacant housing, and surplus infrastructure [18,19,20]. These issues significantly undermine the flexibility, adaptability, and resilience of county towns in responding to external disruptions [21]. Therefore, systematically identifying the developmental challenges faced by shrinking county towns and exploring strategies to enhance their resilience holds considerable theoretical and practical importance.
Faced with the multiple challenges posed by urban shrinkage, traditional growth-oriented urban planning models have become increasingly unsuitable. How can county towns effectively respond to external pressures and internal dynamics while fostering sustainable development? In this context, the development of resilient county towns has become a key strategy to address population decline, mitigate disasters impacts, and promote high-quality regional development in China [22]. The concept of resilience reflects inherent attributes such as support, resistance, and the capacity for transformation [23,24]. Resilience research spans multiple scales, ranging across national [25], regional [26], city [25,27], county [12], rural [17,28], and community levels [29]. Resilience research is typically divided into two categories: (1) normalized scenarios, which evaluate resilience across economic, social, environmental, industrial, infrastructural, and policy dimensions [30,31]; and (2) risk scenarios, which examine responses to disturbances such as climate change [32], technological innovation [33], and geological hazards [34]. Theoretical resilience studies are supported by several key frameworks, including the disturbance–response framework [35,36], the socio-ecological framework [28,37,38], the adaptive cycle framework [39,40], and other classical models [41]. The convergence of resilience theory and regional development goals has emerged as a critical research frontier, underpinning efforts to foster urban systems with long-term adaptive capacity and resilience to disturbances.
Although existing studies on urban shrinkage and resilience have yielded valuable insights, limited attention has been paid to three critical aspects. First, research on the resilience of shrinking county towns remains limited. Most studies on urban shrinkage resilience and related strategies have focused on large cities [42,43,44]. This has led to the long-standing neglect of small towns, which play a vital role in the urban system [45,46,47]. County towns are a key element of China’s urban network and serve as a central engine for promoting regional health and sustainable development [48]. Investigating the resilience of shrinking county towns is directly linked to the success of urban-rural integration in China, thereby influencing the broader trajectory of new-type urbanization [49]. Second, existing studies remain heavily anchored in conventional frameworks [50,51], with insufficient attention to the distinct characteristics of urban shrinkage. Urban shrinkage is not simply characterized by population loss or economic decline; it fundamentally represents a profound reconfiguration of the human–environment relationship and spatial reorganization. Therefore, adopting a human–environment system coupling perspective is crucial. This perspective helps explore the complex mechanisms underlying resilience evolution and the adaptive transformation pathways throughout the shrinkage process. Finally, existing attribution models for urban resilience often overlook spatial heterogeneity and the nonlinear effects of explanatory variables. The impact of geographic location and shrinkage severity on the resilience of county towns is inherently complex and cannot be fully captured by linear assumptions. This underscores the necessity of employing advanced and robust analytical frameworks that can account for intricate spatial dependencies and nonlinear relationships. These frameworks will allow for a more precise understanding of how various factors affect resilience during urban shrinkage.
In this context, this study adopts a coupled human–environment perspective to examine the spatiotemporal evolution of SCTR in China. The research period spans from 2013 to 2022, focusing on county towns in China. This study identifies and assesses the resilience of shrinking county towns in China. The interactions among resilience subsystems are quantified using the Coupling Coordination Degree (CCD) model. Finally, mechanisms of influencing factors on SCTR are explored through a combination of GWRF and SHAP analysis. Theoretically, our work facilitates deeper insight into SCTR, and expands the body of research on urban shrinkage and resilience. Furthermore, it will provide administrators and decision-makers with both perspectives and quantitative tools to assess policy responses in planning.

2. Materials and Methods

2.1. Study Area

This study focuses on county towns in China. The study excludes the Inner Mongolia Autonomous Region due to the lack of key statistical data for its administrative units. Regions such as Hong Kong, Macao, and Taiwan are also excluded due to data limitations. By 2022, China had 1472 county towns, including autonomous counties, banners, autonomous banners, forestry regions, and special economic zones. The lack of data for the 60 units within Inner Mongolia excludes them from the quantitative assessment. Therefore, this study focuses on the remaining 1412 county towns as the research units and identifies the shrinking towns over the study period. These shrinking towns are the primary units for assessing the SCTR. To explore the spatiotemporal dynamics of shrinkage across different regions, the study integrates seven geographical zones, as shown in Figure 1. This was done to compare the shrinkage of county towns and SCTR in different regions.

2.2. Data Source

The data employed in this study fall into three primary categories: the socioeconomic statistics, the natural environment data, and the GIS data. (1) Socioeconomic statistical data was obtained from statistical yearbooks of different cities and counties for 2013–2022. These data include information on population, GDP, per capita GDP, and per capita agricultural production, among others. (2) The natural environment data include DEM, NDVI, land use data, and precipitation. (3) GIS data were sourced from the National Geomatics Center of China (http://www.ngcc.cn, accessed on 5 January 2025). Given the long time span of study, 2022 county-level administrative boundaries were uniformly adopted. This ensured consistency across the research period.
To improve the accuracy of spatial analysis, remote sensing imagery, vector data, and other spatial data were standardized to the WGS 84 coordinate system and UTM projection using ArcGIS 10.5 software. Linear interpolation was utilized to impute missing data for specific years. The research data and its sources are presented in Table 1.

2.3. Understanding the SCTR Framework from a Coupled Human–Environment System Perspective

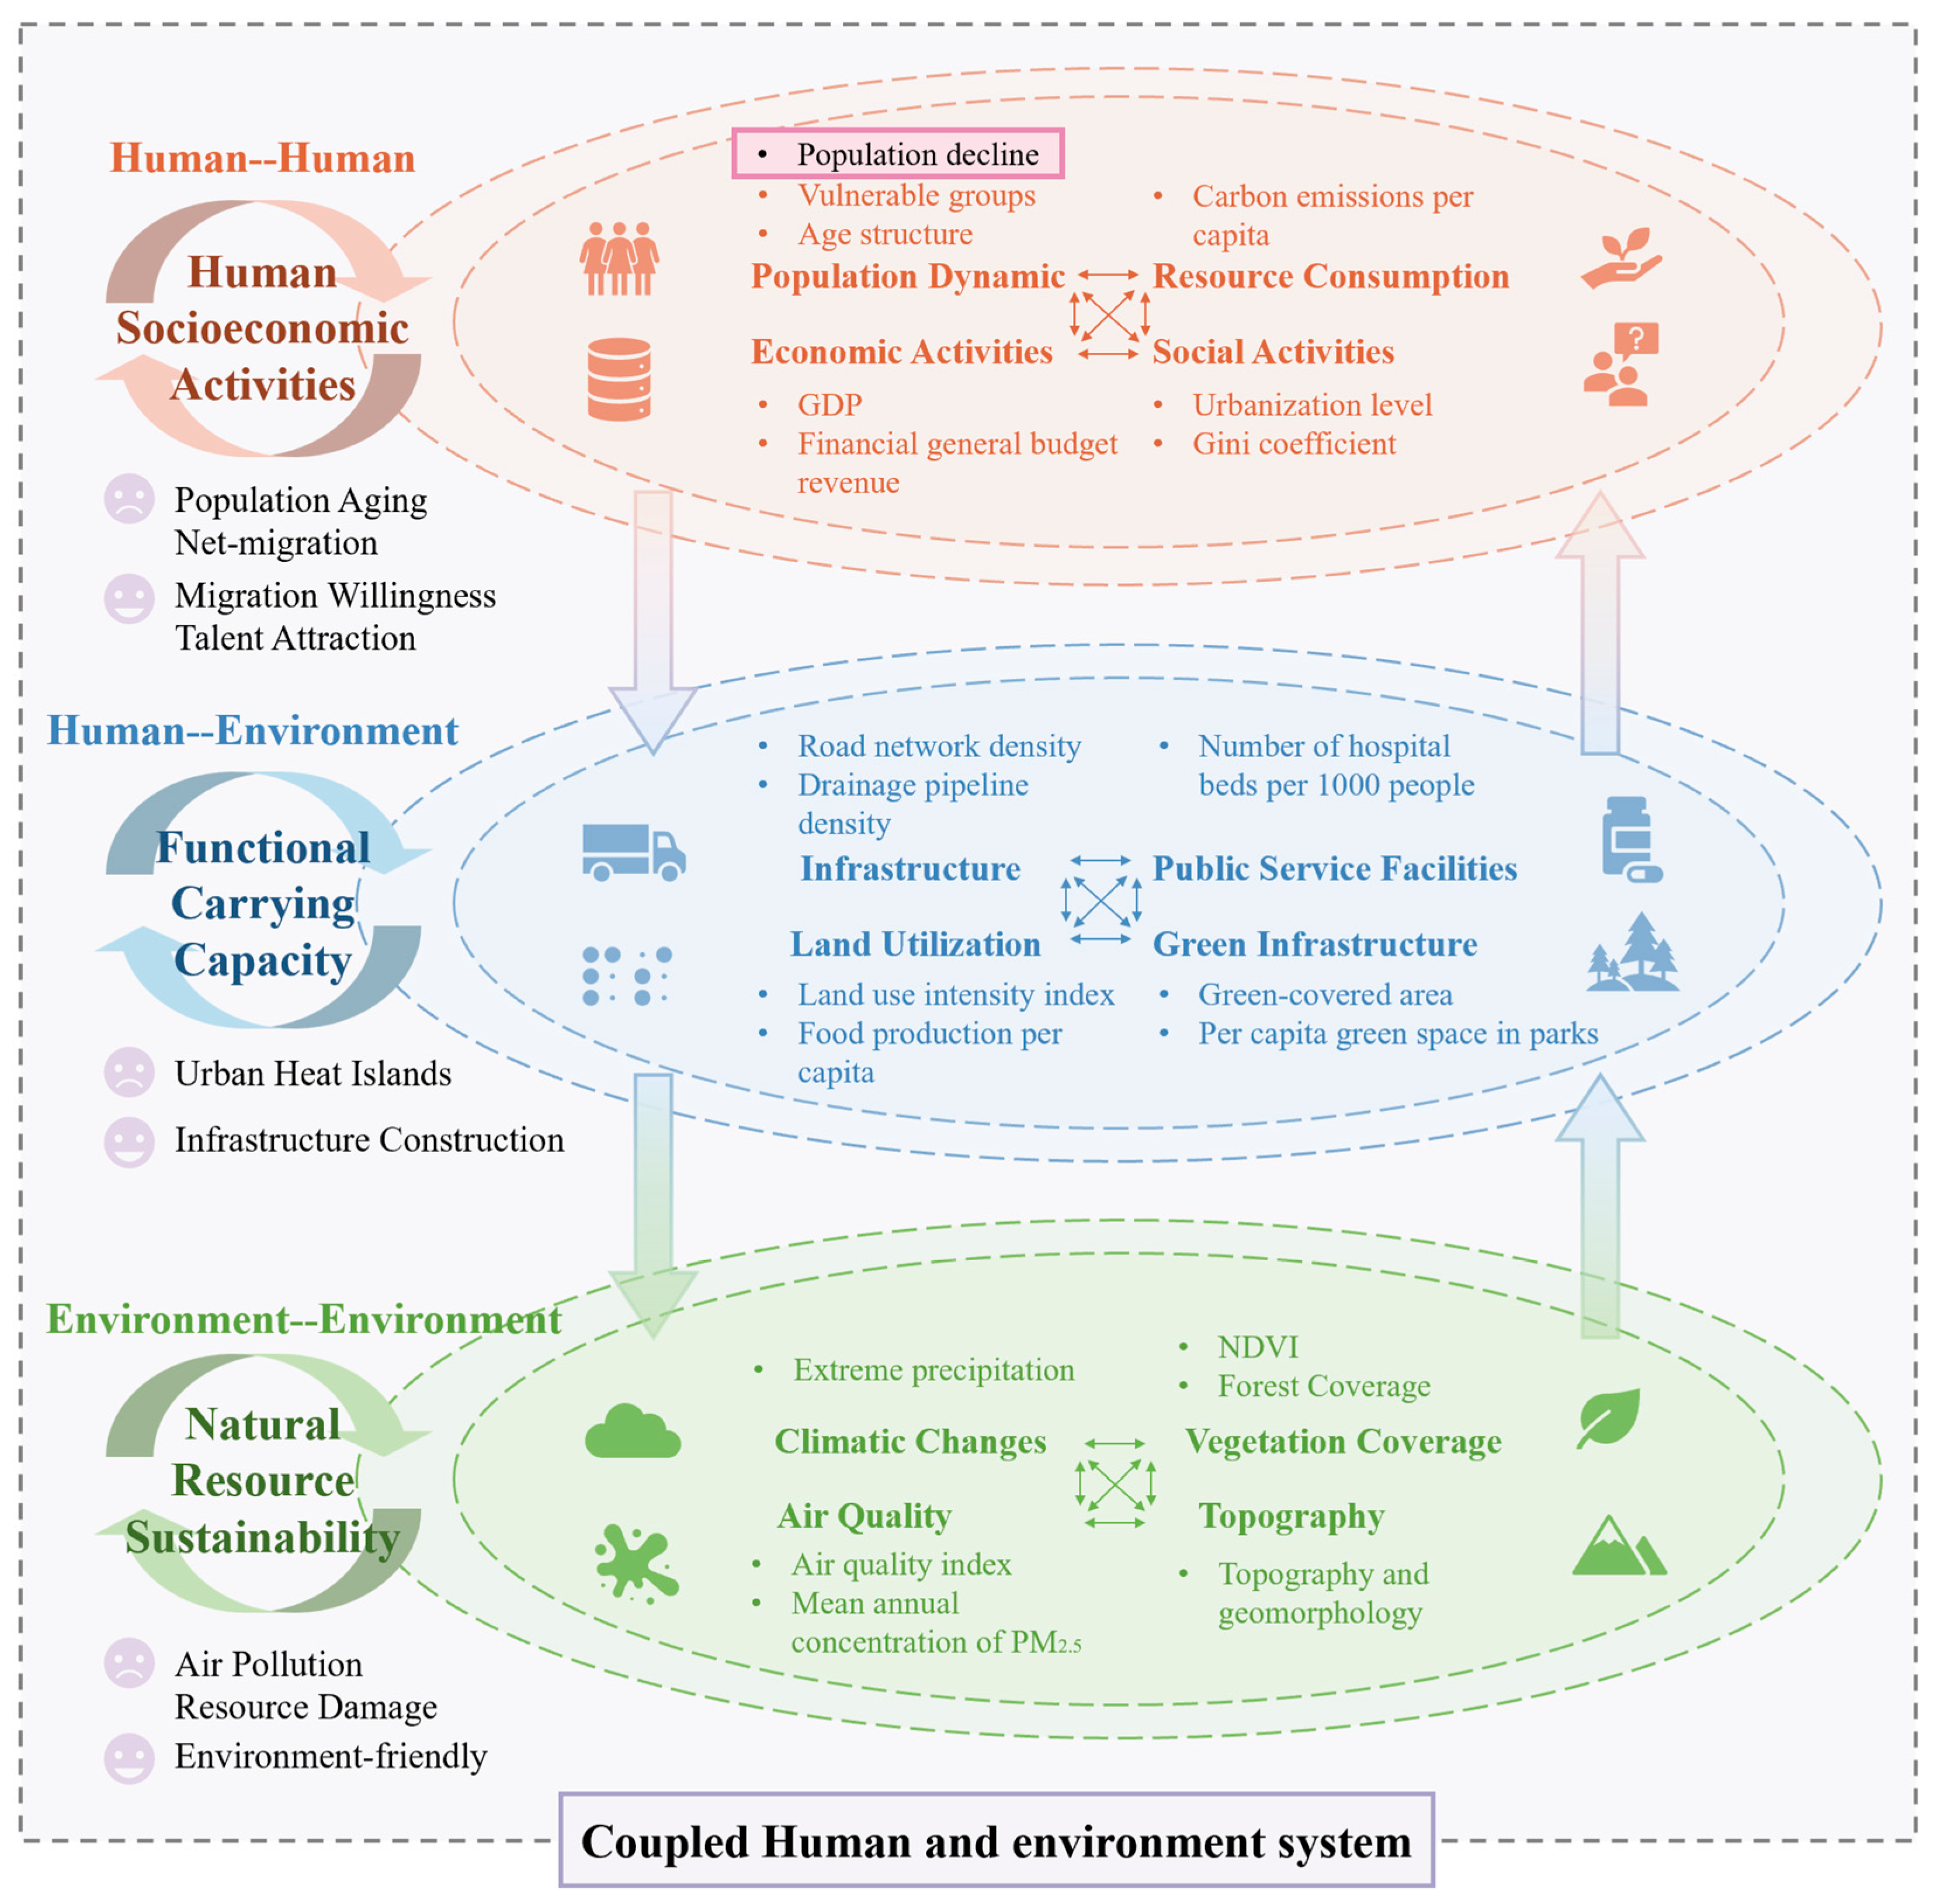
The coupled human–environment system has emerged as a critical theoretical framework for understanding interactions between human societies and the environment [52]. It transcends the binary opposition between anthropocentrism and environmental determinism by conceptualizing humans and the environment as a tightly integrated whole. This framework emphasizes their interdependence and mutual reinforcement [53,54,55,56]. Specifically, this system comprises three types of coupling relationships: (1) Environment-environment coupling, involving the exchange of materials and energy among natural subsystems; (2) Human–environment coupling, which supports human development activities through the provision of natural resources, typically reflected in the functional carrying capacity of urban infrastructure and spatial systems; (3) Human–human coupling, manifested in interactive feedback loops across individuals, groups, and institutions in social and economic activities. The coupled human–environment system is complex, dynamic, interconnected, and intrinsically integrated [55,57,58]. At its core, it emphasizes a dialectical relationship between humans and the environment, characterized by mutual embeddedness, tension, and synergy. Understanding these intricate dynamics is central to sustainability science [59], and essential for formulating region-specific pathways to sustainable development [60,61] (Figure 2).
Resilience theory has become a key analytical lens for unpacking the complex processes, consequences, and adaptive responses within coupled human–environment systems [62,63,64,65]. It focuses on a system’s ability to maintain core functions, adapt to external changes, and transform when necessary. In resilience theory, interactions between human and environmental systems are regarded as key drivers that maintain systemic balance or induce structural transformation [66]. Human socioeconomic activities continuously influence environmental conditions, which in turn feedback to reshape human behavior and institutional responses [67].
County towns, as prototypical coupled human–environment systems, rely on the coordinated functioning of human–human, human–environment, and environment-environment subsystems for their sustainability and resilience [68,69]. These systems demonstrate dynamic regulatory capacities, such as threshold avoidance and adaptive responses to disturbances [70]. Resilience theory offers a powerful framework to explore these nonlinear dynamics and uncover the feedback mechanisms underlying human–environment interactions.

2.4. Methods

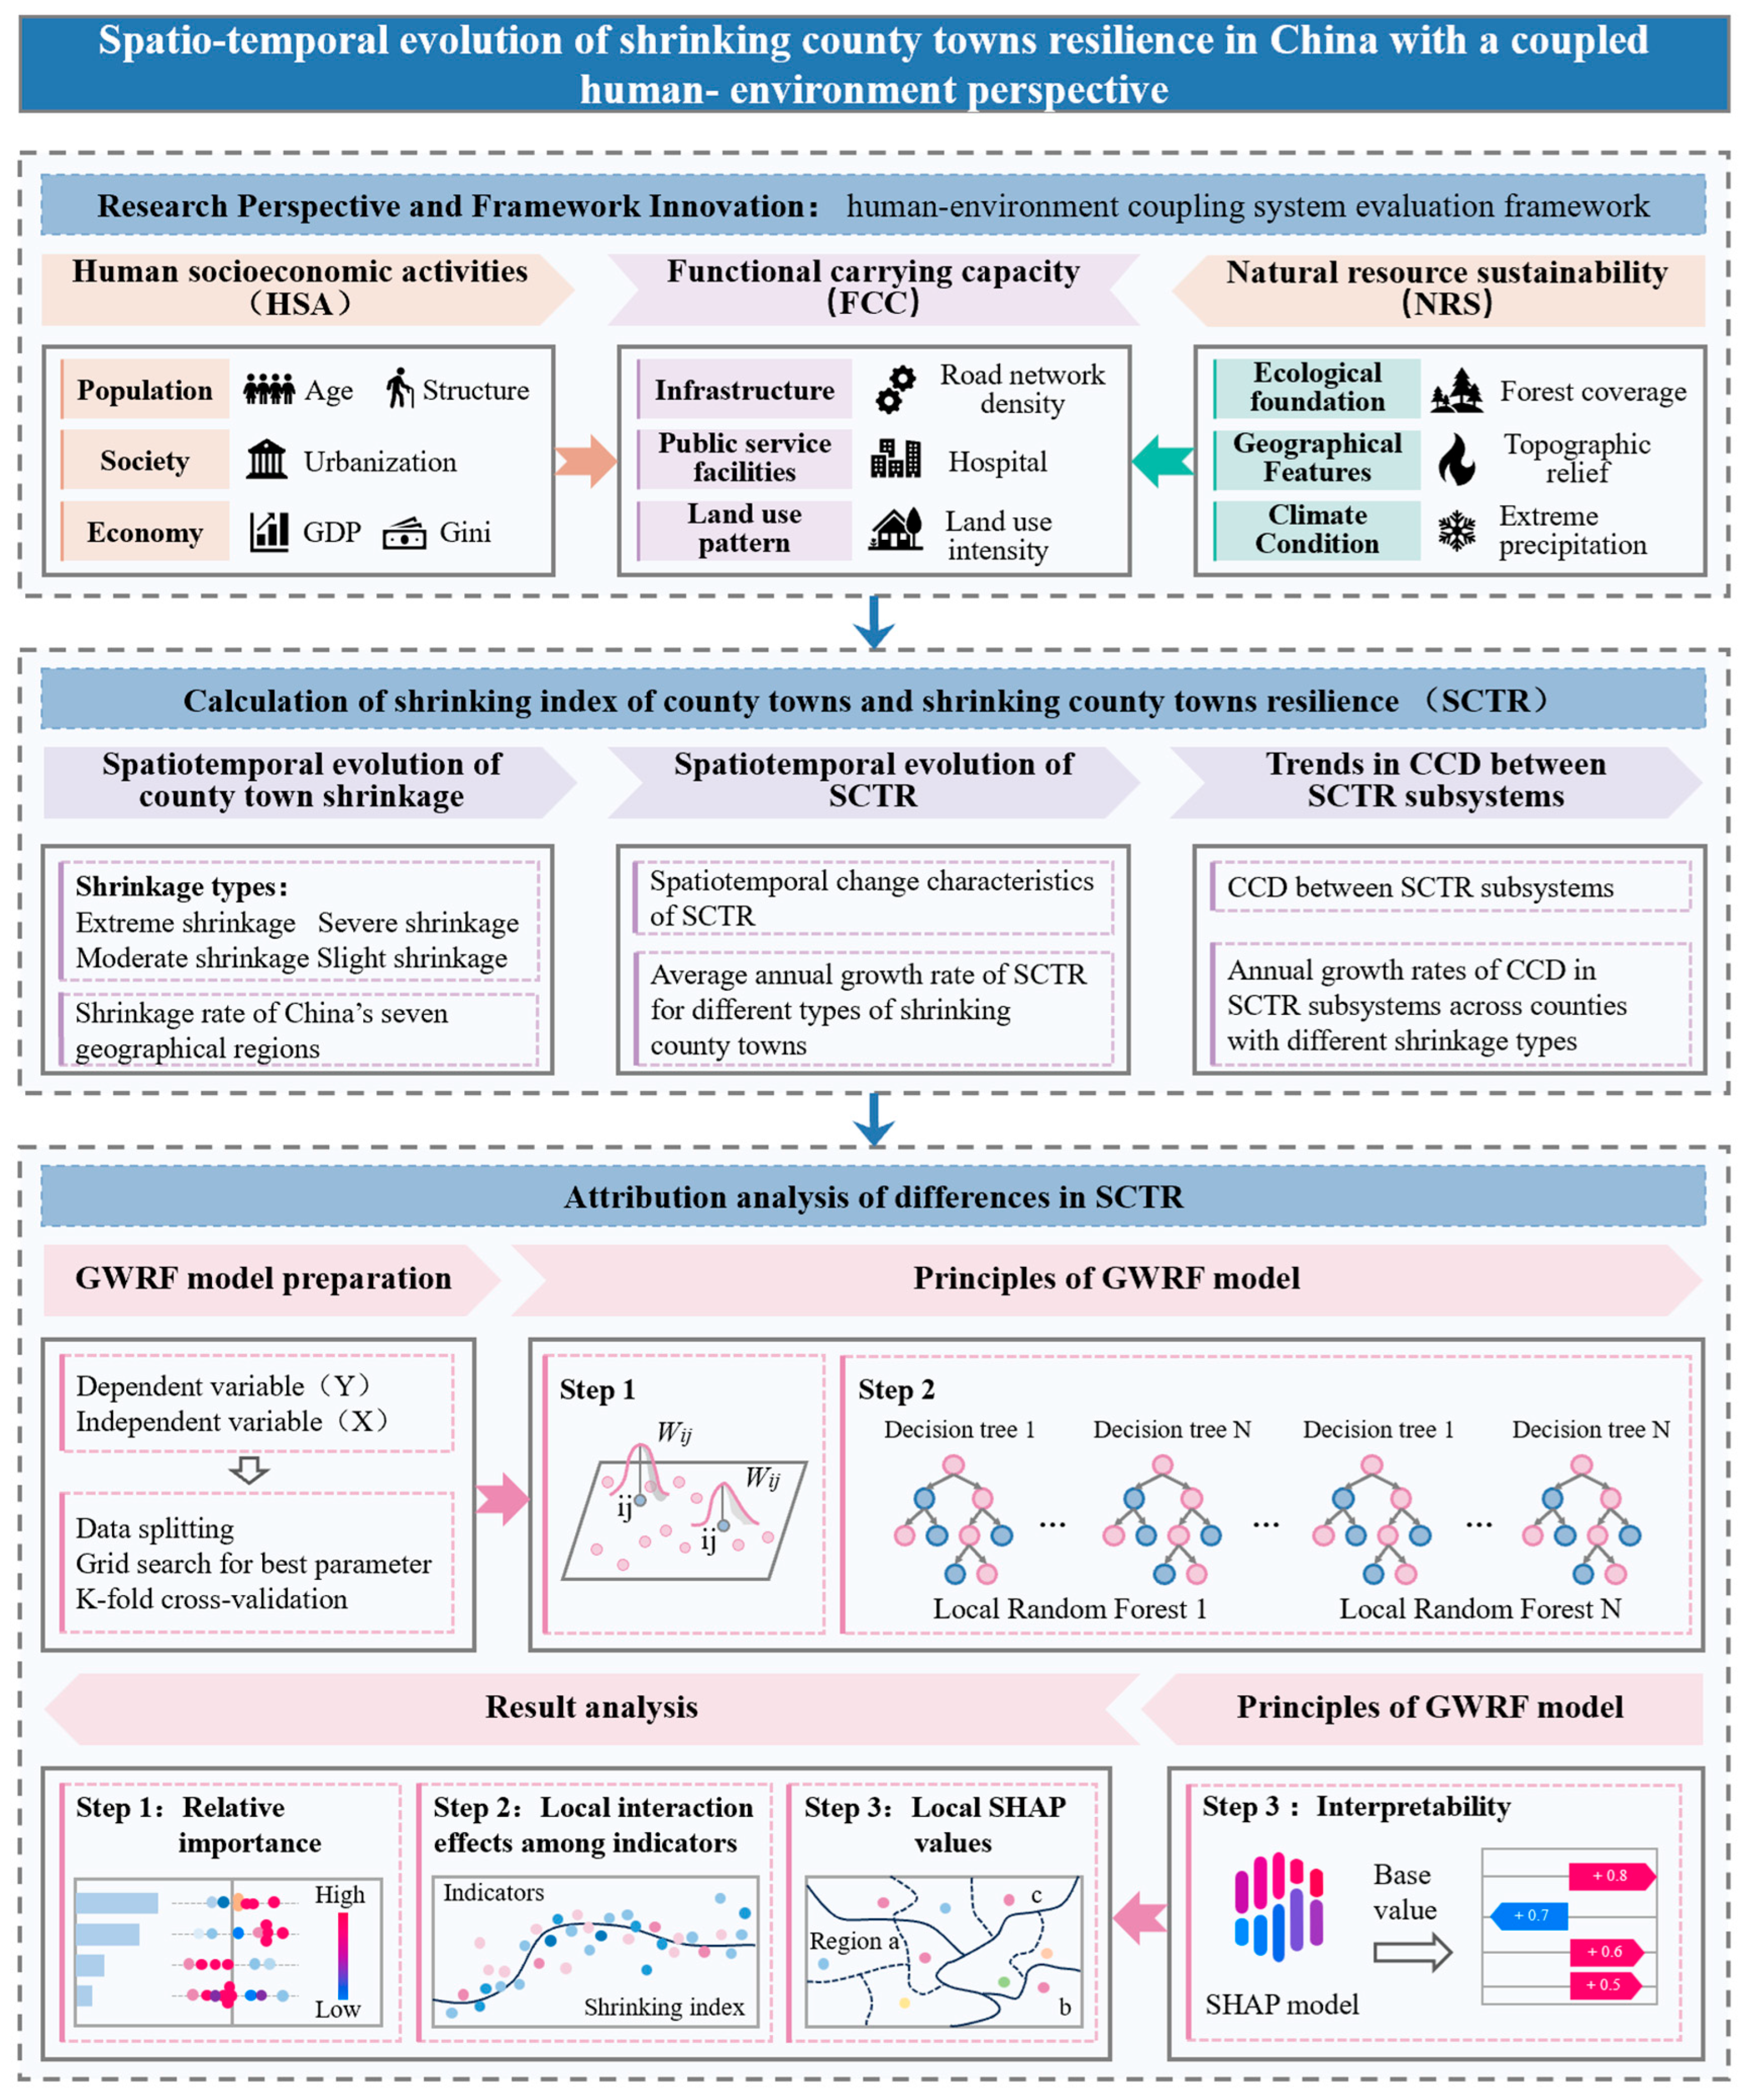
This study aims to evaluate SCTR from a coupled human–environment perspective and to conduct an attribution analysis. The research workflow is illustrated in Figure 3.

2.4.1. Identification and Classification of County Town Shrinkage

Population decline is widely recognized as a primary indicator of urban shrinkage [3,71,72]. In this study, the rate of county towns shrinkage, which is used to determine whether a county town has experienced shrinkage, is calculated as follows:
R i = p o p t 2 p o p t 1 p o p t 1 × 100 %
where R i means the total population change rate for county town between t 1 and t 2 in county town i ; p o p t 2 and p o p t 1 denote the total population at the end of the years t 1 and t 2 , respectively.
The definition of urban shrinkage adopted in this study is derived from the Shrinking Cities International Research Network (SCIRN). A negative CTSR value signifies that a county town is undergoing shrinkage, with lower CTSR values corresponding to a greater severity of shrinkage.
For a more in-depth analysis of spatiotemporal variations in urban shrinkage across China, the county towns shrinkage rate was categorized into four levels at the spatial dimension [47] (Table 2).

2.4.2. Evaluation Model of SCTR

(1) Data standardization and weighting
The index system includes indicators with different measurement units, necessitating the standardization of the indicators prior to the comprehensive evaluation. In this study, the extreme-value method was employed to standardize the data, transforming the values into a range of 0 to 1 to facilitate comparability. The following equations were used:
Positive indicator:
Z i j = X i j X i   m i n X i   m a x X i   m i n
Negative indicator:
Z i j = X i   m a x X i j X i   m a x X i   m i n
where Z i j is the standardized value; X i j is the original value of the indicator j ; X i   m a x and X i   m i n are the maximum and minimum values of indicator j , respectively.
The Entropy Weight Method offers an objective approach to weighting, effectively mitigating errors caused by subjective factors [40]. The smaller the entropy value calculated by the entropy weight method, the greater the weight of the index, and vice versa [73]. The Entropy Weight Method is used to calculate the information entropy and weight for each indicator, with the following formula:
The indicator’s information entropy is calculated as follows:
P i j = Z i j i = 1 n Z i j
where P i j is the proportion of the ith county to the whole under the jth indicator (%); n is the total number of counties.
e j = k i = 1 n p i j ln p i j , j = 1 ,   ,   m
k = 1 ln n
where e j is the information entropy of the jth indicator satisfying e j 0 ; k is a calculated coefficient; j is the jth county resilience indicator; and m is the number of indicators.
Indicator weights are determined as follows:
w j = 1 e j j = 1 m 1 e j
where e j refers to information entropy redundancy; and w j is the weight of each indicator.
(2) Calculation of SCTR
The SCTR is used to measure shrinking county towns’ resilience. The expression is shown in Equation (8):
S C T R i = j = 1 n Z i j w j
where Z i j is the standardized value of each indicator; n is the number of indicators of the system; w j is the weight of each indicator; S C T R i represents the resilience of county town i .

2.4.3. Establishment of an Index System for Evaluating SCTR

Based on the aforementioned theoretical framework, the SCTR evaluation system is structured around three core subsystems: natural resources sustainability (NRS), functional carrying capacity (FCC), and human socioeconomic activities (HAS).
NRS is the most fundamental pillar of resilience in county towns. It encompasses not only basic indicators such as water resource endowment, vegetation coverage, and topographical features, but also places particular emphasis on critical factors like climate adaptability and environmental quality. Through their spatial distribution and interdependent interactions, these natural elements shape the ecological foundation of shrinking counties [74].
FCC refers to the spatial interface between human and environmental systems. It comprises infrastructure, public service facilities, and land use patterns. Collectively, these elements define the capacity of county towns to support population agglomeration and socioeconomic activities. They form a vital foundation for the stable operation of the entire system.
HAS includes population dynamics, economic performance, resource consumption, and social interaction. The system assesses migration trends, population growth rates, and shifts in age structure under conditions of shrinkage. In the economic dimension, it considers both growth potential and the equitable distribution of wealth [75]. Additionally, patterns of resource consumption and social interactions are included to capture the impact of human activities on the human–environment relationship. As shown in Table 1, the SCTR evaluation framework integrates NRS, HAS and FCC. This framework provides theoretical and practical guidance for improving human–environment coordination in shrinking counties, ultimately contributing to the sustainable development of county towns.
Based on collinearity testing conducted using SPSS (version 24) software, indicators with a VIF > 7.5 [76], including the number of permanent residents, proportion of young people, and night-time lighting index, were excluded. The final evaluation system includes 26 robust indicators, forming a scientifically grounded framework for assessing the SCTR (Table 3).

2.4.4. Coupling Coordination Degree Model (CCD)

Subsystems exert mutual influences on one another and collectively determine the overall level of SCTR. A high level of coupling and coordination among these resilience subsystems serves to enhance urban resilience [77,78]. Coupling Coordination Degree (CCD) serves as an established metric used to quantify and evaluate the degree of coordination and coupling among two or more systems [79]. To inform the construction of SCTR, we employ the CDD to evaluate the coordination degree among subsystems. The formula is constructed as follows:
C = U ( H ) × U ( F ) × U ( E ) U H + U F + U ( E ) 3 1 3
T = α U ( H ) + β U ( F ) + ω U ( E ) , α + β + ω = 1
C C D = C × T
where C is the coupling degree of the SCTR complex system, with values ranging from 0 to 1; T reflects the degree of complementary relationship among subsystems; α , β , ω represent undetermined coefficients, denoting the contribution of each subsystem.
The overall SCTR level fundamentally relies on the interdependence and coordinated operation of the three subsystems. No subsystem can independently determine the overall resilience; any imbalance in the coordination of one subsystem will limit the effectiveness of the others. Therefore, we assumed that the three subsystems hold equivalent importance, thus setting α = β = ω .
To more effectively evaluate the coupling level and coordinated development degree among the three subsystems, this study adopts a classification scheme proposed by previous studies [78]. The evaluation criteria are presented in Table 4.

2.4.5. Underlying Mechanisms of Influencing Factors on SCTR

Accurately revealing the impacts of influencing factors on SCTR is critically important to advancing resilience-building efforts in these contexts. We contend that in the analysis of SCTR’s driving mechanisms, the consideration of nonlinear characteristics and spatial heterogeneity are critical prerequisites for safeguarding the credibility of attribution findings.
While machine learning models excel at capturing nonlinear correlations between variables [80], they are plagued by two notable limitations. First, they often fail to account for the inherent spatial heterogeneity of geospatial variables [81]. Second, their ‘black-box’ nature has been widely criticized in the literature [82]. These shortcomings not only constrain their utility in spatial data modeling but also undermine the credibility of attribution outcomes [83]. By comparison, the Geographically Weighted Random Forest (GWRF)—a spatial machine learning (SML) approach—enables robust interpretation of the spatial heterogeneity exhibited by variable importance [84]. Concurrently, the SHapley Additive exPlanations (SHAP) framework facilitates substantial improvements in the interpretability of machine learning models without sacrificing model predictive accuracy [85,86]. Together, these considerations highlight that the combined application of GWRF and SHAP offers significant potential for addressing key challenges in SCTR attribution. These include identifying nonlinear relationships, analyzing spatial heterogeneity, and enhancing model interpretability.
(1) GWRF model
The GWRF model combines the nonlinear feature learning capability of Random Forest (RF) with the spatial weighting mechanism of Geographically Weighted Regression (GWR) [81,87]. This integration allows the GWRF to pinpoint critical environmental predictors and uncover the spatial variability patterns of these predictors across diverse regions [88,89].
Both spatially weighted variables and original characteristic variables were utilized as independent variables [90,91]. We divided the dataset into training (80%) and test sets (20%), ensuring model reliability and generalizability [90,91]. Through repeated experiments, the number of decision trees (ntree) for the GWRF model was set to 500, as this configuration consistently yielded strong predictive performance. For regression tasks, the number of variables sampled at each split (mtry) was set to one-third of the total number of predictors—given 26 predictors in this study, mtry was determined to be 8. This parameter setting helps reduce prediction errors and enhance model stability [92].
The mathematical formulation of GWRF is as follows:
Y i = a u i , v i + ε i
where a u i , v i represents the prediction of the RF model calibrated at location i , and u i , v i denotes the coordinates of spatial unit i , and ε i is the error term.
Additionally, the Grid Search and K-fold cross-validation method was utilized to determine the optimal parameters of the GWRF—a strategy that mitigates the risks of overfitting and data imbalance. The performance indices included the R-squared ( R 2 ), Root Mean Squared Error ( R M S E ) and Mean Absolute Error ( M A E ). Table 5 indicates the optimized parameters and performance of the GWRF model.
R 2 = 1 i y i y ^ i 2 i y i y ¯ i 2
R M S E = i = 1 n y i y ^ i 2 n
M A E = i = 1 n y i y ^ i n
where y i is the statistical value of SCTR i , y ^ i is the sum of the weight simulation values of each cell of county i , and y ¯ i is the average value of SCTR.
(2) SHAP value interpretation
SHAP functions as a game theory-derived framework for interpreting machine learning model predictions, achieved by allocating each feature’s contribution across the entire set of inputs [85,86] To address the limitations associated with the “black box” characteristic of machine learning models, the SHAP model is integrated with the GWRF model. The calculation formula for the Shapley value of feature i is as follows:
i = S N i S ! N S 1 N ! f x S i f x S
where i denotes the Shapley value of the i -th feature; S represents a subset of N that excludes the i -th feature; f x S i is the model output when the i -th feature is included; f x S is the model output excluding the i th feature.
The GWRF model and SHAP were redeveloped using Python 3.11 and libraries like scikit-learn and shap.

3. Results

3.1. Spatiotemporal Evolution of County Town Shrinkage

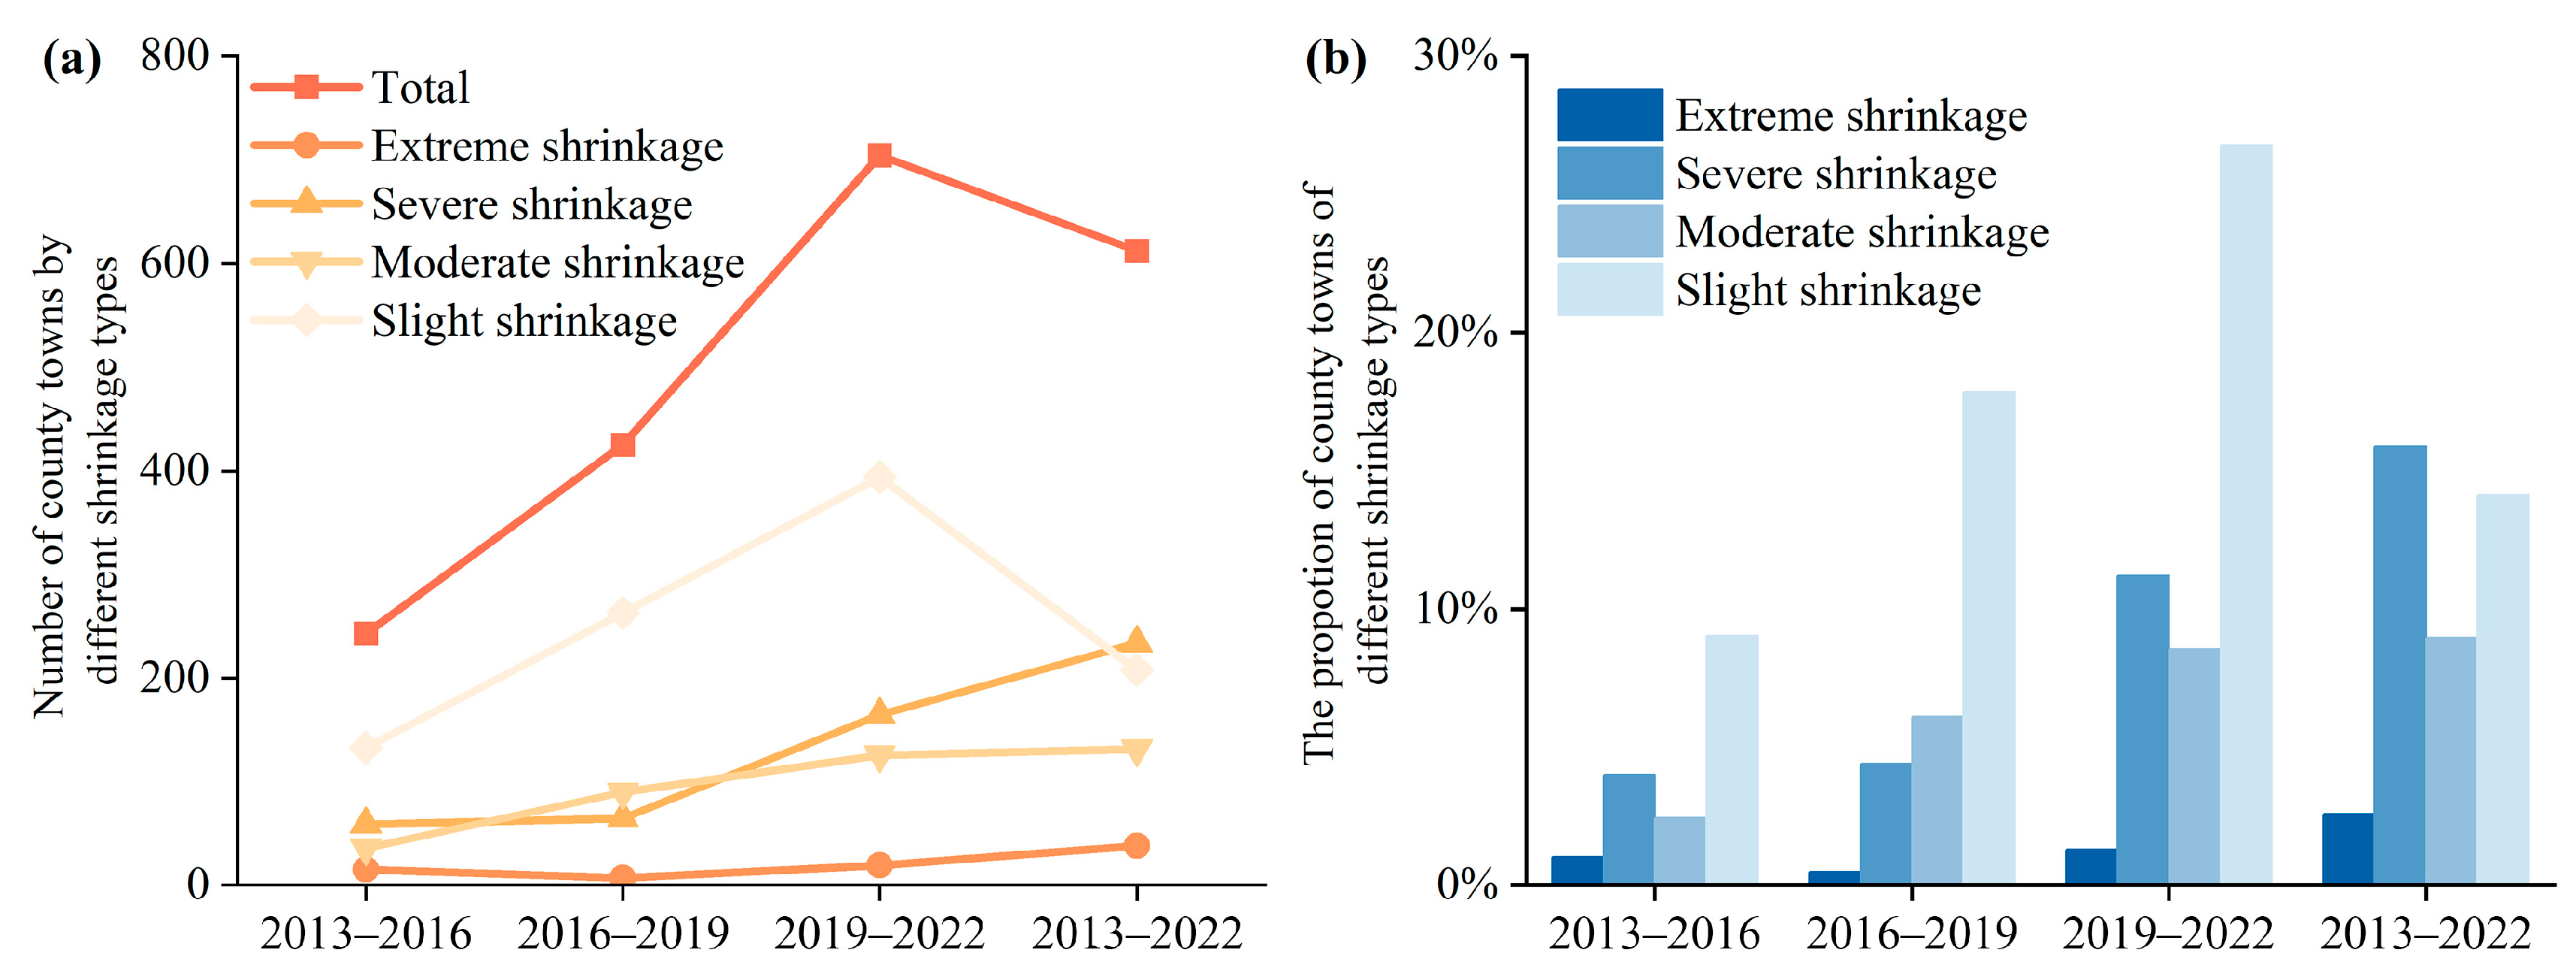
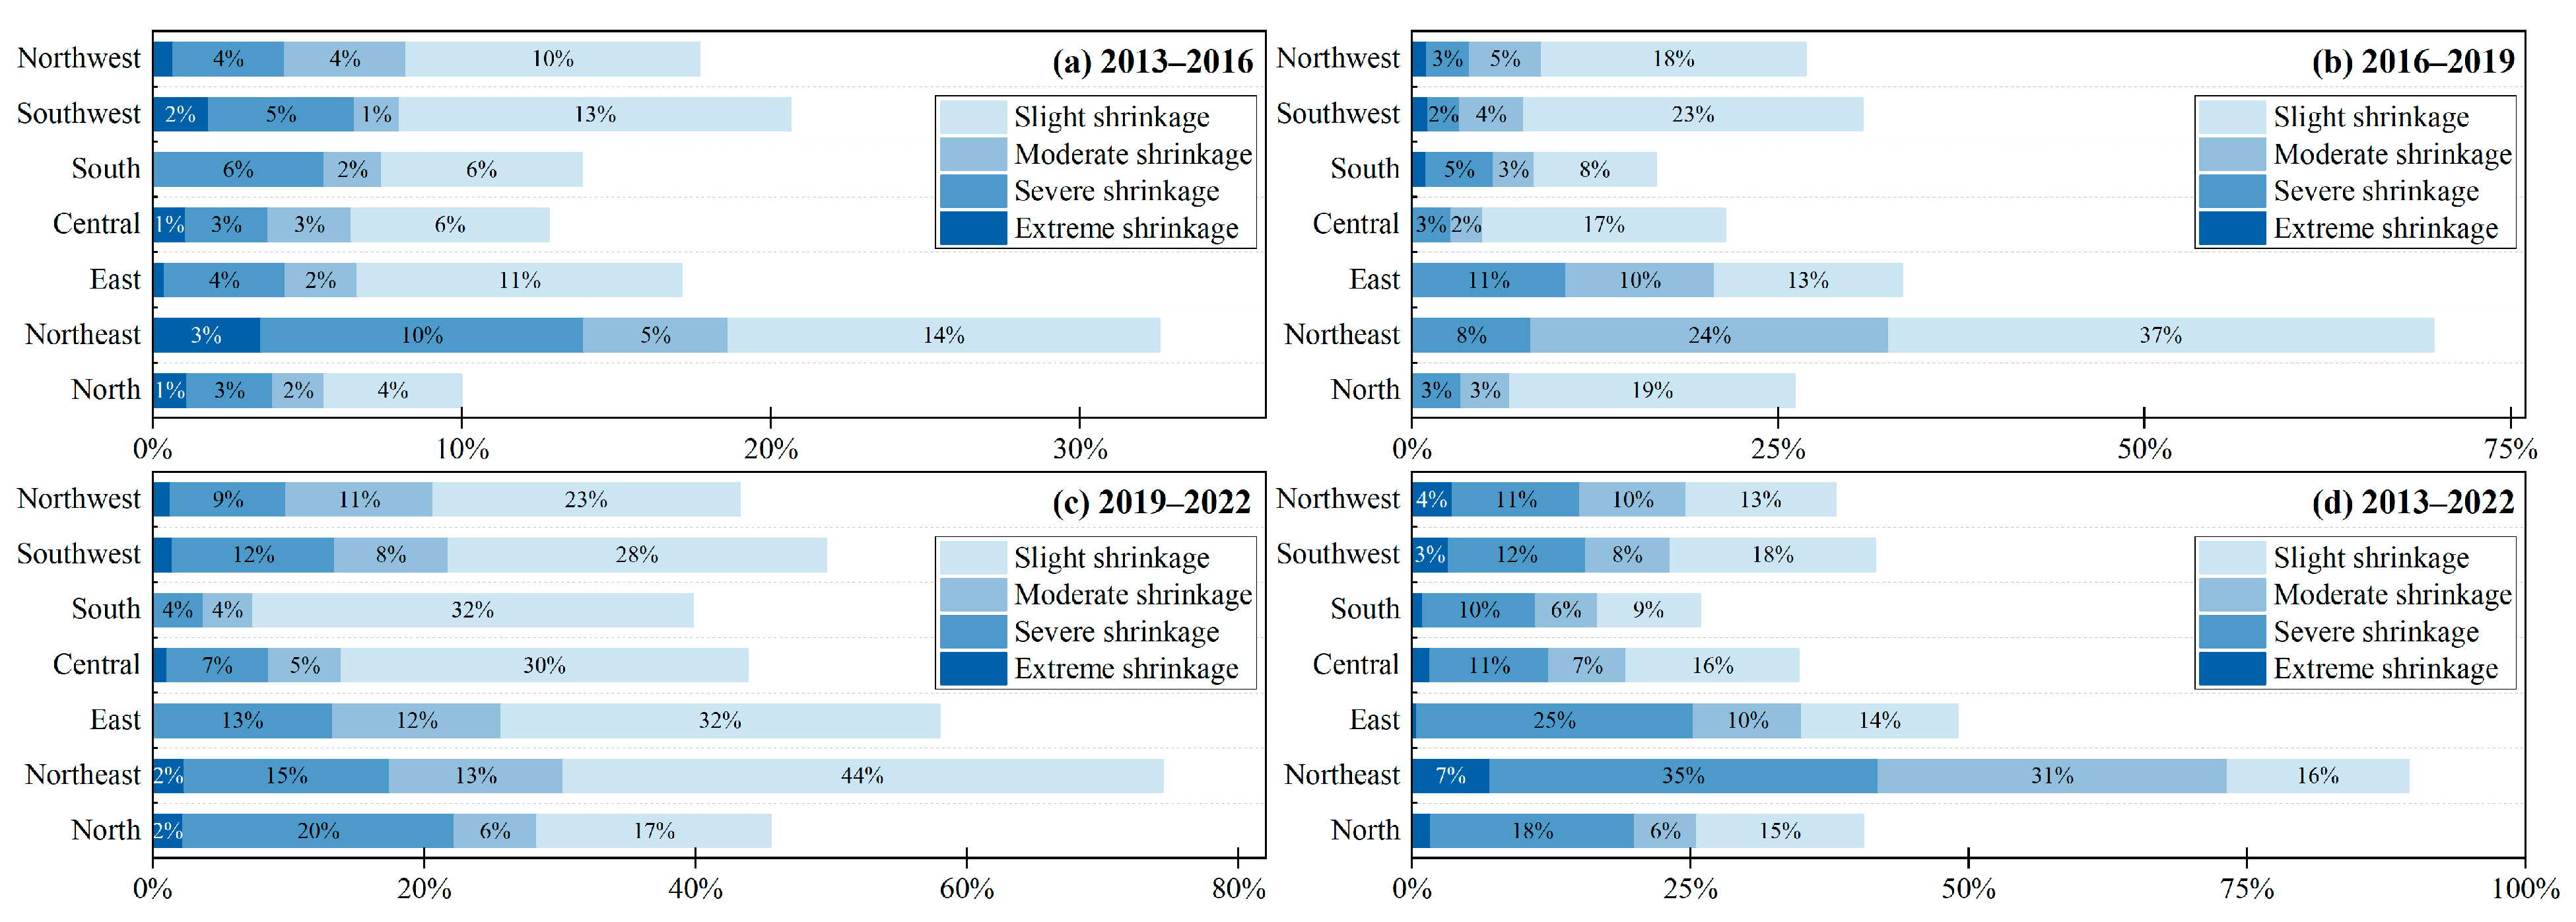
From 2013 to 2022, the number and severity of shrinking towns across China rapidly increased as shown in Figure 4. During the specific time period of 2013–2016, 240 county towns experienced population shrinkage. Among them, slight shrinkage was the predominant type, accounting for 54.16% of all shrinking county towns. Between 2016 and 2019, the number of shrinking county towns rose to 418, constituting 28.4% of the total. However, from 2019 to 2022, 694 county towns experienced shrinkage, with the proportion rising sharply to 47.15%. The number of moderate and extreme shrinkages has increased significantly, accounting for 17.87% and 23.06% of all shrinking county towns, respectively. From 2013 to 2022, a total of 604 county towns in China experienced shrinkage, accounting for 41.04% of the national total. Overall, county town shrinkage in China is significant, indicating a serious and accelerating trend, with slight and moderate shrinkage being the most predominant types.
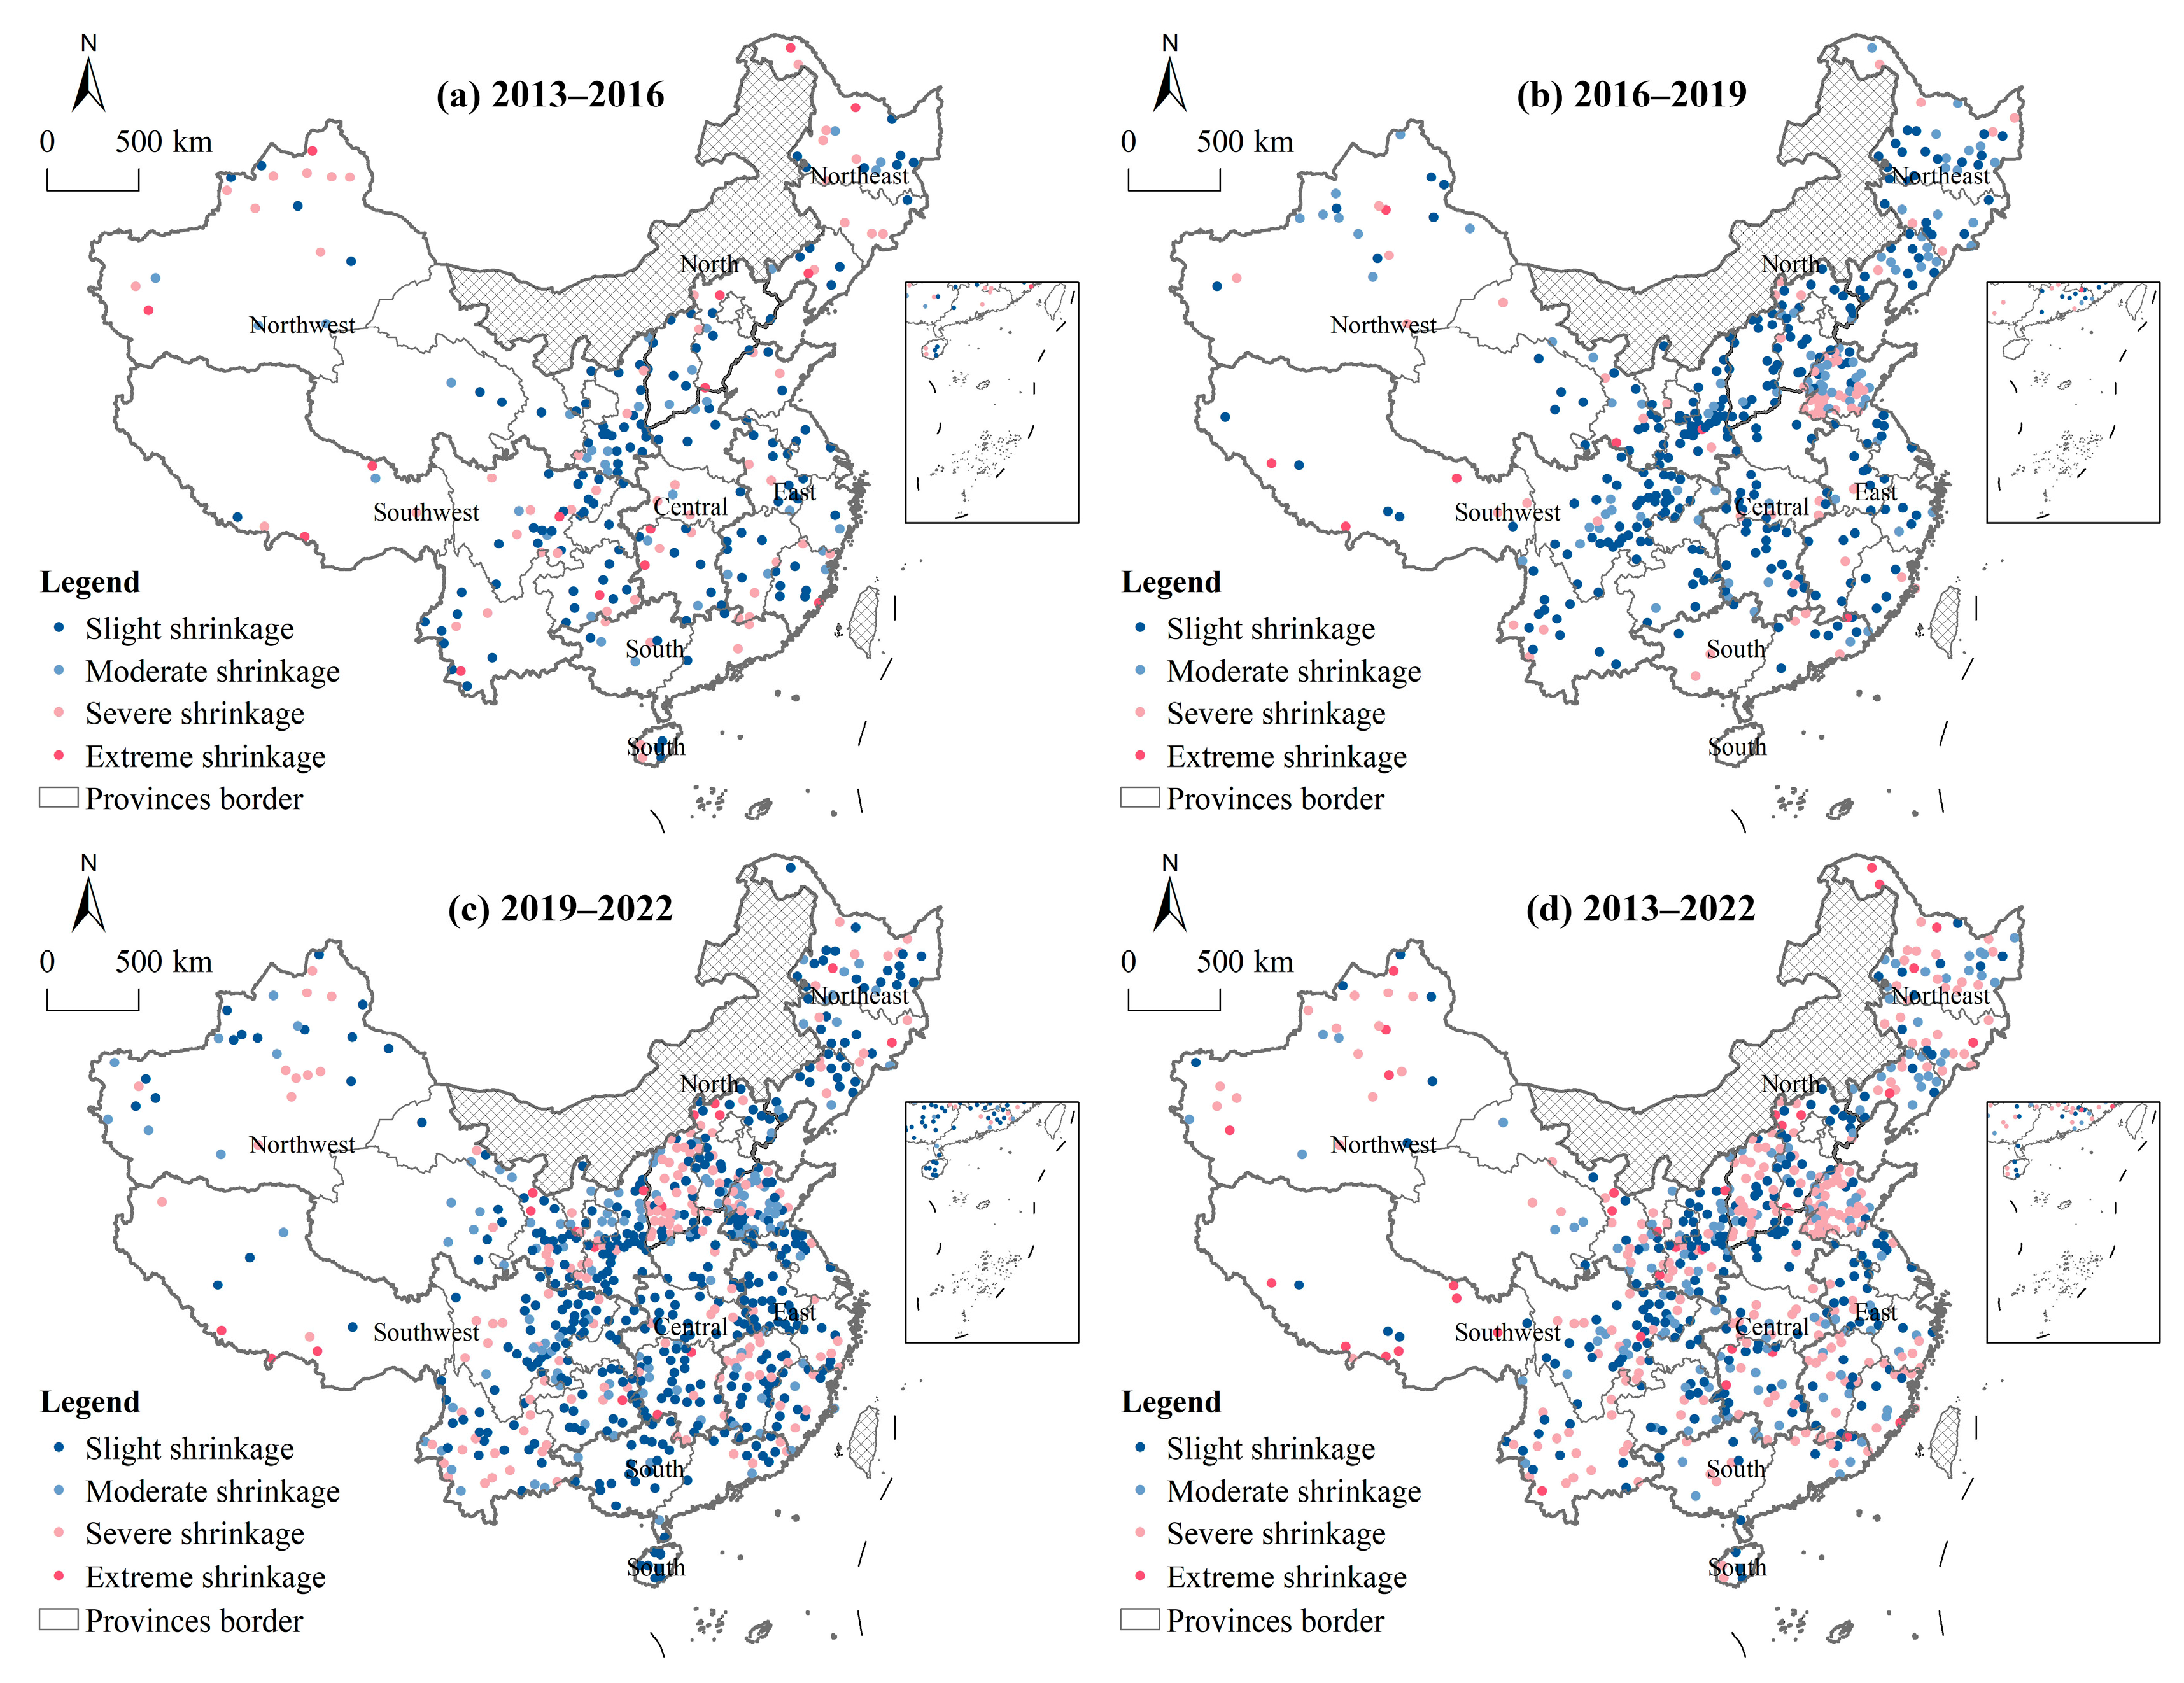
The spatiotemporal distribution of shrinking county towns in China exhibited significant regional disparities from 2013 to 2022, as illustrated in Figure 5 and Figure 6 Since 2013, shrinking county towns are primarily distributed across four regions: China’s Northeast, Northwest, Southwest, and North. Over time, both the number and severity of shrinking counties in these four regions have increased significantly. This has resulted in clearly identifiable and contiguous contraction zones. Among them, Northeast China experienced the most severe shrinkage, with approximately 89% of its county towns undergoing population shrinkage over the decade. This is largely attributed to the high concentration of resource-dependent towns, where the dual challenges of resource depletion and lagging industrial restructuring have led to substantial population shrinkage. County towns in the Southwest and in the Shaanxi–Gansu–Ningxia region of the Northwest have shown a clear trend of worsening shrinkage, evolving from slight to moderate, and in some cases, severe levels. Central and Eastern China exhibited widespread localized shrinkage, particularly in the provinces of Hubei, Hunan, and Jiangxi. Additionally, a small number of county towns in Guangdong and Guangxi also experienced severe shrinkage. Driven by population siphoning effects, county towns in Central, Eastern, and Southern China are experiencing sustained population outflows toward adjacent metropolitan areas. This contributes to emerging patterns of shrinkage across these regions.

3.2. Spatiotemporal Evolution of SCTR

3.2.1. Temporal Dynamics Characteristics of SCTR

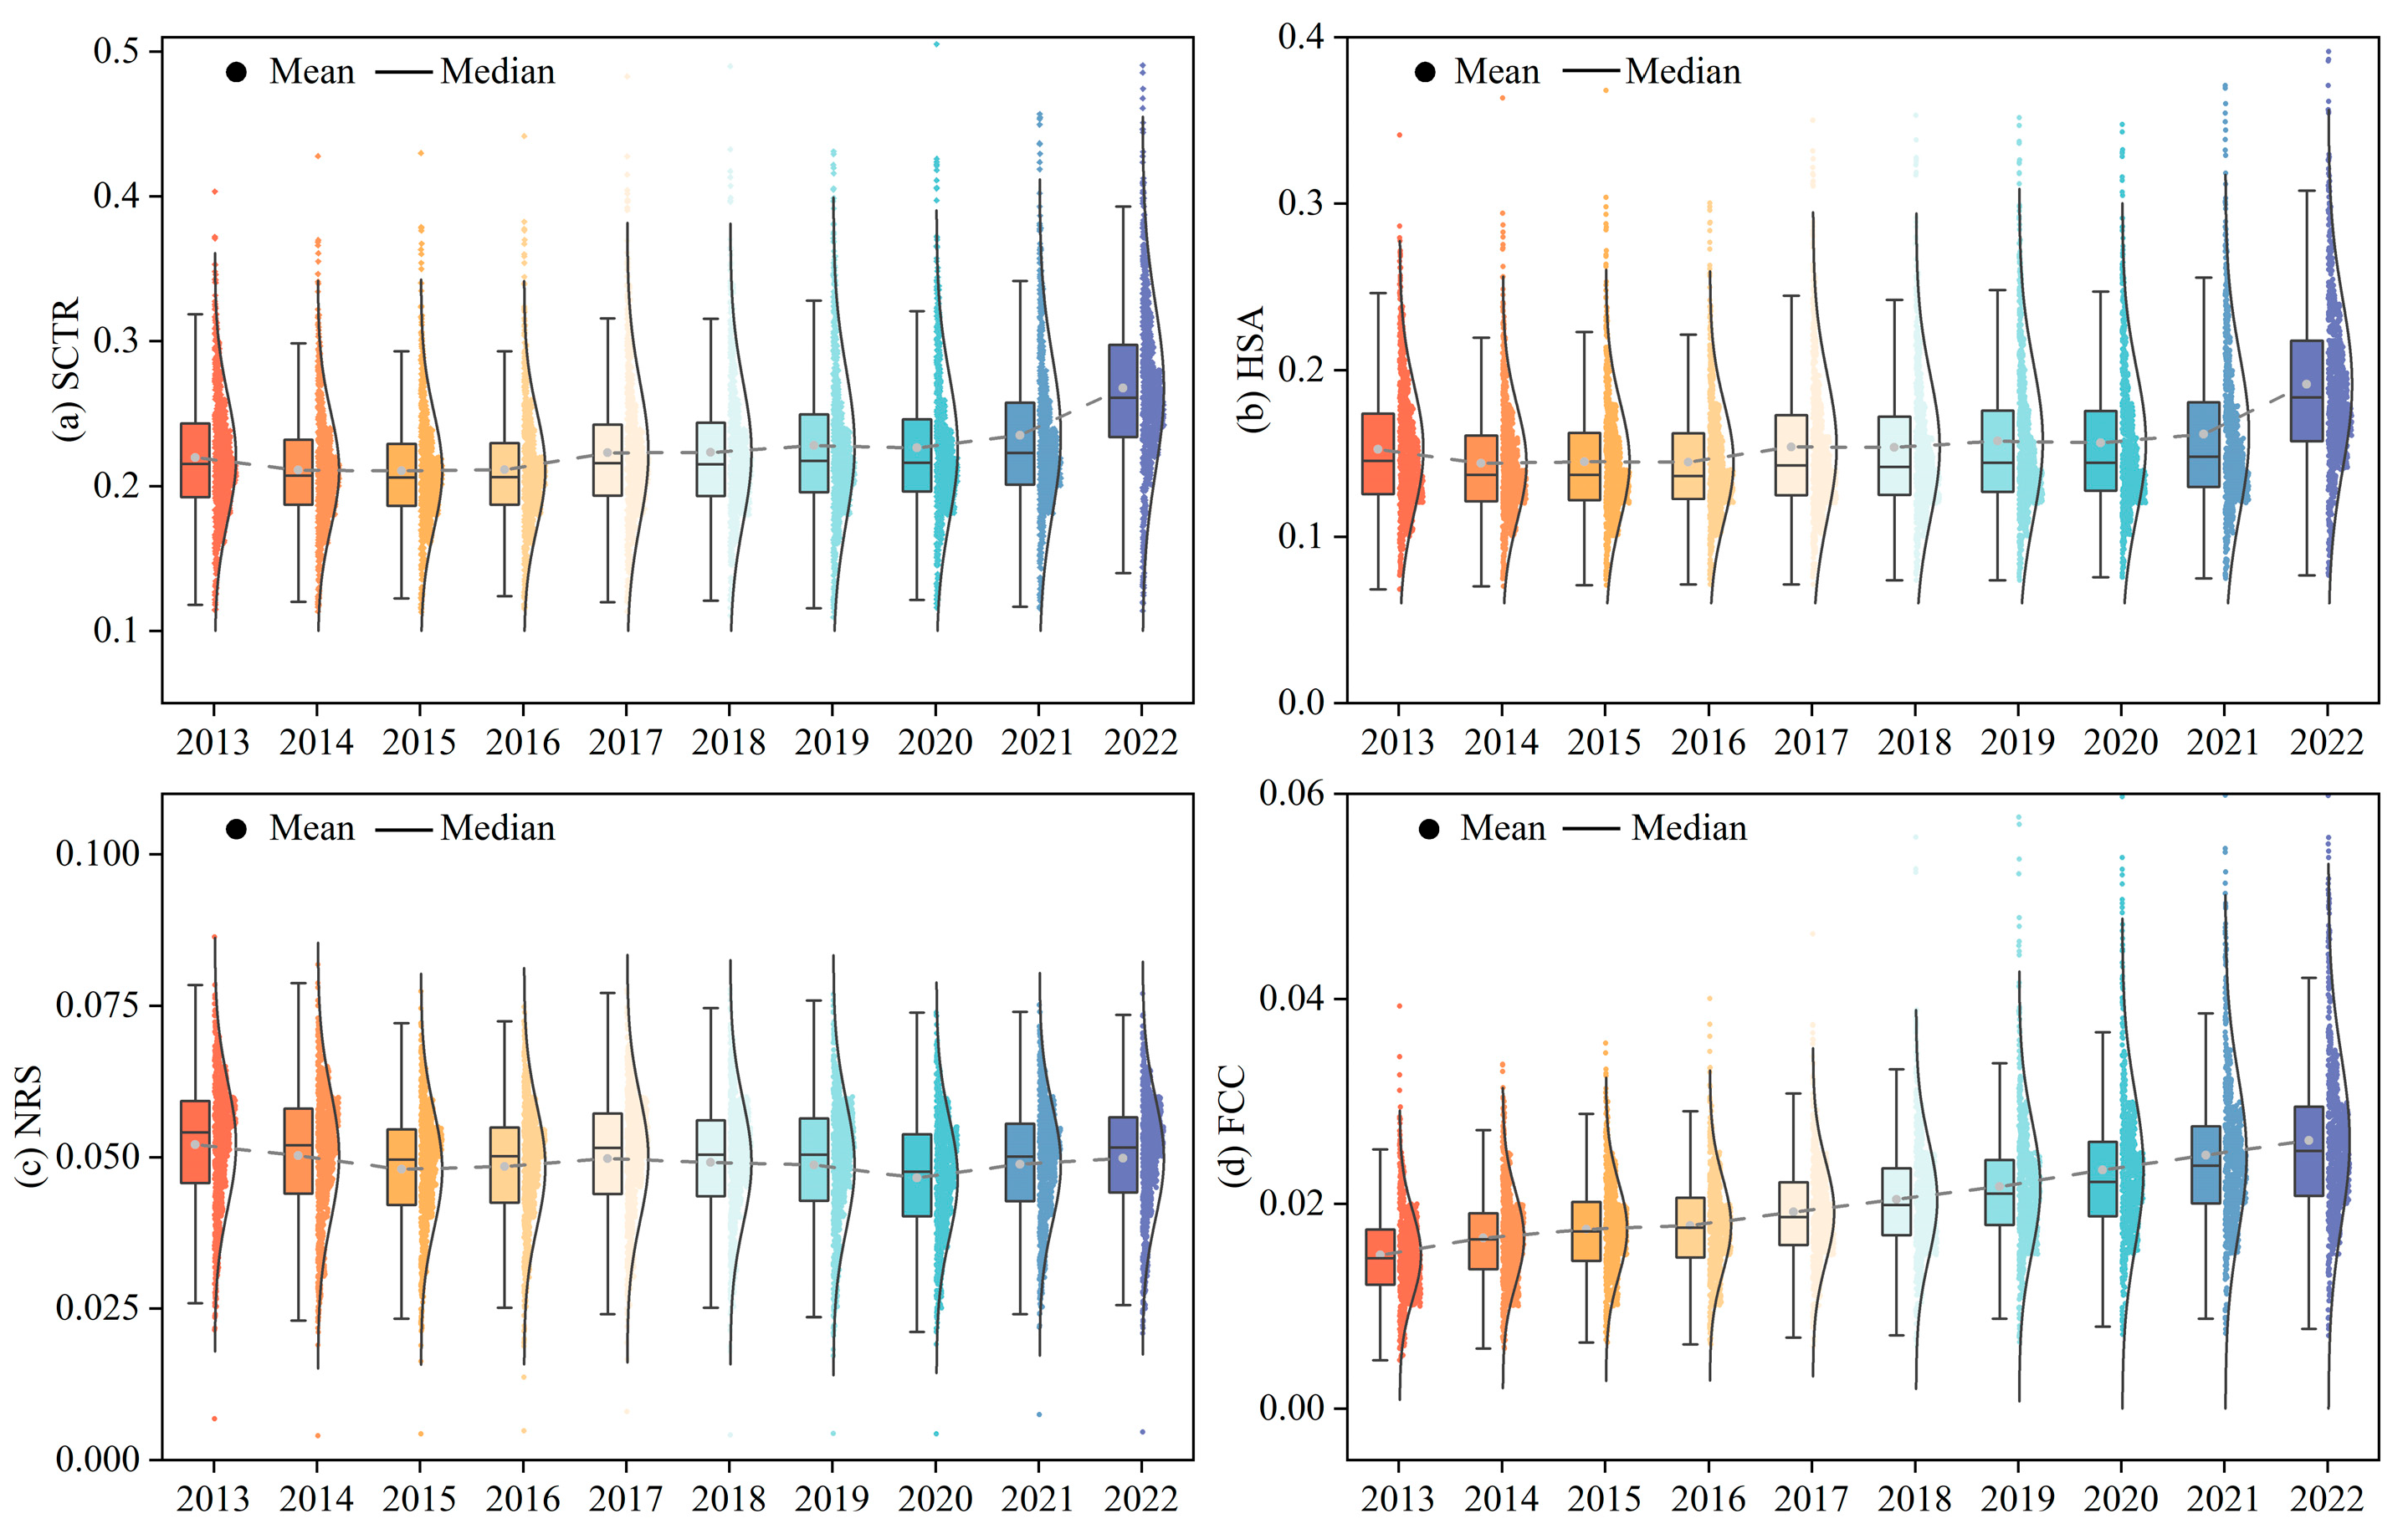
Figure 7a shows the temporal trend of SCTR from 2013 to 2022. Overall, the SCTR value showed a modest but steady upward trend, rising from 0.219 in 2013 to 0.268 in 2022. However, the overall SCTR value remained low. This indicates that, while resilience-oriented urban development policies have been implemented, significant gaps remain in building resilience for shrinking county towns. Over time, the disparity in SCTR levels has grown more pronounced. To analyze temporal variations in resilience subsystem scores for SCTR, we visualized their trends separately (Figure 7b–d). First, the HSA subsystem displayed a fluctuation pattern similar to that of overall SCTR. This suggests that HSA plays a critical role in SCTR development. Additionally, the average value of NRS showed a slight downward trend, staying around 0.05. This reveals a growing imbalance between socioeconomic development and environmental sustainability. Finally, the FCC showed an annual increase, with the average value rising from 0.015 in 2013 to 0.026 in 2022. This illustrates that the continuous strengthening of state support has positively impacted socioeconomic development.

3.2.2. Spatial Distribution Characteristics of SCTR

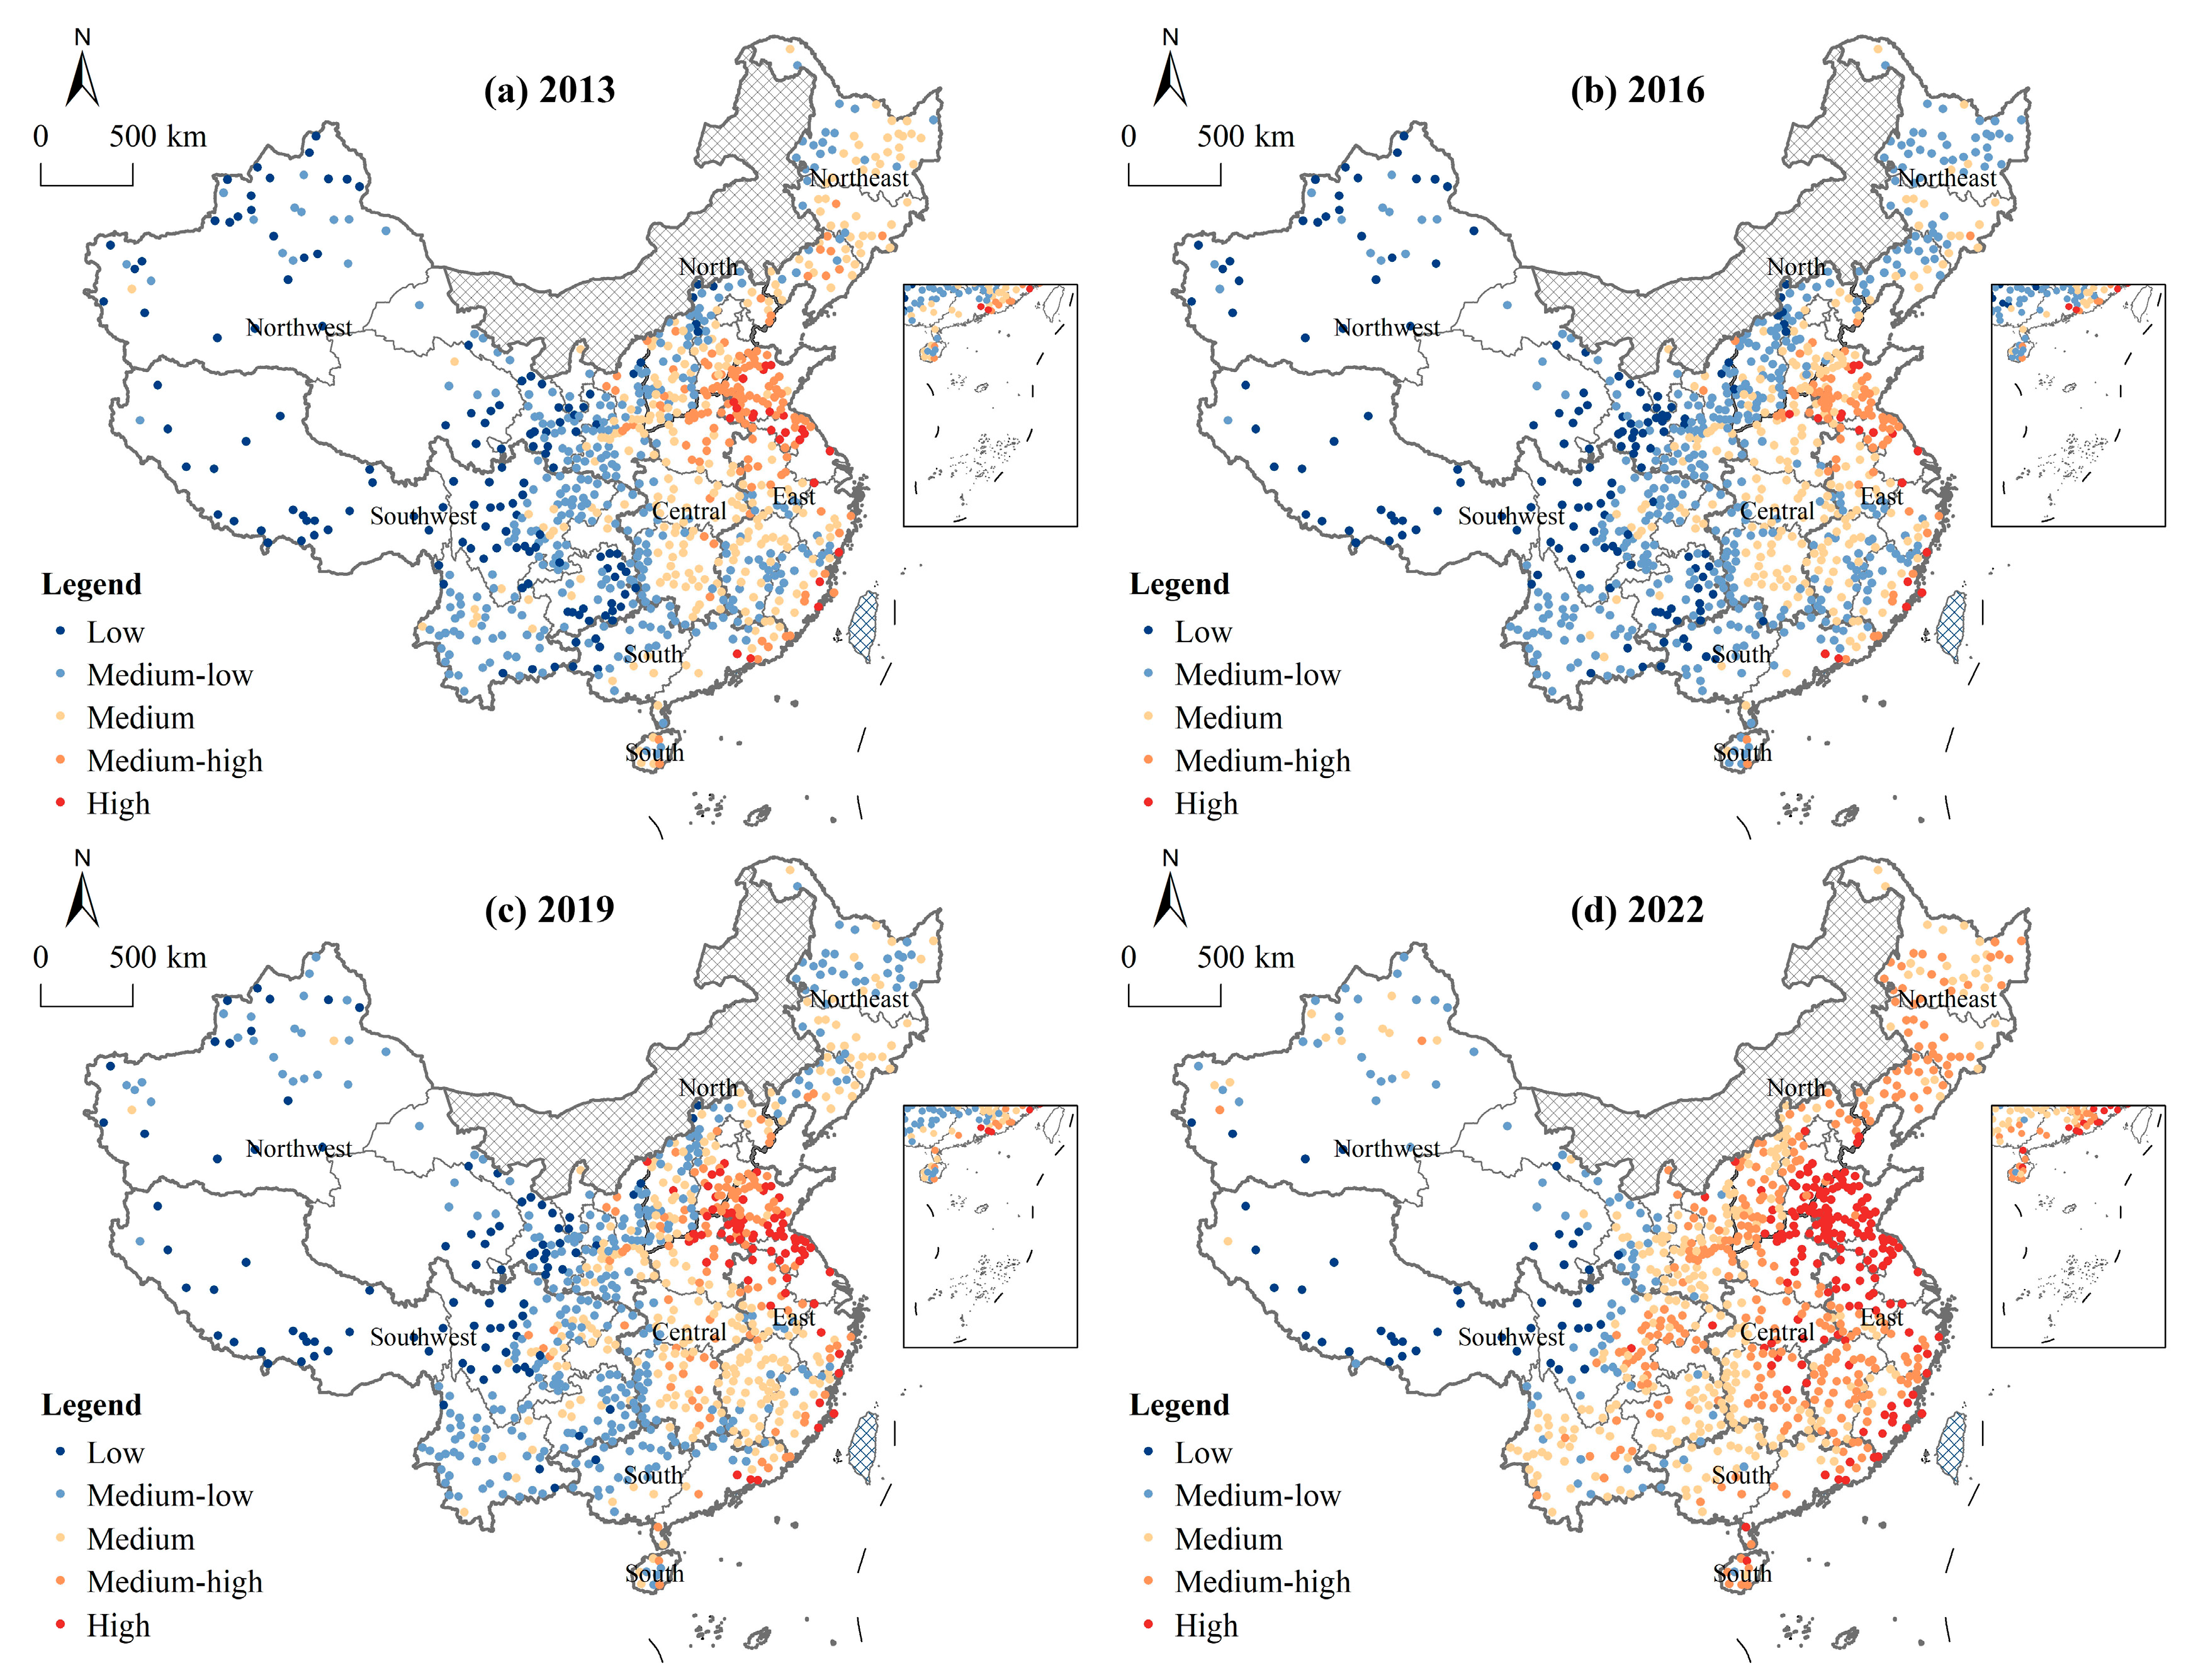
To characterize the spatial distribution of SCTR, we visualized the data for 2013, 2016, 2019, and 2022, as shown in Figure 8a–d. We used the average natural breakpoints of the SCTR composite index over four years as the classification standard for our spatial mapping [25]. From 2013 to 2022, SCTR exhibited significant spatial disparities in China. In 2013, only 17.35% of shrinking counties exhibited medium-high or high resilience, concentrated mainly in the northeastern and southeastern coastal regions. Notably, by 2016, SCTR showed a slight decline, with only 9.98% of county towns exhibiting high or moderate SCTR levels. This indicates that county towns shrinkage has exerted adverse effects on SCTR. Based on the observed changes in SCTR subsystems, it is evident that the challenges in building SCTR go beyond population shrinkage and economic decline. They may also exacerbate social issues, intensify resource scarcity, and reflect inadequate policy support, undermining county governments’ capacity to manage future risks. In 2022, the second year following the conclusion of China’s 13th Five-Year Plan, SCTR levels rose significantly. The proportion of shrinking counties with medium-high or high resilience increased to 53.03%. Using the Hu Line (the Heihe-Tengchong Line) as a geographic reference, counties with higher resilience levels were predominantly located east of the line. In contrast, counties with lower resilience were concentrated in economically underdeveloped regions, including western Sichuan, Gansu, Qinghai, Tibet, and Xinjiang.
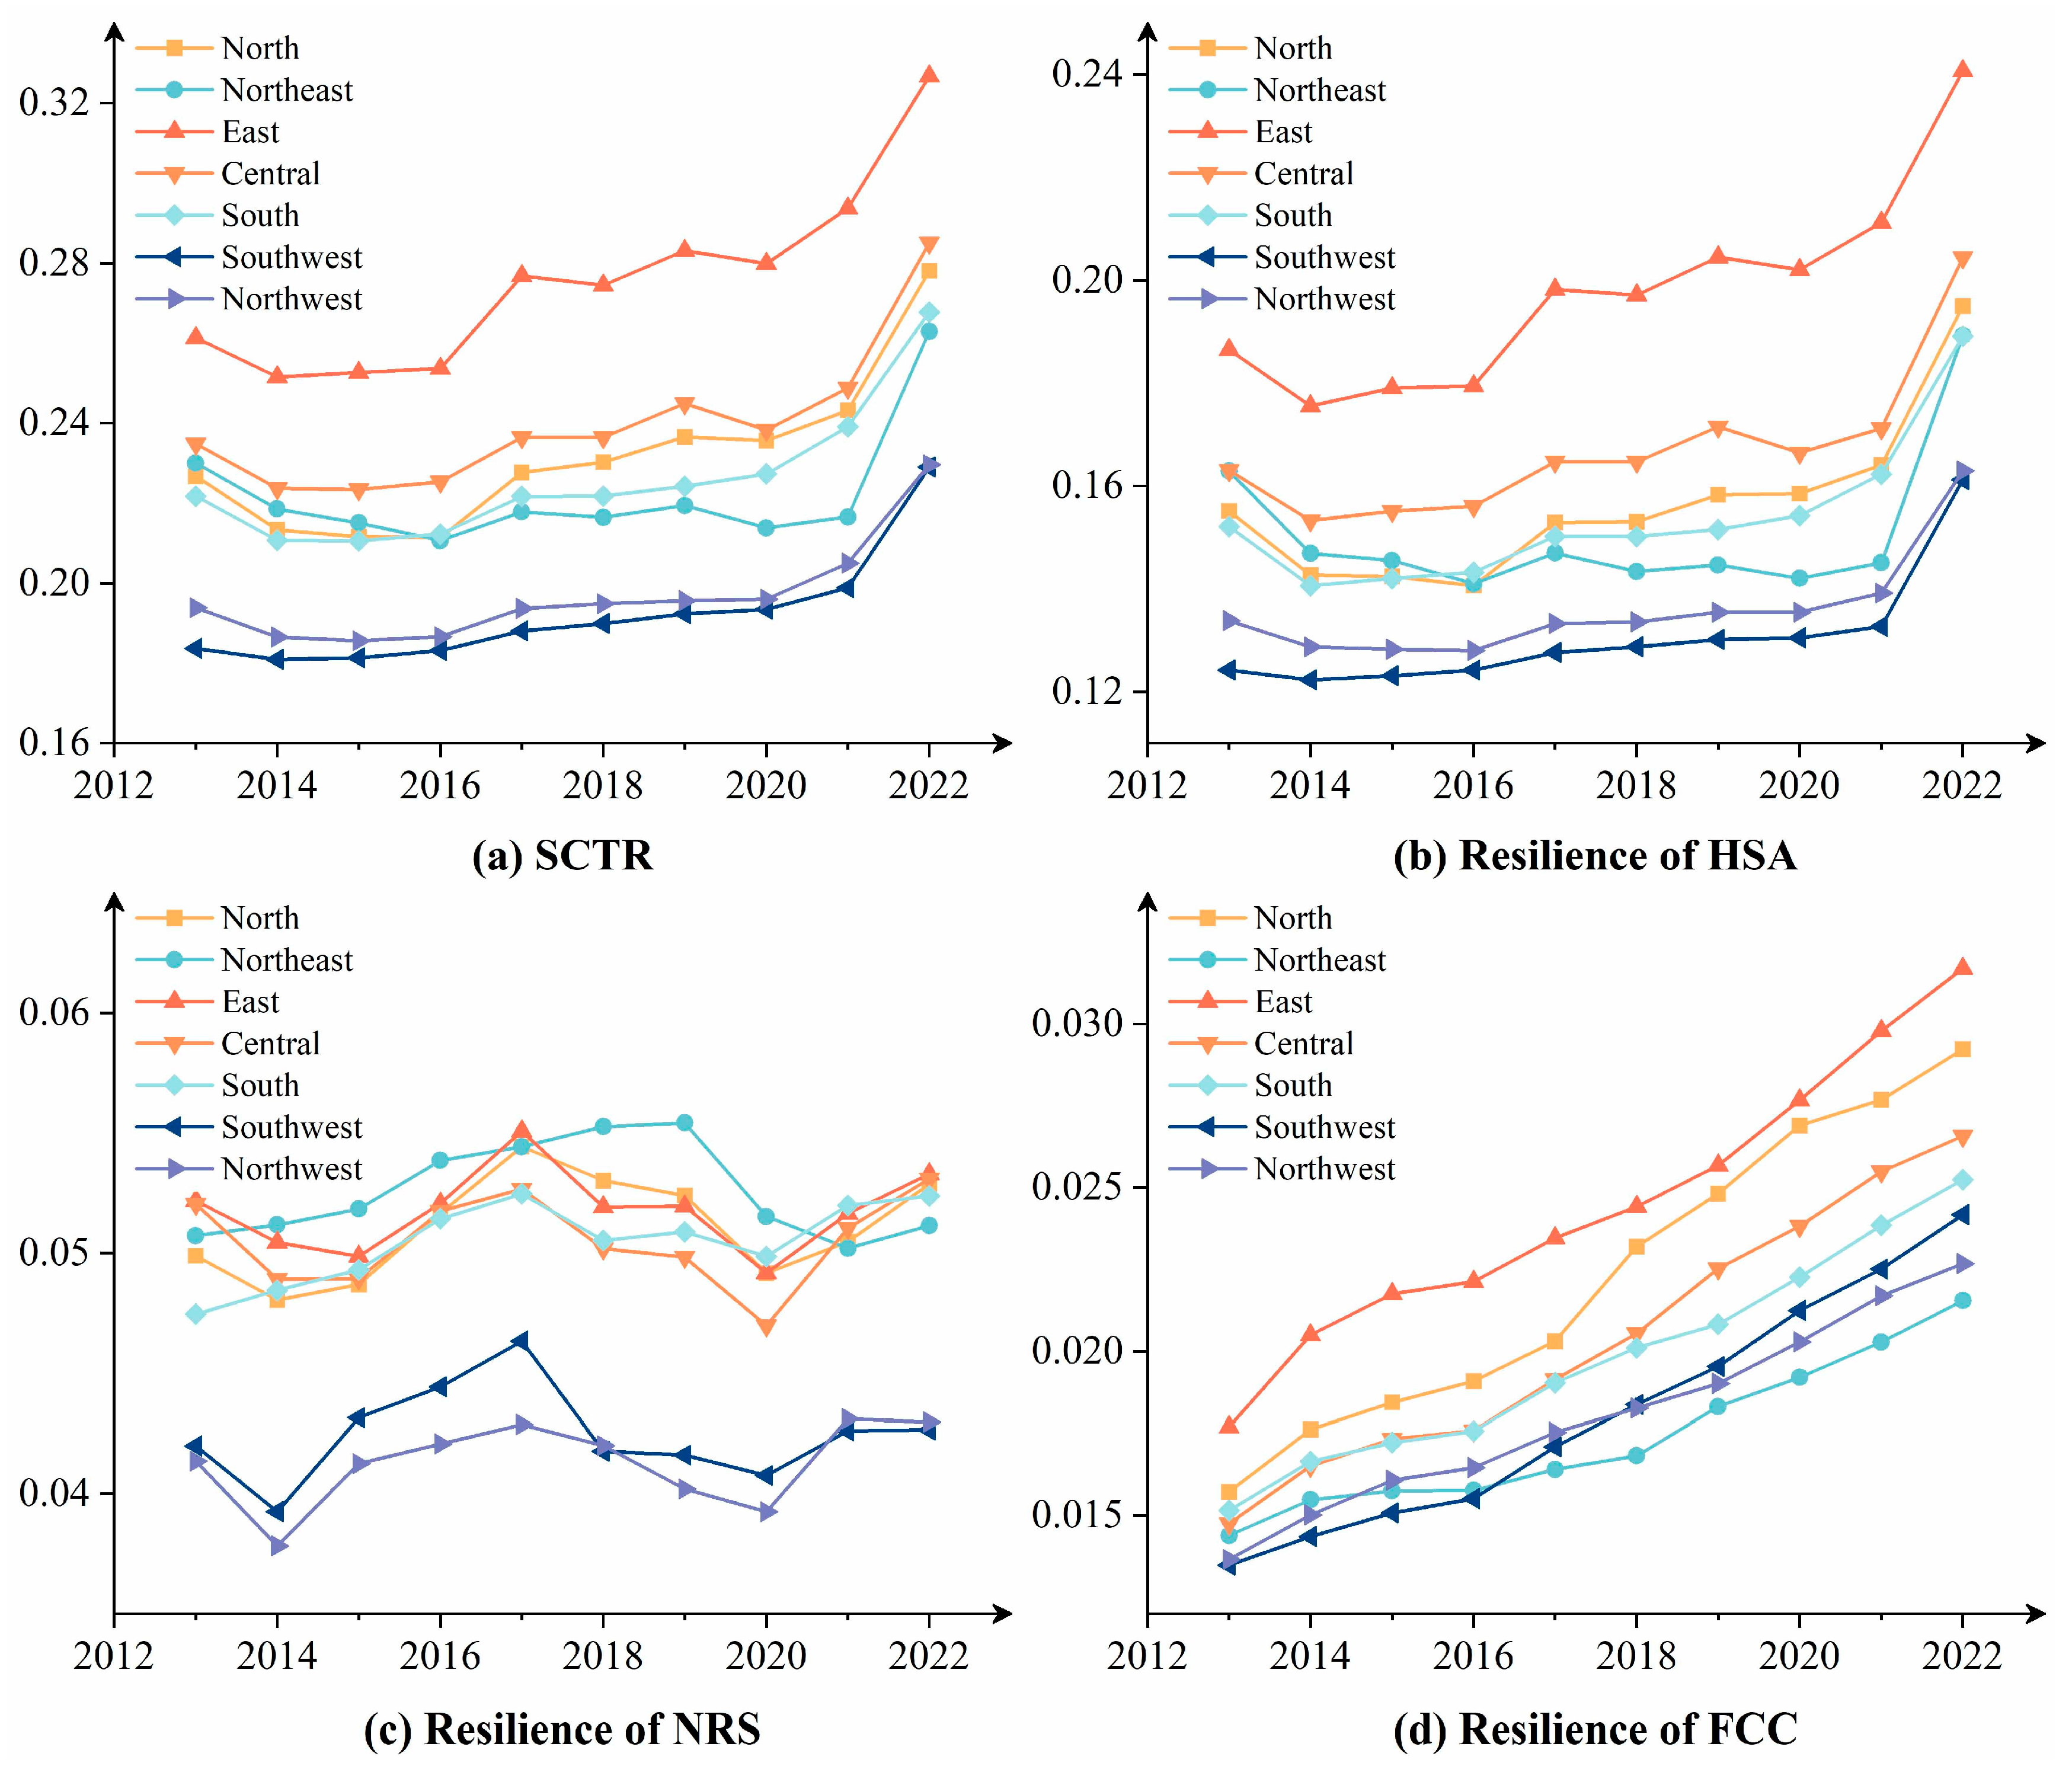
This study compares the SCTR and subsystem resilience across different regions during the study period (Figure 9). In general, both the SCTR and FCC resilience across all regions of China have exhibited a marked improvement, indicating that China’s urban resilience efforts have achieved phased outcomes. Notably, between 2017 and 2020, NRS resilience across all seven regions experienced a significant decline. To pinpoint the key factors driving this decline in NRS resilience, this study calculated the average rate of change for each indicator within the NRS subsystem over this period. The results show that the two indicators with the highest average change rates are air quality (32.66%) and extreme precipitation (20.84%). The findings suggest that air pollution and extreme climate conditions are the primary factors limiting NRS resilience improvement in shrinking county towns in China. From 2017 to 2020, some shrinking counties in China were still undergoing industrial transformation [93]. Emissions from traditional energy-intensive industries, such as regional chemical production and building materials processing, had not been fully controlled, making them major contributors to fixed pollution sources. Between 2018 and 2019, Typhoons Lekima and Mangkhut struck the southeastern coastal regions of China sequentially [94]. In 2020, the southwestern, northwestern, and northern regions experienced rare heavy rainfall, which triggered mountain floods and geological disasters in some areas [95,96,97].

3.2.3. Changes in the Growth Rate of SCTR

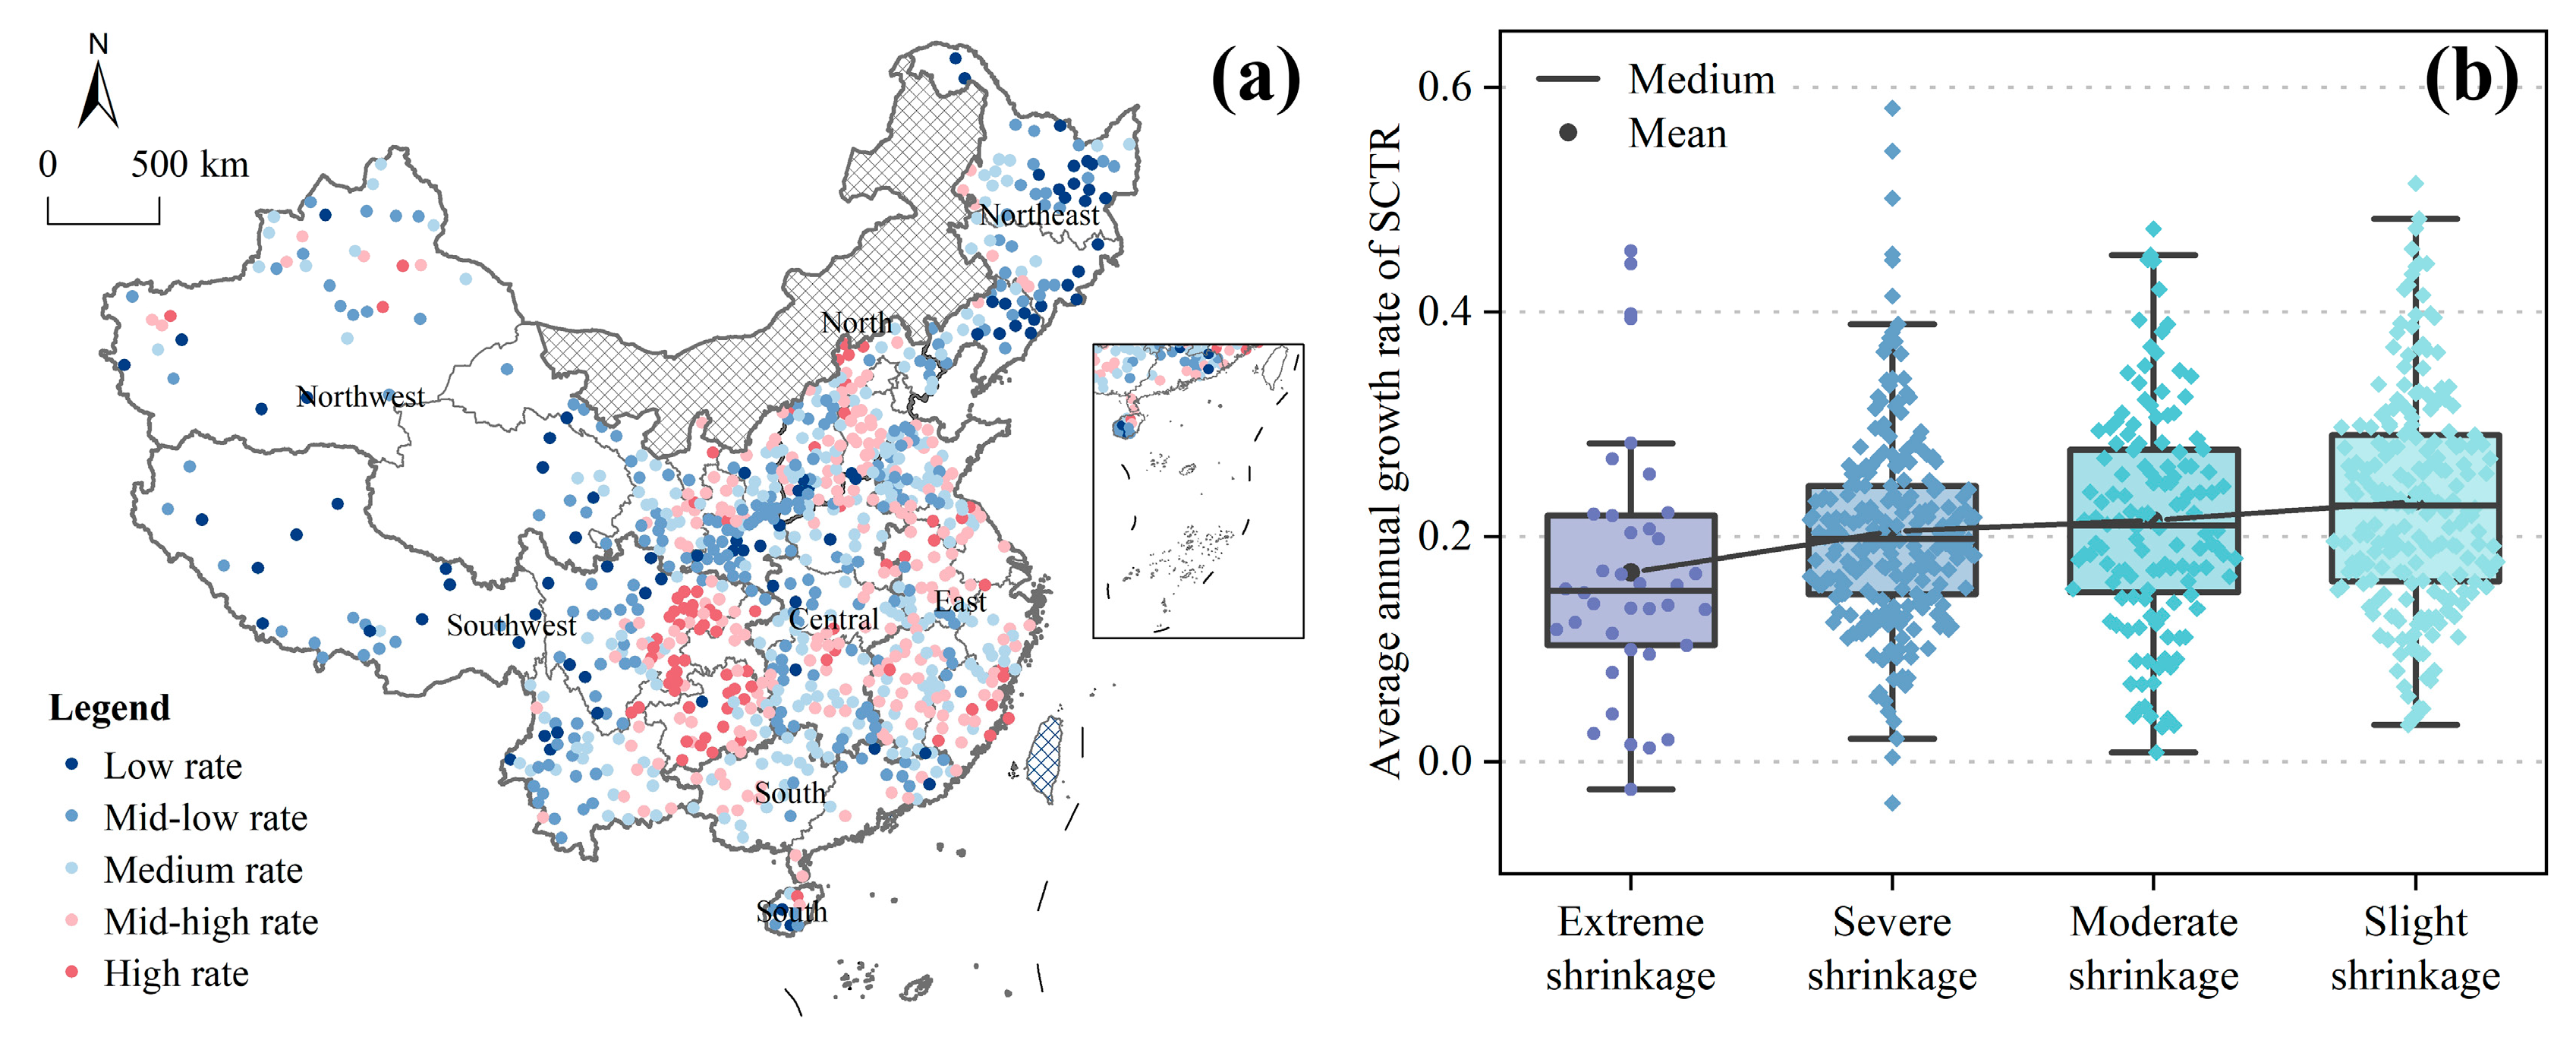
The average annual growth rate of SCTR from 2013 to 2022 was analyzed, with the results categorized using the natural breakpoint method (Figure 10a). Over the past decade, the average SCTR level in China showed modest fluctuations but maintained an upward trajectory. Shrinking county towns with higher annual resilience growth rates were mostly concentrated in the Sichuan–Chongqing–Guizhou region. Notably, while the average SCTR level in central and western China remains relatively low, their annual growth rates are high, particularly in provinces such as Hubei, Hunan, Sichuan, and Gansu. This indicates that while regional disparities in SCTR persist, the gaps are gradually narrowing. The Chinese government has consistently implemented policies to promote coordinated regional development, supporting economic growth in underdeveloped areas and reducing disparities in basic public services. These initiatives have reduced low resilience in central and western regions, contributing to more balanced development across the country.
We also calculated the average annual growth rate of SCTR by type from 2013 to 2022 (Figure 10b). The resilience growth patterns of shrinking counties show significant spatial heterogeneity. As shrinkage severity increases, the SCTR growth rate tends to decrease, with extreme shrinkage counties showing negative growth. This suggests that more pronounced shrinkage in county towns is strongly linked to a greater negative impact on SCTR. This highlights the need to strengthen external support and implement more comprehensive reform measures to improve SCTR. Additionally, the spatial analysis in Figure 8 reinforces the significant moderating role of spatial location factors in the relationship between shrinkage and resilience.

3.2.4. Trends in CCD Between SCTR Subsystems

To guide the coupling coordination of human–environment systems in shrinking county towns, we employed the CCD model to calculate the CCD values for SCTR subsystems from 2013 to 2022 [76] (Figure 11a). In general, the CCD of SCTR subsystems shows a consistent upward trend, indicating significant improvements and increasing coordination among the resilience subsystems. However, in 2022, 67.5% of shrinking county towns remained at the basic coupling coordination level, suggesting that coordination between subsystems still requires considerable improvement.
We further analyzed the annual growth rates of CCD in SCTR subsystems across counties with different types of shrinkage (Figure 11b). The results indicate that the severity of shrinkage negatively impacts the annual growth rate of CCD. This finding underscores that population loss disrupts the coupling and coordination mechanisms between human–environment subsystems, constraining the enhancement of county towns’ resilience. Comparative analysis of China’s seven major regions reveals significant spatial heterogeneity in CCD levels (Figure 11c,d). From 2013 to 2022, South China consistently had the highest average CCD value (0.570), demonstrating good coordination between human and environmental systems.
In contrast, Southwest and Northwest China had notably lower CCD values of 0.437 and 0.449, respectively, indicating these regions face greater challenges in maintaining coordination under shrinkage pressures. These regional disparities may result from variations in economic development, industrial structures, and policy support across regions.
In general, we argue that county towns demonstrating resilience in HSA, FCC, and NRS are in a phase of synergistic coupling characterized by mutual reinforcement and co-evolution. These counties, such as those in East China, typically have relatively prosperous economies and stable societies, which promote population growth. In contrast, a decline in subsystem coupling often signals underdeveloped economic and social conditions, further exacerbating population outmigration. This trend is particularly evident in the Northeast, Northwest, and Southwest regions. This highlights that SCTR results from complex interactions and mutual influences within the human–environment system.

3.3. Mechanisms of Influencing Factors on SCTR

3.3.1. Identification of Key Influencing Factors

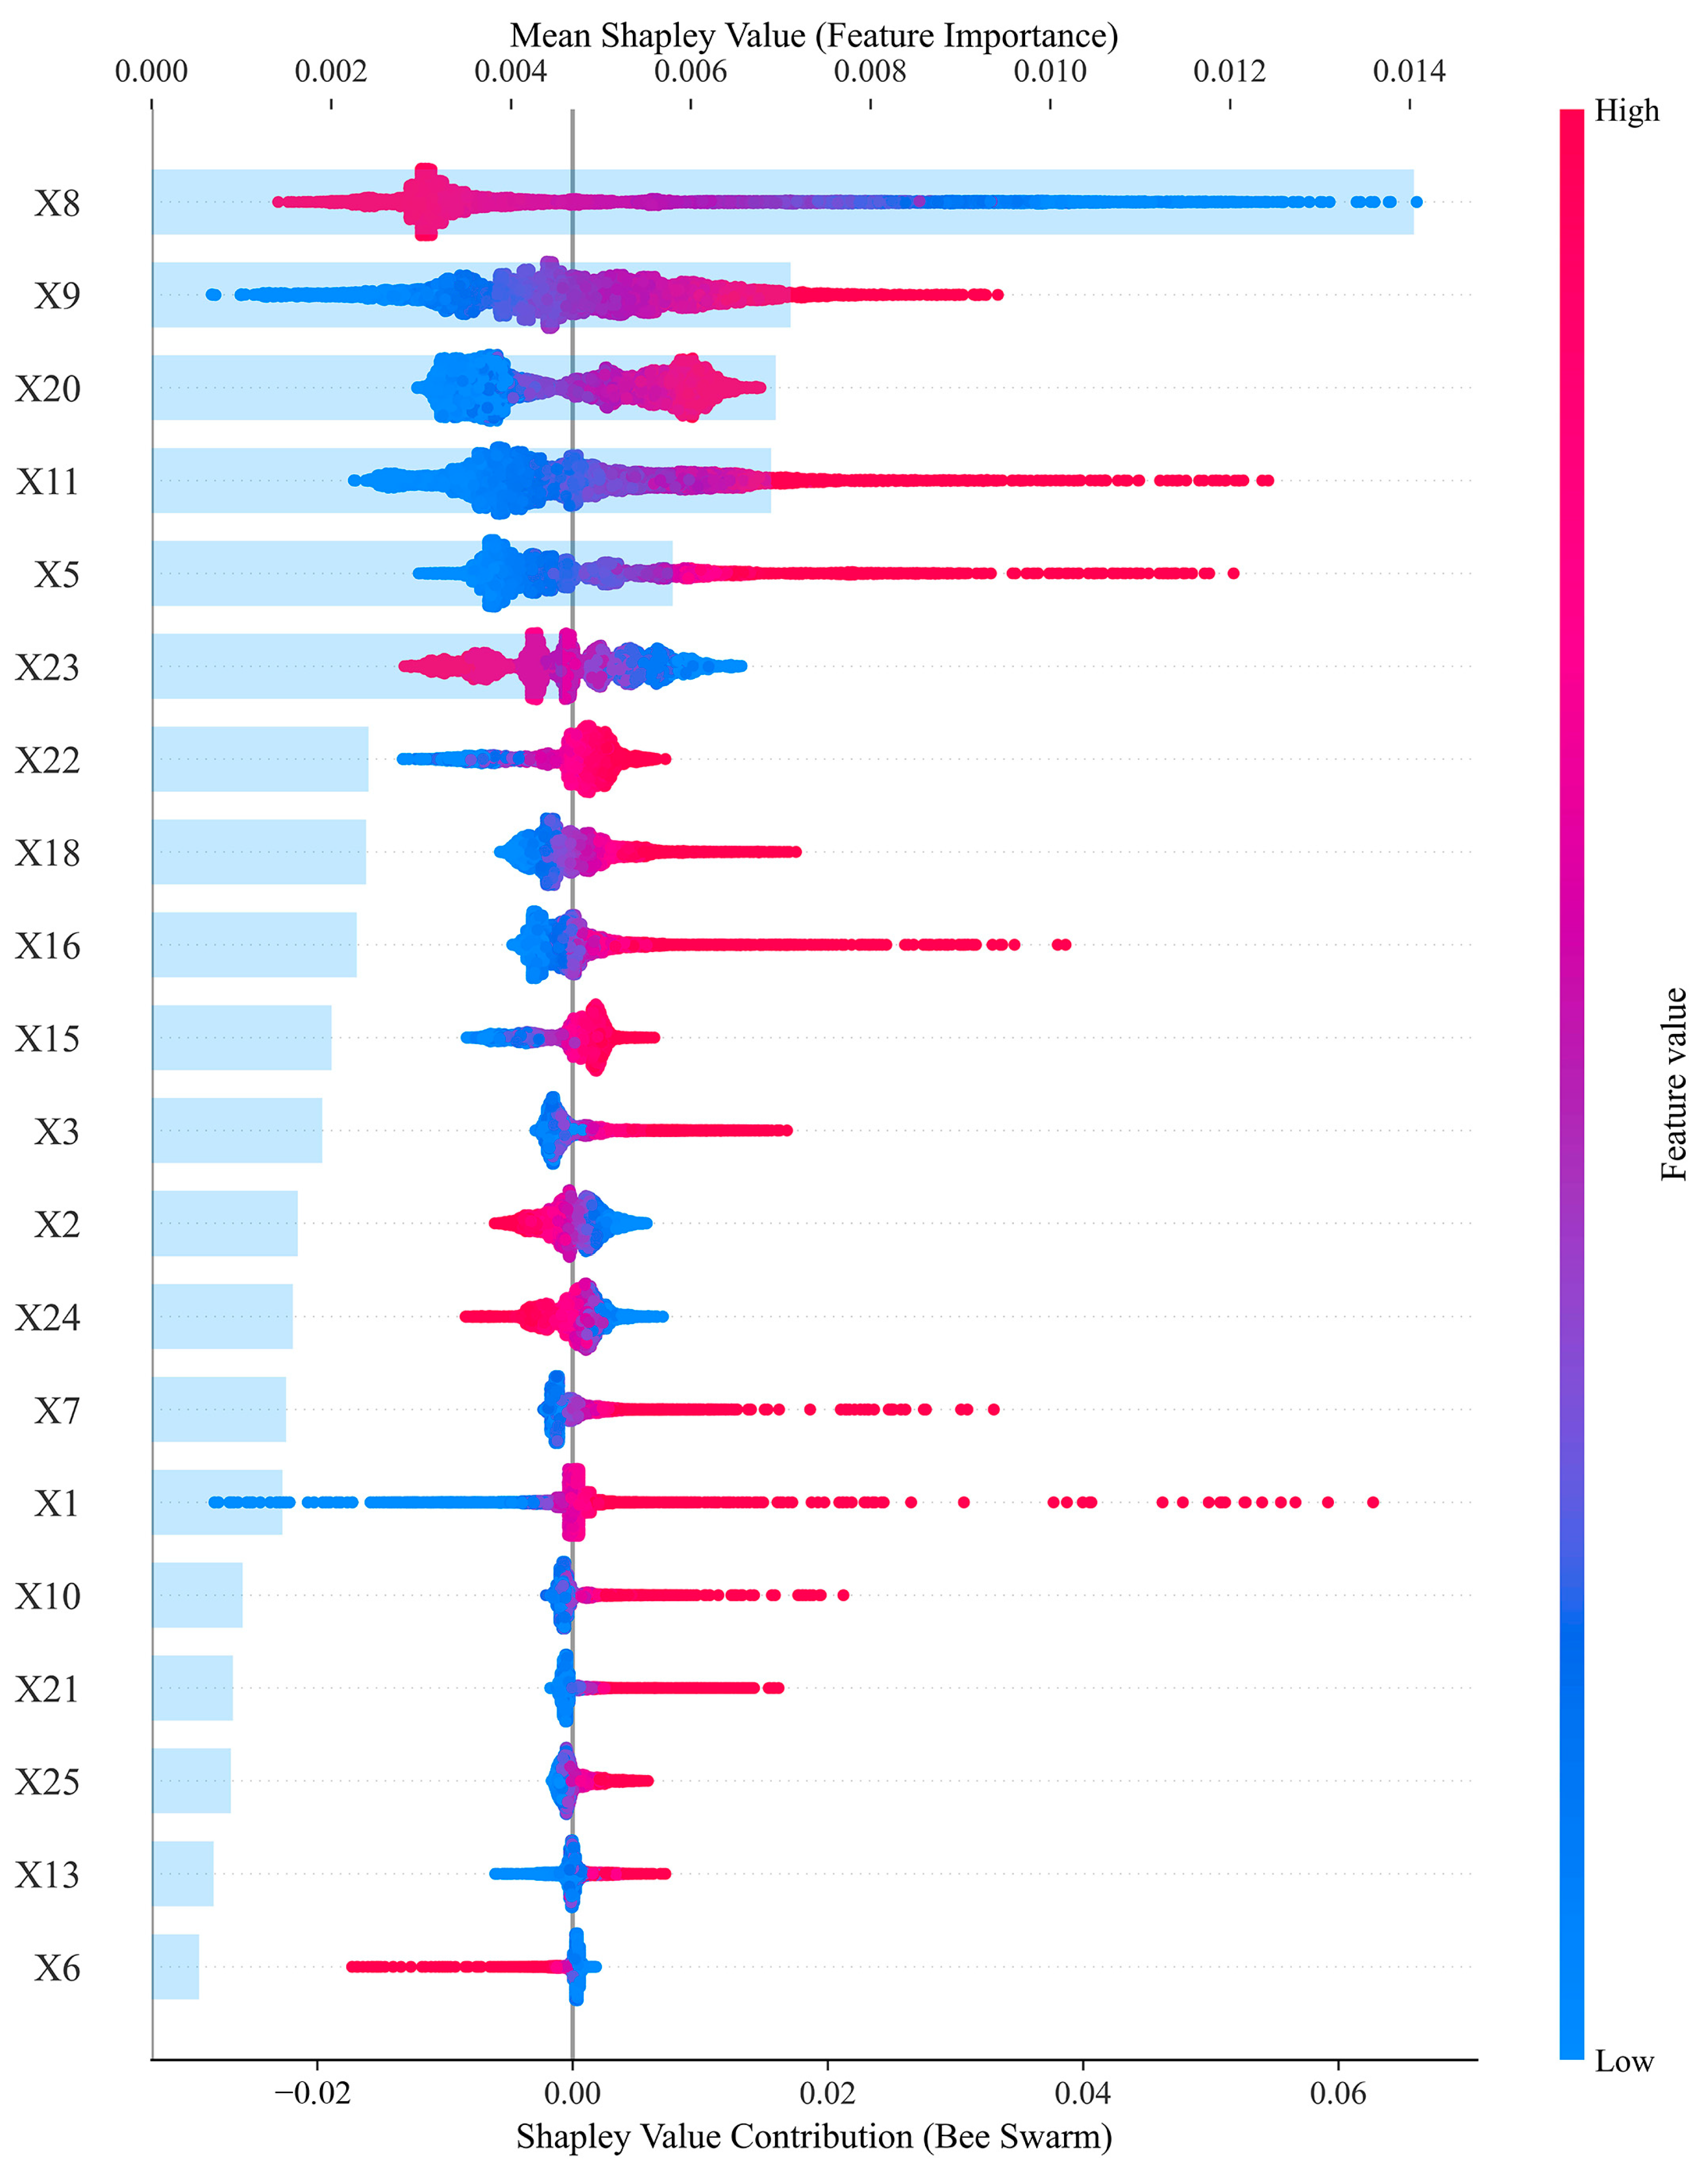
This study reveals the nonlinear effects of factors on SCTR. We used the mean absolute SHAP values to quantify each factor’s global importance [84,98], and visualized the results using a bar chart (Figure 12). Among all factors, the Gini coefficient (X8) plays a critical role in enhancing SCTR. This may be due to the fact that rising income inequality erodes social capital, intensifies group conflicts, and reduces the efficiency of resource allocation. All of these undermine the capacity of county towns to cope with shocks. In addition to the Gini coefficient, urbanization rate (X9), GDP (X11), forest coverage rate (X20), local general fiscal budget revenue (X5), and extreme precipitation (X23) emerge as primary factors influencing SCTR levels from 2013 to 2022.
We further visualized the SHAP values using a bee swarm plot to illustrate the positive and negative effects of different factors on SCTR (Figure 12). In this plot, each point represents a sample, with the color gradient reflecting the actual value of the corresponding feature (red for high values and blue for low values).
Among the various influencing factors, the Gini coefficient, extreme precipitation, proportion of vulnerable groups, and topographic relief exert significant negative impacts on SCTR. Conversely, urbanization level (X9), GDP (X11), local general fiscal budget revenue (X5), and forest coverage (X20) demonstrate positive impacts on SCTR. These findings suggest that more developed economic structures and higher ecological environment quality play crucial roles in enhancing SCTR. Notably, population growth rate shows a positive correlation with SCTR, indicating that shrinkage undermines SCTR.
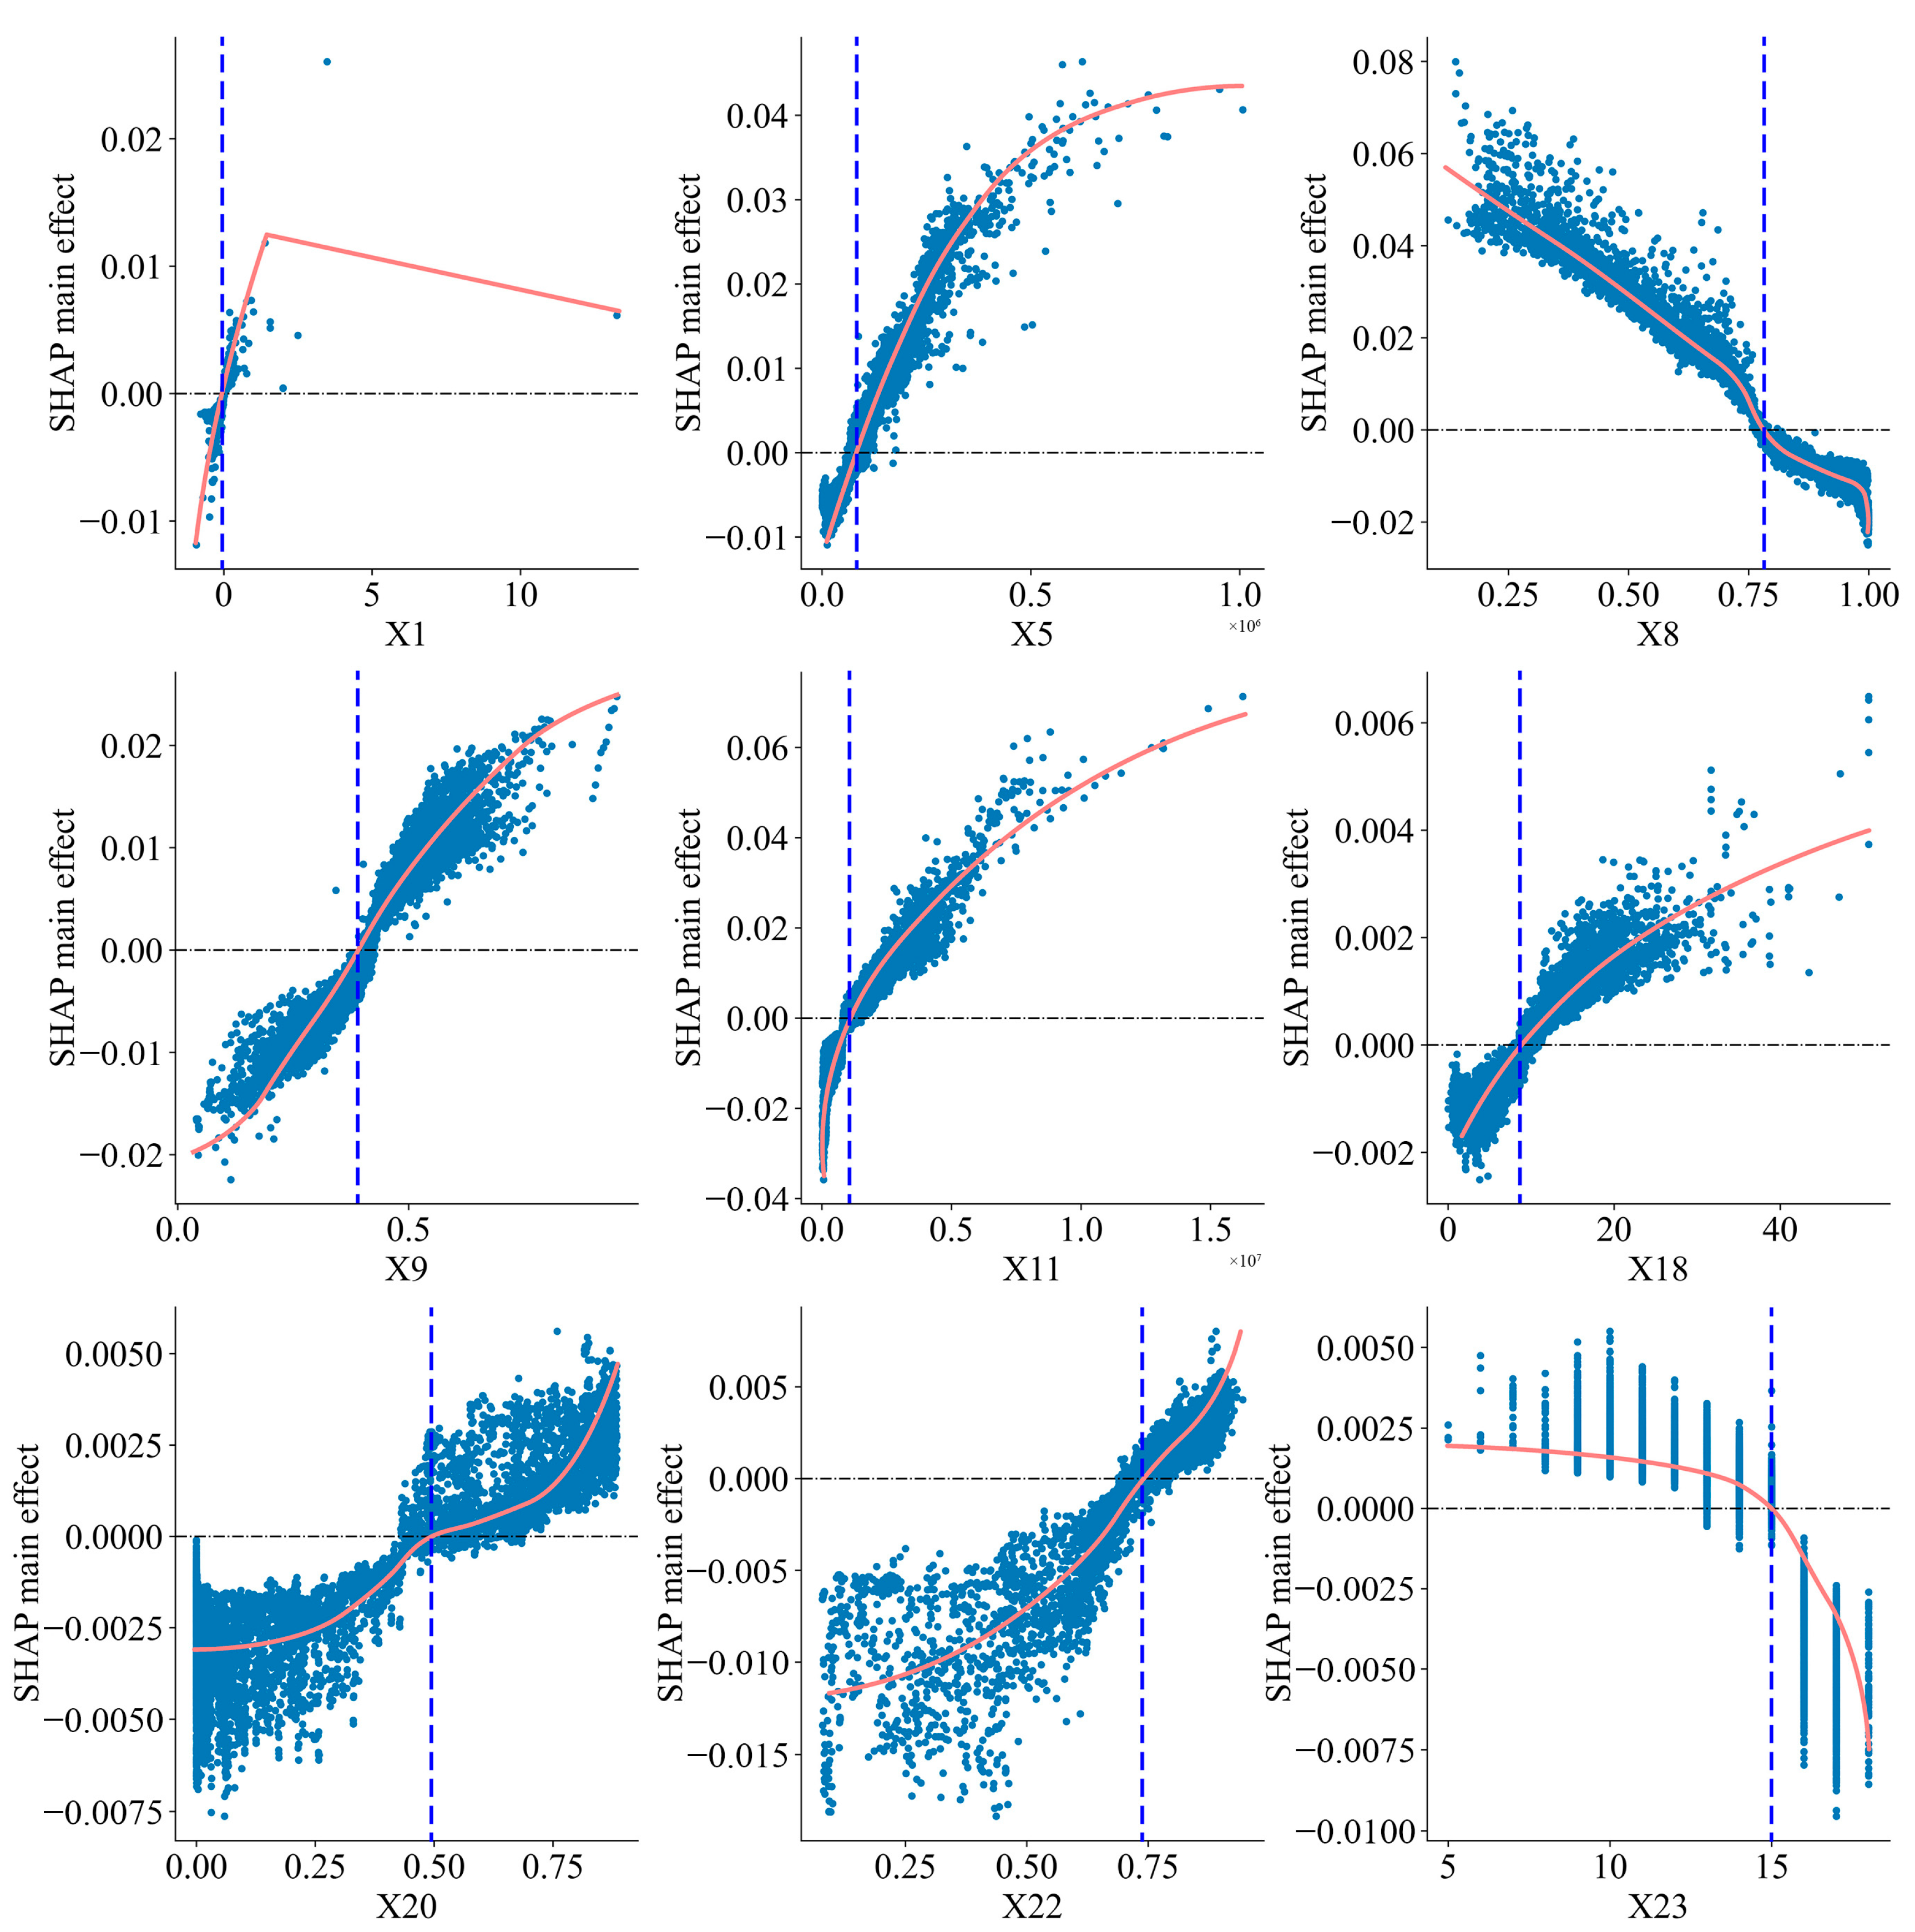
We plotted Partial Dependence Plots (PDP) of SCTR influencing factors based on the SHAP model (Figure 13). The PDP diagrams reveal several critical insights: (1) The effect of the population shrinkage rate (X1) on SCTR displays a nonlinear trend, shifting from a positive to a negative correlation. While moderate population growth initially benefits SCTR, once the growth rate exceeds 39%, it begins to have a detrimental effect on SCTR. (2) The effect of urbanization level (X9) on SCTR follows an S-shaped curve, consistent with the classical Northam urbanization curve. Beyond an urbanization level of 41%, its marginal contribution to SCTR gradually diminishes. (3) When NDVI (X20) exceeds 0.49, its positive impact on SCTR becomes significantly more pronounced. (4) The Gini coefficient (X8), a key indicator of income inequality, reflects increasingly unequal wealth distribution as its value rises. When it exceeds 0.8, indicating extreme inequality, its negative marginal effect on SCTR intensifies significantly. In conclusion, these findings highlight the locally unstable and nonlinear nature of the relationships between key determinants and SCTR, underscoring the need for context-specific resilience strategies.

3.3.2. Attribution Analysis of SCTR Across Different Shrinkage Types

This study further elucidates the differential mechanisms influencing SCTR across various types of shrinking county towns. In general, the factors affecting resilience show slight variations among the four shrinkage types (Figure 14). The Gini coefficient (X8), urbanization rate (X9), GDP (X11), forest coverage (X20), and local government budgetary revenue (X5) have significant effects on the SCTR across all shrinkage types. For slight, moderate, and severe shrinkage, frequent extreme precipitation events exert a notable negative impact on resilience. In contrast, well-developed infrastructure networks can enhance SCTR in these regions, particularly road network density (X16) and urban drainage system coverage (X18). Notably, demographic and socioeconomic factors, such as population decline and age structure, have a more pronounced impact on the resilience of extremely shrinking counties compared to other types. This indicates that in counties experiencing severe population loss, demographic factors have become critical constraints on resilience. Accordingly, mitigating population outflow and maintaining a stable local population have become critical priorities for strengthening resilience in counties experiencing extreme shrinkage.

3.3.3. Spatial Heterogeneity Analysis of Key Influencing Factors

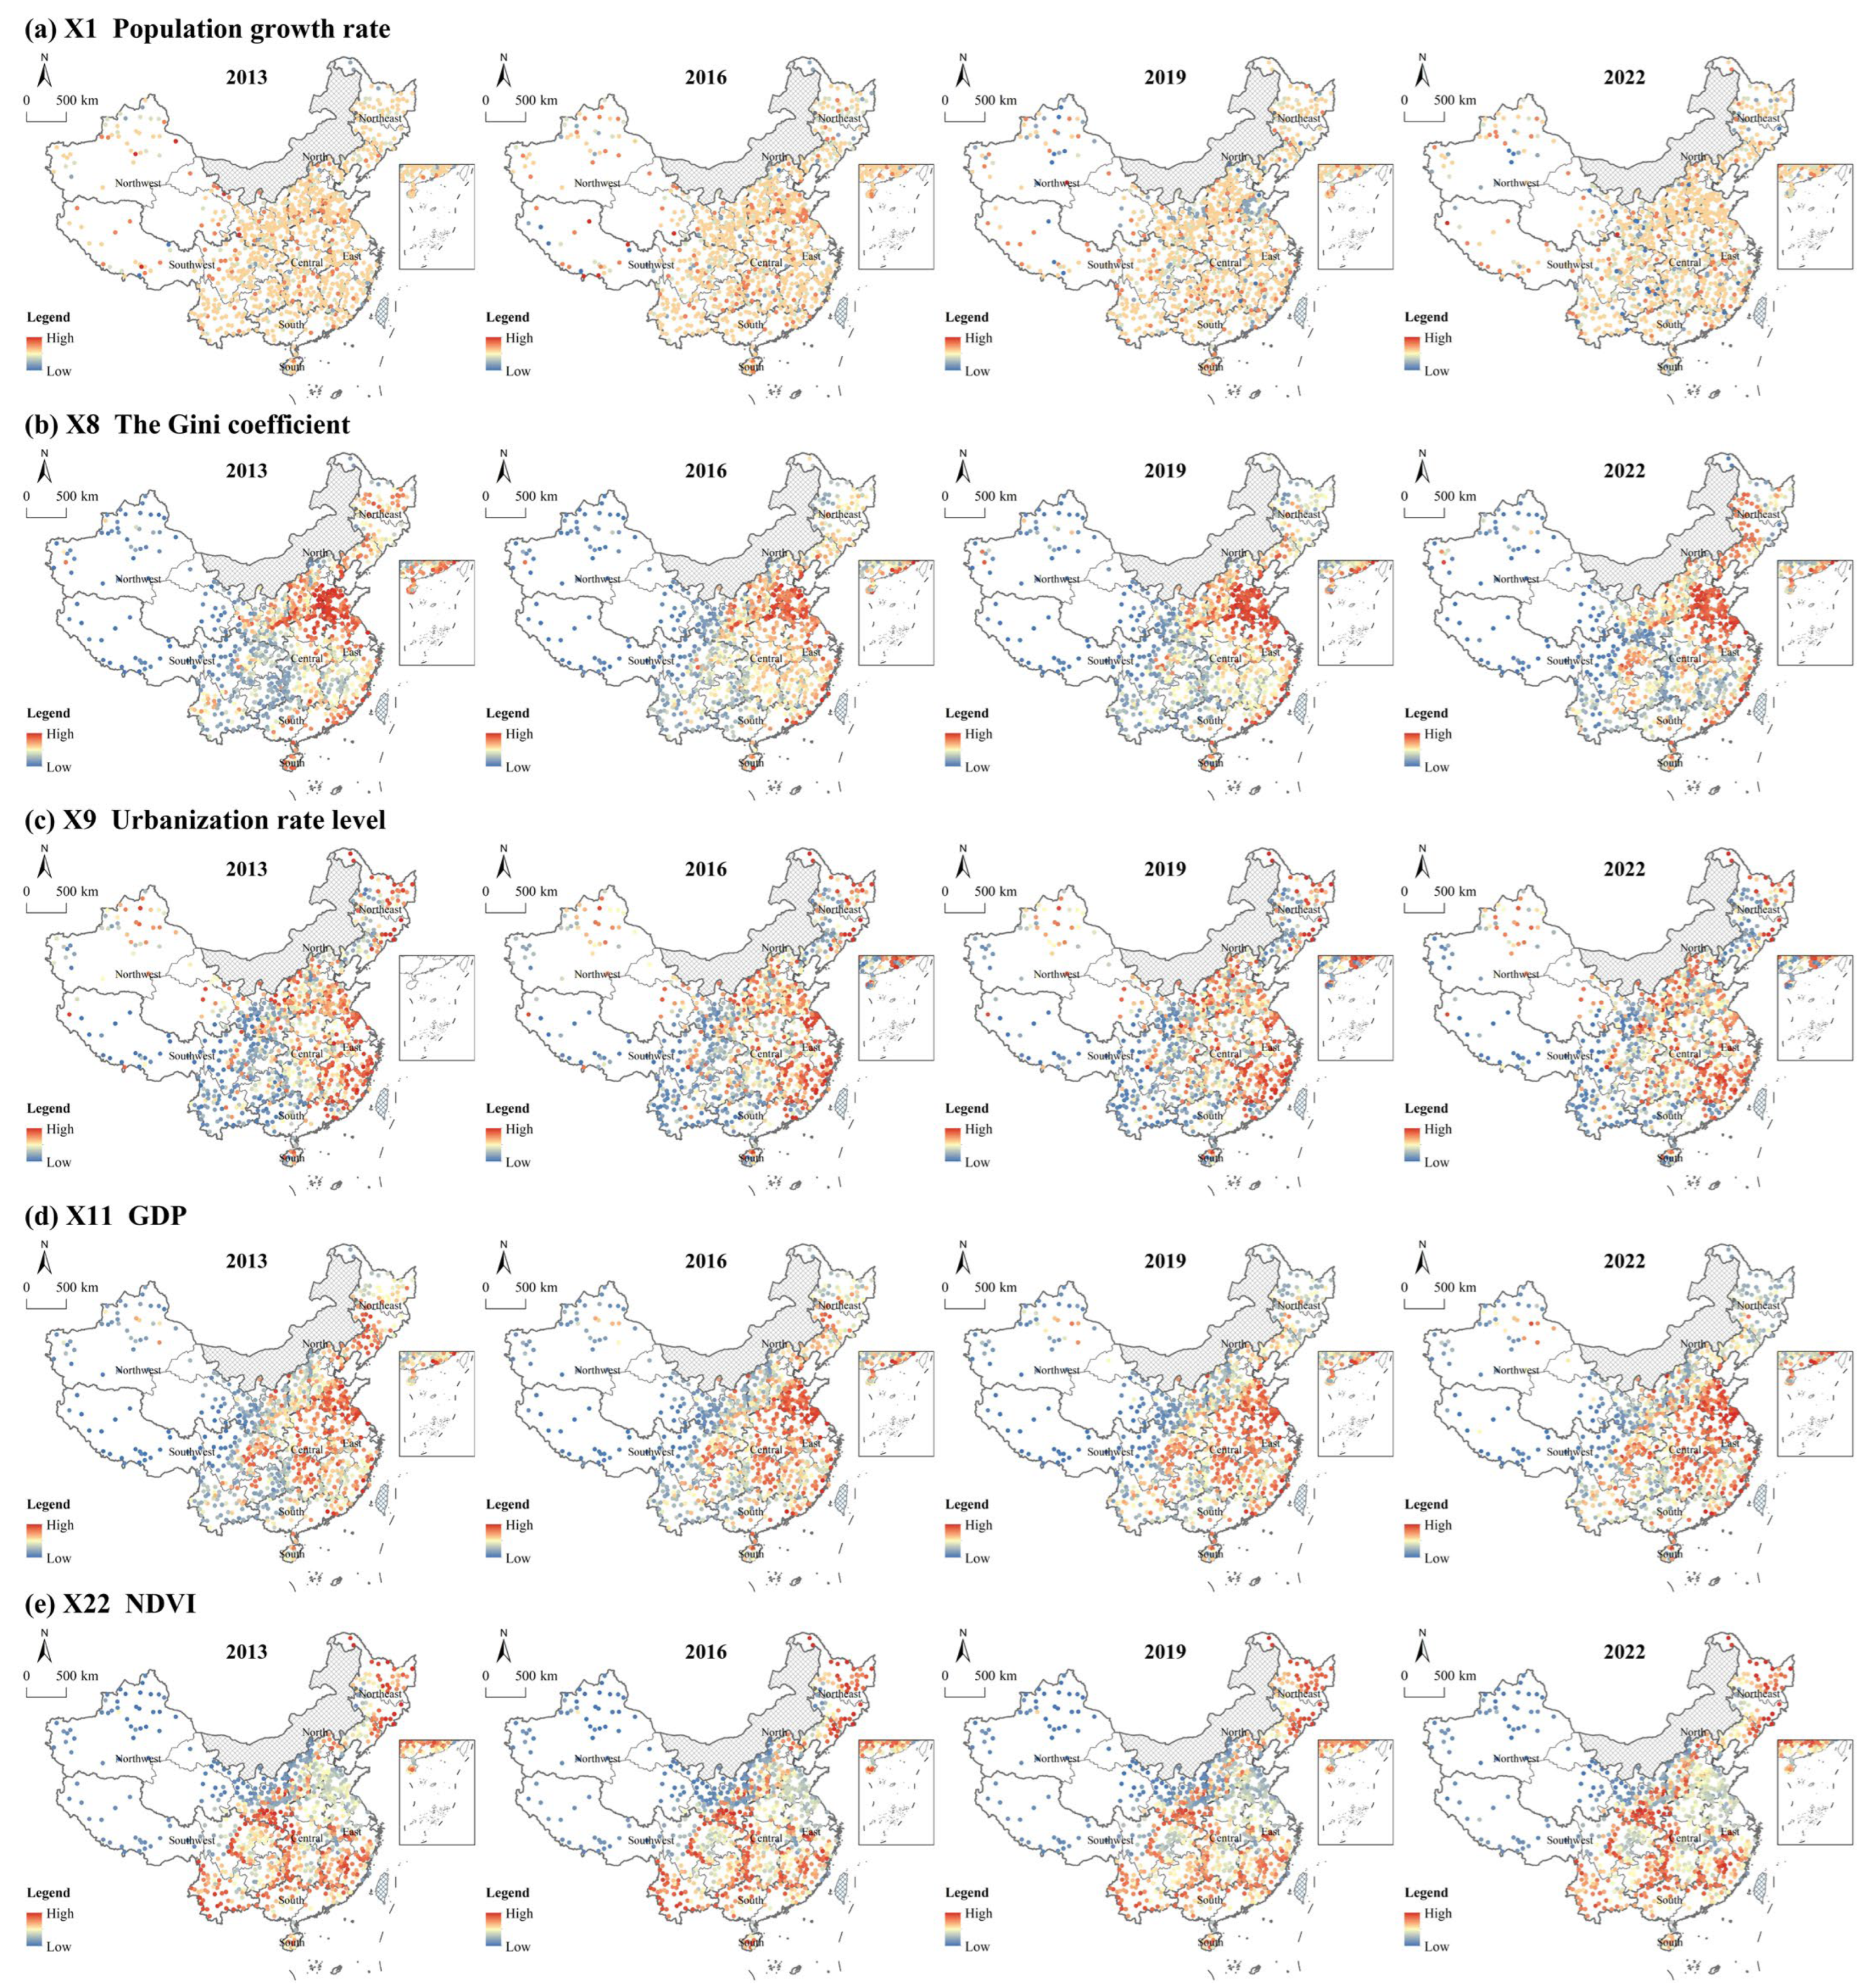
This study explores the spatial heterogeneity of the effects of population growth rate (X1), Gini coefficient (X8), urbanization level (X9), GDP (X11), and NDVI (X22) on SCTR.
From a demographic perspective, the impact of the population growth rate on SCTR shows a spatially scattered pattern, without forming significant clusters. This suggests that population shrinkage exerts a broad and generalized effect on SCTR (Figure 15a). High values of the Gini coefficient, which significantly influence SCTR, are clustered in Shandong, Hebei, and parts of the southeastern coastal regions. Notably, its impact on Northeast China has intensified over the study period (Figure 15b). The urbanization level has a more pronounced effect on SCTR in Heilongjiang Province, as well as in North and East China, while its influence in the Shaanxi-Gansu-Ningxia region and the southwestern provinces is weaker (Figure 15c). The spatial distribution of GDP’s impact on SCTR reveals a “strong east, weak west” distribution, with East and Central China emerging as key high-value areas. In contrast, its influence in Northeast China has shown a declining trend (Figure 15d). NDVI exerts a stronger influence on SCTR in Northeast China, Yunnan, Sichuan, Chongqing, and the southeastern coastal regions, while its impact in the northwest remains relatively limited (Figure 15e).

4. Discussion

4.1. The Shrinkage of Counties in China Is Increasingly Intensifying

Amid rapid urbanization, the population decline in China’s county towns has become an increasingly pressing issue. Over time, population shrinkage in China has been marked by three key trends: an increasing number of affected towns, deepening declines, and a broader geographic scope. These trends align with the findings of Zhang and Yao [99,100]. It is important to highlight that county town shrinkage is not unique to China; it is, in fact, a common challenge faced by small towns globally during periods of transformation [101].
Between 2013 and 2022, two primary patterns of shrinkage emerged in China’s county towns: contiguous decline in the northeastern, northwestern, southwestern, and northern regions, and more localized shrinkage in the central, eastern, and southern regions. This pattern mirrors the trajectory of resource- dependent towns globally, such as Pittsburgh and Detroit in the United States, Manchester and Liverpool in the United Kingdom, and Düsseldorf in Germany’s Ruhr area, all of which faced a cycle of “resource depletion—economic decline—population outflow” due to reliance on single industries and delayed transformation [102,103,104]. Conversely, localized shrinkage largely results from the reallocation of resources driven by the siphoning effect of urban agglomerations. This phenomenon is similar to the population pull exerted by Tokyo on surrounding towns in Japan, or the shrinkage of towns within London’s commuter belt in the United Kingdom. The concentration of capital and labor in core cities often leads to the outflow of population from neighboring small towns [46,105,106].
This study reveals that 47.15% of county towns experienced shrinkage, while Li et al. found that the proportion of shrinking cities in China was 30.4% [107]. This indicates that county towns are facing a more severe crisis of shrinkage compared to cities, a conclusion that aligns with the views expressed by Tong et al. [99]. Moreover, the proportion of shrinking county towns increased sharply between 2019 and 2022, likely due to the adverse economic and social effects of the COVID-19 pandemic. The pandemic intensified the closure of small enterprises in county towns, reducing employment opportunities and accelerating population migration to cities. This impact, not unique to China, has been observed globally, with similar patterns emerging in small towns in southern Italy and non-metropolitan counties in South Korea [108]. These findings highlight the increased vulnerability of county towns to external risks, as well as their heightened sensitivity to macroeconomic fluctuations and policy shifts. This conclusion applies to most small towns worldwide. Consequently, strengthening the SCTR has become a critical issue that must be addressed.

4.2. Differentiated Characteristics and Key Influencing Mechanisms of SCTR

Enhancing the SCTR is a crucial strategy for these towns to withstand external disturbances and mitigate risks, making it an essential component of sustainable development [109]. This study examines the spatial–temporal characteristics of SCTR and the interactions among resilience subsystems. It also explores the mechanisms through which various factors influence resilience from a human–environment coupling perspective. These issues represent the core scientific questions in advancing resilience-building efforts in shrinking county towns.
From a temporal perspective, the SCTR in China has shown a slight upward trend, though it remains at a relatively low level. Notably, resilience subsystems display a differentiated pattern: “increased FCC, HSA volatility, and declining NRS.” Zheng and Chen found that economic and social resilience in most Chinese cities lags behind ecological resilience, which contrasts with the findings of this study [110,111]. This discrepancy is attributed to path dependence driven by policies and development models. Economic development in shrinking county towns has largely been characterized by extensive growth, with a focus on economic benefits at the expense of ecological protection, leading to a decline in NRS. Furthermore, research indicates that air pollution and extreme precipitation between 2017 and 2020 were major contributors to the decline in NRS. This supports Rao et al.’s view that shrinking cities face compounded challenges from both climate change and human activities [72].
It is worth noting that major strategies, such as new-type urbanization, poverty alleviation, and rural revitalization, have accelerated infrastructure development and economic growth in county towns. The governance capacity of local governments and related policies directly influence the degree of shrinkage and resilience-building efforts in these towns [72,112]. In terms of economic resilience, China’s shrinking county towns have received substantial policy support, particularly in FCC, thus maintaining overall stability during transformative periods [101,112]. This contrasts with the market-driven resilience enhancement pathways typically seen in Europe and North America [113,114,115].
Spatially, the SCTR exhibits a clear division along the Hu Line: with higher resilience in the east and lower resilience in the west. This pattern is closely linked to China’s regional development imbalance. Moreover, we observe that the annual growth rate of resilience is higher in central and western regions, which indicates the positive outcomes of China’s regional coordination policies. Policies such as the Western Development Strategy have played a key role in promoting the development of county towns in these areas through strategies such as transfer payments, industrial support, and infrastructure investment.
The greater the population shrinkage in a county town, the slower its resilience growth rate. In cases of extreme shrinkage, resilience can even experience negative growth. For example, extreme shrinking towns in Hokkaido, Japan, have faced a decline in public services and reduced industrial vitality due to continuous population outflow, ultimately entering a vicious cycle of diminishing resilience [116]. Similarly, small towns in eastern Germany, located along the border, have experienced infrastructure idling and economic stagnation due to population loss, resulting in persistently low resilience levels [117,118,119].
Research on the coupling and coordination of SCTR subsystems reveals that the subsystems in China’s shrinking county towns are still in an adjustment phase. Conflicts between economic development, spatial construction, and ecological protection continue to hinder the coordinated development of resilience systems, ultimately affecting the overall SCTR. This finding aligns with the work of Shi and Liu [118,119]. As population shrinkage increases, the coordination between resilience subsystems decreases. Population loss disrupts the relationship between labor, industry, and resources, leading to a failure in synergy among the three subsystems. This highlights that population decline is a key trigger for human–environment decoupling, underscoring the importance of using a human–environment coupling perspective to analyze the SCTR.
Understanding the mechanisms and spatial heterogeneity of the key factors influencing the SCTR is essential to enhancing overall resilience. The impact of population decline is spatially dispersed, highlighting the widespread effects of population shrinkage on the SCTR. However, population loss has emerged as a critical factor driving extreme and severe shrinkage. The Gini coefficient shows high values concentrated in regions such as Shandong, Hebei, and the southeastern coastal areas. This is primarily due to the coexistence of advanced manufacturing and traditional agriculture in these regions, which exacerbates income inequality and weakens the resilience of county towns. Additionally, the northeastern region, reliant on resource-based industries that have declined, exhibits lower economic development quality, resulting in a weakened driving force of GDP in resilience-building efforts.

4.3. Recommendations for Enhancing the SCTR in Different Regions

Policymakers should avoid a one-size-fits-all approach and instead promote development strategies tailored to the specific realities of population shrinkage and local conditions, considering regional disparities. This study provides the following recommendations based on varying levels of shrinkage and resilience across regions:
(1) Northeast China
County towns in the northeast are experiencing severe population decline. While the NRS has recovered, its synergy with the HAS and FCC has weakened, resulting in low coordination among resilience subsystems. The core issue is the decline caused by resource depletion and delayed industrial transformation. Recommendations are as follows: (1) As GDP’s impact on local resilience diminishes, the central government should establish long-term, stable transfer payments to support pensions, unemployment benefits, and healthcare. This will help mitigate the social impact of population loss. (2) The region should reduce reliance on heavy industry and focus on sectors such as modern agriculture, cold-climate tourism, and cross-border cooperation with Russia and Mongolia to revitalize the economy. (3) Prioritize concentrating populations and activities in core county towns. Vacant land should be repurposed for ecological restoration, increasing forest cover and converting ecological burdens into green assets. This will also strengthen NRS and FCC resilience.
(2) Northwest and Southwest China
The southwestern regions of Sichuan, Chongqing, and Guizhou, along with the northwestern regions of Shaanxi, Gansu, Ningxia, Qinghai, and Xinjiang, face continuous shrinkage. These regions exhibit low SCTR levels and weak coordination among resilience subsystems. A common issue is the conflict between HAS and NRS. The following recommendations are proposed: (1) As key ecological zones, these regions should prioritize forest restoration, water quality improvement, and biodiversity protection to reverse NRS decline and enhance HSA resilience. (2) Mitigating the impact of extreme precipitation is crucial in the southwestern region. Investments should focus on resilient transportation, small river management, and flood early-warning systems. In the northwestern region, efforts should focus on water conservation infrastructure and drought management to enhance NRS and FCC subsystem coordination.
(3) North China
Shrinking county towns in North China are affected by the siphoning effect from cities like Beijing and Tianjin. Recommendations are as follows: (1) These towns should integrate into the Beijing-Tianjin-Hebei urban cluster network, leveraging enhanced planning and transportation links to become hubs for technology commercialization, agricultural products, or tourism. This can transform the siphoning effect into a positive spillover. (2) To address the negative impacts of income inequality, local governments should implement policies to narrow wealth gaps, such as providing universal public services and ensuring equitable wealth distribution. This will strengthen social resilience.
(4) Central and Eastern China
In these regions, shrinkage is more localized, with higher SCTR levels but significant internal variation. The focus should be on promoting high-quality urbanization in county towns by enhancing the living environment, public services, and local culture. This will attract rural populations and returning migrants, fostering a positive interaction between HSA and FCC subsystems.
(5) South China
The southern region leads in resilience subsystem coordination, demonstrating effective governance in balancing economic growth, urban development, and ecological protection. As a coastal and highly developed region, South China should take the lead in addressing climate risks such as typhoons and sea level rise. Investments should prioritize strengthening coastal infrastructure and exploring natural solutions, such as mangrove restoration, to ensure long-term resilience.

4.4. Limitations

This study has several limitations that warrant further investigation in future research. First, due to constraints in data availability, the current analysis lacks robust indicators to comprehensively capture the role of government governance capacity. Future research should therefore examine how government policies shape the transformation of shrinking county towns and influence their resilience. Second, the indicators selected in this study may not fully capture all the critical dimensions of SCTR. Future research should develop a more systematic and comprehensive evaluation framework—multi-dimensional, multi-temporal, and multi-objective in nature—to more accurately reflect the dynamic evolution of resilience under population shrinkage. In addition, the identification of shrinking towns is based solely on population decline rates, thereby overlooking the economic and social dimensions inherent to the multifaceted process of urban shrinkage. Finally, this study assessed the resilience of shrinking county towns only for the period 2013–2022, without incorporating projections of future demographic change. Notably, some shrinking county towns have already experienced signs of return migration, which may generate new dynamics in local human–environment interactions. Consequently, future research should extend the observation horizon and incorporate population mobility forecasting models to provide a more comprehensive analysis of the bidirectional relationship between demographic change and resilience dynamics.

5. Conclusions

This study adopts a human–environment coupling perspective to provide a comprehensive understanding of the SCTR, underscoring its importance for advancing China’s new urbanization agenda. Based on coupled human–environment perspective, we developed a multidimensional evaluation model to evaluate the spatiotemporal dynamics of SCTR in China 2013 to 2022. Furthermore, we employed a GWRF model in conjunction with SHAP to elucidate the complex relationships between SCTR and its driving factors. This approach effectively addresses challenges related to nonlinearity, spatial heterogeneity, and model interpretability in attribution analysis. The main findings are as follows:
Between 2013 and 2022, the number of shrinking county towns in China increased annually, with the most significant shrinkage observed in the Northeast, Northwest, and Southwest regions. During the study period, SCTR showed a slight upward trend. Regarding the resilience of the subsystems, the trend of HSA resilience is consistent with that of overall SCTR; FCC resilience has shown a rapid increase, while the resilience of the NRS has slightly declined. From a spatial perspective, the SCTR was markedly higher in the eastern region than in the western region, as demarcated by the Hu Line. Regarding shrinkage severity, higher levels of shrinkage corresponded to slower resilience growth and weaker coupling coordination among the subsystems. These findings indicate that population shrinkage has begun to undermine county-town resilience and disrupt the coordination of human–environment interactions in China. The attribution analysis reveals that income inequality (Gini coefficient), urbanization level, local government budgetary revenue, and NDVI represent the principal determinants shaping SCTR. Moreover, in towns undergoing severe or extreme shrinkage, population outmigration emerges as a major impediment to resilience building. Therefore, strengthening the SCTR in China requires the formulation of differentiated strategies that are responsive to regional shrinkage stages and geographical specificities, thereby facilitating high-quality county-town development and contributing to the advancement of new-type urbanization.

Author Contributions

Conceptualization, C.L.; methodology, C.L.; software, C.L.; validation, C.L.; formal analysis, C.L.; investigation, C.L.; resources, C.L.; data curation, C.L.; writing—original draft preparation, C.L.; writing—review and editing, H.L. and Q.Y.; visualization, C.L.; supervision, C.L., H.L. and Q.Y.; project administration, H.L. and Q.Y.; funding acquisition, Q.Y. All authors have read and agreed to the published version of the manuscript.

Funding

This work was supported by USI Seed Fund supports from the National Natural Science Foundation of China, ‘Research on the Coupling and Coordination of Shrinkage and Social-Ecological System Resilience of Small Towns and Differentiated Planning and Regulation: A Case Study of Northeast China’ (No.52278056).

Data Availability Statement

The data used to support the findings of this study are available from the corresponding author upon request.

Conflicts of Interest

The authors declare no conflicts of interest.

References

  1. Alves, D.; Barreira, A.P.; Guimarães, M.H.; Panagopoulos, T. Historical trajectories of currently shrinking Portuguese cities: A typology of urban shrinkage. Cities 2016, 52, 20–29. [Google Scholar] [CrossRef]
  2. Nelle, A.; Großmann, K.; Haase, D.; Kabisch, S.; Rink, D.; Wolff, M. Urban shrinkage in Germany: An entangled web of conditions, debates and policies. Cities 2017, 69, 116–123. [Google Scholar] [CrossRef]
  3. Peters, D.J.; Hamideh, S.; Zarecor, K.E.; Ghandour, M. Using entrepreneurial social infrastructure to understand smart shrinkage in small towns. J. Rural Stud. 2018, 64, 39–49. [Google Scholar] [CrossRef]
  4. Martinez-Fernandez, C.; Audirac, I.; Fol, S.; Cunningham-Sabot, E. Shrinking Cities: Urban Challenges of Globalization. Int. J. Urban Reg. Res. 2012, 36, 213–225. [Google Scholar] [CrossRef]
  5. Tong, Y.; Liu, W.; Li, C.; Zhang, J.; Ma, Z. Understanding patterns and multilevel influencing factors of small town shrinkage in Northeast China. Sustain. Cities Soc. 2021, 68, 102811. [Google Scholar] [CrossRef]
  6. Gao, Z.; Wang, S.; Gu, J. Identification and mechanisms of regional urban shrinkage: A case study of Wuhan city in the heart of rapidly growing China. J. Urban Plan. Dev. 2021, 147, 05020033. [Google Scholar] [CrossRef]
  7. Li, H.; Lo, K.; Zhang, P. Population shrinkage in resource-dependent cities in China: Processes, patterns and drivers. Chin. Geogr. Sci. 2020, 30, 1–15. [Google Scholar] [CrossRef]
  8. Li, H.; Mykhnenko, V. Urban shrinkage with Chinese characteristics. Geogr. J. 2018, 184, 398–412. [Google Scholar] [CrossRef]
  9. Caselli, B.; Ventura, P.; Zazzi, M. Performance-based spatial monitoring. An interpretative model for long-term shrinking medium-small Italian towns. Sustain. Cities Soc. 2020, 53, 101924. [Google Scholar] [CrossRef]
  10. Long, Y.; Wu, K. Shrinking cities in a rapidly urbanizing China. Environ. Plan. A 2016, 48, 220–222. [Google Scholar] [CrossRef]
  11. Zhang, X.; Zhou, S. Evolution of regional population decline and its driving factors at the county level in China. Econ. Geogr. 2023, 43, 42–51+98. [Google Scholar] [CrossRef]
  12. Geng, Y.; Li, X.; Li, L.; Liu, X.; Chen, X.; Chen, J.; Cheng, J. Static-dynamic characteristics and management scheme of county space resilience based on geographical natures—An empirical study of 95 counties from Jiangsu Province, China. Ecol. Indic. 2024, 166, 112285. [Google Scholar] [CrossRef]
  13. Xu, H.; Deng, H.; Zhang, D. Fine-grained sustainability assessment: County sustainable development in China from 2000 to 2017. J. Clean. Prod. 2023, 425, 138798. [Google Scholar] [CrossRef]
  14. Datola, G. Implementing urban resilience in urban planning: A comprehensive framework for urban resilience evaluation. Sustain. Cities Soc. 2023, 98, 104821. [Google Scholar] [CrossRef]
  15. Li, H.; Jin, X.; Liu, J.; Feng, D.; Xu, W.; Zhou, Y. Analytical framework for integrating resources, morphology, and function of rural system resilience—An empirical study of 386 villages. J. Clean. Prod. 2022, 365, 132738. [Google Scholar] [CrossRef]
  16. Drewes, J.; Van Aswegen, M. Determining the vitality of urban centres. Sustain. World 2011, 142, 15. [Google Scholar]
  17. Yu, T.; Leng, H.; Yuan, Q.; Yuan, Z. Spatial-temporal patterns and driving mechanism of rural vulnerability at county level: A case study of 117 counties in Heilongjiang Province, China. J. Rural Stud. 2025, 113, 103475. [Google Scholar] [CrossRef]
  18. Dubeaux, S.; Cunningham Sabot, E. Maximizing the potential of vacant spaces within shrinking cities, a German approach. Cities 2018, 75, 6–11. [Google Scholar] [CrossRef]
  19. Schwarz, K.; Berland, A.; Herrmann, D.L. Green, but not just? Rethinking environmental justice indicators in shrinking cities. Sustain. Cities Soc. 2018, 41, 816–821. [Google Scholar] [CrossRef]
  20. Sun, Y.; Wang, Y.; Zhou, X.; Chen, W. Are shrinking populations stifling urban resilience? Evidence from 111 resource-based cities in China. Cities 2023, 141, 104458. [Google Scholar] [CrossRef]
  21. Shi, B.; Liu, H.; Huang, L.; Zhang, Y.; Xiang, Z. Increasing Vulnerability of Village Heritage: Evidence from 123 Villages in Aba Prefecture, Sichuan, China. Land 2023, 12, 2048. [Google Scholar] [CrossRef]
  22. Che, Y.; Zhang, Y.; Duan, W.; Zhang, B.; Chen, H. An evaluation of county resilience development levels at the provincial level utilizing multi-source data: A case study of Shandong province. Urban Dev. Stud. 2024, 31, 18–23. [Google Scholar]
  23. Holling, C.S. Resilience and stability of ecological systems. Annu. Rev. Ecol. Evol. Syst. 1973, 4, 1–23. [Google Scholar] [CrossRef]
  24. Walker, B.; Holling, C.S.; Carpenter, S.R.; Kinzig, A. Resilience, adaptability and transformability in social–ecological systems. Ecol. Soc. 2004, 9, 5. [Google Scholar] [CrossRef]
  25. Zhao, R.; Fang, C.; Liu, J.; Zhang, L. The evaluation and obstacle analysis of urban resilience from the multidimensional perspective in Chinese cities. Sustain. Cities Soc. 2022, 86, 104160. [Google Scholar] [CrossRef]
  26. Wang, H.; Ge, Q. Ecological resilience of three major urban agglomerations in China from the “environment–society” coupling perspective. Ecol. Indic. 2024, 169, 112944. [Google Scholar] [CrossRef]
  27. Ji, X.; Nie, Z.; Wang, K.; Xu, M.; Fang, Y. Spatiotemporal evolution and influencing factors of urban resilience in the Yellow River Basin, China. Reg. Sustain. 2024, 5, 100159. [Google Scholar] [CrossRef]
  28. Liu, R.; Zhang, L.; Tang, Y.; Jiang, Y. Understanding and evaluating the resilience of rural human settlements with a social-ecological system framework: The case of Chongqing Municipality, China. Land Use Policy 2024, 136, 106966. [Google Scholar] [CrossRef]
  29. Zang, Y.; Wang, H.; Huang, J.; Liu, G.; Li, J. Community disaster resilience assessment and external association characteristics analysis based on accessibility of service facilities: From the perspective of 15-minute life circle. Sustain. Cities Soc. 2025, 118, 106051. [Google Scholar] [CrossRef]
  30. Lu, H.; Lu, X.; Jiao, L.; Zhang, Y. Evaluating urban agglomeration resilience to disaster in the Yangtze Delta city group in China. Sustain. Cities Soc. 2022, 76, 103464. [Google Scholar] [CrossRef]
  31. Lu, Y.; Zhai, G.; Zhai, W. Quantifying urban spatial resilience using multi-criteria decision analysis (MCDA) and back propagation neural network (BPNN). Int. J. Disaster Risk Reduct. 2024, 111, 104694. [Google Scholar] [CrossRef]
  32. Band, S.S.; Qasem, S.N.; Eslami, S.; Mansor, Z.; Gupta, B.B.; Pai, H.-T.; Biyari, M.; Mosavi, A.; Sajedi Hosseini, F. Integrating the pressure-state-response model with the extension catastrophe progression for flood risk and resilience assessment. Environ. Sustain. Indic. 2025, 27, 100727. [Google Scholar] [CrossRef]
  33. Yin, S.; Shi, R.; Wu, N.; Yang, J. Measuring the impact of technological innovation on urban resilience through explainable machine learning: A case study of the Yangtze River Delta region, China. Sustain. Cities Soc. 2025, 127, 106457. [Google Scholar] [CrossRef]
  34. Ahmadi, Z.; Ghasemi, M.; Khavarian-Garmsir, A.R.; Ahmadi, M. Integrating flood and earthquake resilience: A framework for assessing urban community resilience against multiple hazards. J. Saf. Sci. Resil. 2024, 5, 330–343. [Google Scholar] [CrossRef]
  35. Zhang, C.; Zhou, Y.; Yin, S. Interaction mechanisms of urban ecosystem resilience based on pressure-state-response framework: A case study of the Yangtze River Delta. Ecol. Indic. 2024, 166, 112263. [Google Scholar] [CrossRef]
  36. Li, L.; Xu, J.; Liang, Y. The formation and evolution of vulnerability risk of rural poor groups under the perspective of social support—Based on the analysis of “sensitivity-resilience”. Heliyon 2024, 10, e30305. [Google Scholar] [CrossRef]
  37. Zhu, S.; Feng, H.; Arashpour, M.; Zhang, F. Enhancing urban flood resilience: A coupling coordinated evaluation and geographical factor analysis under SES-PSR framework. Int. J. Disaster Risk Reduct. 2024, 101, 104243. [Google Scholar] [CrossRef]
  38. Wang, H.; Liu, Z.; Zhou, Y. Assessing urban resilience in China from the perspective of socioeconomic and ecological sustainability. Environ. Impact Assess. Rev. 2023, 102, 107163. [Google Scholar] [CrossRef]
  39. Zhang, R.; Yuan, Y.; Li, H.; Hu, X. Improving the framework for analyzing community resilience to understand rural revitalization pathways in China. J. Rural Stud. 2022, 94, 287–294. [Google Scholar] [CrossRef]
  40. Chen, X.-L.; Yu, L.-X.; Lin, W.-D.; Yang, F.-Q.; Li, Y.-P.; Tao, J.; Cheng, S. Urban resilience assessment from the multidimensional perspective using dynamic Bayesian network: A case study of Fujian Province, China. Reliab. Eng. Syst. Saf. 2023, 238, 109469. [Google Scholar] [CrossRef]
  41. Liu, W.; Zhou, J.; Li, X.; Zheng, H.; Liu, Y. Urban resilience assessment and its spatial correlation from the multidimensional perspective: A case study of four provinces in North-South Seismic Belt, China. Sustain. Cities Soc. 2024, 101, 105109. [Google Scholar] [CrossRef]
  42. Döringer, S.; Uchiyama, Y.; Penker, M.; Kohsaka, R. A meta-analysis of shrinking cities in Europe and Japan. Towards an integrative research agenda. Eur. Plan. Stud. 2020, 28, 1693–1712. [Google Scholar] [CrossRef]
  43. Ortiz-Moya, F. Coping with shrinkage: Rebranding post-industrial Manchester. Sustain. Cities Soc. 2015, 15, 33–41. [Google Scholar] [CrossRef]
  44. Ribant, M.; Chen, X. A typology of US shrinking cities. Prof. Geogr. 2020, 72, 152–164. [Google Scholar] [CrossRef]
  45. Bernt, M.; Haase, A.; Großmann, K.; Cocks, M.; Couch, C.; Cortese, C.; Krzysztofik, R. How does (n’t) Urban Shrinkage get onto the Agenda? Experiences from L eipzig, L iverpool, G enoa and B ytom. Int. J. Urban Reg. Res. 2014, 38, 1749–1766. [Google Scholar] [CrossRef]
  46. Martinez-Fernandez, C.; Weyman, T.; Fol, S.; Audirac, I.; Cunningham-Sabot, E.; Wiechmann, T.; Yahagi, H. Shrinking cities in Australia, Japan, Europe and the USA: From a global process to local policy responses. Prog. Plan. 2016, 105, 1–48. [Google Scholar] [CrossRef]
  47. Wolff, M.; Wiechmann, T. Urban growth and decline: Europe’s shrinking cities in a comparative perspective 1990–2010. Eur. Urban Reg. Stud. 2018, 25, 122–139. [Google Scholar] [CrossRef]
  48. Blanco, H.; Alberti, M.; Forsyth, A.; Krizek, K.J.; Rodríguez, D.A.; Talen, E.; Ellis, C. Hot, congested, crowded and diverse: Emerging research agendas in planning. Prog. Plan. 2009, 71, 153–205. [Google Scholar] [CrossRef]
  49. Guo, Z.; Yan, L.; Zhang, Z.; Guo, J. A study on patterns and strategies of in-situ urbanization in China with county towns as key carriers. City Plan. Rev. 2025, 49, 40–48+74. [Google Scholar]
  50. Martin, R.; Sunley, P.; Tyler, P. Local growth evolutions: Recession, resilience and recovery. Camb. J. Reg. Econ. Soc. 2015, 8, 141–148. [Google Scholar] [CrossRef]
  51. Sutton, J.; Arcidiacono, A.; Torrisi, G.; Arku, R.N. Regional economic resilience: A scoping review. Prog. Hum. Geogr. 2023, 47, 500–532. [Google Scholar] [CrossRef]
  52. Liu, Y.; Liu, Y.; Ou, C. Scientific cognition and detection methods of modern human-earth system. In Proceedings of the AGU Fall Meeting Abstracts, San Francisco, CA, USA, 11–15 December 2023; p. SY52B-01. [Google Scholar]
  53. An, L. Modeling human decisions in coupled human and natural systems: Review of agent-based models. Ecol. Model. 2012, 229, 25–36. [Google Scholar] [CrossRef]
  54. Hyun, J.-Y.; Huang, S.-Y.; Yang, Y.-C.E.; Tidwell, V.; Macknick, J. Using a coupled agent-based modeling approach to analyze the role of risk perception in water management decisions. Hydrol. Earth Syst. Sci. 2019, 23, 2261–2278. [Google Scholar] [CrossRef]
  55. Liu, J.; Dietz, T.; Carpenter, S.R.; Alberti, M.; Folke, C.; Moran, E.; Pell, A.N.; Deadman, P.; Kratz, T.; Lubchenco, J. Complexity of coupled human and natural systems. Science 2007, 317, 1513–1516. [Google Scholar] [CrossRef]
  56. Yang, Y.E.; Son, K.; Hung, F.; Tidwell, V. Impact of climate change on adaptive management decisions in the face of water scarcity. J. Hydrol. 2020, 588, 125015. [Google Scholar] [CrossRef]
  57. Turner, B.L.; Matson, P.A.; McCarthy, J.J.; Corell, R.W.; Christensen, L.; Eckley, N.; Hovelsrud-Broda, G.K.; Kasperson, J.X.; Kasperson, R.E.; Luers, A. Illustrating the coupled human–environment system for vulnerability analysis: Three case studies. Proc. Natl. Acad. Sci. USA 2003, 100, 8080–8085. [Google Scholar] [CrossRef]
  58. Galvani, A.P.; Bauch, C.T.; Anand, M.; Singer, B.H.; Levin, S.A. Human–environment interactions in population and ecosystem health. Proc. Natl. Acad. Sci. USA 2016, 113, 14502–14506. [Google Scholar] [CrossRef]
  59. Fu, B. Promoting Geography for Sustainability. Geogr. Sustain. 2020, 1, 1–7. [Google Scholar] [CrossRef]
  60. Ostrom, E. A General Framework for Analyzing Sustainability of Social-Ecological Systems. Science 2009, 325, 419–422. [Google Scholar] [CrossRef] [PubMed]
  61. Liu, J.; Mooney, H.; Hull, V.; Davis, S.J.; Gaskell, J.; Hertel, T.; Lubchenco, J.; Seto, K.C.; Gleick, P.; Kremen, C. Systems integration for global sustainability. Science 2015, 347, 1258832. [Google Scholar] [CrossRef]
  62. Adger, W.N. Vulnerability. Glob. Environ. Change 2006, 16, 268–281. [Google Scholar] [CrossRef]
  63. Gunderson, L.H.; Holling, C.S. Panarchy: Understanding Transformations in Human and Natural Systems; Island Press: Washington, DC, USA, 2002. [Google Scholar]
  64. Turner Ii, B. Vulnerability and resilience: Coalescing or paralleling approaches for sustainability science? Glob. Environ. Change 2010, 20, 570–576. [Google Scholar] [CrossRef]
  65. Stokols, D.; Lejano, R.P.; Hipp, J. Enhancing the resilience of human–environment systems: A social ecological perspective. Ecol. Soc. 2013, 18, 7. [Google Scholar] [CrossRef]
  66. Li, Y.; Kappas, M.; Li, Y. Exploring the coastal urban resilience and transformation of coupled human-environment systems. J. Clean. Prod. 2018, 195, 1505–1511. [Google Scholar] [CrossRef]
  67. Bauch, C.T.; Sigdel, R.; Pharaon, J.; Anand, M. Early warning signals of regime shifts in coupled human–environment systems. Proc. Natl. Acad. Sci. USA 2016, 113, 14560–14567. [Google Scholar] [CrossRef]
  68. Allington, G.R.; Li, W.; Brown, D.G. Urbanization and environmental policy effects on the future availability of grazing resources on the Mongolian Plateau: Modeling socio-environmental system dynamics. Environ. Sci. Policy 2017, 68, 35–46. [Google Scholar] [CrossRef]
  69. Brelsford, C.; Lobo, J.; Hand, J.; Bettencourt, L.M. Heterogeneity and scale of sustainable development in cities. Proc. Natl. Acad. Sci. USA 2017, 114, 8963–8968. [Google Scholar] [CrossRef]
  70. Wu, J. Landscape sustainability science: Ecosystem services and human well-being in changing landscapes. Landsc. Ecol. 2013, 28, 999–1023. [Google Scholar] [CrossRef]
  71. Gurrutxaga, M. Incorporating the life-course approach into shrinking cities assessment: The uneven geographies of urban population decline. Eur. Plan. Stud. 2020, 28, 732–748. [Google Scholar] [CrossRef]
  72. Rao, Y.; Wu, C.; He, Q. The antagonistic effect of urban growth pattern and shrinking cities on air quality: Based on the empirical analysis of 174 cities in China. Sustain. Cities Soc. 2023, 97, 104752. [Google Scholar] [CrossRef]
  73. Zhu, C.; Fang, C.; Zhang, L. Analysis of the coupling coordinated development of the Population–Water–Ecology–Economy system in urban agglomerations and obstacle factors discrimination: A case study of the Tianshan North Slope Urban Agglomeration, China. Sustain. Cities Soc. 2023, 90, 104359. [Google Scholar] [CrossRef]
  74. Ran, Z.; Gao, J.; Yang, J.; Li, C. Evolution and formation mechanism of the agglomeration pattern of commercial fitness resources in China. Acta Geogr. Sin. 2023, 78, 1573–1590. [Google Scholar]
  75. Zhu, Z.; Zheng, Y.; Xiang, P. Deciphering the spatial and temporal evolution of urban anthropogenic resilience within the Yangtze River Delta urban agglomeration. Sustain. Cities Soc. 2023, 88, 104274. [Google Scholar] [CrossRef]
  76. Yi, R.; Chen, Y.; Chen, A. Evaluating urban climate resilience in the Yangtze River Delta urban agglomeration: A novel method integrating the DPSIR model and Sustainable Development Goals. J. Environ. Manag. 2025, 376, 124517. [Google Scholar] [CrossRef]
  77. Han, S.; Wang, B.; Ao, Y.; Bahmani, H.; Chai, B. The coupling and coordination degree of urban resilience system: A case study of the Chengdu–Chongqing urban agglomeration. Environ. Impact Assess. Rev. 2023, 101, 107145. [Google Scholar] [CrossRef]
  78. Xiao, Y.; Yang, H.; Chen, L.; Huang, H.; Chang, M. Urban resilience assessment and multi-scenario simulation: A case study of three major urban agglomerations in China. Environ. Impact Assess. Rev. 2025, 111, 107734. [Google Scholar] [CrossRef]
  79. Wang, J.; Shao, Z.; Zhuang, Q.; Dang, C.; Jing, P.; Cai, B.; Wang, S.; Li, J.; Yang, F.; Wang, W. Multi-scale coupling quantitative assessment of ecological-urban resilience in the Yangtze River Economic Belt. Geo-Spat. Inf. Sci. 2025, 1–21. [Google Scholar] [CrossRef]
  80. Pijanowski, B.C.; Brown, D.G.; Shellito, B.A.; Manik, G.A. Using neural networks and GIS to forecast land use changes: A Land Transformation Model. Comput. Environ. Urban Syst. 2002, 26, 553–575. [Google Scholar] [CrossRef]
  81. Wu, D.; Zhang, Y.; Xiang, Q. Geographically weighted random forests for macro-level crash frequency prediction. Accid. Anal. Prev. 2024, 194, 107370. [Google Scholar] [CrossRef]
  82. Rudin, C. Stop explaining black box machine learning models for high stakes decisions and use interpretable models instead. Nat. Mach. Intell. 2019, 1, 206–215. [Google Scholar] [CrossRef]
  83. Yang, W.; Li, Y.; Liu, Y.; Fan, P.; Yue, W. Environmental factors for outdoor jogging in Beijing: Insights from using explainable spatial machine learning and massive trajectory data. Landsc. Urban Plan. 2024, 243, 104969. [Google Scholar] [CrossRef]
  84. Wang, L.; Yang, J.; Wu, S.; Hu, L.; Ge, Y.; Du, Z. Enhancing mineral prospectivity mapping with geospatial artificial intelligence: A geographically neural network-weighted logistic regression approach. Int. J. Appl. Earth Obs. Geoinf. 2024, 128, 103746. [Google Scholar] [CrossRef]
  85. Foroutan, E.; Hu, T.; Li, Z. Revealing key factors of heat-related illnesses using geospatial explainable AI model: A case study in Texas, USA. Sustain. Cities Soc. 2025, 122, 106243. [Google Scholar] [CrossRef]
  86. Li, Z.; Yan, W. Service flow changes in multilayer networks: A framework for measuring urban disaster resilience based on availability to critical facilities. Landsc. Urban Plan. 2024, 244, 104996. [Google Scholar] [CrossRef]
  87. Cao, Y.; Li, Y.; Shen, S.; Wang, W.; Peng, X.; Chen, J.; Liao, J.; Lv, X.; Liu, Y.; Ma, L.; et al. Mapping urban green equity and analysing its impacted mechanisms: A novel approach. Sustain. Cities Soc. 2024, 101, 105071. [Google Scholar] [CrossRef]
  88. Ma, Y.; Xu, C.; Yang, Z. Quantifying the impact of urban blue-green spaces on humid-heat exposure risk: A case study of Nanjing’s central urban area. Ecol. Indic. 2025, 176, 113708. [Google Scholar] [CrossRef]
  89. Gu, T.; Zhao, H.; Yue, L.; Guo, J.; Cui, Q.; Tang, J.; Gong, Z.; Zhao, P. Attribution analysis of urban social resilience differences under rainstorm disaster impact: Insights from interpretable spatial machine learning framework. Sustain. Cities Soc. 2025, 118, 106029. [Google Scholar] [CrossRef]
  90. Guo, L.; Yang, S.; Peng, Y.; Yuan, M. Examining the nonlinear effects of residential and workplace-built environments on active travel in short-distance: A random forest approach. Int. J. Environ. Res. Public Health 2023, 20, 1969. [Google Scholar] [CrossRef]
  91. Cheng, L.; De Vos, J.; Zhao, P.; Yang, M.; Witlox, F. Examining non-linear built environment effects on elderly’s walking: A random forest approach. Transp. Res. Part D Transp. Environ. 2020, 88, 102552. [Google Scholar] [CrossRef]
  92. Xue, F.; Yao, E. Adopting a random forest approach to model household residential relocation behavior. Cities 2022, 125, 103625. [Google Scholar] [CrossRef]
  93. Li, L.; Liang, X.; Li, J.; Jiao, J. China’s policy for the control of air pollution and air pollution control: An empirical research based on city-level panel data. Ecol. Econ. 2024, 40, 179–186. [Google Scholar]
  94. Zhu, S.; Feng, H.; Shao, Q. Evaluating Urban Flood Resilience within the Social-Economic-Natural Complex Ecosystem: A Case Study of Cities in the Yangtze River Delta. Land 2023, 12, 1200. [Google Scholar] [CrossRef]
  95. Wang, H.; Hu, Y.; Guo, Y.; Wu, Z.; Yan, D. Urban flood forecasting based on the coupling of numerical weather model and stormwater model: A case study of Zhengzhou city. J. Hydrol. Reg. Stud. 2022, 39, 100985. [Google Scholar] [CrossRef]
  96. Wu, Z.; Shen, Y.; Wang, H.; Wu, M. Urban flood disaster risk evaluation based on ontology and Bayesian Network. J. Hydrol. 2020, 583, 124596. [Google Scholar] [CrossRef]
  97. Rentschler, J.; Avner, P.; Marconcini, M.; Su, R.; Strano, E.; Vousdoukas, M.; Hallegatte, S. Global evidence of rapid urban growth in flood zones since 1985. Nature 2023, 622, 87–92. [Google Scholar] [CrossRef]
  98. Grekousis, G.; Feng, Z.; Marakakis, I.; Lu, Y.; Wang, R. Ranking the importance of demographic, socioeconomic, and underlying health factors on US COVID-19 deaths: A geographical random forest approach. Health Place 2022, 74, 102744. [Google Scholar] [CrossRef]
  99. Tong, Y.; Liu, W.; Li, C.; Rong, Y.; Zhang, J.; Yang, Y.; Yan, Q.; Gao, S.; Liu, Y. County town shrinkage in China: Identification, spatiotemporal variations and the heterogeneity of influencing factors. J. Rural Stud. 2022, 95, 350–361. [Google Scholar] [CrossRef]
  100. Zhang, Y.; Ding, X.; Dong, L.; Yu, S. Research on spatiotemporal patterns and influencing factors of county-level urban shrinkage in urbanizing China. Sustain. Cities Soc. 2024, 109, 105544. [Google Scholar] [CrossRef]
  101. Großmann, K.; Adams, R.-M.; Bolotova, A.; Gunko, M.; Lilius, J.; Messerschmidt, S.; Sandmann, L. Self-responsibilization, the municipality, and the state: Peripheralization shaping local initiatives in shrinking small towns. Cities 2024, 150, 105067. [Google Scholar] [CrossRef]
  102. Raines, A.B. Wandel durch (Industrie) Kultur [Change through (industrial) culture]: Conservation and renewal in the Ruhrgebiet. Plan. Perspect. 2011, 26, 183–207. [Google Scholar] [CrossRef]
  103. Digaetano, A.; Lawless, P. Urban Governance and Industrial Decline:Governing Structures and Policy Agendas in Birmingham and Sheffield, England, and Detroit, Michigan, 1980-1997. Urban Aff. Rev. 1999, 34, 546–577. [Google Scholar] [CrossRef]
  104. Glaeser, E.L.; Gyourko, J. Urban decline and durable housing. J. Political Econ. 2005, 113, 345–375. [Google Scholar] [CrossRef]
  105. Sassen, S. The Global City: New York, London, Tokyo; Princeton University Press: Princeton, NI, USA, 2013. [Google Scholar]
  106. Scott, A.J. Global City-Regions: Trends, Theory, Policy; Oxford University Press: Oxford, UK, 2001. [Google Scholar]
  107. Li, T.; Daams, M.N.; Sijtsma, F.J. Shrinking cities in China: A long-term metropolitan perspective. Cities 2025, 158, 105702. [Google Scholar] [CrossRef]
  108. Gude, V.; Melendez, R.; Islam, M.M. Factors influencing anticipated migration patterns across metropolitan cities in the United States between 2018 and 2022. Front. Urban Rural Plan. 2025, 3, 3. [Google Scholar] [CrossRef]
  109. Sun, P.; Cao, N.; Zhang, K.; Lu, M. Resilience of shrinking cities: Diagnosis of shrinking effects and research on their transmission paths. Geogr. Res. 2024, 43, 1107–1125. [Google Scholar]
  110. Zheng, Y.; Xin-Lu, X.; Chen-Zhen, L.; Mou, W.; Xiao-Jia, H. Development as adaptation: Framing and measuring urban resilience in Beijing. Adv. Clim. Change Res. 2018, 9, 234–242. [Google Scholar] [CrossRef]
  111. Chen, Y.; Zhu, M.; Zhou, Q.; Qiao, Y. Research on spatiotemporal differentiation and influence mechanism of urban resilience in China based on MGWR model. Int. J. Environ. Res. Public Health 2021, 18, 1056. [Google Scholar] [CrossRef]
  112. Lee, T.; Painter, M. Comprehensive local climate policy: The role of urban governance. Urban Clim. 2015, 14, 566–577. [Google Scholar] [CrossRef]
  113. Beauregard, R.A. The radical break in late twentieth-century urbanization. Area 2006, 38, 218–220. [Google Scholar] [CrossRef]
  114. Großmann, K.; Bontje, M.; Haase, A.; Mykhnenko, V. Shrinking cities: Notes for the further research agenda. Cities 2013, 35, 221–225. [Google Scholar] [CrossRef]
  115. Hackworth, J. The limits to market-based strategies for addressing land abandonment in shrinking American cities. Prog. Plan. 2014, 90, 1–37. [Google Scholar] [CrossRef]
  116. Guo, Z.-H. Local revitalization: Support from local residents. Sustainability 2022, 14, 8298. [Google Scholar] [CrossRef]
  117. Glock, B.; Häußermann, H. New trends in urban development and public policy in eastern Germany: Dealing with the vacant housing problem at the local level. Int. J. Urban Reg. Res. 2004, 28, 919–929. [Google Scholar] [CrossRef]
  118. Shi, T.; Yang, S.; Zhang, W.; Zhou, Q. Coupling coordination degree measurement and spatiotemporal heterogeneity between economic development and ecological environment—Empirical evidence from tropical and subtropical regions of China. J. Clean. Prod. 2020, 244, 118739. [Google Scholar] [CrossRef]
  119. Ma, L.; Zhang, H.; Meng, X.; Lu, Q. Spatiotemporal heterogeneity of the ecological civilization in the Yangtze River economic belt. Ecol. Indic. 2025, 177, 113808. [Google Scholar] [CrossRef]
Figure 1. The spatial distribution of county towns in China and the seven geographic regions.
Land 14 02202 g001
Figure 2. SCTR assessment framework from the perspective of coupled human–environment system.
Land 14 02202 g002
Figure 3. The flowchart of the research process.
Land 14 02202 g003
Figure 4. The number and severity of shrinking towns in China. (a) The number of county towns by different shrinkage types; (b) The proportion of county towns of different shrinkage types.
Land 14 02202 g004
Figure 5. Spatial distribution of shrinking towns in China, from 2013 to 2022.
Land 14 02202 g005
Figure 6. Number and degree of shrinking towns in different regions, from 2013 to 2022.
Land 14 02202 g006
Figure 7. The temporal evolution trend of SCTR from 2013 to 2022.
Land 14 02202 g007
Figure 8. Spatial distribution of SCTR values in China.
Land 14 02202 g008
Figure 9. SCTR and resilience of each subsystem in seven regions.
Land 14 02202 g009
Figure 10. Average annual growth rate of SCTR. (a) Spatial distribution of the average annual growth rate of SCTR. (b) Average annual growth rate of SCTR by shrinkage type.
Land 14 02202 g010
Figure 11. The CCD of SCTR subsystems. (a) Temporal changes in the CCD of SCTR subsystems in China. (b) Average annual growth rate of CCD in SCTR Subsystems by shrinkage type. (c) The CCD of SCTR subsystems across different regions (2013–2022). (d) Regional comparison of CCD in SCTR subsystems.
Land 14 02202 g011
Figure 12. Importance of influencing factors on SCTR from 2013 to 2022.
Land 14 02202 g012
Figure 13. PDPs of SCTR influencing factors.
Land 14 02202 g013
Figure 14. Importance of influencing factors on SCTR across different shrinkage types from 2013 to 2022.
Land 14 02202 g014
Figure 15. The spatial heterogeneity of key influencing factors on SCTR.
Land 14 02202 g015
Table 1. Data source.
DataFormatSource
Land use dataRaster (30 m)Geographic Data Sharing
Infrastructure, Global Resources Data
Cloud (http://www.gis5g.com/, accessed on 11 January 2025)
Digital elevation model
(DEM)
Raster (1 km)Geospatial Data Cloud (https://www.gscloud.cn/, accessed on 2 January 2025)
Pm2.5 ConcentrationRaster (1 km)National Aeronautics and Space Administration (NASA)
Extreme precipitationRaster (1 km)National oceanic and atmosphere administration (NOAA) (https://www.ncei.noaa.gov/data/global-summary-of-the-day/archive/, accessed on 7 March 2025)
Normalized difference
vegetation index (NDVI)
Raster
(1 km)
National Aeronautics and Space Administration (NASA) (https://www.earthdata.nasa.gov/, accessed on 21 January 2025)
Table 2. Classification of shrinking county towns.
The County Towns Shrinkage Rate0~−5%−5~−10%−10~−30%<−30%
TypeSlight
shrinkage
Moderate
shrinkage
Severe
shrinkage
Extreme
shrinkage
Table 3. Evaluation indicator system for SCTR.
Subsystem LayerIndicator LayerUnitWeightAttributeVIF
HSA(X1) County towns shrinking rate 1%0.05556+1.035
(X2) Proportion of vulnerable groups 2%0.023112.012
(X3) Number of students enrolled in ordinary primary schoolperson0.05310+3.184
(X4) Population densityperson/km20.014721.014
(X5) Financial general budget revenueyuan0.09710+3.168
(X6) Per capita carbon dioxide emissionston/person0.040401.150
(X7) GDP per capitayuan0.05263+2.596
(X8) Gini coefficient-0.06694+2.441
(X9) Urbanization rate%0.07167+1.766
(X10) Annual number of business registrations-0.07456+1.339
(X11) GDPyuan0.07680+5.786
FCC(X12) Food production per capitaton/person0.01770+1.506
(X13) Proportion of urban built-up land%0.008554.067
(X14) Number of hospital beds per 1000 peoplebed0.012171.300
(X15) Green-covered area as percentage of built-up area%0.01382+1.715
(X16) Road network densitykm/km20.073412.033
(X17) Per capita green space in parkskm/km20.02050+1.331
(X18) Drainage pipeline density in built-up areaskm/km20.03302+1.148
(X19) Number of beds in social welfare institutionsbed0.00849+1.846
NRS(X20) Forest coverage%0.04125+4.541
(X21) Water coverage%0.03961+1.222
(X22) NDVI-0.01501+4.127
(X23) Extreme precipitation 3day0.045423.005
(X24) Topographic relief 4°0.020422.892
(X25) Air quality index-0.01749+2.281
(X26) Mean annual concentration of PM2.5µg/m30.006542.176
“+” or “−” indicates whether the indicator has a positive or negative influence on the construction of SCTR. 1 The definition and calculation method of urban shrinkage rate are provided in Section 3.3.1. 2 The proportion of the population in county towns aged under 15 and over 60 in relation to the total population. 3 The number of days in a year when daily precipitation exceeds the 95th percentile of the annual daily precipitation. 4 The elevation difference between the lowest and highest points.
Table 4. Different types of coupling degree.
Coupling DegreeType
C [0, 0.2]Poor coupling
C (0.2, 0.4]Weak coupling
C (0.4, 0.6]Basic coupling
C (0.6, 0.8]Good coupling
C (0.8, 1.0]High coupling
Table 5. Optimized parameters and performance of the GWRF model.
NtreemtryRMSEMAER2
50080.05430.03890.8122
Disclaimer/Publisher’s Note: The statements, opinions and data contained in all publications are solely those of the individual author(s) and contributor(s) and not of MDPI and/or the editor(s). MDPI and/or the editor(s) disclaim responsibility for any injury to people or property resulting from any ideas, methods, instructions or products referred to in the content.