Abstract
The river source region of the Yellow River Basin is a critical ecological barrier in China, yet it is characterized by extreme environmental vulnerability. Human activities, particularly intensive mining, can severely disrupt the landscape ecosystem and alter its spatial patterns. The aim of this study is to conduct a comprehensive landscape ecological risk assessment, analyzing the spatial differentiation and driving factors of these risks to ensure regional ecological security. Employing high-resolution remote sensing technology, a comprehensive assessment of landscape ecological risk in the river source region of the Yellow River Basin was conducted based on the 2020 mining development status. The landscape ecological risk index (ERIk) was applied to evaluate risk distribution patterns, while the Geodetector model implemented in R was utilized to identify and analyze key driving factors. The results were as follows: (1) The study area exhibited an elevated landscape ecological risk. (2) Anthropogenic disturbances, such as urban construction, residential activities, and mining, combined with a widespread cropland distribution, degraded alpine grasslands, and high landscape fragility, were identified as major contributors to the elevated landscape ecological risk in the study area. (3) Habitat quality and population density remain the most significant factors driving the spatial differentiation of landscape ecological risk, and their interaction strongly governs the spatial distribution of such risk. In contrast, mining development intensity is not a dominant factor influencing the spatial heterogeneity of landscape ecological risk at the regional scale in the study area. This assessment reveals the extent of ecological risk associated with mining and other human activities and its key drivers.
1. Introduction
The river source region of the Yellow River Basin is located in the hinterland of the Tibetan Plateau, known as the “Third Pole” of the world. It features extensive, intact, and pristine plateau landscapes, serving as a critical conservation area for these ecosystems and their distinctive ecological scenery [1]. This region encompasses diverse landscape types, including alpine grasslands, alpine meadows, wetlands, lakes, and rivers, which provide not only significant esthetic value but also vital ecosystem services [2]. As the key water conservation zone in the Yellow River Basin and an important biodiversity hotspot on the plateau. This region, recognized as the “Water Tower of China,” serves as a critical ecological security barrier for the nation. Its ecological health is vital for the sustainable development of the entire Yellow River Basin and holds significant strategic importance for ecological security both in China and globally.
The river source region of the Yellow River Basin is located in the transitional zone between the Qinghai–Tibet and Loess Plateaus, characterized by complex geological conditions and abundant mineral resources. Extensive mining activities, including land excavation and occupation for resource extraction, have caused devastating destruction to overlying ecosystems [3]. These anthropogenic disturbances have significantly altered land use patterns, leading to the degradation of the regional landscape structure and consequent adverse impacts on ecological environments [4]. This area represents one of the most acute and typical regions where ecological conservation conflicts with mining development. Selected for its extreme fragility and ecological sensitivity, this study area serves as a critical case for landscape ecological risk assessment and research on key influencing factors. The findings offer valuable insights for the dynamic assessment of ecosystem services and risk management in other ecological barrier zones and vulnerable regions worldwide.
In recent years, research into landscape ecological risks, as an interdisciplinary field connecting landscape ecology and risk science, has garnered widespread attention in academia worldwide. This field primarily focuses on the potential adverse effects of landscape pattern changes, caused by both natural and anthropogenic factors, on ecosystem structure and function. With the intensification of human activities, landscape ecological risk assessment and management have become a research hotspot for regional sustainable development. Differences in landscape structure influence regional eco-hydrological processes, soil moisture, nutrient cycling, and species movement [5] to varying degrees [6]. Disruption to landscape patterns can trigger environmental issues such as soil erosion, land degradation, and biodiversity loss [7], consequently impairing ecosystem service capacity [8,9]. This underlies the concept of landscape ecological risk, which is the likelihood of adverse changes in landscape patterns and functions caused by the combined effects of anthropogenic and natural factors [10]. The higher the degree of landscape ecological risk, the greater the extent of habitat degradation and the more severe the adverse impacts on habitat quality and ecosystem service functions [11]. To ensure the long-term ecological security and sustainable stability of the Yellow River, it is imperative to conduct a comprehensive landscape ecological risk assessment in its river source region to identify key influencing factors and strengthen ecological risk management strategies in this critical area.
Existing studies on landscape ecological risk primarily concentrate on risk responses driven by land use/land cover (LULC) changes [12,13,14]. The predominant research areas include urban areas [15,16], urban agglomerations [17], or watersheds [18,19]. For instance, urban landscape ecological risks due to increased habitat fragmentation from urban expansion have been assessed [20], as have landscape ecological risks caused by human activities disrupting river ecological corridors in watersheds [21]. In contrast, relatively limited attention has been paid to critical strategic ecological regions. Assessments of landscape ecological risks has shifted from single risk sources to comprehensive evaluations under the coupled effects of multiple risk sources [22,23]. Key methodologies include (1) circuit theory-based approaches, employing minimum cumulative resistance (MCR) models and ecological resistance surfaces to identify landscape ecological risks and optimize spatial configurations [24,25]; (2) ecosystem service-specific quantification, where risk severity is evaluated based on the vulnerability of critical ecosystem services [7]; and (3) landscape metric analysis, integrating Fragstats-derived pattern indices (e.g., fragmentation, connectivity) with risk-source weighting schemes to assess spatial risk heterogeneity [26]. The drivers of landscape ecological risks are predominantly human activities or the interactive effects of human and natural factors [27]. Human-induced risks primarily include landscape ecological changes driven by urban expansion, infrastructure development [28,29], and cropland encroachment [30]. Combined human–nature interactions also contribute significantly to landscape ecological risks, such as in vegetation degradation in arid regions [31]. However, research on landscape ecological risk dynamics under mining activities remains limited. Therefore, this study targets mining activities in the river source region of the Yellow River Basin, conducting a diagnostic assessment of landscape ecological risks under mining disturbances, pinpoint the key contributing factors, with the aim of providing a scientific basis for ecological risk management in this vital area.
2. Materials and Methods
2.1. Study Areas
The Yellow River originates in the northern foothills of the Bayan Har Mountains within Qumalai County, Yushu Tibetan Autonomous Prefecture, Qinghai Province, which is the core source area of the Yellow River Basin. Within Qinghai Province, the mainstem of the Yellow River spans 1694 km, accounting for 31% of its total length. This study focuses on the watershed area of the Yellow River’s mainstem and tributaries within the administrative boundaries of Qinghai Province, encompassing 8 prefecture-level cities (or autonomous prefectures) and 35 counties (or districts). The study area covers a total watershed area of 153,100 km2, representing 20.34% of Qinghai Province’s total administrative area (Figure 1a). The study area features diverse landscape types, including widely distributed glacial snow-capped mountains, alpine grasslands, alpine meadows, alpine grassland wetlands, alpine meadow wetlands, alpine marshes, lakes, and rivers, as well as deserts. This rich variety of landscapes provides significant value for ecological appreciation, water conservation, and biodiversity protection. Alpine grassland is the most widely distributed and largest land use type in the study area, and it is also the most important water conservation and biodiversity conservation ecosystem in the river source region of the Yellow River. Farmland, settlements, and other construction land are distributed in the Loess Plateau landform area and Hehuang Valley area in the northeast of the study area (Figure 1b). The altitude of the study area is 1658~6253 m, with an average of 3800 m, and the terrain is high in the west and south and low in the east and north. The southwest belongs to the Qingnan Plateau region, the northwest belongs to the Qilian Mountains, and the northeast region belongs to the Loess Plateau region. From north to south, the area features the Qilian, Animaqing and Bayankala Mountains. Most of the land is hilly and mountainous, and there are a few river valley terraces (Figure 1c).
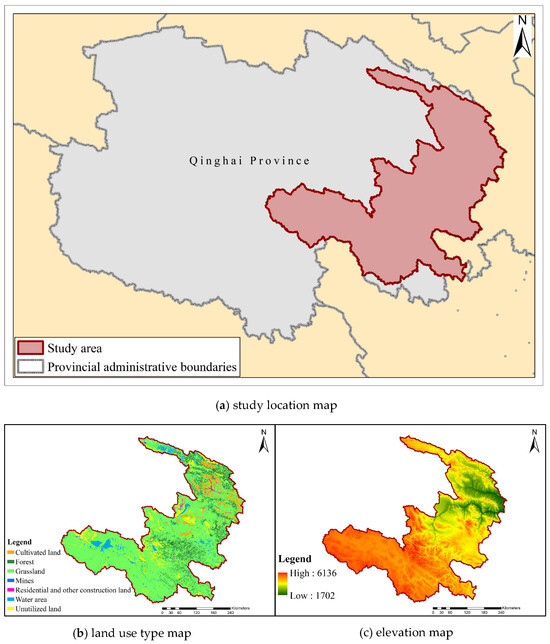
Figure 1.
(a) study location map; (b) land use type map; (c) elevation map.
2.2. Research Framework
This study employs high-resolution remote sensing technology to acquire comprehensive up-to-date information on mining development in the river source region of the Yellow River Basin. Combined with the land use status data for the study area, we establish a coupled landscape ecological risk assessment framework based on the “Disturbance–Vulnerability–Risk” model. The research framework diagram is shown in Figure 2. The aim of the study is to quantify the impacts of both anthropogenic activities and natural factors on landscape patterns and systematically analyze the spatial differentiation characteristics and driving mechanisms of landscape ecological risks induced by mining development in the river source region of the Yellow River Basin.
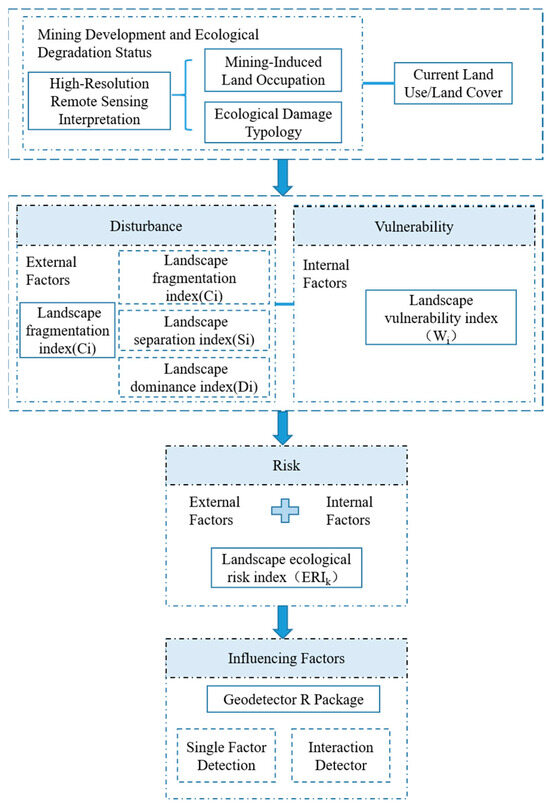
Figure 2.
Research framework diagram.
The degree of landscape ecological risk is determined by both the intensity of external anthropogenic disturbances and the internal vulnerability of the ecosystem [32]. Therefore, the landscape disturbance index (Fi) and the landscape vulnerability index (Wi) were chosen to collectively represent the landscape ecological risk index (ERIk). First, we conducted an assessment of the landscape disturbance caused by human activities such as mining development. The landscape disturbance index (Fi) is composed of the landscape fragmentation index (Ci), the landscape separation index (Si), and the landscape dominance index (Di). Mining development and other anthropogenic disturbances alter regional landscape patterns; activities such as the excavation of mining stopes and the occupation of land by ore piles and solid waste lead to the destructive loss of surface vegetation cover, particularly affecting ecosystems such as grasslands and forests that provide critical ecological services [33]. This results in changes in the shape of the landscape ecosystem, an increase in the number of patches, heightened landscape fragmentation, greater separation of ecological patches, and a change in dominant landscape types in the region [34,35]. Second, the vulnerability of various landscape ecosystems was assessed. The landscape vulnerability index (Wi) reflects the capacity of an ecosystem to resist external disturbances, characterizing both the landscape pattern and the susceptibility of ecosystem types to regional anthropogenic impacts [36]. A higher landscape vulnerability index (Wi) indicates greater susceptibility to human-induced disturbances, leading to alterations in ecosystem properties and an elevated degree of ecological risk. Finally, the landscape ecological risk index (ERIk) is derived by integrating the landscape disturbance index (Fi) and the landscape vulnerability index (Wi). This enables an assessment of the spatial heterogeneity and agglomeration patterns of landscape ecological risks in the study area under the influence of mining development and other human activities. Furthermore, we analyzed the driving factors contributing to the spatial variability in landscape ecological risk.
2.3. Remote Sensing Interpretation Method
2.3.1. Remote Sensing Data Sources
High-resolution remote sensing satellite data, including GF-1, GF-2, and ZY-3 data, were utilized to comprehensively interpret remote sensing data for all elements in mining development areas. The spatial resolution of these satellite data is predominantly 1 m and 2.5 m, with only a few areas with 5 m resolution. Remote sensing imagery for mineral resources in the study area was obtained through processing methods such as orthorectification, image fusion, mosaicking, and clipping. Prior to interpretation, the base monitoring maps were inspected for cloud/snow coverage, radiometric correction, and band matching conditions. The primary dataset consisted of imagery acquired from September to December 2020, supplemented with partial remote sensing data from January to August 2020, ensuring complete coverage of the study area by satellite remote sensing data.
2.3.2. Establishment of Remote Sensing Interpretation Keys
The mine development features in the study area, including mining pits, transfer sites, solid waste deposits, mining structures, and mining-induced subsidence areas, were extracted through visual interpretation methods. Throughout this process, mining rights information was integrated and field verification was performed to obtain additional data regarding mine types, extraction methods, and pre-mining ecosystem characteristics. The visual interpretation accuracy was controlled to within a 3-pixel tolerance range. The diagnostic characteristics used for interpretation are detailed in Table 1.

Table 1.
Remote sensing interpretation signature characteristics.
2.3.3. Remote Sensing Interpretation Techniques and Methods
The land use data used in this study was obtained from the CLCD dataset, a 30 m resolution land cover dataset developed by Wuhan University. Due to the lack of detailed land use classification for mining areas in existing datasets, it is not feasible to directly assess the associated landscape ecological risks. Therefore, building on a multi-temporal mining development database (2011–2019), in this study, specialized interpretation of current mining information was conducted based on high-resolution satellite imagery of the river source region of the Yellow River Basin from 2020. The workflow for interpreting mining-related environmental data from remote sensing imagery mainly included the following steps: collection of baseline materials, quality inspection of remote sensing images and historical datasets, establishment of interpretation keys, information extraction, and field validation. This study primarily utilized remote sensing technology, building upon a comprehensive dataset that includes current and historical mining rights, previous remote sensing survey results and regional geo-ecological data. The specific methodology involved visual interpretation, supplemented by mining rights information, to identify the locations and areas of various features—including mining stopes, transit sites, solid wastes, mining structures, and mining subsidence—related to open-pit, underground, and combined mining operations. Additional attributes such as mineral types, mining methods, and pre-mining ecosystem types were also extracted.
To ensure the authenticity and accuracy of the mining-related environmental information, ambiguous patches were verified through field surveys. The detailed technical workflow for remote sensing interpretation is illustrated in Figure 3.
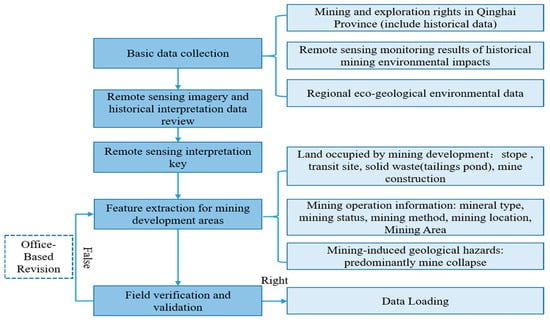
Figure 3.
Remote sensing interpretation technical process and methodology.
The interpreted mining development data and land use data collectively formed the baseline dataset for landscape ecological risk assessment.
2.4. Evaluation Methodology
Variations in landscape patterns across different regions exert different impacts on regional eco-hydrological processes and ecosystem functions, leading to spatial heterogeneity in landscape ecological risks. The degree of risk primarily depends on the magnitude of the external driving forces and the internal resistance capacity of ecosystems. Therefore, we developed a landscape ecological risk assessment model based on the “Disturbance–Vulnerability–Risk” framework. This model consists of a landscape ecological risk index (ERIk), which is the combinations of a landscape disturbance index (Fi) and a landscape vulnerability index (Wi). These are described in detail in the following.
2.4.1. Landscape Disturbance Index (Fi)
The landscape disturbance index (Fi) refers to the stress disturbance degree for different landscape types, including the landscape fragmentation index (Ci), landscape separation index (Si), and landscape dominance index (Di).
- 1.
- Landscape fragmentation index (Ci)
The landscape fragmentation index (Ci) refers to the process of a single continuous landscape patch turning into multiple complex fractured patches under the interference of natural or human factors. The larger the landscape fragmentation index, the lower the regional landscape stability. This index is calculated as follows:
where ni is the number of landscape type i and Ai is the patch area of landscape type i.
- 2.
- Landscape separation index (Si)
The landscape separation index (Si) refers to the degree of separation of fragmented patches in a single landscape type. The larger the landscape separation index (Si), the higher the degree of damage and the greater the degree of separation of landscape patches. This index is calculated as follows:
where ni is the number of landscape type i; A is the total area of landscape type; and Ai is the area of landscape type patches.
- 3.
- Landscape dominance index (Di)
The landscape dominance index (Di) refers to the degree of dominance of a certain landscape type in the landscape structure, reflecting the influence of this landscape type on the construction of and change in landscape patterns. The larger the landscape dominance index (Di), the higher the landscape ecological risk index. The calculation formula are as follows:
where Li is the relative density of landscape types; Pi is the relative coverage of landscape type; and d and e are weights of relative density and relative coverage, respectively, assigned values of 0.4 and 0.6, respectively, according to existing studies [39].
After normalizing the above indexes, according to existing studies [40], the landscape disturbance index was calculated with the weights of the above landscape indices set as 0.5, 0.3, and 0.2, respectively. The calculation formula is as follows:
2.4.2. Landscape Vulnerability Index (Wi)
Landscape vulnerability index (Wi) refers to the vulnerability of ecosystems within different landscape types, and characterizes the ability of landscape ecosystems to resist external disturbances. The higher the landscape vulnerability index (Wi), the greater the degree of ecological risk. Based on previous research [11,41], as well as the actual situation in the study area and its characteristics, the vulnerability assignment for landscape types was set as follows, from high to low: mining land and other construction land (7), unused land (6), cultivated land (5), grassland (4), water body and wetland (3), and forest land (1). The indicators were normalized to obtain the landscape vulnerability index (Wi).
2.4.3. Landscape Ecological Risk Index (ERIk)
The above index is used to construct a landscape ecological risk assessment model from the perspective of landscape patterns; its calculation formula is as follows:
where ERIk is the landscape ecological risk index; Ai is the patch area of landscape type i in the evaluation unit; A is the area of the evaluation unit; and Fi and Wi are the disturbance and vulnerability indexes, respectively, of landscape type i in the evaluation unit k.
The land use data used in this study were derived from the CLCD dataset of Wuhan University (30 m resolution) [42]. The data regarding the land occupied by mining development were derived from the interpretation results of this study.
2.5. Influencing Factor Detection
To further investigate the factors influencing the spatial heterogeneity of landscape ecological risk in the river source region of the Yellow River Basin, the Geodetector model in R 4.3.3 was employed to analyze both the single and interactive explanatory power of these factors on the spatial distribution of ecological risk. The specific formulas and discrimination criteria are as follows:
In these formula, n = 1, …, i represents the stratification (strata) of variable Y or factor X, i.e., the classification or zoning; Nn and N denote the number of units in stratum n and the entire region, respectively; σn2 and σ2 represent the variance of Y in stratum n and the entire region, respectively; SSW and SST stand for the within-sum of squares and total sum of squares, respectively. The q-value range is [0, 1], where a higher q-value indicates a stronger explanatory power of the independent variable X on the dependent variable Y and vice versa [43,44].
The Geodetector model can also be employed to examine interaction effects between different factors, determining whether pairwise combinations of factors enhance or weaken the explanatory power on the dependent variable Y, and whether the factors are independent of Y. The evaluation criteria are summarized in Table 2.
Table 2.
The type of interaction between factor combinations on the dependent variable Y.
3. Results
3.1. Characteristics of Damaged Landscape Ecosystems
Remote sensing monitoring revealed that mining development caused a degradation in landscape ecosystems in the study region, covering an area of 14,874.80 hm2. Grassland ecosystems were the most seriously damaged, with a damaged area of 8374.95 hm2, accounting for 56.30% of the total damaged area. Alpine grassland is a dominant ecosystem in the study area, which functions as a water sources conservator and biodiversity protector and provides areas for animal husbandry and ornamentation value.
Among the remaining ecosystems, the affected areas were ranked as follows in descending order: settlement ecosystems (2575.45 hm2, 17.31% of total degraded area), farmland ecosystems (1820.53 hm2, 12.24%), forest ecosystems (841.84 hm2, 5.66%), aquatic and wetland ecosystems (714.48 hm2, 4.80%), other ecosystems (513.14 hm2, 3.45%), and desert ecosystems (34.43 hm2, 0.23%). The spatial distribution of the affected areas across ecosystems is illustrated in Figure 4, with the proportional impacts of mining development categories presented in detail in Table 3. Notably, alpine grasslands, forests, and aquatic and wetland ecosystems, which provide critical ecological services including water conservation and biodiversity preservation, accounted for 66.77% of the total impacted area. Mining development has triggered large-scale degradation of ecosystems that provide critical ecological functions.
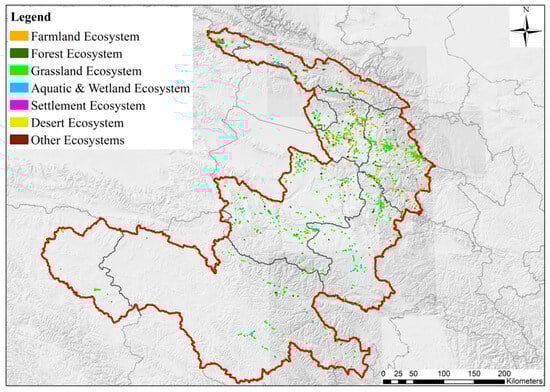
Figure 4.
Mining-induced ecological damage distribution map.
Table 3.
Distribution of mining-induced ecological damage.
3.2. Spatial Distribution Characteristics of Landscape Ecological Risks
The Kriging interpolation method and the natural fracture method were used to classify the degree of landscape ecological risk in the study area into five levels: high, higher rea, general, lower, and low (shown in Figure 5).
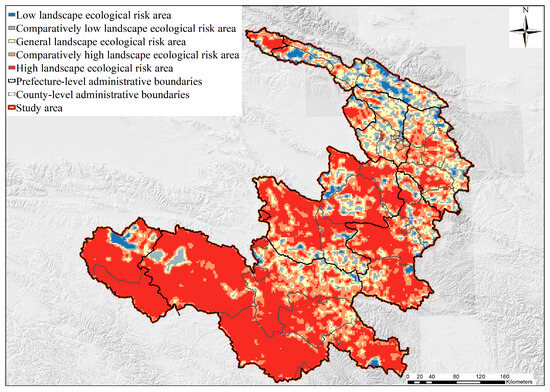
Figure 5.
Spatial distribution map of landscape ecological risk in the study area.
It can be seen that the high-landscape-ecological-risk area in the study area is the greatest, accounting for 49.03%. These areas are mainly distributed in Maqin County (Guoluo Tibetan Autonomous Prefecture) and Tongren City (Huangnan Tibetan Autonomous Prefecture). The second greatest area is that with higher landscape ecological risk, accounting for 24.52%, and is mainly distributed in Maqin County of Guoluo Tibetan Autonomous Prefecture, Huangyuan County of Xining City, Henan Mongolian Autonomous County of Huangnan Tibetan Autonomous Prefecture and Xinghai County of Hainan Tibetan Autonomous Prefecture.
The areas of general, lower, and low landscape ecological risk accounted for 15.41%, 8.63%, and 2.42%, respectively, of the total area. The low-landscape-ecological-risk areas are mainly concentrated in Menyuan Hui Autonomous County, Gangcha County of Haibei Tibetan Autonomous Prefecture, and Qumalai County of Yushu Tibetan Autonomous Prefecture. In general, the degree of landscape ecological risk in the study area is relatively high, and ecological protection and restoration of damaged ecosystems are urgent.
3.3. Distribution of Landscape Ecological Risk Hotspots
Landscape patterns reflect the size, shape, and spatial configuration of regional ecosystems, serving as critical determinants of ecological processes and ecosystem service provision. The analysis of landscape ecological risk hotspots in the study area (Figure 6) revealed high-risk zones predominantly concentrated in Chengdong District, Chengzhong District, Chengxi District, Huangzhong District and Huangyuan County of Xining City, Huzhu Tu Autonomous County, Ledu County, Ping’an District, Hualong Hui Autonomous County, Minhe Hui Tu Autonomous County of Haidong City, Guinan County and Xinghai County of Hainan Tibetan Autonomous Prefecture, Maqin County and Jiuzhi County of Guoluo Tibetan Autonomous Prefecture.
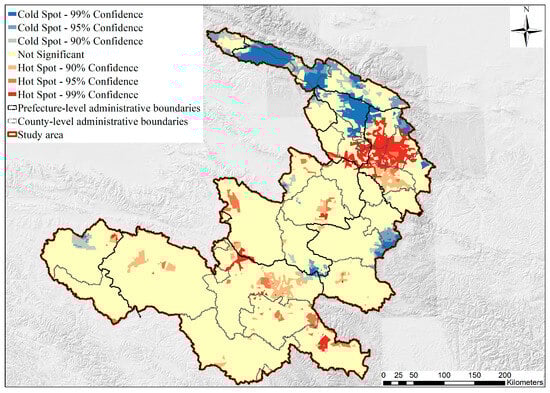
Figure 6.
Map of the distribution of landscape ecological risk hotspots in the study area.
Among these hotspots, landscape ecological risk hotspots are distributed in Xining City and Haidong City mainly because these are the main areas of human activity in the study area. They are also the main concentrated distribution areas of alpine grassland, which is the most dominant landscape type in the study area; change in these areas has a crucial impact on the regional landscape pattern. Areas of anthropogenic activity, such as urban construction land, residential areas and non-metallic mines for building materials, are widely distributed, resulting in high regional landscape vulnerability, damage to and degradation of alpine grassland, and reduced vegetation coverage, which aggravates ecological and environmental problems such as land desertification. It also increases the degree of landscape fragmentation and separation and aggravates the landscape ecological risk level. The area is located in the Hehuang Valley, which is an important agricultural area in Qinghai Province with a large distribution of cultivated land and high landscape vulnerability; this is also an important reason for the increase in landscape ecological risk.
The clusters of high landscape ecological risk in Guinan County, Hainan Tibetan Autonomous Prefecture, are primarily attributed to the extensive amount of cropland and unused land. The large areas of empty land exhibit poor vegetation growth conditions and low habitat quality. Coupled with anthropogenic disturbances from agricultural cultivation, this leads to the spatial aggregation of high ecological risk levels in this region.
The high ecological risk hotspots in Xinghai County, Hainan Tibetan Autonomous Prefecture, Maqin County and Jiuzhi County in Guoluo Tibetan Autonomous Prefecture occur mainly as a result of the degradation of alpine grasslands, resulting in scattered land exposure between concentrated and contiguous alpine grasslands, coupled with mining development activities. This further aggravates the fragmentation and separation of the landscape in the region, which in turn intensifies landscape disturbance and elevates ecological risk. Meanwhile, the region is situated within the main area of the three-river source region, characterized by dense river networks, extensive lakes and marshes, and numerous snow-capped mountains and glaciers. This high landscape fragility further exacerbates the landscape ecological risk level.
3.4. Factors Influencing the Spatial Heterogeneity of Landscape Ecological Risk
The Geodetector model in R 4.3.3 was employed to detect both individual influencing factors and factor interactions. The analysis shows that landscape ecological risk is determined by two aspects: external driving forces and internal resistance. Considering the natural ecological baseline conditions and potential influencing factors in the region, an evaluation system of influencing factors was constructed from these two aspects: external driving forces and internal resistance.
External driving forces refer to anthropogenic disturbance factors that induce landscape ecological risk, including mining development, urban expansion, and infrastructure construction. Four evaluation indicators were selected to represent external disturbances: mining development intensity (X1), urban expansion intensity (X2), population density (X3), and road density (X4). Internal vulnerability denotes the ability of the landscape system to resist external disturbances. Areas with low vulnerability in natural ecological baseline conditions exhibit high resilience, demonstrating greater tolerance to external anthropogenic disturbances and/or stronger inherent ecosystem recovery capacity. Consequently, these regions are less susceptible to adverse impacts from human activities and experience lower levels of ecological risk. Four indicators were chosen to characterize ecosystem resilience and resistance levels: habitat quality (X5), vegetation coverage (X6), soil erosion degree (X7), and river network density (X8). The specific evaluation indicators and their data sources are presented in Table 4.
Table 4.
Index system for evaluating influencing factors.
Using sampling points within a 2 km grid across the study area, the eight aforementioned evaluation indicators were resampled. The Geodetector model in R 4.3.3 was applied to identify the key influencing factors in these high-risk areas, treating areas with high landscape ecological risk induced by mining development as the dependent variable. The results are presented in the following.
3.4.1. Results of Single-Factor Detection
According to the results of the single-factor detection analysis of landscape ecological risk, presented in Table 5, internal vulnerability—that is, the ability of the landscape ecosystem to withstand external anthropogenic disturbances—generally exhibits a more significant explanatory power regarding the spatial heterogeneity of landscape ecological risk in the study region compared to external anthropogenic disturbance factors.
Table 5.
Results of single-factor detection analysis on landscape ecological risk in the study area.
Among the eight influencing factors evaluated, “habitat quality (X5)” and “population density (X3)” were identified as the most significant factors affecting the spatial heterogeneity of landscape ecological risk in the study area; “vegetation coverage (X6)” and “river network density (X8)” also played important roles.
Generally, a higher habitat quality and vegetation coverage indicate lower anthropogenic disturbance and better regional landscape ecological conditions. Population density is a key indicator of the intensity of human activities: A higher population density suggests more developed socioeconomic conditions and stronger human activity, which leads to greater disturbance to natural landscape ecosystems and increased ecological risk. Conversely, a lower population density implies weaker anthropogenic pressure and lower landscape ecological risk. The river network density reflects the sensitivity and vulnerability of the regional natural ecosystem; areas with a high river network density tend to have ecosystems that are more sensitive and fragile with less capacity to resist external disturbances. As a result, these areas are more susceptible to damage from human activities, particularly intensive disturbances such as mining, leading to a higher landscape ecological risk. The river source region of the Yellow River Basin features a well-developed water network and ecologically fragile environments. This ecological profile makes the region particularly sensitive to anthropogenic pressures and more prone to high ecological risk.
The results also show that “mining development intensity (X1)” had relatively weak explanatory power over the spatial heterogeneity of landscape ecological risk. This can be attributed to the fact that landscape ecological risk is primarily influenced by macro-scale factors such as climate, topography, and land use patterns. As a non-basin-wide indicator, “mining development intensity (X1)” may have its influence diluted at the spatial scale of the river source region of the Yellow River Basin when compared to basin-wide indicators such as “habitat quality (X5)” and “vegetation coverage (X6)”. Consequently, the explanatory power of “mining development intensity (X1)” is relatively limited at this regional scale.
3.4.2. Results of Interactive Factor Detection
The Geodetector model in R 4.3.3 was employed to identify the explanatory power of interaction effects among factors on the spatial heterogeneity of mining-induced landscape ecological risk. The interaction analysis results were visualized using Origin 2024 software and are shown in Figure 7.
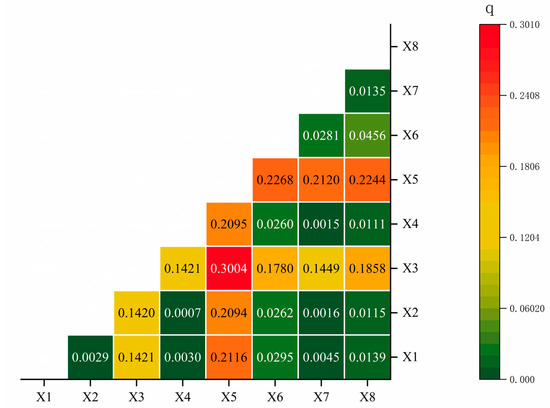
Figure 7.
Heatmap of interaction detection results.
As illustrated in Figure 7, the q-values obtained from the pairwise interactions of the eight influencing factors all demonstrated a consistent increase compared to those of individual factors, indicating enhanced explanatory power through factor interactions. These enhanced effects were categorized into two primary types: “bifactor enhancement” and “nonlinear enhancement”. The most significant factor interaction for explaining the spatial heterogeneity of landscape ecological risk in the study area is the combination of “population density (X3)” + “habitat quality (X5)”, followed by the combinations of “habitat quality (X5)” + “vegetation coverage (X6)” and “habitat quality (X5)” + “river network density (X8)”. This indicates that habitat quality plays an especially prominent role in influencing the spatial distribution of landscape ecological risk. When combined with other factors—such as population density, vegetation coverage, river network density, and mining development intensity—it significantly enhances the explanatory power regarding spatial heterogeneity.
The two factors that formed the combination with the strongest explanatory power—”population density (X3)” + “habitat quality (X5)”—were also the most influential individual drivers of spatial heterogeneity in landscape ecological risk in the region. This suggests that the external factors of socioeconomic development and human disturbance (reflected in the population density), when combined with the internal factor of habitat quality, exert strong control over the spatial differentiation of landscape ecological risk. Their interactive q-value reached 0.3004, a notable enhancement compared to their individual effects.
The second strongest interaction was “habitat quality (X5)” + “vegetation coverage (X6)”, both of which are key indicators of internal ecosystem vulnerability. Their combination also significantly improved the explanatory power compared to that of either factor alone.
The third most influential pair was “habitat quality (X5)” + “river network density (X8)”, implying that habitat quality coupled with ecosystem vulnerability (represented by river network density) is an important factor affecting the spatial distribution of ecological risk.
It is worth noting that the interaction between “mining development intensity (X1)” + “habitat quality (X5)” ranked fourth, with a q-value of 0.2116—only slightly higher than the individual explanatory power of habitat quality (q = 0.2092) and much higher than that of mining intensity alone (q = 0.0027). This interaction showed a weak bi-factor enhancement effect, confirming that mining development intensity has limited explanatory power regarding spatial heterogeneity and is not a dominant factor influencing landscape ecological risk in this region.
The underlying reason for this is that landscape ecological risk is primarily determined by baseline ecological conditions—such as habitat quality and vegetation coverage—which form the foundation of risk evaluation. Mining development intensity acts more as a trigger of ecological risk rather than a region-wide dominant influencing factor. Thus, its impact is spatially heterogeneous: in areas with poor habitat quality, mining exacerbates ecological risk, whereas in regions with sound habitat conditions, mining activities—especially small- to medium-scale operations—cause relatively minor damage. Consequently, the influence of “mining development intensity (X1)” is highly dependent on the spatial distribution of “habitat quality (X5)”, resulting in a weak independent explanatory power but a slight enhancement when combined with habitat quality.
4. Discussion
This study assesses the landscape ecological risk induced by anthropogenic disturbances, such as mining development, in the ecologically critical river source region of the Yellow River Basin and further analyzes the key factors influencing these risks. The results demonstrate elevated ecological risk levels in the source region of the Yellow River, with high-risk value clusters predominantly distributed in zones with intensive human activity like the Huangshui Valley. This finding is consistent with Wang Jie et al.’s [45] conclusion about the high ecological risk in the Huangshui Valley.
The pattern affects the process, and the process changes the pattern: The ecological pattern of the landscape, such as the shape of the patches, can regulate ecohydrological and biological processes, and the number of patches can be used to determine the degree of landscape fragmentation. Conversely, ecological processes, both natural and anthropogenic, may also alter the landscape pattern. For example, species migration and distribution, runoff and erosion, as well as some climate extremes such as fires or floods, can cause changes in the ecological landscape pattern. In this study, a landscape disturbance index (Fi)—comprising the landscape fragmentation (Ci), separation (Si), and dominance (Di) indexed—was integrated with a landscape vulnerability index (Wi) based on land use types to derive a comprehensive landscape ecological risk index (ERIk). While this approach yielded valuable insights into the ecological risks induced by mining development in the river source region of the Yellow River Basin, several limitations remain, as detailed below.
(1) In this study, the landscape disturbance index (Fi) was constructed based on the degree of landscape fragmentation index (Ci), landscape separation index (Si) and landscape dominance index (Di) under the influence of human activities. However, the current model has limitations in accounting for extreme natural disturbances (e.g., wildfires, insect infestations) and indirect impacts of climate change. To address these gaps, future model iterations will integrate additional parameters, including extreme weather event metrics and climate vulnerability indicators, particularly to enhance the risk assessment accuracy in climate-sensitive ecoregions like alpine-permafrost zones.
(2) In this study, landscape ecological risk assessments were primarily conducted based on the 2020 land use status under mining activities in the study area. However, the single-temporal dataset may insufficiently capture cumulative effects, time-lag responses, and threshold mutations of ecosystems. In future research, multi-temporal remote sensing imagery should be incorporated into time-series environmental monitoring data following mining development to establish a dynamic monitoring system for landscape ecological risk evolution under mining disturbances.
(3) Based on the results, in the study area, mining development intensity does not exhibit significant explanatory power regarding the spatial heterogeneity of landscape ecological risk. Its influence on ecological risk spatial patterns is highly dependent on baseline ecosystem conditions, such as habitat quality. Therefore, implementing mining regulation policies in isolation is unlikely to be effective. Instead, differentiated zoning-based management strategies that consider habitat quality and natural ecological conditions should be adopted for mining development control.
5. Conclusions
A comprehensive assessment of the landscape ecological risks induced by mining development in the river source region of the Yellow River Basin was conducted using high-resolution remote sensing techniques. The results are as follows:
(1) Mining development in the study area has caused ecosystem degradation over an area of about 14,874 hm2. Alpine grassland ecosystems suffered the most severe damage, with about 8374 hm2 affected, accounting for 56.30% of the total degraded area.
(2) The study area exhibited a relatively high level of landscape ecological risk, with the high-risk zone being the most extensive, accounting for 49.03% of the total area, calling for the immediate implementation of spatial ecological conservation and restoration measures.
(3) Landscape ecological risk hotspots are predominantly concentrated in Xining City and Haidong City, with some clusters identified in Guinan and Xinghai Counties (Hainan Tibetan Autonomous Prefecture), as well as Maqin and Jiuzhi Counties (Golog Tibetan Autonomous Prefecture).
(4) The high-landscape-ecological-risk clusters in Xining and Haidong Cities are primarily attributed to intensive human activities, compounded by significant mining disturbances and extensive cropland distribution. In Guinan County (Hainan Tibetan Autonomous Prefecture), risk hotspots are associated with large areas of cropland and unused land. Meanwhile, the ecological risk hotspots in Xinghai County (Hainan) and Maqin/Jiuzhi Counties (Golog Tibetan Autonomous Prefecture) result from dense river networks, high landscape fragility, grassland degradation, and mining activities, which collectively exacerbate ecological risk levels.
(5) An indicator system integrating both external and internal factors was developed to identify and analyze key drivers of landscape ecological risk using the Geodetector model in R 4.3.3. The results revealed that “habitat quality (X5)” and “population density (X3)” were the most significant individual factors explaining the spatial heterogeneity of landscape ecological risk in this region, followed by “vegetation coverage (X6)” and “river network density (X8)”, which also played important roles. However, the explanatory power of mining development intensity (X1) was not statistically significant in the study area.
(6) The interaction analysis revealed that the combination of “population density (X3)” + “habitat quality (X5)” was the most significant factor interaction for explaining the spatial heterogeneity of landscape ecological risk in the study area, followed by “habitat quality (X5)” + “vegetation coverage (X6)” and “habitat quality (X5)” + “river network density (X8)”. The interaction between “mining development intensity (X1)” and “habitat quality (X5)” ranked fourth in terms of explanatory power, demonstrating only a marginal enhancement compared to the individual effect of habitat quality alone. This further confirms that mining development intensity is not a dominant driver of landscape ecological risk and that its risk effects are closely linked to baseline natural ecosystem conditions such as habitat quality.
(7) This study applied the “Disturbance–Vulnerability–Risk” model to quantitatively assess landscape ecological risk in the research area and employed the Geodetector model in R to detect and analyze key influencing factors. The proposed methodology is readily applicable to human impact assessments in other ecologically fragile regions, requiring only adjustments to relevant evaluation indicators. However, the approach’s effectiveness relies on the acquisition of high-resolution satellite imagery and accurate interpretation of human activities like mining development. Limitations in data accessibility or interpretation expertise may consequently affect the precision of the study.
Author Contributions
Conceptualization, W.X. and W.Y.; methodology, W.X., W.Y. and H.W.; formal analysis, W.X., J.Y. and T.Y.; W.X. and H.Y. contributed to writing, reviewing, and editing the final draft. All authors have read and agreed to the published version of the manuscript.
Funding
This research was funded by the geological survey project of the China Geological Survey, “National Mining Development and Ecological Space Remote Sensing Monitoring for Key Areas” (102202220120000009066).
Data Availability Statement
The original mining development data supporting this study are part of the core achievements of the national geological survey project “National Mining Development and Key Areas Monitoring,” led by the China Geological Survey. Due to the sensitive nature of the data, these raw data are not publicly accessible.
Conflicts of Interest
The authors declare no conflicts of interest.
References
- Pan, Y.; Yin, Y. Spatiotemporal variation of habitat quality in the Source Region of the Yellow River based on land use and vegetation cover changes. Acta Ecol. Sin. 2022, 42, 7978–7988. [Google Scholar] [CrossRef]
- Guo, L.; Xue, D. Analysis of temporal and spatial change and corridor effect in Yellow River Headwaters Region. Territ. Nat. Resour. Study 2009, 121, 51–53. [Google Scholar]
- Bernhardt, E.S.; Lutz, B.D.; King, R.S. How many mountains can we mine? Assessing the regional degradation of Central Appalachian rivers by surface coal mining. Environ. Sci. Technol. 2012, 46, 8115–8122. [Google Scholar] [CrossRef] [PubMed]
- Jing, P.; Zhang, D.; Ai, Z.; Guo, B. Natural landscape ecological risk assessment based on the three-dimensional framework of pattern-process ecological adaptability cycle: A case in Loess Plateau. Acta Ecol. Sin. 2021, 41, 7026–7036. [Google Scholar]
- Sandvik, H.; Saether, B.-E.; Holmern, T.; Tufto, J.; Engen, S.; Roy, H.E. Generic ecological impact assessments of alien species in Norway: A semi-quantitative set of criteria. Biodivers. Conserv. 2013, 22, 37–62. [Google Scholar] [CrossRef]
- Fu, B. The integrated studies of geography: Coupling of patterns and processes. Acta Geogr. Sin. 2014, 69, 1052–1059. [Google Scholar]
- Vander Zanden, M.J.; Hansen, G.J.A.; Latzka, A.W. A Framework for Evaluating Heterogeneity and Landscape-Level Impacts of Non-native Aquatic Species. Ecosystems 2017, 20, 477–491. [Google Scholar] [CrossRef]
- Costanza, R.; de Groot, R.; Braat, L.; Kubiszewski, I.; Fioramonti, L.; Sutton, P.; Farber, S.; Grasso, M. Twenty years of ecosystem services: How far have we come and how far do we still need to go? Ecosyst. Serv. 2017, 28, 1–16. [Google Scholar] [CrossRef]
- Sun, L.; Zhang, Y.; Zhang, T. Valuation of ecosystem services based on land use and land cover in source region of the Yellow River. Geogr. Geo-Inf. Sci. 2014, 30, 99–104. [Google Scholar]
- Wu, Z.H.; Lei, S.G.; He, B.J.; Bian, Z.F.; Wang, Y.H.; Lu, Q.Q.; Peng, S.G.; Duo, L.H. Assessment of Landscape Ecological Health: A Case Study of a Mining City in a Semi-Arid Steppe. Int. J. Environ. Res. Public Health 2019, 16, 752. [Google Scholar] [CrossRef]
- Xie, X.; Chen, Z.; Wang, F.; Bai, M.; Xu, W. Ecological risk assessment of Taihu Lake basin based on landscape pattern. Chin. J. Appl. Ecol. 2017, 28, 3369–3377. [Google Scholar]
- Chang-Qing, Z.; Bin, D.; Liping, L.; Wenjuan, P.; Lingna, C.; Qiang, Z.; Qing, W.; Junling, L.; Cheng, W.; Hui, H.; et al. Study on Ecological Risk Assessment for Land-Use of Wetland Based on Different Scale. J. Indian Soc. Remote Sens. 2016, 44, 821–828. [Google Scholar] [CrossRef]
- Hua, L.; Liao, J.; Chen, H.; Chen, D.; Shao, G. Assessment of ecological risks induced by land use and land cover changes in Xiamen City, China. Int. J. Sustain. Dev. World Ecol. 2018, 25, 439–447. [Google Scholar] [CrossRef]
- Zhang, F.; Yushanjiang, A.; Wang, D. Ecological risk assessment due to land use/cover changes (LUCC) in Jinghe County, Xinjiang, China from 1990 to 2014 based on landscape patterns and spatial statistics. Environ. Earth Sci. 2018, 77, 491. [Google Scholar] [CrossRef]
- Mo, W.; Wang, Y.; Zhang, Y.; Zhuang, D. Impacts of road network expansion on landscape ecological risk in a megacity, China: A case study of Beijing. Sci. Total Environ. 2017, 574, 1000–1011. [Google Scholar] [CrossRef] [PubMed]
- Peng, J.; Zong, M.; Hu, Y.; Liu, Y.; Wu, J. Assessing Landscape Ecological Risk in a Mining City: A Case Study in Liaoyuan City, China. Sustainability 2015, 7, 8312–8334. [Google Scholar] [CrossRef]
- Xu, J.; Kang, J. Comparison of Ecological Risk among Different Urban Patterns Based on System Dynamics Modeling of Urban Development. J. Urban Plan. Dev. 2017, 143, 04016034. [Google Scholar] [CrossRef]
- Li, Y.; Huang, S.L. Landscape Ecological Risk Responses to Land Use Change in the Luanhe River Basin, China. Sustainability 2015, 7, 16631–16652. [Google Scholar] [CrossRef]
- Xie, H.; Wang, P.; Huang, H. Ecological Risk Assessment of Land Use Change in the Poyang Lake Eco-economic Zone, China. Int. J. Environ. Res. Public Health 2013, 10, 328–346. [Google Scholar] [CrossRef]
- Zhou, D.; Shi, P.; Wu, X.; Ma, J.; Yu, J. Effects of Urbanization Expansion on Landscape Pattern and Region Ecological Risk in Chinese Coastal City: A Case Study of Yantai City. Sci. World J. 2014, 2014, 821781. [Google Scholar] [CrossRef]
- Yan, Y.; Shi, S.N.; Hu, B.Q.; Yang, K.S. Ecological Risk Assessment of Guangxi Xijiang River Basin based on Landscape Pattern. Ekoloji 2018, 27, 5–16. [Google Scholar]
- Lustig, A.; Stouffer, D.B.; Doscher, C.; Worner, S.P. Landscape metrics as a framework to measure the effect of landscape structure on the spread of invasive insect species. Landsc. Ecol. 2017, 32, 2311–2325. [Google Scholar] [CrossRef]
- Prist, P.R.; Dandrea, P.S.; Metzger, J.P. Landscape, Climate and Hantavirus Cardiopulmonary Syndrome Outbreaks. Ecohealth 2017, 14, 614–629. [Google Scholar] [CrossRef]
- Zhang, X.; Cui, J.; Liu, Y.; Wang, L. Geo-cognitive computing method for identifying “source-sink” landscape patterns of river basin non-point source pollution. Int. J. Agric. Biol. Eng. 2017, 10, 55–68. [Google Scholar] [CrossRef]
- Gao, X.; Song, Z.; Li, C.; Tang, H. Landscape Pattern Optimization in Baiyangdian Basin Based on Landscape Ecological Risk Assessment. J. Ecol. Rural Environ. 2023, 39, 174–183. [Google Scholar]
- Fan, J.; Wang, Y.; Zhou, Z.; You, N.; Meng, J. Dynamic Ecological Risk Assessment and Management of Land Use in the Middle Reaches of the Heihe River Based on Landscape Patterns and Spatial Statistics. Sustainability 2016, 8, 536. [Google Scholar] [CrossRef]
- Li, L.; Kong, D.Z.; Liu, Q.; Xiong, Y.; Chen, F.; Zhang, H.; Chu, Y. Comprehensive Identification of Surface Subsidence Evaluation Grades of Mines in Southwest China. Mathematics 2022, 10, 2664. [Google Scholar] [CrossRef]
- Kondolf, G.M.; Podolak, K. Space and Time Scales in Human-Landscape Systems. Environ. Manag. 2014, 53, 76–87. [Google Scholar] [CrossRef]
- Yang, X.; Wang, L.; Wu, T.; Qiu, Q. Ecological risk assessment based on road network development analysis of Xiamen city, China. Int. J. Sustain. Dev. World Ecol. 2018, 25, 458–467. [Google Scholar] [CrossRef]
- Hartel, T.; Fischer, J.; Cympeanu, C.; Milcu, A.I.; Hanspach, J.; Fazey, I. The importance of ecosystem services for rural inhabitants in a changing cultural landscape in Romania. Ecol. Soc. 2014, 19, 42. [Google Scholar] [CrossRef]
- Molinos, J.G.; Takao, S.; Kumagai, N.H.; Poloczanska, E.S.; Burrows, M.T.; Fujii, M.; Yamano, H. Improving the interpretability of climate landscape metrics: An ecological risk analysis of Japan’s Marine Protected Areas. Glob. Change Biol. 2017, 23, 4440–4452. [Google Scholar] [CrossRef]
- Fahrig, L. Ecological Responses to Habitat Fragmentation Per Se. In Annual Review of Ecology, Evolution, and Systematics; Futuyma, D., Ed.; Annual Reviews: San Mateo, CA, USA, 2017; Volume 48, pp. 1–23. [Google Scholar]
- Xu, W.; Yao, W.; Bai, Z.; Yang, J.; Li, L. Ecological Risk Evaluation and Ecological Restoration Model of Mining in the Source Area of the Yellow River Basin. Land 2023, 12, 933. [Google Scholar] [CrossRef]
- Xu, W.; Bai, Z. Identification and diagnosis of ecosystem damaged by mining development in the source area of the Yellow River. China Land Sci. 2022, 36, 118–126. [Google Scholar]
- Yao, W.; Yu, J.; Lu, Y. Investigation and Assessment of Artificial Influencing Factors of Land Degradation in Shendong Coal Mining Area Based on ZY-3 Satellite Data. J. Ecol. Rural Environ. 2016, 32, 355–360. [Google Scholar]
- Guo, B.; Zhou, Y.; Zhu, J.; Liu, W.; Wang, F.; Wang, L.; Yan, F.; Wang, F.; Yang, G.; Luo, W.; et al. Spatial patterns of ecosystem vulnerability changes during 2001–2011 in the three-river source region of the Qinghai-Tibetan Plateau, China. J. Arid Land 2016, 8, 23–35. [Google Scholar] [CrossRef]
- Yang, J.; Qin, X.; Zhang, Z.; Wang, X. Theory, Methods and Applications of Mine Remote Sensing Monitoring; Surveying and Mapping Press: Beijing, China, 2011; pp. 101–115. [Google Scholar]
- Yang, J.; Yao, W.; Xu, W. The Heavenly Eye Watching over Mines: A Remote Sensing Perspective; Geological Publishing House: Beijing, China, 2019; pp. 82–89. [Google Scholar]
- He, Z.; Shang, X.; Zhang, T.; Yun, J. Spatio-temporal changes of landscape ecological risk and its cold-hot spot pattern in the loess hills of northern Shaanxi over the past 20 years. Chin. J. Ecol. 2023, 42, 2514–2525. [Google Scholar]
- Gong, J.; Zhao, C.; Xie, Y.; Gao, Y. Ecological risk assessment and its management of Bailongjiang watershed, southern Gansu based on landscape pattern. Chin. J. Appl. Ecol. 2014, 25, 2041–2048. [Google Scholar]
- Gao, B.; Li, C.; Wu, Y.; Zheng, K.; Wu, Y. Landscape ecological risk assessment and influencing factors in ecological conservation area in Sichuan-Yunnan provinces, China. Chin. J. Appl. Ecol. 2021, 32, 1603–1613. [Google Scholar]
- Yang, J.; Huang, X. The 30 m annual land cover datasets and its dynamics in China from 1985 to 2024. Earth Syst. Sci. Data 2021, 13, 3907–3925. [Google Scholar] [CrossRef]
- Li, Y.; Zhao, X.; Tan, S.; Wu, H. Spatial and Temporal Evolution of vegetation cover and Driving Forces in the Urban Agglom-eration of South Sichuan Province. Res. Soil Water Conserv. 2024, 31, 399–409. [Google Scholar]
- Wang, P.; Wang, Y.; Liu, X.; Chen, X.; Kong, F. Ecological risk of ecological immigrants on land use change in arid areas—Hongsibu district of Ningxia as an example. Agric. Res. Arid Areas 2019, 37, 58–65. [Google Scholar]
- Wang, J.; Bai, W.; Tian, G. Spatiotemporal characteristics of landscape ecological risks on the Tibetan Plateau. Resour. Sci. 2020, 42, 1739–1749. [Google Scholar] [CrossRef]
Disclaimer/Publisher’s Note: The statements, opinions and data contained in all publications are solely those of the individual author(s) and contributor(s) and not of MDPI and/or the editor(s). MDPI and/or the editor(s) disclaim responsibility for any injury to people or property resulting from any ideas, methods, instructions or products referred to in the content. |
© 2025 by the authors. Licensee MDPI, Basel, Switzerland. This article is an open access article distributed under the terms and conditions of the Creative Commons Attribution (CC BY) license (https://creativecommons.org/licenses/by/4.0/).