Abstract
Regional agricultural carbon balance studies are crucial for promoting coordinated development and achieving carbon neutrality. This research quantifies agricultural carbon emissions and sinks across 190 counties in the Beijing–Tianjin–Hebei (BTH) region from 2013 to 2022. The methodology involved the carbon emission factor approach and crop productivity models to assess the agricultural carbon balance. Furthermore, this study employed the carbon load model and the carbon output technical elasticity model to analyze the per-unit contribution of agricultural products and the carbon implications of augmented agricultural output. The findings reveal the following: (1) Total agricultural carbon emissions followed a fluctuating, inverted “U”-shaped trajectory, peaking in 2015. Emission reductions were primarily driven by decreases in agricultural energy consumption and land utilization, followed by crop cultivation. Conversely, agricultural net carbon sequestration and the carbon offset ratio show a fluctuating upward trend. (2) The agricultural carbon balance exhibits a distinct north–south differentiation. There has been a year-on-year reduction in carbon deficit counties, while the spatial aggregation of the carbon balance has become increasingly pronounced over time. (3) The marginal contribution of the agricultural carbon balance across the five primary agricultural zones positively correlates with the scale of agriculture and the prevailing crop cultivation regimes. Specifically, the Central Hebei Plain agricultural zone demonstrated the highest contribution, while the Daming agricultural zone exhibited the lowest. (4) Driven by the synergistic effect of internal and external factors, the BTH region has optimized its production elements. This has led to an elevated agricultural carbon balance and reduced inter-regional disparities. The region’s agricultural carbon balance demonstrates a favorable trajectory, suggesting sustainability under a low-carbon development paradigm. This study offers sustainability recommendations based on four pillars: establishing rigid production systems, enhancing compensation and trading mechanisms, optimizing industrial structures and integration strategies, and reinforcing regional coordination and incentive frameworks.
1. Introduction
The IPCC’s Sixth Assessment Report indicates a significant rise in global average surface temperature over the past few decades [1], with climate change emerging as a critical issue threatening human survival and development [2]. To adhere to the 2 °C temperature control limit, nations are compelled to accelerate emission reductions [3]. China actively participates in global climate governance and proposed the “dual carbon” goals (carbon peaking and carbon neutrality) in September 2020 [4], providing a direction for domestic low-carbon development. As a foundational industry of the national economy, agriculture not only fulfills core functions in ensuring people’s livelihoods, maintaining social stability, and driving economic operations but also faces ecological challenges such as high total carbon emissions, weak carbon sink capacity, resource scarcity, declining soil quality, and pollution. Unlike industry, agriculture possesses a dual characteristic of being both a “carbon source” and a “carbon sink” [5]. On the one hand, agricultural production activities and crop cultivation processes generate carbon emissions. On the other hand, the photosynthesis of crops and the accumulation of soil organic matter can form carbon sinks. The dynamic balance between these two directly impacts the carbon metabolism efficiency of regional agriculture. Optimizing the carbon source–carbon sink matching relationship can enhance agricultural carbon balance potential [6]. Techniques like returning straw to the field and replacing chemical fertilizers with organic fertilizers have significantly improved the agricultural carbon sink capacity [7]. The effectiveness of their regulation is directly linked to the efficiency of achieving the “dual carbon” goals, making it a crucial breakthrough point in the global carbon neutrality process. Despite the remarkable achievements in Chinese agriculture since the reform and opening-up periods, the demand for low-carbon transformation under ecological constraints has become increasingly urgent. Among these, the BTH region, as a pilot zone for ecological civilization construction and a core agricultural area in the North China Plain, faces both the pressure of agricultural transformation under the coordinated development strategy and the constraints of low-carbon targets. Therefore, research into the evolutionary patterns and elastic mechanisms of its agricultural carbon balance holds significant exemplary value [8,9].
The core connotation of agricultural carbon balance lies in quantifying the dynamic relationship between carbon sources and carbon sinks within the agricultural ecosystem, to reveal the net carbon effect of agricultural activities between carbon emissions and carbon sinks, and to reduce inter-regional carbon balance differences and enhance regional carbon balance levels [10]. Defined as the ratio of the rate of change in carbon balance status to the rate of change in agricultural output, carbon balance elasticity quantifies the sensitivity of agricultural output to the carbon balance level. A positive elasticity coefficient signifies that output growth correlates with an improved carbon balance status. Coefficients exceeding 1 indicate a more pronounced response of the carbon balance level to output fluctuations. Existing research on agricultural carbon balance elasticity remains systematically underdeveloped. While studies have addressed “carbon emission elasticity” [11] or “carbon sink elasticity” [12], few have integrated carbon sources and sinks into a holistic “carbon balance” framework to establish an elastic correlation between output and net carbon effects. Although Yuan et al. [7] introduced “carbon balance responsiveness” in their Yangtze River Delta study, they did not develop a standardized calculation methodology for elasticity. This acknowledged research gap presents an innovative avenue for the present study. Similar concepts include agricultural carbon compensation [13], agricultural carbon neutrality [14], the agricultural net carbon effect [15,16], and the agricultural net carbon sink. In the literature, research on the agricultural carbon balance has focused primarily on two distinct dimensions. First, from an agricultural ecological perspective, the ecological compensation value of agricultural carbon sink functions [17], the quantification of carbon compensation value in land use [18], and other related aspects [19] are analyzed. However, a systematic and mature framework has yet to be established. Second, studies have examined the quantitative relationship between agricultural carbon sinks and carbon emissions to analyze the agricultural carbon balance. As agriculture inherently possesses carbon absorption capacity, it can offset and compensate for the carbon emissions it generates. The level of agricultural carbon sinks is typically measured by the ratio of agricultural carbon sinks to carbon emissions. When this ratio exceeds 1, agricultural carbon sinks can fully offset carbon emissions, indicating a strong carbon sink capacity [20]. Related research findings have focused primarily on the quantification [21], evolutionary patterns [22], influencing factors [23], and convergence characteristics of agricultural carbon emissions and sinks [24]. Spatial analysis methods primarily include exploratory spatio-temporal data analysis methods [25,26], such as the Moran I index and cluster analysis, to reveal the spatial aggregation characteristics of the carbon balance. In terms of research scale, studies have focused primarily on the national [4], provincial [27], and municipal [28] levels. Although research using urban agglomerations [29] or economic zones [30] as study areas has increased, studies examining county-level agricultural carbon compensation rates from a regional perspective are insufficient [31]. Carbon emission calculation methods primarily include the widely applicable emission factor method [32], the mass balance method suitable for specific facilities and processes, field measurement methods applicable to small regions, the life cycle method, and the input–output method [33]. To balance international standards with China’s national conditions, this study uses carbon emission coefficients from the Oak Ridge National Laboratory (ORNL) and IPCC data for agricultural activities, whereas the coefficients for agricultural films, tillage, and irrigation are based on measurement results from Chinese scholars. Different scholars employ various calculation methods [34], and the coefficients they select also differ [35]. China’s agricultural carbon emissions originate primarily from crop production and livestock farming [24]. Scholars argue that agricultural carbon emissions primarily include agricultural input materials [36], agricultural machinery use, tillage, irrigation, and livestock farming. Broadly defined, agriculture includes agriculture, forestry, animal husbandry, fisheries, and related auxiliary activities, and calculating agricultural carbon emissions and sinks is complex. In this study, agriculture refers only to traditional crop cultivation, and the calculated carbon emissions mainly include agricultural energy consumption, agricultural land use, and crop cultivation, excluding carbon emissions from livestock and poultry farming.
This study makes three key contributions that distinguish it from existing literature: (1) We move beyond macro-level analyses, employing a fine-grained, county-level approach within the BTH urban agglomeration, focusing on five major agricultural zones to inform targeted agricultural policy. (2) Our methodology for assessing agricultural carbon sinks excludes short-term gains from crop harvesting, leading to a more accurate carbon balance assessment and a robust basis for evaluating regional carbon reduction potential. (3) We quantify agricultural carbon load to reveal the marginal contribution of unit product yield to regional carbon balance. Furthermore, we employ agricultural carbon balance elasticity to deeply analyze the dynamic interplay between carbon effects and economic output in agricultural production, providing novel analytical tools for achieving agricultural carbon balance in BTH.
This study focuses on the implementation pathways for the coordinated development of BTH [37] and the achievement of agricultural carbon neutrality goals [38] and explores the spatiotemporal evolution and elasticity mechanisms of the agricultural carbon balance in county-level areas of BTH from 2013–2022, providing a basis and support for enhancing carbon balance levels and reducing disparities in the region [39]. This study combines theory with practice to identify agricultural carbon emissions from three dimensions (agricultural energy consumption, land use, and crop cultivation) across eight aspects (agricultural irrigation, agricultural diesel consumption, total agricultural machinery power, agricultural fertilizer application, pesticide use, agricultural film use, land tillage, and crop cultivation); agricultural carbon sinks primarily consider crop carbon sequestration (Figure 1).
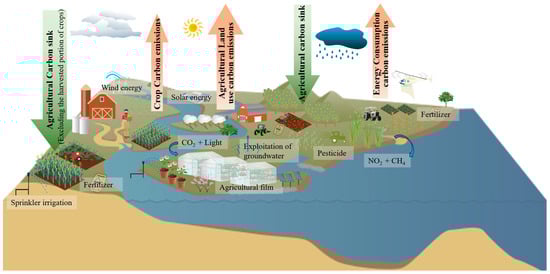
Figure 1.
Research Framework.
2. Materials and Methods
2.1. Study Area
The BTH region is the core area of China’s “Capital Economic Circle,” encompassing the two direct-controlled municipalities of Beijing and Tianjin, and Hebei Province (Figure 2). It spans geographical coordinates of 36°05′–42°40′ N and 113°27′–119°50′ E, covering an area of approximately 217,200 km2.
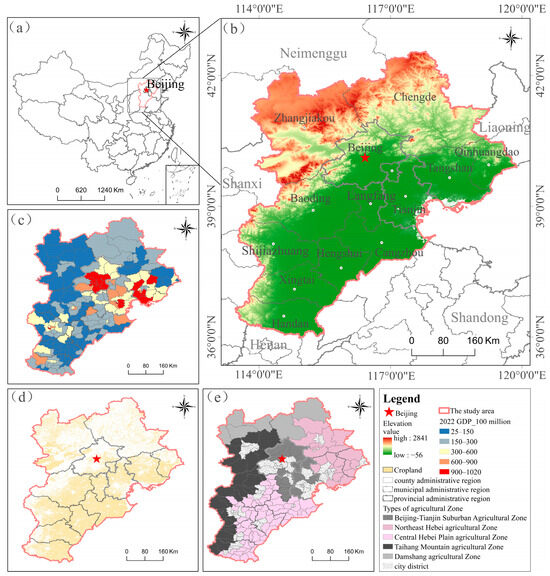
Figure 2.
Location of the study area. ((a) Map of administrative divisions of China and the study area; (b) Topography and geomorphology map of the study area; (c) Map of GDP distribution; (d) Map of agricultural land distribution; (e) Map of agricultural zoning.)
In terms of socio-economic conditions, the GDP of Beijing–Tianjin–Hebei reached 10.4 × 10¹² yuan in 2023, a 1.9-fold increase from 2013. Among these, Beijing, Tianjin, and Hebei had economic outputs of 4.38 × 10¹² yuan, 1.67 × 10¹² yuan, and 4.39 × 10¹² yuan, respectively, representing 2.1, 1.7, and 1.8 times their 2013 figures. The total permanent resident population is approximately 54 million people.
From the perspective of natural conditions, the Beijing–Tianjin–Hebei (BTH) region exhibits a distinct geographical divide: the northwest is predominantly mountainous and hilly, while the southeast consists mainly of plains. Blessed with abundant hydrothermal resources and superior agricultural potential, the region’s soils are diverse, encompassing Fluvisols, Cambisols, Luvisols, and Calcisols. Fluvisols, crucial for agriculture, are primarily found in the southeastern plains, whereas Cambisols are more prevalent in the northwestern hilly and low mountain areas. The BTH region is situated within the warm temperate semi-humid continental monsoon climate zone, characterized by concentrated summer precipitation (600–1000 mm annually). Influenced by latitude and topography, crop maturity systems vary: southern plains primarily support bicropping, while northern mountainous and high-latitude areas predominantly feature monocropping. Agricultural land is concentrated in Hebei Province, with production largely focused on grain, vegetables, and fruits. In 2022, the area under grain cultivation was 664.57 × 10⁴ ha, with a yield of 4170.23 × 104 t; the area under vegetable and fruit cultivation was 85.66 × 10⁴ ha, with a vegetable yield of 4957.67 × 104 t and a fruit yield of 449.99 × 10⁴ t.
Following principles such as consistency and conjugacy, regional differences, and dominant functionality, the zones of BTH were classified on the basis of differences in light, heat, water, and soil resources. Referring to Fang Fang [40], proposed a modern agricultural zoning framework in which five agricultural zones were formed, characterized by relative spatial continuity, relative consistency within zones, and relative heterogeneity between zones: the Beijing–Tianjin Suburban Agricultural Zone (I), Northeast Hebei Agricultural Zone (II), Central Hebei Plain Agricultural Zone (III), Taihang Mountain Agricultural Zone (IV), and Daming Agricultural Zone (V).
2.2. Data Source
This study covers a research area encompassing 190 counties in BTH, excluding nine nonagricultural districts in Beijing and Tianjin. As most regional yearbook data are only updated to 2022, this study selected the 10 years from 2013–2022 on the basis of data availability. Data sources can be divided into three distinct categories:
- Agricultural carbon emissions, carbon sink data, and crop yield data were sourced from the municipal statistical yearbooks of Beijing, Tianjin, and Hebei for 2013–2022. The specific data sources include the Beijing Statistical Yearbook, Tianjin Statistical Yearbook, Shijiazhuang Statistical Yearbook, Tangshan Statistical Yearbook, Qinhuangdao Statistical Yearbook, Handan Statistical Yearbook, Xingtai Statistical Yearbook, Baoding Economic Statistical Yearbook, Zhangjiakou Statistical Yearbook, Chengde Statistical Yearbook, Cangzhou Statistical Yearbook, Langfang Statistical Yearbook, and Hengshui Statistical Yearbook. Available on the official website of the corresponding municipal government. Some supplementary data were obtained from the China Social and Economic Big Data Research Platform. (https://data.cnki.net/trade/valueSearch/index?ky=%E7%8E%89%E7%B1%B3&zcode=Z009) (accessed on 23 October 2025).
- The DEM data are sourced from the National Basic Geographic Information Center (https://ngcc.cn/dlxxzy/gjjcdlxxsjk/) (accessed on 23 October 2025).
- The 30 m China land cover dataset (CLCD) was derived from the processing results of the GEE platform [41] (https://www.earth-system-science-data.net/) (accessed on 23 October 2025).
The key to data processing is standardizing the statistical criteria. Following the 2016 agricultural census, some counties adjusted their crop yield statistical criteria, necessitating the standardization of data before 2016. Taking Zhengding County in Shijiazhuang City as an example, it was found that vegetable output showed an increasing trend from 2013–2016 (before the census). The average annual growth rate was 0.17%, with an original output of approximately 87 × 104 t in 2016. Extrapolating based on this trend, the theoretical output for 2017 should have been 87.1 × 10⁴ t. However, the actual statistical output after the 2017 census was 58 × 104 t, resulting in a ratio of theoretical to actual values of 1.502. Considering potential marginal errors in census adjustments and referencing the correction ratios of neighboring similar counties, the final correction ratio for Zhengding County was set at 1.5. Other counties were adjusted accordingly, with correction ratios calibrated between 1.0 and 2.5 to eliminate data discrepancies and lay the foundation for the precise quantification of the agricultural carbon balance.
2.3. Quantifying Agricultural Carbon Emissions
This study primarily used the emission factor method to calculate carbon emissions [42]. When calculating CH4 emissions, only those generated during rice production are considered. N2O emissions are primarily calculated based on the emissions from the seven crop types. CH4 and N2O are uniformly converted into standard carbon equivalents via the following conversion factors (Formulas and ):
The carbon emissions and their corresponding emission coefficients are listed in Table 1. The Formula for calculating the major agricultural carbon emissions in BTH is as follows:
where represents agricultural carbon emissions, represents carbon emissions from the i-th source, denotes the usage of the i-th carbon source, and is the i-th source’s coefficient.

Table 1.
Main Agricultural Carbon Emission Coefficients and Reference Sources.
2.4. Quantifying the Agricultural Carbon Sink
This study only calculates the carbon sink of unharvested crops, that is, the carbon absorption during the growth cycle minus the short-term carbon sink of harvested agricultural products. On the basis of crop maturity and planting area proportions, 11 major crops were selected for calculating carbon emissions. The carbon sinks of crops were calculated by combining the yield, moisture content, and economic coefficients [45]. The method for estimating carbon sinks via crop productivity models was modified to derive the following Formula [46]:
where agricultural carbon sinks, represents the carbon sequestration of crop type i, , , and represent the carbon content coefficient, water content ratio, and economic coefficient of crop type i, respectively (Table 2). and represent the total biomass and economic yield of crop type i, respectively.
Table 2.
Carbon absorption rates and economic coefficients of crops.
2.5. Quantifying the Carbon Balance and Elasticity
2.5.1. Quantifying the Net Carbon Sink and Carbon Compensation Rates
The agricultural net carbon sink is the difference between carbon sinks and emissions from agricultural production. The agricultural carbon compensation rate is the ratio of carbon sinks to emissions and is used to measure the net carbon level of agriculture [49]. The Formulas and for calculating the agricultural net carbon sink and agricultural carbon compensation rate are as follows:
where represents the net agricultural carbon sink; represents the agricultural carbon sink; represents agricultural carbon emissions; and represents the agricultural carbon compensation rate.
2.5.2. Quantifying the Marginal Agricultural Product Carbon Balance
The core of the relationship between marginal agricultural products and the carbon balance is exploring the net balance of carbon emissions and absorption throughout the life cycle of these products. This study quantifies this relationship by calculating the carbon load per unit of agricultural product output via the following Formula :
where represents the carbon load per unit of agricultural product, and where represents the agricultural product yield.
2.5.3. Quantifying the Carbon Balance Elasticity of Agricultural Products
The carbon balance elasticity proposed in this study focuses on the relationship elasticity between carbon effects and agricultural output in agricultural production [50], which is used to measure the sensitivity of changes in carbon sinks, sources, and net carbon caused by changes in agricultural output [51,52]. In other words, it reflects the percentage change in the carbon effects when the agricultural output changes by 1%. The calculation Formulas is as follows:
where represents the change in carbon sinks; represents the change in carbon emissions; represents the change in net carbon sinks; represents the relative change in agricultural carbon sinks; represents the relative change in agricultural carbon emissions; represents the relative change in agricultural net carbon sinks; and represents the relative change in agricultural product yield. When ≥ 1, the agricultural carbon balance is elastic, indicating that changes in agricultural product yield are sensitive to changes in agricultural carbon effects; when < 1, the opposite is true.
2.6. Spatial Autocorrelation Analysis
The global spatial autocorrelation index can be used to determine whether agricultural carbon compensation rates are spatially aggregated [26]. A Moran’s I > 0 indicates a positive correlation, with larger values indicating a more significant correlation; a Moran’s I < 0 indicates a negative correlation, with smaller values indicating greater spatial differences. The Formula (11) is [53]:
where n is the number of counties; and are the net carbon sink and carbon compensation rates of counties i and j, respectively; is the mean value of the factor; and is the spatial weight matrix, which represents the spatial adjacency relationship between counties i and j.
The local spatial autocorrelation index can identify counties with high- or low-value clusters. The Formula (12) is as follows [54]:
where a value of > 0 indicates that adjacent regions form “high-high” or “low-low” clusters, whereas a value of < 0 indicates that they form “high-low” or “low-high” clusters.
3. Results
3.1. Current Status of Agricultural Carbon Balance
This study calculated agricultural carbon emissions, carbon sinks, net carbon sinks, and carbon compensation rates on the basis of agricultural data from counties in the Beijing–Tianjin–Hebei region from 2013–2022 (Figure 3).
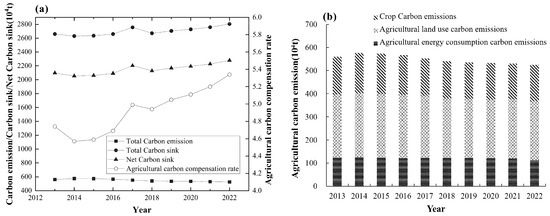
Figure 3.
Current Status of Agricultural Carbon Balance. ((a) Carbon emission/Carbon sink/Net Carbon sink; (b) Agricultural carbon emission structure.)
Agricultural carbon emissions in BTH decreased by 14.0% from 2013–2022, exhibiting an inverted U-shaped trend of fluctuating decline (Figure 3a). Emissions peaked at 1.2 × 10⁷ t in 2015. The decline in agricultural carbon emissions was primarily due to changes in land use and agricultural energy consumption (Figure 3b). These factors decreased by 7.3% between 2013 and 2022. The second major contributor was crop cultivation, which decreased by 3.5% during the same period. The agricultural carbon sink volume in BTH consistently exceeded emissions, indicating that the region’s agriculture is in a “net carbon sink” state. The agricultural net carbon sink volume and the agricultural carbon compensation rate both exhibited fluctuating increasing trends. Compared with that in 2013, the agricultural carbon sink volume increased by 5.5% in 2022, demonstrating a steady improvement in agricultural carbon sinks. The agricultural net carbon sink volume increased by 8.7% from 2013–2022. In 2022, the agricultural carbon compensation rate increased by 12.5% compared with that in 2013, with an average annual increase of approximately 1.2%, indicating sustained expansion.
3.2. Spatial–Temporal Characteristics of Agricultural Carbon Emissions
Agricultural carbon emissions in BTH exhibited a spatial pattern of “low in the core, high at the periphery” (Figure 4). Over time, carbon emissions have shown a decreasing trend, with the number of cities with low emissions increasing annually and the number of cities with medium-to-high emissions decreasing. In the following text, Roman numerals I-V represent the five major agricultural zones in the BTH: I refers to the Beijing–Tianjin Suburban Agricultural Zone, II to the Northeast Hebei Agricultural Zone, III to the Central Hebei Plain Agricultural Zone, IV to the Taihang Mountain Agricultural Zone, and V to the Daming Agricultural Zone. The total carbon emissions of the five zones were positively correlated with the agricultural scale: III > II > V > IV > I.
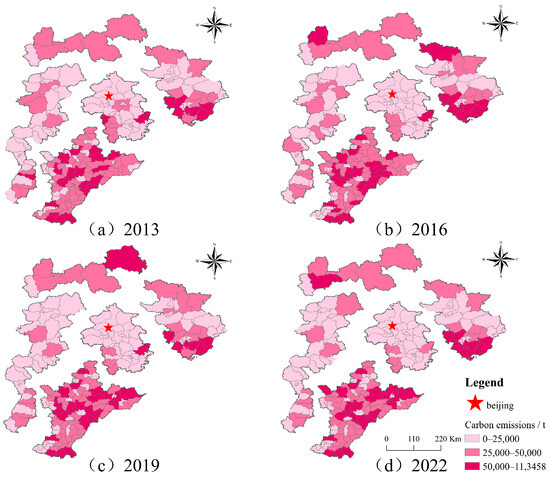
Figure 4.
Temporal–Spatial Changes in Agricultural Carbon Emissions.
I: Characterized by the lowest carbon emissions, this zone exhibits a decreasing emission trend, with a notable annual reduction in the number of high-emission counties. Its focus on high-value-added, low-energy-consumption agricultural products, diversified structure, and reduced reliance on traditional high-carbon methods are key. Constraints from water resource limitations and ecological protection policies further cap total carbon emissions. Since 2015, this zone has implemented a phased strategy including phasing out high-water-consuming crops, piloting initiatives like returning irrigated land to natural states, and promoting green pest control. By 2019, the ecological conservation zone achieved universal adoption of environmentally friendly pesticides, and post-2021, precision technologies have been employed to further reduce carbon emissions.
II: This zone presents relatively high carbon emissions, with pronounced “high-input, high-carbon-emission” production methods concentrating these emissions in southern counties. As the second-largest agricultural zone in the BTH, it is characterized by a significant proportion of high-carbon crops, substantial fertilizer application, and high energy consumption. Post-2014, the Yanshan region transitioned towards ecological agriculture. Subsequently, since 2016, the coastal region has focused on reducing rice cultivation, promoting drought-resistant crops, and decreasing fertilizer dependence and carbon emissions.
III: This zone, historically exhibiting the highest carbon emissions, has witnessed a decrease in overall emissions, yet the number of high-emission areas remains unchanged, with a subsequent trend of northward expansion. Abundant in agricultural resources, this region features over 60% arable land and extensive cultivation of high-carbon-emitting crops. Despite planting system adjustments and the promotion of low-carbon technologies, the large total arable land area continues to stabilize the number of high-emission areas.
IV: This zone has overall low carbon emissions with a significant decline, and the number of high-emission counties has decreased, showing a north–south divergence (higher in the southern region and lower in the northern region). The northern mountainous areas have one crop per year, with low carbon emissions from agricultural inputs, whereas the southern foothill plains have two crops per year, with a high proportion of water-intensive crops requiring large amounts of fertilizer, resulting in high carbon emissions. Since 2013, North region has developed specialty agriculture, whereas South region has implemented “grain-to-forage” reforms, among other measures, to curb the growth of carbon emissions.
V: Carbon emissions in this zone are at the average level for the BTH region. While emissions from crop cultivation have decreased, those from land use and energy consumption have increased, leading to suboptimal carbon reduction outcomes. The zone primarily relies on dryland agriculture due to the cold climate and water scarcity, resulting in a high proportion of energy-intensive potato cultivation. Technological lag further contributes to elevated carbon emissions. Although the zone has adjusted its crop structure since 2014, the anticipated carbon reduction effects have not been realized.
3.3. Spatial–Temporal Characteristics of Agricultural Carbon Sinks
The agricultural carbon sinks in BTH exhibited a pattern of “high in the southeast and low in the northwest”, which is consistent with the distribution of agricultural land and crop yield gradients. The III and II Zones are the core carbon sink areas, followed by the I Zone, whereas the IV and V Zones have the lowest carbon sink levels (Figure 5). From 2013–2022, counties with higher carbon sink levels (≥1 × 10⁴ t) showed an increasing trend, whereas areas with levels below 1 × 10⁴ t continued to decrease, resulting in a steady increase in the total agricultural carbon sink across the region.
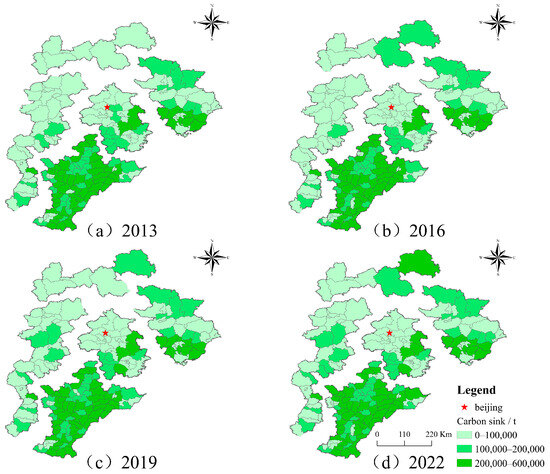
Figure 5.
Temporal–Spatial Changes in Agricultural Carbon Sinks.
I: High-value carbon sinks are concentrated in the northeast, and the number of medium- and high-value counties has increased over time. The northeast’s dry farming, rice cultivation, mountainous forest, and fruit-growing areas constitute diverse, diverse carbon sinks. Low-carbon crop rotation models, “straw return to the field + organic fertilizer replacement”, “intelligent temperature control—LED supplementary lighting”, and other technologies are used to increase photosynthesis time and stabilize farmland carbon pools. The “forestry and fruit + tourism” industry chain has been extended to synergistically increase carbon sinks and economic benefits in the zone.
II: High-value carbon sinks are concentrated in southern China, whereas medium-value areas are located in northern China. The number of carbon sinks has increased over time, and the number of countries has increased. The southern zone relies primarily on “wheat–corn” and “rice–vegetable” double-cropping systems with a high proportion of cash crops. It benefits from favorable resource endowments, well-developed irrigation systems, and precise fertilizer and pesticide management, enabling high-value carbon sequestration through straw and root systems to return to fields. The northern zone drives the increase in carbon sequestration through optimized planting techniques and the promotion of high-quality seeds. The transitional zone between high- and low-value areas is influenced by technological advancements and ecological planting models, with the number of medium-value counties growing.
III: With its vast arable land, this zone has become a concentrated area of agricultural carbon sinks, and the number of counties with medium-to-high values continues to expand. This zone has excellent resource endowments, and diversified cropping systems and models such as wheat–corn rotation and corn–soybean intercropping improve utilization efficiency and biodiversity, increase carbon sequestration time, and significantly contribute to carbon sinks from high-biomass crops. Crop residues returned to fields increase the soil organic carbon input. Technological progress and management improvements have promoted biomass accumulation and expanded the scope of medium- and high-value crops.
IV: The agricultural carbon sink capacity is low but steadily increasing, with an increase in the number of counties with medium values and significant regional differences in value. Owing to the fragmented terrain, water shortages, and poor soil, the total carbon sink has remained low for a long period. In recent years, the northern part of the zone has developed special economic forests, and the high-yield areas of the plains in front of the mountains have adopted comprehensive water conservation measures to alleviate water resource shortages, reduce energy consumption, and indirectly increase their carbon sink capacity.
V: Agricultural carbon sinks are generally low, but carbon sequestration has been significant in recent years, with all areas rising to medium–high levels by 2022. Constrained by the highland’s cold climate and water scarcity, agriculture relies primarily on dry farming, with limited technological advancement and biomass accumulation; agricultural and pastoral production activities disrupt the ecological environment, making it difficult to release the vegetation’s carbon sequestration potential. In recent years, ecological restoration efforts have increased vegetation coverage, enhanced plant carbon sequestration capacity, and driven a notable increase in carbon sink levels.
3.4. Spatial and Temporal Characteristics of Agricultural Carbon Compensation Rates
In 2013, the carbon compensation rates of the five major agricultural zones were ranked as follows: III > I > II > IV > V. By 2022, the carbon compensation rates were ranked as follows: I > III > II > IV > V. Over the past decade, the agricultural carbon compensation rate in I has increased the most significantly, rising by 56%, followed by V, which has increased by 45% (Figure 6).
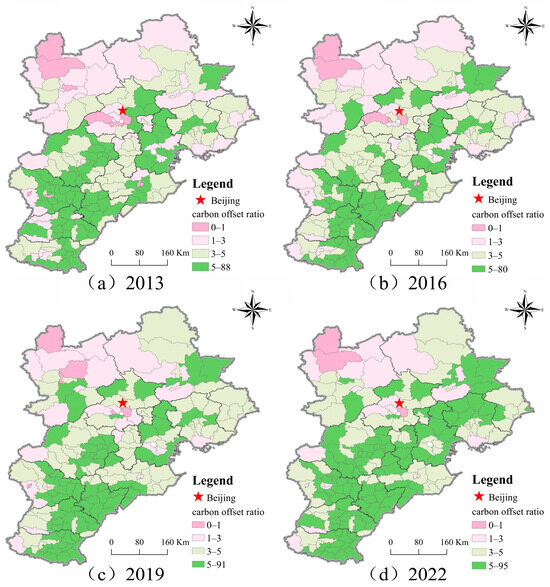
Figure 6.
Spatial–temporal changes in the agricultural carbon compensation rate.
I: With urban facility agriculture as the core, science and technology, and capital support high-value crops, forming a “high added value, low energy consumption, high intensity” model. Although the scale is limited, the carbon compensation rate ranks first in the BTH region. Facility agriculture is well developed, and intelligent greenhouse supplementary lighting makes the annual carbon sink 2.3 times that of open fields, with “agriculture–light complementarity” extending the carbon fixation period. After 2019, policies promoted water and chemical savings and popularized low-carbon crop rotation. With the help of the Internet of Things for precise control, the carbon compensation rate has increased significantly.
II: Mainly high-carbon crops such as wheat and rice, which have high carbon sinks but also high carbon emissions, weaken the carbon compensation rate. Since 2013, emission reduction and carbon sequestration measures have been implemented: reducing the cultivation of high-water-consuming crops, promoting ecological farming, and using soybean rhizobia to fix nitrogen and reduce fertilizer use; leveraging fertile farmland to promote mechanization and precision agriculture; expanding economic forests to form a “grain–fruit” composite carbon sequestration system; and increasing the number of counties with high net carbon sequestration. By 2022, specialty agricultural product bases will be established, significantly improving the carbon compensation rate.
III: With extensive arable land, a mature planting system, low costs, high yields, and a high carbon compensation rate. Since 2013, farmland protection red lines have been established, and high-standard farmland has been constructed. In 2014, the “one season fallow, one season rain-fed” policy was implemented to reduce irrigation-related carbon emissions. In 2016, the “three reductions and three increases” policy was implemented, and green and efficient farming models were promoted. Straw return to fields and the use of organic fertilizers to increase soil fertility were also implemented. Crops have strong carbon sequestration capabilities, and the total net carbon sink is significant and increasing annually.
IV: Due to terrain, soil, and water restrictions, the carbon compensation rate is low. In recent years, special measures have been taken to improve this situation: restricting the cultivation of water-intensive crops, promoting drip irrigation to save water and reduce energy consumption, developing special economic forests, and constructing an “economic forest + grain crop” composite system for three-dimensional carbon sequestration, becoming a demonstration zone for carbon sink enhancement in ecologically fragile areas of North China.
V: The climate is cold, grassland desertification is severe, clean energy is backward, and the carbon compensation rate is low. Since 2018, solar energy has been promoted to reduce dependence on fossil fuels; in areas of groundwater overexploitation, wheat and corn cultivation have been reduced and replaced with crops with low water consumption; and the planting structure has been adjusted to increase the carbon sequestration capacity. In 2022, carbon sinks will rise to medium–high values but will still be a shortcoming in the regional carbon balance.
3.5. Spatial Autocorrelation Analysis of the Agricultural Carbon Balance
3.5.1. Global Spatial Autocorrelation
This study calculates the global Moran’s I index for agricultural carbon compensation rates in the BTH region from 2013–2022 (Table 3). The results show that the index was positive throughout the study period, indicating a positive spatial correlation and convergence in agricultural carbon compensation efficiency among neighboring cities. From a temporal perspective, the index fluctuated, with spatial correlation strengthening and differences narrowing. Additionally, all p values were less than 0.05, indicating that the study results were statistically significant at the 95% confidence interval.
Table 3.
Results of Global Spatial Autocorrelation.
3.5.2. Local Spatial Autocorrelation
The LISA clustering analysis indicates that counties in Tianjin and its surrounding areas with well-developed facility agriculture are predominantly classified into high-high and low-high clusters, leveraging the advantages of urban agriculture to form a high-carbon compensation model; the low-high clusters are driven by technological spillover and policy incentives from Beijing and Tianjin and are undergoing a low-carbon transition (Figure 7). Low-low clusters are primarily found in ecologically fragile regions such as Zhangjiakou, where weak carbon sequestration and difficult carbon control due to climate and terrain factors result in an “ecological fragility-low carbon compensation efficiency” lock-in effect, highlighting spatial differentiation. From 2013 to 2019, the count of “high-high” cluster regions grew, indicating an outward spread of high carbon compensation models. Concurrently, “low-low” cluster regions diminished, with areas like Zhangjiakou experiencing enhanced carbon compensation rates, leading to a mitigation of spatial disparities. By 2022, regional disparities in agricultural carbon compensation rates widened once more, significantly impacted by the COVID-19 pandemic. Differences in agricultural endowments and structures influence carbon compensation capabilities, and balanced development hinges on accurately recognizing regional characteristics.
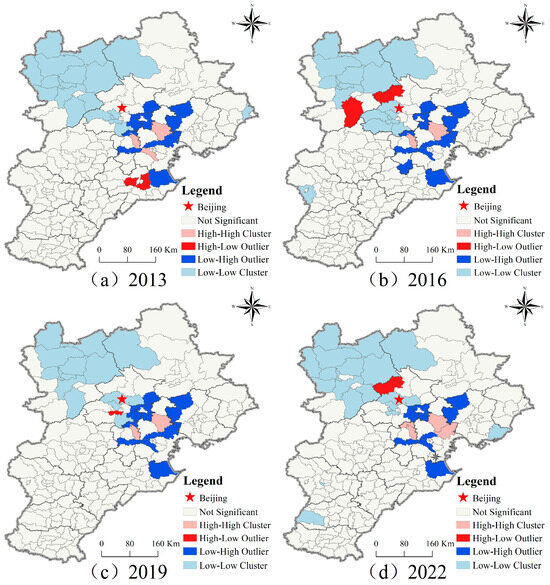
Figure 7.
Cluster Analysis and Outlier Detection of Carbon Compensation Rates.
3.6. Marginal Agricultural Product Carbon Balance Analysis
Agricultural carbon loads are categorized into four types based on carbon load thresholds: (1) low carbon load: carbon emissions per unit of agricultural product exceed carbon sequestration; (2) moderate carbon load: carbon sequestration is nearly balanced with carbon emissions or slightly greater; (3) high carbon load: carbon sinks per unit of agricultural product are significantly greater than carbon emissions. The five major agricultural zones are ranked in order of their marginal carbon balance contributions as follows: III > IV > I > II > V (Figure 8). During the study period, the carbon load per unit of agricultural product increased most significantly in V and I, followed by IV, whereas the carbon load per unit of agricultural product remained relatively stable in II and III.
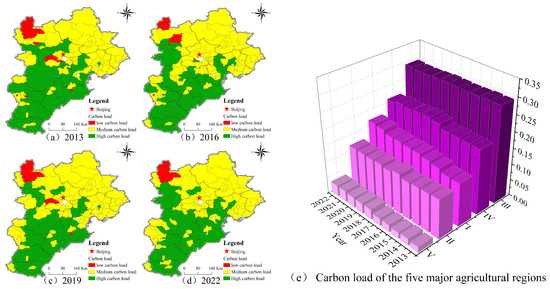
Figure 8.
Dynamic Changes in Agricultural Carbon Load. ((e) Temporal variation of carbon load in the five major agricultural regions (purple areas in the figure).)
Low-carbon load areas are located primarily in the Taihang Mountain region of northwestern China and certain urban districts (Figure 8a–d): the former region has a cool climate and infertile soil, resulting in high input and low output, with net carbon emissions per unit of output tending toward zero or negative; the latter region has fragmented farmland and a limited scale, with relatively high yields but total carbon sinks below carbon emissions, resulting in overall low carbon loads. The moderate carbon load regions are located primarily in the northern part of BTH (e.g., Zones I, II, and V) and certain western counties of IV. Owing to climatic factors, the carbon sink coverage per unit of agricultural product output is slightly greater than the carbon emissions. High-carbon load regions are concentrated in the central and southern parts of BTH, including Zones IV and III, and the southeastern part of region I. Through low-carbon policies, large-scale planting, and technological interventions, the carbon sink per unit of agricultural products is significantly greater than the carbon emissions.
III has the highest carbon load per unit of agricultural product. It improves land utilization and increases biodiversity through planting patterns and systems, ensures that high carbon sinks through large-scale mechanical planting, and reduces carbon emissions through fertilizer reduction and drip irrigation water-saving technology (Figure 8c). IV has a high net carbon sink per unit of agricultural product in the northern region, which is dominated by forestry and fruit farming. In the southern region, which is dominated by small-scale dryland agriculture, carbon emissions are reduced, and carbon sinks are enhanced through composite farming systems and water-saving technologies, resulting in a transition toward higher carbon loads per unit of agricultural product. I have developed facility agriculture and large-scale vegetable production, but weak carbon sequestration in the straw and root systems. The carbon sink per unit of agricultural product is slightly greater than the amount of carbon emissions. Relying on “smart agriculture + three-dimensional planting of facility” technology, the carbon load per unit of agricultural product is steadily increasing; II is a medium-carbon-load zone. Owing to factors such as water resources, there is significant pressure to reduce emissions and increase carbon sinks per unit of agricultural product, with low carbon load values. V has long faced high carbon emission pressures. Constrained by insufficient accumulated temperature and high input costs in dryland agriculture, carbon sinks per unit of agricultural product cannot fully offset carbon emissions. Recent policy and technological interventions have increased carbon load values, but a shortfall in the regional carbon balance remains.
3.7. Agricultural Product Carbon Balance Flexibility Mechanism
3.7.1. Framework for a Carbon Balance Elasticity Mechanism
The spatial differences in agricultural carbon balance elasticity in BTH are formed by the combined effects of endogenous and exogenous factors (Figure 9). Endogenous factors include agricultural resource endowments and geographical location; exogenous factors include crop structure, technology input, and agricultural policy support, which indirectly affect carbon balance elasticity by shaping resource utilization conditions.
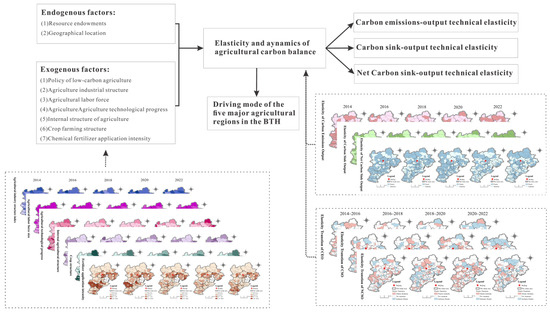
Figure 9.
Drivers of the Elastic Changes in Carbon Balance (The image of external influencing factors in the figure is cited from Appendix A Figure A1, and the image of carbon balance output technical elasticity and its changes is cited from Appendix A Figure A2).
3.7.2. Analysis of the Carbon Balance Elasticity Mechanism
Based on agricultural carbon emissions, carbon sinks, and agricultural product yield data from 2013 to 2022, we calculated the technical elasticity coefficients for carbon emissions-output, carbon sinks-output, and net based on agricultural carbon emissions, carbon sinks, and agricultural product yield data from 2013–2022, we calculated the technical elasticity coefficients for carbon emissions-output, carbon sinks-output, and net carbon-output from 2014–2022 in the Beijing–Tianjin–Hebei region. The absolute values of these coefficients reflect the strength of the association between yield changes and carbon effects. Starting with the five major zones, we explored the dynamic changes in elasticity and their underlying mechanisms.
- Beijing–Tianjin Suburban Agricultural Zone (I) (Figure 10)
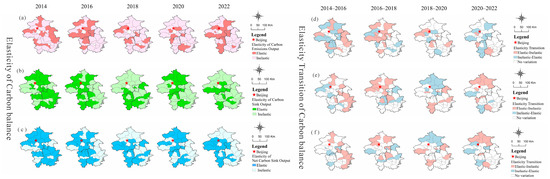 Figure 10. Dynamic Changes of I in Carbon Balance Elasticity. ((a) the elasticity of carbon emission output technology; (b) the elasticity of carbon sink output technology, (c) the elasticity of net carbon output; (d) the elasticity transition of carbon emission output technology; (e) the elasticity transition of carbon sink output technology; (f) the elasticity transition of net carbon output.)
The carbon emissions in this region lack flexibility, whereas carbon sinks and net carbon exhibit long-term flexibility and undergo significant transformations. After 2014, ecological conservation areas implemented measures to weaken the response of carbon emissions to outputs, whereas smart greenhouses reinforced the rigidity of carbon emissions. The increased proportion of technical labor also promoted growth in the carbon sink efficiency per unit of agricultural products. Between 2014 and 2018, the development of the tourism and picking industry increased carbon emissions while also increasing the carbon sequestration capacity. In the later period, under the influence of policies and technology, the elasticity of carbon emissions and carbon sinks fluctuated significantly. In the Beijing–Tianjin suburban agricultural zone, land fragmentation limits carbon sink expansion, but the zone’s locational advantages have received policy and capital support. Policies strictly control carbon emissions in agriculture, whereas urban demand drives the development of the picking and tourism industries. Later, the transition to “low-carbon tourism” optimized the net carbon sink elasticity. The implementation of smart facilities, supplementary lighting technology, and a capital focus on emission reduction and carbon sink enhancement has led to the replacement of traditional greenhouses with photovoltaic greenhouses, achieving increased production while enhancing net carbon sink elasticity.
- 2.
- Northeast Hebei Agricultural Zone (II) (Figure 11)
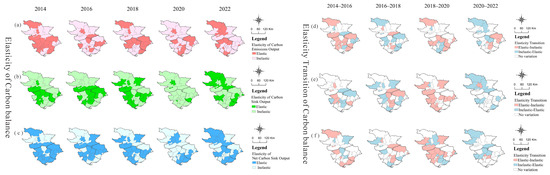 Figure 11. Dynamic Changes of II in Carbon Balance Elasticity. ((a) the elasticity of carbon emission output technology; (b) the elasticity of carbon sink output technology, (c) the elasticity of net carbon output; (d) the elasticity transition of carbon emission output technology; (e) the elasticity transition of carbon sink output technology; (f) the elasticity transition of net carbon output.)
From 2014–2018, carbon emissions, carbon sinks, and net carbon in each county were generally resilient, weakened in 2020, and strengthened again in 2022, showing dramatic changes. To build green industries and high-quality agricultural product bases, the Agricultural Zone in Northeast Hebei has reduced agricultural diesel and other inputs annually. Improvements in agricultural resources and technological investments have supported high carbon emissions and carbon sink elasticity. After 2018, the northeastern Hebei region increased its investment in low-carbon technologies and expanded the cultivation of high-carbon sink crops, leading to a significant improvement in net carbon sink elasticity. From 2014–2018, mechanized planting and precision agriculture technologies were widely adopted, optimizing the structure of the planting industry. Clean energy and organic fertilizers replaced traditional inputs, and in some areas, crops transitioned toward high-carbon sink types, with an increase in the proportion of specialty agricultural products and vegetable cultivation. In 2020, to address the pandemic, policies such as restoring rice cultivation areas were proposed, and technologies such as mechanized farming were promoted, leading to significant changes in the carbon source, carbon sink, and net carbon sink elasticity. Counties in Tangshan leveraged their agricultural resources and geographical advantages to establish a foundation for resilient adjustments. The Beijing–Tianjin market has driven the expansion of specialty agricultural product production on a large scale. Initial high investments have increased carbon source elasticity, whereas subsequent green transitions have optimized outcomes. Precise policy interventions targeting factor inputs, coupled with the substitution of traditional crops with high carbon sequestration crops, directly alter the intensity and elasticity of carbon sources/sinks.
- 3.
- Central Hebei Plain Agricultural Zone (III) (Figure 12)
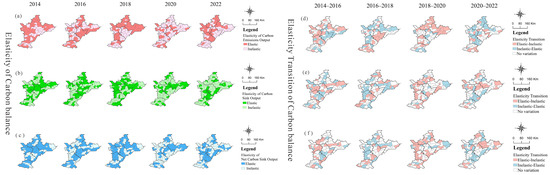 Figure 12. Dynamic Changes of III in Carbon Balance Elasticity. ((a) the elasticity of carbon emission output technology; (b) the elasticity of carbon sink output technology, (c) the elasticity of net carbon output; (d) the elasticity transition of carbon emission output technology; (e) the elasticity transition of carbon sink output technology; (f) the elasticity transition of net carbon output.)
From 2014–2018, carbon emissions, carbon sinks, and net carbon elasticity were significant; from 2020–2022, the carbon source and carbon sink elasticities were often insufficient, with significant fluctuations. High inputs of agricultural inputs led to increased agricultural production, accompanied by rising carbon emissions, whereas changes in fertilizer application intensity weakened carbon source elasticity. Adjustments to cropping systems in groundwater overexploitation areas reduced the increase in carbon sink resulting from increased production. From 2014–2018, driven by agricultural technological progress, the optimization of crop structure from 2016–2018 was the key driver. From 2018 to 2022, the promotion of low-carbon technologies reduced the increase in carbon emissions from increased production, whereas the rebound in fertilizer use in Handan County in 2022 increased carbon source elasticity. This region has a large arable land area and a high proportion of traditional agriculture. Carbon source/sink elasticity is sensitive to technological and structural adjustments, but the transition is slow. Policy interventions such as “organic fertilizer substitution” for agricultural input costs, and the implementation of technologies like low-carbon irrigation, weaken the rigidity of carbon sources. However, traditional agriculture has deep path dependencies, and continuous optimization of input structures is needed to drive low-carbon transformation.
- 4.
- Taihang Mountain Agricultural Zone (IV) (Figure 13)
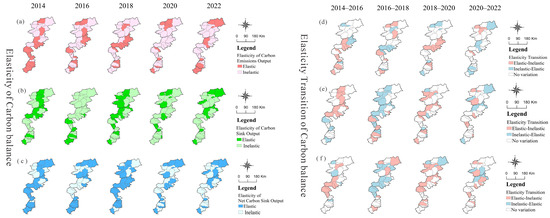 Figure 13. Dynamic Changes of IV in Carbon Balance Elasticity. ((a) the elasticity of carbon emission output technology; (b) the elasticity of carbon sink output technology, (c) the elasticity of net carbon output; (d) the elasticity transition of carbon emission output technology; (e) the elasticity transition of carbon sink output technology; (f) the elasticity transition of net carbon output.)
From 2014 to 2022, carbon emissions, carbon sinks, and net carbon elasticity were relatively high. From 2014–2018, there was a clear north–south divide in the Taihang Mountain Agricultural Zone. The northern region has high carbon sink elasticity due to the large-scale planting of special economic forests, which increases the carbon sequestration potential. In southern China, carbon emissions exhibit high elasticity due to complex terrain, small-scale agriculture, high water consumption by crops, and reliance on fertilizer application for increased yields. Policy and technological interventions led to increased yields accompanied by reduced carbon emissions. From 2014 to 2018, land consolidation and agricultural machinery subsidies were implemented, and the “grain-to-forage” initiative was promoted. From 2018 to 2020, the “double reduction” of fertilizers and pesticides was implemented, “gully economy” ecological planting was developed, and farmland shelterbelts and ecological corridors were constructed. From 2020 to 2022, “internet monitoring + water-fertilizer integration” was promoted in the mountain-front plains of Xingtai and Handan, and digital farmland and water-saving irrigation demonstration counties were established. The Taihang Mountain Agricultural Zone focuses on “water conservation, carbon reduction, and ecological restoration.” The north–south terrain and industrial differences constitute “innate conditions” for flexible differentiation. The northern forestry and fruit industry will undergo iteration, whereas southern ecological restoration and other policies will precisely intervene in high-carbon links to change the net carbon elasticity.
- 5.
- Daming Agricultural Zone (V) (Figure 14)
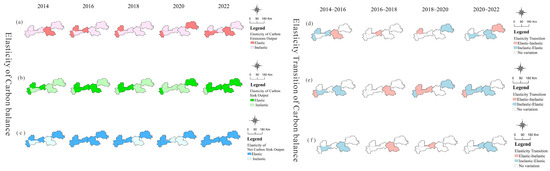 Figure 14. Dynamic Changes of V in Carbon Balance Elasticity. ((a) the elasticity of carbon emission output technology; (b) the elasticity of carbon sink output technology, (c) the elasticity of net carbon output; (d) the elasticity transition of carbon emission output technology; (e) the elasticity transition of carbon sink output technology; (f) the elasticity transition of net carbon output.)
From 2014 to 2022, the carbon source elasticity was weak, the carbon sink elasticity was strong, and the net carbon sinks remained elastic and stable over the long term. In 2014, steeply sloped sandy farmland was permanently withdrawn from use and converted to pasture or ecological forest, and subsidies were distributed. From 2015–2017, a three-year crop rotation and fallow system was implemented, reducing the use of fertilizers and pesticides. Ecological restoration was used to increase vegetation coverage, and no-till planting reduced carbon disturbance, thereby increasing the carbon storage potential of agriculture. From 2016 to 2020, the construction of high-standard farmland and other projects advanced simultaneously, resulting in a significant increase in soil organic carbon density. From 2020 to 2022, the full implementation of facility agriculture industrial clusters and other initiatives drove a sustained increase in carbon sink elasticity. The fragile ecological environment and agriculture-dominated industrial structure form the foundation for elasticity adjustments. Policies such as “carbon reduction and greening” have restructured crop patterns, reducing the number of high-water-consuming crops and increasing the number of drought-tolerant crops. Post-pandemic concerns over food security temporarily increased the planting area of crops such as potatoes, driving an increase in elasticity.
In summary, the differences in carbon balance elasticity among the five major agricultural zones in BTH are the result of the synergy between “endogenous potential and exogenous factors shaping the path.” The agricultural zone in the suburbs of Beijing and Tianjin is location- and policy-driven; the agricultural zone in northeast Hebei is technology- and structure-driven; the plain agricultural zone in central Hebei is tradition- and transformation-driven; the Taihang Mountain agricultural zone is north–south difference-driven; and the agricultural zone above the dam is ecology- and technology-driven (Figure 15).
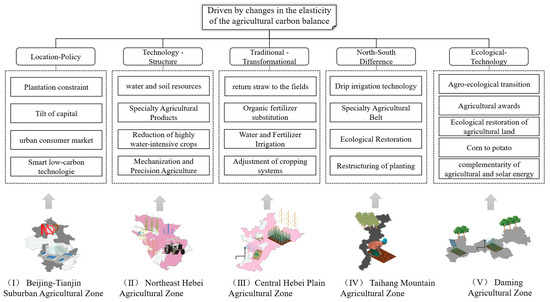
Figure 15.
Agricultural Carbon Balance Driving Models in the BTH.
3.8. Differentiated Measures
The development models of the Beijing and Tianjin Suburban, the Northeast Hebei, the Central Hebei Plain, the Taihang Mountain, and the Daming area differ, and carbon balance optimization must be based on regional characteristics. To achieve coordinated agricultural development in BTH, it is necessary to combine regional characteristics and economic development stages to construct a differentiated governance system from four dimensions:
- A modern agricultural production system adapted to different regions should be built.
Tailor policies to address core contradictions in each region and strengthen the alignment between technology and industry. The Beijing and Tianjin Suburban agricultural zone focus on “smart low carbon + functional expansion”; the Northeast Hebei agricultural zone strengthens “characteristic efficiency + emission reduction synergy”; the central Hebei Plain agricultural zone deepens “scale intensification + crop rotation carbon sequestration”; the Taihang Mountain agricultural zone implements “north–south division + forest and fruit empowerment”; and the Daming agricultural zone promotes “ecological restoration + structural transformation”. Promote biochar technology for improving facility soils, recycle shredded straw through field return or conversion to organic fertilizer, thereby reducing chemical fertilizer use and waste-related carbon emissions in facility agriculture, and enhancing soil carbon sequestration capacity.
- 2.
- The ecological compensation and carbon trading mechanisms should be improved.
Adhere to the principle of “equal emphasis on quantity and quality, mutual assistance between regions,” and establish a cross-regional adjustment system linked to both carbon sink contributions and the difficulty of transition (Table 4). A technical compensation channel should be established, an agricultural carbon trading market should be piloted, and a unified compensation platform should be established.
Table 4.
Differential Compensation Standards.
- 3.
- The agricultural industrial structure should be optimized, and the path to the integration of the three industries should be optimized.
Redefining the carbon balance landscape through “regional collaboration and supply chain expansion” to facilitate the conversion of carbon sink value into economic value. The agricultural zones in the suburbs of Beijing and Tianjin will reduce high-carbon crops and create sightseeing experience bases; northeast Hebei will expand the cultivation of specialty crops and build low-carbon supply chains; the Taihang Mountains and northeast Hebei will jointly create industrial belts; and the central Hebei Plain will build crop rotation belts to achieve a low-carbon closed loop. Moreover, a low-carbon supply chain of “urban demand-mountain supply” will be created, and “ecological restoration + study tourism” will be developed.
- 4.
- Regional coordination, protection, and incentives should be strengthened.
A multilevel collaborative mechanism should be established, the BTH Agricultural Low-Carbon Alliance should be established, policy integration should be coordinated, carbon balance reports should be regularly published, a rolling recognition mechanism for “low-carbon agricultural demonstration counties” should be established, and priority should be given to central and provincial fiscal, financial, and land use preferences. Collaborations with universities should establish a technology-sharing platform to address regional challenges such as the “low-yield, unstable production” issue in the Daming area, soil and water conservation in the Taihang Mountains, and nitrogen oxide reduction in the Central Hebei Plain. Carbon compensation rates and net carbon sink increments should be incorporated into incentive mechanisms. Counties with outstanding collaborative achievements will be granted exemptions from carbon trading fees, interest subsidies for green loans, and priority access to demonstration funds, thereby establishing replicable and scalable low-carbon agricultural governance models.
4. Discussion
4.1. Analysis of Research Results
On the basis of the above research findings, primary trends in the development of the agricultural carbon balance in BTH can be summarized. In the past decade, significant progress has been made in emission reduction and carbon sequestration in the BTH. Both the net agricultural carbon sink and carbon compensation rate in various districts and counties have shown a fluctuating upward trend [55]. This decline is driven primarily by policy initiatives outlined in the National Plan for Sustainable Agricultural Development (2015–2030), which aims to achieve “one control, two reductions, and three fundamentals.” These goals are achieved by promoting green production technologies [56], adjusting the energy structure, and significantly reducing energy consumption-related carbon emissions [57], thereby demonstrating the direct impact of policies on reducing agricultural carbon emissions. Although differences in carbon emission coefficients and selected crop types result in varying outcomes in agricultural carbon emission calculations, the overall trends in carbon emissions are similar [8,24], with agricultural land use and energy consumption being the primary sources of agricultural carbon emissions. The “straw return to fields + organic fertilizer substitution” policy implemented after 2013 significantly enhanced the cumulative effect of soil organic carbon enhancement [58]. Reducing carbon emissions and increasing carbon sinks are effective strategies for boosting agricultural net carbon sinks and compensation rates.
Carbon emissions exhibit a “core low-edge high” spatial pattern, whereas carbon sinks show “southeast high-northwest low” spatial characteristics, stemming from the differing pathways between the “policy-constrained emissions reduction” in the suburban areas of Beijing and Tianjin and the “scale-driven carbon sink” in central Hebei and northeastern Hebei. In the suburban areas of Beijing and Tianjin, despite their limited agricultural scale [59], they achieved leading carbon compensation rates through technological advantages, breaking away from the traditional notion that “carbon sinks depend on the planting scale”. The positive spatial correlation of carbon compensation rates has strengthened [60], and regional differences have narrowed annually [8], indicating that the ecological synergy policies of BTH [61] have enabled the southern region to export carbon sequestration models to the northern region through “straw return to fields + organic fertilizer” technology [62,63]. The BTH carbon emissions trading pilot program has facilitated the cross-regional flow of carbon sink resources, promoting regional convergence in carbon balance capacity and shifting from a dispersed distribution to a clustered development pattern [64]. However, the agricultural carbon balance in BTH still exhibits distinct north–south differentiation and clustering characteristics, closely linked to the overall imbalance in agricultural development [65]. Its core driving factors can be summarized into three dimensions: resource endowments, policy intervention intensity, and technological application level [66].The primary reasons for the challenges in achieving coordinated agricultural development among Beijing, Tianjin, and Hebei include unequal regional political status, inconsistent development interests, unclear urban functions, and the absence of effective cooperation mechanisms [67]. Given Beijing’s role as the political and cultural core of the Beijing–Tianjin–Hebei region, collaborative development plans primarily position Tianjin and Hebei on the supply side to support the capital’s economic development [68]. Consequently, agricultural functions are more pronounced in the central and southern parts of Hebei [69]. The current unequal situation in the agricultural regions of BTH provides a basis for low-carbon agricultural policies and agricultural regionalization.
4.2. Comparison with Existing Research
Unlike studies that focus on single carbon emissions or sinks [70], this paper systematically reveals the synergistic dynamics of “emissions–carbon sinks–net carbon sinks–compensation rate” in agriculture in the Beijing–Tianjin–Hebei region. Notably, a 12.5% increase in the carbon compensation rate was detected. This addresses the limitation of “emphasizing individual indicators over system balance.” This study quantifies agricultural carbon loads to reveal the marginal impact of agricultural product production on the regional carbon balance [71] and introduces supply elasticity theory to deconstruct the nonlinear dynamic coupling mechanism between changes in agricultural product yields and carbon effect responses. Thus, it provides a microlevel basis for decision-making and regionally differentiated policies.
Considering scale dependency and scale effects [72], microscale analysis may be more effective than macroscale analysis in revealing the spatiotemporal evolution of cross-regional agricultural carbon balance effects. This study explores dynamic changes in the agricultural carbon balance at the county level, refining them to five major zones and providing a more precise basis for regionally targeted policies. The implementation of agricultural emission reduction and carbon sink enhancement policies at the county level is key to enhancing emission reduction and carbon sequestration potential [73].
Using the crop carbon sink dynamic correction method, this study deducted the carbon flux from harvested portions to correct the systematic overestimation of regional carbon sink quantities reported in previous research. This correction allows the assessment of the net carbon sequestration potential in agricultural ecosystems to be more closely aligned. By scientifically calculating the reduction in short-term carbon sinks from crop harvesting, the seasonal variations in the carbon cycle can be effectively removed, providing an accurate reflection of the long-term carbon sequestration capacity of ecosystems. This method offers a new tool for evaluating the net carbon neutrality contributions of agriculture.
4.3. Limitations of the Study
Despite achieving notable results, this study is subject to several limitations. First, data quality and calculation inaccuracies pose a significant challenge. Although multiple data sources were integrated, sample discrepancies in statistical criteria and potentially unreasonable standardized proportional coefficients may have affected precision. The calculation of agricultural carbon emissions and sinks relies on existing coefficients; the absence of region-specific parameters likely introduced a 10–15% systematic error. Specifically, this study assumes that the emission factor remains constant over multiple years, without considering variations caused by technological progress, management practices, or environmental changes. Future studies could incorporate dynamic emission factors to more accurately reflect the changing characteristics of carbon emissions. Second, the study’s focus on N2O and CH4 emissions, with CO2 measured implicitly via standard carbon units, may introduce some uncertainty. Future research could enhance the assessment of agricultural carbon balance by directly measuring CO2. Third, crop-level analysis remains insufficient. The marginal carbon balance analysis for agricultural products has not been refined for specific crops, hindering the identification of precise emission reduction priorities for highly sensitive crops and impacting policy implementation accuracy. Furthermore, limitations in analyzing carbon balance elasticity mechanisms include: The omission of socioeconomic variables, such as farmer behavior, and an inadequate analysis of the “policy–farmer response–carbon effect” transmission mechanism due to difficulties in obtaining micro-level survey data. The exclusion of short-term impacts of extreme climate events on carbon sink elasticity, stemming from insufficient data on extreme events during the study period for quantification.
5. Conclusions
This study innovatively proposes to enhance carbon balance by integrating methodological contributions and practical insights from agricultural zoning. It is the first to couple carbon load and output-technology elasticity models for agricultural carbon research in the BTH region, thereby overcoming the precision limitations of traditional regional-scale analyses and offering a methodological reference for comparable county-level carbon balance studies. Agricultural carbon emissions in the BTH region have exhibited an inverted “U”-shaped downward trend, peaking in 2015. The primary drivers of this decline are agricultural land use and energy consumption, followed by crop cultivation. Concurrently, the total agricultural carbon sink has fluctuated upwards, consistently exceeding emissions and maintaining its “net carbon sink” status. Both the net carbon sink volume and the carbon compensation rate have shown continuous increases. The fluctuating upward trend of Moran’s I index signifies an enhancement in spatial correlation and a reduction in disparities, resulting in improved carbon balance levels and a more even spatial distribution. However, heterogeneity exists across agricultural zones: the Central Hebei Plain Zone exhibits the highest net carbon sink, while the Above-Dam Zone has the lowest. The carbon compensation rate is highest in the Central Hebei Plain Zone and the Beijing–Tianjin Suburban Zones and lowest in the Above-Dam Zone. The marginal agricultural product contribution rate ranks as follows: Central Hebei Plain Zone (III) > Taihang Mountain Zone (IV) > Beijing–Tianjin Suburban Zone (I) > Northeast Hebei Zone (II) > Daming Zone (V). The spatial distribution of agricultural carbon balance elasticity across the BTH is jointly influenced by internal and external factors. The Beijing–Tianjin suburban area is driven by location and policy; the Hebei Northeast Agricultural Area is driven by technology and structure; the Central Hebei Plain is driven by tradition and transformation; the Taihang Mountains is driven by north–south differentiation; and the Daming Mountain Agricultural Area is driven by ecology and technology. Overall, BTH’s agricultural carbon balance capacity improved between 2013 and 2022, yet regional development remains uneven. Future strategies for promoting carbon balance in BTH should be differentiated: Zone I: Focus on “smart low-carbon practices + functional expansion”; Zone II: Strengthen “specialty enhancement + emission reduction synergy”; Zone III: Deepen “scale intensification + crop rotation for carbon sequestration”; Zone IV: Implement “north–south differentiation + forest and fruit empowerment”; and Zone V: Advance “ecological restoration + structural transformation”.
Author Contributions
We understand that the corresponding author and the first author are the points of contact during the editorial process. They are responsible for communicating progress to other authors, submitting revised manuscripts, and ultimately approving proofs. All authors are as follows: L.T. (first author): conceptualization, data curation, formal analysis, investigation, methodology, software, visualization, and manuscript drafting. M.F. (corresponding author): conceptualization, resources, supervision, validation, and writing—review & editing. K.Z. (third author): conceptualization, data curation, formal analysis, investigation, software, visualization, and writing—review & editing. X.H. (fourth author): conceptualization, methodology, software, supervision, and writing—review & editing. Y.X. (fifth author): conceptualization, methodology, supervision, and writing—review & editing. All authors have read and agreed to the published version of the manuscript.
Funding
This research received no external funding.
Data Availability Statement
The datasets supporting the conclusions of this article are included within the article and its additional files.
Conflicts of Interest
The authors declare that they have no known competing financial interests or personal relationships that could have appeared to influence the work reported in this paper.
Abbreviations
The following abbreviations are used in this manuscript:
| BTH | Beijing–Tianjin–Hebei |
| IPCC | Intergovernmental Panel on Climate Change |
| IREEA | Institute of Agricultural Resources and Ecological Environment, Nanjing Agricultural University |
| IABCAU | College of Agriculture and Biotechnology, China Agricultural University |
| I | Beijing–Tianjin Suburban Agricultural Zone |
| II | Northeast Hebei Agricultural Zone |
| III | Central Hebei Plain Agricultural Zone |
| IV | Taihang Mountain Agricultural Zone |
| V | Daming Agricultural Zone |
Appendix A

Figure A1.
Drivers of the Elastic Changes in Carbon Balance of Agricultural Products.

Figure A2.
Elasticity and Changes in Agricultural Carbon Balance in the Beijing–Tianjin–Hebei region. ((a) the elasticity of carbon emission output technology; (b) the elasticity of carbon sink output technology, (c) the elasticity of net carbon output; (d) the elasticity transition of carbon emission output technology; (e) the elasticity transition of carbon sink output technology; (f) the elasticity transition of net carbon output.)
References
- The Intergovernmental Panel on Climate Change. The IPCC Sixth Assessment Report on Climate Change Impacts. Popul. Dev. Rev. 2022, 48, 629–633. [Google Scholar] [CrossRef]
- Laborde, D.; Mamun, A.; Martin, W.; Piñeiro, V.; Vos, R. Agricultural Subsidies and Global Greenhouse Gas Emissions. Nat. Commun. 2021, 12, 2601. [Google Scholar] [CrossRef] [PubMed]
- Zhang, A.X.; Deng, R.R. Spatial-Temporal Evolution and Influencing Factors of Net Carbon Sink Efficiency in Chinese Cities under the Background of Carbon Neutrality. J. Clean. Prod. 2022, 365, 132547. [Google Scholar] [CrossRef]
- Wang, L.; Lv, T.; Zhang, X.; Hu, H.; Cai, X. Global Research Trends and Gaps in Ecological Compensation Studies from 1990 to 2020: A Scientometric Review. J. Nat. Conserv. 2022, 65, 126097. [Google Scholar] [CrossRef]
- Luo, H. Research on Domestic Agricultural Carbon Source/Sink Effect: Perspectives, Advances and Improvements. Shengtai Xuebao 2022, 42, 832–3841. [Google Scholar]
- Wei, H.; Wu, L.; Yang, D.; Chen, D.; Xiong, L. Spatiotemporal dynamic characteristics and driving impact mechanisms of carbon sources and sinks in Chinese cropland ecosystem. Acta Ecol. Sin. 2025, 45, 7277–7296. [Google Scholar]
- Yuan, R.; Xu, C.; Kong, F. Decoupling Agriculture Pollution and Carbon Reduction from Economic Growth in the Yangtze River Delta, China. PLoS ONE 2023, 18, e0280268. [Google Scholar] [CrossRef]
- Wei, Q.; Xue, L.; Zhang, H.; Chen, P.; Yang, J.; Niu, B. Spatiotemporal Analysis of Carbon Emission Efficiency across Economic Development Stages and Synergistic Emission Reduction in the Beijing-Tianjin-Hebei Region. J. Environ. Manag. 2025, 377, 124609. [Google Scholar] [CrossRef] [PubMed]
- Mu, J.; Wang, J.; Liu, B.; Yang, M. Spatiotemporal Dynamics and Influencing Factors of CO2 Emissions under Regional Collaboration: Evidence from the Beijing-Tianjin-Hebei Region in China. Environ. Pollut. 2024, 357, 124403. [Google Scholar] [CrossRef] [PubMed]
- Li, Z.; Wang, Z.; Wu, W.; Shao, H. The relationship between China’s provincial carbon balance capacity and urbanization under carbon neutrality target. J. Nat. Resour. 2022, 37, 3136–3152. [Google Scholar] [CrossRef]
- Wang, J.; Dong, X.; Qiao, H.; Dong, K. Impact Assessment of Agriculture, Energy and Water on CO2 Emissions in China: Untangling the Differences between Major and Non-Major Grain-Producing Areas. Appl. Econ. 2020, 52, 482–6497. [Google Scholar] [CrossRef]
- Chen, S.; Yang, P.; Zhang, Y.; Dong, W.; Hu, C.; Oenema, O. Responses of Cereal Yields and Soil Carbon Sequestration to Four Long-Term Tillage Practices in the North China Plain. Agronomy 2022, 12, 176. [Google Scholar] [CrossRef]
- Yang, Z.; Zhang, X.; Hu, X.; Zhou, X. Spatial-Temporal Evolution of Agricultural Carbon Balance at Township Scale and Carbon Compensation Zoning: A Case Study of Guangshui City, Hubei Province. Land 2024, 13, 820. [Google Scholar] [CrossRef]
- Wang, Z.; Huang, W.; Wang, H.; Gao, J.; Zhang, R.; Xu, G.; Wang, Z. Research on the Improvement of Carbon Neutrality by Utilizing Agricultural Waste: Based on a Life Cycle Assessment of Biomass Briquette Fuel Heating System. J. Clean. Prod. 2024, 434, 140365. [Google Scholar] [CrossRef]
- Li, J.; Ning, J.; Song, J.; Chen, X. Analysis of the Spatial Mismatch Pattern of Net Carbon in Agriculture and Its Influencing Factors. Environ. Impact Assess. Rev. 2024, 106, 107522. [Google Scholar] [CrossRef]
- Zhou, P.; Li, X.; Lai, J.; Guo, X.; Wu, J. Straw Amendment Induced Contrasting Net Carbon Balance in Subtropical Paddy and Adjacent Upland Soils. Appl. Soil Ecol. 2025, 207, 105959. [Google Scholar] [CrossRef]
- Ma, Y.; Chen, H.; Yang, M.; Aihemaiti, G.; Lu, W.; Zhao, R. Ecological Compensation Based on Multiscale Ecosystem Carbon Sequestration Service Flow. J. Environ. Manag. 2024, 372, 123396. [Google Scholar] [CrossRef]
- Zhang, Z.; Cui, Y.; Wang, L.; Sun, X.; Gao, Y. Determining the Ecological Compensation Standards Based on Willingness to Accept (WTA) for Intensive Agricultural Production Areas: A Case in China. Appl. Geogr. 2023, 158, 103051. [Google Scholar] [CrossRef]
- Chen, B.; Xu, X.; Wang, S.; Yang, T.; Liu, Z.; Falk, S. Carbon Dioxide Fertilization Enhanced Carbon Sink Offset by Climate Change and Land Use in Amazonia on a Centennial Scale. Sci. Total Environ. 2024, 955, 176903. [Google Scholar] [CrossRef] [PubMed]
- Shen, R.; Yang, Y.; Xu, J.; Wang, L.; Jiang, Y.; Xie, Y.; Wang, Y. Research on Carbon Compensation Zoning Guided by Major Function Zones: A Case Study of the Yangtze River Delta Region. Ecol. Indic. 2025, 173, 113383. [Google Scholar] [CrossRef]
- Wu, D.; Zhang, Z.; Liu, D.; Zhang, L.; Li, M.; Khan, M.I.; Li, T.; Cui, S. Calculation and Analysis of Agricultural Carbon Emission Efficiency Considering Water–Energy–Food Pressure: Modeling and Application. Sci. Total Environ. 2024, 907, 167819. [Google Scholar] [CrossRef]
- Meng, Q.; Li, C. Spatiotemporal Evolutionary Patterns and Influencing Factors of Urban Carbon Emissions in China. Ecol. Indic. 2025, 176, 113665. [Google Scholar] [CrossRef]
- Zhang, X.; Liu, B.; Zhao, Y.; Liu, X.; Pan, K.; Zhang, Y. Research on the Uncertainty Analysis of the Carbon Peak and Pivotal Influencing Factors for Provincial Agriculture in China. Ecol. Model. 2025, 509, 111266. [Google Scholar] [CrossRef]
- Huan, H.; Wang, L.; Zhang, Y. Regional Differences, Convergence Characteristics, and Carbon Peaking Prediction of Agricultural Carbon Emissions in China. Environ. Pollut. 2025, 366, 125477. [Google Scholar] [CrossRef] [PubMed]
- Han, X.; Yu, J.; Xia, Y.; Wang, J. Spatiotemporal Characteristics of Carbon Emissions in Energy-Enriched Areas and the Evolution of Regional Types. Energy Rep. 2021, 7, 7224–7237. [Google Scholar] [CrossRef]
- Liu, X.; Jin, X.; Luo, X.; Zhou, Y. Quantifying the Spatiotemporal Dynamics and Impact Factors of China’s County-Level Carbon Emissions Using ESTDA and Spatial Econometric Models. J. Clean. Prod. 2023, 410, 137203. [Google Scholar] [CrossRef]
- Yu, Z.; Zhang, F.; Gao, C.; Mangi, E.; Ali, C. The Potential for Bioenergy Generated on Marginal Land to Offset Agricultural Greenhouse Gas Emissions in China. Renew. Sustain. Energy Rev. 2024, 189, 113924. [Google Scholar] [CrossRef]
- Wang, L.; Shi, P.; Luo, J.; Yin, J.; Cheng, F.; Shi, J.; Wang, Z. Region-County Characteristics of Spatiotemporal Dynamic Evolution and Influencing Factors on Agricultural Net Carbon Sink in Hexi Region of Gansu Province. Ecol. Indic. 2024, 169, 112817. [Google Scholar] [CrossRef]
- Yu, X.; Wu, Z.; Zheng, H.; Li, M.; Tan, T. Corrigendum to “How Urban Agglomeration Improve the Emission Efficiency? A Spatial Econometric Analysis of the Yangtze River Delta Urban Agglomeration in China”. J. Environ. Manag. 2020, 263, 110399. [Google Scholar] [CrossRef]
- Shi, K.; Yu, B.; Zhou, Y.; Chen, Y.; Yang, C.; Chen, Z.; Wu, J. Spatiotemporal Variations of CO2 Emissions and Their Impact Factors in China: A Comparative Analysis between the Provincial and Prefectural Levels. Appl. Energy 2019, 233–234, 170–181. [Google Scholar] [CrossRef]
- Liu, X.; Wei, Y.; Jin, X.; Luo, X.; Zhou, Y. County-Level Carbon Compensation Zoning Based on China’s Major Function-Oriented Zones. J. Environ. Manag. 2024, 367, 121988. [Google Scholar] [CrossRef]
- Zhang, L.; Mu, R.; Zhan, Y.; Yu, J.; Liu, L.; Yu, Y.; Zhang, J. Digital Economy, Energy Efficiency, and Carbon Emissions: Evidence from Provincial Panel Data in China. Sci. Total Environ. 2022, 852, 158403. [Google Scholar] [CrossRef]
- Pelaracci, S.; Goglio, P.; Moakes, S.; Knudsen, M.T.; Van Mierlo, K.; Adams, N.; Maxime, F.; Maresca, A.; Romero-Huelva, M.; Waqas, M.A.; et al. Harmonizing Soil Carbon Simulation Models, Emission Factors and Direct Measurements Used in LCA of Agricultural Systems. Agric. Syst. 2025, 227, 104361. [Google Scholar] [CrossRef]
- Li, X.; Chen, B.; Liu, H.; Xu, M.; Yang, H. Characteristics of Agricultural Carbon Emissions in Arid Zones, Drivers and Decoupling Effects: Evidence from Xinjiang, China. Energy 2025, 328, 136373. [Google Scholar] [CrossRef]
- Liu, H.; Liu, Y.; Zhang, G. Spatial-Temporal Distribution Pattern and Driving Factors of Agricultural Carbon Sinks in Beijing-Tianjin-Hebei Region from the Perspective of Carbon Neutrality. J. Agric. Sci. 2024, 162, 1–18. [Google Scholar] [CrossRef]
- Jin, M.; Feng, Y.; Wang, S.; Chen, N.; Cao, F. Can the Development of the Rural Digital Economy Reduce Agricultural Carbon Emissions? A Spatiotemporal Empirical Study Based on China’s Provinces. Sci. Total Environ. 2024, 939, 173437. [Google Scholar] [CrossRef]
- Wang, Y.; Li, W.; Li, G.; Tan, S. Assessing the Impact of Regional Coordinated Development on a Low-Carbon Future: Evidence from the Beijing-Tianjin-Hebei Coordinated Development Strategy. J. Clean. Prod. 2024, 481, 144140. [Google Scholar] [CrossRef]
- Wei, Y.M.; Chen, K.; Kang, J.N.; Chen, W.; Wang, X.Y.; Zhang, X. Policy and Management of Carbon Peaking and Carbon Neutrality: A Literature Review. Engineering 2022, 14, 52–63. [Google Scholar] [CrossRef]
- Xu, R.; Zhang, Z. Exploring the Carbon Rebound Effect of Agriculture and Policy Response: Lessons from Zero Growth of Fertiliser Action. Environ. Res. 2025, 285, 122455. [Google Scholar] [CrossRef] [PubMed]
- Fang, F. Research of spatial and temporal pattern of agricultural production efficiency and its convergence in Beijing-Tianjin-Hebei Region. World Reg. Stud. 2019, 28, 130–140. [Google Scholar]
- Yang, J. Huang Xin the 30 m Annual Land Cover Datasets and Its Dynamics in China from 1985 to 2023. Earth Syst. Sci. Data 2024, 13, 3907–3925. [Google Scholar] [CrossRef]
- Pearce, J.K.; Hofmann, H. Potential Methane Emissions from Aquifer and Coal Seam Gas Groundwater Extraction: Effect of Open and Closed Sampling Methods and New Emission Factors. J. Hydrol. 2025, 658, 133228. [Google Scholar] [CrossRef]
- Mantoam, E.J.; Angnes, G.; Mekonnen, M.M.; Romanelli, T.L. Energy, Carbon and Water Footprints on Agricultural Machinery. Biosyst. Eng. 2020, 198, 304–322. [Google Scholar] [CrossRef]
- Liu, Y.; Liu, H.B. Characteristics, influence factors, and prediction of agricultural carbon emissions in Shandong Province. Chin. J. Eco-Agric. 2022, 30, 558–569. [Google Scholar]
- Wang, L.; Bai, Y.; Wang, J.; Qin, F.; Liu, C.; Zhou, Z.; Jiao, X. A Transferable Learning Classification Model and Carbon Sequestration Estimation of Crops in Farmland Ecosystem. Remote Sens. 2022, 14, 5216. [Google Scholar] [CrossRef]
- Tian, Y.; Zhang, J.B. Regional Differentiation Research on Net Carbon Effect of Agricultural Production in China. J. Nat. Resour. 2013, 28, 1298–1309. [Google Scholar]
- Cao, Z.H.; Qin, S.; Hao, J.M. Spatio-Temporal Evolution and Agglomer-Ation Characteristics of Agricultural Production Carbon Sink in Henan Province. Chin. J. Eco-Agric. 2018, 26, 1283–1290. [Google Scholar]
- Han, Z.Y.; Meng, Y.L.; Xu, J.; Wu, Y.; Zhou, Z.G. Temporal and Spatial Dif- Ference in Carbon Footprint of Regional Farmland Ecosystem—Taking Jiangsu Province as a Case. J. Agro-Environ. Sci. 2012, 31, 1034–1041. [Google Scholar]
- Luo, J.; Zhao, Z.; Pang, J. Spatiotemporal Characteristics and Dynamic Prediction of Agricultural Carbon Compensation Potential in the Middle and Lower Reaches of the Yellow River Basin. Environ. Sci. Pollut. Res. 2025, 32, 1903–1917. [Google Scholar] [CrossRef]
- Yan, K.; Tang, D.T.; Gan, T.Q. Quantitative Evaluation and Dynamic Evolution of the Synergistic Effect of Agricultural Pollution and Carbon Reduction in China:An Analysis Based on Marginal Abatement Cost. CRE 2024, 9, 22–41. [Google Scholar]
- Hirth, L.; Khanna, T.M.; Ruhnau, O. How Aggregate Electricity Demand Responds to Hourly Wholesale Price Fluctuations. Energy Econ. 2024, 135, 107652. [Google Scholar] [CrossRef]
- Brown, T.; Neumann, F.; Riepin, I. Price Formation without Fuel Costs: The Interaction of Demand Elasticity with Storage Bidding. Energy Econ. 2025, 147, 108483. [Google Scholar] [CrossRef]
- Li, R.; Li, L.; Wang, Q. The Impact of Energy Efficiency on Carbon Emissions: Evidence from the Transportation Sector in Chinese 30 Provinces. Sustain. Cities Soc. 2022, 82, 103880. [Google Scholar] [CrossRef]
- Liu, Q.; Wu, S.; Lei, Y.; Li, S.; Li, L. Exploring Spatial Characteristics of City-Level CO2 Emissions in China and Their Influencing Factors from Global and Local Perspectives. Sci. Total Environ. 2021, 754, 142206. [Google Scholar] [CrossRef]
- Li, Y.; Xue, C.; Chai, C.; Li, W.; Li, N.; Yao, S. Influencing Factors and Spatiotemporal Heterogeneity of Net Carbon Sink of Conservation Tillage: Evidence from China. Environ. Sci. Pollut. Res. 2023, 30, 110913–110930. [Google Scholar] [CrossRef]
- Luo, J.; Huang, M.; Bai, Y. Promoting Green Development of Agriculture Based on Low-Carbon Policies and Green Preferences: An Evolutionary Game Analysis. Environ. Dev. Sustain. 2023, 26, 6443–6470. [Google Scholar] [CrossRef]
- Song, Y.M.; Li, A. Spatiotemporal Differentiation Pattern and Emission Reduction Optimization Path of Carbon Emissions in Beijing-Tianjin-Hebei Region. Soil Water Conserv. China 2024, 44, 408–417. [Google Scholar]
- Zhang, J.T.; Shi, H.; Tian, H.Q.; Lu, F.; Xu, X.Y.; Liu, D.; Gang, C.C.; Fang, S.M.; Qin, X.Y.; Pan, N.Q. Spatial-temporal changes in and influencing mechanisms for cropland soil organic carbon storage in the North China Plain from 1981 to 2019. Acta Ecol. Sin. 2022, 42, 9560–9576. [Google Scholar] [CrossRef]
- Fang, F.; Wang, F.; Shi, Z.L.; Zhen, X.Q.; Shao, Y.H.; Li, X.; Qiu, L. Quantitative Estimation on Straw Nutrient Resources and Emission of Pollutants from Straw Burning in Beijing-Tianjin-Hebei Region. Trans. Chin. Soc. Agric. Eng. 2017, 33, 1–6. [Google Scholar]
- Su, K.; Chen, H.; Gan, C. Spatial Differentiation and Dynamic Evolution of Agricultural Carbon Emissions in Fujian Province of China. Nat. Environ. Pollut. Technol. 2022, 21, 1015–1025. [Google Scholar] [CrossRef]
- Yang, P.; Peng, S.; Benani, N.; Dong, L.; Li, X.; Liu, R.; Mao, G. An Integrated Evaluation on China’s Provincial Carbon Peak and Carbon Neutrality. J. Clean. Prod. 2022, 377, 134497. [Google Scholar] [CrossRef]
- Ma, Y.; Li, J.; Cao, W.; Yin, C.; Huang, L. Projecting the carbon sink potential and contribution of Grain for Green Program in the Beijing-Tianjin-Hebei region. Acta Geogr. Sin. 2024, 79, 732–746. [Google Scholar]
- Burke, T.; Rowland, C.; Whyatt, J.D.; Blackburn, G.A.; Abbatt, J. Achieving National Scale Targets for Carbon Sequestration through Afforestation: Geospatial Assessment of Feasibility and Policy Implications. Environ. Sci. Policy 2021, 124, 279–292. [Google Scholar] [CrossRef]
- Chen, X.; Lin, B. Towards Carbon Neutrality by Implementing Carbon Emissions Trading Scheme: Policy Evaluation in China. Energy Policy 2021, 157, 112510. [Google Scholar] [CrossRef]
- Du, Y.; Liu, H.; Huang, H.; Li, X. The Carbon Emission Reduction Effect of Agricultural Policy—Evidence from China. J. Clean. Prod. 2023, 406, 137005. [Google Scholar] [CrossRef]
- Jia, L.-L.; Sun, Y.; Liu, K.; Yang, Y.; Huang, S.; Yang, J.; Liu, M. Soil Fertility Status of Farmland and Its Change in Different Ecological Region of Hebei Province. Chin. J. Soil. Sci. 2018, 49, 367–376. [Google Scholar]
- Ma, B.; Li, Y.; Zhou, B.; Jian, Y.; Zhang, C.; An, J. The Green Development Mechanism of the Beijing-Tianjin-Hebei Coordinated Development Strategy in China: Novel Evidence of Green Finance. Int. Rev. Econ. Financ. 2025, 98, 103941. [Google Scholar] [CrossRef]
- Miao, J.; Pan, P.; Liu, B.; Yuan, X.; Pan, Z.; Li, L.; Wang, X.; Wang, Y.; Cao, Y.; Zhang, T. Research on Grain Supply and Demand Matching in the Beijing–Tianjin–Hebei Region Based on Ecosystem Service Flows. J. Integr. Agric. 2025; in press. [Google Scholar]
- Xu, M.; Niu, L.; Wang, X.; Zhang, Z. Evolution of Farmland Landscape Fragmentation and Its Driving Factors in the Beijing-Tianjin-Hebei Region. J. Clean. Prod. 2023, 418, 138031. [Google Scholar] [CrossRef]
- Liang, L.; Wang, H.; Huai, H.; Tang, X. Study of the Decoupling Patterns between Agricultural Development and Agricultural Carbon Emissions in Beijing Tianjin Hebei Region from 2000 to 2020. Land 2024, 13, 839. [Google Scholar] [CrossRef]
- Shen, X.; Li, J.; Yin, Y.; Tang, J.; Qian, B.; Lin, X.; Wang, Z. Multi-Objective Optimal Scheduling Considering Low-Carbon Operation of Air Conditioner Load with Dynamic Carbon Emission Factors. Front. Energy Res. 2024, 12, 1360573. [Google Scholar] [CrossRef]
- Huang, Y.; Li, Z.; Shi, M. Prediction of Plant Carbon Sink Potential in Beijing-Tianjin-Hebei Region of China. Environ. Dev. Sustain. 2022, 26, 3529–3556. [Google Scholar] [CrossRef]
- Liu, X.; Xin, L. Spatial and Temporal Evolution and Greenhouse Gas Emissions of China’s Agricultural Plastic Greenhouses. Sci. Total Environ. 2023, 863, 160810. [Google Scholar] [CrossRef] [PubMed]
Disclaimer/Publisher’s Note: The statements, opinions and data contained in all publications are solely those of the individual author(s) and contributor(s) and not of MDPI and/or the editor(s). MDPI and/or the editor(s) disclaim responsibility for any injury to people or property resulting from any ideas, methods, instructions or products referred to in the content. |
© 2025 by the authors. Licensee MDPI, Basel, Switzerland. This article is an open access article distributed under the terms and conditions of the Creative Commons Attribution (CC BY) license (https://creativecommons.org/licenses/by/4.0/).