Article

Mapping Urban Segregation with GeoAI: Street View Perceptions and Socio-Spatial Inequality in Thessaloniki, Greece

by
Aristotelis Vartholomaios
and
Apostolos Lagarias
*
Department of Planning & Regional Development, University of Thessaly, 38334 Volos, Greece
*
Author to whom correspondence should be addressed.
Land 2025, 14(10), 2083; https://doi.org/10.3390/land14102083
Submission received: 14 September 2025 / Revised: 15 October 2025 / Accepted: 16 October 2025 / Published: 18 October 2025
(This article belongs to the Special Issue GeoAI for Urban Sustainability Monitoring and Analysis)

Abstract

This study examines the statistical and spatial alignment between urban place perceptions and the census-based evidence of socio-spatial segregation. We process a large dataset of geotagged images from Mapillary and KartaView with ZenSVI to score six place perception dimensions (safety, liveliness, wealth, beauty, boredom, depression) for the metropolitan area of Thessaloniki, Greece. The socio-economic structure is derived from census indicators and property values using Location Quotients and principal component analysis. We assess alignment through Pearson’s correlation (r) to capture statistical association, and bivariate Moran’s I to test spatial correspondence while accounting for spatial dependence. Results reveal a robust northwest–southeast divide: southeastern and central districts are perceived as safer, livelier, wealthier, and more beautiful, while northwestern and industrial zones score higher on boredom and depression. The historic city center emerges as vibrant and affluent, acting as a key interface between social groups, especially students, the elderly, and migrants. Perceptual dimensions vary in spatial form: safety, beauty, and depression cluster locally, whereas wealth and vibrancy extend over broader sectors. The study demonstrates the combined use of perceptual and socio-economic data for urban analysis and provides a replicable framework for monitoring inequalities and guiding participatory and inclusive planning.

1. Introduction

Socio-spatial segregation remains one of the most pressing challenges in urban studies [1], shaping inequalities, reinforcing socio-economic divides, and influencing the social cohesion of metropolitan regions. Since the 1980s, when urban studies began to explore the interplay between space, power, gender, and inequality [2,3], segregation has occupied a central position in urban geography debates. The spatial organization of cities structures everyday interaction, strategies of surveillance and control, access to resources, and broader life opportunities [4,5], closely tied to questions of spatial justice [6,7]. Segregation can therefore be understood, not only as a spatial outcome of socio-economic differentiation but also as a process through which inequality is reproduced over time [1,8].
Urban manifestations of segregation include residential segregation, homelessness, deprivation, minority discrimination, crime, gentrification, and displacement [9]. Maffini and Maraschin [10] define urban segregation as any form of spatial exclusion within the city, while Knox and Pinch [11] emphasize that spatial differentiation does not necessarily imply segregation. Diversity and clustering must therefore be distinguished from inequality-driven exclusion. Segregation emerges through both macro-level socio-economic restructuring and micro-level residential preferences [5,12], where spatial differentiation is embedded within wider political-economic processes.
Globalization and neoliberal urban policies have further intensified spatial divides by prioritizing market logics over welfare provision [13,14]. Consequently, mapping and analyzing segregation have become long-standing concerns in urban geography, planning, and policy [15,16]. Planning literature stresses that segregation is not only a social condition but also a spatial–structural phenomenon shaped by urban form, infrastructure, and land-use regulation [16].
Traditionally, segregation has been studied through census data and statistical indices [1], focusing on four axes: (1) socio-economic differentiation (income, education, employment, unemployment), (2) demographic differentiation (age, household structure), (3) cultural differentiation (ethnicity, religion, language), and (4) housing conditions (ownership, quality, affordability, overcrowding). Economic inequalities are generally considered the strongest drivers, given their link with housing access [17]. Demographic and cultural markers also shape urban differentiation, whether through voluntary clustering (ethnic enclaves, cultural communities) or involuntary exclusion driven by discrimination and racism [14].
Recent contributions highlight three broad processes behind segregation: (i) ethno-racial discrimination, (ii) structural socio-economic dynamics, and (iii) individual decision-making [18]. Importantly, spatial concentration can also represent voluntary collective strategies, where minority groups cluster to mobilize networks and resources. For example, gentrified mixed-use districts may combine socio-economic diversity with strong interaction, while ethnic enclaves may provide community infrastructures without implying exclusion from wider city life [11]. However, when inequality becomes spatially entrenched and reproduced through socio-political and economic practices, segregation appears in its stricter form.
To measure these dynamics, scholars have developed a variety of quantitative indices. The Segregation Index captures uneven group distribution across spatial units (0 = complete integration, 1 = complete segregation) [2]. The Index of Dissimilarity measures the proportion of a group that would need to relocate for distributions to match a reference group [19,20]. Other approaches combine multiple indices via factor or cluster analysis [21,22], or produce composite deprivation indices [23,24]. Reardon and O’Sullivan [20] propose the dimensions of spatial evenness/clustering and exposure/isolation. Spatial autocorrelation is often tested using Moran’s I and local statistics such as the Location Quotient and Local Moran’s I [24]. These indices, though indispensable, offer static representations, often overlooking the lived perceptions of place.
The integration of perceptual analysis with census-based socio-spatial data represents a step forward in urban studies. Algorithmic street-image analysis, as used in this study, can be seen as a contemporary evolution of classic approaches to spatial perception and urban phenomenology, aiming to interpret how urban space is experienced and valued. Through such methods, visual and perceptual attributes are systematically quantified, offering valuable inputs for urban design and planning. These perspectives resonate with design theories such as Identity by Design and Responsive Environments [25,26] which emphasize how enhancing place identity and perceived quality of urban environments can ultimately contribute to reducing socio-spatial inequalities.
Therefore, recent advances in geospatial data science, Big Data, and GeoAI have expanded the analytical toolkit for understanding urban environments [27,28,29]. Perceptual information derived from street view imagery (SVI) complements traditional socio-economic indicators by adding a qualitative, human-centered dimension to spatial analysis [30,31]. The quantification of visual perception from photographs is now possible through large crowdsourced and labeled SVI datasets and advancements in geospatial artificial intelligence (GeoAI) and computer vision (CV) [32,33].
This study integrates two methodological strands within a common framework: (1) classical statistical analysis of socio-economic data, and (2) automated perception analysis of SVI using pre-trained machine learning models. Rather than claiming causal inference, our aim is comparative: to explore convergence and divergence between conventional and perception-based methods in detecting segregation patterns. Our research questions are:
  • Can perceptual data extracted from SVIs help identify urban socio-spatial segregation?
  • How does big-data geo-analysis enhance understanding of neighborhood qualities at metropolitan scale?
  • To what extent do automated GeoAI methods and traditional geo-spatial analysis statistically and spatially align, and what do these comparisons reveal?
Socio-economic indicators describe objective structural conditions, while perceptual data capture subjective evaluations of the urban environment. These dimensions do not necessarily coincide: disadvantaged areas may appear lively or appealing, whereas affluent districts may evoke boredom or detachment. This study indicates mismatches that are critical for understanding segregation. Our basic assumption is that segregation does not only materialize through unequal distribution of resources but also as a lived and perceived division of urban space [34,35,36,37]. Linking objective and subjective measures therefore allows us to assess whether inequalities are spatially recognized, concealed, or reproduced through collective imagery. This comparative perspective justifies our approach, situating perceptual analysis as a complementary lens for diagnosing the experiential dimensions of socio-spatial segregation.
Mediterranean cities remain underexamined in segregation research, despite mounting evidence that housing deregulation, gentrification pressures and tourism intensification are reshaping urban inequalities [38,39,40]. Recent studies document these shifts: in Marseille, rising concentrations of high-status households in the city center are linked to economic restructuring and liberal urban renewal policies [39]; in Barcelona, estimates for 1947–2011 show increasing spatial segregation associated with the gentrification of high-skill workers [40]. Comparable trends have been identified across Mediterranean Europe [38]. This study focuses on Thessaloniki as a representative Southern European metropolis, where compact urban form and mixed land uses provide a suitable context for perception-based analysis at a neighborhood scale.
The paper is structured as follows: Section 2 reviews theoretical and methodological background, including approaches to quantifying place perception, advances in ML- and AI-based perceptual studies, and existing evidence on socio-spatial dynamics in Thessaloniki. Section 3 outlines the methodology, detailing socio-spatial and perceptual data collection, processing, and statistical validation. Section 4 presents results from both statistical and perception-based analyses, while Section 5 discusses convergence between the two methods and broader methodological implications. Section 6 concludes by summarizing the key findings and suggesting directions for future research.

2. Theoretical and Methodological Background

2.1. The Quantification of Place Perception Studies

Research on the city’s image treats urban space as a field of perception, experience, and meaning. Early work emphasized cognitive and morphological dimensions: Lynch [41] introduced legibility and imageability as foundations for mental maps, Norberg-Schulz [42] argued that place acquires meaning through individual and collective values, and Kostof [43] highlighted the cultural inscription of urban form. At the experiential scale, Cullen [44] described pedestrian experience as a sequential revelation of scenes, Appleyard, Lynch, and Myer [45] examined esthetics from the moving viewpoint, Whyte [46] documented social use of small spaces, and Jacobs [47] stressed the role of street frontages in pedestrian experience. These studies were richly descriptive but remained local and difficult to scale.
From the 1980s onward, perception research incorporated quantitative spatial methods. Hillier and Hanson’s space syntax [4] provided a mathematical link between network configuration, movement, and legibility. Nasar [30] used structured surveys to statistically map residents’ “evaluative images.” With greater computing power, GIS enabled citywide integration of physical form, demographic, and economic data [27,29,48], with Batty [28,49] analyzing urban cognition through digital simulations.
The diffusion of the Internet and social media in the 2000s brought large crowdsourced datasets. Public Participation GIS (PPGIS) and volunteered Geographic Information platforms allowed residents to mark values, risks, amenities and perceptions. Quercia et al. [31] crowdsourced ratings of London street photographs to map pleasant routes, while the “Livehoods” project [50] used Foursquare check-ins to delineate perceptual neighborhoods. Flickr, Twitter, Instagram, and TripAdvisor data have since been mined for esthetic or cultural perceptions [51,52]. These approaches extended, rather than replaced, traditional interviews, enabling perception analysis at metropolitan scale.
This evolution reflects both theoretical shifts and technological enablers. Theoretically, the study of the “image of the city” has moved from individual cognition toward collective patterns and statistical description. Technologically, it has been powered by cheaper computing, ubiquitous mobile devices, and AI: computer vision and machine learning can now process millions of images for meaning. Place perception research has progressed from small-sample qualitative sketches to automated big-data analytics. The challenge now lies not only in scaling but also in ensuring representativeness, interpretability and ethical limits [53,54].

2.2. Perceptual Studies Using ML and AI

Recent reviews provide an overview of how ML/AI have reshaped the study of urban perception. Biljecki and Ito [53] emphasize the versatility of SVI, which has been applied across a wide range of domains. They note that growth in computing power, automation, and coverage of SVI, together with advances in deep learning, has driven a rapid expansion of applications. SVI is often used in conjunction with social media, aerial or satellite imagery, and other geospatial data, providing complementary insights and supporting multimodal urban analysis.
Zhang et al. [54] underline both the potential and the limitations of such approaches. Models trained in one setting may not transfer reliably to others due to spatial heterogeneity and nonstationarity. Place identity remains inherently personal and context-dependent, which means that algorithmic outputs can only approximate the human sense of place. Both reviews highlight uncertainties and biases in SVI-based methods, including the modifiable areal unit problem, ecological fallacy, temporal changes, and demographic variability in perception.
Recent research illustrates the breadth of ML/AI applications for perceptual studies. Wei et al. [55] mapped landscape perception in Shanghai using deep learning and large SVI datasets, while Abascal et al. [56] combined satellite imagery with citizen-science perception data to model deprivation, demonstrating the potential of multimodal fusion. Danish et al. [57] advanced open citizen-science toolkits with automated image analysis, addressing bias and transparency concerns. Zhang et al. [58] and Zhou [59] explored multimodal pipelines using large language and vision models for predicting safety and attractiveness. Kang and Kang [60] trained CV models to predict perceived safety in Seoul from street views, and De Nadai et al. [33] linked safety perceptions to measures of urban vibrancy using neural networks.
At a global scale, Hou et al. [61] released the “Global Streetscapes” dataset, covering millions of images with predicted perceptual attributes and metadata, enabling comparative cross-city analyses. Collectively, these studies point to a rapidly evolving field that is expanding both methodologically and geographically, while also raising questions about transferability, representativeness, and fairness. The Place Pulse project by Salesses et al. [34] represented a pivotal milestone. Launched in 2013, it developed an online platform to crowdsource pairwise comparisons of Google SVIs, producing normalized perception scores across six subjective dimensions: safety, wealth, beauty, liveliness, boredom, and depression ranging from 1 to 10. It was then found that certain visual cues, such as greenery and presence of pedestrians, strongly influenced perceptions of safety and beauty for the four examined cities.
Dubey et al. [62] developed a scaled-up global dataset using the same crowdsourcing technique. Place Pulse 2.0 expanded to images from 56 cities worldwide. This project amassed 110,988 street-view images and 1.17 million pairwise comparisons from over 81,000 online volunteers between 2013 and 2016. The authors then trained deep convolutional neural networks (CNNs), one for each Place Pulse dimension. A score for the six perceptual dimensions could then be obtained by simply feeding a new street image to the pre-trained models. To the authors’ knowledge Place Pulse 2.0 remains to date the single freely available source of global and validated perception models with an average accuracy of 73.5% [62]. This continues to underpin many subsequent studies, from global datasets such as “Global Streetscapes” [61] to open-source projects like ZenSVI [63].
More recently, Ito et al. [63] released ZenSVI 1.3.0, an open-source Python library that integrates all steps of street image research. ZenSVI can download images en masse from open repositories such as Mapillary and KartaView, preprocess them, apply pre-trained perception models and aggregate results. Its unified pipeline has “streamlined” urban perception mapping by making these complex tasks reproducible for any city. Real-world studies have begun to use these tools. For example, Li et al. [64] showed that images with tall street trees (>2.5 m) are rated significantly safer across different area types. Rossetti et al. [32] carried out a large cross-city analysis and found that street scenes with buildings tend to score higher on liveliness but lower on beauty and safety, whereas the presence of trees and pedestrians boosts both safety and pleasantness.
Recent studies mark a shift from visual-only CNN models to integrative frameworks linking perception with broader urban dynamics. Zhang et al. [65] used XGBoost–SHAP to reveal nonlinear links between built environment and urban vitality, while Le et al. [66] combined visual and auditory data to capture multisensory place perception. These advances move GeoAI research toward holistic, interpretable, and reproducible approaches, aligned with toolkits such as ZenSVI.

2.3. Study Area: Thessaloniki

Thessaloniki, the capital of Central Macedonia and Greece’s second largest metropolitan area, is examined as a characteristic case of southern Mediterranean city, within the Greek context. Generally, Greek cities share the regional morphology of compact fabrics, multi-story apartment blocks, and mixed land uses [67]. Prior research in Athens shows that segregation can appear both horizontally between neighborhoods and “vertically” within apartment buildings [68,69,70]. Leontidou [71,72] argues that late industrialization, informal housing acquisition, familial proximity, and a weak statutory planning system have resulted in limited neighborhood-scale segregation. Similarly, Maloutas [73] notes the complex, often self-reinforcing interactions of socio-spatial inequalities and housing geography in Greek cities.
Thessaloniki is framed by the Gulf of Thermaikos and Mount Hortiatis, producing a compact urban form with mean densities above 60 inhabitants/ha and central sectors reaching 400–600 inhabitants/ha [74] (Figure 1). Its central layout was shaped by Ernest Hébrard’s post-fire 1917 reconstruction plan, which introduced monumental axes, squares, and vistas while preserving areas such as Ano Poli, the Byzantine walls, and historic markets. This plan embodied early 20th-century ambitions of modernization and state-building through urban form [75,76,77]. Rapid housing demand from refugees and internal migrants drove grid-based expansions with limited provision for infrastructure. Post-war growth accelerated through the land-for-flats system (Antiparohi) and successive increases in floor area ratio, fostering vertical densification [78].
Since the 1980s, decentralization has reshaped the metropolitan structure. The central municipality declined from 325,182 residents in 2011 to 317,778 in 2021 (−2.3%), reflecting aging and national demographic crisis, while Neapoli–Sykies and Ampelokipoi–Menemeni also lost population. By contrast, peri-urban municipalities such as Pylaia–Chortiatis, Kalamaria, and Kordelio–Evosmos expanded [79]. Peri-urbanization in Thessaloniki has been driven primarily by middle- and upper-middle-class households, particularly younger age groups employed in the tertiary sector, seeking improved living conditions and residential environments. This suburban relocation has reinforced socio-economic differentiation between the urban core and peripheral areas [80].
Although systematic research on socio-economic stratification in Thessaloniki remains limited [65], the availability of census data at the neighborhood level and open SVI datasets offer a valuable basis for analyzing contemporary processes of socio-spatial differentiation using both traditional indices and GeoAI-based perceptual measures.

3. Methodology and Data

3.1. Workflow Overview

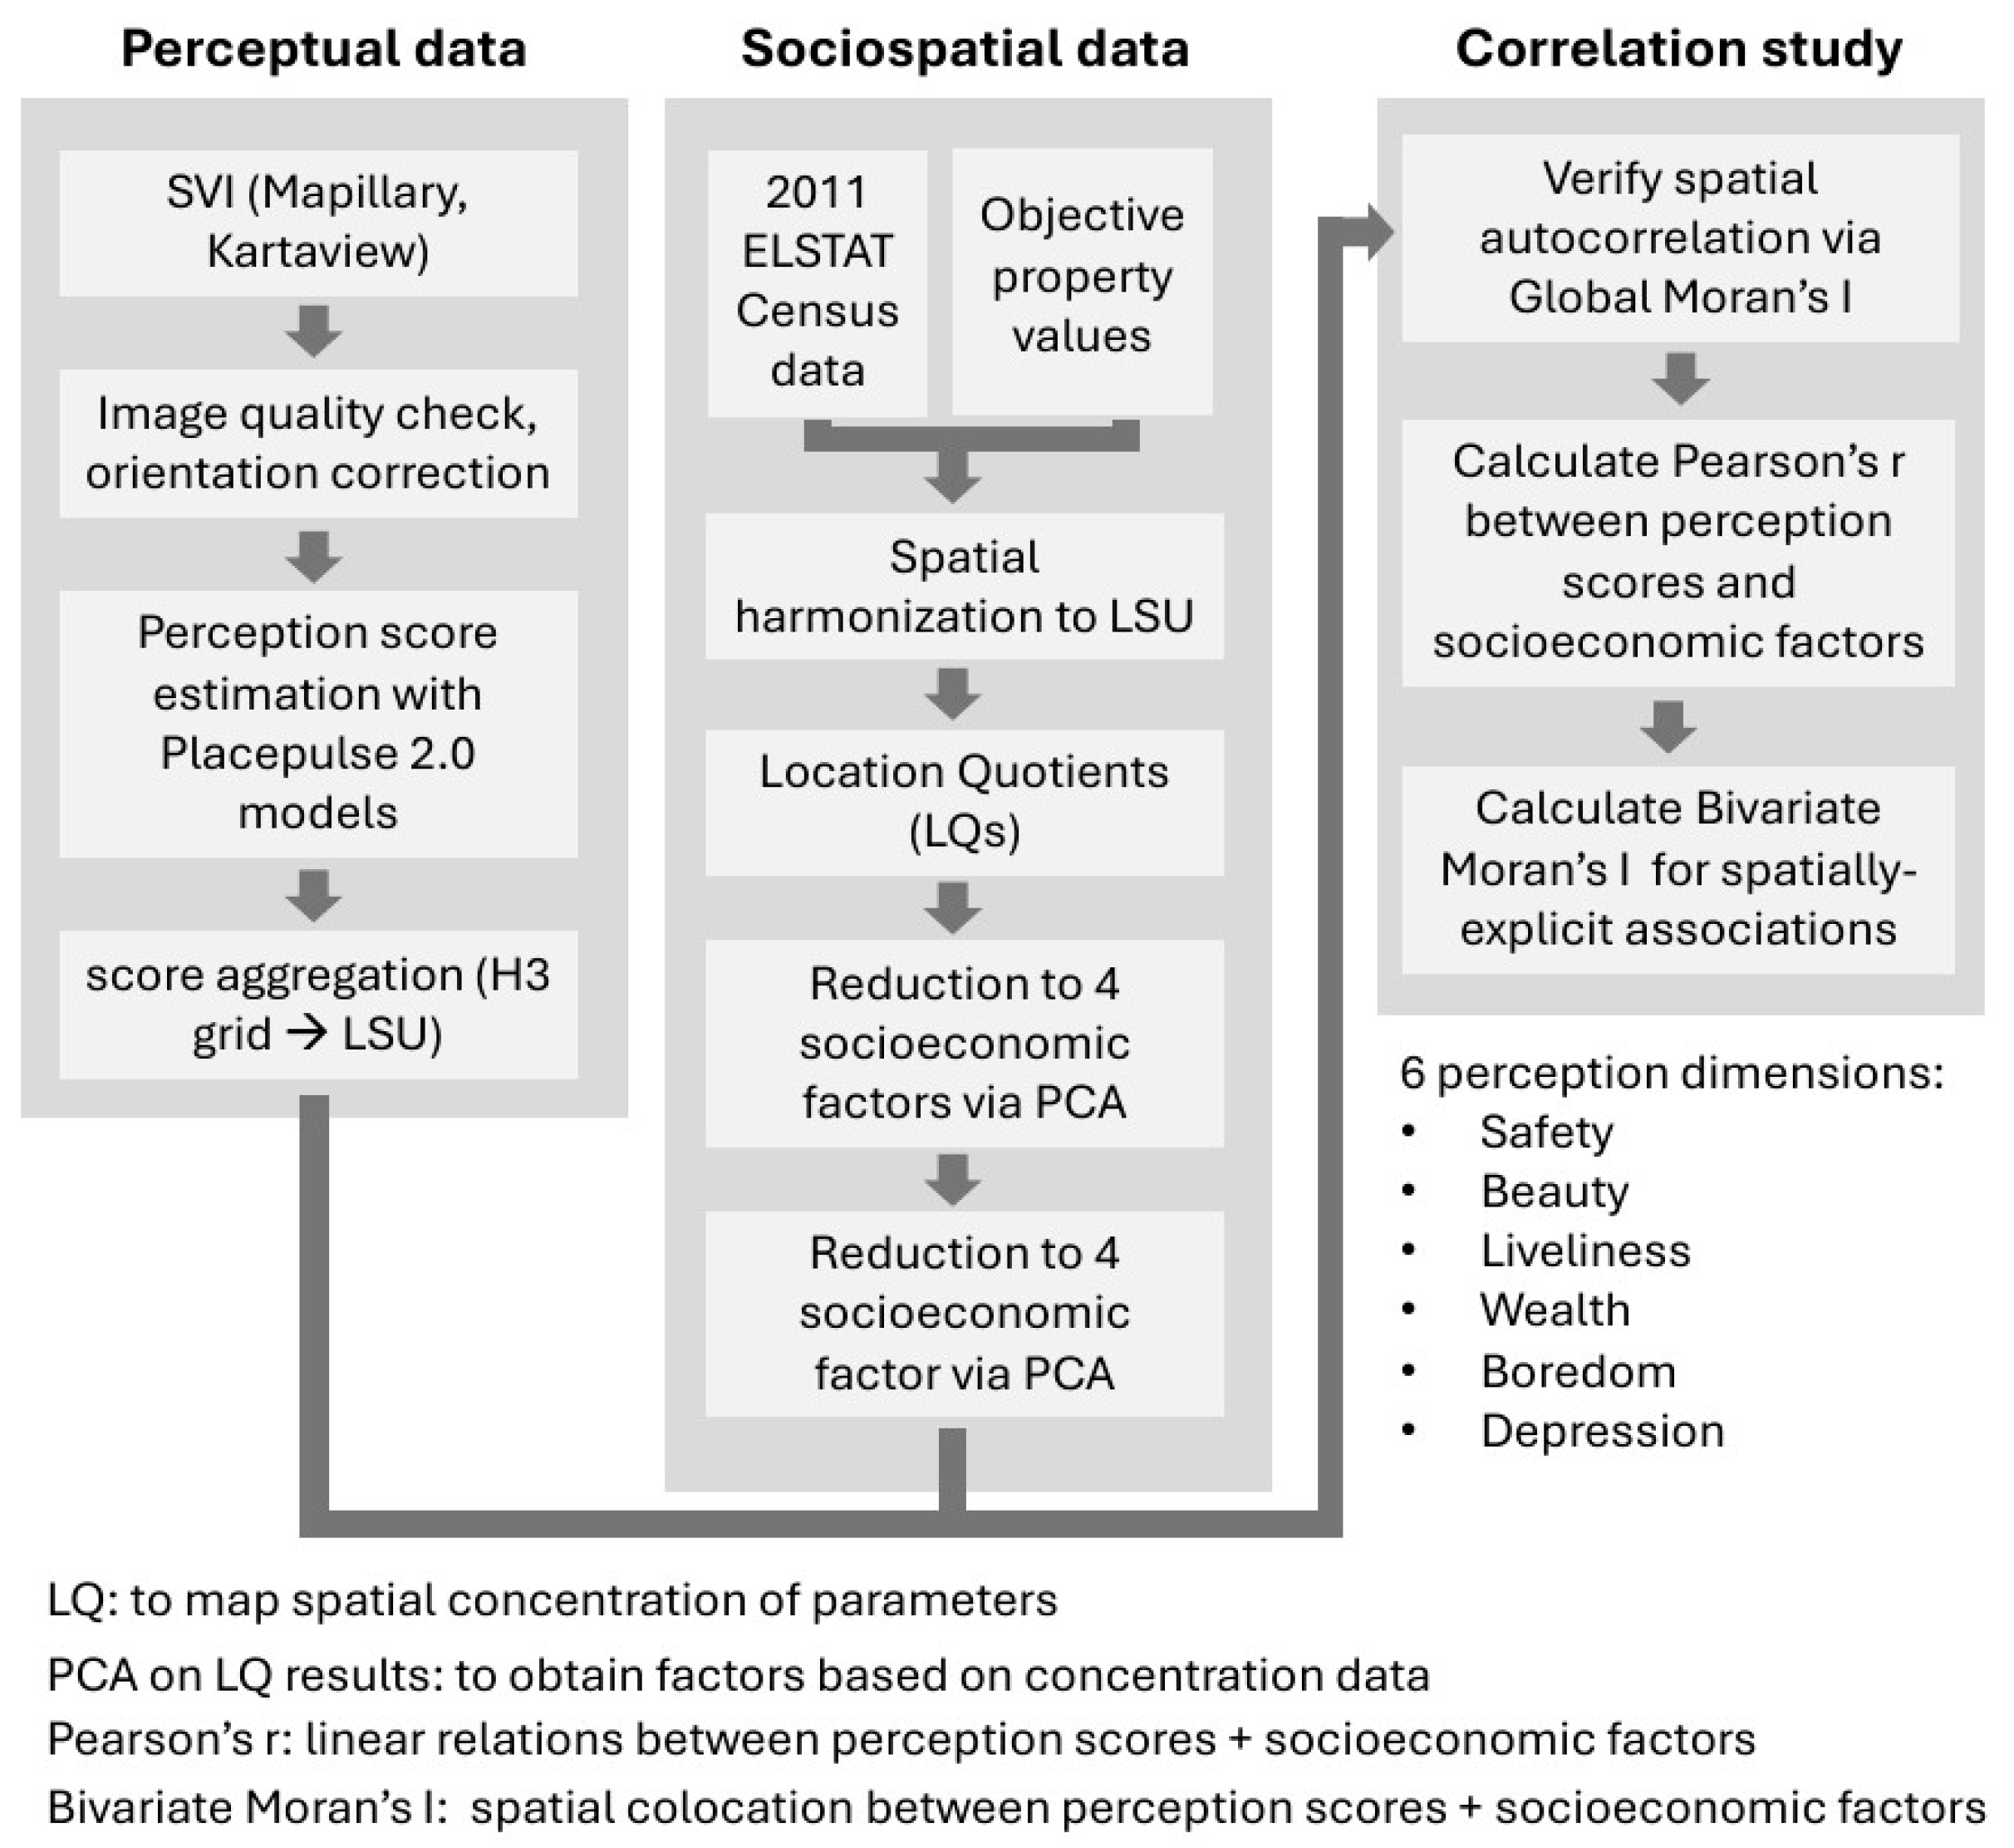
The analysis followed a multi-stage workflow (Figure 2):
  • Step 1. Spatial framework definition: The Thessaloniki metropolitan area was delineated to include municipalities with continuous compact urban tissue and to exclude low-density peri-urban zones. The study adopts the Local Spatial Unit (LSU) used by the Greek census (ELSTAT), ensuring consistency with census neighborhood boundaries.
  • Step 2. Preparation of socio-spatial data: Socio-economic and demographic variables were obtained from the 2011 ELSTAT Census (Panorama database) [74] together with objective property values from the Government Gazette [81]. After spatial harmonization to LSUs, Location Quotients (LQs) were computed to express the local concentration of each variable relative to the metropolitan average. Principal Component Analysis (PCA) [82] was then applied to the LQ set, reducing it to four latent socio-economic factors that summarize census data. PCA was considered necessary in order to reduce the dimensionality of the 21 socio-economic variables, initially selected as particularly relevant to our investigation.
  • Step 3. Preparation of perceptual data: SVI from Mapillary and KartaView was processed with the open-source ZenSVI library. After preprocessing, SVIs were scored using the six pre-trained Place Pulse 2.0 perception models (one per each perception dimension). Perception scores were averaged within an H3 hexagonal grid and then aggregated to the LSU level.
  • Step 4. Statistical and spatial analysis: Global Moran’s I [83] was first computed to verify the presence of spatial autocorrelation in both datasets. Pearson’s r [84] was then used to test linear associations between perception scores and socio-economic factors. Finally, bivariate Moran’s I [83] measured whether high (or low) values of one variable tended to occur near high (or low) values of another—indicating spatial co-location between objective and perceived dimensions of urban inequality.

3.2. Choice of Geographical Unit and Study Area Delineation

The case study area was defined to include the compactly built-up portion of the metropolitan area of Thessaloniki. This includes the central municipality together with the adjacent municipalities that form the majority of continuous urban fabric. From the large suburban municipality of Pylaia–Chortiatis, only the settlements of Pylaia and Panorama were included, whereas peri-urban and mountainous settlements (e.g., Pefka, Exochi, Hortiatis, Fyliro, Asvestochori) were excluded due to their substantially lower population densities and longer commuting distances from the urban core.
Socio-economic and demographic variables were obtained from the Panorama Statistics database, based on official ELSTAT 2011 census data [85]. The 2021 census data are not yet publicly available at this level of detail. Data are reported at the LSU level, whose boundaries are defined by EKKE–ELSTAT [85] and broadly define neighborhoods of varying sizes. Selecting LSU as the spatial units of analysis is appropriate since:
  • Each LSU encompasses 700–1500 inhabitants, corresponding closely to the social and spatial scale at which neighborhood effects and socio-spatial inequalities are traced;
  • LSUs are standardized across Greek cities, allowing consistent comparisons in future research beyond Thessaloniki;
  • Census indicators are directly reported at LSU level, avoiding the need for ad hoc aggregation or disaggregation of data.
A total of 673 LSU polygons were included in the analysis, covering the defined urban agglomeration. For each census variable, location quotients (LQs) were calculated relative to the total and mean values of the LSU features, providing standardized measures of socio-economic differentiation across neighborhoods.

3.3. Socio-Spatial Data Processing

To capture the socio-economic structure of Thessaloniki’s metropolitan area, a set of variables was selected from the 2011 Population and Housing Census and related statistical sources [85]. Variables were grouped into two broad categories:
(i)
Economic variables, reflecting the professional composition of the population, economic sector of employment, unemployment rates, and non-active population, alongside “objective” property values for taxation from the Ministry of Finance [81].
(ii)
Social variables, characterizing selected aspects of residents’ conditions, including ethnic/national origin, housing conditions and amenities (car ownership, internet access, residential space per capita), and educational level (very high—very low, as the scope was to investigate extreme polarizations regarding educational status).
All variables were first collected as simple counts of individuals. These counts were then expressed as percentages relative to the relevant population or household totals. To make results comparable across spatial units of different sizes, Location Quotients (LQs) were calculated for each variable in each local zone. The use of LQs in this analysis is methodologically justified, as (a) they allow for a relative normalization of the observed socio-economic variables across the metropolitan area, facilitating the integration of heterogeneous indicators within the multivariate (PCA) analysis, (b) they weight local proportions against the corresponding metropolitan averages, thus controlling for structural size differences between zones and for variations in total population or employment.
The LQ (1) is defined as:
L Q =   V i r / V r V i n / V n
where V i r is the value of variable i in region r, V r is the total value of all variables in region r, V i n is the value of variable i in the larger area n, and V n is the total value of all variables in the larger area n.
In this study, the reference region n corresponds to the metropolitan zone of Thessaloniki and V i n , V n were estimated using these boundaries. LQ allows the mapping of areas with over- or under-representation of socio-economic groups relative to the metropolitan baseline, supporting both mapping visualization and subsequent statistical analyses. LQ is interpreted as follows:
  • LQ > 1: The variable is more concentrated locally than at the metropolitan level. Particularly strong if LQ > 1.2 [86].
  • LQ < 1: The variable is less concentrated locally than at the metropolitan level. Particularly weak if LQ < 0.8 [86].
Statistical analysis was conducted in SPSS software (IBM SPSS Statistics 20). Descriptive statistics and distributional properties of the LQ variables were evaluated prior to multivariate analysis (Appendix B, Table A1, Table A2, Table A3 and Table A4). Given that several socio-economic variables displayed skewed distributions, PCA was nonetheless applied as a data reduction technique to variables in Table 1, tolerating moderate deviations from normality in line with common scientific practice. Suitability was assessed using the Kaiser–Meyer–Olkin (KMO) statistic [87] and Bartlett’s test of sphericity [88], and variables with low communalities or poor measures of sampling adequacy were excluded from the final solution. Components were extracted according to the eigenvalue > 1 criterion, rotated with Varimax to aid interpretation, and factor scores were calculated using the regression method.

3.4. Perceptual Data Collection and Pre-Processing

We mapped Thessaloniki’s urban image by processing street-level imagery with ZenSVI [63] and applying the six pre-trained Place Pulse 2.0 models [62]. The models were selected because they currently remain the most openly available and validated models trained on over 50 cities worldwide with an acceptable average accuracy (73.5%) (see Section 2.2). In our workflow, internal consistency was further examined by checking that inter-dimension correlations and visual cues (Appendix A) reproduce expected patterns reported in prior literature (see Section 2.3).
We assembled a corpus of more than 126,000 geotagged photographs from Mapillary [89] and 32,000 from KartaView [90]. Photographs were taken from 2009 to 2025 with 67% during summer, 4% in winter and 93% during the day. Almost 60% came from a single contributor who performed an extensive campaign in summer of 2018 with a car-mounted dashcam. Image quality was assessed automatically via the Global Streetscapes pre-trained model [61]. Roughly 20% of the SVI dataset was classified as very poor quality. Poor quality images were retained to preserve coverage in areas with sparse imagery, expecting that aggregation at the LSU level would reduce the influence of individual outliers. Images identified as inverted due to incorrect camera placement by a user were automatically flipped before further processing.
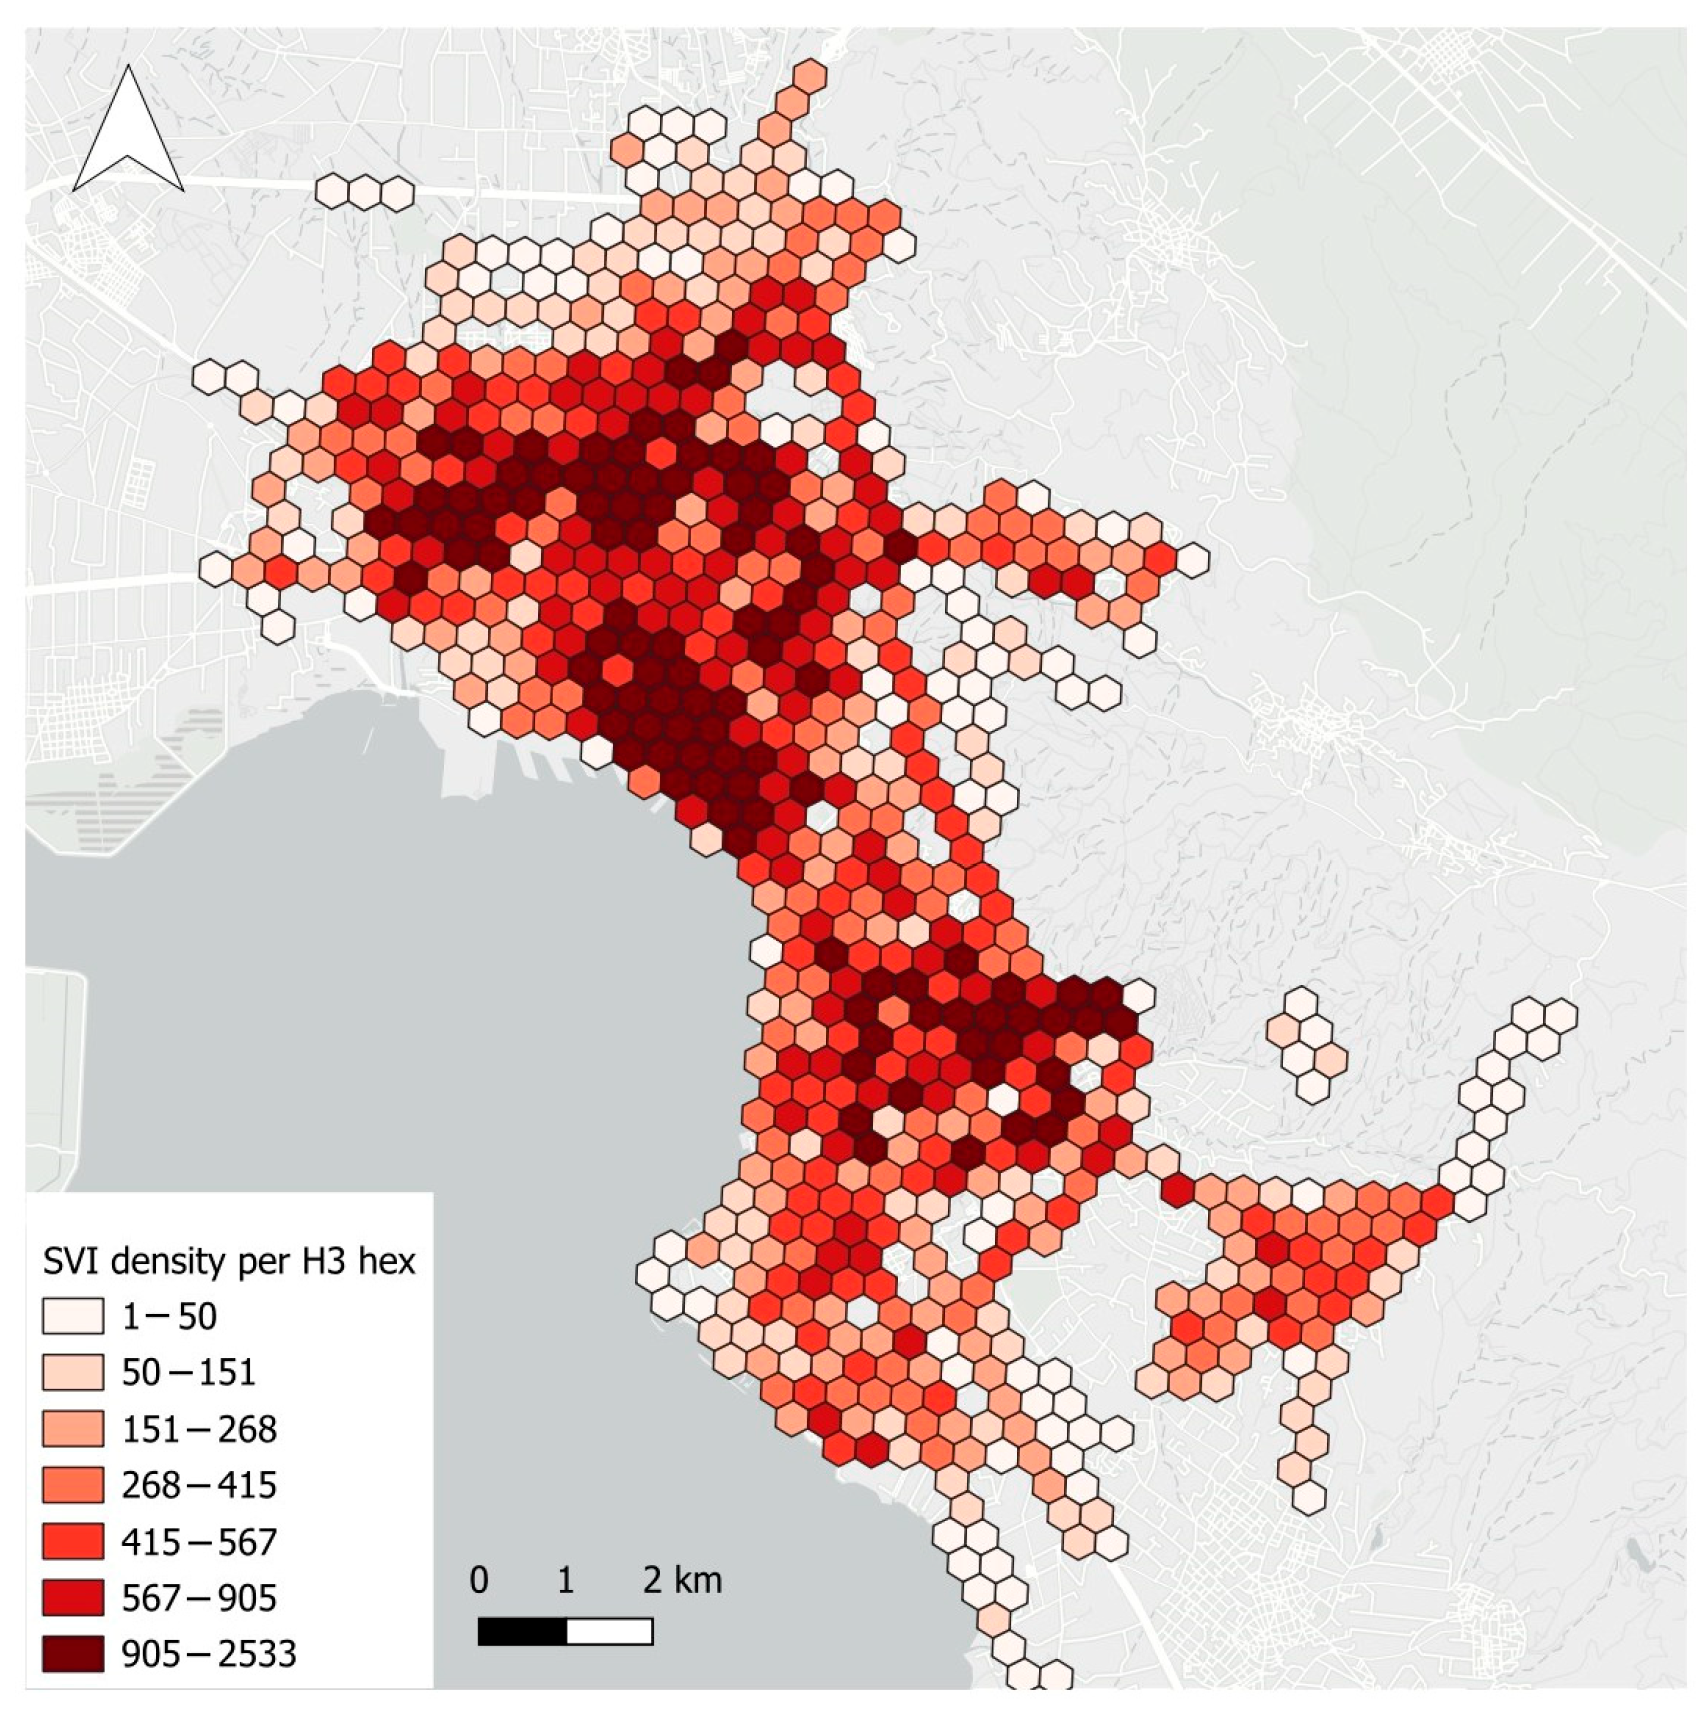
SVIs are concentrated in the city center, local centers, and main urban arteries (Figure 3). To address oversampling along major roads, we aggregated image scores to the H3 hexagonal grid at resolution 9. For each hexagon we computed the mean of all image-level scores per perception dimension, producing six per-cell values. These hexagon means were then inherited to LSU geometries by calculating an area-weighted mean for each perception dimension, where the weight is proportional to the relative coverage of LSU by each overlapping hexagon.

3.5. Statistical Analysis of Socio-Economic and Perceptual Associations

Associations between the reduced socio-economic structure (in the form of PCA factors) and the six perception dimensions were examined in two complementary steps. First, we computed conventional Pearson correlation coefficients (r) with 95% confidence intervals (CI) and applied the Benjamini–Hochberg procedure [91] to control the false discovery rate (Type I error) across multiple correlation tests. These correlations capture linear co-variation at the LSU level but assume spatial independence of observations.
To explicitly account for spatial dependence, we calculated bivariate Moran’s I [83]. A robust Moran’s I procedure was first implemented by increasing neighborhood radii between LSU centroids from 200 m to 600 m at a step of 100 m to assess sensitivity to the neighborhood radius. This was done by calculating Spearman’s ρ rank correlation between Moran’s I values and radii r.
Based on this diagnostic, the selected radius was then applied in bivariate Moran’s I calculations. For each perception–factor pair, bivariate Moran’s I was calculated in both forms (x with the spatial lag of y and vice versa). The coefficient with the larger absolute value was retained as the reported statistic. Significance was evaluated using 1000 random permutations to obtain two-sided confidence intervals, and results were adjusted for multiple testing using the Benjamini–Hochberg procedure within each perception block.
This two-step strategy ensured that (i) direct linear associations were identified, and (ii) spatial clustering of these associations was formally tested to rule out spurious correlations arising from geographic autocorrelation.
Perception scores derive from images captured between 2009 and 2025, whereas socio-economic indicators refer to 2011. Reported associations are therefore cross-sectional but temporally non-contemporaneous, which can attenuate or inflate effect sizes.

4. Results

4.1. Socio-Spatial Analysis Results

As a first step, normality of the 21 socio-economic variables was assessed through descriptive statistics across the 673 spatial units (Appendix B). Overall, most variables show means close to 1.0, reflecting the balancing effect of the Location Quotient. Several variables exhibited high positive skewness and kurtosis, reflecting the presence of extreme values in a few zones. Notable examples include “Directors” (skewness = 2.12; kurtosis = 6.96), “Origin from developed countries” (skewness = 5.92; kurtosis = 45.5), “Origin from less developed countries” (skewness = 3.84; kurtosis = 28.8), and “Very high education” (skewness = 2.05; kurtosis = 6.06). These distributions are asymmetric, indicating localized “pockets” where certain occupational or social groups are highly concentrated, while absent in most other areas (e.g., affluent enclaves with many directors, or immigrant clusters).
Conversely, some variables, such as SOC_LQ1, show negative skewness (−1.33). Many variables (SOC_LQ2, SOC_LQ3, SOC_LQ4) also present zero values in multiple zones, reflecting the absence of specific groups at the neighborhood scale. While presence of zero values complicates normality assumptions, these variables were retained in the analysis to capture spatial differentiation and localized socio-economic extremes. Overall, the dataset contains some non-normal variables with skewed distributions and significant outliers, especially in variables representing directors, foreign origins, and higher education. These deviations are substantively meaningful, reflecting socio-spatial inequalities in Thessaloniki. Two variables (EC_LQ5 and SOC_LQ2) exhibited low communalities and sampling adequacy and were excluded from the final PCA solution.
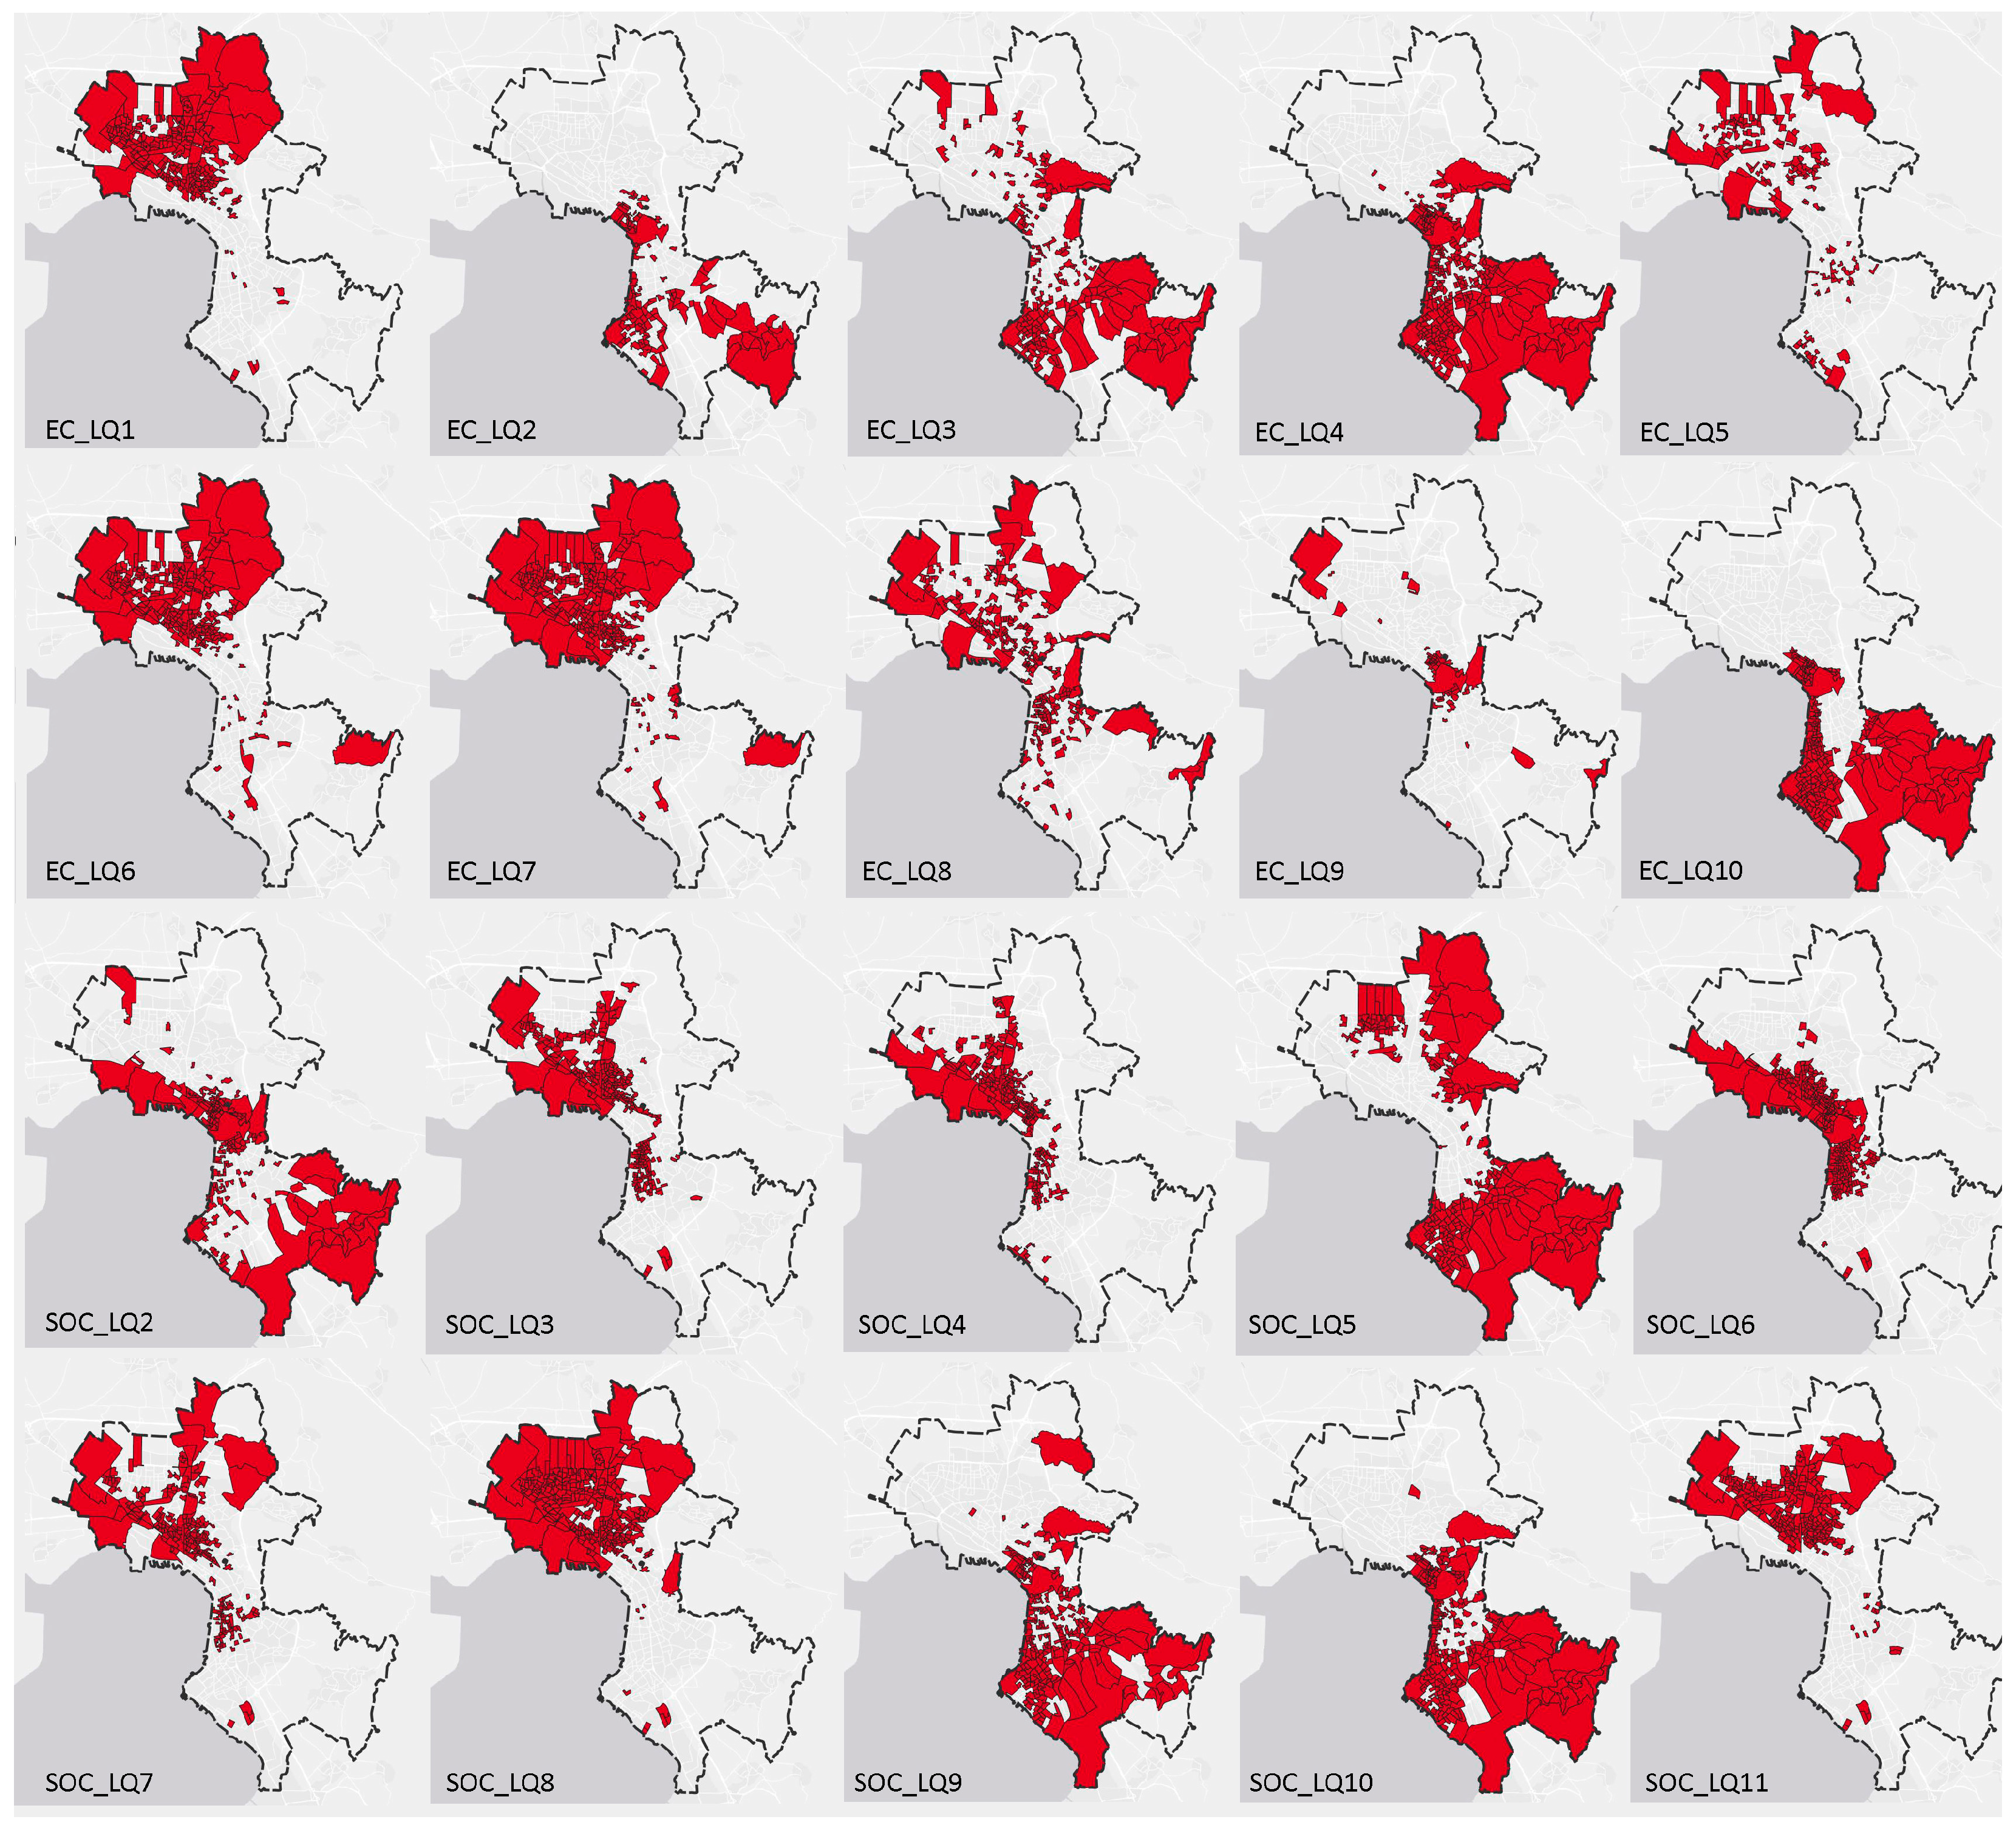
The geographic distribution of areas with strong presence of each corresponding social or economic variable (LQ > 1.1) is plotted in Figure 4. Correlation analysis was also used to explore the structural relationships between economic and social indicators prior to PCA. Expected sectoral contrasts were confirmed, as industrial and commercial activities formed two opposite axes. The industrial sector was positively correlated with technicians and unskilled workers (r ≈ 0.7–0.8), and negatively with self-employed (r = −0.73) and directors (r = −0.41). Conversely, commercial activities were positively associated with markers of affluence, such as car ownership (r = 0.40) and large housing space (r = 0.72), and negatively with lack of internet access (r = −0.64).
Similar patterns emerged for the socio-demographic indicators. The industrial sector was strongly correlated with smaller housing conditions (<20 m2/person; r = 0.86), while the self-employed/technology professionals were positively linked to larger housing (>50 m2/person; r = 0.65). Population of Eastern European origin was positively associated with industrial and technician workers (r = 0.35–0.40), while the Greek majority was negatively correlated with industrial labor (r = −0.32), unemployment (r = −0.35), and deprivation markers such as lack of internet (r = −0.64) and car ownership (r = −0.73).
Further, land values were found to correlate strongly with commercial/public sector employment (r = 0.73), self-employed/technology professions (r = 0.72), and large housing space (r = 0.68). Similarly, higher education was positively associated with commercial/public sector occupations (r = 0.73), directors (r = 0.57), and self-employed/technology professions (r = 0.70). These associations provide further evidence of the alignment between socio-economic privilege, housing conditions, and educational attainment.
Suitability of the variables for PCA was evaluated prior to extraction. The Kaiser–Meyer–Olkin (KMO) measure was 0.842, indicating meritorious sampling adequacy [87]. Bartlett’s test of sphericity was highly significant (χ2 = 17,381, df = 171, p < 0.001), confirming that the correlation matrix is appropriate for factor analysis. Communalities were generally high (>0.70), indicating that extracted components explain a substantial portion of variance. SOC_LQ2 and EC_LQ5 had low communalities (MSA) in preliminary runs and were excluded from the final solution. After Varimax rotation, a four-factor structure was retained (Appendix B), jointly explaining 81.3% of the total variance, with the first two components alone accounting for nearly 70%. Factor scores were estimated using the regression method.
When considering only variables with loading higher than |0.4| in the corresponding factors (Table 2), we reach the following interpretation:
  • Factor F1—Industrial Economy & Deprivation–Affluence Axis: Contrasts areas dominated by industrial and technical occupations with zones of higher socio-economic advantage. Positive loadings: Secondary sector, industrial & technical jobs, small housing, and very low education. Negative loadings: Commerce/public sector), Land values, large housing, very high education. Land value (−0.831) highlights the deprivation-to-affluence continuum.
  • Factor F2—Migrant Concentration and Resource Constraints: Defined by East European origin, Global South origin, no car, no internet. Negative loadings capture the Greek-origin majority with higher car ownership. This suggests migrant concentration with material deprivation, indicative of enclave-type segregation.
  • Factor F3—Occupational Hierarchy: Positive loadings for directors and self-employed/technology. Negative loadings for technicians and manual/unspecialized. This factor separates managerial/technical elites from manual labor.
  • Factor F4—Labor Market Detachment and Mobility Deficits: Captures unemployment and non-active population, with moderate positive loadings for no car and no internet variables. This may represent central-city groups such as retirees and students, who often lack mobility and digital resources, and are economically non-active.
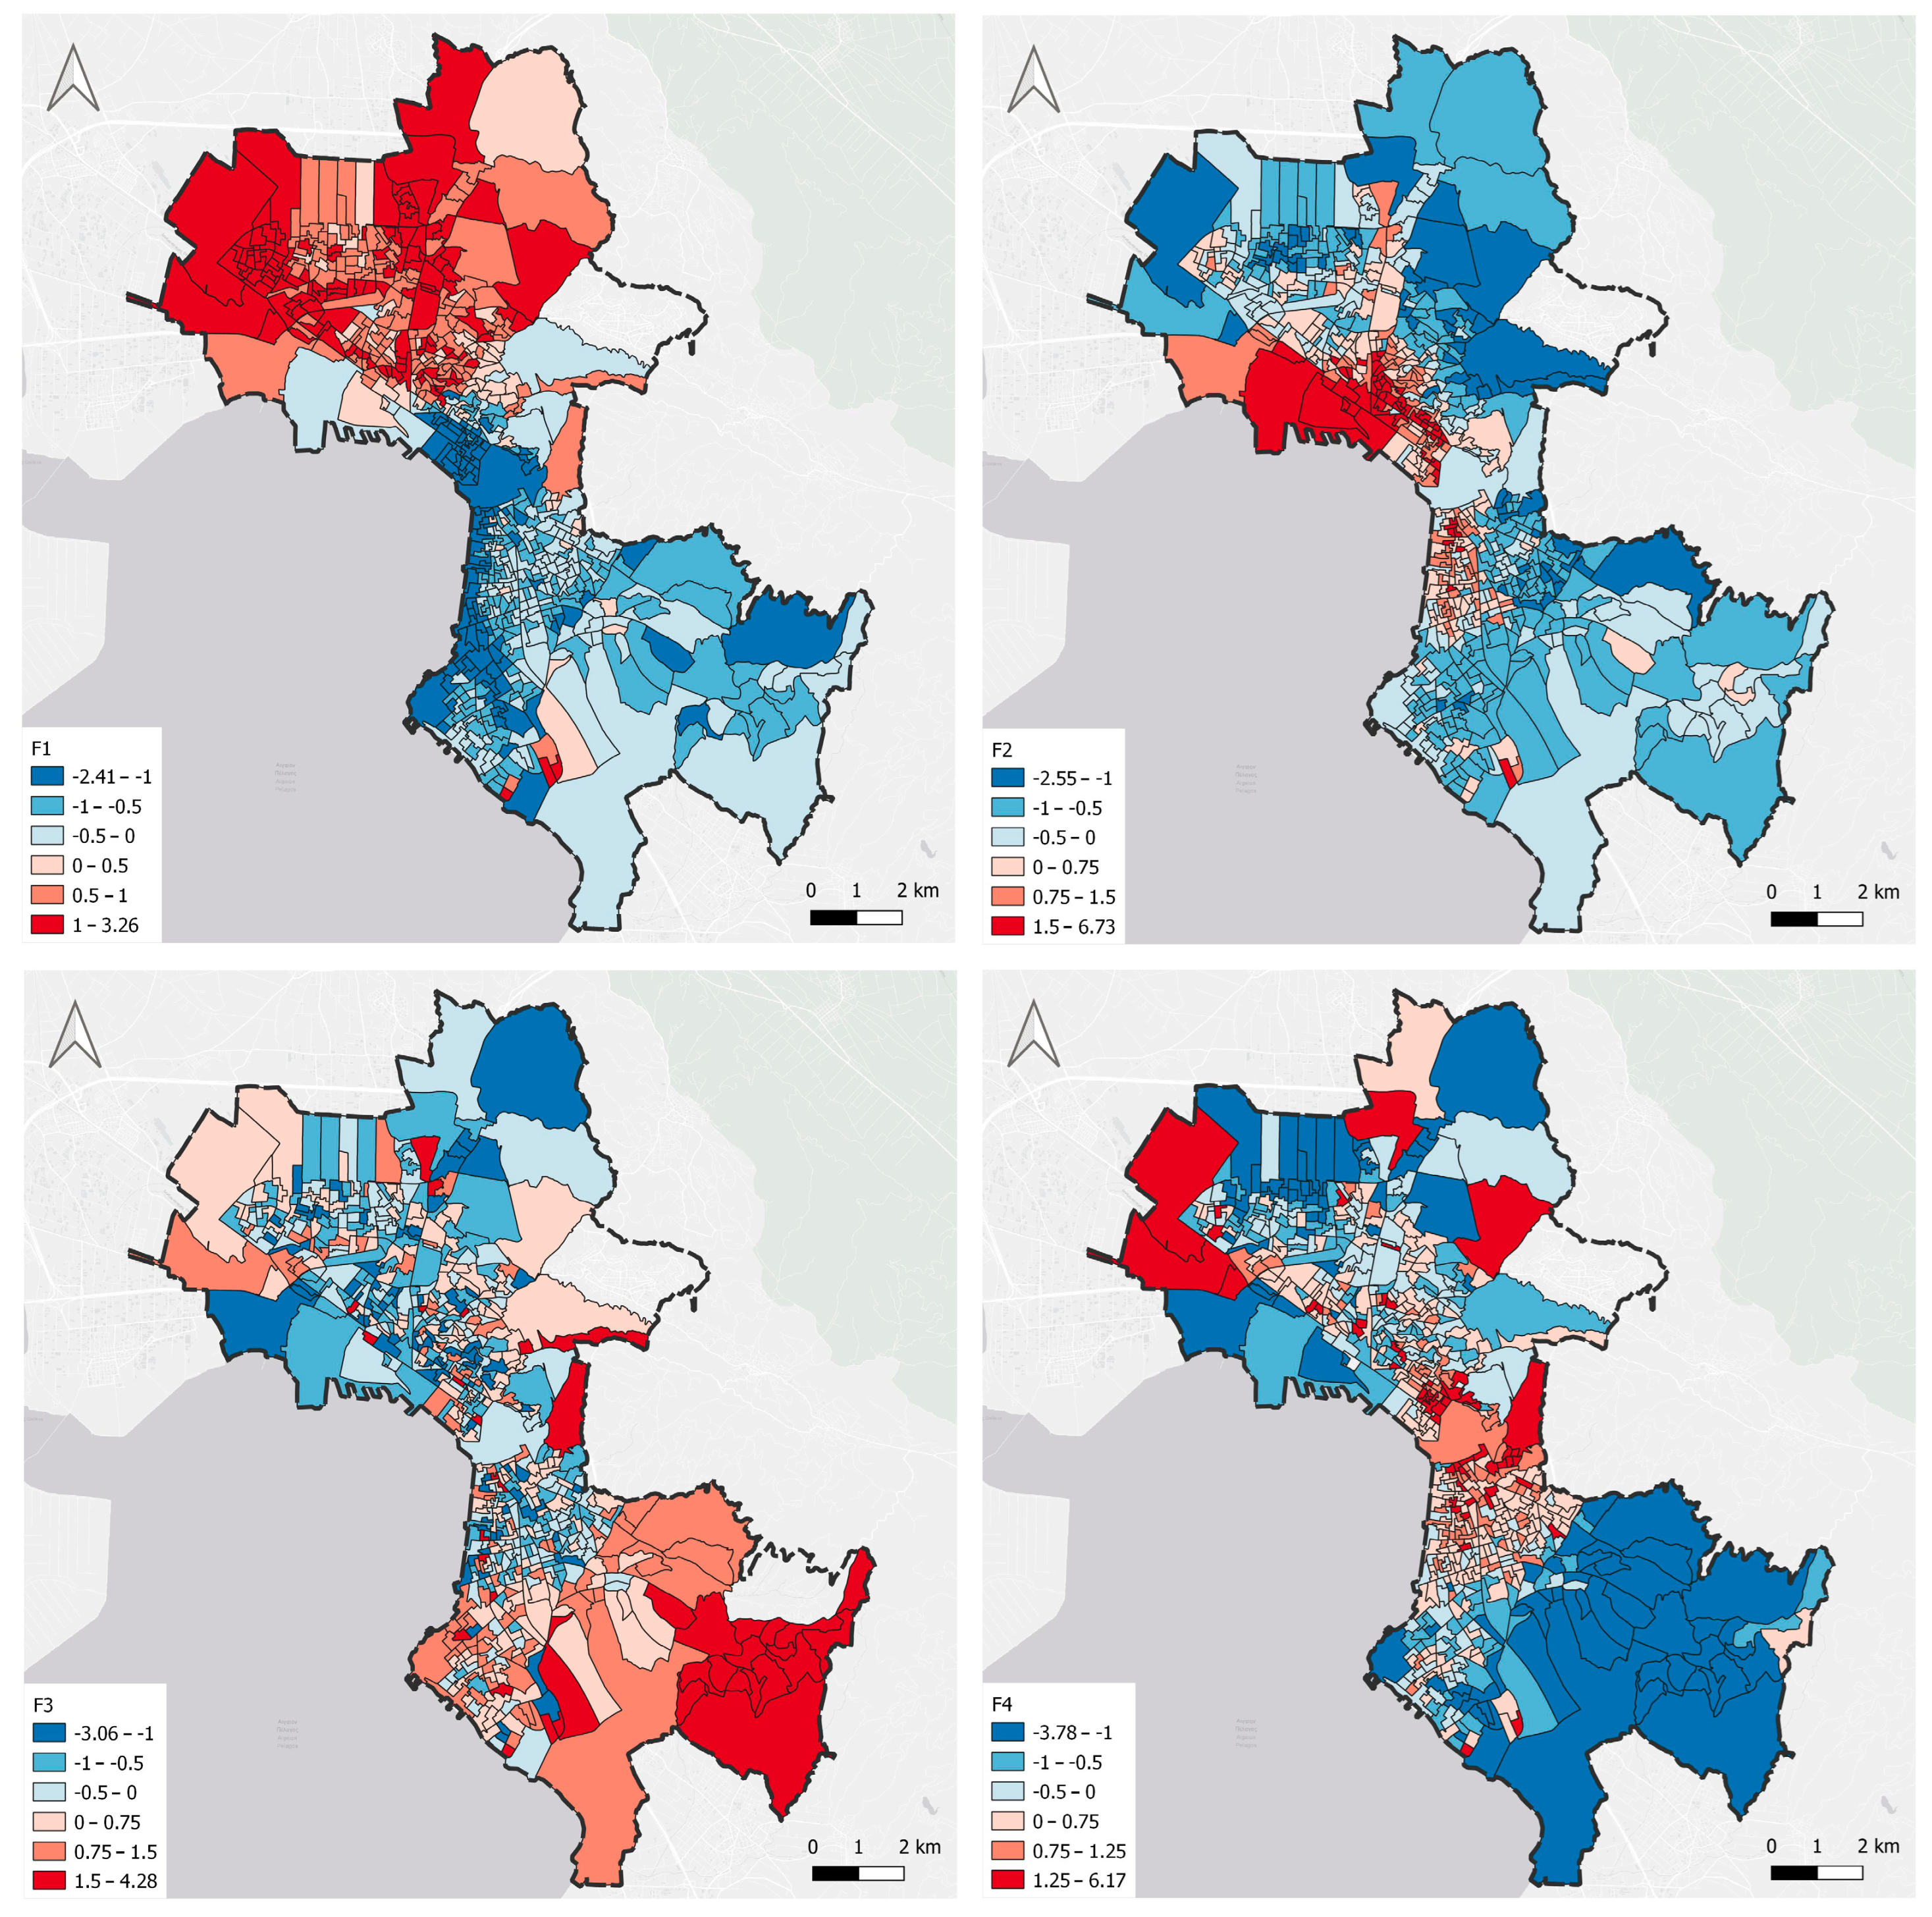
Mapping of the four factors (F1–F4) across the metropolitan area of Thessaloniki reveals distinct socio-spatial patterns that are consistent with the city’s historical development, labor market segmentation, and residential differentiation (Figure 5). Factor 1 displays a stark divide between the working-class northwestern sectors (industrial jobs, small dwellings, low education) and affluent areas extending from central districts to the southern coast (Kalamaria) and into the eastern suburbs (Panorama–Pylaia). Factor 2 shows high scores in the central-western districts around the railway station, port, and Vardaris, as well as older housing areas around Kassandrou and Olympiados Streets and the eastern fringe of the center (Theagenio hospital, Pananastasiou Street), reflecting concentrations of migrant households.
Factor 3 peaks in the eastern suburbs, especially Panorama, with managerial and high-skilled residents, and to a lesser extent in Kalamaria, while the historic center shows mainly negative values with occasional positive pockets. Factor 4 identifies suburban deprivation pockets in the northwestern periphery (Dendropotamos River, Meteora settlement) and concentrations in the historic center and nearby districts (e.g., Saranta Ekklisies), where aging retirees and student populations converge, both typically characterized by limited private mobility.

4.2. Perceptual Analysis Results

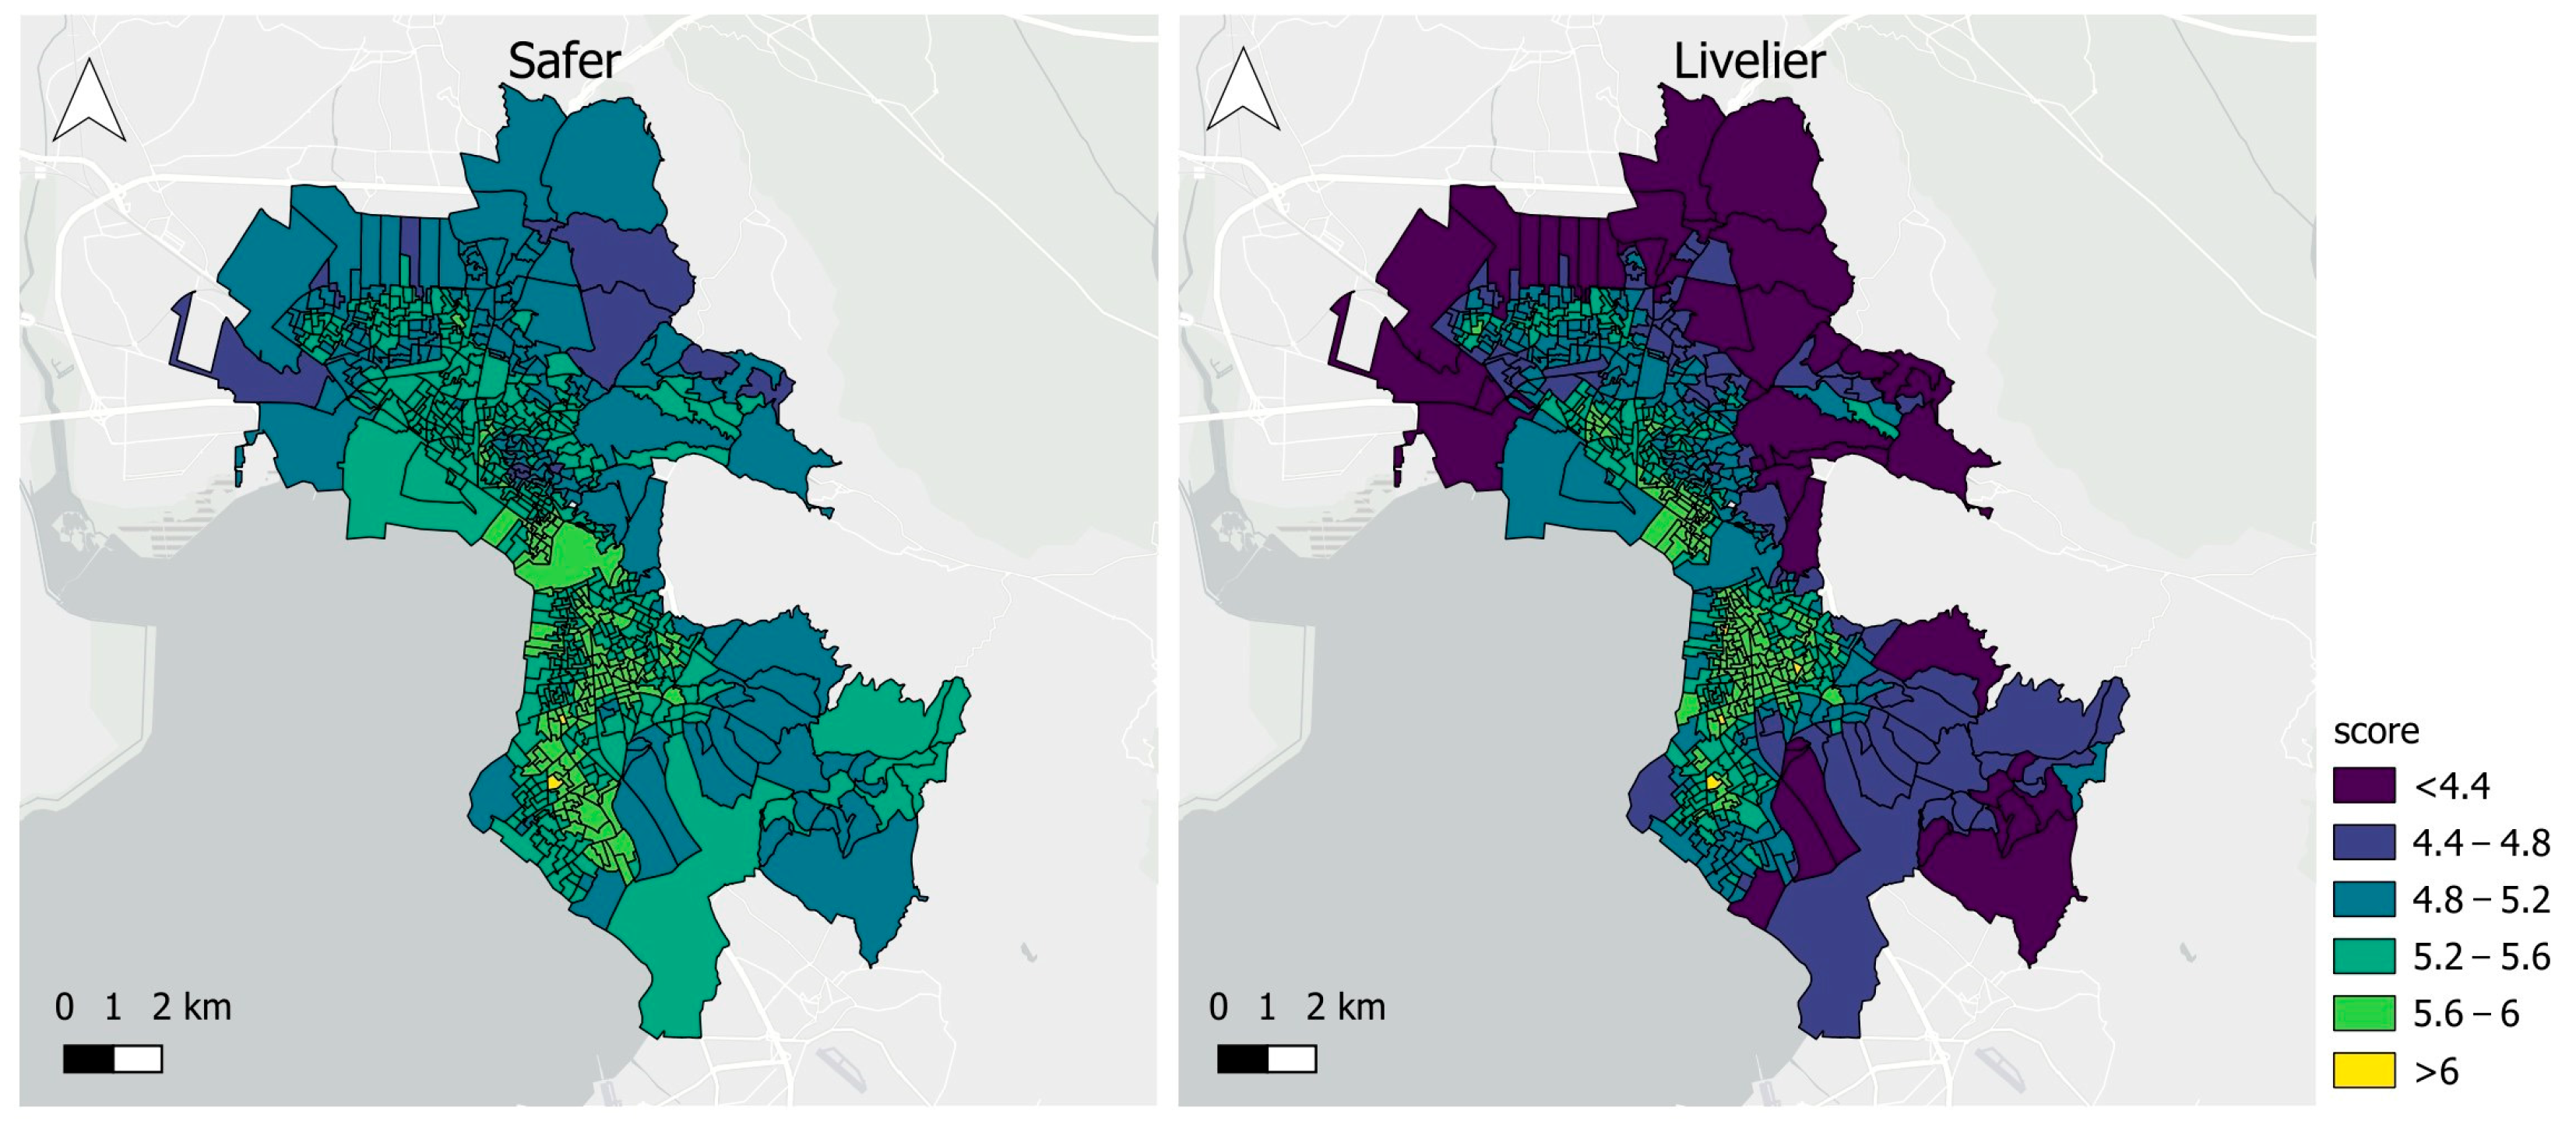
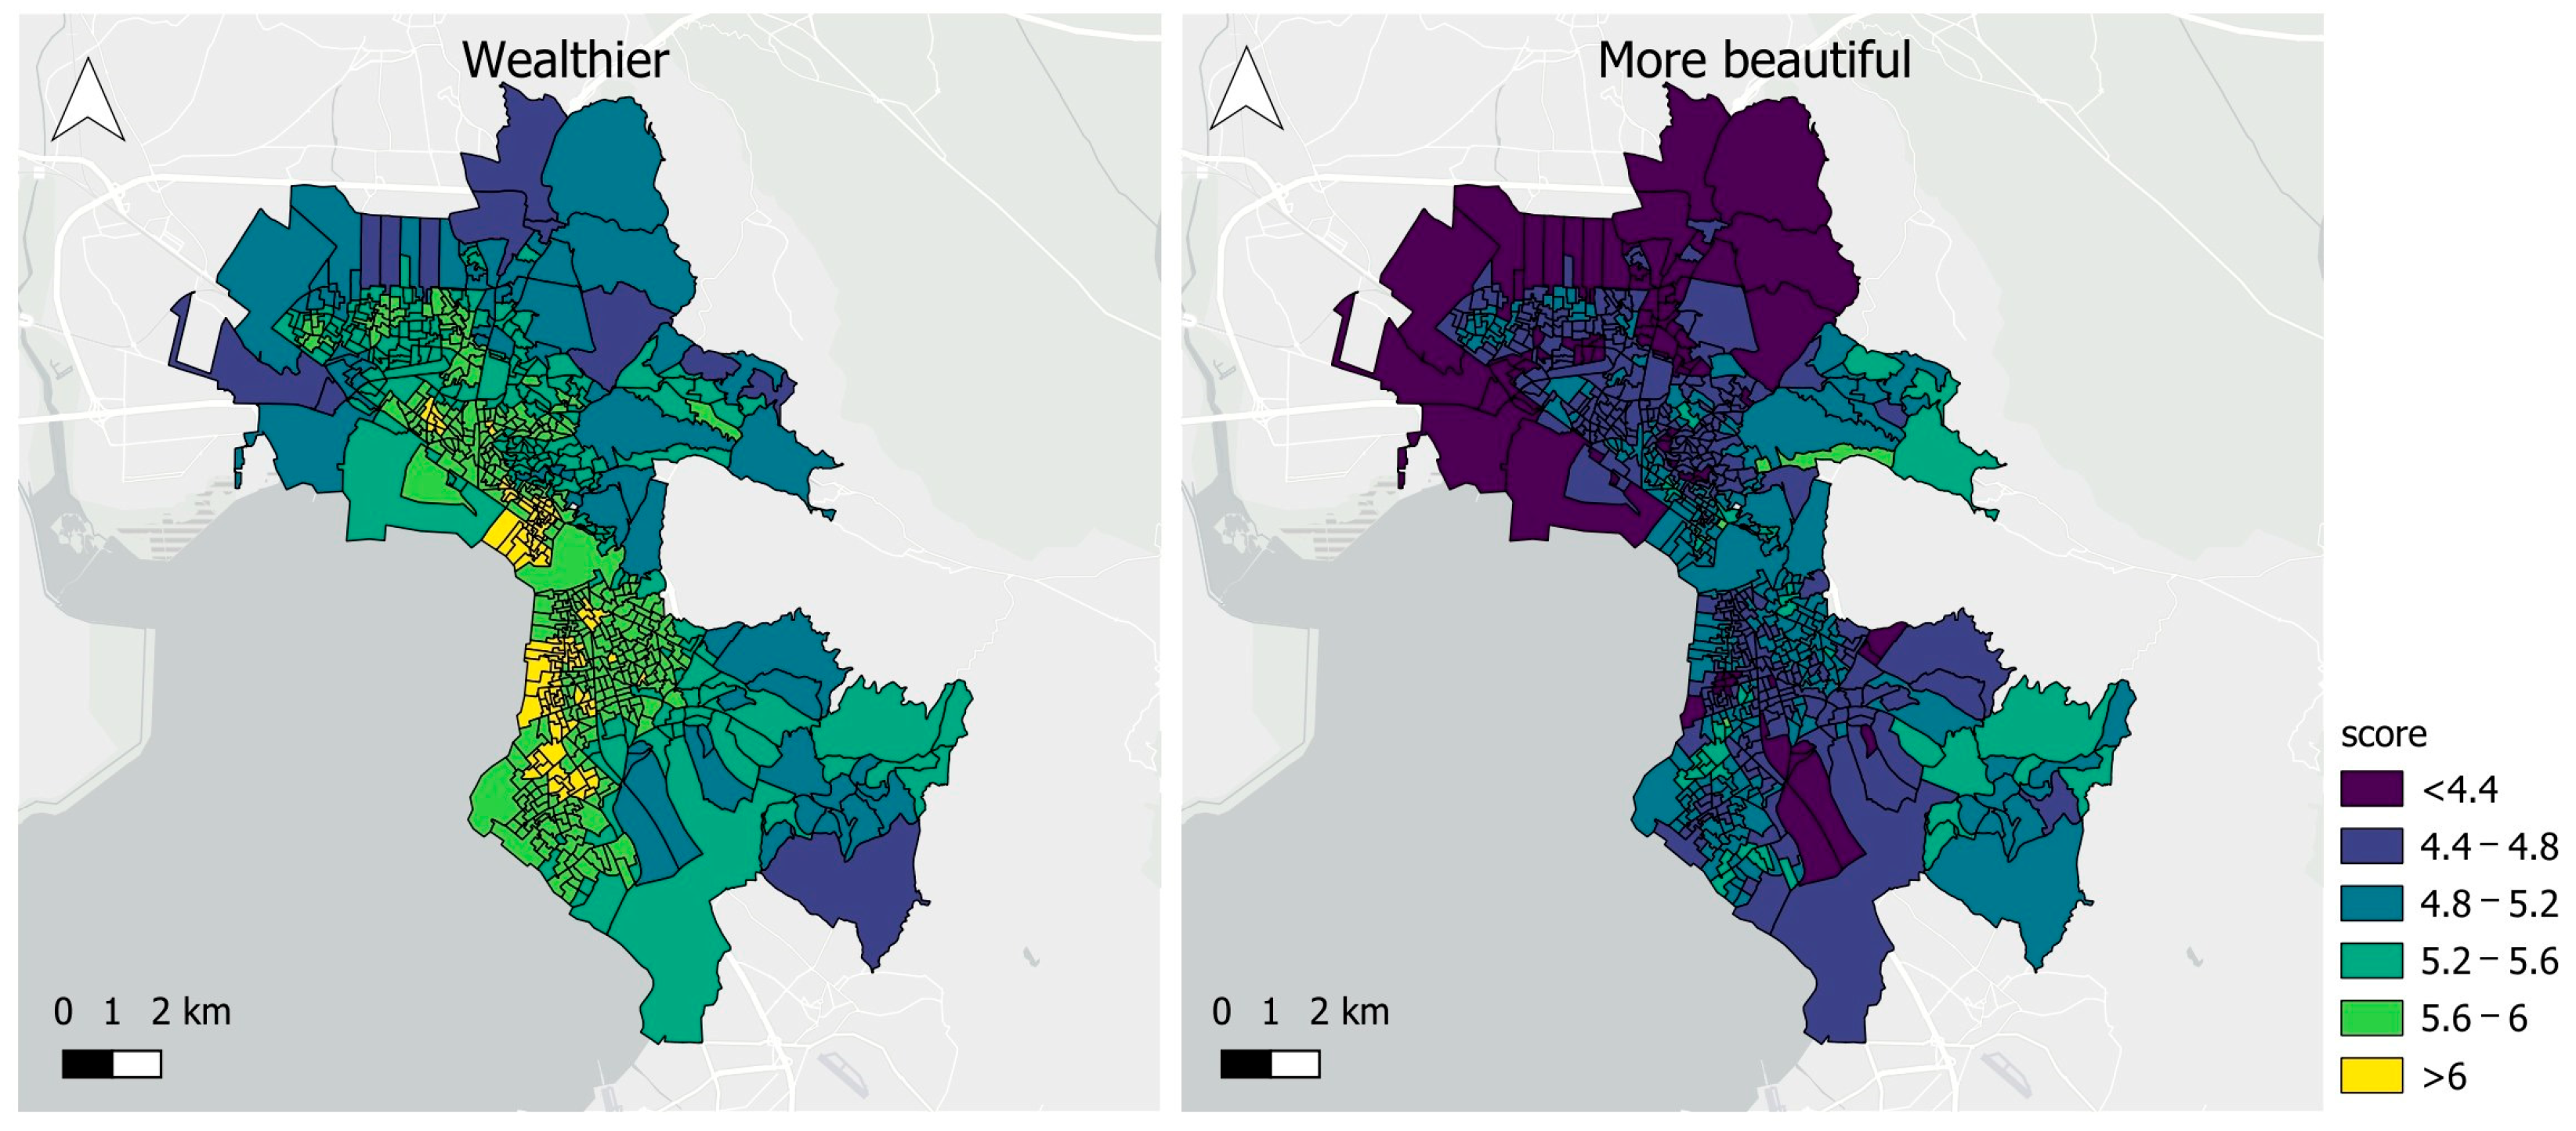
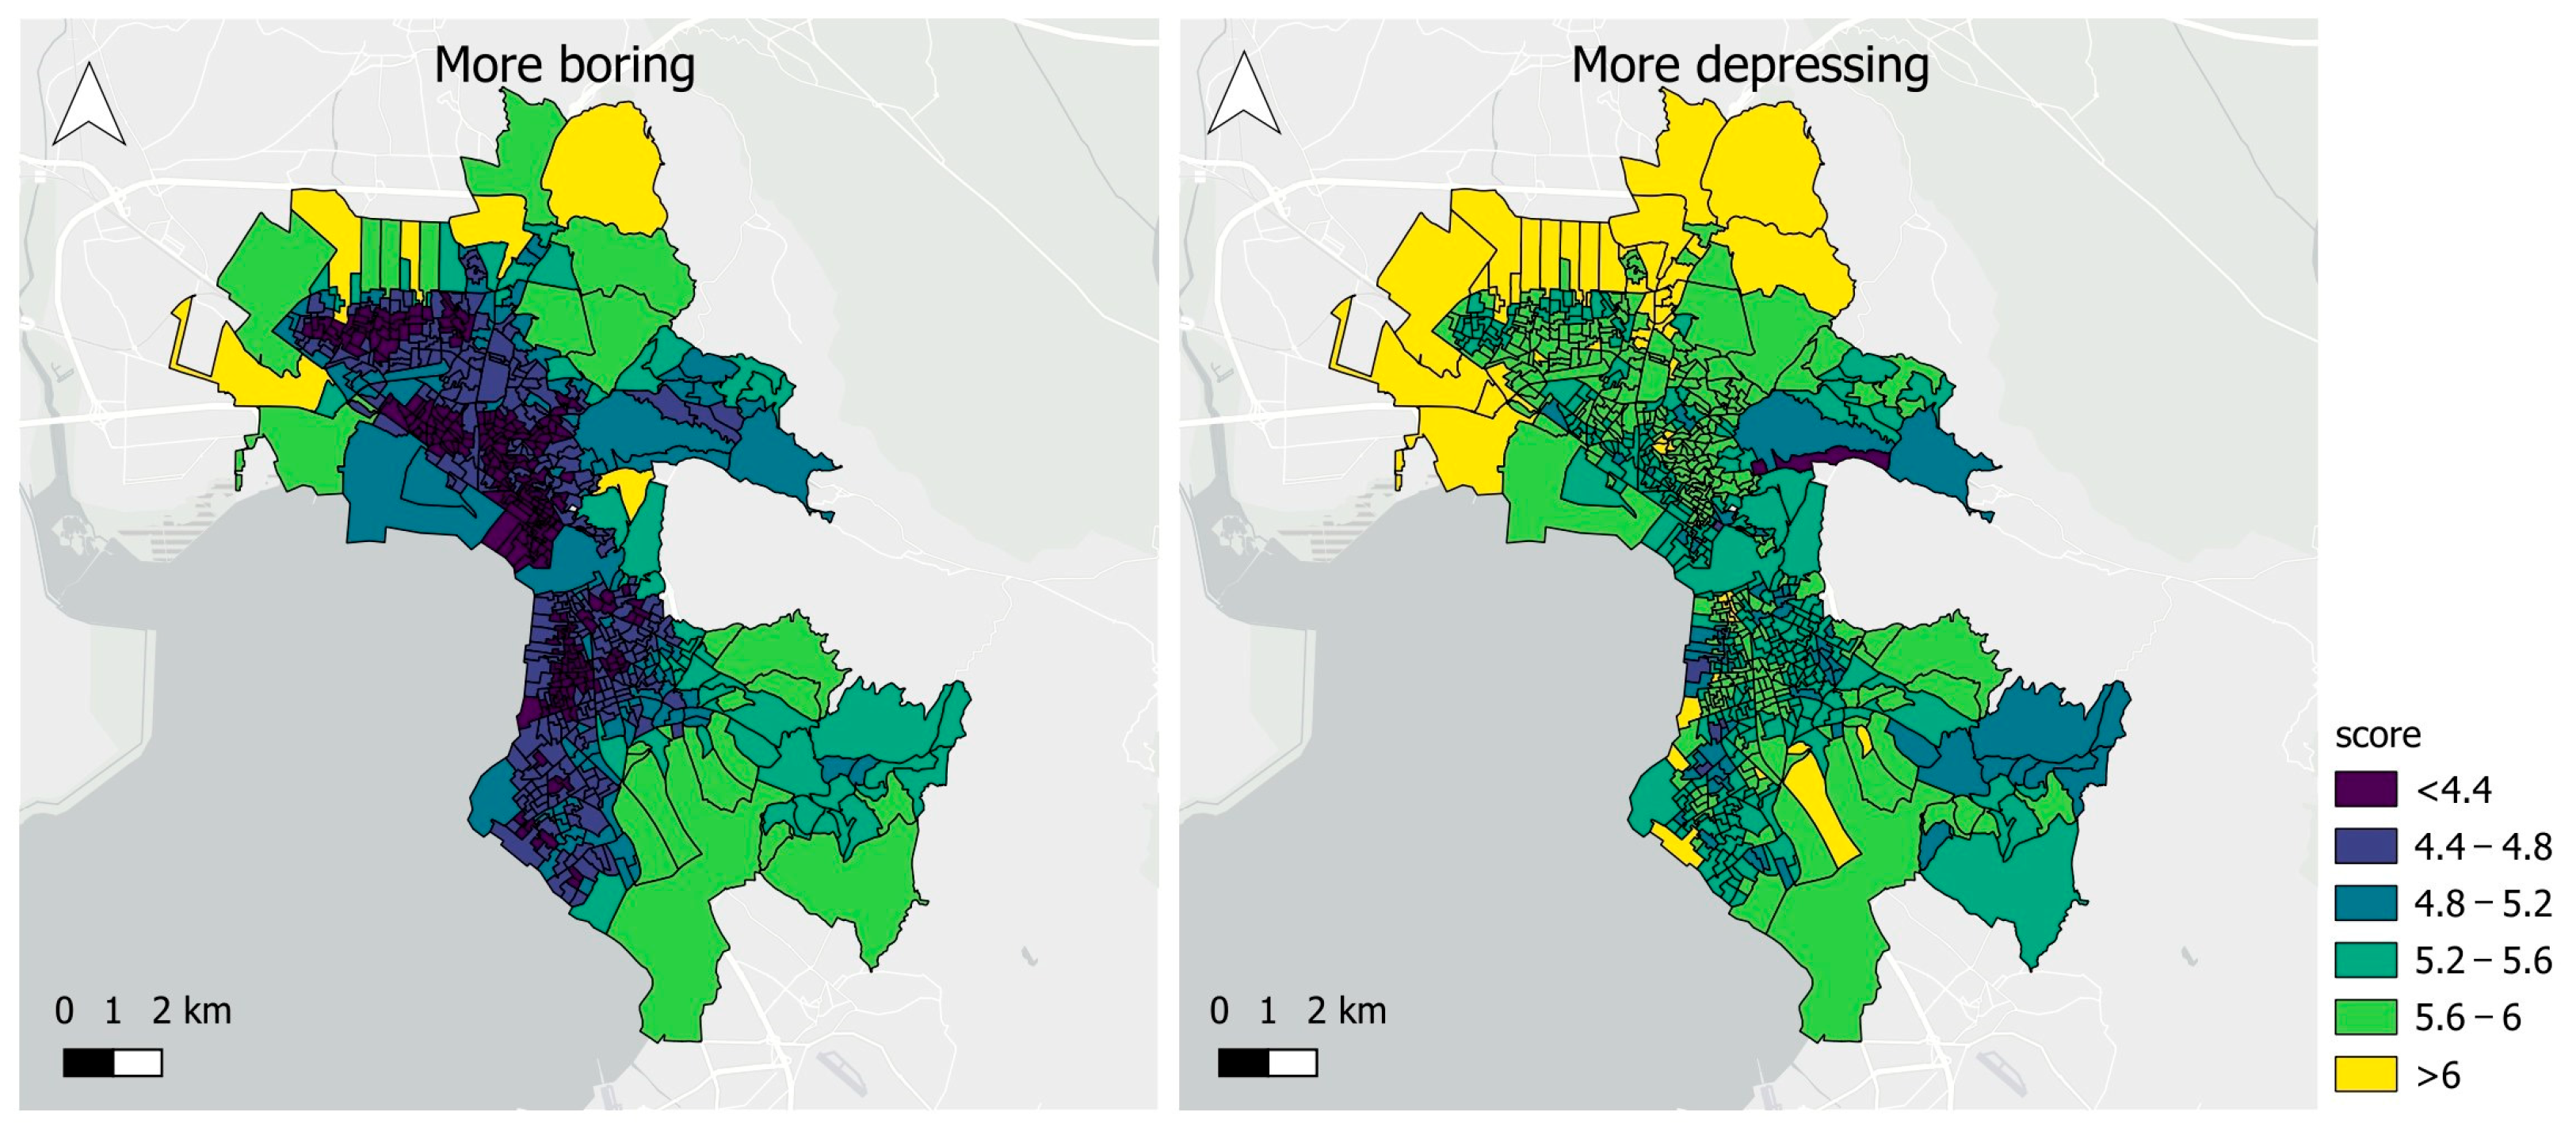
The perception maps (Figure 6, Figure 7 and Figure 8) reveal a distinct spatial pattern in Thessaloniki. Figure 6 shows that high safety scores concentrate in the historic city center and along the eastern corridors, whereas lower safety appears in the industrial and peripheral zones. Perceptions of safety, liveliness, and wealth (Figure 6 and Figure 7) all peak in roughly the same areas: the compact core downtown and the affluent suburbs to the southeast (e.g., Panorama, Thermi). Conversely, boredom and depression (Figure 8) are highest in the northwestern neighborhoods, industrial areas and around the port and the ring road. Beauty (Figure 7) stands out in green and low-density fringes (e.g., Pefka, Panorama hills, Karabournaki, Nea Krini), reflecting the abundance of trees and quality open spaces. Generally, eastern and southeastern areas and the city center seem to score higher on positive perceptions while northwestern districts score higher on negatives.
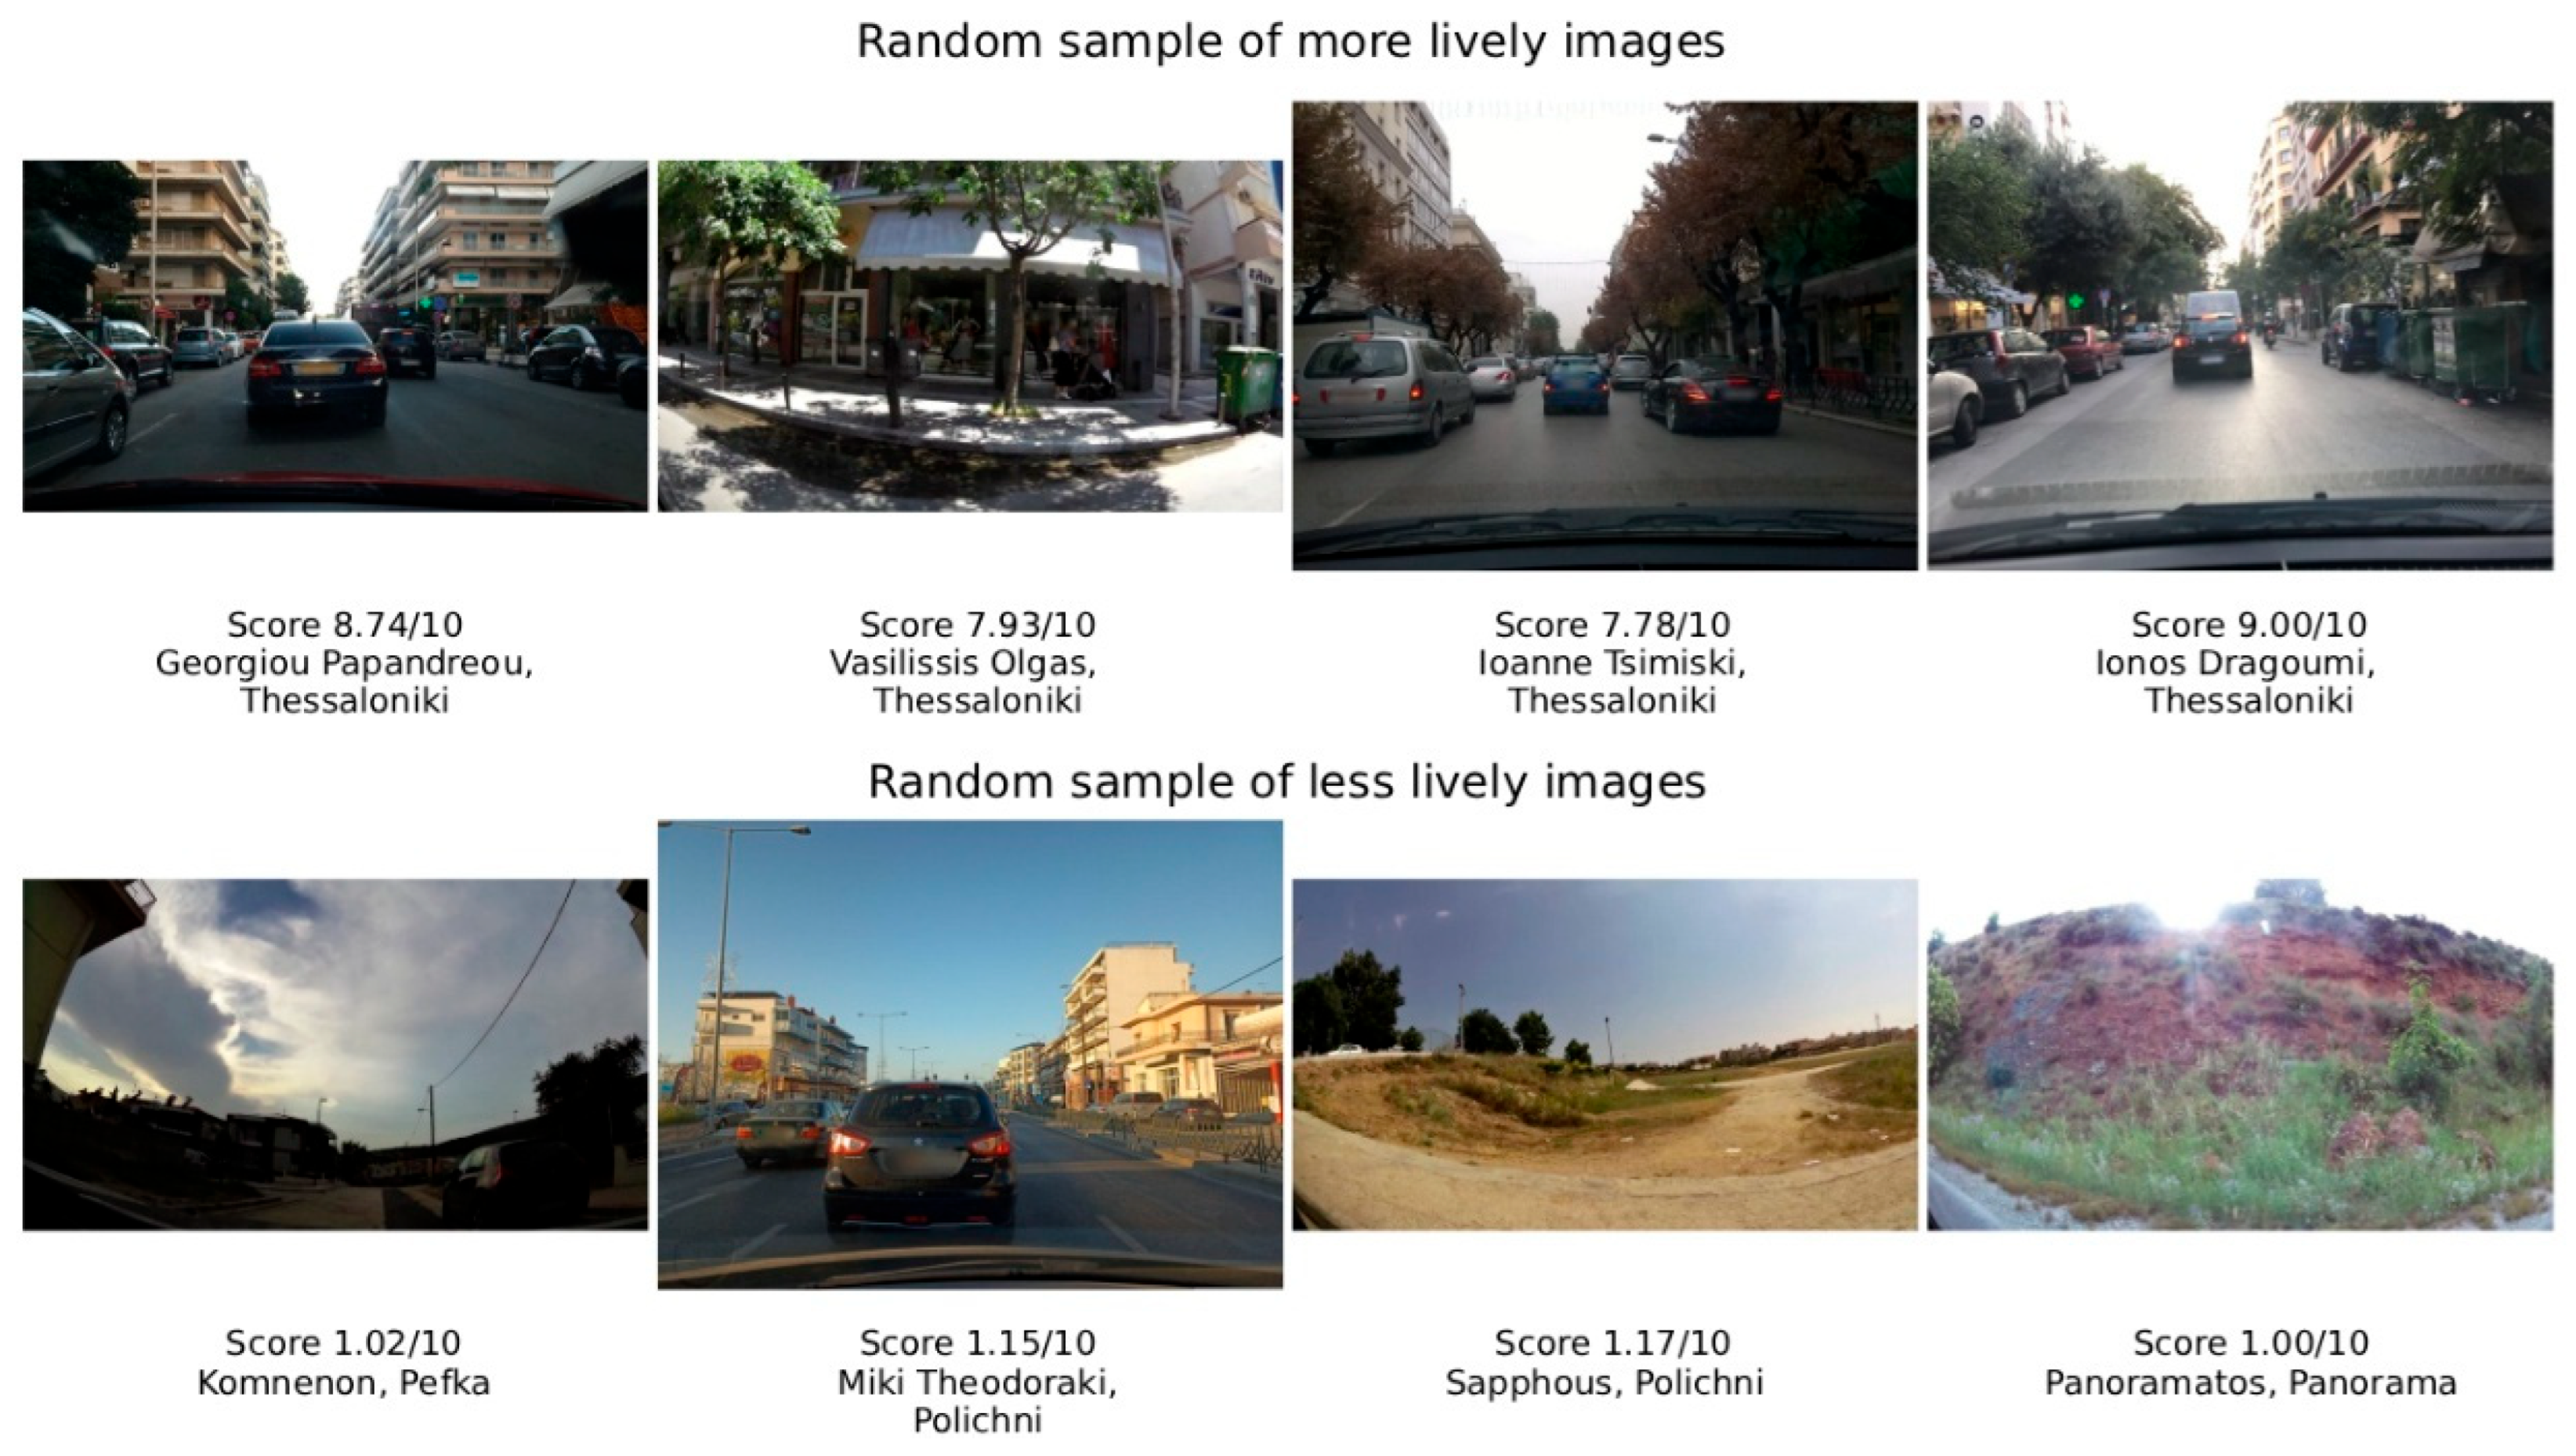
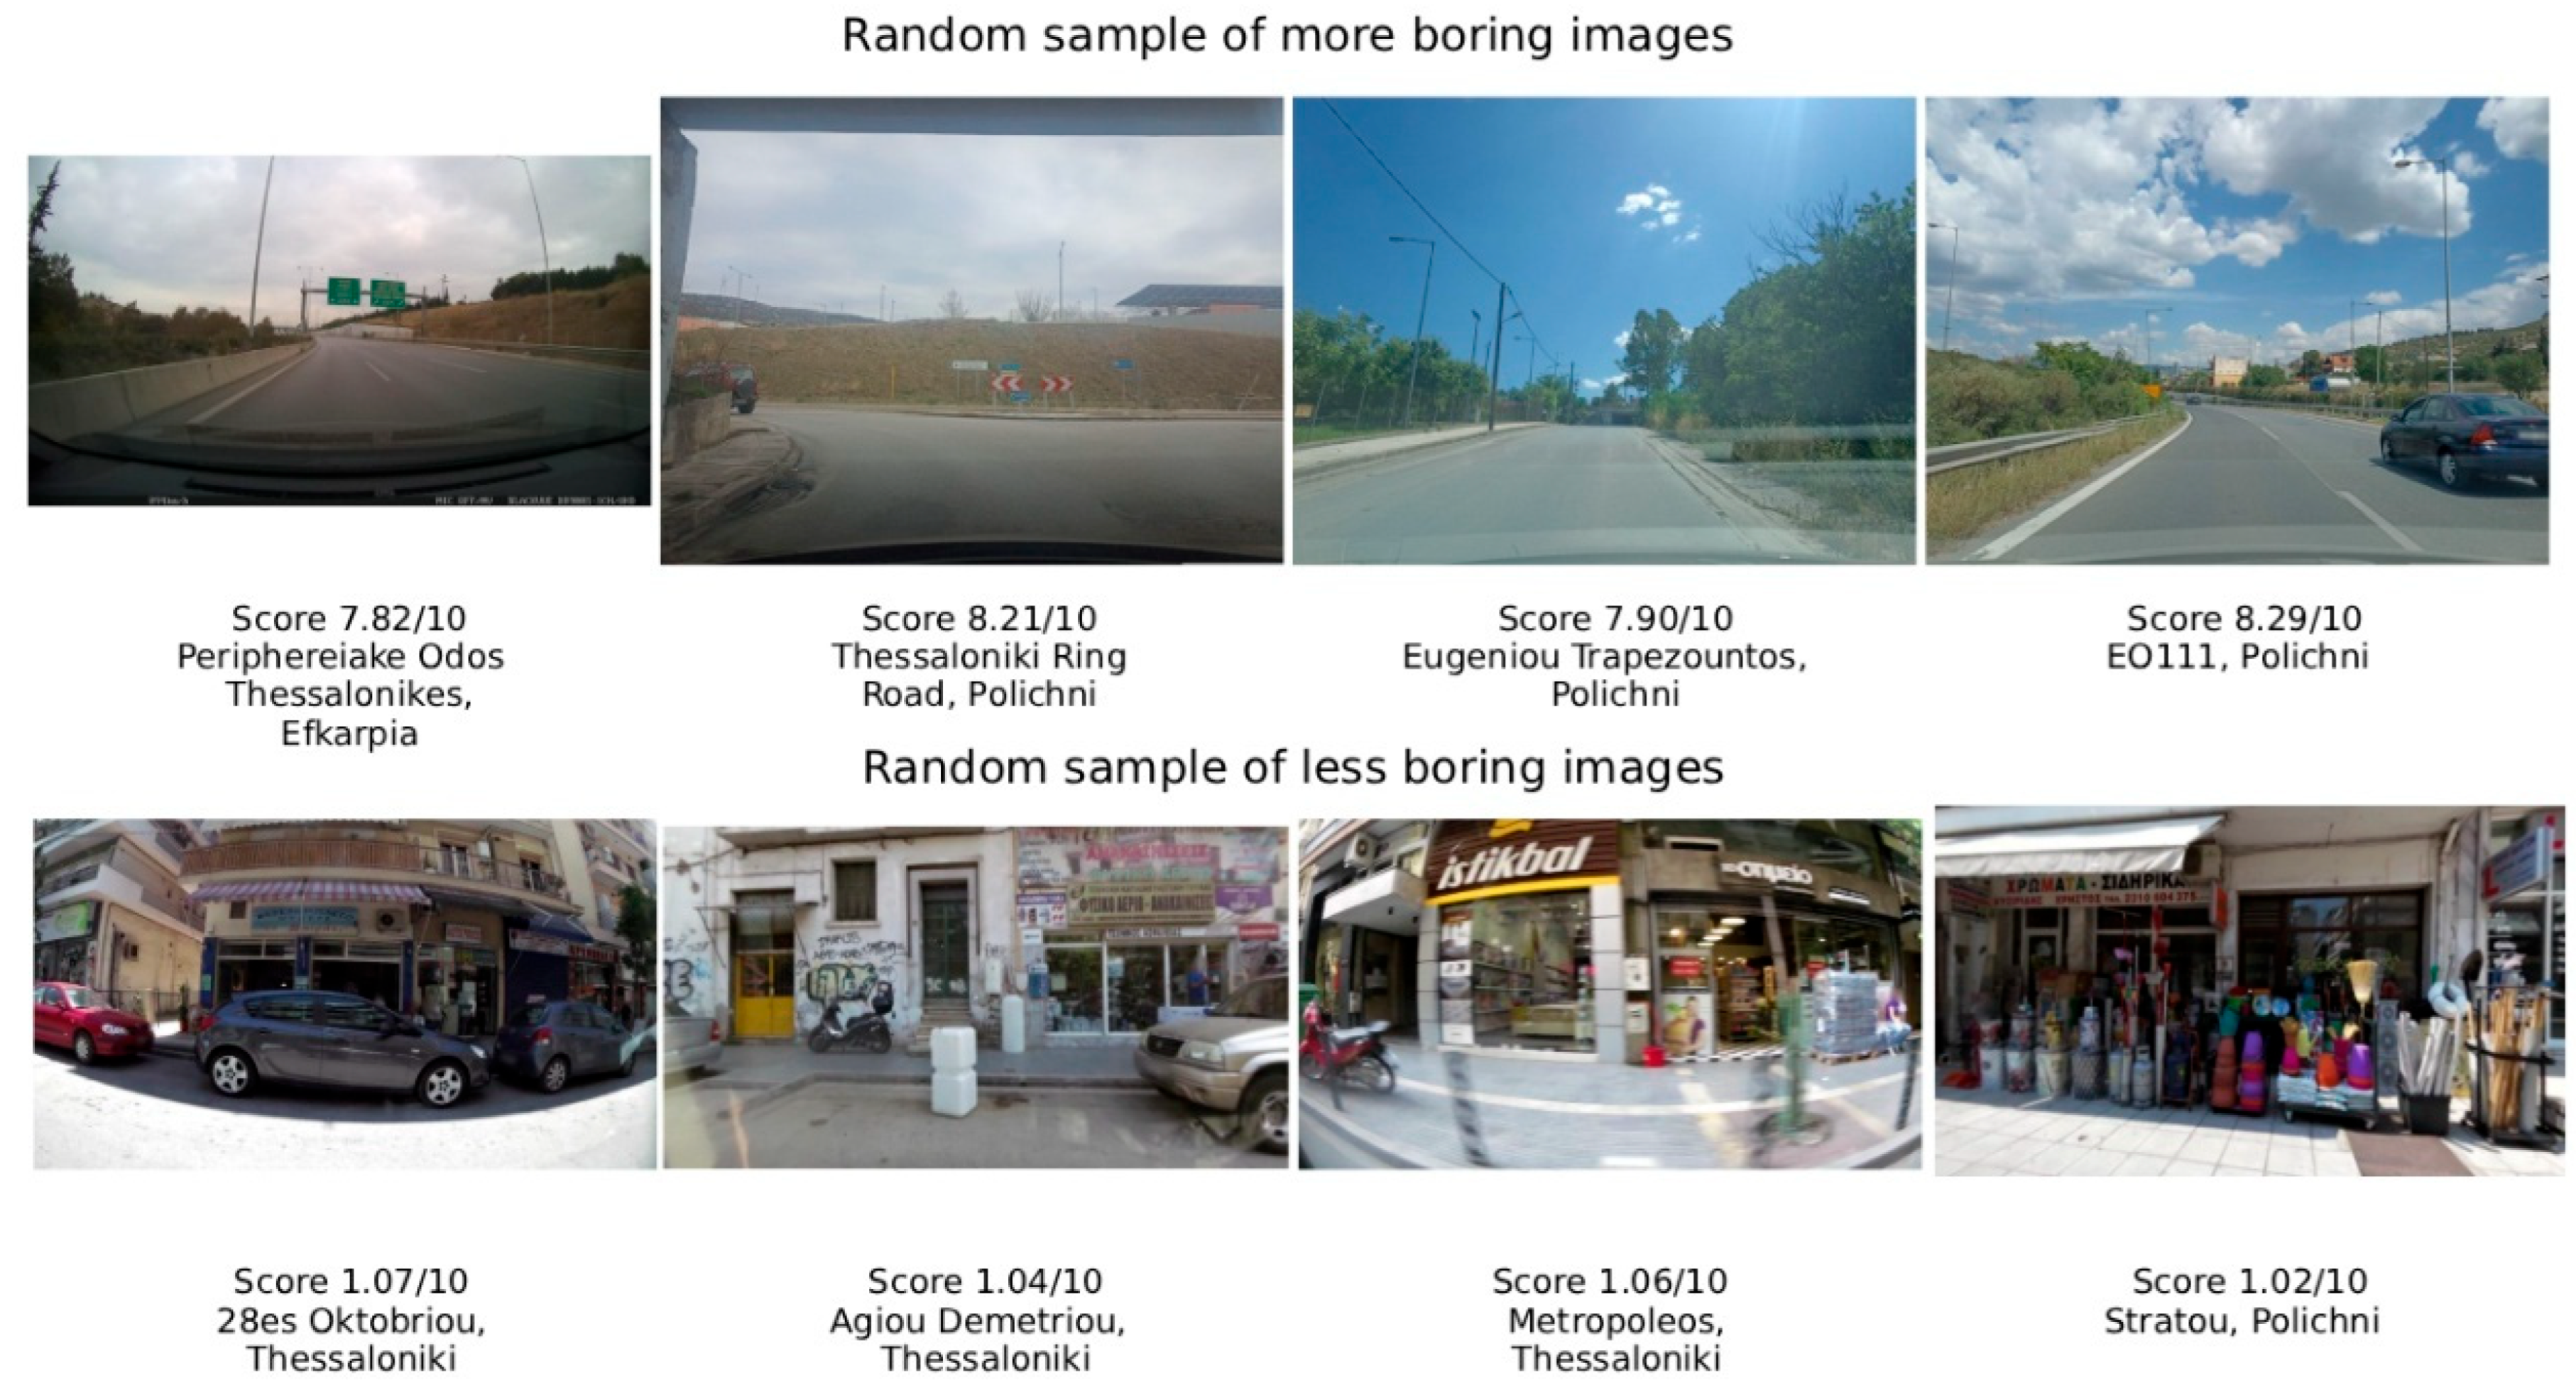
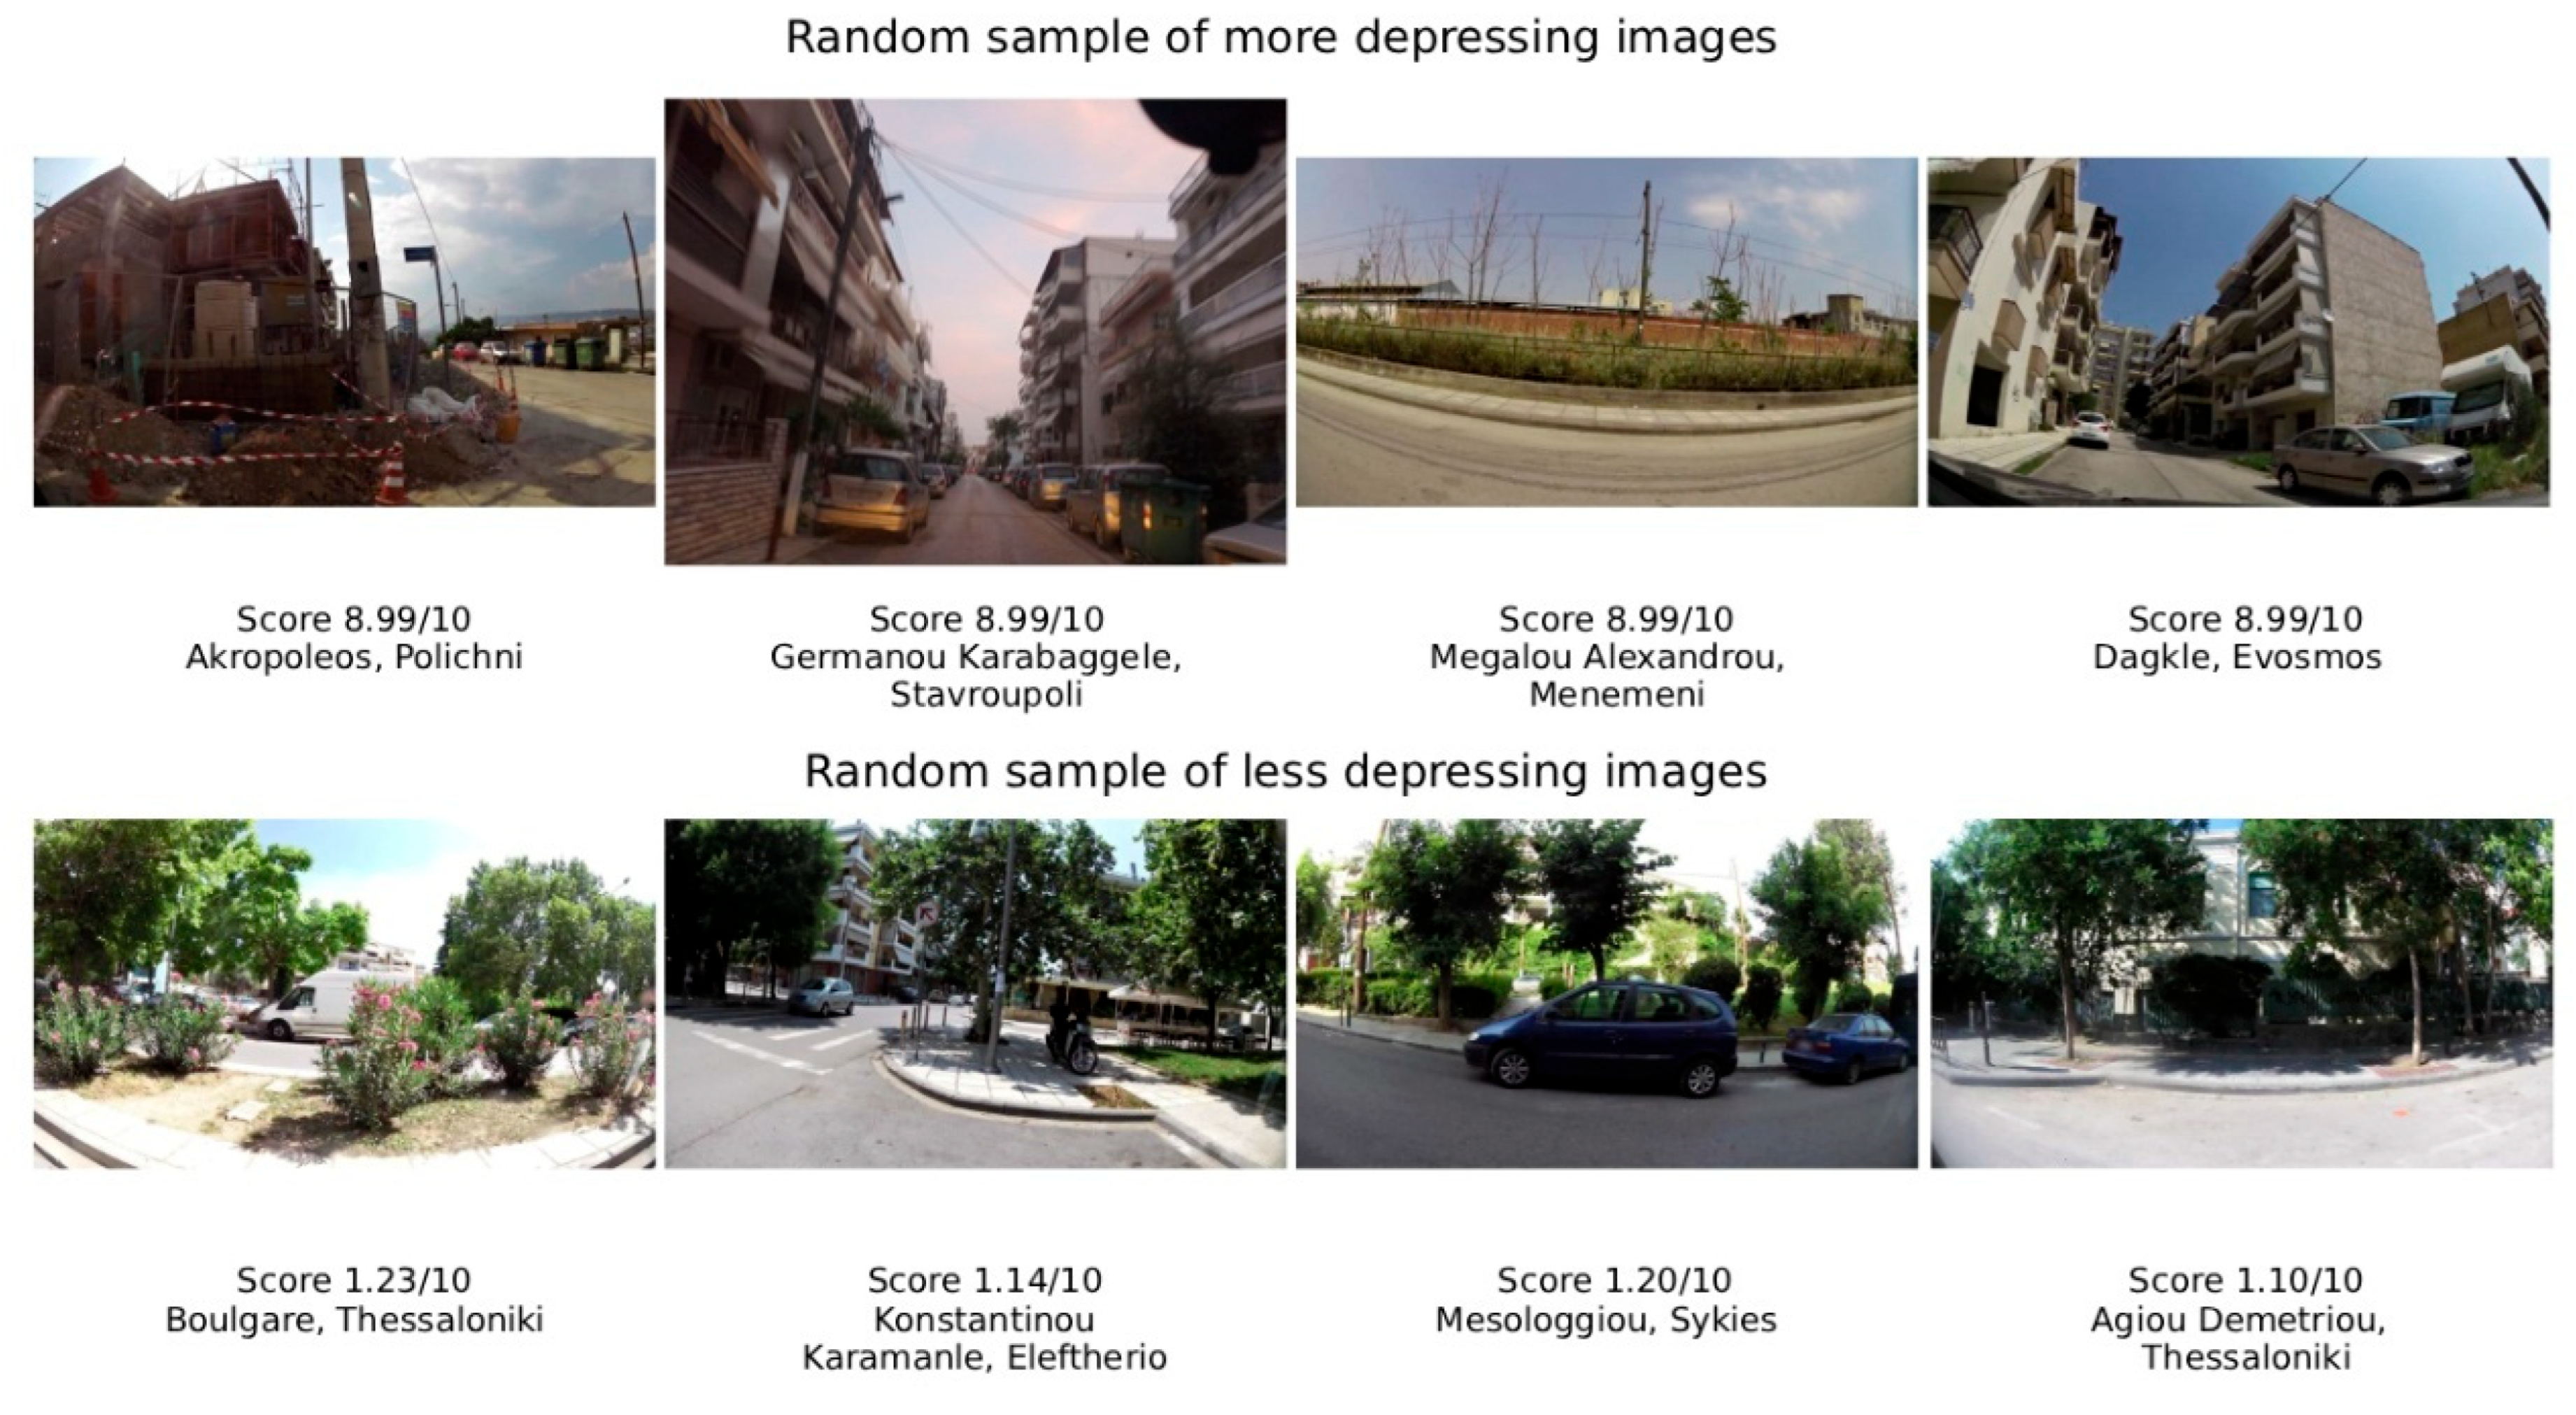
Example photos randomly selected from the lowest and highest scoring 10% of the SVI dataset are provided in the Appendix A (Figure A1, Figure A2, Figure A3, Figure A4, Figure A5 and Figure A6). In Figure A1, the top row shows three of the highest-scoring images for safety: all depict orderly streets with high openness, some vegetation and signs of life (parked cars, pedestrians). The bottom row shows three low-scoring safety images: these are wide vacant lots, streets with little signs of life and alleys. Figure A2 (liveliness) and Figure A3 (beauty) follow a similar logic: the high-score images have active street fronts, busy street traffic and tall vegetation, whereas the low-score images are highways, industrial areas, construction sites or vacant lands.
Figure A4 (wealth) displays central plazas, main streets and store frontages as “wealthy” scenes in contrast to more concrete-dominated housing areas. Figure A5 (boredom) and Figure A6 (depression) show high-scoring pictures of derelict industrial zones and plain landscapes (e.g., empty service roads, construction sites, blank facades) versus low-scoring active street frontages and green spaces. These example images confirm that the model’s scores align with intuitive cues: order, openness, signs of human activity, vegetation produce high safety and liveliness, while industrial decay, emptiness and abandonment produce high boredom and depression.
To better understand the relation between perception dimensions in Thessaloniki we performed an exploratory PCA, reducing the six dimensions to two (P1 and P2 explaining 61% and 24% of total variance, respectively). P1 describes activity, prosperity, safety vs. boredom, while P2 describes depression vs. beauty. This means that places in Thessaloniki can be more beautiful or more depressing irrespective of perceived liveliness, wealth and safety. Also, places simultaneously beautiful and boring may be common while places simultaneously beautiful and depressing might be very rare (Figure 9).

4.3. Autocorrelation and Correlation of Socio-Spatial and Perceptual Data

Global spatial structure is strong and scale-dependent (Table 3). Among factors, F1 is highly clustered and stable across 200–600 m radii (mean Moran’s I = 0.795, CV = 0.039, ρ vs. radius = 0). F2 is strongly clustered on short radii but weakens as distance grows (I = 0.728, CV = 0.189, ρ = −1). F3 is moderate and slightly strengthens with increasing radius (I = 0.417, ρ = 0.4). F4 is weak to moderate yet grows with scale (I = 0.165, ρ = 1). Perceptions also cluster together in space. Wealthier, safer, and livelier are the most structured (I = 0.613, 0.587, 0.582, respectively). Beauty is moderate (0.498). Boring and depressing are lower and more variable, with depressing showing the largest dispersion across radii (SD = 0.100, CV = 0.219). Scale dependency is revealed by different neighborhood radii: safety, beauty, depression attenuate with radius (ρ = −1), meaning their clustering is more localized, while wealth and liveliness strengthen (ρ = 0.8 and 0.7) over distances.
Pearson correlations align perceptions with the socio-economic axes in expected ways yet with notable twists (Table 4). F1 relates negatively to safety, liveliness, wealth, beauty, and positively to depressing, all at q < 0.05. F2 relates positively to liveliness and wealth, negatively to boredom, and weakly positively to safety. F3 associates negatively with liveliness and positively with beauty and boredom. F4 aligns positively with safety, liveliness, and wealth. Beauty shows no linear link to F2 or F4.
Bivariate Moran’s I for a neighborhood radius of 400 m confirms the main gradients while exposing spatial contingencies (Table A5). F1 co-locates negatively with safety, liveliness, wealth, beauty, and positively with depression. F2 co-locates with liveliness and wealth and anti-locates with boredom. F3 shows small but significant spatial links that mirror Pearson signs for liveliness, beauty, boredom, and depression. F4 co-locates with safety, liveliness, wealth, beauty, and anti-locates with boredom and depression.
Key differences between r and I mark where associations are non-spatial or scale-mismatched. Safer–F2 is significant in r but not in I, implying an aspatial association at 400 m. Wealthier–F3 is significant and negative in r but null in I. The reverse also appears: Beauty–F4 is null in r yet significant and positive in I, and depressing–F2 and depressing–F4 are null in r yet significantly negative in I. Where both metrics are significant, I magnitudes are smaller than r, consistent with spatial dilution.
Implications for potential segregation are multi-faceted. F1 reflects the northwest–southeast deprivation–affluence divide of Thessaloniki. Yet F2 complicates the picture: migrant concentration overlaps with lively, prosperous-looking central districts, where mixed uses and dense street life offset socio-economic constraints. F3 aligns with “beautiful but boring” neighborhoods. F4, concentrated in the historic city center, links to safe, vibrant, and wealthy perceptions despite labor-market detachment, since students and retirees benefit from centrality and multiple available services. These findings show that while structural divides persist, perceptions are shaped by urban form and function, producing environments where disadvantage and positive imagery coexist.

5. Discussion

5.1. Socio-Spatial Differentiation Mirrored in the Image of the City

Cities are inherently complex and diverse, both in their urban form and in the social structures that shape them. This complexity is the outcome of long-term socio-spatial interactions and dynamics. In this study, we propose a methodology capable of capturing such diversities as they are projected into space, with a particular focus on differentiation patterns linked with inequalities, segregation, or exclusion [2,21]. Our approach combines (i) geo-statistical analysis of neighborhood-scale census data and (ii) AI-driven street-image analysis using the PlacePulse 2.0 perception dataset. Applying both at the same spatial unit level allowed for direct comparison in the study area.
Results show that Thessaloniki is more sharply divided than often assumed for southern European cities [71,92]. The first two PCA components (F1, F2) explain nearly 70% of variance across 21 socio-economic indicators and reveal a clear pattern: a working-class northwest zone contrasts with an affluent southeast, with the historic center in between. An “affluence corridor” runs from the redeveloped seafront (Nea Paralia) through Kalamaria to the eastern suburbs of Panorama and Pylaia. This reproduces well-known east–west inequalities in the city.
Ethnic concentration is also evident. Migrants from Eastern Europe and the Global South concentrate in central-western districts near the port and railway station, closer to the urban core than the native-Greek working class that concentrates in the western sector. Factor 4 highlights the dual character of the historic center, with students and pensioners concentrated in old housing stock, alongside poverty pockets in the peripheral northwest. This aligns with results from the pan-European study by Malheiros [93]. Factor 3, by contrast, marks concentrations of directors and freelancers in the southern suburbs. Methodologically, LQ indices and PCA allowed high-dimensional census data to be summarized without losing local variation. These factors are not causal but structured representations of socio-spatial layering.
Street-image analysis offered a complementary view. Perceptions of wealth, safety, and liveliness are highest in central and southeastern neighborhoods, while boredom and depression cluster in industrial and northwestern zones. Places such as Tsimiski avenue and the waterfront area register as wealthy, while abandoned warehouses near the port are perceived as depressing or boring. Broadly, perceptual geography mirrors socio-economic divides, reinforcing the utility of AI-derived imagery in urban analysis.
Yet the correspondence is not absolute. Migrant concentration (F2) correlates positively with liveliness and wealthier appearance and negatively with boredom, both in Pearson r and bivariate Moran’s I. This indicates that migrant-dense areas are embedded in active mixed-use environments, usually near downtown areas, that project prosperity and vitality. Occupational hierarchy (F3) aligns positively with beauty but also with boredom, pointing to suburban zones that are aesthetically green but quiet. Labor-market detachment (F4) co-locates with perceptions of safety, wealth, and liveliness in the historic core, where non-active groups benefit from centrality and services. These cases complicate the notion that socio-economic disadvantage is matched by negative imagery.
Scale effects add further complexity. Moran’s I trends show that safety, beauty, and depression are highly local, strongest at small radii and weakening with distance. Wealth and liveliness cluster more strongly at larger radii, indicating that they reflect broader neighborhood or district gradients. Such differentiation in spatial reach underscores the importance of multi-scalar approaches to Mediterranean segregation, where local contrasts and citywide axes intersect.
Taken together, the analysis suggests that Thessaloniki bears features of socio-spatial differentiation but not in a uniform or deterministic sense. A NW–SE deprivation–affluence duality appears to be robust, yet central migrant neighborhoods project lively and prosperous images, and suburban elites inhabit beautiful but sometimes boring settings. The historic core, while socio-economically mixed, reads as safe and affluent, traditionally being a place of concentration of many retirees and students, both registered as economically inactive. Differentiation therefore coexists with counter-patterns shaped by morphology, centrality, and activity.
Whether Thessaloniki should be classified as a segregated city remains open. Spatial divisions are clear, but not all disadvantaged populations occupy negatively perceived spaces. As Malheiros [93] argues, the issue is not clustering itself but when poor people and poor environments overlap with exclusion, crime, or weak social cohesion. From this perspective, the central challenge is livability, not segregation per se.

5.2. Urban Planning and Policy Implications

Integrating perceptual indicators with census structure provides several insights for urban planning, design and policy, as it identifies where inequalities are both socio-economic and visually perceptible and where they diverge. Lived experience and place identity should inform planning and urban regeneration projects, yet formulaic solutions that underestimate these dimensions seem to prevail globally [25,94].
The combined results of our study confirm the long-standing socio-spatial divide of Thessaloniki, particularly the contrast between the western and northwestern sectors, traditionally associated with lower-income/working class populations, and the more affluent eastern and southeastern sectors. Beyond confirming this general pattern, our work advances the discussion by specifying and mapping these inequalities with high spatial precision, also revealing additional “pockets” of socio-spatial inequality and concentration of specific migrant groups. Such spatially explicit insights could inform the prioritization of social inclusion initiatives in Thessaloniki, directing resources toward the most vulnerable neighborhoods.
Generally, the study results can be used as a policy lens to prioritize interventions where negative perceptions co-locate with structural disadvantage. This is important as the integration of perceptual indicators derived from street-level imagery into urban analysis provides a novel dimension that is rarely incorporated into conventional planning processes. Mapping how residents perceive urban environments can reveal subtle aspects of socio-spatial deprivation that are not easily captured by census data, thus supporting more sensitive and equitable spatial strategies.
Currently, the metropolitan planning framework of Thessaloniki lacks a coherent, long-term strategic vision. In 2014, amid national planning reforms and austerity measures, Thessaloniki’s metropolitan regulatory plan and its implementing agency were abolished, with functions absorbed into higher-level (national, regional) frameworks. Since then, the city has focused on “special projects”, such as the TIF-HELEXPO redevelopment, the expansion of the port to accommodate cruise tourism and height-exception approvals. These are advancing with limited public consultation, fragmenting policy and sidelining local identity. Other major interventions often remain infrastructure-driven (e.g., the metro development and its future expansions, and the flyover ring road expansion), not directly assessing socio-spatial impacts.
Strengthening institutional participatory mechanisms and citizen engagement could help counterbalance this top-down tendency and ensure that regeneration efforts address real social needs rather than reproducing inequalities. Our work contributes towards making such data more transparent, which is a requirement for democratic planning. Another insight concerns the historical center, identified in our study as a socially mixed, vibrant area of the city, emerging as a key interface between different social groups, while still preserving its role as a place of residence for elderly pensioners and students, in particular. Therefore, urban policies should aim to preserve its residential diversity and everyday functions, reinforcing its role as a spatial and social integrator within Thessaloniki’s urban fabric. Surging short-term rentals, retail monoculture, and rent inflation endanger the city center’s residential mix, which sustains vibrancy and local identity. If students and pensioners are priced out, the center is likely to drift toward a more exclusive and sterile landscape. While the metro currently expands east, prioritizing western neighborhoods would likely boost access and place perception, mitigating existing discrepancies.

5.3. Limitations and Future Research

In discussing methodological limitations and future research pathways, we can draw four main directions, regarding spatial scale, temporal perspective, future methodological enrichments and policy integration. These are briefly discussed below:
Spatial scale: Census data are constrained by predefined zones that include peri-urban polygons with little population. Downscaling via land-use, density, or gridded models could refine the spatial picture. The contrasting scale effects in perception data reinforce this need.
Temporal perspective: Our analysis provides a largely static snapshot across different years. Census baseline is 2011 while SVI collection span multiple years. We did not explicitly account for dynamics over time, particularly the long-lasting impacts of the Greek economic crisis (2008–2019), which may have significantly reshaped socio-spatial structures. As the 2021 census data are not yet fully available at fine spatial resolution, we could not integrate longitudinal perspectives. A natural future extension of this work would be the exploration of comparative temporal data and the application of segregation indexes across different periods to better capture trajectories of change and resilience.
Methodological Enrichment: Future work should focus on segregation-candidate spaces with local surveys and participatory mapping to test whether lived experience aligns with model predictions. While such global models can provide a useful “base” for analysis, fine-tuning with additional local datasets might increase accuracy and reduce bias for place-specific studies that respect local cultural perceptions. This can be achieved by newer transformer-based vision models that allow fine-tuning via LoRAs (Low-Rank Adaptations).
Policy integration: With AI becoming rapidly integrated in urban planning, crucial policy questions are raised: The automation of deep place knowledge offered by AI will likely be used to drive real-estate investments. Could hidden model biases become engrained in AI-assisted planning processes? Could their widespread use amplify such biases, creating a vicious cycle of self-reinforcing socio-spatial inequalities and negative place perceptions?
These questions remain, yet it is clear that such a methodological enrichment, combining statistical analysis with participatory and policy-oriented approaches, would enable a more holistic understanding of urban differentiation and segregation in Thessaloniki.

6. Conclusions

This study shows that pairing census-based indices with automated street-image perception yields a coherent account of socio-spatial structure at the metropolitan city level, while the GeoAI analysis offers a complementary view. This framework is replicable and policy-relevant, casting further light into the complex issue of urban inequality, spatial justice, and socio-spatial segregation. With only one city as a case study, it is not possible to draw a more generalized conclusion on causality; however, our work adds to existing literature. Through future review works, broader methodological conclusions on how perceptions and census characteristics are spatially aligned could be reached.
When applied into the city of Thessaloniki, a typical compact city of the Mediterranean regions, our analysis reveals that a robust northwest to southeast axis separates working-class and deprived areas from affluent corridors, while central districts display mixed yet patterned outcomes. Interestingly, migrant concentrations near the downtown area align with lively and prosperous-looking environments rather than uniformly negative imagery, while suburban elites occupy greener and more beautiful zones that are often read by the GeoAI algorithm as relatively boring.
Spatial autocorrelation confirms strong clustering, with safety, beauty, and depression acting locally, and wealth and liveliness spreading over broader neighborhoods, including the downtown core. Overall, Thessaloniki is clearly a spatially divided city but not necessarily a segregated one, as not all disadvantaged populations occupy negatively perceived spaces.
Ultimately, this research provides a framework for monitoring spatial inequalities and potentially supporting participatory decision-making, ensuring that planning interventions reflect both structural conditions and lived perceptions. When seen through the lens of urban planning practice, this would point towards integrated urban regeneration that addresses not only public-space design but also urban identity and perception. Spatial alignment between perceptions and socio-economic structure can guide where negative imagery and disadvantage co-occur, and where lively streets mask deprivation and exclusion at the micro level. This perception–socio-economic frame also supports participatory governance, making spatial patterns legible to decision-makers, residents and visitors, and incorporating their priorities into co-design processes without erasing local character.

Author Contributions

Conceptualization, A.V. and A.L.; Methodology, A.V. and A.L.; Software, A.V. and A.L.; Validation, A.V. and A.L.; Formal analysis, A.V. and A.L.; Investigation, A.V. and A.L.; Resources, A.V. and A.L.; Data curation, A.V. and A.L.; Writing—original draft, A.V. and A.L.; Writing—review & editing, A.V. and A.L.; Visualization, A.V. and A.L.; Supervision, A.V. and A.L.; Funding acquisition, A.L. All authors have read and agreed to the published version of the manuscript.

Funding

This research received no external funding.

Data Availability Statement

The socio-economic and demographic data used are publicly available from the Panorama of Greek Census Data (ΕΚΚΕ–ELSTAT) at https://panoramaps2.statistics.gr (accessed on 14 September 2025) and the Hellenic Government Gazette (Objective Property Values, Issue B 2375/2021). Census data for educational level at fine resolution were confidentially provided by the Hellenic Statistical Authority (ELSTAT), and the results reported are based on further analysis done by the authors. Street View Imagery was obtained from Mapillary and KartaView, both open-access platforms. Derived perception scores and analytical outputs were generated using the open-source ZenSVI framework and are available from the corresponding author upon request.

Acknowledgments

During the preparation of this manuscript/study, the authors used ChatGPT, version 5.0 for the purposes of text-editing. The authors have reviewed and edited the output and take full responsibility for the content of this publication. The authors gratefully acknowledge the three anonymous reviewers for their valuable and constructive comments, which have significantly improved the manuscript.

Conflicts of Interest

The authors declare no conflicts of interest.

Appendix A

Figure A1. Example images scored for safety [89].
Land 14 02083 g0a1
Figure A2. Example images scored for liveliness [89].
Land 14 02083 g0a2
Figure A3. Example images scored for beauty [89].
Land 14 02083 g0a3
Figure A4. Example images scored for wealth [89].
Land 14 02083 g0a4
Figure A5. Example images scored for boredom [89].
Land 14 02083 g0a5
Figure A6. Example images scored for depression [89].
Land 14 02083 g0a6

Appendix B

Table A1. Descriptive statistics of socio-economic and social LQ variables (N = 673 spatial units).
VariableMinMaxMeanStd. Dev.SkewnessKurtosis
Economic
EC_LQ1 Industrial0.242.250.990.330.48−0.40
EC_LQ2 Commercial/Public0.601.231.000.10−0.38−0.29
EC_LQ3 Directors0.183.620.990.482.126.96
EC_LQ4 Self-employed/Tech0.112.201.000.410.28−0.77
EC_LQ5 Office & Services0.421.541.000.15−0.681.70
EC_LQ6 Technicians0.082.291.000.410.29−0.37
EC_LQ7 Workers (Industry & Unskilled)0.142.381.000.440.32−0.55
EC_LQ8 Unemployed0.174.141.040.481.454.19
EC_LQ9 Non-active0.711.331.000.080.021.97
EC_LQ10 Land Values0.471.961.000.260.871.48
Social
SOC_LQ1 Greek origin0.721.061.000.05−1.332.45
SOC_LQ2 Origin: Developed countries0.0022.831.051.885.9245.50
SOC_LQ3 Origin: East European0.004.241.030.801.040.70
SOC_LQ4 Origin: Global South0.0012.691.031.173.8428.78
SOC_LQ6 Households w/o car0.092.731.020.490.600.12
SOC_LQ7 No Internet0.212.161.010.260.041.12
SOC_LQ8 Housing space < 20 m2/person0.052.560.990.440.25−0.28
SOC_LQ9 Housing space > 50 m2/person0.431.651.000.22−0.04−0.40
SOC_LQ10 Very high education0.008.011.011.022.056.06
SOC_LQ11 Very low education0.312.661.000.280.622.41
Table A2. Communalities (Extraction).
VariableExtractionVariableExtraction
EC_LQ10.868SOC_LQ10.954
EC_LQ20.901SOC_LQ30.816
EC_LQ30.814SOC_LQ40.776
EC_LQ40.903SOC_LQ50.819
EC_LQ60.850SOC_LQ60.904
EC_LQ70.835SOC_LQ70.798
EC_LQ80.676SOC_LQ80.874
EC_LQ90.694SOC_LQ90.712
EC_LQ100.756SOC_LQ100.738
SOC_LQ110.767
Table A3. PCA—Total Variance Explained.
ComponentEigenvalue% VarianceCumulative %
19.4449.7049.70
23.7319.6869.33
31.206.2975.63
41.085.6581.30
5+<1.00
Table A4. Rotated Component Matrix (Varimax, loadings > |0.10|).
Component
1234
EC_LQ10.8900.213−0.157
EC_LQ2−0.893−0.2140.130−0.199
EC_LQ3−0.278−0.1490.822−0.195
EC_LQ4−0.715 0.615
EC_LQ60.6620.113−0.624
EC_LQ70.6270.160−0.644
EC_LQ80.243 0.781
EC_LQ9−0.2220.285 0.751
EC_LQ10−0.830 0.257
SOC_LQ1−0.201−0.937 −0.184
SOC_LQ30.3810.800 0.173
SOC_LQ4 0.871−0.103
SOC_LQ5−0.157−0.5550.384−0.581
SOC_LQ6−0.1170.711−0.1920.589
SOC_LQ70.4690.531−0.2380.489
SOC_LQ80.8970.178−0.194
SOC_LQ9−0.821−0.1610.102
SOC_LQ10−0.745−0.1050.357−0.212
SOC_LQ110.841 −0.1230.199
Extraction Method: Principal Component Analysis, Rotation Method: Varimax with Kaiser Normalization.
Table A5. Bivariate Moran’s I between the six perception dimensions and the four socio-economic PCA factors, using a 400 m distance radius with 1000 permutations and FDR correction (5%).
PerceptionFactorICI (95%)pq (BH-FDR)Significant (95%)
saferF1−0.43−0.08 to 0.080.0010.002
F20.05−0.06 to 0.070.0950.095
F30.06−0.07 to 0.070.0400.053
F40.13−0.06 to 0.070.0010.002
livelierF1−0.37−0.08 to 0.070.0010.001
F20.19−0.06 to 0.070.0010.001
F3−0.06−0.05 to 0.050.0110.011
F40.24−0.06 to 0.060.0010.001
wealthierF1−0.45−0.08 to 0.080.0010.001
F20.17−0.07 to 0.060.0010.001
F30.01−0.07 to 0.060.4230.423
F40.21−0.06 to 0.060.0010.001
more
beautiful
F1−0.36−0.06 to 0.060.0010.002
F20.02−0.07 to 0.070.2790.279
F30.09−0.05 to 0.050.0010.002
F40.08−0.05 to 0.050.0030.004
more
boring
F10.03−0.05 to 0.060.1550.155
F2−0.24−0.06 to 0.060.0010.001
F30.11−0.05 to 0.050.0010.001
F4−0.16−0.06 to 0.050.0010.001
more
depressing
F10.36−0.07 to 0.070.0010.002
F2−0.06−0.06 to 0.060.0230.023
F3−0.07−0.05 to 0.050.0010.002
F4−0.08−0.06 to 0.060.0050.007

References

  1. Dujardin, C.; Selod, H.; Thomas, I. Residential Segregation and Unemployment: The Case of Brussels. Urban Stud. 2008, 45, 89–113. [Google Scholar] [CrossRef]
  2. Massey, D.S.; Denton, N.A. The Dimensions of Residential Segregation. Soc. Forces 1988, 67, 281–315. [Google Scholar] [CrossRef]
  3. Harvey, D. From Managerialism to Entrepreneurialism: The Transformation in Urban Governance in Late Capitalism. Geogr. Annaler. Ser. B Hum. Geogr. 1989, 71, 3–17. [Google Scholar] [CrossRef]
  4. Hillier, B.; Hanson, J. The Social Logic of Space; Cambridge University Press: Cambridge, UK, 1984. [Google Scholar]
  5. Chen, F.; Nielsen, C.P.; Wu, J.; Chen, X. Examining Socio-Spatial Differentiation under Housing Reform and Its Implications for Mobility in Urban China. Habitat Int. 2022, 119, 102498. [Google Scholar] [CrossRef]
  6. Harvey, D. The Right to the City. New Left Rev. 2008, 53, 23–40. [Google Scholar] [CrossRef]
  7. Soja, E.W. Seeking Spatial Justice; University of Minnesota Press: Minneapolis, MN, USA, 2010. [Google Scholar]
  8. Oxford Reference Entry. Available online: https://www.oxfordreference.com/display/10.1093/oi/authority.20110803100521633 (accessed on 14 September 2025).
  9. Smith, N. The New Urban Frontier: Gentrification and the Revanchist City, 1st ed.; Routledge: Abingdon, UK, 1996. [Google Scholar]
  10. Luisa Maffini, A.; Maraschin, C. Urban Segregation and Socio-Spatial Interactions: A Configurational Approach. Urban Sci. 2018, 2, 55. [Google Scholar] [CrossRef]
  11. Knox, P.; Pinch, S. Urban Social Geography: An Introduction; Routledge: Abingdon, UK, 2014. [Google Scholar]
  12. Musterd, S. Handbook of Urban Segregation; Edward Elgar Publishing: Cheltenham, UK, 2020; ISBN 978-1-78811-560-5. [Google Scholar]
  13. Sassen, S. The Global City: New York, London, Tokyo; Princeton University Press: Princeton, NJ, USA, 2001. [Google Scholar]
  14. Swyngedouw, E.; Heynen, N.C. Urban Political Ecology, Justice and the Politics of Scale. Antipode 2003, 35, 898–918. [Google Scholar] [CrossRef]
  15. Legeby, A. Urban Segregation and Urban Form: From Residential Segregation to Segregation in Public Space; KTH: Stockholm, Sweden, 2010. [Google Scholar]
  16. Gaffikin, F.; Morrissey, M. Planning in Divided Cities; Wiley-Blackwell: Oxford, UK, 2011. [Google Scholar]
  17. Marcuse, P. Gentrification, Abandonment, and Displacement. J. Urban Contemp. Law 1985, 28, 195–240. [Google Scholar]
  18. Lehman-Frisch, S. La ségrégation: Une injustice spatiale? Questions de recherche. Ann. De Géographie 2009, 665–666, 94–115. [Google Scholar] [CrossRef]
  19. Duncan, O.D.; Duncan, B. A Methodological Analysis of Segregation Indexes. Am. Sociol. Rev. 1955, 20, 210–217. [Google Scholar] [CrossRef]
  20. Reardon, S.F.; O’Sullivan, D. Measures of Spatial Segregation. Sociol. Methodol. 2004, 34, 121–162. [Google Scholar] [CrossRef]
  21. Maloutas, T. Socio-Economic Segregation in Athens at the Beginning of the Twenty-First Century. In Socio-Economic Segregation in European Capital Cities: East Meets West; Routledge: London, UK; New York, NY, USA, 2016; pp. 156–185. [Google Scholar]
  22. Faka, A.; Kalogeropoulos, K.; Maloutas, T.; Chalkias, C. Spatial Variability and Clustering of Quality of Life at Local Level: A Geographical Analysis in Athens, Greece. ISPRS Int. J. Geo-Inf. 2022, 11, 276. [Google Scholar] [CrossRef]
  23. Noble, M.; Wright, G.; Smith, G.; Dibben, C. Measuring Multiple Deprivation at the Small-Area Level. Environ. Plan. A 2006, 38, 169–185. [Google Scholar] [CrossRef]
  24. Livingston, M.; Lee, D. “The Glasgow Effect?” The Result of the Geographical Patterning of Deprived Areas? Health Place 2014, 29, 1–9. [Google Scholar] [CrossRef]
  25. Butina, G.W.; Bentley, I. Identity by Design; Elsevier: Oxford, UK, 2007. [Google Scholar]
  26. Bentley, I.; Alcock, A.; Murrain, P.; McGlynn, S.; Smith, G. Responsive Environments: A Manual for Designers; Architectural Press: London, UK, 1985. [Google Scholar]
  27. Batty, M. Defining Geodesign (= GIS + Design?). Environ. Plan. B Plan. Des. 2013, 40, 1–2. [Google Scholar] [CrossRef]
  28. Batty, M. Cities and Complexity: Understanding Cities with Cellular Automata, Agent-Based Models, and Fractals; MIT Press: Cambridge, MA, USA, 2007. [Google Scholar]
  29. Montello, D.R. Cognitive Research in GIScience: Recent Achievements and Future Prospects. Geogr. Compass 2009, 3, 1824–1840. [Google Scholar] [CrossRef]
  30. Nasar, J.L. The Evaluative Image of the City; Sage: Thousand Oaks, CA, USA, 1998. [Google Scholar]
  31. Quercia, D.; Schifanella, R.; Aiello, L.M. The Shortest Path to Happiness: Recommending Beautiful, Quiet, and Happy Routes in the City. In Proceedings of the 25th ACM Conference on Hypertext and Social Media, Santiago, Chile, 1–4 September 2014; ACM: New York, NY, USA, 2014; pp. 116–125. [Google Scholar]
  32. Rossetti, T.; Lobel, H.; Rocco, V.; Hurtubia, R. Explaining Subjective Perceptions of Public Spaces as a Function of the Built Environment: A Massive Data Approach. Landsc. Urban Plan. 2019, 181, 169–178. [Google Scholar] [CrossRef]
  33. De Nadai, M.; Vieriu, R.L.; Zen, G.; Dragicevic, S.; Naik, N.; Caraviello, M.; Hidalgo, C.A.; Sebe, N.; Lepri, B. Are Safer Looking Neighborhoods More Lively? A Multimodal Investigation into Urban Life. In Proceedings of the 24th ACM International Conference on Multimedia, Amsterdam, The Netherlands, 1 October 2016; Association for Computing Machinery: New York, NY, USA; pp. 1127–1135. [Google Scholar]
  34. Salesses, P.; Schechtner, K.; Hidalgo, C.A. The Collaborative Image of the City: Mapping the Inequality of Urban Perception. PLoS ONE 2013, 8, e68400. [Google Scholar] [CrossRef]
  35. Jiang, Y.; Zhu, Y.; Tang, F.; Chung, T.; Wu, B. Residential Segregation, Perceived Neighborhood Environment, and All-Cause Mortality Among Community-Dwelling Older Chinese Americans. J. Gerontol. B Psychol. Sci. Soc. Sci. 2023, 78, 2071–2079. [Google Scholar] [CrossRef] [PubMed]
  36. Dixon, J.; Sturgeon, B.; Huck, J.; Hocking, B.; Jarman, N.; Bryan, D.; Whyatt, D.; Davies, G.; Tredoux, C. Navigating the Divided City: Place Identity and the Time-Geography of Segregation. J. Environ. Psychol. 2022, 84, 101908. [Google Scholar] [CrossRef]
  37. Roberto, E.; Korver-Glenn, E. The Spatial Structure and Local Experience of Residential Segregation. Spat. Demogr. 2021, 9, 277–307. [Google Scholar] [CrossRef]
  38. Pfirsch, T.; Semi, G. Segregation in the Cities of the European Mediterranean. Méditerranée Rev. Géograph. Pays Méditerranéens 2016, 15–23. [Google Scholar]
  39. Grzegorczyk, A. Residential Segregation and Socio-Spatial Processes in Marseille. Urban Social Sustainability Challenge. Bull. Geogr. Socio-Econ. Ser. 2021, 52, 25–38. [Google Scholar] [CrossRef]
  40. Garcia-Lopez, M.À.; Nicolini, R.; Roig, J.L. Segregation and Urban Spatial Structure in Barcelona. Pap. Reg. Sci. 2020, 99, 749–772. [Google Scholar] [CrossRef]
  41. Lynch, K. The Image of the City; MIT Press: Cambridge, MA, USA, 1960. [Google Scholar]
  42. Norberg-Schulz, C. Genius Loci: Towards a Phenomenology of Architecture; Rizzoli: New York, NY, USA, 1980; ISBN 978-0-8478-0287-6. [Google Scholar]
  43. Kostof, S. The City Shaped: Urban Patterns and Meanings Through History; Bulfinch Press: Boston, MA, USA, 1991; ISBN 978-0-8212-1867-9. [Google Scholar]
  44. Cullen, G. The Concise Townscape; Routledge: New York, NY, USA, 1961. [Google Scholar]
  45. Appleyard, D.; Myer, J.R.; Lynch, K. The View from the Road; Harvard-MIT Joint Center for Urban Studies Series; MIT Press: Cambridge, MA, USA, 1965; ISBN 978-0-262-01015-3. [Google Scholar]
  46. Whyte, W.H. The Social Life of Small Urban Spaces; Conservation Foundation: Washington, DC, USA, 1980. [Google Scholar]
  47. Jacobs, A.B. Great Streets; MIT Press: Cambridge, MA, USA, 1993; ISBN 978-0-262-10048-9. [Google Scholar]
  48. Tversky, B. Structures Of Mental Spaces: How People Think About Space. Environ. Behav. 2003, 35, 66–80. [Google Scholar] [CrossRef]
  49. Batty, M. Big Data, Smart Cities and City Planning. Dialogues Hum. Geogr. 2013, 3, 274–279. [Google Scholar] [CrossRef] [PubMed]
  50. Cranshaw, J.; Schwartz, R.; Hong, J.; Sadeh, N. The Livehoods Project: Utilizing Social Media to Understand the Dynamics of a City. In Proceedings of the international AAAI conference on web and social media, Copenhagen, Denmark, 23–26 June 2012; Volume 6, pp. 58–65. [Google Scholar] [CrossRef]
  51. Hollenstein, L.; Purves, R. Exploring Place through User-Generated Content: Using Flickr Tags to Describe City Cores. J. Spat. Inf. Sci. 2010, 1, 21–48. [Google Scholar]
  52. Dunkel, A. Visualizing the Perceived Environment Using Crowdsourced Photo Geodata. Landsc. Urban Plan. 2015, 142, 173–186. [Google Scholar] [CrossRef]
  53. Biljecki, F.; Ito, K. Street View Imagery in Urban Analytics and GIS: A Review. Landsc. Urban Plan. 2021, 215, 104217. [Google Scholar] [CrossRef]
  54. Zhang, F.; Salazar-Miranda, A.; Duarte, F.; Vale, L.; Hack, G.; Chen, M.; Liu, Y.; Batty, M.; Ratti, C. Urban Visual Intelligence: Studying Cities with Artificial Intelligence and Street-Level Imagery. Ann. Am. Assoc. Geogr. 2024, 114, 876–897. [Google Scholar] [CrossRef]
  55. Wei, J.; Yue, W.; Li, M.; Gao, J. Mapping Human Perception of Urban Landscape from Street-View Images: A Deep-Learning Approach. Int. J. Appl. Earth Obs. Geoinf. 2022, 112, 102886. [Google Scholar] [CrossRef]
  56. Abascal, A.; Vanhuysse, S.; Grippa, T.; Rodriguez-Carreño, I.; Georganos, S.; Wang, J.; Kuffer, M.; Martinez-Diez, P.; Santamaria-Varas, M.; Wolff, E. AI Perceives like a Local: Predicting Citizen Deprivation Perception Using Satellite Imagery. npj Urban Sustain. 2024, 4, 20. [Google Scholar] [CrossRef]
  57. Danish, M.; Labib, S.M.; Ricker, B.; Helbich, M. A Citizen Science Toolkit to Collect Human Perceptions of Urban Environments Using Open Street View Images. Comput. Environ. Urban Syst. 2025, 116, 102207. [Google Scholar] [CrossRef]
  58. Zhang, J.; Li, Y.; Fukuda, T.; Wang, B. Urban Safety Perception Assessments via Integrating Multimodal Large Language Models with Street View Images. Cities 2025, 165, 106122. [Google Scholar] [CrossRef]
  59. Zhou, Q.; Zhang, J.; Zhu, Z. Evaluating Urban Visual Attractiveness Perception Using Multimodal Large Language Model and Street View Images. Buildings 2025, 15, 2970. [Google Scholar] [CrossRef]
  60. Kang, H.-W.; Kang, H.-B. Prediction of Crime Occurrence from Multi-Modal Data Using Deep Learning. PLoS ONE 2017, 12, e0176244. [Google Scholar] [CrossRef]
  61. Hou, Y.; Quintana, M.; Khomiakov, M.; Yap, W.; Ouyang, J.; Ito, K.; Wang, Z.; Zhao, T.; Biljecki, F. Global Streetscapes—A Comprehensive Dataset of 10 Million Street-Level Images across 688 Cities for Urban Science and Analytics. ISPRS J. Photogramm. Remote Sens. 2024, 215, 216–238. [Google Scholar] [CrossRef]
  62. Dubey, A.; Naik, N.; Parikh, D.; Raskar, R.; Hidalgo, C.A. Deep Learning the City: Quantifying Urban Perception at a Global Scale. In Proceedings of the Computer Vision—ECCV 2016; Leibe, B., Matas, J., Sebe, N., Welling, M., Eds.; Springer International Publishing: Cham, Switzerland, 2016; pp. 196–212. [Google Scholar]
  63. Ito, K.; Zhu, Y.; Abdelrahman, M.; Liang, X.; Fan, Z.; Hou, Y.; Zhao, T.; Ma, R.; Fujiwara, K.; Ouyang, J.; et al. ZenSVI: An Open-Source Software for the Integrated Acquisition, Processing and Analysis of Street View Imagery towards Scalable Urban Science. Comput. Environ. Urban Syst. 2025, 119, 102283. [Google Scholar] [CrossRef]
  64. Li, X.; Zhang, C.; Li, W. Does the Visibility of Greenery Increase Perceived Safety in Urban Areas? Evidence from the Place Pulse 1.0 Dataset. ISPRS Int. J. Geo-Inf. 2015, 4, 1166–1183. [Google Scholar] [CrossRef]
  65. Zhang, Y.; Wang, X.; Ye, Y.; Wang, L.; Zhang, Y.; Qin, W.; Chi, Y.; Liu, G.; Yao, S. Nonlinear Relationships and Interaction Effects of Urban Built Environment on Urban Vitality Based on Explainable Machine Learning. City Environ. Interact. 2025, 28, 100244. [Google Scholar] [CrossRef]
  66. Le, Q.H.; Dinh, N.N.H.; Kim, B.; Ahn, Y. Scalable Transfer Learning Framework for Capturing Human Perceptions of Place through Visual-Aural Data Integration. Cities 2025, 166, 106286. [Google Scholar] [CrossRef]
  67. Gemenetzi, G. Thessaloniki: The Changing Geography of the City and the Role of Spatial Planning. Cities 2017, 64, 88–97. [Google Scholar] [CrossRef]
  68. Maloutas, T. Segregation, Social Polarization and Immigration in Athens during the 1990s: Theoretical Expectations and Contextual Difference. Int. J. Urban Reg. Res. 2007, 31, 733–758. [Google Scholar] [CrossRef]
  69. Arapoglou, V.; Maloutas, T. Segregation, Inequality and Marginality in Context: The Case of Athens. Greek Rev. Soc. Res. 2011, 136, 135–155. [Google Scholar] [CrossRef]
  70. Arapoglou, V.P.; Spyrellis, S.N. Arrival Infrastructures: Segregation of Displaced Migrants and Processes of Urban Change in Athens. Geographies 2024, 4, 182–202. [Google Scholar] [CrossRef]
  71. Leontidou, L. The Mediterranean City in Transition: Social Change and Urban Development; Cambridge University Press: Cambridge, MA, USA, 1990. [Google Scholar]
  72. Leontidou, L. Alternatives to Modernism in (Southern) Urban Theory: Exploring In-Between Spaces. Int. J. Urban Reg. Res. 1996, 20, 178–195. [Google Scholar] [CrossRef]
  73. Maloutas, T. The Social Geography of Athens: Social Groups and Structured Environment in a Southern European Metropolis; Alexandreia: Athens, Greece, 2018. [Google Scholar]
  74. Hellenic Statistical Authority (ELSTAT). 2011 Population and Housing Census: Final Results. Available online: https://www.statistics.gr/en/2011-census-pop-hous (accessed on 14 September 2025).
  75. Kalogirou, N. The Palimpsest of Aristotelous: Byzantine Visions and Eclectic Localism; University Studio Press: Thessaloniki, Greece, 2021. [Google Scholar]
  76. Lagopoulos, A. Monumental Urban Space and National Identity: The Early Twentieth Century New Plan of Thessaloniki. J. Hist. Geogr. 2005, 31, 61–77. [Google Scholar] [CrossRef]
  77. Yerolympos, A. Thessaloniki (Salonika) before and after 1917. Twentieth Century Planning versus 20 Centuries of Urban Evolution. Plan. Perspect. 1988, 3, 141–166. [Google Scholar] [CrossRef]
  78. Oikonomou, M.; Christodoulou, C. Evolution and Transformation Processes of Urban Form: Urban Tissues in Thessaloniki, Greece. In Proceedings of the XXIX International Seminar on Urban Form ISUF 2022 Urban Redevelopment and Revitalisation. A Multidisciplinary Perspective, Łódź, Poland; Kraków, Poland, 6 June–11 September 2022; Lodz University of Technology Press: Łódź, Poland. [Google Scholar]
  79. Lagarias, A. Exploring Land Use Policy Scenarios with the Use of a Cellular Automata-Based Model: Urban Sprawl Containment and Sustainable Development in Thessaloniki. Geocarto Int. 2015, 30, 1033–1051. [Google Scholar] [CrossRef]
  80. Lafazani, P.; Lagarias, A. Applying Multiple and Logistic Regression Models to Investigate Periurban Processes in Thessaloniki, Greece. Geocarto Int. 2016, 31, 927–942. [Google Scholar] [CrossRef]
  81. National Printing House. Adjustment of the Starting Prices of the Areas Included in the System of Objective Determination of the Taxable Value of Real Estate and Entry into Force of the Provisions of Article 41 of Law 1249/1982, and Determination of Starting Prices and Their Adjustment Coefficients for the Determination of the Taxable Value of Real Estate Located in Other Areas within the Plan or Boundaries of Settlements According to the Objective System. Government Gazette of the Hellenic Republic, Series B, No. 2375/21-05-2021. Available online: https://www.et.gr/api/DownloadFeksApi/?fek_pdf=20210202375 (accessed on 13 September 2025).
  82. Jolliffe, I.T.; Cadima, J. Principal Component Analysis: A Review and Recent Developments. Philos. Trans. R. Soc. A Math. Phys. Eng. Sci. 2016, 374, 20150202. [Google Scholar] [CrossRef]
  83. Anselin, L. Local Indicators of Spatial Association—LISA. Geogr. Anal. 1995, 27, 93–115. [Google Scholar] [CrossRef]
  84. Pearson, K. VII. Mathematical Contributions to the Theory of Evolution.—III. Regression, Heredity, and Panmixia. Philos. Trans. R. Soc. London. Ser. A Contain. Pap. A Math. or Phys. Character 1896, 187, 253–318. [Google Scholar] [CrossRef]
  85. ΕΚΚΕ-ΕLSTAT Panorama of Greek Census Data 1991–2011. Available online: https://panoramaps2.statistics.gr/ (accessed on 14 September 2025).
  86. Crawley, A.; Beynon, M.; Munday, M. Making Location Quotients More Relevant as a Policy Aid in Regional Spatial Analysis. Urban Stud. 2013, 50, 1854–1869. [Google Scholar] [CrossRef]
  87. Kaiser, H.F. An Index of Factorial Simplicity. Psychometrika 1974, 39, 31–36. [Google Scholar] [CrossRef]
  88. Bartlett, M.S. Tests of Significance in Factor Analysis. Br. J. Psychol. 1950, 3, 77–85. [Google Scholar] [CrossRef]
  89. Mapillary. Available online: https://www.mapillary.com/app/ (accessed on 29 April 2025).
  90. KartaView. Available online: https://kartaview.org/ (accessed on 29 April 2025).
  91. Benjamini, Y.; Hochberg, Y. Controlling the False Discovery Rate: A Practical and Powerful Approach to Multiple Testing. J. R. Stat. Soc. Ser. B (Methodol.) 1995, 57, 289–300. [Google Scholar] [CrossRef]
  92. Arbaci, S. Ethnic Segregation, Housing Systems and Welfare Regimes in Europe. Eur. J. Hous. Policy 2007, 7, 401–433. [Google Scholar] [CrossRef]
  93. Malheiros, J. Ethni-Cities: Residential Patterns in the Northern European and Mediterranean Metropolises. Implications for Pol-icy Design. Int. J. Popul. Geogr. 2002, 8, 107–134. [Google Scholar] [CrossRef]
  94. Gospodini, A. Urban Morphology and Place Identity in European Cities: Built Heritage and Innovative Design. J. Urban Des. 2004, 9, 225–248. [Google Scholar] [CrossRef]
Figure 1. Case study area, with municipalities and population density from Global Human Settlement Layer (https://human-settlement.emergency.copernicus.eu/ (accessed on 14 September 2025)).
Land 14 02083 g001
Figure 2. Methodological workflow.
Land 14 02083 g002
Figure 3. SVI density per H3 hexagon (resolution 9). Basemap: OpenStreetMap (Carto).
Land 14 02083 g003
Figure 4. Geographic distribution of areas with strong presence of each corresponding social or economic variable (LQ > 1.1) of Table 1 (SOC_LQ1 was not plotted since its maximum LQ value is < 1.1).
Land 14 02083 g004
Figure 5. Mapping of PCA factors F1–F4 in the metropolitan area of Thessaloniki.
Land 14 02083 g005
Figure 6. Safer (left) and livelier (right).
Land 14 02083 g006
Figure 7. Wealthier (left) and more beautiful (right).
Land 14 02083 g007
Figure 8. More boring (left) and more depressing (right).
Land 14 02083 g008
Figure 9. PCA correlation circle (varimax rotated axes).
Land 14 02083 g009
Table 1. Socio-economic variables analyzed.
VariableCodeDescription/Notes
Industrial EmploymentEC_LQ1Share of employed population in industrial sector.
Commercial & Public Sector EmploymentEC_LQ2Share of employed population in commerce and public sector.
DirectorsEC_LQ3ELSTAT Code 1 (Hellenic Statistical Authority, 2011)
Freelancers & Technology ProfessionsEC_LQ4ELSTAT Codes 2–3 (Hellenic Statistical Authority, 2011)
Office & ServicesEC_LQ5ELSTAT Codes 4–5 (Hellenic Statistical Authority, 2011)
TechniciansEC_LQ6ELSTAT Code 7 (Hellenic Statistical Authority, 2011)
Industrial & Non-Specialized WorkersEC_LQ7ELSTAT Codes 8–9 (Hellenic Statistical Authority, 2011)
Unemployment RateEC_LQ8% unemployed, relative to total employed (job-seekers included, non-active excluded).
Non-Active PopulationEC_LQ9% non-active, relative to total population.
Property ValuesEC_LQ10Official state-defined (“objective”) property values.
Nationality—Greek originSOC_LQ1Greek nationality.
Nationality—Developed countriesSOC_LQ2Western/Northern/Southern Europe and developed non-European countries.
Nationality—Eastern EuropeSOC_LQ3Non-developed Eastern European countries.
Nationality—Global SouthSOC_LQ4Middle East, North Africa, and other less developed countries.
Households with >1 carSOC_LQ52–6 cars per household.
Households without a carSOC_LQ6Zero-car households.
Households without internetSOC_LQ7No internet access.
Small residential spaceSOC_LQ8<20 m2 per person.
Large residential spaceSOC_LQ9>50 m2 per person.
Very High educationSOC_LQ10Master’s/PhD degrees (children < 5 years old excluded).
Very Low educationSOC_LQ11Primary school only or illiterate (children < 5 years old excluded).
Table 2. Rotated PCA component matrix (Varimax, loadings > |0.40|, smaller loadings are suppressed).
VariablePCA Component
F1F2F3F4
EC_LQ1 (Ind.)0.890
EC_LQ2 (Comm. & Publ. Sect.)−0.893
EC_LQ3 Directors 0.823
EC_LQ4 (Freelancers & Techn.) −0.719 0.610
EC_LQ6 (Technicians)0.666 −0.619
EC_LQ7 (Indust. & Non-Specialized)0.631 −0.639
EC_LQ8 (Unempl.) 0.782
EC_LQ9 (Non-active) 0.747
EC_LQ10 (Property Val.)−0.831
SOC_LQ1 (Greeks) −0.938
SOC_LQ3 (Eastern EU) 0.802
SOC_LQ4 (Global South) 0.870
SOC_LQ5 (>1 car) −0.563 −0.570
SOC_LQ6 (no car) 0.718 0.579
SOC_LQ7 (no Internet)0.4680.536 0.484
SOC_LQ8 (small residence)0.898
SOC_LQ9 (large residence)−0.822
SOC_LQ10 (v.high edu)−0.744
SOC_LQ11 (v.low edu)0.840
Table 3. Moran’s I global autocorrelation measure for the four factors and perceptual parameters. Min, max, coefficient of variation (CV) and Spearman’s ρ (I vs. radius) are also provided.
VariableMean Moran’s I (200–600 m radii)Min IMax ISt. Dev.CVρ
F10.7950.7550.8350.0310.0390
F20.7280.5990.9490.1380.189−1
F30.4170.380.4520.0290.070.4
F40.1650.1050.2510.0620.3771
wealthier0.6130.5860.6410.0230.0370.8
safer0.5870.5390.6210.0340.058−1
livelier0.5820.5380.6040.0280.0480.7
more beautiful0.4980.4250.580.060.12−1
more boring0.4680.4040.5180.0460.0990.4
more depressing0.4570.3420.5910.10.219−1
Table 4. Pearson correlation r between perception scores and socio-spatial factors F1–F4 for confidence interval (CI) 95%. p-value and q value are also calculated for FDR correction (5%).
PerceptionFactorrCI (95%)pq (BH-FDR)Significant (95% Level)
saferF1−0.47−0.53 to −0.41<0.0010.000
F20.120.04 to 0.190.0030.004
F3−0.06−0.14 to 0.010.1030.124
F40.180.11 to 0.25<0.0010.000
livelierF1−0.40−0.47 to −0.34<0.0010.000
F20.290.22 to 0.36<0.0010.000
F3−0.20−0.27 to −0.13<0.0010.000
F40.370.30 to 0.43<0.0010.000
wealthierF1−0.51−0.56 to −0.45<0.0010.000
F20.280.21 to 0.35<0.0010.000
F3−0.12−0.20 to −0.050.0010.002
F40.300.23 to 0.37<0.0010.000
more
beautiful
F1−0.43−0.49 to −0.36<0.0010.000
F20.00−0.07 to 0.080.9580.958
F30.190.12 to 0.26<0.0010.000
F40.04−0.04 to 0.110.3120.356
more
boring
F10.07−0.01 to 0.140.0760.096
F2−0.37−0.43 to −0.30<0.0010.000
F30.230.16 to 0.30<0.0010.000
F4−0.30−0.37 to −0.23<0.0010.000
more
depressing
F10.410.35 to 0.47<0.0010.000
F2−0.04−0.11 to 0.040.3350.365
F3−0.13−0.20 to −0.050.0010.002
F4−0.04−0.11 to 0.040.3530.368
Disclaimer/Publisher’s Note: The statements, opinions and data contained in all publications are solely those of the individual author(s) and contributor(s) and not of MDPI and/or the editor(s). MDPI and/or the editor(s) disclaim responsibility for any injury to people or property resulting from any ideas, methods, instructions or products referred to in the content.