Article

Investigation of the Influence of Urban Compactness on Transportation: A Comparative Analysis of Average Commuting Duration and Velocity

1
School of Tourism Management, Hubei University, Wuhan 430062, China
2
Hubei Digital Culture and Tourism Research Institute, Wuhan 430062, China
*
Author to whom correspondence should be addressed.
Land 2025, 14(10), 2082; https://doi.org/10.3390/land14102082 (registering DOI)
Submission received: 30 September 2025 / Revised: 15 October 2025 / Accepted: 16 October 2025 / Published: 18 October 2025

Abstract

Compact urban land use planning and smart growth are essential strategies for tackling the issues of sustainable urban transportation development. In the context of swift global urbanization, examining the intrinsic relationship between urban spatial structure and transport systems might furnish a measurable foundation for urban planning decisions. This study utilizes various data sources, including Chinese city compactness and the Didi traffic index, to integrate exploratory spatial analysis and regression analysis methods. It examines the influence of city compactness on urban transportation by comparing average commuting time and speed relative to city compactness. The following findings are derived: The compactness of Chinese cities demonstrates notable regional differentiation, with western cities expanding uniformly and efficiently, whereas eastern cities display multi-centered, differentiated development in their spatial structures. Furthermore, Chinese cities exhibit a pronounced high-value agglomeration in commuting patterns, where major cities are characterized by high speeds and extended durations. The study reveals that city compactness creates a “concentration paradox” in commuting efficiency, which may reduce commuting distances but significantly decreases speed and extends travel time. The solution to this conflict is to prioritize the enhancement of public transport systems, as the increase in passenger volume is strongly positively connected with improved commuting speed and reduced commuting time. These findings offer a crucial scientific foundation for developing diverse regional spatial plans and transport development strategies.

1. Introduction

Compact urban development represents a highly effective strategy for sustainable urbanization amidst fast population expansion [1]. In recent decades, the swift increase in the worldwide urban population and urban sprawl has precipitated numerous socioeconomic and environmental challenges [2]. The primary expressions include urban sprawl [3], reliance on motor mobility resulting in land resource overconsumption, traffic congestion, environmental degradation and social inequity [4]. Compact cities, characterized by elevated density, mixed land use, and pedestrian-centric lifestyles, have been suggested as a strategy for sustainable urban development [5]. The correlation between transportation and urban land use is a fundamental aspect of urban sustainable development research [6]. The intensity and mode of transportation demand are influenced by the level of spatial agglomeration, which subsequently impacts the operational efficiency and sustainability of the transportation system.
Current research indicates that compact cities facilitate sustainable development by decreasing travel volume, minimizing commute duration, and lowering reliance on automobiles [7]. In contrast to dispersed development, compact development leads to a reduction in vehicle miles traveled (VMT). Nevertheless, compact development may result in the centralization of travel sources and destinations. Given that VMT is positively connected with traffic congestion, lowering VMT via compact development inherently aids in alleviating congestion. Nonetheless, centralized travel will intensify congestion at certain locations, suggesting that the centralization effect resulting from compact development may really elevate traffic strain. At present, no research employs urban form indicators and congestion data to assess the influence of these opposing factors on regional traffic congestion [8].
The influence of compactness on transportation differs among various geographical and cultural contexts. China’s swift urbanization, distinctive planning framework, and extensive area offer a substantial case study for the examination of compact cities. The examination of compact city morphology in China is essential for addressing contemporary urban expansion challenges and serves as a significant reference for cities in emerging nations globally to attain sustainable development [9]. Chinese cities exhibit elevated population and construction density, with a swift rate of urbanization. Adapting urban compactness tactics and transportation research from European and American contexts to China’s high-density development presents significant challenges. Moreover, in light of China’s high-density urbanization context, comprehensive study on commuting speed and duration remains inadequate. This study is conducted at the scale of mainland China, with Chinese prefecture-level cities as the basic research units. Cities with different economic development levels and urban structures are selected to examine transportation scenarios. Using data such as the “China Urban Compactness”, “Didi Commute Traffic Metrics” and the “China City Statistical Yearbook”, regression analysis models are constructed. With the support of geographic information technology, the distribution characteristics of urban compactness are analyzed, and the internal mechanisms through which urban compactness affects traffic speed and time are thoroughly investigated. The aim is to provide a scientific basis for urban governance and transportation infrastructure construction in China.
This section presents literature regarding the effects of urban compactness on transportation. This review examines urban compactness metrics and the methods by which urban compactness influences transportation. Section 3 delineates the data sources and research methodologies employed. Section 4 examines the relationship and influencing mechanisms between transportation indicators and urban compactness data across several samples utilizing regression equation methodologies. Section 5 presents conclusions and analyzes the findings.

2. Literature Review

2.1. Measurement and Influencing Factors of Compact Cities

The notion of “compact city” was first articulated by Dantzig and Saaty (1973) as a framework for evaluating urban spatial morphology. Compact development has been acknowledged as an effective planning and policy instrument for advancing sustainable urbanism [10]. It is defined by high-density development, mixed land use, and efficient transportation systems, with the objective of mitigating urban sprawl [11]. At present, a singular definition of urban compactness is lacking; however, scholars agree that urban compactness must be dense in at least one dimension, including physical space, social space, urban functions, or the organization of social activities [12]. Burton initially introduced a complete indicator system to evaluate urban compactness, examining it from three viewpoints: high-density cities, mixed-use cities, and enhanced cities [13]. Various methodologies exist for quantifying urban compactness, with researchers selecting suitable combinations of dimensions and indicators according to the research scope, objectives, or data accessibility. The academic community often performs extensive assessments across multiple fundamental characteristics, such as density, functional diversity, urban morphology, and design, and has established matching comprehensive indexing methodologies [14,15,16]. The assessment of urban compactness has progressed from a singular density metric in its first stages to a multifaceted evaluation framework encompassing several variables and methodologies. Simultaneously, developing geographic spatial big data and computational tools are employed to precisely and dynamically assess urban morphology. Remote sensing technology establishes a global standard for urban measuring [17].
The compact configuration of a city reflects the evolution of its spatial structure. The primary elements influencing alterations in the geographical organization of urban areas include economic variables, demographic shifts, and social, political, institutional, physical, and environmental processes, along with infrastructure development and globalization dynamics [18]. Accelerated population expansion during urbanization significantly influences urban density [19]. The persistent concentration of population in the core metropolitan region has resulted in the expansion of construction land. This trend intensifies the intrinsic conflict between population density and land resources, leading to the disjointed expansion of urban space into adjacent regions, thus diminishing the compactness of suburban areas [20]. While population expansion is the principal catalyst for urban dispersion, the efficiency of urban agglomeration serves as the predominant centripetal force in the advancement of compact cities. Enhanced urban transport systems augment the accessibility and interconnection of cities, while alterations in spatial accessibility influence the magnitude and orientation of urban structure [9]. Moreover, investment in fundamental urban infrastructure enhances the advancement of compact cities [21].

2.2. The Influence of Urban Density on Transportation and Commute Patterns

The influence of urban compactness on transportation networks, as a strategy for sustainable urban growth, is a fundamental subject in urban research, transportation geography, and urban planning. Prior research has demonstrated that urban morphology significantly affects transportation behavior in urban areas [22]. A compact city may be either multi-centered or single-centered, contingent upon the concentration of population and employment at the local level. Consequently, examining both polycentricity and compactness may enhance the comprehension of urban spatial structure’s influence on commuting [23]. Urban areas in industrialized nations typically exhibit a more prevalent polycentric urban form [24]. In multi-center cities, commuting duration escalates with the city’s magnitude and the spatial distance between employment and residential areas. Commuting duration is positively associated with urban scale and the separation of employment from housing, although negatively associated with density and polycentricity [25]. Commuting behavior is influenced by the spatial distribution of employment and population [26], as well as the mode of travel and the socio-economic characteristics of commuters, including income, gender, and family attributes [27], which collectively dictate the chosen mode of commuting. Simultaneously, we acknowledge that the influence of compactness on transport is neither unequivocally beneficial nor detrimental, but is considerably influenced by the phase of urban development, geographical context, research scope, and particular aspects of compactness [28].
The influence of compactness on transportation commuting arises from the interplay of various elements. This leads us to contemplate the question: should various cities adopt a uniform compact growth paradigm to mitigate traffic challenges? In a country such as China, characterized by extensive territory and significant disparities in geographical environments and socio-economic development among cities [29], effective policy-making necessitates a nuanced, multi-faceted approach tailored to local contexts, rather than merely striving for high density.

2.3. The Intermediary Function of Commuting Efficiency in the Relationship Between Urban Compactness and Travel Behavior

From the standpoint of urban morphology, compact cities often adhere to certain fundamental principles, including high-density development, mixed-use land utilization, advanced public transportation systems, and well-connected street networks. These ideas are commonly regarded as enhancing infrastructure efficiency, improving public service accessibility, reducing carbon emissions, and decreasing commute distances, thereby yielding numerous favorable outcomes [30].
Commuting efficiency, often assessed by time or distance, serves a crucial mediating function in the correlation between urban compactness and travel behavior. The urban growth model significantly influences commuting efficiency [31]. The prevailing perspective is that a more compact city core enhances the efficacy of commuting distance reduction [32]. The condensed region consolidates departure and destination sites, hence diminishing per capita vehicle miles traveled (VMT) and resulting in a reduction in commute time. The accessibility of a destination is a significant predictor of vehicle mileage (VMT), with high density and mixed use being crucial for enhancing accessibility [15]. Compact communities generally demonstrate reduced reliance on motor vehicles and shorter commuting distances [7]; related research indicates that enhancing accessibility with neighborhood densification will decrease travel time. The sustainability of compact cities is achievable from a transportation standpoint [33].
The compact growth has exacerbated congestion-related delays, negating some of the beneficial effects on travel time [34]. In certain urban areas characterized by limited public transportation, underdevelopment, or high density, enhancing urban compactness will likely intensify traffic congestion, exacerbate the urban heat island effect, and elevate carbon emissions [35,36]. Increased density may result in prolonged commuting durations and localized congestion [28].

3. Materials and Methods

3.1. Data

3.1.1. Urban Compactness

Referring to Angel et al. and Harari [3], the average distance between any two points within the city is constructed to reflect the compactness of the urban spatial form. The maximum continuous built-up area of each city’s municipal district is extracted using land use remote sensing monitoring data from 2019, from the Resource and Environmental Science and Data Center of the Chinese Academy of Sciences. The ratio of the mean distance between any two points within an equal-area circle of the built-up area to the mean distance between any two points within the built-up area is calculated. The calculation of urban compactness is standardized to eliminate the interference of urban area on urban form. A higher urban compactness index value indicates a more compact urban spatial development, with shorter travel distances for residents within the city. This index largely reflects the convenience of residents’ travel. One advantage of using land use remote sensing monitoring data in this paper is that it can distinguish between land categories, defining “urban built-up area” land within the land category as urban area, which is consistent with the use of built-up area as urban area in the China City Statistical Yearbook. Built-up area refers to the area within the city limits that has been connected by municipal infrastructure, which can reflect the possible activity range of urban residents, which is consistent with the research purpose of this paper.

3.1.2. Traffic Commuting Index

The study primarily utilizes pertinent data from the 2019 Didi Chuxing report, focusing on metrics such as work–life balance, average travel distance, relative commuting duration, and relative commuting speed. Excluding cities with significant data loss and inadequate data volume, we further identified 204 prefecture-level cities that had initiated Didi ride-hailing services prior to 2017 and recorded an annual order volume surpassing 10,000. Didi Chuxing constructed the Didi Index. When the value of an indicator is positively correlated with the Didi Index, it is considered a positive indicator and is calculated using Formula (1); when negatively correlated, it is considered a negative indicator and is calculated using Formula (2). The calculation models for average commuting speed and morning rush-hour relative speed are as follows:
V = V i V min V max V min × 10
The calculation model for average commuting time and relative commuting time during the morning rush hour is as follows:
V = V max V i V max V min × 10
The calculation model for average commuting time and relative commuting time during the morning rush hour is as follows: where Vi is the raw data for the ith indicator in a certain region; Vmin is the minimum value for the ith indicator in the benchmark city; and Vmax is the maximum value for the ith indicator in the benchmark city.

3.1.3. Data from China City Statistical Yearbook

The control variable research data used in the regression model mainly comes from the “China City Statistical Yearbook” in 2020, including relevant data such as the number of registered residence population at the end of the year, the land area of administrative regions, the regional gross domestic product, the actual urban road area at the end of the year, and the total passenger volume of public transportation.

3.2. Methods

3.2.1. Exploratory Spatial Data Analysis

This study employs exploratory geographical data analysis techniques for comprehensive investigation. In the operational process, visual tools and spatial statistical analysis are two essential methodologies for doing research. Visualization technologies offer the benefit of intuitively showing facts. Geographic Information System (GIS) softwareArcMap (10.8) effectively visualizes commuting speed, duration, and urban density data in map format, facilitating an understanding of data distribution; spatial statistical testing meticulously examines data from a statistical standpoint to validate its spatial correlation, randomness, and other attributes. Utilize these two methodologies to thoroughly analyze the distribution patterns of commuting speed, time, and urban compactness, while considering the local clustering characteristics of the data. An exhaustive examination of commuting velocity, duration, and urban density can furnish a robust foundation for evaluating urban commuting efficiency and compactness.

3.2.2. Regression Equation Model

To deeply analyze the impact of urban compactness on commuting efficiency, this study selects relevant variables for analysis. Commuting efficiency is influenced by a combination of factors, including urban infrastructure, transportation facilities, and socioeconomic conditions. Among these, urban compactness is a core variable that reflects the degree of spatial intensification of urban form and has a direct or indirect impact on commuting efficiency. Socioeconomic conditions are also a key factor, and the degree of improvement of transportation facilities cannot be ignored. The layout of road networks, the coverage of public transportation, and other factors all have important impacts on commuting efficiency.
To investigate the impact of urban compactness on urban commuting efficiency, this study constructs the following regression model:
Y = α 0 + i = 1 n α i X i + β
where Y represents the traffic efficiency indicator, measured by average commuting speed Y1 and average commuting time Y2, respectively. X1 denotes the core independent variable, urban compactness, and X2–Xn represent the control variables, namely average travel distance, morning peak travel distance, year-end registered residence population, administrative area, year-end actual urban road area, and total public transport passenger volume. α0 is the constant term, α1, α2, …, αn are regression coefficients, and β is the random error term.

4. Results and Analysis

4.1. Analysis of Urban Compactness in China

To better understand the spatial and temporal distribution characteristics of urban compactness in China, we employed the natural breaks classification method to visualize the compactness of 370 prefecture-level cities across the country in 2019 (Figure 1a). To gain a more intuitive and comprehensive understanding of urban compactness in China, we conducted in-depth analysis at multiple scales.
From the perspective of the four major geographical divisions, the compactness of cities in the four regions presents a certain hierarchical distribution characteristic. The average compactness of the eastern region is the lowest, followed by the northeastern and central regions, while the western region exhibits the highest average level of urban compactness. Some cities in the eastern region have higher compactness, forming high-value centers. The compactness of cities in the Bohai Rim region and southeast coastal region is relatively low, showing a pattern of “multi-center and differentiation”. The spatial development of the western region is generally compact, with the smallest internal compactness differences, showing a relatively consistent spatial development pattern and exhibiting the characteristics of “uniform and efficient”. The northeastern region generally exhibits a spatial gradient increasing from southeast to northwest, with relatively high dispersion of urban compactness. This phenomenon indicates that there are significant differences in urban compactness within the region. The overall compactness of the central region is relatively high, but there are high internal differences in urban compactness.
After analyzing the characteristics of compactness in four major regions, we found that there are still significant differences in urban compactness across city clusters and provinces. Therefore, based on sample data, we conducted a systematic analysis of the differences in urban compactness within various city clusters in China, including the Pearl River Delta, Yangtze River Delta, Beijing–Tianjin–Hebei, Chengdu–Chongqing, Middle Reaches of the Yangtze River, Central Plains, and Harbin–Changchun.
The compactness of the seven major urban agglomerations exhibits significant internal spatial differentiation characteristics (Figure 1b). The Pearl River Delta urban agglomeration presents a significant core–periphery structure, with the core cities of Shenzhen and Guangzhou forming a high-compactness contiguous area with cities such as Foshan and Dongguan. The compactness of other cities within the agglomeration decreases significantly, indicating a gradual weakening of spatial development compactness as it extends from the core area to the periphery, indicating spatial inequality within the agglomeration. The Yangtze River Delta urban agglomeration exhibits a high-value overall equilibrium characteristic, with Shanghai, Hangzhou, Nanjing, Changzhou, Yangzhou, and other cities having high compactness values. This indicates that the urban agglomeration is not a single core, but rather a relatively balanced networked spatial structure supported by multiple high-compactness cities. The Beijing–Tianjin–Hebei urban agglomeration exhibits a trend of “high in the north and low in the south”, with Beijing and Tianjin as the two high-compactness cities surrounded by a discontinuous high-compactness ring composed of cities such as Langfang and Baoding. Outside this ring, especially in the southern region, there is a “collapse zone” of low compactness represented by Shijiazhuang and a vast area of medium compactness. The Yangtze River Middle Reaches urban agglomeration, consisting of some cities in Hubei, Hunan, and Jiangxi provinces, exhibits a robust pattern of “multiple cores leading and overall high values”. The provincial capitals form a high-compactness core, while non-provincial capitals also exhibit high compactness levels, indicating that the spatial intensive development of this urban agglomeration is not limited to the provincial capitals, but has formed a continuous high-compactness plate over a large area. Compared with the aforementioned urban agglomerations, the Central Plains urban agglomeration and the Harbin–Changchun urban agglomeration exhibit “low-lying” characteristics in overall compactness. The core city of Zhengzhou in the Central Plains urban agglomeration has an abnormally low compactness, while surrounding cities such as Luoyang and Kaifeng have higher compactness values, forming a unique spatial inversion phenomenon of “core collapse and peripheral high values”. The Harbin–Changchun urban agglomeration, except for the core cities, has low compactness values, revealing extreme inequality in spatial development within the urban agglomeration.
Overall, from the perspective of geographical zoning, the compactness of Chinese cities is uniform and efficient in the western region, with gradient differences in the northeastern region, significant polarization in the central region, and a multi-center differentiated pattern in the eastern region. From the perspective of spatial compactness, the Yangtze River Delta and the Yangtze River Middle Reaches urban agglomeration have higher development quality and better structure; the Pearl River Delta and Chengdu–Chongqing urban agglomeration have strong core driving forces but insufficient internal coordination; the Beijing–Tianjin–Hebei urban agglomeration has a more severe polarization phenomenon; and the Central Plains and Harbin–Changchun urban agglomeration face major challenges of weak core driving force and development model transformation.

4.2. Analysis of Commuting Speed and Time in Chinese Cities

4.2.1. Analysis of Spatial Characteristics of Commuting Speed

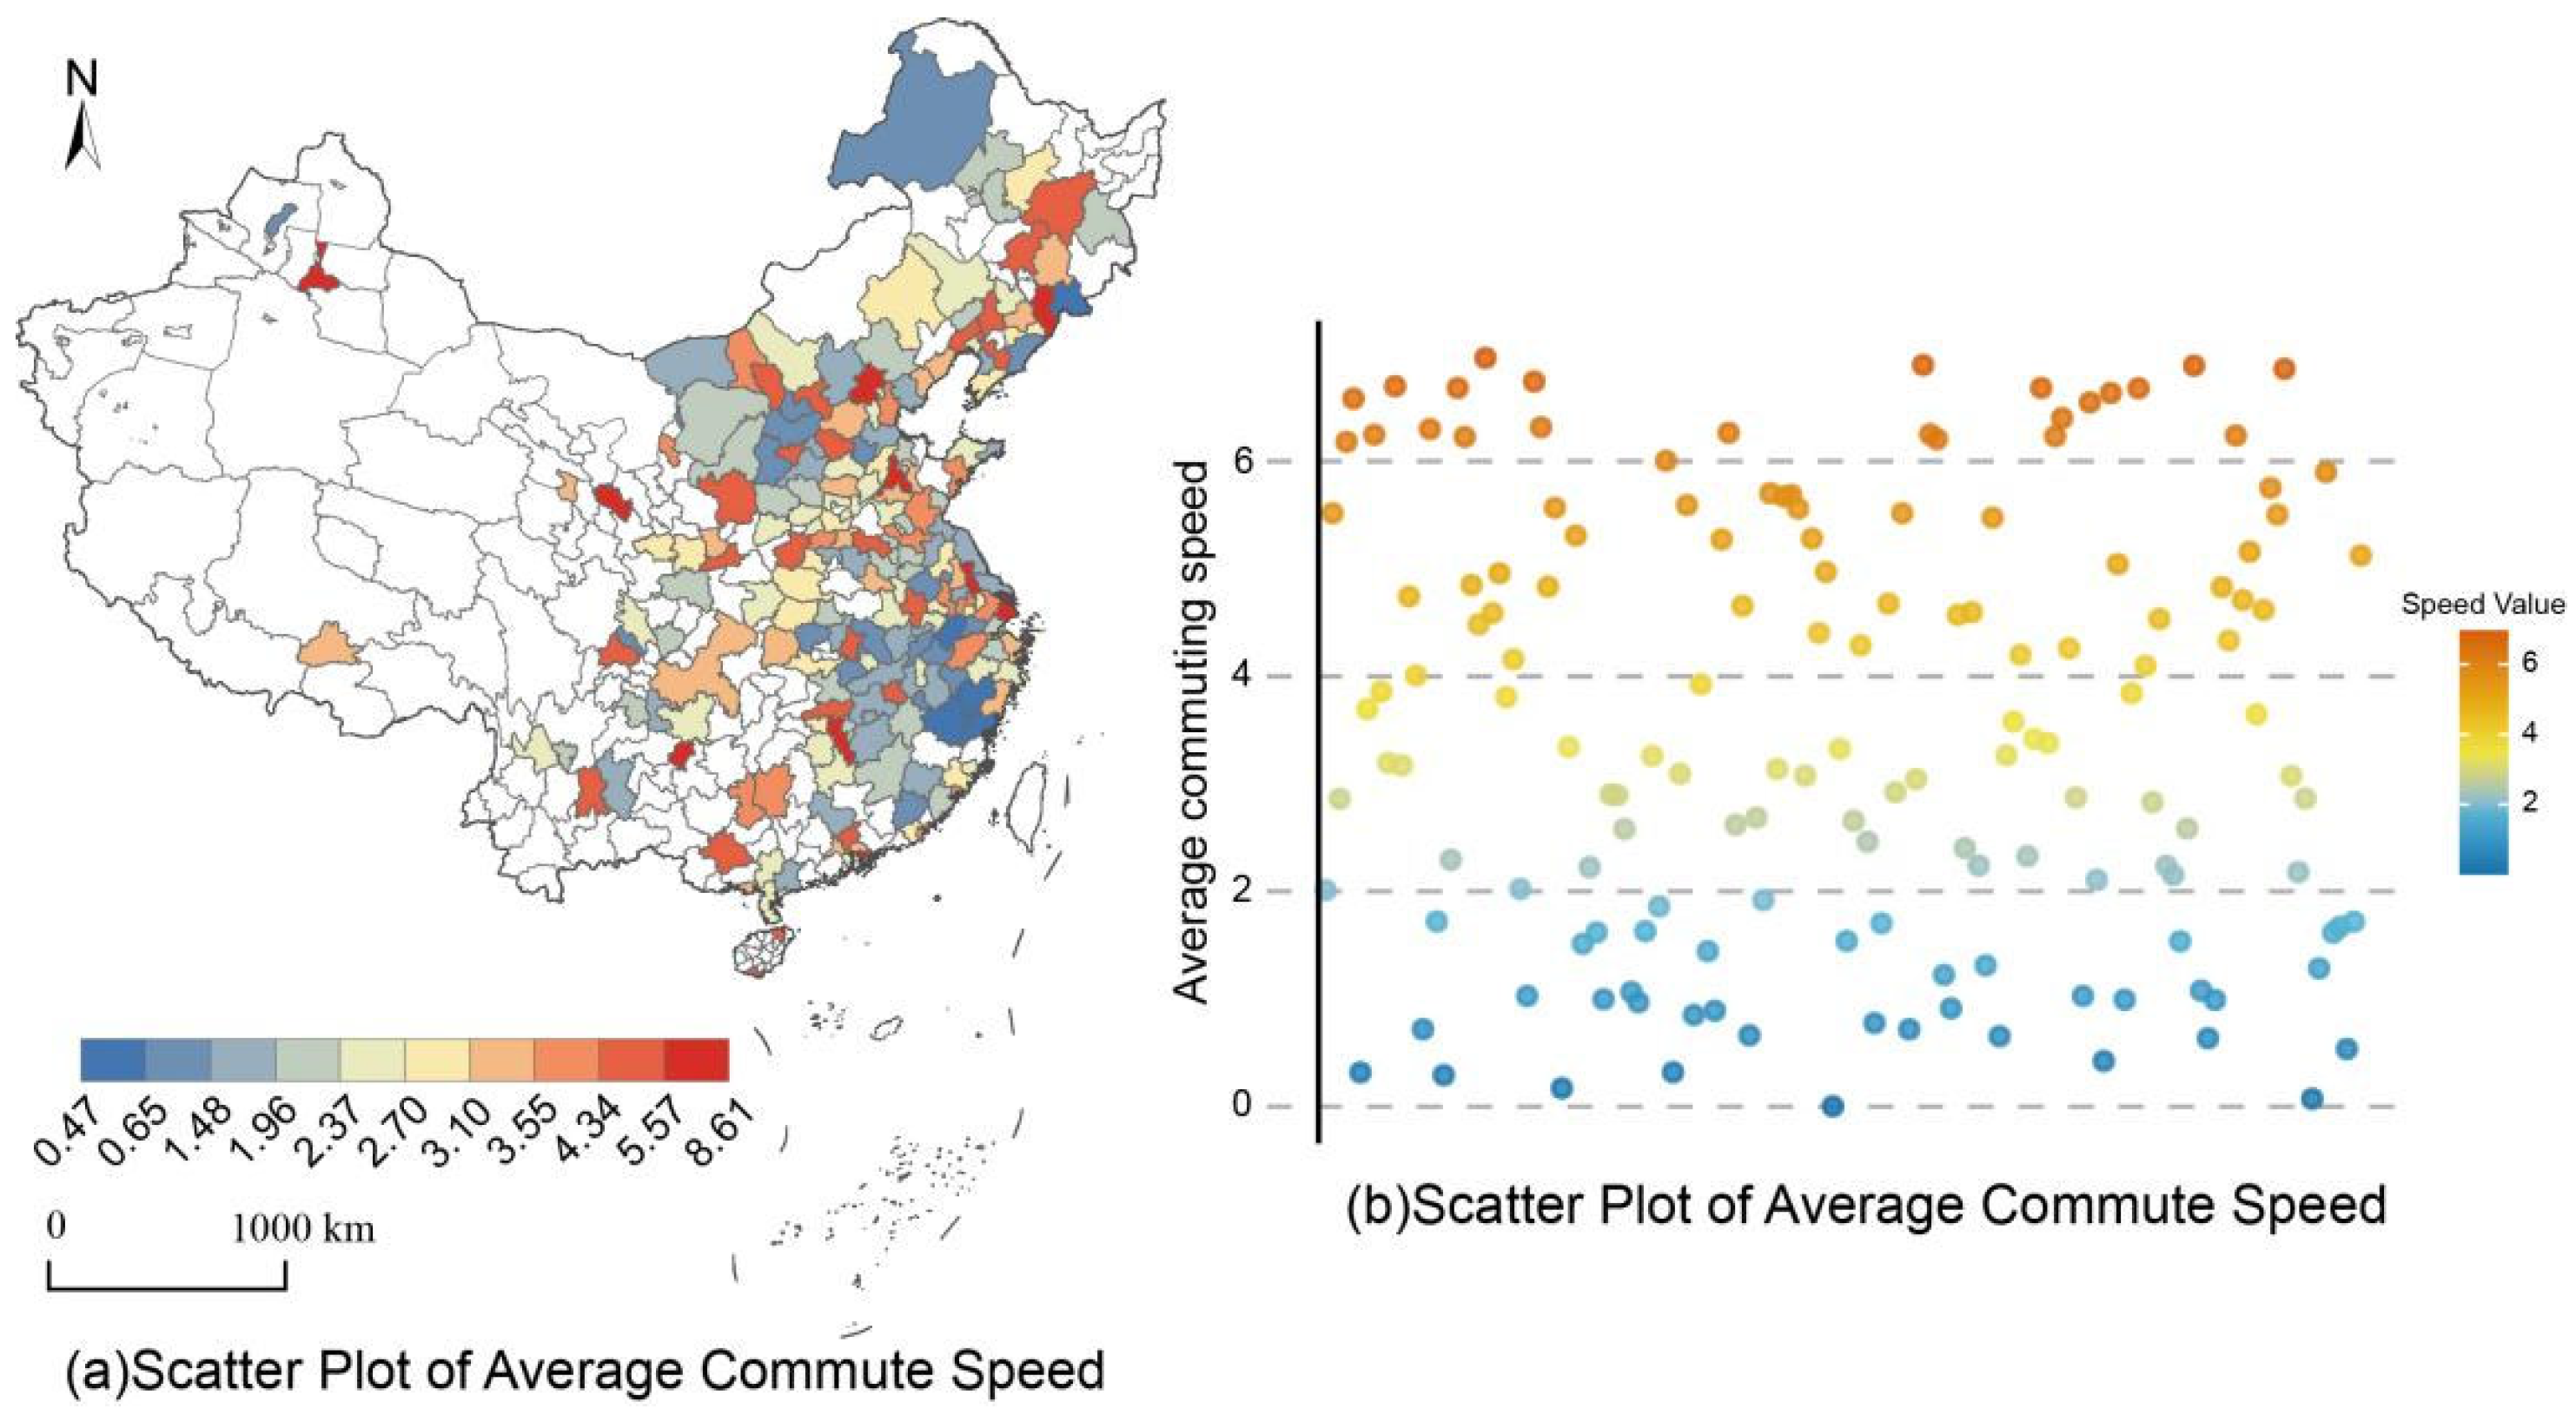
As a key link connecting urban space and social functions, resident commuting is a window to observe the impact of urban compactness on traffic commuting in China. Therefore, we will focus on the perspective of commuting and systematically analyze the spatial and temporal distribution characteristics of urban commuting speed and time in different regions. From the spatial distribution pattern (Figure 2), the high-value areas of commuting speed are spatially distributed in a “clustered” manner. The central and southern part of Liaoning Province, especially the region where the Liaoning Central South City Cluster is located, is one of the most significant high-value areas of commuting speed in the country. In the core areas of major city clusters such as Beijing–Tianjin–Hebei, Yangtze River Delta, and Pearl River Delta, there are also high-value points of commuting speed. From a national perspective, the commuting speed of some cities in Zhejiang and Jiangxi provinces is generally at a medium-to-low level, forming a contiguous concentrated area; this indicates that the spatial distribution of commuting speed within the two provinces is relatively homogeneous, and compared with other cities, the differences in commuting speed between different cities within the province are relatively small. It should be noted that high commuting speed does not necessarily equate to a good commuting experience or job–housing balance. There may be hidden issues such as long commuting distances, long commuting times, and high traffic congestion costs behind it. The influencing factors are still in need of further exploration.

4.2.2. Analysis of Spatial Characteristics of Commuting Time

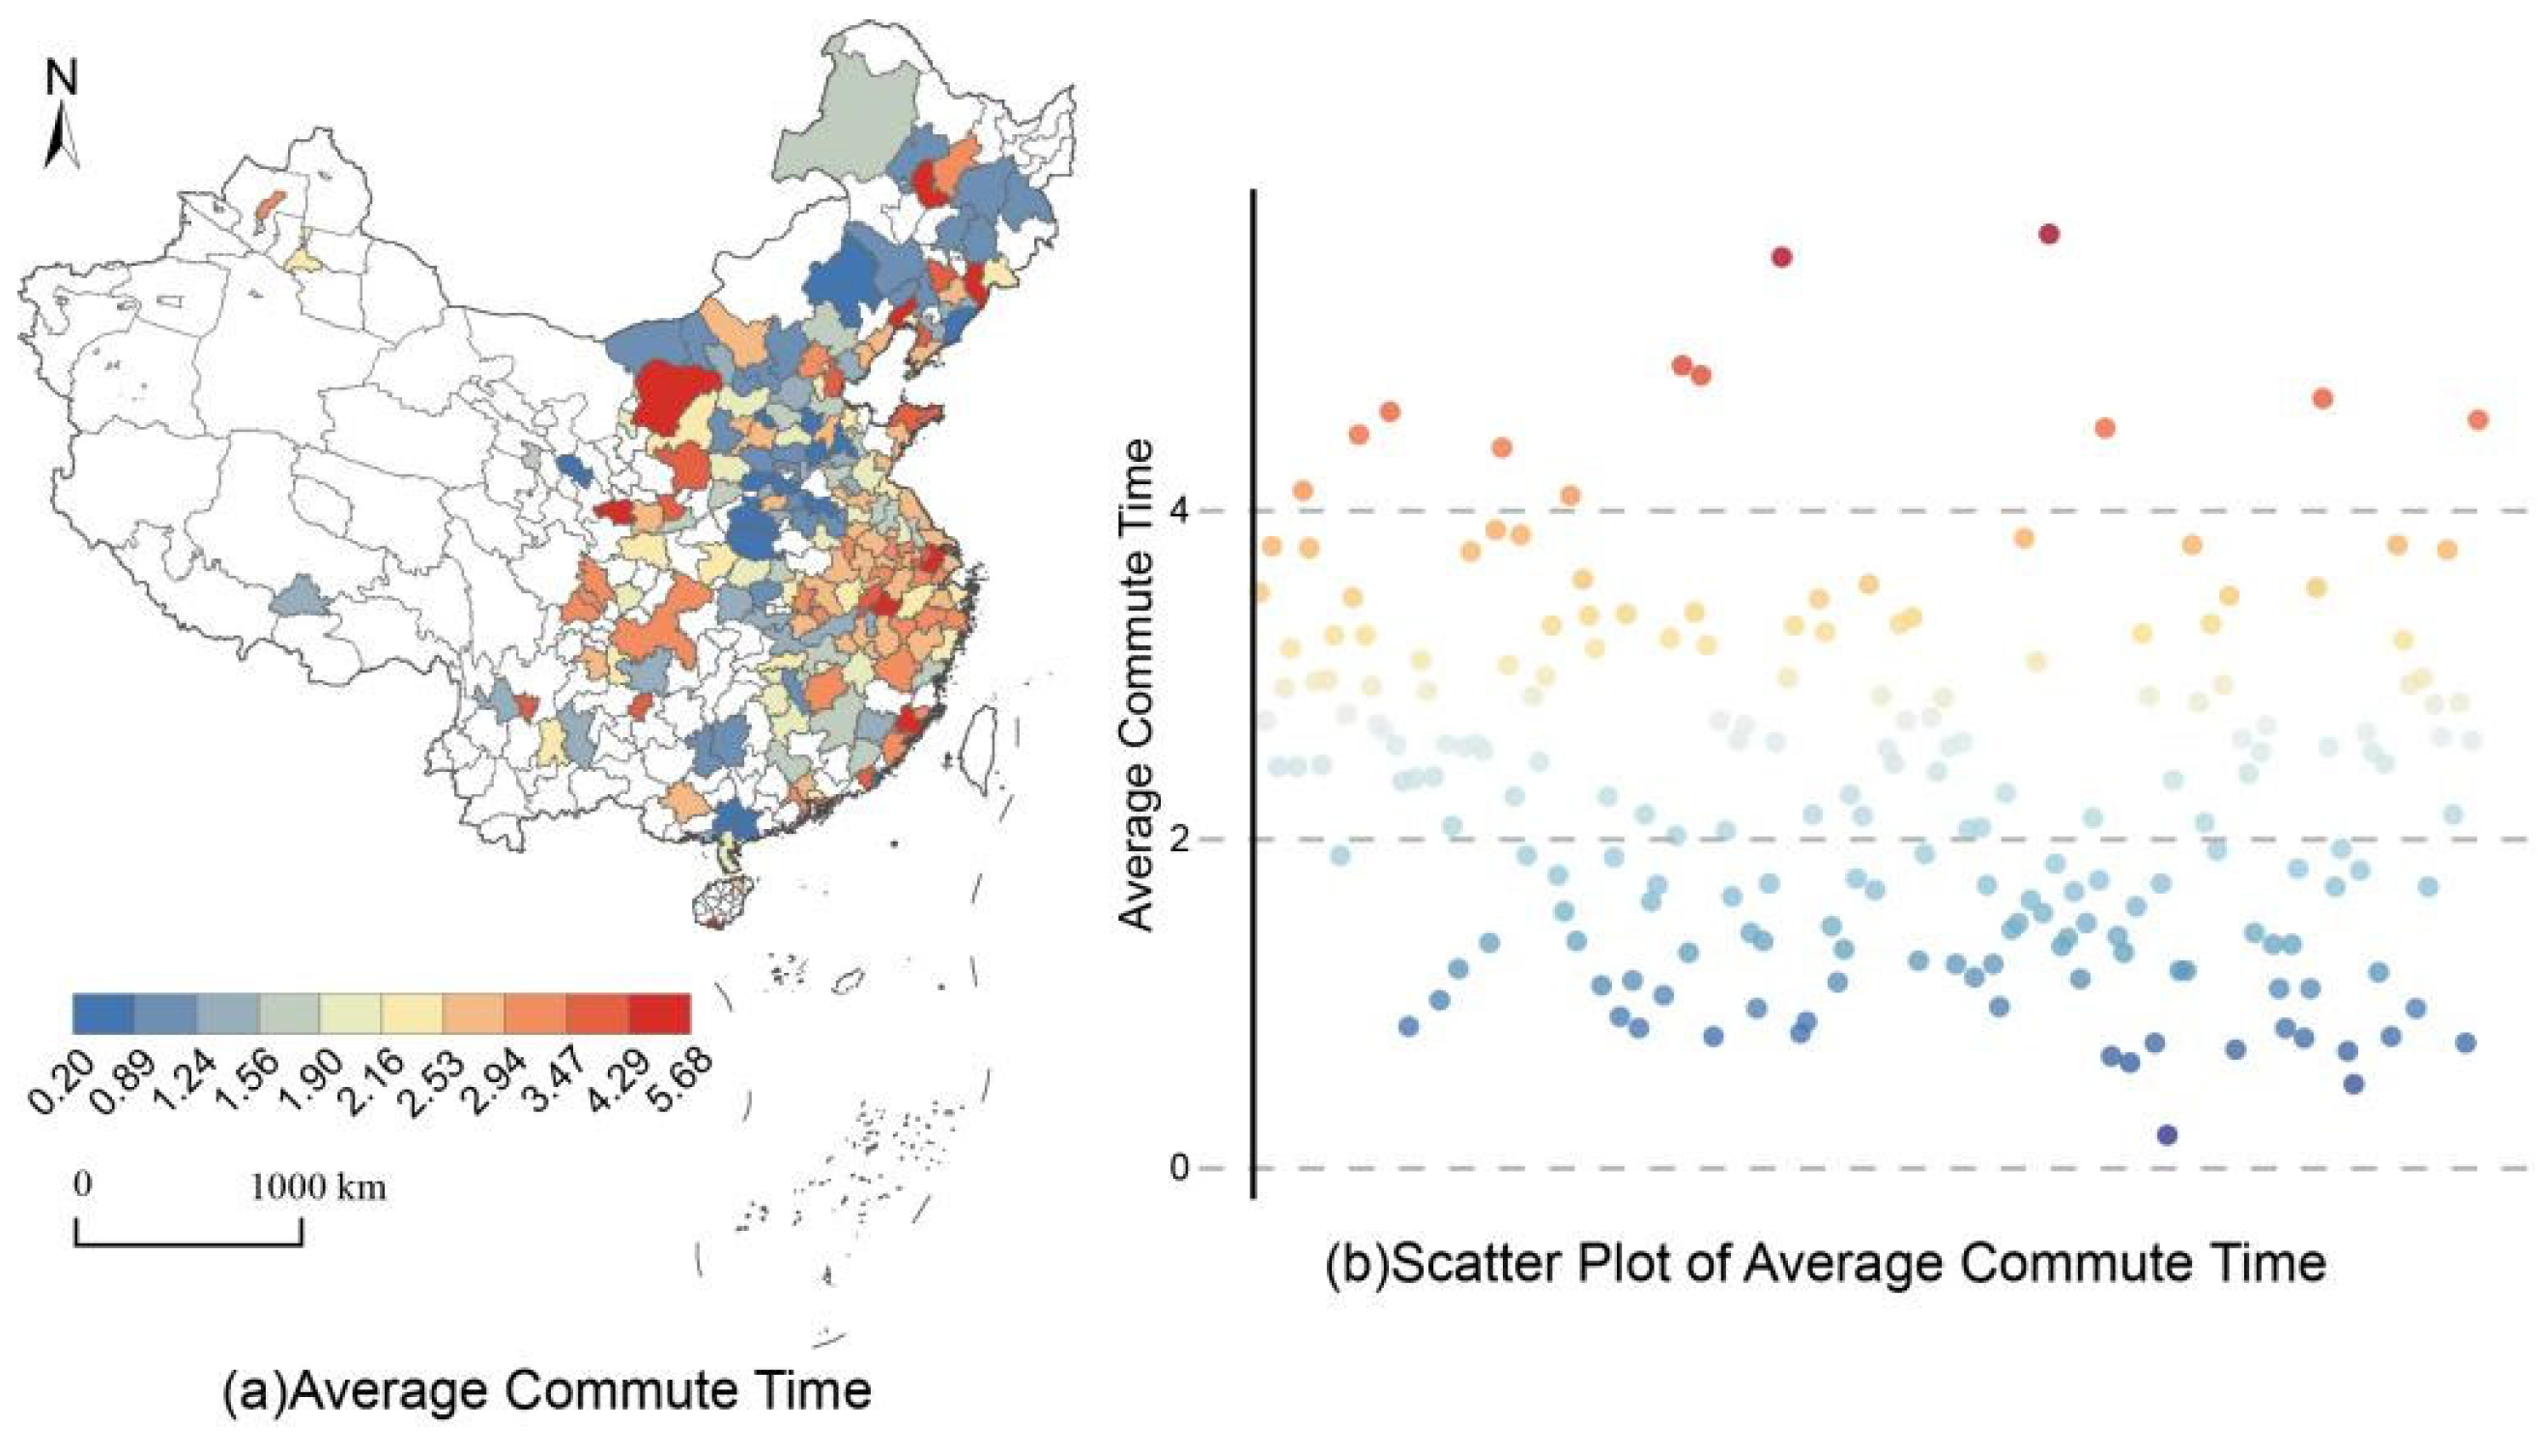
From the spatial distribution pattern (Figure 3), the spatial distribution of average commuting speed shows significant regional differentiation characteristics.
The high-value areas of commuting time exhibit clustering characteristics in space. High-value areas of commuting time have formed in Beijing, Tianjin, and surrounding adjacent areas; with Shanghai as the core, covering a vast area of Jiangsu and Zhejiang provinces, commuting time remains high and distributed in a contiguous manner; the metropolitan area consisting of Guangzhou, Shenzhen, Foshan, Dongguan, and other cities is another obvious high-value area.
These high-value areas highlight the enormous pressure faced by these regions in terms of traffic congestion and job–housing balance.
The low-value areas of commuting time are mainly distributed in two major regions. The northern and eastern parts of Heilongjiang, Jilin, and Inner Mongolia provinces exhibit relatively low commuting times; the commuting time in Henan Province is medium–low, and except for Zhengzhou and a few major urban nodes, the vast majority of the province is evenly colored, forming a vast medium–low-value area, reflecting the relatively balanced and homogenized development level and commuting time in other regions of the province.
The spatial pattern of the low-value areas is primarily characterized by extensive contiguous distribution, forming a stark contrast to the spot-like or plate-like distribution of the high-value areas in the eastern region.
In summary, the spatial distribution characteristics of average commuting speed and average commuting time not only reveal the regional differentiation rules of urban transportation efficiency in China, but also provide important scientific basis for formulating differentiated transportation policies and optimizing urban transportation systems. The weak correlation between the two indicators further indicates that it is necessary to comprehensively consider the improvement strategies of urban transportation efficiency from multiple dimensions.

4.3. Regression Analysis

4.3.1. Variable Selection

Prior research indicates that the spatial arrangement of compact cities correlates with reduced commuting distances and an increased reliance on public transport [7]. Consequently, we will employ regression techniques to investigate the determinants influencing average commuting time and speed as a result of urban compactness. This study examines the influencing mechanism of urban compactness on transportation efficiency, utilizing average commuting time and average commuting speed as dependent variables and urban compactness as the primary independent variable. Furthermore, certain often utilized control variables are also chosen. Accelerated population expansion is a significant determinant influencing urban commute [26]. Consequently, the quantity of registered residents at year-end is incorporated into the study as an independent variable. Economic and transportation infrastructure considerations influence changes in urban commuting, with transportation infrastructure impacting commuting time and accessibility [37]. Consequently, regional GDP, the land size of administrative regions, the actual road area at year-end, total public transport passenger volume, and average travel distance are all designated as independent variables. The pertinent characteristic features are delineated in Table 1.
To effectively avoid the problem of multicollinearity among independent variables, the variance inflation factor (VIF) is used to test the correlation among independent variables, and indicators with VIF values higher than 3 are eliminated. The average travel distance is a traffic indicator, the year-end registered residence population and administrative area are population and economic indicators, and the year-end actual urban road area and total public transport passenger volume are infrastructure indicators. The relevant descriptive statistics are detailed in Table 2.

4.3.2. Model Analysis

This study initially employed ordinary least squares (OLSs) to conduct baseline regression in order to assess the influence of urban compactness on average commute speed and commuting duration. To examine potential spatial dependencies, a spatial lag model (SLM) and a spatial error model (SEM) were also developed as robustness tests (Table 3).
All three regression models for average commuting speed (OLS, SLM, and SEM) exhibit exceptionally high explanatory power. It is evident that, in both the spatial lag model and the spatial error model, the direction, magnitude, and statistical significance of key variables such as urban compactness, public transport passenger volume, and average travel distance are markedly consistent with the OLS results. Consequently, the principal analysis relies on the results of the OLS model. The regression analysis indicates a strong negative association between urban compactness and average commuting speed. This suggests that, after accounting for several factors including population, economy, transportation infrastructure, travel distance, and job–housing balance, cities exhibiting more urban compactness generally have reduced average commuting speeds.
The average journey distance is significant at the 1% level, demonstrating that increased travel distances are strongly correlated with markedly diminished commuting speeds. This indicates that average journey distance may somewhat mediate the unfavorable association between urban compactness and commuting speed. The notably positive coefficient of total public transport passenger volume suggests that a robust public transport system correlates with increased commuting speeds, thereby mitigating commuting efficiency challenges in densely populated cities.
The year-end registered population exerts a markedly positive causal influence on commuting speed, indicating that population growth enhances commuting speed. The degree of economic development demonstrates a markedly negative causal association with commuting speed, indicating that an increase in regional GDP hinders commuting speed. The extension of urban road infrastructure positively influences commute speed, demonstrating that an increase in road area directly enhances commuting efficiency. The land area of the administrative region is statistically insignificant, indicating no meaningful causal association between this variable and commuting speed.
The model results indicate substantial causal linkages regarding average commute time. Urban compactness demonstrates a markedly favorable effect in the OLS, SLM, and SEM, suggesting that increased urban compactness results in extended average commuting durations. The year-end registered population demonstrates a markedly adverse effect across all models, indicating that population growth reduces commuting time. The regional GDP demonstrates a markedly favorable effect, suggesting that economic growth extends commuting duration. The total volume of public transport passengers demonstrates a markedly adverse effect across all models, indicating that heightened public transport use lowers commuting time. The average journey distance exhibits a markedly positive effect, suggesting that an increase in travel distance considerably extends commuting time. The year-end real urban road area, land area of the administrative region, and job–housing balance are not statistically significant across all models, showing an absence of causal impact. The model’s goodness-of-fit enhances from 0.437 (OLS) to 0.493 (SEM), and the AIC value diminishes from OLS to SEM, signifying the superiority of the spatial models.
In contrast to commuting speed, spatial models consider the impact of spatial elements on the interactions among variables, facilitating a more precise understanding of how urban spatial structure and geographic attributes influence commuting time. Spatial models provide superior goodness-of-fit and explanatory power in comparison to the conventional OLS model. The examination of commuting duration indicates significant spatial error dependence, signifying that a city’s commuting time is influenced not only by its intrinsic attributes but also by external factors associated with adjacent cities that are excluded from the model, such as regional transportation policies and geographic conditions. In this spatial setting, the positive association between compactness and commute time is consistent.

5. Discussion and Conclusions

5.1. Discussion

The density of urban areas adversely affects average commuting speed while positively influencing average commuting time. This result alludes to a significant urban transportation phenomenon: the development of compact cities may be trapped in the conundrum of the “agglomeration paradox”. In principle, reducing commute distance by high-density mixed land use is expected to enhance commuting efficiency [32]. Empirical findings demonstrate that denser urban configurations correlate with reduced commuting speeds and extended commuting durations. This finding aligns with Ewing et al.’s (2018) research [8], indicating that whereas compact development decreases vehicle mileage (VMT), it may simultaneously intensify local traffic congestion due to the aggregation of trip destinations [38,39]. The fundamental mechanism may consist in the compact configuration, which fosters equilibrium between employment and habitation, yet necessarily results in an exceedingly high density of population and economic activities. The agglomeration effect creates significant transport demand within a confined geographical area, often surpassing the real capacity of the road network, resulting in pervasive and normalized traffic congestion. In the absence of adequate traffic diversion and management techniques, a singular compact urban area policy may counterproductively hinder commuting speed.
From a policy standpoint, while compactness may extend commute duration, its extensive advantages in fostering sustainable transportation, conserving land resources, and diminishing energy use remain substantial. The substantial positive influence of total public transportation passenger volume and road infrastructure elucidates the resolution of this paradox; specifically, while advocating for compact development, it is imperative to prioritize the establishment of an efficient public transportation system and enhance it with judicious road network optimization to effectively mitigate congestion and enhance overall commuting speed. Consequently, advancing the establishment of compact cities is the appropriate approach for attaining sustainable urban growth; nevertheless, it must be supported by comprehensive transportation systems. Transportation infrastructure and public service facilities embody the anticipations of spatial strategy and planning configuration [40]. We ought to forgo the conventional strategy of solely targeting high density and, instead, advocate for collaborative design across spatial and transportation elements.
It is essential to enhance the link between work and residential areas and to establish a Transit-Oriented Development (TOD) paradigm driven by public transit. In the context of China, the Transit-Oriented Development (TOD) concept, which integrates transport and land use, is regarded as an effective approach for attaining sustainable development [41]. Since 2019, China has established a cohesive planning framework, particularly for land spatial planning, to enhance the coordination of various planning initiatives, including land use, transportation, and urban–rural growth. The Transit-Oriented Development (TOD) concept has been included into the urban design of numerous major cities in China, including Beijing, Shanghai, and Shenzhen [42]. Conversely, emphasis must be placed on regionally differentiated government. Eastern high-density cities should prioritize the enhancement of public transport and the optimization of road network infrastructure, whilst cities in the middle and western regions may judiciously escalate development intensity and preemptively manage urban expansion. Consequently, it enhances commuting speed, thus curtailing the increase in commuting time and resulting in a comprehensive enhancement of urban commuting efficiency. Simultaneously, it is essential to establish “flexible” development boundaries to accommodate future population increase, industrial expansion, and natural causes, thereby reserving territory for prospective urban expansion within a defined timeframe [43].
This research also has specific limitations. The data primarily originates from macro statistics and the Didi platform, which does not encompass micro-level traffic flow and individual travel preferences within the city, potentially obscuring the diversity of local commuting behavior. Secondly, cross-sectional data analysis inadequately captures the dynamic interplay between urban compactness and traffic efficiency, while the use of average commuting distance measures does not fully reflect the intrinsic characteristics of urban spatial organization. Future study may integrate remote sensing data and individual movement trajectories, or include multidimensional indicators such as land use mix, to elucidate the influence of urban form evolution on traffic behavior across various scales.

5.2. Conclusions

This study elucidates the complex influence of urban compactness on transportation efficiency by examining the spatial distribution of urban compactness, commuting speed, and duration, while also developing a regression model to correlate urban compactness with average commuting time and speed.
The compactness of Chinese cities has a consistent and efficient pattern in the western region, a gradient variation in the northeast, pronounced polarization in the middle region, and a multi-centered differentiation in the eastern region. The spatial attributes of urban compactness varies throughout the seven principal city clusters in China, indicating their distinct developmental phases, driving forces, and spatial configurations. The Pearl River Delta and Yangtze River Delta display significant agglomeration and equilibrium; the Beijing Tianjin Hebei and Chengdu Chongqing regions reveal a characteristic dual-core dominance; the urban agglomeration in the middle reaches of the Yangtze River shows a stable trend of coordinated multi-core development, whereas the Central Plains and Harbin Great Wall urban agglomerations have relatively low urban compactness nationally, attributed to either the excessive expansion of core cities or broad development models. These spatial differentiation characteristics offer a crucial scientific foundation for developing tailored regional spatial planning and intensive development strategies.
Commuting in Chinese cities exhibits a notable feature of clustered distribution. The principal urban agglomerations have evolved into high-value zones for commuting speed and duration, highlighting the significant challenge of reconciling employment and housing. Conversely, the northeastern and northern regions, along with the central plains, have established extensive low commuting time zones, indicating a trend of uniform development. This spatial pattern distinctly illustrates the systematic influence of varying regional development stages on commuting behaviors.
The density of urban areas adversely affects commuting by markedly decreasing speed and extending duration, illustrating the “agglomeration paradox.” Public transport has demonstrated efficacy in enhancing commuting efficiency, with a notable correlation between increased passenger volume and improved commuting speeds and reduced times. The distance of commuting is a crucial determinant of commuting efficiency; its expansion will enhance commuting speed while concurrently prolonging commuting duration, illustrating the intricacy of the mechanisms influencing commuting efficiency.
To effectively address the “agglomeration paradox” in the growth of high-density urban areas, varied regional spatial governance solutions must be employed. In the densely populated urban agglomeration of the eastern region, it is imperative to enhance the employment and service capabilities of secondary centers while fostering a balance between work and residential areas. In contrast, for the low-value compact zones in the central and western regions, it is essential to nurture core growth poles and pursue intensive development to prevent the phenomenon of “spreading the pie” expansion. Universal policies must unequivocally promote the advancement of public transportation, enhance commuting frameworks, and systematically elevate the operational efficiency and quality of life for urban people.

Author Contributions

Conceptualization, F.W. and H.X.; validation, Y.C.; formal analysis, J.L.; methodology, H.X. and J.L.; data curation, H.X.; writing—original draft preparation, F.W. and Y.C.; writing—review and editing, F.W. and Y.C.; supervision, H.X.; project administration, Z.W.; funding acquisition, F.W. All authors have read and agreed to the published version of the manuscript.

Funding

This research was funded by the National Natural Science Foundation of China (grant numbers: 42301214), Hubei Provincial Key Laboratory of Regional Development and Environmental Response (grant numbers: 2024 (A) 001). The funders had no role in study design, data collection and analysis, decision to publish, or preparation of the manuscript.

Data Availability Statement

The raw data supporting the conclusions of this article will be made available by the authors on request.

Conflicts of Interest

The authors declare no conflict of interest.

References

  1. Lan, T.; Shao, G.; Xu, Z.; Tang, L.; Sun, L. Measuring urban compactness based on functional characterization and human activity intensity by integrating multiple geospatial data sources. Ecol. Indic. 2021, 121, 107177. [Google Scholar] [CrossRef]
  2. Zhao, J.; Xiao, L.; Tang, L.; Shi, L.; Su, X.; Wang, H.; Song, Y.; Shao, G. Effects of spatial form on urban commute for major cities in China. Int. J. Sustain. Dev. World Ecol. 2014, 21, 361–368. [Google Scholar] [CrossRef]
  3. Angel, S.; Parent, J.; Civco, D.L. The Fragmentation of Urban Footprints: Global Evidence of Sprawl, 1990–2000; Lincoln Institute of Land Policy: Cambridge, MA, USA, 2010. [Google Scholar]
  4. Nechyba, T.J.; Walsh, R.P. Urban sprawl. J. Econ. Perspect. 2002, 18, 177–200. [Google Scholar] [CrossRef]
  5. Chen, H.; Jia, B.; Lau, S. Sustainable urban form for Chinese compact cities: Challenges of a rapid urbanized economy. Habitat Int. 2008, 32, 28–40. [Google Scholar] [CrossRef]
  6. Aditjandra, P.T. The impact of urban development patterns on travel behaviour: Lessons learned from a British metropolitan region using macro-analysis and micro-analysis in addressing the sustainability agenda. Res. Transp. Bus. Manag. 2013, 7, 69–80. [Google Scholar] [CrossRef]
  7. Bibri, S.E. Compact Urbanism and the Synergic Potential of its Integration with Data-Driven Smart urbanism: An Extensive Interdisciplinary Literature Review. Land Use Policy 2020, 97, 104703. [Google Scholar] [CrossRef]
  8. Ewing, R.; Tian, G.; Lyons, T. Does compact development increase or reduce traffic congestion? Cities 2018, 72, 94–101. [Google Scholar] [CrossRef]
  9. Xing, X.; Shi, W.; Wu, X.; Liu, Y.; Wang, X.; Zhang, Y. Towards a more compact urban form: A spatial-temporal study on the multi-dimensional compactness index of urban form in China. Appl. Geogr. 2024, 171, 103368. [Google Scholar] [CrossRef]
  10. Bibri, S.E.; Krogstie, J.; Kärrholm, M. Compact City Planning and Development: Emerging Practices and Strategies for Achieving the Goals of Sustainability. Dev. Built Environ. 2020, 4, 100021. [Google Scholar] [CrossRef]
  11. Lian, H.; Kong, S.; Yu, Y. Tight spaces, strong cities: The resilience payoff of urban compactness. Land Use Policy 2025, 156, 107621. [Google Scholar] [CrossRef]
  12. Yu, P.; Zhang, S.; Yung, E.H.K.; Chan, E.H.; Luan, B.; Chen, Y. On the urban compactness to ecosystem services in a rapidly urbanising metropolitan area: Highlighting scale effects and spatial non–stationary. Environ. Impact Assess. Rev. 2023, 98, 106975. [Google Scholar] [CrossRef]
  13. Burton, E. Measuring urban compactness in UK towns and cities. Environ. Plan. B Plan. Des. 2002, 29, 219–250. [Google Scholar] [CrossRef]
  14. Jabareen, Y.R. Sustainable Urban Forms Their Typologies, Models, and Concepts. J. Plan. Educ. Res. 2016, 26, 38–52. [Google Scholar] [CrossRef]
  15. Ewing, R.; Cervero, R. Travel and the built environment: A meta-analysis. J. Am. Plan. Assoc. 2010, 76, 265–294. [Google Scholar] [CrossRef]
  16. Handy, S.; Boarnet, M.; Ewing, R.; Killingsworth, R.E. How the built environment affects physical activity: Views from urban planning. Am. J. Prev. Med. 2002, 23 (Suppl. 1), 64–73. [Google Scholar] [CrossRef] [PubMed]
  17. Xu, Z.; Xu, G.; Lan, T.; Li, X.; Chen, Z.; Cui, H.; Zhou, Z.; Wang, H.; Jiao, L.; Small, C. Global consistency of urban scaling evidenced by remote sensing. Proc. Natl. Acad. Sci. USA Nexus 2025, 4, pgaf037. [Google Scholar] [CrossRef] [PubMed]
  18. Dadashpoor, H.; Malekzadeh, N. Driving factors of formation, development, and change of spatial structure in metropolitan areas: A systematic review. J. Urban Manag. 2020, 9, 286–297. [Google Scholar] [CrossRef]
  19. Zhang, P.; Pan, J.; Xie, L.; Zhou, T.; Bai, H.; Zhu, Y. Spatial–temporal evolution and regional differentiation features of urbanization in China from 2003 to 2013. ISPRS Int. J. Geo-Inf. 2019, 8, 31. [Google Scholar] [CrossRef]
  20. Wang, J.; Qu, S.; Peng, K.; Feng, Y. Quantifying Urban Sprawl and Its Driving Forces in China. Discret. Dyn. Nat. Soc. 2019. [Google Scholar] [CrossRef]
  21. Liu, X.Y.; Qin, M.; Li, S.L. Urban spatial structure and labour income. World Econ. 2019, 4, 123–148. [Google Scholar]
  22. Boussauw, K.; Neutens, T.; Witlox, F. Relationship between spatial proximity and travel-to-work distance: The effect of the compact city. Reg. Stud. 2012, 46, 687–706. [Google Scholar] [CrossRef]
  23. Li, Y.; Xiong, W.; Wang, X. Does polycentric and compact development alleviate urban traffic congestion? A case study of 98 Chinese cities. Cities 2019, 88, 100–111. [Google Scholar] [CrossRef]
  24. Xu, Z.; Jiao, L.; Lan, T.; Zhou, Z.; Cui, H.; Li, C.; Xu, G.; Liu, Y. Mapping hierarchical urban boundaries for global urban settlements. Int. J. Appl. Earth Obs. Geoinf. 2021, 103, 102480. [Google Scholar] [CrossRef]
  25. Sun, B.; He, Z.; Zhang, T.; Wang, R. Urban spatial structure and commute duration: An empirical study of China. Int. J. Sustain. Transp. 2016, 10, 638–644. [Google Scholar] [CrossRef]
  26. Ma, K.-R.; Banister, D. Urban spatial change and excess commuting. Environ. Plan. A 2007, 39, 630–646. [Google Scholar] [CrossRef]
  27. Jun, M.J. The effects of polycentric evolution on commute times in a polycentric compact city: A case of the Seoul Metropolitan Area. Cities 2020, 98, 102587. [Google Scholar] [CrossRef]
  28. Stevens, M.R. Does Compact Development Make People Drive Less? J. Am. Plan. Assoc. 2016, 83, 7–18. [Google Scholar] [CrossRef]
  29. Cirilli, A.; Veneri, P. Spatial Structure and Carbon Dioxide (CO2) Emissions Due to Commuting: An Analysis of Italian Urban Areas. Reg. Stud. 2013, 48, 1993–2005. [Google Scholar] [CrossRef]
  30. Dehghani, A.; Alidadi, M.; Sharifi, A. Compact development policy and urban resilience: A critical review. Sustainability 2022, 14, 11798. [Google Scholar] [CrossRef]
  31. Rao, Y.; Yang, J.; Dai, D.; Wu, K.; He, Q. Urban growth pattern and commuting efficiency: Empirical evidence from 100 Chinese cities. J. Clean. Prod. 2021, 302, 126994. [Google Scholar] [CrossRef]
  32. Li, M.; Zuo, M.; Chen, S.; Tang, S.; Chen, T.; Liu, J. Impact of Urban Spatial Compactness on Carbon Emissions: Heterogeneity at the County Level in the Beijing–Tianjin–Hebei Area, China. Land 2024, 13, 2104. [Google Scholar] [CrossRef]
  33. Lin, D.; Allan, A.; Cui, J. The impact of polycentric urban development on commuting behaviour in urban China: Evidence from four sub-centres of Beijing. Habitat Int. 2015, 50, 195–205. [Google Scholar] [CrossRef]
  34. Rahman, M.H.; Antipova, A. Structural equation model in exploring urban sprawl and its impact on commuting time in 162 US urbanized areas. Cities 2024, 148, 104855. [Google Scholar] [CrossRef]
  35. Xu, X.; Ou, J.; Liu, P.; Liu, X.; Zhang, H. Investigating the impacts of three-dimensional spatial structures on CO2 emissions at the urban scale. Sci. Total Environ. 2020, 762, 143096. [Google Scholar] [CrossRef] [PubMed]
  36. Hong, S.F.; Hui, E.C.M.; Lin, Y.Y. Relationship between urban spatial structure and carbon emissions: A literature review. Ecol. Indic. 2022, 144, 109456. [Google Scholar] [CrossRef]
  37. Zhao, P.; Cao, Y. Commuting inequity and its determinants in Shanghai: New findings from big-data analytics. Transp. Policy 2020, 92, 20–37. [Google Scholar] [CrossRef]
  38. Islam, M.R.; Saphores, J.D.M. An L.A. story: The impact of housing costs on commuting. J. Transp. Geogr. 2022, 98, 103266. [Google Scholar] [CrossRef]
  39. Wang, M.; Debbage, N. Urban morphology and traffic congestion: Longitudinal evidence from US cities. Comput. Environ. Urban Syst. 2021, 89, 101676. [Google Scholar] [CrossRef]
  40. Zhang, L.; Shu, X.; Luo, J. The formation of a polycentric city in transitional China in a three-level analysis framework: The case study of Hangzhou. Land 2022, 11, 2054. [Google Scholar] [CrossRef]
  41. Li, Z.; Han, Z.; Xin, J.; Luo, X.; Su, S.; Weng, M. Transit oriented development among metro station areas in Shanghai, China: Variations, typology, optimization and implications for land use planning. Land Use Policy 2019, 82, 269–282. [Google Scholar] [CrossRef]
  42. Wang, J.; Tan, W.; Huang, J. Extending TOD through the interrelationship between transport and land use: A case study of Beijing. Land Use Policy 2024, 144, 13. [Google Scholar] [CrossRef]
  43. Pu, L.; Xia, Q. Urban Development Boundary Setting Versus Ecological Security and Internal Urban Demand: Evidence from Haikou, China. Land 2023, 12, 2018. [Google Scholar] [CrossRef]
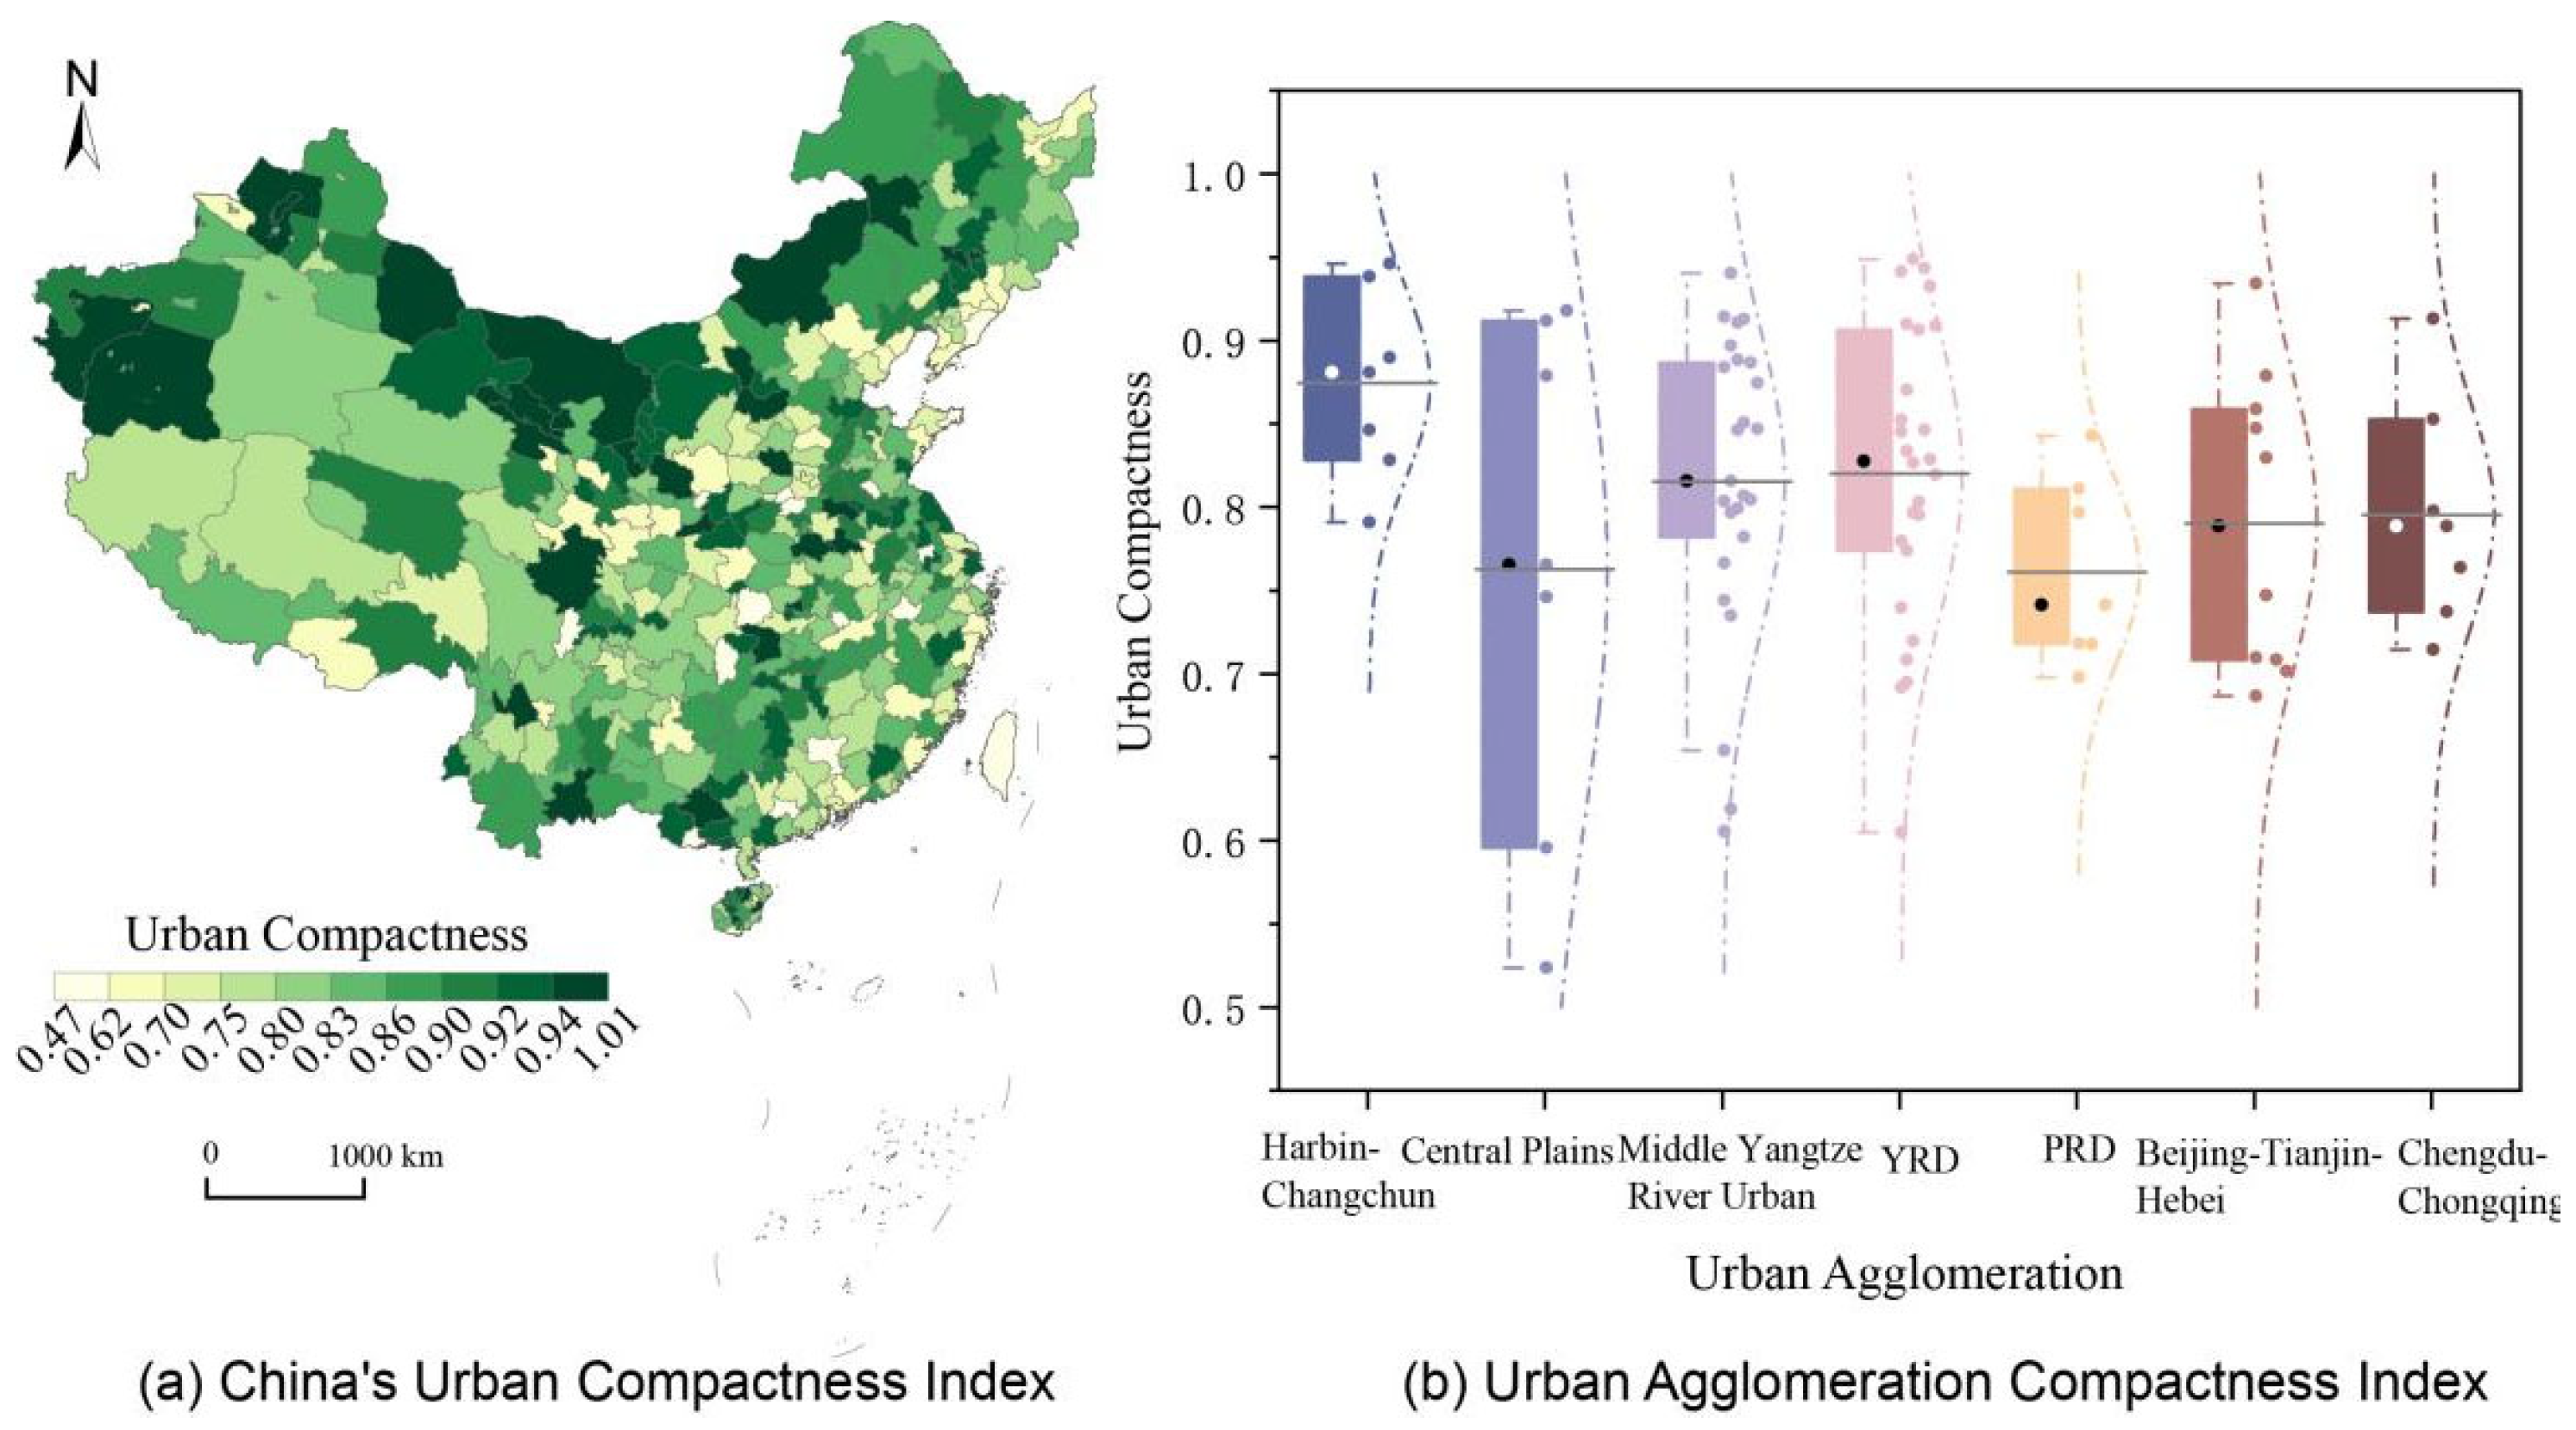
Figure 1. Compactness of Chinese cities.
Land 14 02082 g001
Figure 2. Average commuting speed.
Land 14 02082 g002
Figure 3. Average commuting time.
Land 14 02082 g003
Table 1. Characteristics of variable attributes in regression equations.
VariableVariable TypeDescription
Average Commute Time dependent variableThe average duration of all express train orders in the city
Average commuting speeddependent variableThe ratio of the order mileage to the order duration of all express trains in the city
Urban compactnesscore independent variableThe degree of spatial intensification in urban form
Registered residence population at the end of the yearindependent variableIt refers to the statistics of registered residence of the city at 24:00 on December 31 every year
Administrative area land areaindependent variableAll land and water areas within the jurisdiction
Regional Gross Domestic Productindependent variableThe final result of production activities of all resident units in a region during a certain period of time
Actual urban road area at the end of the yearindependent variableActual pavement area of the road
Total passenger volume of public transportationindependent variableThe total number of passengers transported
Average travel distanceindependent variableThe average mileage of all express train orders in various cities on the Didi platform
Job–housing balanceindependent variableThe extent of spatial correspondence between employment and residence
Table 2. Analysis of variable descriptions in the regression equation.
VariableMin.Max.MeanStd. Dev.
Average Commute Time 0.4658.6082.8831.367
Average commuting speed0.2035.6762.2791.065
Urban compactness1.0172.1281.2550.176
Registered residence population at the end of the year3.4348.1366.0310.683
Administrative area land area7.28612.4749.310.812
Regional Gross Domestic Product6.15910.5497.8940.866
Actual urban road area at the end of the year0.3365.4013.0320.844
Total passenger volume of public transportation5.52912.6559.4461.159
Average travel distance0.1386.2761.1290.676
Job–housing balance2.5947.3856.4190.442
Table 3. Analysis of regression equation results.
VariableRegression Analysis of Average Commuting SpeedRegression Analysis of Average Commuting Time
OLSSLMSEMOLSSLMSEM
Urban compactness−0.958 ***−0.955 ***−0.925 ***1.082 ***1.081 ***1.139 ***
Registered residence population at the end of the year0.322 *0.325 **0.291 **−0.660 ***−0.594 ***−0.558 ***
Administrative area land area−0.060−0.060−0.0540.0050.0320.027
Regional Gross Domestic Product−0.380 ***−0.380 ***−0.363 **0.725 ***0.625 ***0.659 ***
Actual urban road area at the end of the year0.193 **0.188 *0.187 *−0.087−0.029−0.038
Total passenger volume of public transportation0.327 ***0.329 ***0.340 ***−0.400 ***−0.414 ***−0.449 ***
Average travel distance1.462 ***1.456 ***1.449 ***0.893 ***0.947 ***0.925 ***
Job–housing balance0.0030.002−0.0060.1060.1420.142
Constant0.3620.3900.2971.4810.8441.137
R20.7870.7870.7910.4370.4740.493
AIC407.531.406.497402.011504.430489.269483.759
Note: * p < 0.1, ** p < 0.05, *** p < 0.01.
Disclaimer/Publisher’s Note: The statements, opinions and data contained in all publications are solely those of the individual author(s) and contributor(s) and not of MDPI and/or the editor(s). MDPI and/or the editor(s) disclaim responsibility for any injury to people or property resulting from any ideas, methods, instructions or products referred to in the content.