Article

Exploring the Multidimensional Visual Perception of Urban Riverfront Street Environments: A Framework Using Street View Images, Deep Learning and Eye-Tracking

1
Department of Landscape Architecture, Nanjing Agricultural University, Nanjing 210095, China
2
School of Rural Revitalization, Jiangsu Open University, Nanjing 210036, China
*
Author to whom correspondence should be addressed.
Land 2025, 14(10), 2039; https://doi.org/10.3390/land14102039
Submission received: 13 August 2025 / Revised: 20 September 2025 / Accepted: 22 September 2025 / Published: 13 October 2025

Abstract

Urban waterfront areas (UWAs), which are essential natural resources and highly perceived public areas in cities, play a crucial role in improving the quality of the urban environment. While numerous studies have delved into the visual perception of urban environments, little attention has been paid to understanding how the visual perception of urban riverfront streets (URSs) differs with various aspects within their unique spatial environment. This study took the Gusu District in Suzhou, China, as a case study, applying deep learning to street-view images to identify urban riverside landscape elements and evaluate their visual attention, aesthetic preference, and distinctiveness through eye-tracking technology and questionnaires. Subsequently, a multidimensional assessment was conducted to analyze how landscape elements influence visual perception in the urban riverfront street. This study concludes that (1) riverfront streets in the Gusu District present balanced visual attention, with high aesthetic preference but limited distinctiveness, and only a few roads in the ancient city score highly for distinctiveness. (2) Greenery, traditional-style buildings, water, and riverfronts positively impact visual perception, while buildings have a negative impact, and backgrounds such as the sky and roads exhibit minimal influence. This study validated the scientific accuracy, appropriateness, and precision of assessments of visual attention, aesthetics, and distinctiveness to quantitatively evaluate the multidimensional human perception of URSs.

1. Introduction

Urban waterfront areas (UWAs) integrate nature, culture, and society and stand out as aesthetically appealing and unique areas [1]. They serve as vital exhibition spaces that highlight the dynamism and unique character of a city [2]. Desirable UWAs can enhance the quality of the urban environment, fostering cultural experiences and driving tourism development [3]. As a fundamental linear element of UWAs, urban riverfront streets (URSs) serve as a primary means for individuals to enjoy the surrounding environment, enhancing their engagement with the city’s natural aesthetics and cultural heritage [4]. Making the riverfront landscape accessible, aesthetically pleasing, unique, and alluring has become a crucial consideration for urban planners and decision makers. Nowadays, high-quality waterfront landscapes significantly elevate the aesthetic value and charm of urban landscapes, with their planning and construction being increasingly prioritized for human perceptual experience [5,6].
The development of UWAs has emerged as a global trend in numerous cities worldwide, aiming to bring about ambitious waterfront projects [7]. Studies have demonstrated that UWAs play a significant role in enhancing vitality, improving the environment, and reshaping regional characteristics [8]. Moreover, the redevelopment of UWAs is considered an effective means to alleviate the pressure brought about by urbanization [9,10]. Concurrently, research on the visual perception of UWAs has emerged as a pivotal area of focus, highlighting the importance of understanding and improving public perception and evaluation of these areas, which is a crucial factor for urban planners and developers. The research on UWA perception has intensified, with scholars investigating satisfaction, service functions [11,12], spatial vitality via correlation analysis [13,14], and ecological landscape design [15].
Landscape perception has a long history of research aimed at understanding how individuals perceive and interact with various landscapes. With the development of environmental psychology and cognitive theory, landscapes are perceived as a synthesis of objective spaces and human cognitive perceptions [16,17]. It is widely recognized that visual perception plays a key role in landscape experience, primarily through individuals’ perception of various landscape elements, each of which contributes equally to shaping the overall experience [18]. For instance, in UWAs, landscape elements such as water, revetments, and bridges uniquely influence landscape perception, collectively forming a distinct and memorable impression of the riverfront landscape [1].
Traditional methods for analyzing urban visual perception, such as manual surveys or basic image classification, often encounter challenges in capturing the complexity of dynamic urban environments due to their reliance on subjective interpretation and limited scalability. In contrast, deep learning-based semantic segmentation facilitates automated, high-precision extraction of detailed landscape elements from extensive street-view datasets, effectively overcoming the limitations of conventional approaches in managing spatial heterogeneity and temporal variations [19,20,21]. These methods enable researchers to explore the intricate interrelationships among human cognition, emotional responses, and their combined effects on individual aesthetic evaluations, ultimately revealing the complex dynamics underlying landscape perception [2,22,23].
UWAs possess significant visual features and aesthetic values, which reflect unique cultural characteristics and natural beauty [24]. The scenic beauty evaluation (SBE) method has been frequently adopted to quantify public preferences for riverfront aesthetics [25,26], integrating subjective evaluations with objective scenery features, enabling the analysis of influential factors, and providing a framework with which to understand the aesthetics and value of these environments [27,28]. Additionally, data from questionnaires, street-view images [29], mobile phone signals [30], and internet texts [31] have been employed to explore human perception of the distinctiveness of UWAs and urban images, thereby complementing research on public perception of urban-water-related environments from different perspectives. These methodologies offer valuable insights, but gaps remain in understanding how different public groups perceive specific visual elements of UWAs and how these perceptions influence urban planning decisions, highlighting the need to refine the integration of subjective preferences with objective environmental factors to enhance the riverfront environment.
In UWAs, visual attention shapes public first impressions and unique perceptions, significantly impacting their interest and stay intentions [6]. Data collected from eye-tracking studies, including saccades, fixation counts, and gaze durations, is employed to quantify the attention devoted to diverse landscape elements, thereby assisting researchers in identifying salient scene features [32]. The objectivity of the eye-tracking index compensates for the limitations of subjective perception in previous landscape evaluation [33]. The combination of eye-tracking and cognitive evaluation is considered feasible in the linear landscape area [34]. Research has shown that the relationship between eye-tracking behavior and cognitive evaluation is quite complex. In highway landscapes, the intensity of visual attraction aligns with the public’s aesthetic preferences [35]. In coastal linear environments, aesthetic perception highly correlates with distinctiveness perception [36]. However, popular landscape elements are not always the ones that attract the most attention [6]. Although eye-tracking provides a more objective measure of visual attention, it does not fully capture the complex dynamics of how different landscape elements interact to form distinct aesthetic preferences. Further research is needed to explore how the interaction between landscape elements and cognitive processing impacts perception beyond simple attention metrics, particularly in varied urban settings.
Prior studies have extensively explored visual perception in urban environments, yet critical gaps remain in the context of riverfront streets. While eye-tracking methodologies have revealed patterns of visual attention in greenways and waterfronts [1], these works frequently fail to consider the interplay between physiological metrics, such as fixation duration, and subjective perceptions like aesthetics and distinctiveness. For instance, Qiu [37] linked eye-tracking data to aesthetic preferences but did not address how cultural distinctiveness modulates attention. Similarly, Jiang [38] emphasized heritage canal landscapes but limited their scope to semantic segmentation, omitting human-centered evaluations. Furthermore, existing frameworks frequently isolate variables, such as greenery versus architecture, rather than analyzing their synergistic effects [39,40]. A coordinated approach that integrates these multiple dimensions is crucial for capturing the full complexity of visual perception in historically rich waterfront environments.
Visual attention (VA) quantifies immediate physiological attention, aesthetic preference (AP) reflects subjective evaluations of beauty, and distinctiveness-evaluation (DE) measures perceived uniqueness. Unlike AP, which reflects general liking, DE measures how recognizably different or locally distinctive a place appears—a quality often rooted in historical, cultural, or narrative attributes that render a site identifiable and meaningful to viewers [41]. These dimensions were selected to capture both objective visual engagement and subjective psychological responses in UWAs. This study took the Gusu District in Suzhou, China, as a case and applied deep learning to street-view images to identify urban riverside landscape elements and evaluate their visual attention, aesthetic preference, and distinctiveness through eye-tracking technology and questionnaires. Subsequently, we conducted a multidimensional assessment of urban riverfront street landscape, analyzing the influencing mechanism of the landscape elements on visual perception. This study establishes a multidimensional framework integrating VA, AP, and DE, revealing how natural and cultural landscape elements differentially shape visual perception in UWAs. The findings provide empirical evidence for optimizing waterfront environments by balancing cultural heritage preservation with public perceptual needs.
Our primary objective was to address the following 3 questions: (1) What are the visual perception characteristics regarding visual attention, aesthetic preference, and distinctiveness of urban riverfront spaces in the Gusu district? (2) How do riverfront landscape elements influence these three visual perceptions? (3) What is the relationship between the perception of visual attention at the physiological level and aesthetics and distinctiveness at the psychological level?

2. Materials and Methods

2.1. Research Framework

Figure 1 illustrates the three key stages of this study.
In the first stage, street-view images of the study area were obtained using the Baidu Street View Application Programming Interface (API) and OpenStreetMap (OSM). The extracted street-view elements were processed with a Pyramid Scene Parsing Network (PSPNet) to achieve accurate and objective image segmentation, from which the percentage of each landscape element was calculated. Subsequently, randomly selected image samples underwent eye-tracking experiments and survey questionnaires to gather eye movement data, aesthetic preference (AP), and distinctiveness evaluation (DE) scores.
In the second stage, the percentage data of landscape elements were combined with the AP and DE scores. Correlation analysis and linear regression were employed to develop predictive models for AP and DE across all URSs in Gusu District. A visual attention (VA) model was subsequently constructed by summarizing the landscape elements visual attention (EVA), which was used to predict the VA of all URSs in the district.
In the third stage, a comprehensive evaluation of the waterfront landscapes in Gusu District was conducted by integrating the predicted results from the VA, AP, and DE models. This analysis explored the impact of landscape elements on VA, AP, and DE, and identified landscape elements as having positive, negative, or neutral effects on visual perception. Based on these findings, specific renewal strategies for UWAs were proposed.

2.2. Study Area

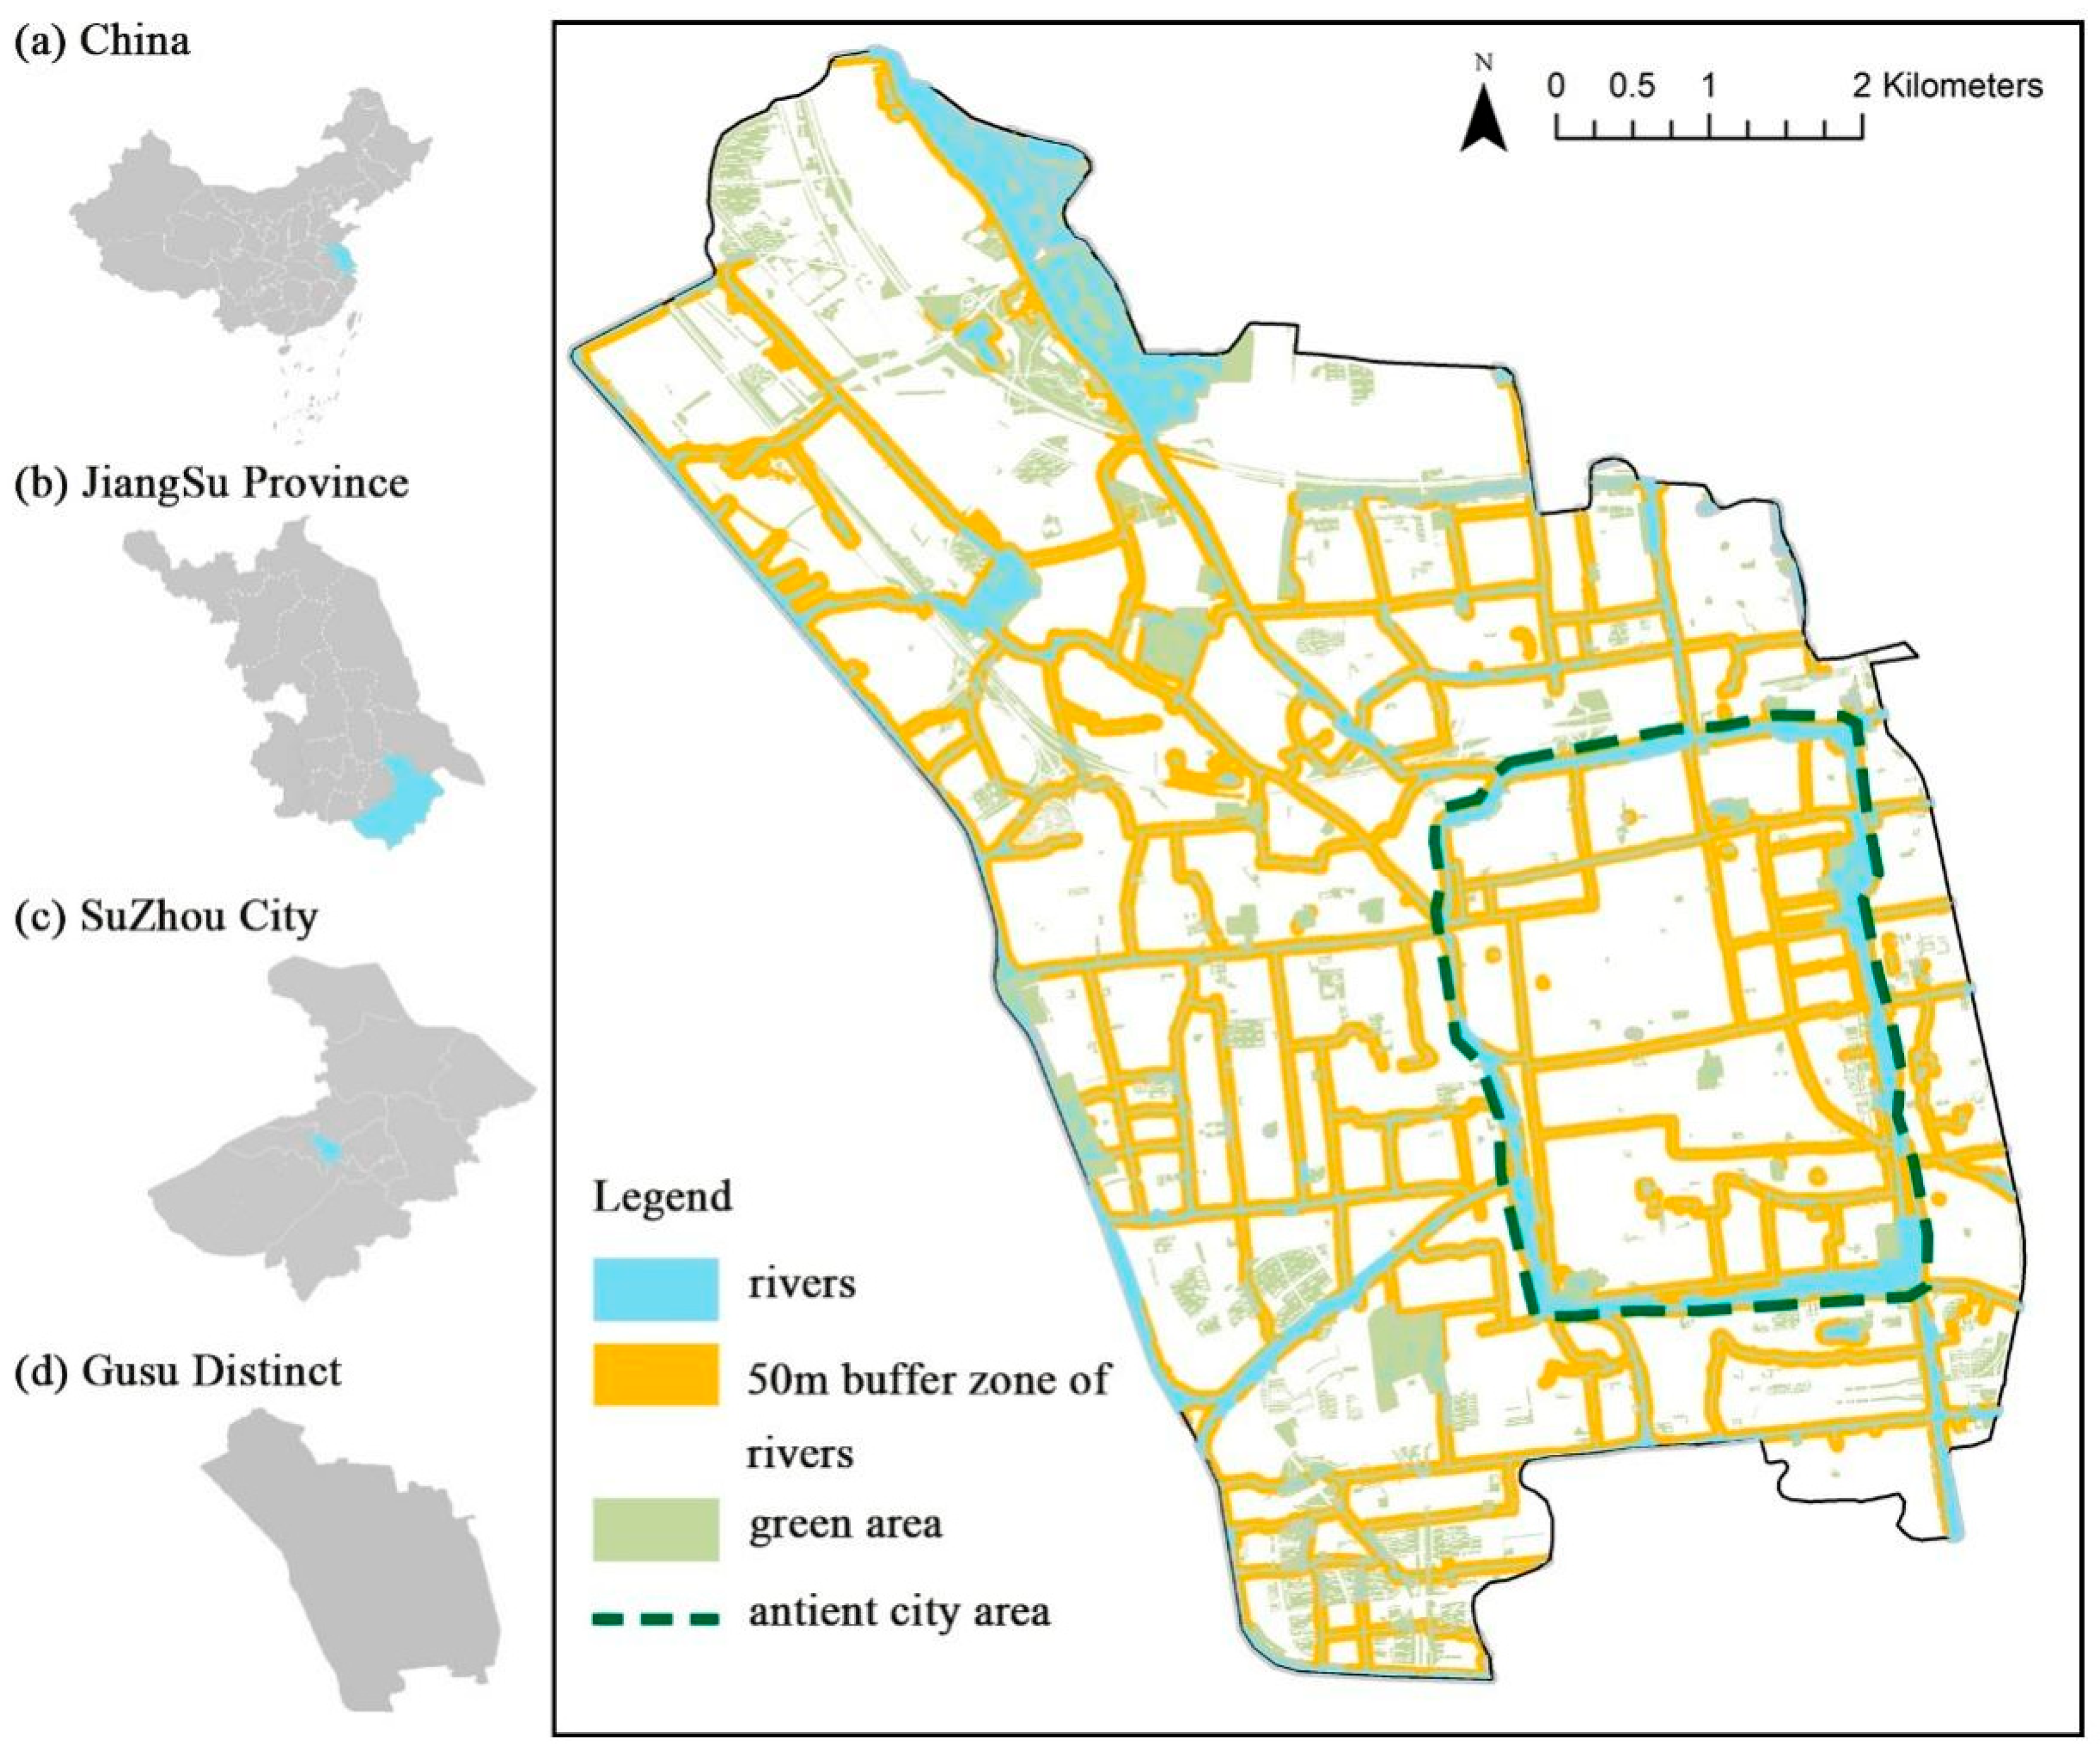
Gusu District, located in Suzhou, China, is the nation’s first historical-cultural preservation zone. Renowned for its iconic “double checkerboard” urban layout—shaped by the 2500-year-old Grand Canal intricately interwoven with modern roads—it exemplifies the coexistence of heritage and contemporary infrastructure, uniquely defining its urban landscape [42].
The district is characterized by an extensive network of main and tributary channels originating from the ancient canal section of the Grand Canal (Figure 2).
There are significant variations in street widths and large disparities in the visible distances to the rivers among different streets in the Gusu District. To ensure that the buffer space can cover all areas with visual accessibility to the water surface, this study defines the spatial extent of URSs as the area within a 50-m buffer zone around the district’s river system.

2.3. Data Collection and Process

2.3.1. Extracting URS Landscape Elements

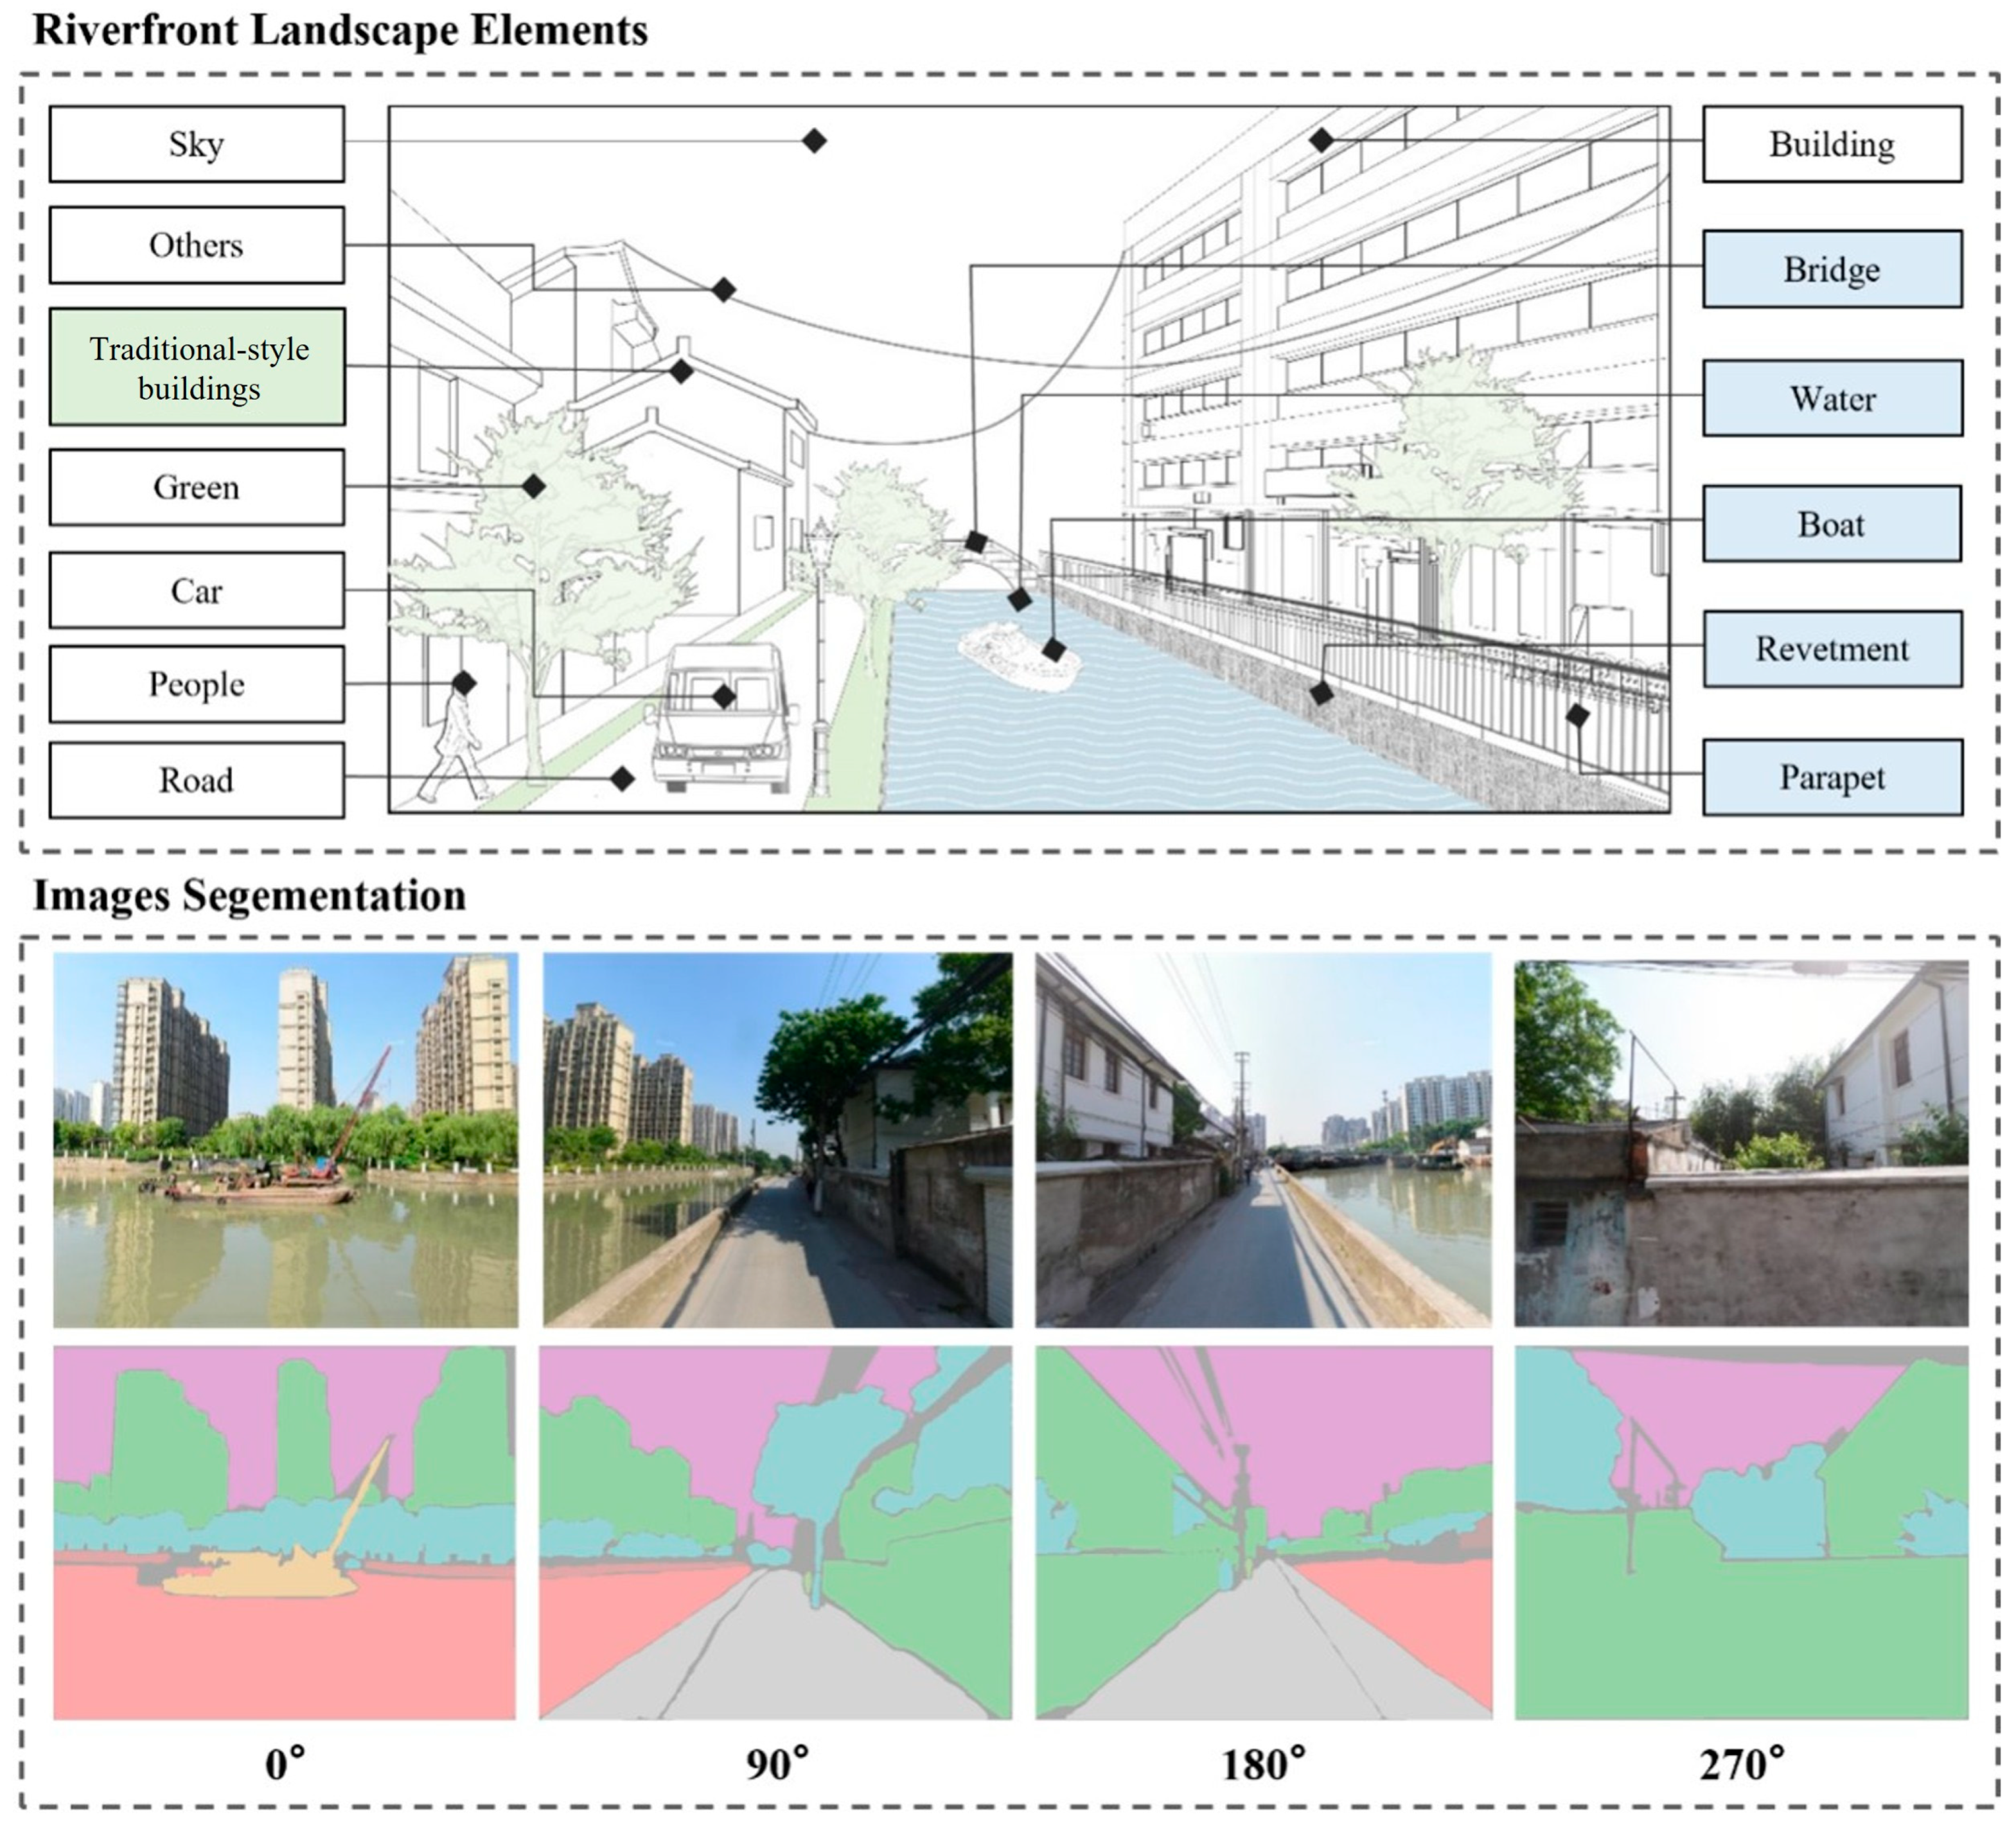
It is widely acknowledged that the influence of visual perception on landscape experience is primarily manifested by the individual perception of various landscape elements, each of which is equally crucial in shaping the overall experience [18]. Using the OpenStreetMap (OSM) interface in QGIS (Quantum GIS 3.40.0) software, we captured vector data of urban roads in Gusu District and obtained coordinate points for URSs at 50-m intervals. A Python 3.10 script was then used to retrieve undistorted, street-view images from four directions (0°, 90°, 180°, and 270°) at these sampling points from Baidu Maps V21, filtering out any invalid points. All the collected images are the latest, taken by Baidu Street View V21 between March 2022 and September 2022. This process yielded a total of 3311 valid street-view sampling points and 13,244 street-view images. These street-view perspectives effectively capture the URS landscape, composed of multiple elements, and provide a realistic reflection of how the human eye perceives the urban environment.
Deep learning excels in processing vast and intricate visual data, offering precise, efficient solutions with unmatched accuracy in computer vision tasks [21]. In this study, we utilized the SegNet segmentation network to train our dataset, focusing on extracting feature maps from the final convolutional layer, and we improved the model by integrating local and global information through pyramid pooling and applying an optimized strategy with balanced supervised loss.
The URSs in Gusu District contain many unique landscape elements, such as revetments, bridges, and traditional-style buildings characterized by pitched roofs, wooden structures, and decorative details [43], which differ significantly from those on typical urban streets (Figure 3). These differences hinder existing semantic segmentation models from accurately recognizing the landscape features of these waterfront roads.
Due to the current dataset’s inability to cover all the elements we needed, especially the absence of traditional elements, we collected 2648 street view images of Gusu riverfront roads as a supplementary dataset. We used transfer learning to adjust the ADE20K dataset and trained a PSPNet semantic segmentation model for riverfront roads landscapes [44]. Statistics were compiled on the average proportion of each element. Special elements such as traditional-style buildings were labeled using the AnyLabeling tool, which supports both manual and semiautomatic labeling for complex, multi-category, and multi-boundary scenes, making it well-suited for fine-grained segmentation tasks. The dataset was then split into 70% for training, 15% for validation, and 15% for testing. During the training process, the pixel accuracy of the semantic segmentation model reached 0.86, with a mean intersection over union (IoU) of 0.79. The accuracy of each element exceeded 0.75, with the highest reaching 0.96. All IoU values were greater than 0.5. The recognition accuracy for each label was high, making the dataset broadly applicable for recognizing and classifying waterfront landscape elements.

2.3.2. Scoring Landscape Elements’ Visual Attention

Eye-tracking technology provides a series of quantifiable information for the study of visual attention by recording objective data such as frequency, time, and repetition degree of eye attraction, reflecting the gaze distribution in response to element stimuli [32,45]. Of the 3311 street-view sampling points (13,244 images), 48 groups of photos (4 for each sampling point) were randomly sampled as the experimental sample for the eye-tracking experiment.
Participants were required to have normal naked eyesight or corrected visual acuity and normal color vision. After excluding invalid participants, such as those who blinked too much, gazed at a point too long, or had chaotic eye-movement tracks, 30 participants were finally accepted. The quantified participants included undergraduates, graduate students or faculty members (14 males and 16 females, aged between 18 and 41) from the two universities. The participant pool size is consistent with sample sizes adopted in related eye-tracking studies [46,47]. The eye-tracking tasks were accomplished by using an aSee Pro telemetry eye tracker and a Lenovo R7000P monitor [48]. After calibration, each participant was shown the 48 groups of photos for 5 s each. No specific viewing instructions were given. The photos were randomly displayed to avoid order effects on the output.
Visual attention in landscape spaces is defined as the focal point of a viewer’s gaze when landscape elements stimulate their eyes and draw their attention to specific parts of the space. In the experiments, observation results vary due to individual differences. Qualitative analysis of data under various eye-movement indicators cannot accurately quantify the appeal of different landscape elements, as the visual attention is also closely related to the area proportion of the elements. To tackle this, we use the total gaze duration on different elements and their share of the area to assess the visual attention of landscape elements [45]. We segmented the landscape elements into Areas of Interest (AOIs) based on semantic segmentation results. This was a crucial step for the subsequent eye-movement experiments (Figure 4).
During the eye-movement experiments, we presented participants with images containing various landscape elements and recorded the fixation durations of participants on each element. The fixation duration within an AOI was calculated as the cumulative value of all fixation points in that area. We used the total fixation duration as an indicator, with a longer duration signifying that the corresponding element was more attractive to the subjects. The total fixation duration, which is the sum of all fixation points within an AOI, reflects the level of attention an element can attract from the subject; a longer duration means greater attention. The Element visual attention (EVA) is calculated as follows:
EVA = PF/PS
where EVA represents the element visual attention, PF represents the proportion of fixation (calculated as the fixation duration within this AOI divided by the total fixation duration of the photo), and PS represents the proportion of the area (calculated as the area of this AOI divided by the total area of the image).

2.3.3. Scoring AP and DE Perception

A questionnaire survey was conducted immediately after the eye-tracking experiment to measure aesthetic preference and distinctiveness. The questionnaire experimental sample was the same as the eye-movement one [45]. In the survey, participants’ evaluations of each sampling point were measured with two indicators: aesthetic value and distinctiveness value. In the questionnaire, “beautiful” and “unique” represent “aesthetic value” and “distinctiveness value”, respectively. After viewing each photo, the participants used a Likert scale from very poor (1) to excellent (7) to evaluate a photo in regard to the two indicators above. Each experiment lasted 10–15 min and consisted of an eye-tracking test and a questionnaire survey.
The formula for AP is as follows:
Z A P i j = ( R i j R j ) / S j
Z A P i = Z i j / N j
In the formula, Z A P i j represents the standardized rating of landscape sample i by evaluator j ; R i j represents the rating value given by evaluator j for landscape sample i ; R i j represents the average rating of evaluator j for all landscape samples; S j represents the standard deviation of evaluator j ’s ratings for all landscape samples; N j represents the number of evaluators for the j -th landscape; and Z A P i represents the final standardized score of landscape sample i , i.e., the aesthetic preference (AP) value.
The formula for DE is as follows:
Z D E i j = ( R i j R j ) / S j
Z D E i = Z i j / N j
In the formula, Z D E i j represents the standardized rating of landscape sample i by evaluator j ; R i j represents the rating value given by evaluator j for landscape sample i ; R j represents the average rating of evaluator j for all landscape samples; S j represents the standard deviation of evaluator j ’s ratings for all landscape samples; N j represents the number of evaluators for the j -th landscape; and Z D E i represents the final standardized score of landscape sample i , i.e., the distinctiveness (DE) value.

3. Results

3.1. Spatial Distribution of Landscape Elements

The collected pixel data of the URS landscape elements were statistically analyzed for area proportion. The average value and standard deviation of the area proportion for each landscape element were calculated to reflect their respective proportions in the URSs of the Gusu District. Given the small proportion of traditional riverfront landscape elements (TRLEs), such as revetments, parapets, bridges, and ships, these four types of landscape elements were combined and counted as the total number of TRLEs. Similarly, cars, other elements, and people were merged into a single category labeled “Others.” The results are presented in Table 1.
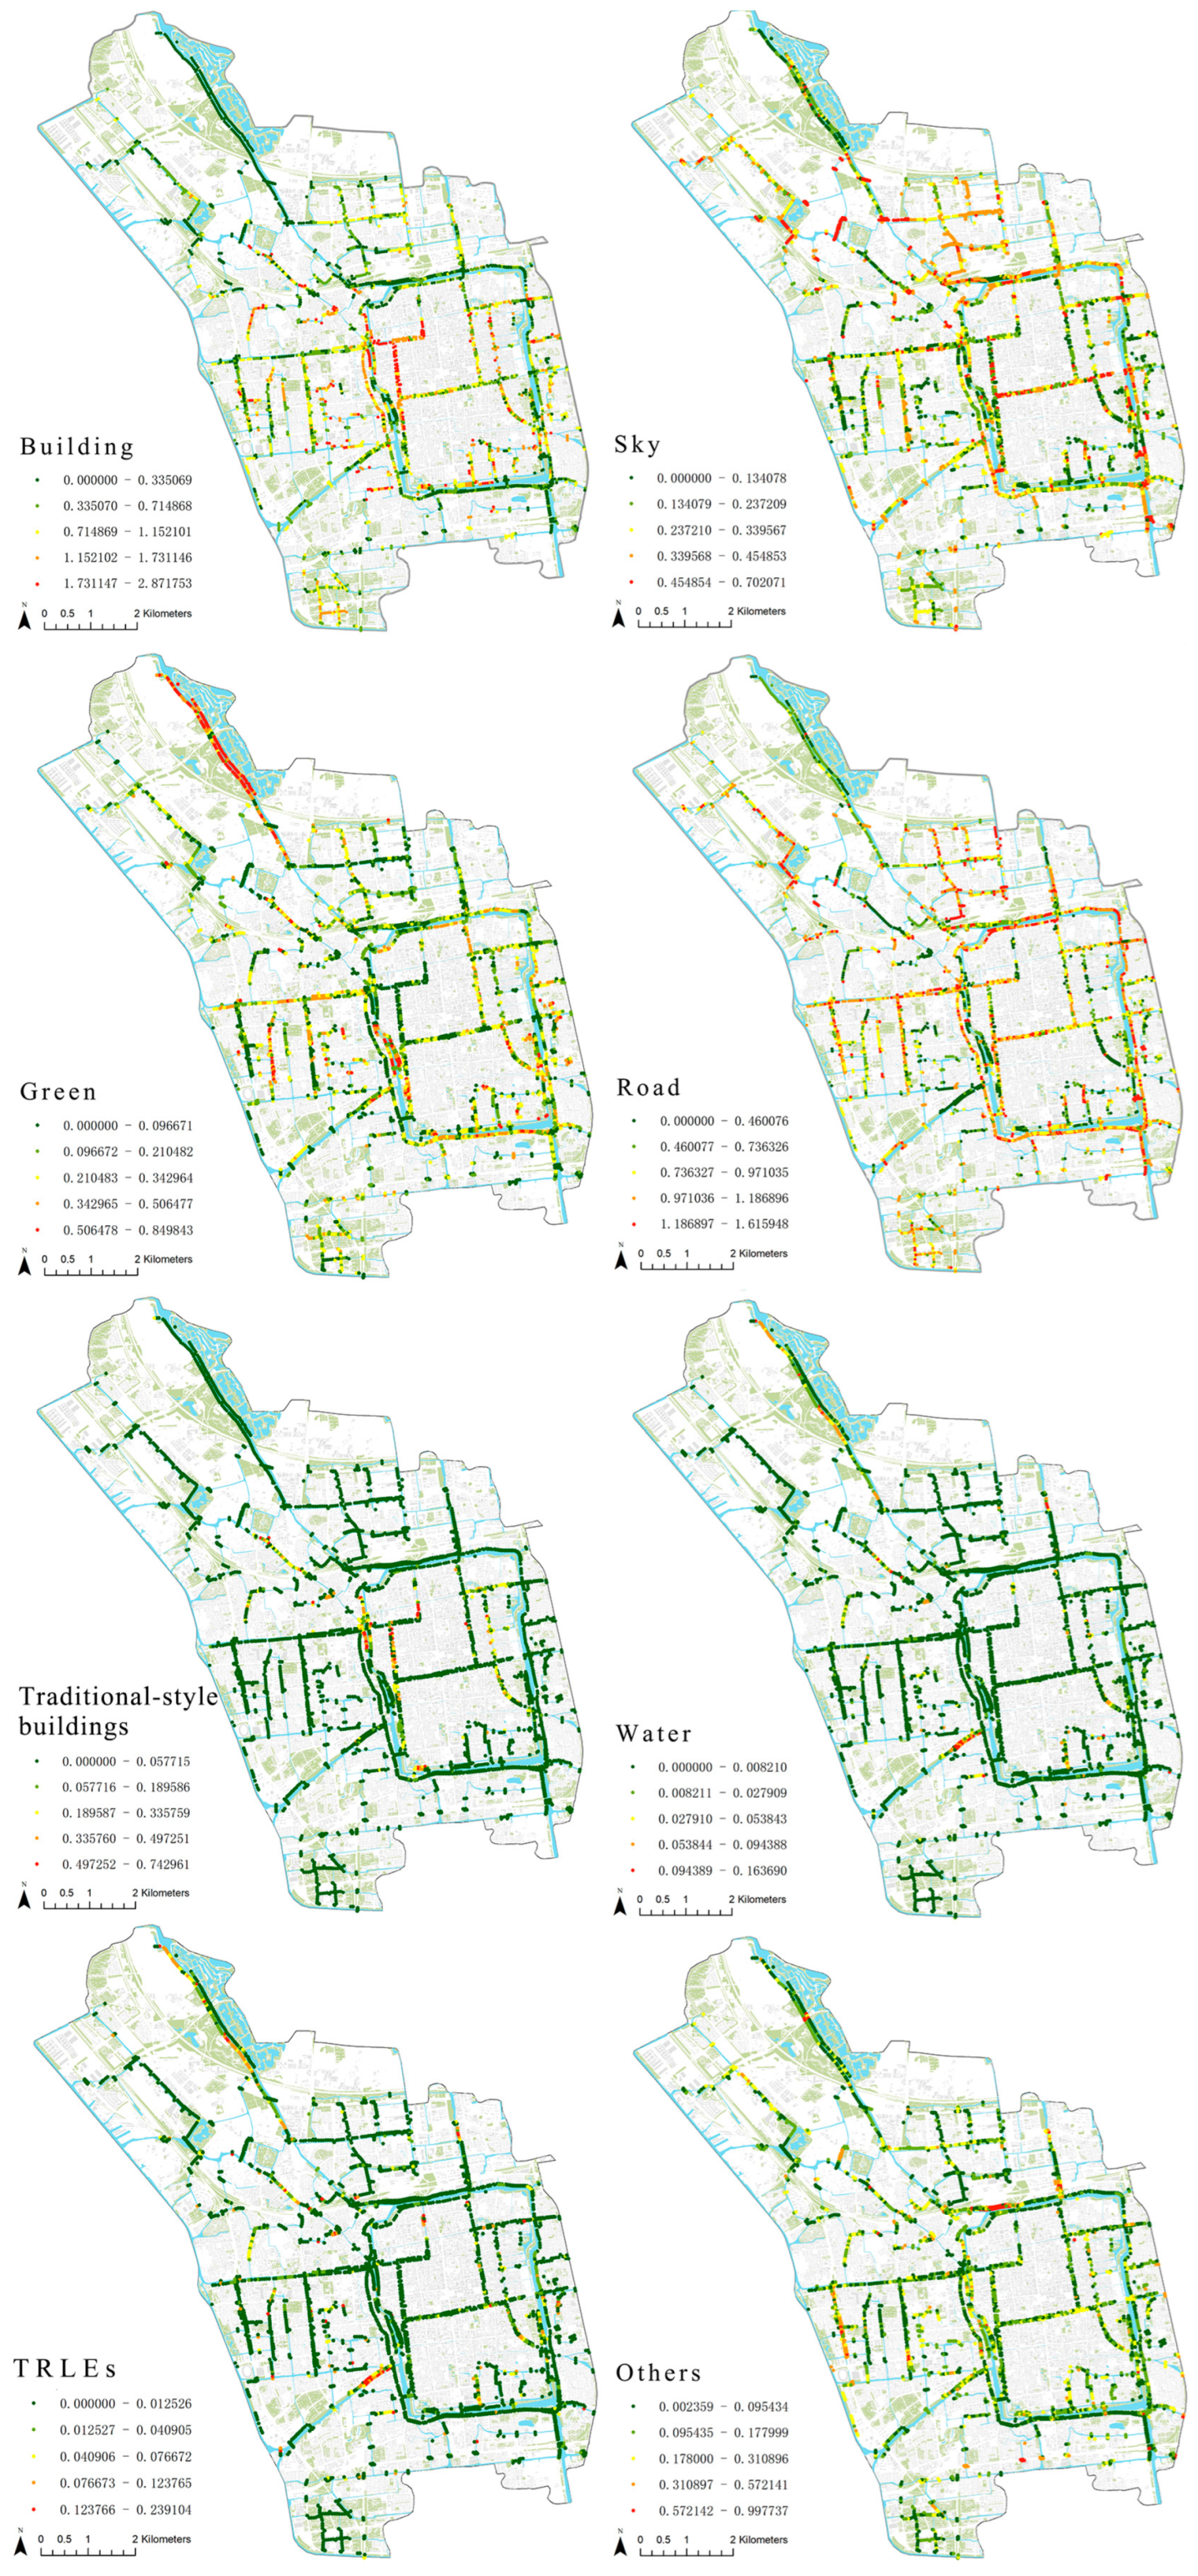
The results indicate that the sky is the most dominant visual element along the URSs in the Gusu District, accounting for 27.94% of the landscape. Roads closely followed at 20.45%, while greenery comprised 19.49%. Building elements collectively make up 16.4% of the visual composition, with ordinary buildings contributing 13.75% and traditional-style buildings 2.65%. Together, the sky, roads, greenery, and buildings constitute the core visual elements, comprising a total of 84.28% of the URS landscape. Other elements, such as traffic lights, road fences, and garbage cans, occupy 14.71% of the visual area. Changes in the spatial sequence of landscape elements are shown in Figure 5. In areas with a high proportion of greenery, the proportion of other elements is low, suggesting that greenery may obscure other elements. The proportion of traditional-style buildings is higher in the ancient city area of Gusu District, while it is lower in other areas. Notably, water and URSs elements make up only a minimal portion of the visual area at 0.47% and 0.54%, respectively, summing up to just 1.01%. This suggests that water elements are underdeveloped and underutilized in the overall urban URS landscape of the Gusu District.

3.2. Analysis of the Visual Attention of the URS Landscape

3.2.1. EVA Value

The average visual attention value of each element was calculated using the EVA formula. The results are presented in Table 2, and the landscape elements were clustered, with the corresponding results displayed in Figure 6. Landscape elements are classified into 4 categories: SA-HV (small area, high visual attention, e.g., TRLEs), LA-HV (large area, high visual attention, e.g., greenery), LA-LV (large area, low visual attention, e.g., others, roads, sky), and SA-MV (small area, middle visual attention, e.g., traditional-style buildings, buildings, and water).
This result indicates that although the area of waterfront landscape elements is limited, they possess a strong visual impact, occupying an important position, capable of attracting attention and enhancing aesthetic value. The large proportion of the area occupied by greenery, along with its high visual attractiveness, suggests that these elements not only exist extensively but also can generate strong visual attention. Further analysis of the heat maps of the samples reveals that buildings have a relatively strong visual attractiveness due to the presence of a lot of textual information. Roads and the sky occupy prominent positions in space, yet their visual attractiveness is relatively low, and they mainly fulfill functional roles. The distribution of traditional-style buildings and water elements is not as extensive as that of other landscape elements, but they tend to be the significant visual focal points.

3.2.2. Visual Attention Evaluation Model Construction

EVA refers to the visual attention of landscape elements within a unit area. By multiplying the EVA of different landscape elements by the proportion data of these elements in the landscape, the landscape visual attention (VA) of the entire image can be obtained. The formula provides a method for predicting the visual attention of the research area on a large scale, and it is presented as follows:
VA = EVA(buildings) × P(buildings) + EVA(green) × P(green) + EVA(roads) × P(roads) + EVA(sky) × P(sky) + EVA(traditional-style buildings) × P(traditional-style buildings) + EVA(water) × P(water) + EVA(waterfront elements) × P(waterfront elements) + EVA(others) × P(others)
The VA of all URSs in Gusu District was calculated using this formula, and the corresponding appeal map was generated, as shown in Figure 7.
The results show that the VA of URSs in the northern part of the Gusu District is relatively low, while that in the southern part is higher. Roads perpendicular to the river generally have lower VA. Most areas within the ancient city have higher VA; however, the URSs beside the northern and southern city moats have lower VA, either because of their distance from the river or their location in tunnels. By contrast, the VA of the roads beside the eastern and western city moats is higher. Additionally, URSs with high VA generally have either higher green coverage or a greater number of buildings, indicating a higher level of built-up area.

3.3. Coupling Analysis of AP and DE Perception

3.3.1. Influence of Landscape Elements on Aesthetic Preference and Distinctiveness Perception

The AP and DE results are shown in Table 3 and Figure 8, respectively. The AP of URSs in the Gusu District is evenly distributed. Most of the AP of URSs in the Gusu District are positive, with an overall high evaluation. By contrast, most of the DEs of URSs in the Gusu District are negative.
The correlation analysis generally aims to reveal whether there is a certain degree of association between variables and to describe the nature of such an association. Correlation analysis helps us understand the relationship between the proportions of different landscape elements and AP, DE, and the results are shown in Table 4. AP was found to have a highly significant positive correlation with green at the 0.01 level and a highly significant negative correlation with buildings and roads at the 0.01 level. Additionally, a significant negative correlation with others was observed at the 0.05 level. This indicates that green buildings and roads play a decisive role in AP. DE, on the other hand, showed a highly significant positive correlation with traditional-style buildings and water at the 0.01 level and a significant positive correlation with water and TRLEs at the 0.05 level. This suggests that the distinctiveness of URSs in Gusu District is primarily influenced by traditional-style buildings, water, and riverfront structures. These elements reflect the unique characteristics of the Gusu District and are important components of the URSs.

3.3.2. Construction of Aesthetic Preference and Distinctiveness Perception Evaluation Models

The landscape elements that have a significant impact in the above analysis were used as independent variables, and the AP and DE were used as dependent variables to establish subjective evaluation models through multiple linear regression (Table 5). Model 1 represents the regression model for AP, whereas model 2 represents the regression model for DE. In model 1, the R value is 0.773a, and the adjusted R2 is 0.598. The Durbin–Watson (DW) test statistic is 1.643, suggesting that the data satisfy the independence criteria. The summary data of the model indicates that the regression model fits well and possesses a certain level of credibility. In model 2, the R value is 0.658a, and the adjusted R2 is 0.433. Although the DW statistic of 1.317 suggests potential residual autocorrelation, Newey-West HAC robust standard errors (lag = 3) were applied and confirmed consistency with original estimates, supporting the reliability of results. The Variance Inflation Factor (VIF) values for both models range from 1.021 to 1.886, indicating a low degree of multicollinearity among the variables. This suggests that the impact of each variable on the model is independent. The summary statistics of the model indicate that the regression model has a certain degree of reliability.
According to the regression coefficient analysis in Table 5, the multivariate linear regression equation established for the AP and DE models of URSs is as follows:
AP = 0.58 − 1.84 × buildings + 1.24 × green − 1.88 × others − 2.29 × roads
DE = 0.32 − 0.88 × buildings − 2.11 × roads + 4.11 × water + 1.19 × traditional-style buildings.
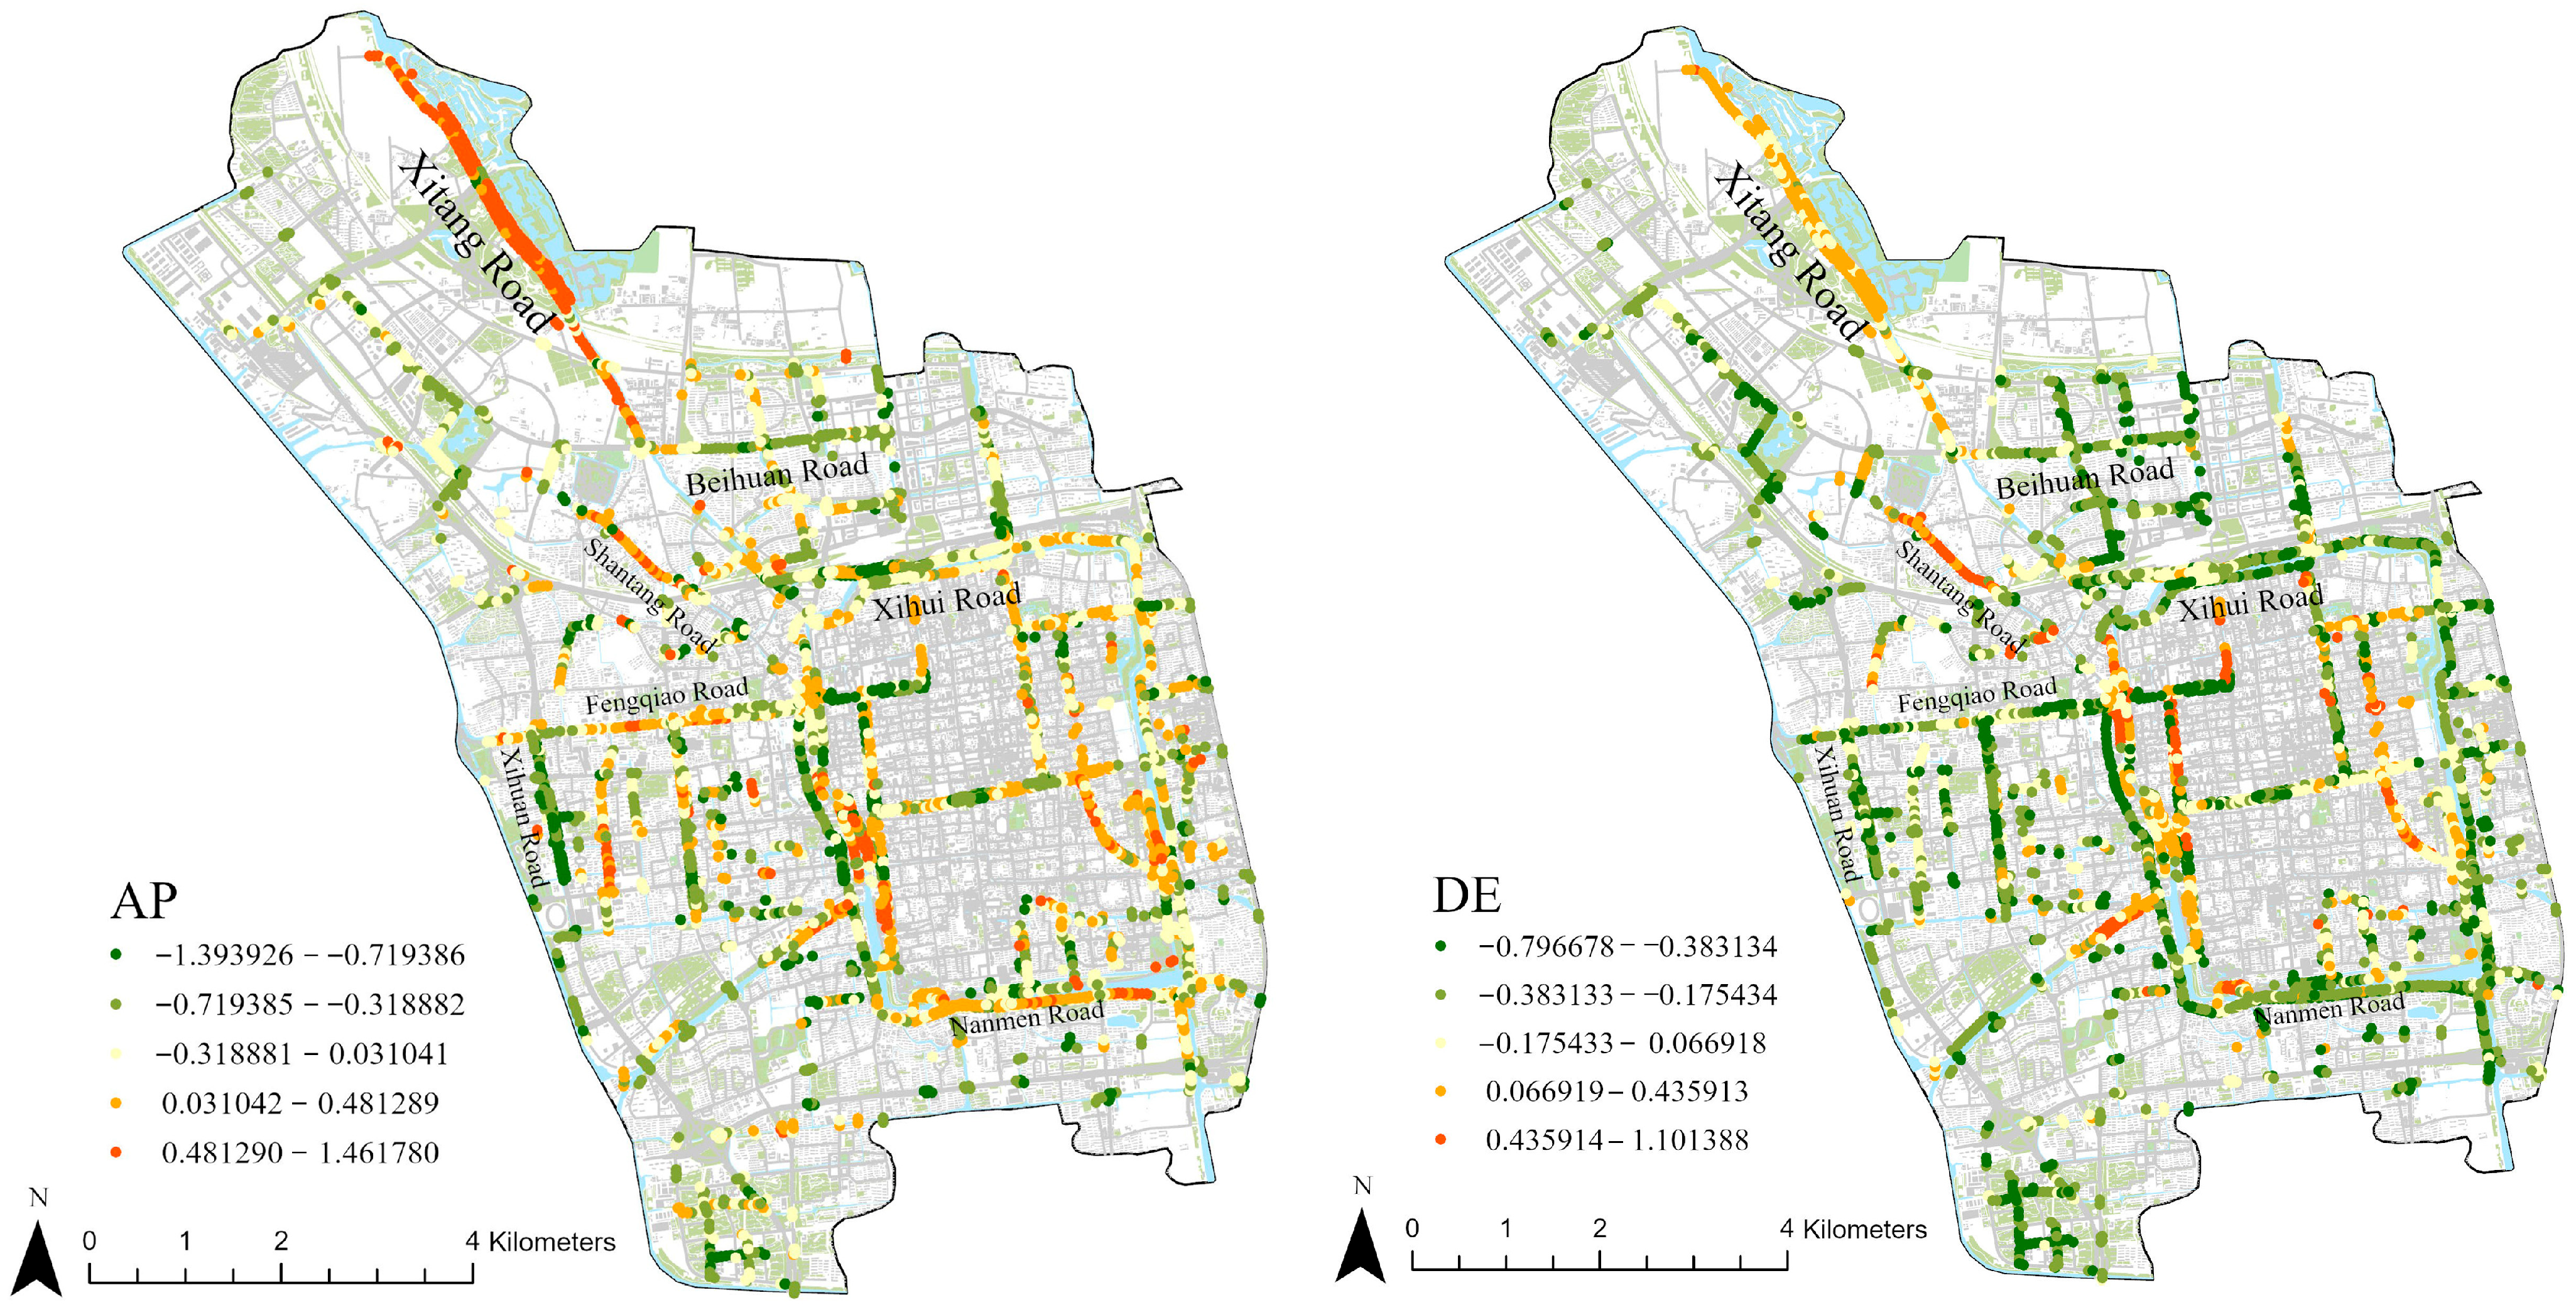
The AP values of all 3311 sampling points in Gusu District were calculated using the regression equation, and the values were visualized using ArcGIS 10.8 to obtain the AP and DE maps of URSs in Gusu District (Figure 9).
In Figure 9, the AP of most URSs in the Gusu District is high, benefiting from extensive greening coverage and high-quality road landscapes. Specifically, Xitang Road and Fengqiao Road beside the Xitang River, as well as Xihui Road and Nanmen Road on both sides of the northern and southern city moats, exhibit the highest AP values. However, the AP of some roads within tunnels on Xihuan Road and Beihuan Road is relatively low, primarily due to the lack of green in the field of view and the presence of numerous interference elements. In terms of DE, most URSs in the Gusu District perform poorly, with the exception of Shantang Road, which has higher DE values. The URSs within the ancient city are enhanced by their long history and rich cultural landscape elements, whereas those outside the ancient city lack distinctiveness.

4. Discussion

4.1. Comprehensive Evaluation of Visual Perception of URSs

VA, AP, and DE were divided into high and low categories, and the evaluation values of these three dimensions were expressed through a three-dimensional coordinate system. The comprehensive evaluation is represented by eight quadrants in the three-dimensional coordinate system, each corresponding to a unique combination of high or low VA, AP, and DE.
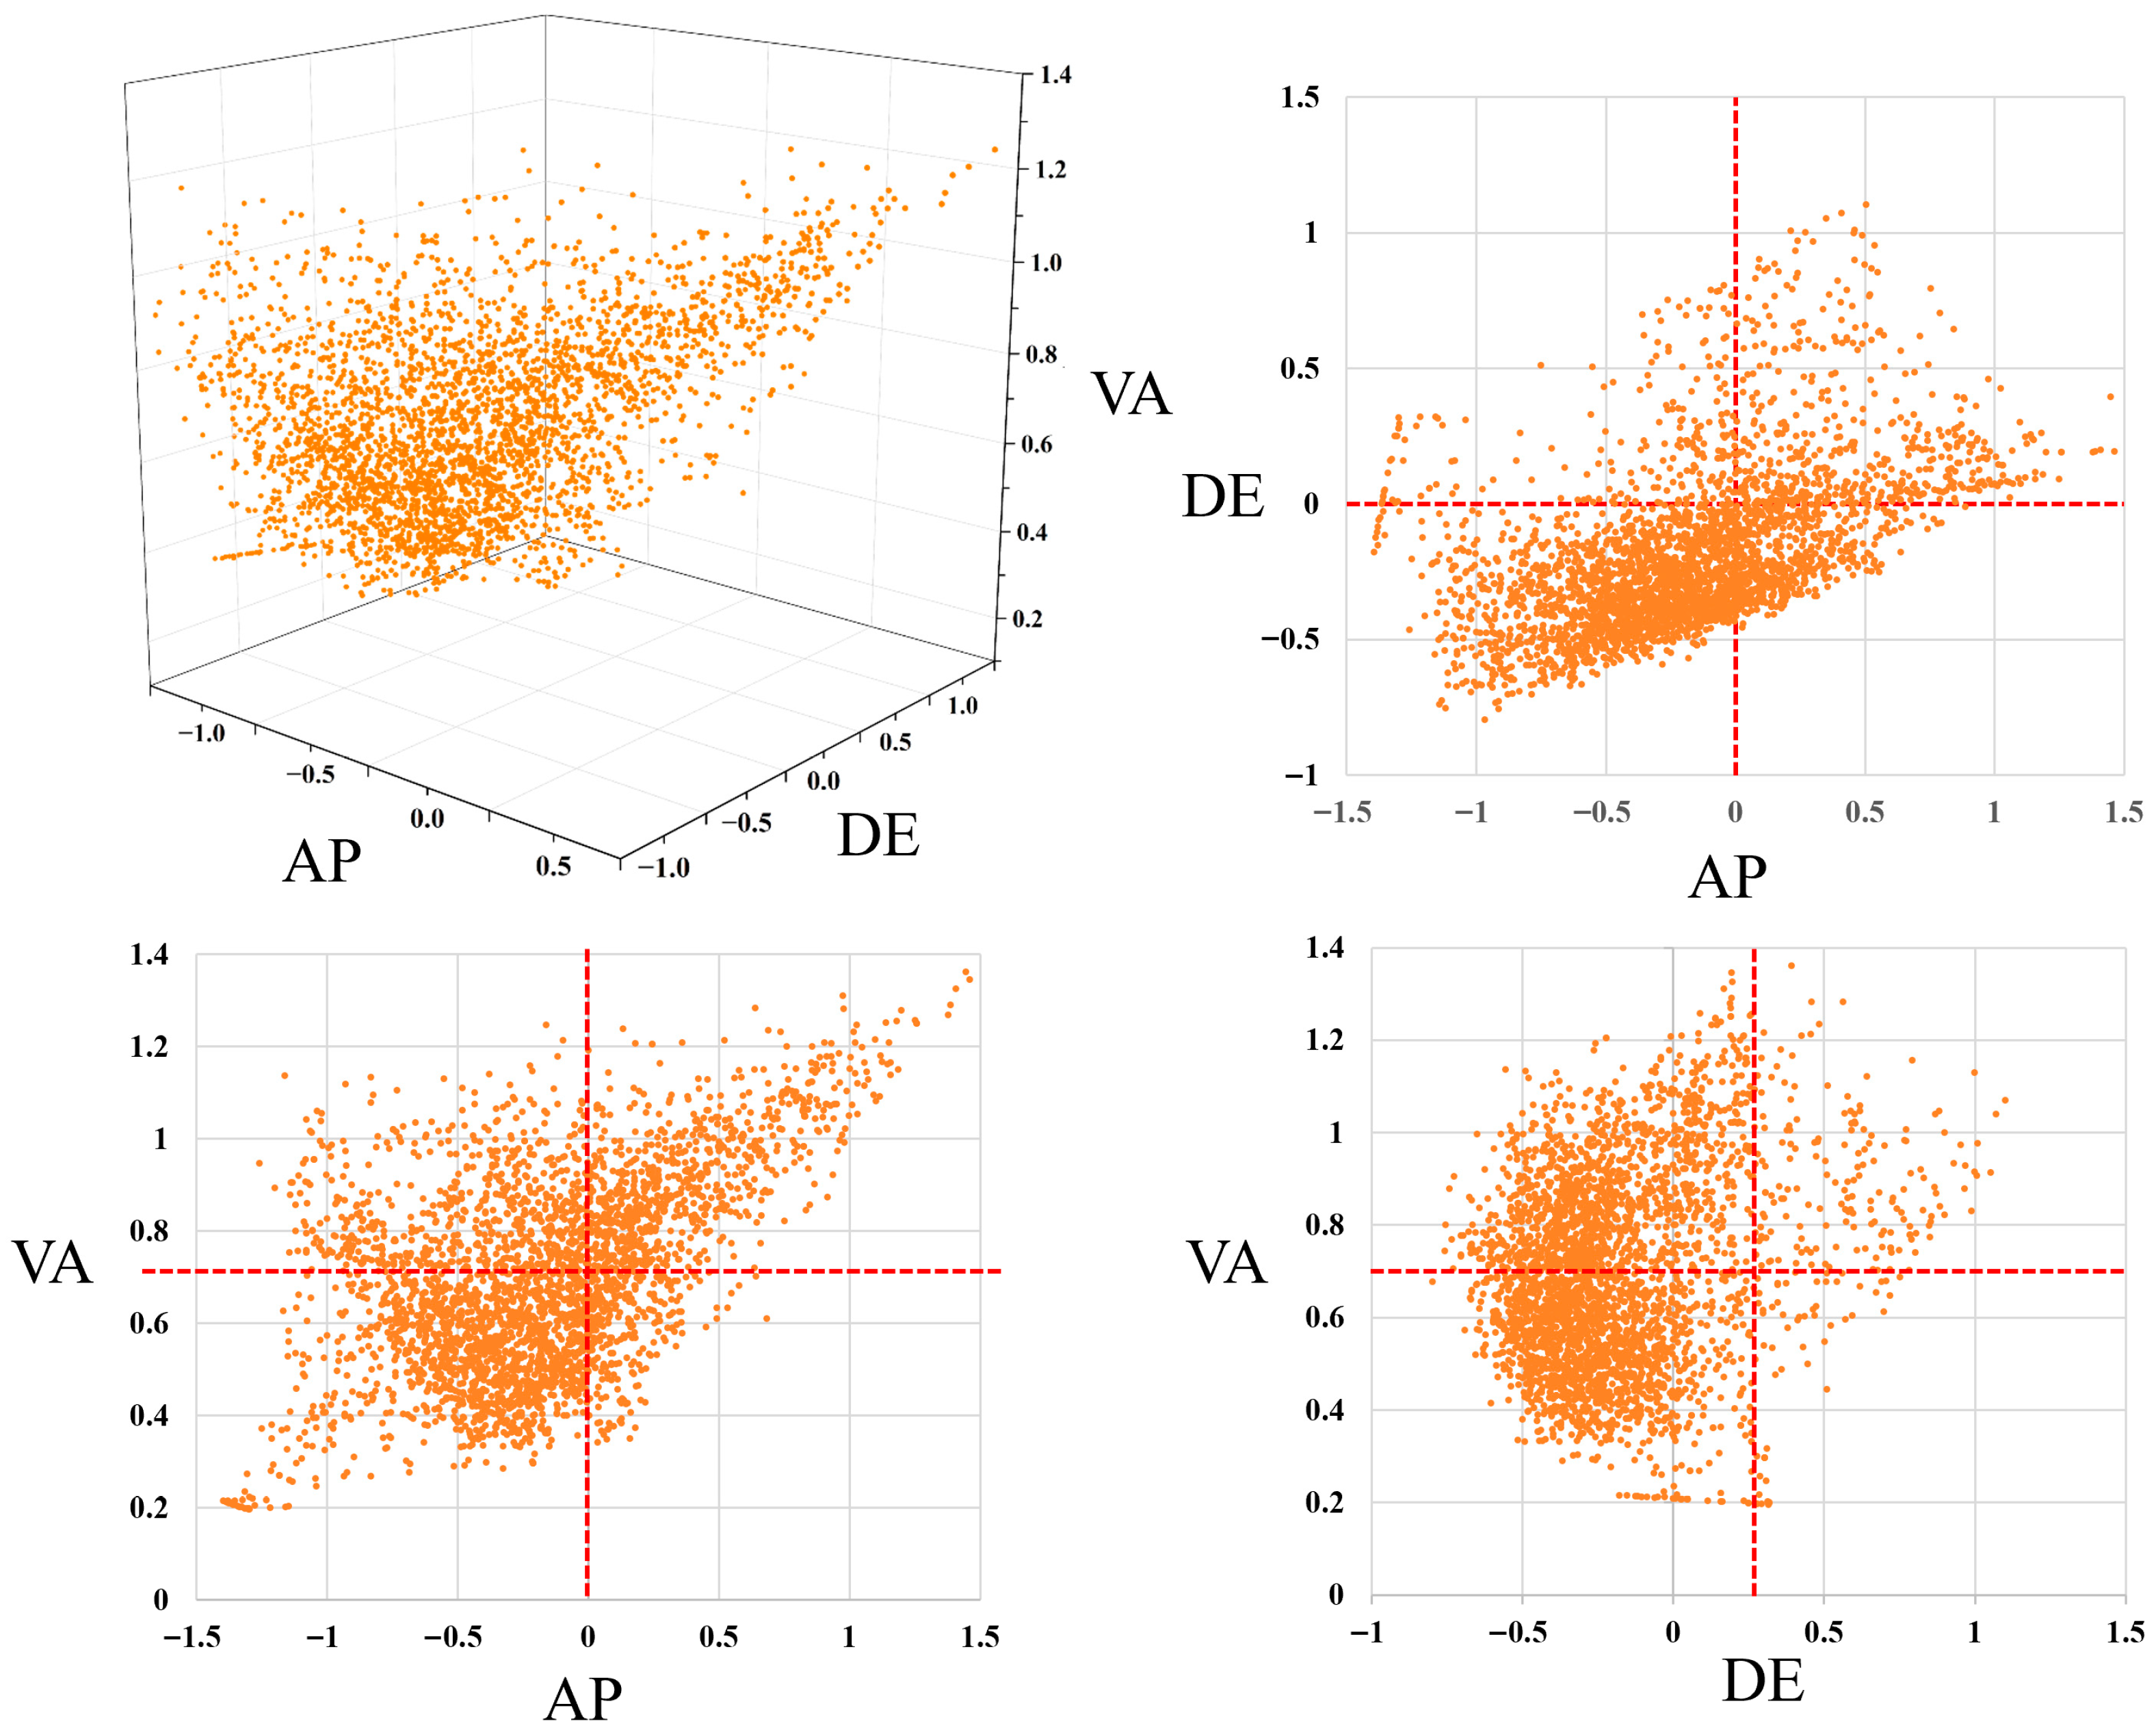
The three-dimensional scatter plot (Figure 10) shows that most scatter points are concentrated in the third and fourth quadrants, indicating high AP and low DE, while VA is evenly distributed. There are a few points with high AP–high DE–high VA, which indicates that the waterfront roads in Gusu District generally have a certain degree of scenic beauty, but are relatively poor in distinctiveness and relatively balanced in terms of appeal.
Further analysis of the two-dimensional scatter plot shows that AP and VA are evenly distributed, DE and VA mostly present as a combination of low DE and high VA, and DE and AP are mostly concentrated in the low-value area. The simultaneous occurrence of high VA and low DE at certain points indicates that the waterfront area can still attract the public even if it lacks distinctive features.

4.2. Influence Mechanism of Landscape Elements on VA, AP, and DE

The correlation between the regression values of VA, AP, and DE of URSs was analyzed. The results are shown in Table 6, with the VA and AP (r = 0.515, p < 0.01) showing a highly significant positive correlation, indicating that the VA of the landscape will affect the AP of the audience in the studied area. Furthermore, there is a correlation between DE and VA (r = 0.212, p < 0.01), suggesting that the level of DE does determine the value of VA.
The coefficient values of the regression models for AP and DE clearly define the quantitative relationship between these landscape elements and subjective evaluations, whereas the EVA establishes the quantitative relationship between landscape elements and VA. The results in Table 7 reveal that buildings, green spaces, traditional-style buildings, water features, roads and others exert a greater influence on the three types of visual perception. By contrast, the sky and TRLEs, as background elements, have minimal effects on visual perception. Notably, buildings with relatively high VA are associated with a negative relation to AP, suggesting that they can be disadvantageous visual landscape elements in URSs. Conversely, green spaces are positively associated with VA and AP, emerging as positive visual landscape elements. Furthermore, water features, and traditional-style buildings are positively related to VA and DE, reinforcing their essential role in enhancing URSs.
The results demonstrate that people have a stronger preference for natural elements rather than artificial ones. Areas that combine natural elements with characteristic elements organically, as well as pure natural environments, are more popular and possess greater appeal.
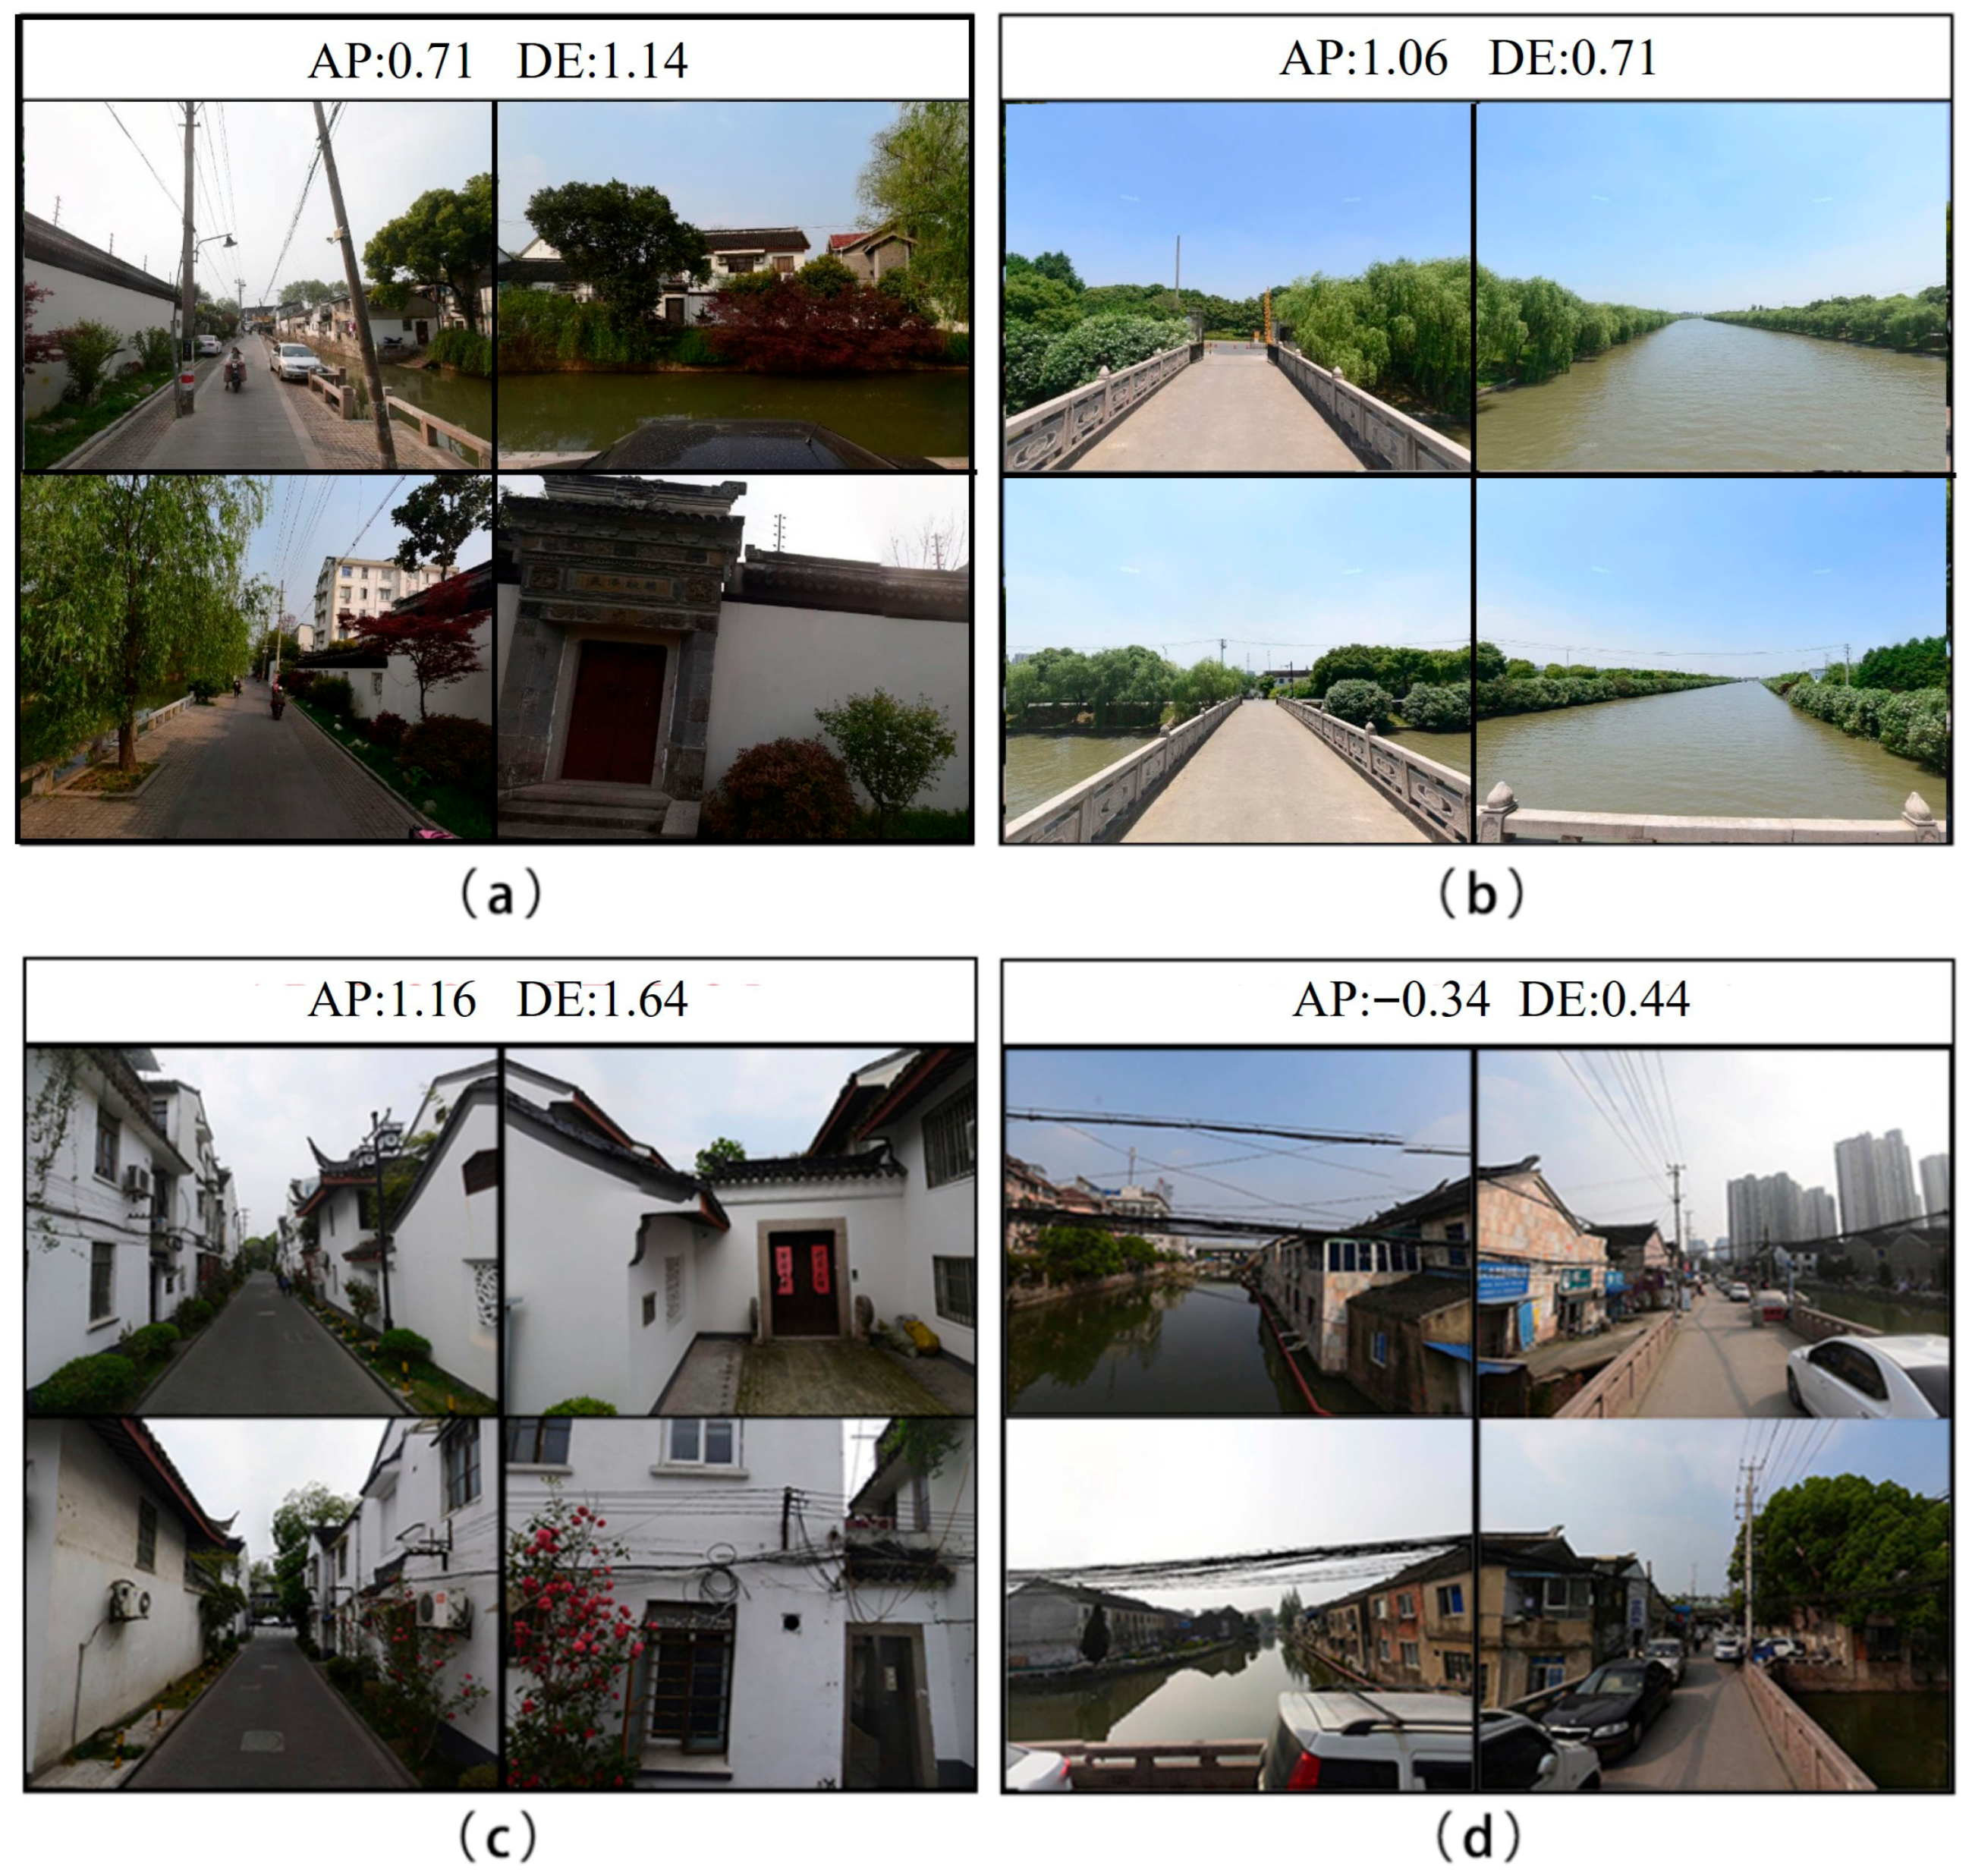
It was discovered that the samples with a high proportion of natural elements had a relatively high AP, and the samples with high DE scores showed a significant variation in their AP evaluation results, as Figure 11 presents typical sample photos. The areas that combined unique elements with natural elements always received a relatively high DE score, as shown in Figure 11a. The areas rich in natural elements had higher AP scores, presented in Figure 11b. However, the samples with more characteristic elements but fewer natural elements had a lower AP score and a higher DE score, as illustrated in Figure 11c. The AP was considerably and negatively influenced by interfering elements, even if the area had a high degree of distinctiveness, as depicted in Figure 11d. Therefore, more emphasis should be placed on introducing natural elements and combining them with unique elements, and interfering elements should be strictly controlled to enhance the aesthetic perception of the historical waterfront area.
These findings highlight the importance of strategically managing key landscape elements to optimize the visual perception of URSs. Specifically, generic building elements negatively correlate with aesthetic preference, indicating the need to mitigate their visual dominance—particularly in historic settings [37]. By contrast, greenery consistently enhances both visual attention and aesthetic preference, aligning with evidence that water and green coverage significantly elevate public preference [6]. Moreover, water features and traditional-style buildings contribute notably to visual distinctiveness and appeal, reinforcing the positive role of historical “distinctiveness” in waterfront redevelopment. Such distinctiveness can not only enhance cultural salience but also amplify tourism appeal, fostering economic revitalization through cultural heritage preservation and public space activation [49]. Importantly, traditional riverfront landscape elements (TRLEs) show a significant contribution to visual attention but exert limited effects on aesthetic preference and distinctiveness. This suggests that their cultural and aesthetic potential remains underutilized.
Therefore, the renewal of URSs should prioritize the integration of green spaces, water features, and culturally distinctive elements while minimizing the presence of incongruous or visually intrusive structures. Careful consideration of building placement and form, combined with the balanced inclusion of natural and heritage elements, is essential to enhance both the aesthetic quality and cultural uniqueness of historic waterfront environments. Furthermore, we have established the optimization paths of URSs based on a Comprehensive Evaluation of Visual Perception (Figure 12).

4.3. Limitations

There are several limitations in this study. First, street-view images are obtained from different seasons and years. This might lead to errors in the identification of plant elements because seasonal changes can affect visual perception. In addition, weather variations may also impact the accuracy of both machine recognition and subjective human perception. Secondly, due to the constraints of experimental equipment, photographs are used instead of real-life scenes in the eye-tracking experiments. In addition, this study did not explicitly account for visual depth or viewing distance, both of which strongly influence visual attention and aesthetic judgments; overlooking them may have reduced result accuracy. Participants may not be able to perceive the street views comprehensively and intuitively, which may cause potential discrepancies between the experimental results and the actual perception. The participant pool, primarily consisting of students and faculty, may introduce sampling bias and limit generalizability. Furthermore, the small sample size may limit the generalizability of our findings over a larger spatial area, while the sparse proportion of key elements like traditional-style buildings and water features could reduce the sensitivity of the linear regression model. Nonlinear methods or spatial analyses—alongside multi-scale data such as dynamic eye-tracking and real-time environmental interactions—may be needed to more accurately capture and validate the relationships between visual attention and psychological perceptions. Future studies should expand recruitment to include diverse age groups and socioeconomic backgrounds to enhance generalizability.

5. Conclusions

Measuring the multidimensional perception of URSs and revealing their influencing mechanisms can help understand public landscape perceptions and create better URS landscapes. This study employs deep-learning and eye-tracking technology to identify the multidimensional visual perception of URSs by analyzing landscape elements and their influence on visual attention, aesthetic preference, and distinctiveness. This study introduces a novel integration of EVA and correlation analysis models to quantify the impact of urban landscape elements on multidimensional visual perceptions—visual attention, aesthetic preference, and distinctiveness—in riverfront streets. Our findings show that traditional-style buildings and water features enhance distinctiveness, while greenery aligns with both visual attention and aesthetic preference, supporting the existing literature on the restorative effects of natural elements. These insights redefine waterfront regeneration priorities, emphasizing the need to balance natural and culturally distinctive elements while mitigating the negative effects of generic buildings.

Author Contributions

Supervision, X.X., Q.Z. and H.Y.; Writing—review and editing, X.X., Y.W., J.Z. and Y.H.; Writing—original draft preparation, M.M.; Software, S.Y. All authors have read and agreed to the published version of the manuscript.

Funding

This research was funded by the Ministry of Education Humanities and Social Sciences Youth Foundation Project: Mechanisms and Planning Design Strategies for Slow-Mobility Environments in Promoting Public Health Under the “City-Park Integration” Framework (No. 24YJC760143), the Jiangsu Provincial Philosophy and Social Science Research General Project: Coupling Mechanisms and Design Interventions for Urban Slow-Mobility Spaces from a Public Health Perspective (No. 2024SJYB0071), and by the Jiangsu Province Postgraduate Research & Practice Innovation Program: Landscape Layout Generation of Traditional Jiangnan Villages Based on Generative Adversarial Networks (SJCX25_0278).

Institutional Review Board Statement

The study involving human participants was conducted in accordance with the ethical standards of “Experimental animal welfare and ethics review form of Nanjing Agricultural University”. All participants provided informed consent prior to participation (Audit number: NJAULLSC2023015).

Informed Consent Statement

Informed consent was obtained from all participants involved in the study.

Data Availability Statement

The dataset is available on request from the authors.

Conflicts of Interest

The authors declare no conflict of interest.

References

  1. Li, X.; Wang, X.; Jiang, X.; Han, J.; Wang, Z.; Wu, D.; Lin, Q.; Li, L.; Zhang, S.; Dong, Y. Prediction of riverside greenway landscape aesthetic quality of urban canalized rivers using environmental modeling. J. Clean. Prod. 2022, 367, 133066. [Google Scholar] [CrossRef]
  2. Sairinen, R.; Kumpulainen, S. Assessing social impacts in urban waterfront regeneration. Environ. Impact Assess. Rev. 2006, 26, 120–135. [Google Scholar] [CrossRef]
  3. Yao, Y.M.; Zhu, X.D.; Xu, Y.B.; Yang, H.Y.; Sun, X. Assessing the Visual Quality of Urban Waterfront Landscapes: The Case of Hefei, China. Acta Ecol. Sin. 2012, 32, 5836–5845. [Google Scholar] [CrossRef]
  4. Kwiatkowski, M.A.; Karbowiński, Ł. Why the Riverside Is an Attractive Urban Corridor for Bicycle Transport and Recreation. Cities 2023, 143, 104611. [Google Scholar] [CrossRef]
  5. Kang, N.; Liu, C. Towards Landscape Visual Quality Evaluation: Methodologies, Technologies, and Recommendations. Ecol. Indic. 2022, 142, 109174. [Google Scholar] [CrossRef]
  6. Zhou, X.; Cen, Q.; Qiu, H. Effects of Urban Waterfront Park Landscape Elements on Visual Behavior and Public Preference: Evidence from Eye-Tracking Experiments. Urban For. Urban Green. 2023, 82, 127889. [Google Scholar] [CrossRef]
  7. Erkök, F. Waterfront: Potentials for Improving the Quality of Urban Life. Istanb. Tech. Univ. Fac. Archit. 2009, 6, 126–145. [Google Scholar]
  8. Wu, J.; Li, J.W.; Ma, Y. Exploring the Relationship between Potential and Actual of Urban Waterfront Spaces in Wuhan Based on Social Network. Sustainability 2019, 11, 3298. [Google Scholar] [CrossRef]
  9. Breen, A.; Rigby, D. Waterfronts: Cities Reclaim Their Edge; McGraw-Hill Inc.: New York, NY, USA, 1994. [Google Scholar]
  10. Pramesti, R.E. Sustainable Urban Waterfront Redevelopment: Challenge and Key Issues. Media Matrasain 2017, 14, 41–54. [Google Scholar]
  11. Liu, S.; Lai, S.Q. Research on Urban Waterfront Public Space Satisfaction Evaluation Based on AHP-IPA Method. Urban Archit. 2024, 21, 73–79. [Google Scholar] [CrossRef]
  12. Liu, Y.; Sun, X. Evaluation of Public Facility Service Functions in Urban Waterfront Parks: A Case Study of Yueya Lake Park in Nanjing. Gardening 2021, 38, 57–65. [Google Scholar]
  13. Yang, C.; Shao, B. The Influence of Waterfront Public Space Elements on Retention Vitality and Countermeasures: A Case Study of Two Typical Waterfront Areas in Shanghai’s Huangpu River. Urban Archit. 2018, 5, 40–47. [Google Scholar] [CrossRef]
  14. Zhang, J.; Yu, Q.Q.; Fu, D.S.; Zhang, C.; Guo, T.T.; Xin, Y.; Shao, F. Research on Urban Waterfront Space Vitality Based on Multi-Source Data: A Case Study of Hangzhou West Lake Waterfront Area. Zhejiang For. Sci. Technol. 2023, 43, 82–89. [Google Scholar]
  15. Zeng, X.; Zhang, Z. Urban Waterfront Landscape Planning and Design Based on Regional Ecology Priority: A Case Study of the Grass Street Riverside Landscape Planning on Jialing River, Chongqing. Chin. Landsc. Archit. 2010, 26, 49–53. [Google Scholar]
  16. Bulut, Z.; Yilmaz, H. Determination of Waterscape Beauties through Visual Quality Assessment Method. Environ. Monit. Assess. 2009, 154, 459–468. [Google Scholar] [CrossRef]
  17. Liu, B. Towards Landscape Interaction: Inheritance and Development of Landscape Perception and Visual Evaluation. Landsc. Archit. 2022, 29, 12–17. [Google Scholar] [CrossRef]
  18. Filova, L.; Vojar, J.; Svobodova, K.; Sklenicka, P. The Effect of Landscape Type and Landscape Elements on Public Visual Preferences: Ways to Use Knowledge in the Context of Landscape Planning. J. Environ. Plan. Manag. 2015, 58, 2037–2055. [Google Scholar] [CrossRef]
  19. Misthos, L.-M.; Krassanakis, V.; Merlemis, N.; Kesidis, A.L. Modeling the Visual Landscape: A Review on Approaches, Methods and Techniques. Sensors 2023, 23, 8135. [Google Scholar] [CrossRef] [PubMed]
  20. Wei, J.; Yue, W.; Li, M.; Gao, J. Mapping Human Perception of Urban Landscape from Street-View Images: A Deep-Learning Approach. Int. J. Appl. Earth Obs. Geoinf. 2022, 112, 102886. [Google Scholar] [CrossRef]
  21. Dubey, A.; Naik, N.; Parikh, D.; Raskar, R.; Hidalgo, C.A. Deep Learning the City: Quantifying Urban Perception at a Global Scale; Springer International Publishing: Cham, Switzerland, 2016; pp. 196–212. [Google Scholar] [CrossRef]
  22. Poledniková, Z.; Galia, T. Photo Simulation of a River Restoration: Relationships between Public Perception and Ecosystem Services. River Res. Appl. 2021, 37, 44–53. [Google Scholar] [CrossRef]
  23. Ding, J.; Luo, L.; Shen, X.; Xu, Y. Influence of Built Environment and User Experience on the Waterfront Vitality of Historical Urban Areas: A Case Study of the Qinhuai River in Nanjing, China. Front. Archit. Res. 2023, 12, 820–836. [Google Scholar] [CrossRef]
  24. Lan, W.J.; Wang, L.L. Research on Conservation Methods for Diversified Characteristic Blocks from the Perspective of Historic Urban Landscapes: A Case Study of the Yu Liang Nan Road Historic and Cultural Block in Jiujiang. China Famous Cities 2019, 4, 71–77. [Google Scholar] [CrossRef]
  25. Daniel, T.; Boster, R. Measuring Landscape Esthetics: The Aesthetic Preference Estimation Method; US Forest Service: Washington, DC, USA, 1976. [Google Scholar]
  26. Yazici, K.; Asur, F. Assessment of Landscape Types and Aesthetic Qualities by Visual Preferences (Tokat, Turkey). 2021. Available online: https://avesis.yyu.edu.tr/yayin/d137a2d7-f81d-4cd4-a703-1d02daf0544d/assessment-of-landscape-types-and-aesthetic-qualities-by-visual-preferences-tokat-turkey (accessed on 15 September 2025).
  27. Akten, M.; Celik, M. Evaluation of Visual Landscape Perception for Incilipinar and Adalet Park Cases. J. Food Agric. Environ. 2013, 11, 1532–1538. [Google Scholar]
  28. Chen, Y.; Zhong, Q.; Li, B. Positive or Negative Viewpoint Determines the Overall Scenic Beauty of a Scene: A Landscape Perception Evaluation Based on a Panoramic View. Sustainability 2023, 15, 11458. [Google Scholar] [CrossRef]
  29. Zhang, F.; Zhou, B.; Liu, L.; Liu, Y.; Fung, H.H.; Lin, H.; Ratti, C. Measuring Human Perceptions of a Large-Scale Urban Region Using Machine Learning. Landsc. Urban Plan. 2018, 180, 148–160. [Google Scholar] [CrossRef]
  30. Huang, J.; Obracht-Prondzynska, H.; Kamrowska-Zaluska, D.; Sun, Y.; Li, L. The Image of the City on Social Media: A Comparative Study Using ‘Big Data’ and ‘Small Data’ Methods in the Tri-City Region in Poland. Landsc. Urban Plan. 2021, 206, 103977. [Google Scholar] [CrossRef]
  31. Filomena, G.; Verstegen, J.A.; Manley, E. A Computational Approach to ‘The Image of the City’. Cities 2019, 89, 14–25. [Google Scholar] [CrossRef]
  32. De Lucio, J.V.; Mohamadian, M.; Ruiz, J.; Banayas, J.; Bernaldez, F. Visual Landscape Exploration as Revealed by Eye Movement Tracking. Landsc. Urban Plan. 1996, 34, 135–142. [Google Scholar] [CrossRef]
  33. Carrasco, M.; Eckstein, M.; Verghese, P.; Boynton, G.; Treue, S. Visual Attention: Neurophysiology, Psychophysics, and Cognitive Neuroscience. Vis. Res. 2009, 49, 1033–1036. [Google Scholar] [CrossRef]
  34. Zhang, X.; Xiong, X.; Chi, M.; Yang, S.; Liu, L. Research on Visual Quality Assessment and Landscape Elements Influence Mechanism of Rural Greenways. Ecol. Indic. 2024, 160, 111844. [Google Scholar] [CrossRef]
  35. Qin, X.; Fang, M.; Yang, D.; Wangari, V.W. Quantitative Evaluation of Attraction Intensity of Highway Landscape Visual Elements Based on Dynamic Perception. Environ. Impact Assess. Rev. 2023, 100, 107081. [Google Scholar] [CrossRef]
  36. Zhang, Y.; Xiong, X.; Yang, S.; Zhang, Q.; Chi, M.; Wen, X.; Zhang, X.; Wang, J.; Mejjad, N. Enhancing the Visual Environment of Urban Coastal Roads through Deep Learning Analysis of Street-View Images: A Perspective of Aesthetic and Distinctiveness. PLoS ONE 2025, 20, e0317585. [Google Scholar] [CrossRef] [PubMed]
  37. Qiu, Y.; Luo, T.; Wang, Y.Y.; Fang, X.L.; Zhao, C. Research on the Perceptual Characteristics of Urban Landscape Elements Based on Visual Attention and Aesthetic Preference. Chin. Landsc. Archit. 2023, 39, 82–87. [Google Scholar] [CrossRef]
  38. Jiang, X.; Li, X.; Wang, M.; Zhang, X.; Zhang, W.; Li, Y.; Cong, X.; Zhang, Q. Multidimensional Visual Preferences and Sustainable Management of Heritage Canal Waterfront Landscape Based on Panoramic Image Interpretation. Land 2025, 14, 220. [Google Scholar] [CrossRef]
  39. Luo, S.; Xie, J.; Furuya, K. Effects of Perceived Physical and Aesthetic Quality of Urban Blue Spaces on User Preferences: A Case Study of Three Urban Blue Spaces in Japan. Heliyon 2023, 9, e15033. [Google Scholar] [CrossRef]
  40. Jiang, H.; Song, M.K.; Xiao, Y. Study on the Visual Comfort Evaluation of Waterfront Spaces: A Case Study of ‘One River and One Creek’ in Shanghai. Landsc. Archit. 2022, 29, 122–129. [Google Scholar]
  41. Truong, T.L.H.; Lenglet, F.; Mothe, C. Destination distinctiveness: Concept, measurement, and impact on tourist satisfaction. J. Destin. Mark. Manag. 2018, 8, 214–231. [Google Scholar] [CrossRef]
  42. Wu, Y.F.; Rong, X. The Relationship between Suzhou’s Waterfront Street Distribution and Urban Changes in the Ming and Qing Dynasties. City Plan. Rev. 2017, 41, 96–100. [Google Scholar]
  43. Zhang, L.; Pei, T.; Wang, X.; Wu, M.; Song, C.; Guo, S.; Chen, Y. Quantifying the urban visual perception of Chinese traditional-style building with street view images. Appl. Sci. 2020, 10, 5963. [Google Scholar] [CrossRef]
  44. Ogawa, Y.; Oki, T.; Zhao, C.; Sekimoto, Y.; Shimizu, C. Evaluating the Subjective Perceptions of Streetscapes Using Street-View Images. Landsc. Urban Plan. 2024, 247, 105073. [Google Scholar] [CrossRef]
  45. Ma, R.; Luo, Y.; Furuya, K. Classifying Visually Appealing Elements in Parks Using Social Media Data-Assisted Eye-Tracking: Case Study of Shinsui Parks in Tokyo, Japan. J. Outdoor Recreat. Tour. 2023, 44, 100672. [Google Scholar] [CrossRef]
  46. Yuan, Y.; Wang, L.; Wu, W.; Zhong, S.; Wang, M. Locally Contextualized Psycho-Physiological Wellbeing Effects of Environmental Exposures: An Experimental-Based Evidence. Urban For. Urban Green. 2023, 88, 128070. [Google Scholar] [CrossRef]
  47. Naghibi, M. Rethinking Small Vacant Lands in Urban Resilience: Decoding Cognitive and Emotional Responses to Cityscapes. Cities 2024, 151, 105167. [Google Scholar] [CrossRef]
  48. Li, C.; Huang, X. Differences in Visual Attraction between Historical Garden and Urban Park Walking Scenes. Land 2022, 11, 1766. [Google Scholar] [CrossRef]
  49. Airas, A.; Hall, P.V.; Stern, P. Asserting Historical ‘Distinctiveness’ in Industrial Waterfront Transformation. Cities 2015, 44, 86–93. [Google Scholar] [CrossRef]
Figure 1. Research framework.
Land 14 02039 g001
Figure 2. Study area.
Land 14 02039 g002
Figure 3. Framework for extracting URS landscape elements.
Land 14 02039 g003
Figure 4. Designation of AOIs and the attention heatmap.
Land 14 02039 g004
Figure 5. Changes in the spatial sequence of landscape elements.
Land 14 02039 g005
Figure 6. Clustering results of eight visual attentions of URS landscape elements.
Land 14 02039 g006
Figure 7. VA of URSs.
Land 14 02039 g007
Figure 8. Scatter plots of the AP and DE scores.
Land 14 02039 g008
Figure 9. AP map (left) and DE map (right).
Land 14 02039 g009
Figure 10. Scatter plots of AP, DE, and VA.
Land 14 02039 g010
Figure 11. The comparison of AP and DE scores of photo samples. (a) high DE, combination of characteristic and natural elements; (b) high AP, rich in natural elements; (c) higher DE and lower AP, more characteristic elements and fewer natural elements; (d) low AP, more characteristic elements but with interfering elements.
Land 14 02039 g011
Figure 12. Optimization paths of URSs.
Land 14 02039 g012
Table 1. Percentages of URS landscape elements in the Gusu District.
BuildingsSkyGreenRoadsTraditional-Style BuildingsWaterTRLEsOthers
13.75%27.94%19.49%20.45%2.65%0.47%0.54%14.71%
Table 2. The EVAs of URS landscape elements.
ElementPercent
(Element)
EVA
(Element)
ElementPercent
(Element)
EVA
(Element)
Buildings11.37%1.38Traditional-style buildings6.65%1.19
Sky28.16%0.26Water1.71%1.4
Green20.95%1.53TRLEs1.25%1.81
Roads17.26%0.28Others12.64%0.19
Table 3. Results of AP and DE.
Image
Number
APDEImage
Number
APDE
sample_10.65−0.13sample_250.371.03
sample_20.27−0.05sample_260.260.90
sample_3−0.11−0.37sample_270.650.97
sample_40.37−0.17sample_28−0.95−0.54
sample_5−0.51−0.76sample_290.82−0.23
sample_60.020.04sample_30−0.48−0.59
sample_70.65−0.10sample_310.481.09
sample_8−0.03−0.54sample_320.840.30
sample_90.10−0.27sample_33−0.73−0.62
sample_100.560.13sample_34−0.86−0.70
sample_11−1.29−0.79sample_35−0.85−0.26
sample_12−0.91−0.57sample_360.520.16
sample_13−1.19−0.90sample_37−0.68−0.81
sample_140.030.34sample_380.610.55
sample_15−0.590.16sample_39−0.40−0.63
sample_160.480.10sample_40−1.03−0.60
sample_170.711.14sample_411.060.71
sample_180.230.69sample_421.33−0.02
sample_191.161.64sample_43−0.56−0.66
sample_200.100.01sample_440.110.18
sample_210.08−0.29sample_45−0.33−0.52
sample_22−0.240.41sample_46−0.05−0.50
sample_23−0.450.13sample_470.180.07
sample_24−0.090.44sample_48−0.340.44
Table 4. Correlation Analysis of the subjective evaluation of URS landscape elements.
APDETRLEsOthersBuildingsSkyGreenRoadsTraditional-Style
Buildings
Water
AP1
DE0.679 **1
TRLEs0.0950.306 *1
others−0.320 *−0.1230.0041
buildings−0.521 **−0.374 **−0.083−0.0481
sky0.1170.0820.033−0.275−0.1431
green0.575 **0.071−0.022−0.224−0.337 *−0.405 **1
roads−0.382 **−0.513 **−0.451 **−0.1850.234−0.09−0.1461
traditional-style buildings0.0030.399 **−0.025−0.071−0.357 *−0.159−0.264−0.191
water0.2450.412 **0.640 **0.085−0.1120.009−0.07−0.468 **0.0151
* p < 0.05, ** p < 0.01. Correlation coefficients (e.g., Pearson’s r) are reported. Significance levels are indicated by asterisks (*).
Table 5. Regression coefficient analysis table.
ModelUnstandardized
Coefficients
Standardized CoefficientstSig.Collinearity Statistics
BStd. ErrorBetaToleranceVIF
1(Constant)0.5810.221 2.6360.012
Others−1.8770.603−0.318−3.1100.0030.8931.119
Buildings−1.8360.556−0.347−3.3000.0020.8441.185
Green1.2380.3870.3423.1980.0030.8161.226
Roads−2.2870.753−0.309−3.0360.0040.9001.111
2(Constant)0.3150.210 1.4980.142
Buildings−0.8750.620−0.177−1.4120.1650.8431.186
Roads−2.1130.931−0.305−2.2710.0280.7321.367
Water4.1092.1800.2461.8850.0660.7741.291
Traditional-style buildings1.1930.5420.2742.2020.0330.8531.172
Table 6. Subjective evaluation correlation analysis.
APDEVA
AP10.506 **0.515 **
DE 10.222 **
VA 1
** The correlation is significant at the 0.01 level (two-tailed).
Table 7. VA, AP, and DE coefficients of landscape elements.
Landscape ElementsVAAPDEType
Buildings1.12−1.84−0.88
Sky000·
Green1.271.240+
Roads0.02−2.29−2.11-
Traditional-style buildings0.9301.19+
Water1.1404.11+
TRLEs1.5500·
Others−0.07−1.880
Note: “+” means positive visual landscape elements; “−” means negative visual landscape elements; and “·” means neutral visual landscape elements.
Disclaimer/Publisher’s Note: The statements, opinions and data contained in all publications are solely those of the individual author(s) and contributor(s) and not of MDPI and/or the editor(s). MDPI and/or the editor(s) disclaim responsibility for any injury to people or property resulting from any ideas, methods, instructions or products referred to in the content.