Abstract
Rural digitalization in Hungary from 2010 to 2024 is examined, focusing on infrastructure, digital skills, and sectoral uptake. Using secondary data, an interrupted time-series model determines national household internet access, and a regional panel includes post-2020 slope terms. Nationally, uptake continued and accelerated after 2020, while regional trajectories remained broadly parallel, indicating persistent yet narrowing territorial differences. Market indicators point to a capacity-heavy fixed network with county-level disparities, suggesting that affordability and competencies shape the remaining rural gaps. There is a need for place-based policies that jointly target last-mile infrastructure, affordability, and skills to convert access into practical use in rural economies.
1. Introduction
Digitalization is widely recognized as a driver of productivity, resilience, and social inclusion. However, adoption remains uneven across regions of Hungary. Rural areas often lag behind, not because of inadequate networks, but because access alone does not guarantee meaningful use. Factors such as affordability, limited skills, varying service quality, and local institutional capacity all influence adoption. To design effective place-based policies that convert infrastructure into tangible benefits for households, farms, and small businesses, it is essential to understand how these factors interact.
Digitalization is one of the most defining global processes of the 21st century, bringing sweeping changes to the economy, society, and institutional structures [1]. It encompasses the emergence of new technologies and a profound transformation in the flow of information, production systems, human relations, and public services. Although urban areas generally adapt to these changes more quickly and with greater capacity, due to their specific characteristics and constraints, rural areas show different dynamics in the digital transition [2].
The digital convergence of rural areas in Hungary is particularly important, as these areas simultaneously face aging populations, emigration, infrastructure deficiencies, and low levels of digital competence [3]. As such, digitalization offers an opportunity for economic and social renewal, contributing to employment diversification, service availability, and the reduction in social inequalities [4].
Digital technologies promise new levels of automation and are redefining labor in society. Intangible, non-rival goods are reshaping value creation and pricing mechanisms in contemporary capitalist economies [5]. These technologies are also altering social relations in production processes, ranging from emancipatory potential to new forms of “computer control” [6]. The widespread digitalization of organizations and their business models is one of the strongest trends in today’s global economy [7]. The push to digitize is driven by a strong belief that companies will achieve higher overall organizational performance and create competitive advantages essential for survival and growth. Countries across regions also recognize the societal benefits of digitalization.
This study examines the domestic situation and territorial specificities of rural digitalization, assesses the main challenges and opportunities, and proposes measures for promoting sustainable and inclusive digital development. This research highlights the territorial characteristics of Hungary’s digital infrastructure, the level of digital skills, the adaptive capacity of enterprises, and the effectiveness of both E.U. and domestic policy frameworks. Drawing on the literature, statistical analyses, and thematic maps, this study seeks to make a scientific contribution to reducing digital inequalities and placing Hungarian rural areas on a future-proof development path. As such, the research questions of interest are as follows:
RQ1. Did Hungary’s household internet use exhibit a level change around 2020. If so, how large was the magnitude of change?
RQ2. Do post-2020 growth rates differ across Hungarian regions after controlling for the common trend?
Regional differences are hypothesized to be influenced not only by infrastructural disparities but also by institutional capacity (e.g., local government digital initiatives), market access (e.g., broadband competition), and social capital (e.g., education level of the rural population).
RQ3. How do territorial patterns in infrastructure (bandwidth tiers) and market structure relate to observed regional uptake?
The mechanisms through which digitalization affects agricultural and rural communities are expected to include technology adoption rates, sectoral employment structures, and differences in policy implementation intensity.
RQ4. Which policy levers (i.e., skills, intermediaries, and smart village instruments) identified in the literature are most consistent with Hungary?
2. Literature Review
The E.U. has committed to supporting businesses and individuals through a framework that emphasizes people-centered approaches, sustainability, and the creation of a thriving digital future. The 2030 Digital Decade policy agenda establishes an annual cooperation cycle to achieve common objectives and targets [8], and it relies on systematic cooperation between the Commission and Member States to ensure effective coordination and progress toward shared goals [9].
The digitalization of rural areas can influence urban–rural inequalities in different ways. It plays a crucial role in reducing inequalities, especially in regions with higher disparities [2]. However, Hungarian digital policies are largely shaped by urban priorities, often neglecting the specific needs of rural communities, which hinders inclusive rural transformation [10]. Moreover, digital services remain difficult to access in rural areas [11], where the pace of technological development often outstrips the ability of local communities to adapt [10]. Digital presence substantially facilitates human capital accumulation in both rural and urban areas, and rising educational levels generally align with digitalization. However, the urban–rural human capital gap is widening as digital development advances, particularly affecting females, higher education graduates, and larger families [12]. In summary, while digitalization in rural areas can effectively reduce inequalities, it must be carefully implemented to avoid unintended negative outcomes.
One study identifies the main drivers and barriers to rural digitalization based on expert opinion [13]. The principal drivers include cost reduction potential and regulatory pressure to improve monitoring of production. The barriers are poor network coverage and distrust of technology. This study emphasizes that, although digitalization can positively affect rural sustainability, it also risks marginalizing actors who are unable to keep pace with rapid change [13]. Nonetheless, efficiency gains are anticipated across all dimensions of the bottom line: revenue generation (e.g., new customers, new sales, higher cross-selling rates, and lower churn), cost reduction (e.g., automated processes, straight-through processing, and shorter processing times), and improved risk management (e.g., accurate and timely data, fewer operational issues, and advanced risk modeling [14]. Digitalization also promotes rural tourism, particularly in low-density areas, as digital platforms expand accommodation supply and positively influence demand [15].
The benefits of digitalization extend to economic development and productivity growth [16]. Research has shown that its spread significantly contributes to economic growth, primarily through information and communication technology (ICT)) [17]. The widespread use of the internet and mobile phones enables faster, more cost-effective communication, fostering the emergence of new economic structures [18]. With Industry 4.0, the automation of production processes and systems based on data processing has become increasingly critical. Modern technologies, including artificial intelligence, big data, mobile platforms, and social media, significantly enhance both economic activity and business operations [19,20]. Digitalization also supports financial development by advancing banking systems and financial services [21]. However, rapid technological growth challenges legislation in Hungary, which often struggles to keep up with the pace of the digital revolution [22,23]. Nevertheless, the digitalization of manufacturing processes and expansion of automation not only increase productivity but also profoundly affect the labor market, as higher-level digital skills become increasingly essential [24,25].
The Digital Economy and Society Index (DESI) tracks four main dimensions of digital progress: connectivity, human capital, integration of digital technology, and digital public services. Hungary has consistently scored below the EU average, especially in human capital and digital skills, which reflects the rural–urban divide in access and adoption (Figure A1) [26]. The EU’s Digital Decade strategy frames these challenges in a long-term perspective, with 2030 targets for universal gigabit connectivity, full 5G rollout, improved digital skills, and greater SME adoption of digital technologies. These benchmarks serve as a reference point to assess Hungary’s relative progress within the EU [26]. In 2023, the proportion of urban households in Hungary with internet access increased by 1.58% compared with 2022. As a result, urban household internet access peaked at 96.39% in 2023. Notably, the share of urban households with internet access has steadily risen in recent years. [27].
One of the greatest challenges of digitalization is overcoming social inequality. The “digital divide” refers to unequal access to digital technologies among demographic groups in society [28,29]. These differences are rooted in cultural, geographic, and social factors. Furthermore, older generations are less capable of adapting to digital technologies, whereas younger generations come by the skills naturally [30,31]. Research on the relationship between digital development and urban–rural income gaps shows that some dimensions of digitalization reduce inequalities, while others can exacerbate them [2].
Notably, digitalization can create opportunities that reduce social disparities. For example, expanding digital access in education, healthcare, and financial services allows broader groups to benefit from these resources [32,33,34]. It can also stimulate social innovation, offering new opportunities for disadvantaged regions and populations [35]. However, technological progress does not always reach every segment of society equally, raising the risk of widening inequalities. Digital skills and ITC competencies are becoming increasingly valuable, especially in higher value-added jobs [36]. Similarly, the outlook for low-skilled workers is growing more precarious as demand for routine, manual labor declines [37]. Although new technologies open opportunities for large segments of society, the extent of these benefits depends heavily on citizens’ digital skills—an area that remains a particular challenge in Hungary [30].
3. Materials and Methods
This study began with a broad-scope search in the Web of Science (WoS) Core Collection to assess the scope and contours of the problem area. Using the topic query digital* AND “rural areas” (no country filter), I retrieved 3421 records (accessed in August 2025). This corpus was used to produce an indicative topic map of “digitalization”.
In Figure 1, several clusters are observed. First, the center of gravity, “rural areas,” is most strongly tied to “information,” “access,” “people,” and “health”. A healthcare cluster emerged (blue), which is densely linked to “telemedicine,” “digital health,” and “rural health.” An infrastructure cluster (yellow) also emerged, tied to “broadband,” internet access,” “infrastructure,” “rural broadband,” and “connectivity.” A governance and services (green) cluster emerged, linking “e-government,” “policy,” “impact,” and “access,” indicating a policy and e-service lens, with links to “inequality.” A development and smart technology (red) cluster emerged, tying “digitalization,” “digital economy,” “rural development,” and “smart cities.” It is interesting that “smart city” appears, even though it remains comparatively small. A socio-economic lens (purple/orange) cluster also emerged, highlighting “inequality,” “poverty,” “participation,” and “income gap”.
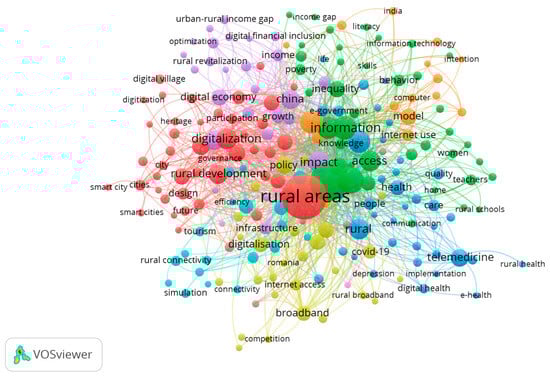
Figure 1.
Digitalization topical map. Source: Author’s work, based on Web of Science database output (2025).
Because the study focuses on digital transformation in rural Hungary, a more targeted WoS search was conducting using the following plain-language query: (Hungary AND (rural OR countryside OR villages OR “small settlements” OR “peripheral regions”)) AND (“digital transformation” OR “internet access” OR “digital literacy” OR “digital skills” OR “digital inclusion” OR “digital divide”). Filters were set for the timespan 2004–2025, focusing on articles, reviews, or early access papers, and the language was restricted to English. This refinement yielded 25 records. PRISMA screening then proceeded in two stages. First, titles and abstracts were reviewed for an explicit Hungarian focus or findings in a comparative frame. These required a clear rural scope (e.g., villages, small settlements, or peripheral regions) and substantive engagement with digital transformation (e.g., infrastructure, access, skills/inclusion, or service adoption). Urban-only studies were excluded, as were purely hardware or telecom engineering papers lacking territorial or socio-economic analysis and items not centered on Hungary. Afterward, ten studies met the inclusion criteria and were retained for synthesis (Figure 2).
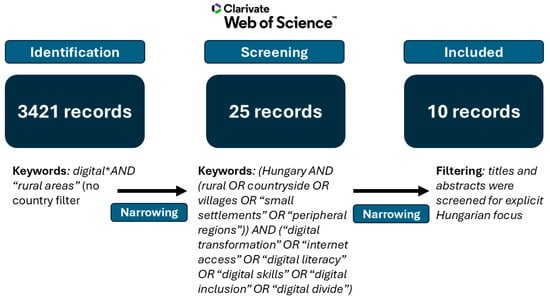
Figure 2.
PRISMA flow of the Hungary-focused rural digitalization literature (2004–2025). Source: Author’s work (2025).
To contextualize Hungarian specificities and triangulate findings, official statistical and regulatory sources were consulted. Secondary data were drawn from Statista, Eurostat (E.U. comparisons and regional indicators), the Hungarian Central Statistical Office (HCSO), and the National Media and Infocommunications Authority (NMIA). These sources are commonly used and offer trustworthy national and regional statistics. Their aggregation level, whether NUTS-2 or county, is suitable for examining territorial patterns. However, it does not fully capture all the variations between smaller villages and larger towns. Infrastructure coverage is detailed, but usage indicators are less specific.
Descriptive statistics were used to visualize the data in terms of national household internet penetration (Statista, 2010–2024), and percentages were converted to proportions at a logit scale to respect the [0, 1] bounds. The choice of the logit transformation follows from the bounded nature of the dependent variable (internet use proportions between 0 and 1), ensuring predictions remain within the admissible range and stabilizing variance compared to linear probability approaches. Alternative nonlinear specifications (e.g., probit or complementary log–log) were considered, but the logit offered more interpretable odds-ratio scaling for policy implications.
To test for a pandemic-era structural break, an interrupted time-series (ITS) model was applied with an ordinary least squares protocol using JASP software v. 0.95.0.0:
where post2020_t = 1 for t ≥ 2020 and 0 otherwise (level change in 2020), and time_after_t = (Year_t − 2020) × post2020_t (change in slope from 2020 onward). Unstandardized coefficients with 95% confidence intervals are reported. Model assumptions were checked with standardized residual Q–Q plots and residuals-versus-fitted plots, and no material violations were found.
A panel of Hungarian regions was then compiled using the Eurostat dataset, which reports the annual share of people using the internet by NUTS-2 county/region (2006–2024, with denser coverage from 2018). Data were reshaped to long format (Region × Year), converted from percentages to proportions, and mapped to the logit scale to respect the [0, 1] bounds.
We estimated an ANCOVA (Analysis of covariance)-style ITS with region fixed effects and region-specific slopes in JASP (ordinary least squares; 95% confidence intervals). The factor, Region (reference = Budapest), was included, along with interactions, Region_Year and Region_time_after, to allow both pre- and post-2020 slope changes, which differ by region. Model assumptions were verified using standardized residual Q–Q plots and residuals-versus-predicted plots, with no material violations detected. The equation is specified as:
where p_rt is the proportion of people using the internet in region r in year t (0–1 scale), and logit_p_rt is the log-odds of p_rt, where logit(p) = ln(p/(1 − p)) keeps predictions within [0–1]. t refers to the calendar year, r is the region (reference category), Year_t is the numeric time trend (increase in one per year), and post2020_t indicates the break, which equals one o if Year_t ≥ 2020; otherwise it is zero. An immediate level change for 2020 was tested using time_after_t, which indicates the years since 2020. With this, (Year_t− 2020) × * post2020_t was used to test slope changes from 2020 onward.
We selected 2020 as the structural breakpoint because it coincided with both the COVID-19 pandemic and multiple EU/Hungarian digital policy initiatives that substantially altered demand and supply-side dynamics. While other candidate shocks (e.g., 2016 broadband expansion, 2022 EU Digital Decade targets) may also matter, our focus was on testing the most plausible and visible discontinuity. In terms of robustness, we conducted model diagnostics and found no major violations of normality or homoscedasticity. However, the relatively short time series suggests that results should be viewed as descriptive rather than causal. We cannot fully rule out endogeneity, such as reverse causality between adoption and infrastructure investments. Therefore, the findings are best viewed as indicative associations. Future research could use instrumental variables or difference-in-differences designs to tackle these issues more formally.
β0 is the intercept, reflecting baseline log-odds for the reference region when Year_t = 0. Hence, the value is substantively important unless the year is centered. β1 (Year) indicates the baseline trend (i.e., common yearly change before 2020 for the reference region). β2 (post2020) indicates the level change at the 2020 break (i.e., up/down shift vs. the pre-2020 trend). β3 (time_after) reflects the common slope change after 2020 (i.e., acceleration/deceleration for the reference region). Region(r) designates the region fixed effect (i.e., constant level difference for region r vs. the reference region). (Region*Year)_r indicates the adjustment to the pre-2020 slope in region r vs. the reference. (Region*time_after)_r is the adjustment to the post-2020 slope change in region r vs. the reference. Lastly, ε_rt is the residual error term for region r in year t, where the mean is zero.
For both linear regression calculations, JASP 0.95 was the primary software used, with Statista (statistics/377743) for household internet access) and Eurostat table [isoc_r_iuse_i__custom_16862220] for individuals who used the internet by region in Hungary. Both datasets were downloaded in July 2025 and analyzed in August 2025.
4. Results
The results are organized in three parts. First, the narrowed PRISMA findings are presented, followed by descriptive patterns of household internet access and related indicators to provide empirical context. National interrupted time-series estimates are then presented, followed by regional panel results tracing within-country trajectories. Finally, remaining heterogeneity items are examined using capacity mix and provider structure market indicators.
4.1. Narrowed PRISMA Results
The following paragraph summarizes the ten articles. Hungary’s shift toward inclusive digitalization began with eHungary 2.0, which paired access with local intermediaries of tele-centers and e-counselors to reach small settlements [38]. Building on this early wave, recent strategy has reframed “smart technology” as a territorial rather than an exclusively urban agenda. Kaiser’s Smart Village Indicator introduced a transfer–empowerment–downscaling logic to adapt smart-city know-how to rural contexts and documented national instruments (e.g., DSP 1.0/2.0 and network of DSP Points) to support digital skills and e-administration in small settlements [39,40]. Adoption, however, depends on capabilities and perceived value. A Hungarian micro-regional study found that small and medium-sized enterprise (SME) uptake aligns with e-skills and perceived usefulness, whereas farms continue to lag without targeted support. The literature also traced national and E.U. trends, such as e-readiness indices, SME internet usage, and persistent peripheral gaps despite EU-backed infrastructure. They generally argue that higher education and targeted projects (e.g., NODES e-learning) are necessary to move from access to effective use [41,42].
In practice, farmers rely heavily on advisers and low-friction formats, such as video and social media, making trusted intermediaries critical even when resources are available [43]. On the labor and organizational side of agriculture, a systematic integrative review spanning 2013–2023 mapped how human-resource practices shape technology adoption, from precision tools to platform-based farm management. The article’s Hungarian-anchored authors emphasized training, incentives, and change management as central to realizing Agriculture 4.0 in rural settings, a vital complement to connectivity and hardware [44]. Spatially, digital ties add layers to, rather than replace, proximate service networks, meaning peripheral hubs still matter [45].
Kaiser’s (2022) indicator system clarifies how to measure empowerment and knowledge transfer when adapting smart-city toolkits to village contexts, and documents the governance structures that support scaling [39]. Another study went further by applying a quality function deployment–based planning tool that intakes residents’ opinions, cascading needs into technical characteristics, and prioritizes projects. This method helps small municipalities sequence broadband, skills, and e-service investments under real-world constraints [46]. A sectoral perspective also highlights opportunities beyond agriculture. Hence, a bibliometric mapping of digitalization and sustainability in rural destinations positioned Hungarian scholars within an emerging network where datafication, platforms, and smart sensing can support greener, higher-quality rural tourism. However, local capabilities and governance must be aligned [47].
Table 1 shows that an interrupted time-series model accurately captured the household internet penetration data (R = 0.998; R2 = 0.996; adjusted R2 = 0.995; RMSE = 0.056; ANOVA F = 930.8, p < 0.001). The linear trend before 2020 on the logit scale was both positive and statistically significant (β_Year = 0.162, SE = 0.006, 95% CI [0.149, 0.176], p < 0.001), indicating a consistent year-on-year increase in diffusion. The immediate level change observed in 2020 was not statistically significant (β_post2020 = −0.003, 95% CI [−0.129, 0.123], p = 0.969), showing no distinct “jump” at the breakpoint. In contrast, the slope significantly increased after 2020 (β_time_after = 0.061, SE = 0.019, 95% CI [0.020, 0.102], p = 0.007), suggesting a faster growth rate in the years that followed.

Table 1.
Linear regression of households with internet access in Hungary between 2010 and 2024. Source: Author’s summary of Statista [27].
To clarify magnitudes, the logit coefficients correspond to different percentage-point increases depending on the current penetration level (with growth diminishing as saturation is approached). Before 2020, β = 0.162 translates to roughly +3.4% annually at about 70% penetration, but only +1.5% per year at about 90%. After 2020, the combined slope (0.162 + 0.061 = 0.223) indicates approximately +4.7% per year at ~70% penetration and +2.0% per year at ~90%. When expressed as odds ratios, the yearly change is represented by exp(0.162) ≈ 1.176 (+17.6% annually) before 2020 and exp(0.223) ≈ 1.25 (+25% annually) afterward. Taken together, these results suggest that 2020 did not produce a one-time shock but instead marked the beginning of a sustained acceleration in the diffusion process. This acceleration aligns with increased perceived usefulness via remote work, remote schooling, increased online services, supply-side improvements, and late adopters. Although it still indicates ceiling effects, as expected at high coverage levels.
Model diagnostics, including standardized residual Q–Q plots and residuals-versus-predicted plots (Figure 3), reveal no significant issues with normality or heteroscedasticity. This is common with short annual series, where a very high R2 reflects a strong trend component. Consequently, these results should be interpreted as descriptive evidence of an accelerated post-2020 trajectory, not as causal proof of any single intervention.
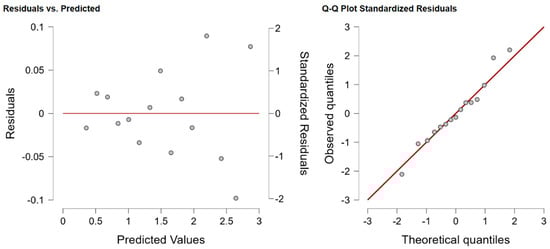
Figure 3.
Share of households with internet access in Hungary from 2010 to 2024. Source: Author’s summary of Statista [27], 2025. Note: Red line represents zero residuals—the ideal case where predicted and observed values are identical.
Table 2 shows that the regional time-series model tracks the data very well (R2 = 0.985; adj. R2 = 0.981; RMSE = 0.112; F(27, 89) = 221.9, p < 0.001). In simple terms, the model captures most of the yearly and regional differences in internet use. Before 2020, the series was already on an upward trajectory. The Year coefficient is positive (b = 0.196, SE = 0.074, 95% CI [0.049, 0.342], p = 0.009). On the logit scale, this translates to about a 22% increase in the odds of use each year (exp(0.196) ≈ 1.22). In 2020, there was an additional upward change (post2020 b = 0.114, SE = 0.043, 95% CI [0.029, 0.200], p = 0.009), consistent with the pandemic encouraging wider adoption. However, there is no indication of a shared acceleration in the trend after 2020; the average change in slope is small and imprecisely estimated (time_after b = 0.033, SE = 0.096, 95% CI [–0.158, 0.223], p = 0.734). Allowing regions to have their own slopes does not change the findings. None of the Region × Year terms differ significantly from Budapest at the 5% level, and the Region × time_after terms are also not significant. In other words, after accounting for the overall upward trend and the shared jump in 2020, post-2020 trajectories look quite similar across regions (Coefficient values can be seen in Table A1). Any visual differences are minor compared to the sampling noise in this short annual panel. These broadly parallel trajectories suggest that deeper structural factors, rather than infrastructure availability alone, shape regional digitalization patterns. Regions with stronger local government initiatives and digital support programs were able to translate access into uptake more effectively. By contrast, peripheral areas with weaker institutional capacity and lower levels of human capital experienced slower conversion of infrastructure into actual use. Market access, including the degree of competition among broadband providers, also played a role in mediating these outcomes. These factors could help explain why some regions advance more quickly in adopting digital technologies, even when overall trends look similar.
Table 2.
Linear regression of individuals who used the internet by regions, between 2006 and 2024. Source: Author’s summary of Eurostat [48].
Model diagnostics are straightforward. The standardized residuals align with the reference line in the Q–Q plot, and the residuals-versus-predicted panel shows no fan shape. Thus, normality and constant variance appear acceptable. Overall, the results tell a clear story: steady growth before 2020, a definite increase in 2020, and ongoing growth afterward without strong evidence of any one region diverging (Figure 4).
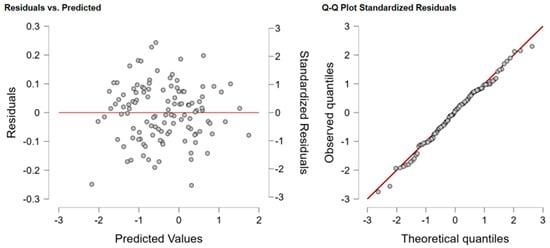
Figure 4.
Share of households with internet access in Hungary from 2010 to 2024. Source: Author’s summary of Eurostat [48]. Note: Red line represents zero residuals—the ideal case where predicted and observed values are identical.
Figure 5 presents the total number of internet subscriptions in Hungary in 2016 and 2023, broken down by counties. The visualization clearly shows the spatial inequalities of digital infrastructure and their trend-like development. Spatial inequalities have not disappeared over the last decade, but subscription numbers have increased. As early as the 2010s, significant differences existed between settlement types: while nearly 70% of households in Budapest had internet access, the figure barely exceeded 50% in villages [49]. In the following years, driven by national and E.U.-level development policies and the expansion of telecommunications infrastructure, a gradual increase occurred in all three settlement types. The steepest growth was observed between 2010 and 2016, particularly in villages, where internet penetration approached that of cities at a striking pace. Since 2016, growth dynamics have slowed, and after 2020 there are signs of saturation: internet access has surpassed 90% in municipalities, while in Budapest it has plateaued at around 95% [50]. Trends suggest that territorial differences in access to digital infrastructure have diminished. However, qualitative differences may still be hidden in the data, such as bandwidth, network reliability, and service quality. Enhancing internet access remains a critical prerequisite for the success of rural digitalization [39], particularly in education [51], teleworking, e-health, and the digital presence of local businesses [50]. Figure 5 provides evidence for RQ2, showing how regional disparities in internet access remain visible across counties. While the overall trend is upward, the pace of adoption varies, indicating that infrastructural availability does not automatically ensure uniform uptake. These county-level disparities highlight that rural digitalization gaps are not only technological but also institutional and social in nature. For example, wealthier counties with stronger local government initiatives and higher education levels may be better positioned to utilize broadband investments, while peripheral and less affluent regions face persistent challenges in affordability, digital literacy, and effective policy implementation.
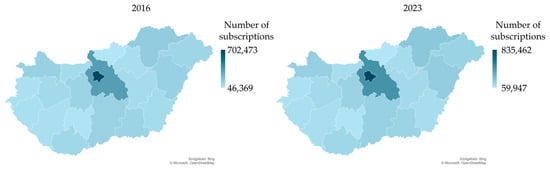
Figure 5.
Share from total of internet subscriptions by county in Hungary, 2023. Source: Author’s summary of HCSO [50].
Figure 6 shows the distribution of fixed internet subscriptions in Hungary in 2023 by nominal bandwidth. The largest share, 38%, consists of subscriptions at 1 Gbit/s and above, reflecting significant modernization of network infrastructure. The second-largest category is subscriptions between 100 and 500 Mbit/s (26%), followed by medium-bandwidth packages of 30–100 Mbit/s (12%). Subscriptions between 500 Mbit/s and 1 Gbit/s account for 17%, while those between 10 and 30 Mbit/s represent only 5%, and subscriptions below 10 Mbit/s make up just 2%. These data indicate that high-bandwidth subscriptions dominate the Hungarian fixed-line internet market. As such, medium- and low-speed connections remain present, particularly in rural areas, where infrastructural inequalities persist [49]. Information and communication technologies are critical for improving competitiveness, but domestic enterprises have shown little change in this area. In 2023, 96% of companies had internet access, two-thirds maintained their own website, and nearly one-third of those websites supported online ordering [49]. It also relates to RQ3 by highlighting differences in digital skills across regions. The variation suggests that human capital factors—such as education level and training opportunities—play a crucial role in shaping digital adoption, beyond mere connectivity.
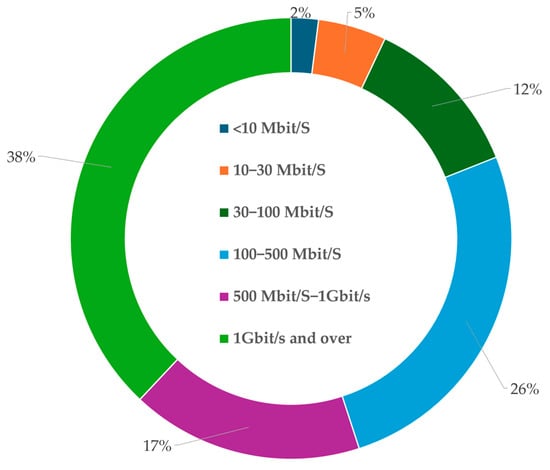
Figure 6.
Distribution of fixed internet subscriptions by nominal bandwidth, 2023. Source: Author’s summary of [49].
In the second quarter of 2024, Magyar Telekom held the largest share of the Hungarian broadband market by subscription distribution, especially in the non-residential segment. Vodafone ranked second, with 20% of the residential market and 23% of the non-residential market. By 2024, nearly every Hungarian household had internet access (Figure 7). According to the Central Statistical Office, in 2023, more than 90% of internet-connected households used wired broadband, while 87% also had mobile broadband access. In the third quarter of 2024, download traffic through wired broadband exceeded 1.97 thousand petabytes. In 2024, Hungary had approximately 8.5 million internet users, a number projected to grow to a peak of 9.3 million by 2029. Regarding demographics, in 2022, the highest usage rate was observed among individuals aged 26–40, at 99%. In contrast, 67% of Hungarians between 66 and 70 years of age were internet users [52]. Figure 5, along with Figure 6 and Figure 7, help with interpreting RQ2 and RQ3. Even when they have a similar infrastructure, the differences in social, economic and institutional terms anyway ensure that things emerge differently. Counties with better access to education-related amenities and local government programs use up their infrastructure more efficiently than do counties worse off.
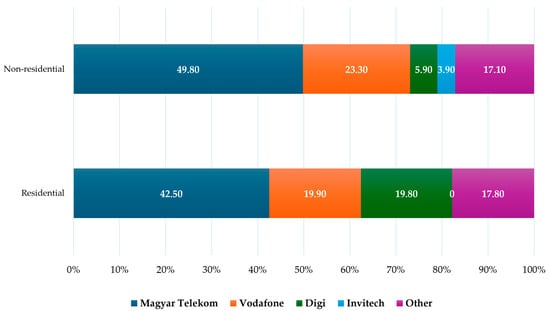
Figure 7.
Market share of service providers based on fixed-line broadband internet subscriptions in Hungary as of 2nd quarter, 2024. Source: Author’s summary of Statista [52].
Hungary demonstrates notable strengths in connectivity, infrastructure development, and the adoption of cloud services and data analytics. VHCNs cover 84.1% of the country, above the EU average of 78.8%. Fiber-to-the-home (FTTP) coverage is also higher, at 76.2%, compared with the E.U. average of 64%. The use of cloud services increased to 37.1%, up from 20.6% the previous year, approaching the E.U. average of 38.9%. Enterprise adoption of data analytics is particularly strong, at 53.2%, well above the E.U. average of 33.2% (Figure 8) [53].
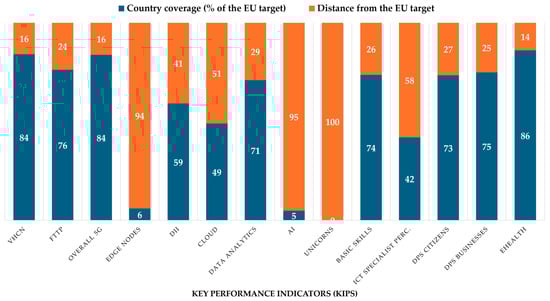
Figure 8.
Observed key performance indicators as percentage of the E.U. target. Source: Author’s summary of European Commission [9].
The Hungarian roadmap shows that the country intends to make limited efforts to achieve the goals and indicators of the Digital Decade. It has set targets for 12 of 14 key performance indicators, with half aligning with or exceeding E.U. 2030 targets and the other half falling below them. Hungary plans to allocate €1.7 billion in budgetary resources, in addition to private investments, equivalent to 0.9% of its gross domestic product, to support digital transformation [53]. Household internet access has steadily increased between 2010 and 2023. Growth was especially strong in the early years: between 2010 and 2016, access rose from 58% to 79%. After 2016, the pace slowed but still increased, reaching 91% in 2021. In recent years, growth has leveled off, with coverage at 93% by 2023, suggesting near saturation and limited room for further expansion. These data demonstrate a successful digital expansion, particularly over the past decade. In 2024, almost 95% of the Hungarian population used the internet, compared to just 67% in 2010 [54]. In 2023, Hungarian households spent approximately 13,000 forints on mobile phone and mobile internet bills. Fixed broadband internet represented the second-largest expenditure on household communication services [55].
The data also show the trajectory of Hungary’s digitalization in terms of e-commerce growth. The sharpest increase occurred between 2020 and 2021, when the COVID-19 pandemic significantly boosted online shopping, especially in consumer electronics, beauty, and furniture. Although some stabilization was observed in 2022–2023, the overall growth trend has continued. The sustained expansion projected for 2024 confirms that digital commerce has become a dominant part of consumer habits, reflecting a long-term shift toward online retail and growing reliance on digital platforms (Figure A2) [56].
The spread of online banking in Hungary also increased steadily between 2014 and 2024. The most notable growth occurred between 2019 and 2022, fueled by technological advances and the COVID-19 pandemic. Although the growth rate slowed in 2023, further expansion projected for 2024 indicates that digital banking has become commonplace and reflects the broader digital transformation of financial services in Hungary [57]. Traditional payment methods, such as bank transfers and cash on delivery, remain dominant in Hungarian online stores. Online bank card payments are also widely used, underscoring the importance of digital transactions. Although modern payment solutions such as Google Wallet, Apple Pay, and PayPal are available, their prevalence remains limited compared to traditional methods. The relatively high share of online stores offering payment upon receipt or at parcel points suggests that many consumers prefer hybrid online–offline solutions. Overall, the trends reflect a clear shift toward digitalization, while traditional payment habits remain deeply embedded [58].
4.2. Relationship Between Rural Development and Agriculture in Hungary, and the Status of Agricultural Digitalization
The literature explores multiple dimensions of rural development. Studies have examined the spatial concentration and role of the ICT sector in economic growth, comparing metropolitan and rural areas [59]. Rural areas perform numerous functions, such as providing jobs and essential services, making it crucial to design and implement “smart settlement” strategies [60,61]. The articles highlighted rural depopulation, the importance of sustainable development, and the factors influencing the economic and social situation of individual rural areas [62]. They also investigated the effects of urbanization on the rural–settlement–urban scale and found that average ciliate size decreases with urbanization [63]. Additional research identified factors shaping the entrepreneurial ecosystem of rural areas, with particular attention paid to poverty and cultural values [64].
Agriculture and rural development remain closely linked in Hungary [30,65,66,67]. Rural development support plays a decisive role in agriculture: in 2020, 18% of farms (~42,000) received such support. These farms managed 70% of the country’s agricultural land and maintained 72% of the total livestock. Farmers engaged in grazing and mixed or arable crop production received the largest share of rural development support by farm type. Participation in the Rural Development Program was highest among farmers under 40 and those with higher education [68]. Most payments supported fixed asset investments. The agricultural census, conducted every 10 years and covering all settlements and farms above a defined threshold, provides comprehensive agricultural data. The 2020 census data were compared with participation in the Rural Development Program, using support data from the Integrated Administration and Control System, operated by the Hungarian State Treasury [68].
Between 2018 and 2020, a total of HUF 508 billion in rural development support was distributed under these measures. Their importance is evident—in 2020 alone, payments equaled 6.7% of total agricultural output and 17% of gross added value. Rural Development Program funding accounted for 26% of all agricultural and rural development payments during this period, broken down as follows:
- 200 billion HUF in general support,
- 155 billion HUF for agri-environment and climate measures,
- 33 billion HUF for farmers in Natura 2000 areas,
- 29 billion HUF for organic farming
- 25 billion HUF for animal welfare payments [68].
The map shows the counties of Hungary (Figure 9), where the proportion of farms receiving rural development support is represented in different shades of color. Darker colors indicate higher support rates, while lighter colors indicate lower rates. According to HCSO data, Vas County had the highest proportion of supported farms, confirmed by the dark shade clearly visible on the map. In contrast, Budapest and its surroundings appear in a light shade, indicating that far fewer farms participated in rural development programs there. In this area, the tertiary sector and industry are the dominant factors. High support rates are also visible in Hajdú-Bihar, Borsod-Abaúj-Zemplén, and Szabolcs-Szatmár-Bereg Counties, suggesting that these regions are particularly important for agriculture and rural development. The distribution of support reflects the regional centers of gravity in agriculture. The dominance of eastern and western border regions may also indicate that less urbanized areas depend more on agricultural development funds, while central, more urbanized regions—especially Budapest—participate less in such programs [68].
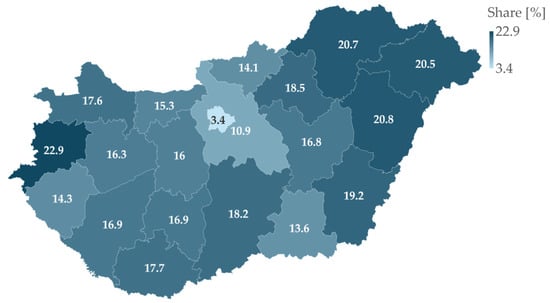
Figure 9.
Proportion of farms receiving rural development support by county, 2020. Source: Author’s summary of HCSO [68].
Digitalization in Hungarian agriculture remains relatively limited. Although most farms have internet access, the use of digital tools, particularly precision agriculture technologies, is concentrated among larger, arable farms. The most common digital solutions include satellite positioning and yield mapping, but these are used primarily on farms that can generate returns on investment through economies of scale [69]. Many smaller farms do not yet use modern digital systems such as online consulting, digital accounting, or e-administration. This gap is partly due to farmers’ lack of technological preparedness and partly to infrastructural challenges, including lower levels of digital coverage in rural areas. There are also significant generational and educational differences: younger, more educated farmers are typically more open to adopting new technologies, while older and less educated farmers are more reluctant [30,66,69]. A successful digital transition will require targeted infrastructure investments, improved digital competencies among farmers, and stronger financial access to technologies.
5. Discussion
In Hungary, the rural–urban digital divide remains pronounced, particularly in peripheral agricultural regions. Although broadband coverage is relatively high, connectivity in remote villages still lags behind, and many small settlements struggle with last-mile infrastructure. Regarding digital skills, Hungarian population had at least basic digital skills, which is slightly above the EU average. However, the rural population tends to fall behind the national average due to lower education levels and less access to training. On the business side, while Hungary holds good positions in digital infrastructure, the actual uptake of advanced digital technologies by SMEs remains limited. This is aligned with the findings in the 2025 Digital Decade Country Report, which notes that despite solid infrastructure, Hungary still lags in digitalization of businesses When comparing to other Central and Eastern European (CEE) countries, Hungary exhibits similar patterns of digital lag, though variation exists: some CEE countries have achieved faster adoption of digital technologies in rural areas [70]. A larger European context helps to interpret growing similarities or paradoxes, by which Hungary characterizes her rural digitization pattern. For example, in Poland, marked digital disparities have been observed between municipalities. In the older and more radially distant parts of Poland, bloggers are lagging behind [71]. Meanwhile, research into Czech agricultural areas highlights that institutional capacity and technological infrastructure converge as a function of the models through which digital technologies are unevenly diffusing in rural communities [72]. Furthermore, a study conducted among rural youth in Poland also shows substantial digital disparities between urban and rural adolescents with education and access as key influencers [73]. Finally, rural women leaders in the Czech Republic view the lack of quality infrastructure and digital skills as significant barriers to their full participation in the digital economy [74]. In comparison, Hungary appears to have better infrastructure coverage. However, it has difficulties turning that into effective use and skill development. These comparisons indicate that policy should prioritize enabling adoption rather than solely building infrastructure, as well as strengthening local support institutions.
Beyond the similar regional trends, we need to understand the results in light of deeper structural differences. Institutional capacity, like the availability of municipal digital programs, market access shown in the level of broadband competition, and socio-economic factors such as education and income levels, all affect how well regions can turn infrastructure into actual use. Therefore, the generally similar paths seen in the data may hide significant inequalities in the underlying factors that drive rural digitalization in Hungary.
The narrowed PRISMA highlights three recurring gaps related to the expanse of Hungarian digitalization: reliance on cross-sectional designs, limited treatment of territorial dependence, and fragmented operationalization of digital inclusion. This analysis extends these findings by applying an interrupted time-series on national household internet access (2010–2024) and a regional panel with post-2020 slope terms. The findings show continued, and post—2020 accelerated—uptake nationally, strong overall fit across regions, and a capacity-heavy fixed network alongside county-level disparities. Together, these patterns suggest that affordability and skills, rather than availability, now shape the remaining rural gaps, in line with the review’s emphasis on complementary, place-based instruments.
The study successfully addressed the research questions. For RQ1, Hungary’s infrastructure advanced substantially, as VHCNs now cover about 84.1% of premises and FTTP about 76.2%, both above the E.U. average. Subscriptions at ≥1 Gbps already account for ~38% of fixed connections, yet lower tiers remain visible in rural counties. On digital literacy, progress is evident but uneven (DESI 2022: 49% with at least basic skills; 2023 update: 58.9%), and the share of ICT professionals still lags the E.U. average, making skills a binding constraint. For RQ2, the national interrupted time-series found no immediate level jump in 2020 (β_post2020 = −0.003, p = 0.959), but the post-2020 slope accelerated significantly (β_time_after = 0.061, p = 0.007), raising annual growth in the odds of household internet use from about +17.6% pre-2020 to about +25% afterward. The regional panel suggests a small positive step in 2020 (b_post2020 = 0.114, p = 0.009) with broadly parallel post-2020 trajectories across regions (non-significant interactions). For RQ3, territorial patterns reveal persistent county-level inequalities despite national near saturation: high-bandwidth offers dominate, but medium/low tiers and service quality gaps still characterize rural areas. Market structure is Telekom-led, with Vodafone second, indicating that uptake is increasingly shaped by affordability, service quality, and skills rather than basic availability. For RQ4, the most consistent levers with Hungary’s evidence base are bundled, place-based interventions: extending SZIP/VHCN last-mile access, mobilizing DSP points and smart village intermediaries, and targeted skills programs for households, farms, and SMEs (e.g., Digital Agricultural Academy and European Digital Innovation Hubs (EDIHs)). These align with the PRISMA findings, which emphasize the importance of translating access into practical use. It is important to note that the models used here have certain limitations. The ITS and panel ANCOVA approaches work well for showing changes over time and across regions. However, the short annual series and reliance on secondary data mean that results should be seen as descriptive evidence, not proof of cause and effect. Potential endogeneity cannot be completely ruled out; for instance, there may be reverse causality between digital adoption and infrastructure investment. Although diagnostic checks did not show serious issues, future work could use different methods.
The national time-series confirms sustained growth in household internet access from 2010 to 2024, with acceleration after 2020 rather than a one-time shock. The regional panel shows broadly parallel upward paths, consistent with persistent but narrowing territorial differences. Market data indicate a capacity-heavy fixed network, dominated by ≥1 Gbps and 100–500 Mbps tiers, coexisting with county-level variation. This implies that local quality, affordability, and skills increasingly mediate uptake. These findings support continued place-based measures: last-mile upgrades (SZIP), digital support points, smart village tools, farm- and SME-focused skills, HRM programs to translate access into active use. The most vulnerable groups in Hungary’s rural digitalization are small-scale farmers, elderly residents, and low-educated rural youth. Small farmers face barriers in adopting digital tools due to high entry costs and limited advisory services [30,66], while elderly populations often lack the digital literacy to benefit from online services. Rural youth with weaker educational backgrounds are also at risk of exclusion, especially where schools have limited ICT resources. These groups are not only disadvantaged in digitalization but have also been identified by the authors’ previous studies on energy poverty as the most vulnerable segments of the rural population [75]. This consistency across different policy domains suggests that targeted interventions for these groups are particularly urgent. Among policy instruments, targeted subsidies for farm digital equipment, training programs tailored for elderly and disadvantaged groups, and pilot “digital village” initiatives stand out as having the most significant marginal impact. These tools address access and active usage, thereby directly reducing the rural digital divide.
The findings should be understood with the data structure in mind. Most indicators are available at the regional or county level. This makes them better for looking at broad patterns and trends. While infrastructure coverage is well documented, usage indicators lack detail. This makes it difficult to clearly distinguish between availability and actual use. These factors shape the scope of this analysis but do not lessen the strength of the results. Instead, they highlight promising paths for future research at the micro level, which could add to our broader perspective.
The analysis makes clear that considering local needs is critical for successful rural digitalization. Policymakers must place greater emphasis on serving community needs. Within the E.U., the digitalization of tourism and agriculture plays a central role in rural economic development. Supporting the digitalization of local businesses and narrowing the digital divide are essential elements for successful rural development.
The development of rural digitalization requires a comprehensive, multidimensional strategy that addresses infrastructure, competencies, the entrepreneurial ecosystem, and social integration in a coordinated way. for example, further expansion of broadband and high-speed internet is essential to infrastructure development, especially in underdeveloped regions. Additionally, SZIP support should be continued and expanded to ensure the availability of next-generation networks in rural areas. Intelligent technological infrastructures (e.g., smart street lighting and smart settlement solutions) should also be developed to improve quality of life and increase the attractiveness of rural areas. Although broadband access is strong nationwide, coverage gaps remain in rural regions. The proportion of next-generation networks (e.g., optical) is lower in these areas, creating disadvantages in teleworking, online education, and e-services.
Broader digital competency programs should be introduced, especially targeting young people and older populations, with initiatives such as the Digital Agricultural Academy serving as models. Educational institutions, particularly in disadvantaged areas, should be equipped with digital tools and infrastructure. Tailored training programs should be designed to strengthen the digital skills of rural businesses and farmers. Rural youth lag behind their urban counterparts in digital skills, limiting their opportunities in both the labor market and education.
Entrepreneurial and economic support schemes should be expanded to accelerate the digital transformation of rural SMEs, including programs such as DigiKKV, the Modern Enterprises Program, and EDIH. Incentives should be created to encourage the wider adoption of precision agriculture technologies, with financial grants and preferential loans helping to lower barriers.
Community-based social integration programs should implement digital projects that reflect local needs and actively involve local residents. The smart village concept and the Digital Village Program should be promoted more widely, with development carried out in cooperation with local communities.
Notably, areas for improvement persist. For example, artificial intelligence adoption among businesses remains low at only 3.7%, far below the E.U. average of 8%, which requires significant improvement. In 2023, 58.9% of Hungary’s population had at least basic digital skills, slightly above the E.U. average (55.6%). However, ICT professionals account for only 4.2% of employment, compared to the E.U. average of 4.8%. The growth rate is also lagging, at 2.4% annually compared to 4.3% in the E.U., highlighting a gap with respect to the 2030 targets [53].
The integrated implementation of these measures could make a major contribution to sustainable rural development, reducing social and economic inequalities and improving both the quality of life and competitiveness in rural communities. Persistent challenges include inadequate infrastructure, limited financial resources, and the technological resistance of older generations. Social isolation and emigration continue to deepen the digital divide. While digitalization is not a cure-all, it plays a critical role in enhancing quality of life in rural areas and strengthening population retention. Achieving this requires coordinated policy measures, infrastructure investments, and targeted education programs.
6. Conclusions
This research demonstrates that rural digitalization cannot be treated solely as a technological issue but must be addressed as a complex social and economic challenge requiring a systemic, integrated approach. Digital infrastructure, digital skills development, and targeted enterprise support form the cornerstones of effective rural policy. The findings show that significant territorial differences persist in internet access, digital competencies, and technology use in Hungary. Smaller farms, older generations, and individuals with lower education remain particularly disadvantaged, limiting their access to digital services, constraining competitiveness, and weakening social cohesion. Domestic and international examples underscore that community-led, needs-based developments can be most effective, particularly when aimed at retaining young people, countering depopulation, and stimulating economic activity. The study emphasizes that inclusive and territorially sensitive strategies (e.g., expanding NGA networks, supporting SME digital transitions, and promoting digital literacy) are vital to narrowing the digital divide. Rural digitalization in Hungary strengthened significantly between 2010 and 2024, with post-2020 growth accelerating rather than reflecting a single-step increase. A capacity-heavy fixed network now coexists with county-level disparities, showing that affordability and skills—rather than physical coverage—are the key constraints. Place-based policies that combine last-mile upgrades (e.g., SZIP) with digital support points, smart village instruments, and targeted skills and HRM programs for farms and SMEs are likely to deliver the greatest marginal gains. While the designs used here are descriptive, they provide an actionable baseline for future causal evaluations and spatial diagnostics.
This study is characterized by several original features. First, it represents one of the few attempts to comprehensively analyze digitalization in rural areas in Hungary, with a special emphasis on spatial (territorial) disproportions and sectoral (agricultural) dimensions. Through combining of several secondary data sources, the analysis presents somewhat subtler clues than most previous studies, especially when it comes to rural–urban differentials.
Second, the formulated and answered research questions of this thesis contribute to its literature background by examining the applicability of international digitalization indicators in the rural Hungarian context. This comparative part is also an original feature and contributes to the broader context of European digitalization trends that Hungary falls into.
Further research should investigate the long-term impacts of domestic digital pilot programs, such as smart village models, and their socio-economic effects across different regions.
Author Contributions
Conceptualization, D.F. and D.F.-H.; methodology, D.F.; software, D.F.; validation, D.F. and D.F.-H.; formal analysis, D.F.-H.; investigation, D.F. resources, D.F.; data curation, D.F.; writing—original draft preparation, D.F. and D.F.-H.; writing—review and editing, D.F. and D.F.-H.; visualization, D.F.; supervision, D.F.; project administration, D.F.; funding acquisition, D.F. and D.F.-H. All authors have read and agreed to the published version of the manuscript.
Funding
This research received no external funding.
Data Availability Statement
The raw data supporting the conclusions of this article will be made available by the authors on request.
Acknowledgments
This research was funded by the EKÖP-24-4-II-DE-54 University Research Scholarship program of the Ministry for Culture and Innovation from the source of the National Research, Development and Innovation Fund.
Conflicts of Interest
Author Dorina Fróna-Hadas was employed by the company MOL Group. The remaining author declares that the research was conducted in the absence of any commercial or financial relationships that could be construed as a potential conflict of interest.
Appendix A
Table A1.
(Linear regression of individuals who used the internet by regions, between 2006 and 2024) Coefficients values.
Table A1.
(Linear regression of individuals who used the internet by regions, between 2006 and 2024) Coefficients values.
| Coefficients | ||||||||
|---|---|---|---|---|---|---|---|---|
| 95% CI | ||||||||
| Model | Unstandardized | Standard Error | Standardized a | t | p | Lower | Upper | |
| M0 | (Intercept) | −0.389 | 0.075 | −5.215 | <0.001 | −0.537 | −0.241 | |
| M1 | (Intercept) | −394.374 | 148.582 | −2.654 | 0.009 | −689.604 | −99.144 | |
| Region (Dél-Alföld) | 99.137 | 148.516 | 0.668 | 0.506 | −195.961 | 394.235 | ||
| Region (Dél-Dunántúl) | 204.430 | 148.516 | 1.376 | 0.172 | −90.668 | 499.528 | ||
| Region (Hungary) | 75.135 | 148.194 | 0.507 | 0.613 | −219.323 | 369.592 | ||
| Region (Közép-Dunántúl) | 81.065 | 148.516 | 0.546 | 0.587 | −214.033 | 376.163 | ||
| Region (Nyugat-Dunántúl) | 117.638 | 148.516 | 0.792 | 0.430 | −177.460 | 412.736 | ||
| Region (Pest) | 252.409 | 199.634 | 1.264 | 0.209 | −144.260 | 649.078 | ||
| Region (Észak-Alföld) | 91.425 | 148.516 | 0.616 | 0.540 | −203.673 | 386.523 | ||
| Region (Észak-Magyarország) | 142.500 | 148.516 | 0.959 | 0.340 | −152.598 | 437.598 | ||
| Year | 0.196 | 0.074 | 1.074 | 2.658 | 0.009 | 0.049 | 0.342 | |
| post2020 | 0.114 | 0.043 | 0.069 | 2.667 | 0.009 | 0.029 | 0.200 | |
| time_after | 0.033 | 0.096 | 0.053 | 0.341 | 0.734 | −0.158 | 0.223 | |
| Region (Dél-Alföld) ✻ Year | −0.050 | 0.074 | −0.674 | 0.502 | −0.196 | 0.097 | ||
| Region (Dél-Dunántúl) ✻ Year | −0.102 | 0.074 | −1.383 | 0.170 | −0.248 | 0.044 | ||
| Region (Hungary) ✻ Year | −0.038 | 0.073 | −0.511 | 0.610 | −0.183 | 0.108 | ||
| Region (Közép-Dunántúl) ✻ Year | −0.040 | 0.074 | −0.549 | 0.584 | −0.187 | 0.106 | ||
| Region (Nyugat-Dunántúl) ✻ Year | −0.059 | 0.074 | −0.797 | 0.428 | −0.205 | 0.088 | ||
| Region (Pest) ✻ Year | −0.125 | 0.099 | −1.268 | 0.208 | −0.322 | 0.071 | ||
| Region (Észak-Alföld) ✻ Year | −0.046 | 0.074 | −0.623 | 0.535 | −0.192 | 0.100 | ||
| Region (Észak-Magyarország) ✻ Year | −0.071 | 0.074 | −0.967 | 0.336 | −0.217 | 0.075 | ||
| Region (Dél-Alföld) ✻ time_after | −0.009 | 0.103 | −0.085 | 0.932 | −0.214 | 0.197 | ||
| Region (Dél-Dunántúl) ✻ time_after | 0.021 | 0.103 | 0.202 | 0.840 | −0.184 | 0.226 | ||
| Region (Hungary) ✻ time_after | −0.046 | 0.102 | −0.445 | 0.658 | −0.249 | 0.158 | ||
| Region (Közép-Dunántúl) ✻ time_after | −0.088 | 0.103 | −0.851 | 0.397 | −0.293 | 0.117 | ||
| Region (Nyugat-Dunántúl) ✻ time_after | 0.010 | 0.103 | 0.092 | 0.927 | −0.196 | 0.215 | ||
| Region (Pest) ✻ time_after | 0.182 | 0.132 | 1.376 | 0.172 | −0.081 | 0.444 | ||
| Region (Észak-Alföld) ✻ time_after | −0.045 | 0.103 | −0.432 | 0.667 | −0.250 | 0.161 | ||
| Region (Észak-Magyarország) ✻ time_after | 0.017 | 0.103 | 0.167 | 0.868 | −0.188 | 0.223 | ||
“a” means: Standardized coefficients can only be computed for continuous predictors.

Figure A1.
Digital Economy and Society Index outputs and Hungarian dimensions in 2022. Source: Author’s summary of based on European Commission [76].

Figure A2.
E-commerce revenue in Hungary 2019–2024, by segment. Source: Author’s summary of [56].
References
- Löfving, L.; Viktoria, K.; Timothy, H.; Sabine, W.; Norlén, G. Can digitalization be a tool to overcome spatial injustice in sparsely populated regions? The cases of Digital Västerbotten (Sweden) and Smart Country Side (Germany). Eur. Plan. Stud. 2022, 30, 917–934. [Google Scholar] [CrossRef]
- Fu, H.; Guan, J.; Wang, R.; Kong, L.; Dai, Q. How does digitalization affect the urban-rural disparity at different disparity levels: A Bayesian Quantile Regression approach. Technol. Soc. 2024, 78, 102633. [Google Scholar] [CrossRef]
- Madanipour, A.; Mark, S.; Brooks, E. The concept of spatial justice and the European Union’s territorial cohesion. Eur. Plan. Stud. 2022, 30, 807–824. [Google Scholar] [CrossRef]
- Hazuda, M.; Gotra, V.; Hazuda, L. Advancing the convergence and integration of rural border areas. Econ. Ann.-XXI 2016, 162, 18–21. [Google Scholar] [CrossRef]
- Watanabe, K.; Fukuda, K. Designing Digital Technology for Service Work: Systematic and Participatory Approach. Proc. Des. Soc. Int. Conf. Eng. Des. 2019, 1, 1453–1462. [Google Scholar] [CrossRef][Green Version]
- Elliott, C.S.; Long, G. Manufacturing rate busters: Computer control and social relations in the labour process. Work Employ. Soc. 2016, 30, 135–151. [Google Scholar] [CrossRef]
- Murthy, K.B.; Kalsie, A.; Shankar, R. Digital economy in a global perspective: Is there a digital divide? Transnatl. Corp. Rev. 2021, 13, 1–15. [Google Scholar] [CrossRef]
- Codagnone, C.; Liva, G.; Gunderson, L.; Misuraca, G.; Rebesco, E. Europe’s Digital Decade and Autonomy; Publication for the committee on Industry, Research and Energy, Policy Department for Economic, Scientific and Quality of Life Policies, European Parliament: Luxembourg, 2021; Available online: https://internationaldataspaces.org/wp-content/uploads/dlm_uploads/IPOL_STU2021695465_EN.pdf (accessed on 16 May 2025).
- European Commission. Europe’s Digital Decade: Digital Targets for 2030; European Commission: Brussels, Belgium, 2025; Available online: https://commission.europa.eu/strategy-and-policy/priorities-2019-2024/europe-fit-digital-age/europes-digital-decade-digital-targets-2030_en (accessed on 21 May 2025).
- Lindberg, J.; Runardotter, M.; Ståhlbröst, A. Bridging the Gap. Policies to Accelerate Social Change for an Inclusive Rural Digital Transformation in Sweden. Eur. Ctry. 2024, 16, 26–42. [Google Scholar] [CrossRef]
- Csiszarik-Kocsir, A.; Lentner, C. Financial exclusion from the perspective of financial literacy in the digital world of the 21st century through the example of Hungary. Transform. Bus. Econ. 2023, 22, 266. [Google Scholar]
- Sun, D.P.; Yu, B.T.; Ma, J. Research on the Impact of Digital Empowerment on China’s Human Capital Accumulation and Human Capital Gap between Urban and Rural Areas. Sustainability 2023, 15, 5458. [Google Scholar] [CrossRef]
- Ferrari, A.; Bacco, M.; Gaber, K.; Jedlitschka, A.; Hess, S.; Kaipainen, J.; Koltsida, P.; Toli, E.; Brunori, G. Drivers, barriers and impacts of digitalisation in rural areas from the viewpoint of experts. Inf. Softw. Technol. 2022, 145, 106816. [Google Scholar] [CrossRef]
- Kotarba, M. Measuring digitalization–key metrics. Found. Manag. 2017, 9, 123–138. [Google Scholar] [CrossRef]
- Gallo, N.A.; Vicent, L.; Trillo, D. Digitalisation and rural tourism development in Europe. Tour. Manag. Stud. 2024, 20, 33–44. [Google Scholar] [CrossRef]
- Attaran, M.; Celik, B.G. Digital Twin: Benefits, use cases, challenges, and opportunities. Decis. Anal. J. 2023, 6, 100165. [Google Scholar] [CrossRef]
- Myovella, G.; Karacuka, M.; Haucap, J. Digitalization and economic growth: A comparative analysis of Sub-Saharan Africa and OECD economies. Telecommun. Policy 2020, 44, 101856. [Google Scholar] [CrossRef]
- Suvankulov, F.; Chi Keung Lau, M.; Ho Chi Chau, F. Job search on the internet and its outcome. Internet Res. 2012, 22, 298–317. [Google Scholar] [CrossRef]
- Vial, G. Understanding digital transformation: A review and a research agenda. Manag. Digit. Transform. 2021, 28, 13–66. [Google Scholar] [CrossRef]
- Obermayer, N.; Máhr, T.; Banász, Z. A digitalizáció társadalmi hatásainak vizsgálata hazai szakértők véleményének tükrében—Examining the social impacts of digitalisation based on the perspective of Hungarian experts. Vez./Bp. Manag. Rev. 2023, 54, 32–46. [Google Scholar] [CrossRef]
- Ha, L.T. Effects of digitalization on financialization: Empirical evidence from European countries. Technol. Soc. 2022, 68, 101851. [Google Scholar] [CrossRef]
- Schulze, R.; Staudenmayer, D. Digital Revolution: Challenges for Contract Law in Practice; Nomos: Baden-Baden, Germany, 2016. [Google Scholar] [CrossRef]
- Ramiro Troitiño, D. The European Commission, the Council, and the European Parliament: Differentiated theoretical frame for the digital revolution. Digit. Dev. Eur. Union Interdiscip. Perspect. 2023, 349–361. [Google Scholar] [CrossRef]
- Kagermann, H.; Wahlster, W. Ten years of Industrie 4.0. Sci 2022, 4, 26. [Google Scholar] [CrossRef]
- Furstenau, L.B.; Sott, M.K.; Kipper, L.M.; Machado, E.L.; Lopez-Robles, J.R.; Dohan, M.S.; Cobo, M.J.; Zahid, A.; Abbasi, Q.H.; Imran, M.A. Link between sustainability and industry 4.0: Trends, challenges and new perspectives. IEEE Access 2020, 8, 140079–140096. [Google Scholar] [CrossRef]
- European Commission. Hungary in the Digital Economy and Society Index; European Commission: Brussels, Belgium, 2025; Available online: https://digital-strategy.ec.europa.eu/en/policies/desi-hungary (accessed on 5 March 2025).
- Statista. Share of Households with Internet Access in Hungary from 2010 to 2024; Statista: Hamburg, Germany, 2025; Available online: https://www.statista.com/statistics/377743/household-internet-access-in-hungary/ (accessed on 4 April 2025).
- Lutz, C. Digital inequalities in the age of artificial intelligence and big data. Hum. Behav. Emerg. Technol. 2019, 1, 141–148. [Google Scholar] [CrossRef]
- Helsper, E. The Digital Disconnect: The Social Causes and Consequences of Digital Inequalities; Sage Publications: Thousand Oaks, CA, USA, 2021. [Google Scholar]
- Fróna, D. The state of agricultural digitalisation in Hungary. Res. Agric. Eng. 2024, 70, 1–12. [Google Scholar] [CrossRef]
- Martins Van Jaarsveld, G. The effects of COVID-19 among the elderly population: A case for closing the digital divide. Front. Psychiatry 2020, 11, 577427. [Google Scholar] [CrossRef] [PubMed]
- Sabbagh, K.; Friedrich, R.; El-Darwiche, B.; Singh, M.; Ganediwalla, S.; Katz, R. Maximizing the impact of digitization. Glob. Inf. Technol. Rep. 2012, 2012, 121–133. [Google Scholar]
- Menvielle, L.; Audrain-Pontevia, A.-F.; Menvielle, W. The Digitization of Healthcare: New Challenges and Opportunities; Springer: Berlin/Heidelberg, Germany, 2017. [Google Scholar] [CrossRef]
- Pazarbasioglu, C.; Mora, A.G.; Uttamchandani, M.; Natarajan, H.; Feyen, E.; Saal, M. Digital financial services. World Bank 2020, 54, 1–54. Available online: https://thedocs.worldbank.org/en/doc/305a39cbb6f35567db78bda6709c5cd8-0430012025/original/World-Bank-DFS-Whitepaper-DigitalFinancialServices.pdf (accessed on 4 April 2025).
- Fahmi, F.Z.; Arifianto, A. Digitalization and social innovation in rural areas: A case study from Indonesia. Rural Sociol. 2022, 87, 339–369. [Google Scholar] [CrossRef]
- Cetindamar Kozanoglu, D.; Abedin, B. Understanding the role of employees in digital transformation: Conceptualization of digital literacy of employees as a multi-dimensional organizational affordance. J. Enterp. Inf. Manag. 2021, 34, 1649–1672. [Google Scholar] [CrossRef]
- Bertani, F.; Raberto, M.; Teglio, A. The productivity and unemployment effects of the digital transformation: An empirical and modelling assessment. Rev. Evol. Political Econ. 2020, 1, 329–355. [Google Scholar] [CrossRef]
- Pósfai, M.; Féjer, A. The eHungary Programme 2.0. Innov. Eur. J. Soc. Sci. Res. 2008, 21, 407–415. [Google Scholar] [CrossRef]
- Kaiser, T. Empowering, transferring and downscaling: Three steps towards implementing smart village strategies. In Proceedings of the Central and Eastern European eDem and eGov Days, Budapest, Hungary, 22–23 September 2022; pp. 38–45. [Google Scholar] [CrossRef]
- Leschiutta, L.; Zicca, G.; Li, F.Y.; Vandoni, L.; Fragoulis, N. Achieving reliability via multi-homing and path redundancy in multi-hop wireless networks for Internet access in rural areas. In Proceedings of the 2007 16th IST Mobile and Wireless Communications Summit, Budapest, Hungary, 1–5 July 2007; pp. 1–5. [Google Scholar] [CrossRef]
- Herdon, M.; Botos, S.; Várallyai, L. Decreasing the digital divide by increasing e-innovation and e-readiness abilities in agriculture and rural areas. Int. J. Agric. Environ. Inf. Syst. 2015, 6, 1–18. [Google Scholar] [CrossRef][Green Version]
- Várallyai, L.; Herdon, M.; Botos, S. Statistical Analyses of Digital Divide Factors. Procedia Econ. Financ. 2015, 19, 364–372. [Google Scholar] [CrossRef]
- Kiraly, G.; Vago, S.; Bull, E.; van der CRUYSSEN, L.; Arbour, T.; Spanoghe, P.; van Dijk, L. Information behaviour of farmers, foresters, and advisors in the context of digitalisation in the EU. Stud. Agric. Econ. 2023, 125, 1–12. [Google Scholar] [CrossRef]
- Qorri, D.; Pergéné Szabó, E.; Felföldi, J.; Kovács, K. The Role of Human Resource Management in Agricultural Labor-Saving Technologies: An Integrative Review and Science Mapping. Agriculture 2024, 14, 1144. [Google Scholar] [CrossRef]
- Kovács, L.; Szőke, V. Geographical space and service use in agriculture: The view from the perspective of multilayer networks. Hung. Geogr. Bull. 2025, 74, 93–115. [Google Scholar] [CrossRef]
- Bojtor, A. The use of Quality Function Deployment in case of smart village developments. In Proceedings of the Central and Eastern European eDem and eGov Days, Budapest Hungary, 14–15 September 2023; pp. 218–221. [Google Scholar] [CrossRef]
- El Archi, Y.; Benbba, B.; Zhu, K.; El Andaloussi, Z.; Pataki, L.; Dávid, L.D. Mapping the Nexus between Sustainability and Digitalization in Tourist Destinations: A Bibliometric Analysis. Sustainability 2023, 15, 9717. [Google Scholar] [CrossRef]
- Eurostat. Individuals Who Used the Internet, Frequency of Use and Activities; Eurostat: Luxembourg, 2025; Available online: https://ec.europa.eu/eurostat/databrowser/view/isoc_r_iuse_i__custom_16862220/default/table (accessed on 4 April 2025).
- HCSO. Tér-Kép, 2023; Hungarian Central Statistical Office: Budapest, Hungary, 2024; Available online: https://www.ksh.hu/docs/hun/xftp/idoszaki/pdf/ter_kep_2023.pdf (accessed on 15 April 2025).
- HCSO. Helyhez Kötött Internetes Előfizetések Száma Kapcsolattípusonként Vármegye és Régió Szerint; Hungarian Central Statistical Office: Budapest, Hungary, 2025; Available online: https://www.ksh.hu/stadat_files/ikt/hu/ikt0025.html (accessed on 15 April 2025).
- Holik, I.; Kersánszki, T.; Molnár, G.; Sanda, I.D. Teachers’ Digital Skills and Methodological Characteristics of Online Education. Int. J. Eng. Pedagog. 2023, 13, 50. [Google Scholar] [CrossRef]
- Statista. Market Share of Service Providers Based on Fixed-Line Broadband Internet Subscriptions in Hungary as of 2nd Quarter 2024; Statista: Hamburg, Germany, 2025; Available online: https://www.statista.com/statistics/1184771/hungary-market-share-of-service-providers-based-on-fixed-broadband-internet-subscriptions/ (accessed on 15 April 2025).
- European Commission. Hungary 2024 Digital Decade Country Report; European Commission: Brussels, Belgium, 2025; Available online: https://digital-strategy.ec.europa.eu/en/factpages/hungary-2024-digital-decade-country-report (accessed on 15 May 2025).
- Eurostat. Share of Households with Internet Access in Hungary from 2010 to 2023; Eurostat: Luxembourg, 2024; Available online: https://ec.europa.eu/eurostat/databrowser/view/isoc_ci_in_h/default/table?lang=en (accessed on 20 April 2025).
- NMHH. Az Elektronikus Hírközlési piac Fogyasztóinak Vizsgálata, 2023—Háztartási Felmérés; NMHH: Budapest, Hungary, 2024; Available online: https://nmhh.hu/dokumentum/247708/nmhh_haztartasi_felmeres_2023.pdf (accessed on 20 April 2025).
- Statista. E-Commerce Revenue in Hungary from 2019 to 2024, by Segment; Statista: Hamburg, Germany, 2025; Available online: https://www.statista.com/forecasts/1312894/hungary-e-commerce-segment-revenue (accessed on 23 April 2025).
- Statista. Penetration Rate of Online Banking in Hungary from 2014 to 2029; Statista: Hamburg, Germany, 2024; Available online: https://www.statista.com/forecasts/1150315/online-banking-penetration-forecast-in-hungary (accessed on 23 April 2025).
- Statista. Distribution of Webshops by Supported Payment Methods in Hungary in 2024; Statista: Hamburg, Germany, 2025; Available online: https://www.statista.com/statistics/1100698/hungary-share-of-webshops-by-available-payment-methods/ (accessed on 23 April 2025).
- Vas, Z.; Szakálné Kanó, I.; Vida, G. Spatial concentration of the ICT sector in the digital age in Central and Eastern Europe. Eur. Plan. Stud. 2024, 32, 2619–2640. [Google Scholar] [CrossRef]
- Kaposzta, J.; Honvari, P. The concept of smart villages and a rural home development strategy. Tér és Társadalom 2019, 33, 83–97. [Google Scholar] [CrossRef]
- Nagy, H.; Kaposzta, J.; Varga-Nagy, A. Is ICT smartness possible development way for Hungarian rural areas. Eng. Rural Dev. 2018, 17, 463–468. [Google Scholar] [CrossRef]
- Adamowicz, M.; Zwolińska-Ligaj, M. The “Smart Village” as a way to achieve sustainable development in rural areas of Poland. Sustainability 2020, 12, 6503. [Google Scholar] [CrossRef]
- Bogyó, D.; Magura, T.; Simon, E.; Tóthmérész, B. Millipede (Diplopoda) assemblages alter drastically by urbanisation. Landsc. Urban Plan. 2015, 133, 118–126. [Google Scholar] [CrossRef]
- Aguilar, E.C. Rural entrepreneurial ecosystems: A systematic literature review for advancing conceptualisation. Entrep. Bus. Econ. Rev. 2021, 9, 101–114. [Google Scholar] [CrossRef]
- Fróna, D. Factors affecting food security. Ann. Univ. Oradea. Econ. Sci. 2020, 1, 39–49. Available online: https://dea.lib.unideb.hu/dea/bitstream/handle/2437/296543/FILE_UP_0_Anale-AUOES_Issue-1-din-2020_unlocked.pdf?sequence=1 (accessed on 8 October 2025).
- Fróna, D.; Szenderák, J. Digitalization and digital technologies: The obstacles to adaptation among Hungarian farmers. Equilibrium. Q. J. Econ. Econ. Policy 2024, 19, 1075–1110. [Google Scholar] [CrossRef]
- Donham, K.J.; Thelin, A. Agricultural Medicine: Rural Occupational and Environmental Health, Safety, and Prevention; John Wiley & Sons: Hoboken, NJ, USA, 2016. [Google Scholar] [CrossRef]
- HCSO. Agrárcenzus-Eredmények—Vidékfejlesztés; HCSO: Budapest, Hungary, 2025; Available online: https://www.ksh.hu/docs/hun/xftp/ac2020/videkfejlesztes/index.html#tovbbiadatokinformcik (accessed on 15 April 2025).
- HCSO. Agrárcenzus Eredmények—Agrárdigitalizáció; HCSO: Budapest, Hungary, 2023; Available online: https://www.ksh.hu/docs/hun/xftp/ac2020/agrardigitalizacio/index.html (accessed on 15 April 2025).
- Dobos, I.; Bánhidi, Z. Where Central and Eastern European countries stand in terms of digital readiness. Soc. Econ. 2025, 47, 66–84. [Google Scholar] [CrossRef]
- Komorowski, Ł. Digitalisation as a Challenge for Smart Villages: The Case of Poland. Agriculture 2024, 14, 2270. [Google Scholar] [CrossRef]
- Mrnuštík Konečná, M.; Sutherland, L.-A. Digital innovations in the Czech Republic: Developing the inner circle of the Triggering Change Model. J. Agric. Educ. Ext. 2022, 28, 577–600. [Google Scholar] [CrossRef]
- Tomczyk, Ł. Digital transformation and digital competences of urban and rural Polish youths. Politics Gov. 2024, 12, 1–18. [Google Scholar] [CrossRef]
- Kouřilová, J.; Pělucha, M.; Shemetev, A.; Kubíková, M. Perceptions of Digital Economy Opportunities in Diverse Rural Areas in Czechia by Rural Women Leaders. Eur. Ctry. 2024, 16, 615–627. [Google Scholar] [CrossRef]
- Rákos, M.; Mihály-Karnai, L.; Fróna, D.; Csetneki, C. Examination of the Factors of Multidimensional Energy Poverty in a Hungarian Rural Settlement. Energies 2025, 18, 4287. [Google Scholar] [CrossRef]
- European Commission. The Digital Economy and Society Index (DESI); European Commission: Brussels, Belgium, 2025; Available online: https://digital-strategy.ec.europa.eu/hu/policies/desi (accessed on 23 March 2025).
Disclaimer/Publisher’s Note: The statements, opinions and data contained in all publications are solely those of the individual author(s) and contributor(s) and not of MDPI and/or the editor(s). MDPI and/or the editor(s) disclaim responsibility for any injury to people or property resulting from any ideas, methods, instructions or products referred to in the content. |
© 2025 by the authors. Licensee MDPI, Basel, Switzerland. This article is an open access article distributed under the terms and conditions of the Creative Commons Attribution (CC BY) license (https://creativecommons.org/licenses/by/4.0/).