Article

Multiscale Effects of Land Infrastructure Planning on Housing Prices in Bangkok, Thailand

1
AI for Digital Earth Group, School of Mathematics, Shandong University, Jinan 250100, China
2
Wolfson College, University of Oxford, Oxford OX2 6UD, UK
*
Author to whom correspondence should be addressed.
Land 2025, 14(10), 2004; https://doi.org/10.3390/land14102004
Submission received: 28 August 2025 / Revised: 27 September 2025 / Accepted: 3 October 2025 / Published: 6 October 2025
(This article belongs to the Section Land Use, Impact Assessment and Sustainability)

Abstract

Bangkok is the largest city in Thailand and the second largest city in Southeast Asia. Due to the rapid urbanization and upgrading of economic structures, the real estate market in Bangkok is not only constrained by domestic factors but also fluctuates with international economic cycles. Bangkok’s long history, diverse culture, developed economy, and incomplete land infrastructure make the formation of housing prices particularly complex. In this study, we collected 13,175 residence transaction data from 2076 different neighborhoods in Bangkok and explored multiscale effects of various land infrastructure factors on housing prices in Bangkok at the neighborhood level. Our analysis not only supports land planning departments of Bangkok to make more reasonable facility planning but also provides new insights into driving mechanisms of housing prices in other cities of Thailand and ASEAN countries.

1. Introduction

Real estate markets, especially in developing countries, have exhibited substantial volatility, along with rapid urbanization and the upgrading of economic structures in recent decades. Compared with developed countries, the recent urbanization processes in emerging economies are severely constrained by the land carrying capacity, incomplete infrastructure, and simple economic structures. Effective land use planning can mitigate the imbalance of urban facilities and services, thereby playing a unique role in lowering and stabilizing housing transaction prices and avoiding triggering gentrification.
Various models have been developed to explore the relationship between potential influential factors and housing prices. The known hedonic price model is a widely used approach in revealing housing price formation mechanisms from existing land infrastructure maps [1,2]. It can estimate marginal prices from different factors influencing the final housing sale prices, where housing attributes and neighborhood facilities are used to estimate the market demand as elements that make up the housing value [3]. The embedment of global regression into the hedonic price model was adopted in early housing price research due to its simplicity and effectiveness [4,5,6]. However, global regressions do not consider spatial autocorrelation, leading to the generation of biases when identifying the determinants of apartment prices, so by embedding global regression into the hedonic price model, the complex spatial autocorrelations prevalent in housing markets are not modeled well [7]. Moreover, the demand to capture spatial heterogeneity in the links between housing prices and influential factors also introduces higher requirements for housing price models [8]. To overcome this drawback, improved models, such as the spatial lag model, the spatial error model, and the spatial Durbin model, have been developed to capture the spatial autocorrelation of apartment prices and influential factors [9,10]. Although geographical phenomena often exhibit spatial heterogeneity due to their complex nature and interaction mechanisms, the regression coefficients in these improved models are typically spatially and temporally invariant. Geographically weighted regression (GWR) has the ability to transform classic global regression into local regressions by allowing the estimated regression coefficients to vary locally over geographic space and incorporating a fixed bandwidth and a spatial weight matrix [11,12,13]. Different attributes/facilities have different areas of influence, leading to their spatial effects on housing prices appearing at different scales. As an improvement in GWR, the multiscale geographically weighted regression (MGWR) incorporates further local variations in all influential factors at multiple spatial scales and allows the relationships between housing price variables and different explanatory variables to vary at different spatial scales [14,15,16].
There has been some attention to assess effect degrees of various land infrastructure factors on housing prices and to explore their spatial heterogeneity and homogeneity. Hui et al. [17] investigated four major regions in Hong Kong, China, and explored the effect of the spatial dependence in the geographic distribution, structure, and traffic on the overall housing market and submarkets. They indicated that there were significant differences in the region, structure, and traffic in these submarkets. Kim et al. [18] examined the relationship between green space and single-family housing prices in Austin, USA, and found that higher quality forest areas around houses contribute positively to housing prices. Jang and Kang [19] divided the housing market in Seoul, South Korea, into several submarkets, considering the effect of retail accessibility on housing prices, and emphasized the importance of retail types and accessibility effects for housing prices. Koster and Rouwendal [20] demonstrated the value-added effect of diversified mixed land use on housing prices in Rotterdam, Netherlands, and showed that diversified neighborhoods were more in line with the preferences of apartment residents. Based on data from repeated sales of properties in New Jersey, USA, Kim and Lahr [21] demonstrated that a light rail could have a positive effect on real estate appreciation rates near light rail stations. Based on data on 34,284 apartment transactions in Warsaw, Poland, Trojanek and Gluszak [22] found that the subway line under construction also drove apartment prices. Wen et al. [23] confirmed that educational facilities at all stages in Hangzhou, China, had a significant effect on housing prices from the perspective of education quality or accessibility and further revealed the spatial heterogeneity in education capitalization.
Thailand, as a major member of the Association of Southeast Asian Nations (ASEAN) and the second largest economy in Southeast Asia, has a globally attractive real estate market. As a newly industrialized country, Thailand’s urban population has grown from 31% of the total population in 2000 to 53% in 2022. Urbanization and industrialization have created a large demand for land infrastructure and housing in Thai cities. Meanwhile, as a popular tourist destination, the increasing demand for hotels and rentals has stimulated the development of commercial properties. Among all Thai cities, Bangkok is experiencing rapid real estate development as the result of rapid urbanization and tourism [24,25]. Not only that, the government has also taken a series of measures to promote the development of real estate, such as simplifying the investment process and increasing infrastructure investment. In this context, it is of great market value and social significance to explore the relationship between housing prices and potential influential factors in Bangkok. Vichiensan et al. [26] studied a small number of property samples along the BTS Sukhumvit line in Bangkok and found that property values are strongly affected by rail transit. Rinchumphu [27] analyzed the effect of noise pollution on housing prices in Bangkok and found that the impact extent was related to the type of house. Vichiensan et al. [28] employed condominium sales data along major rail corridors to reveal that there were significant spatial differences in the driving effect of rail transit on housing prices in Bangkok. These existing studies investigated very limited housing transaction samples and only considered one or two factor effects, so they are far from a comprehensive analysis on the housing price formation mechanisms in Bangkok.
In this study, we investigated housing prices in 2076 neighborhoods of Bangkok, which cover almost all condominiums and detached houses for sale in Bangkok. Residences in the same neighborhood generally have the same location characteristics, so we ignored internal differences inside any neighborhood and focused on the effects of various influential factors on housing prices at the neighborhood level. We explored multiscale effects of structural features; neighborhood and accessibility to education, medical care, public transport, scenery, and business on housing prices in Bangkok. Our study not only helps potential purchasers to better understand the spatial patterns and driving mechanisms of housing prices in Bangkok but also enhances the spatial justice of Bangkok governments in providing urban public services.

2. Study Area and Data

Bangkok is the capital and largest city of Thailand and the second largest city in Southeast Asia. During the past four decades, with the transfer of labor-intensive industries brought by globalization, Bangkok has experienced rapid urbanization, sustained economic growth, and a booming tourism industry. At present, Bangkok has about 15% of Thailand’s population and nearly half of its GDP. As an international metropolis, Bangkok’s long history, diverse culture, developed economy, and incomplete infrastructure make the formation mechanisms of its housing prices particularly complex. Bangkok’s real estate market expanded rapidly in the late 1980s and preceded that of all other cities in Thailand, during which a large number of modern commercial buildings emerged successively in Pathum Wan and Sukhumvit. Real estate in Bangkok had a steady increasing demand and was driven not only by regular urbanization processes but also overseas investment during 2023–2024 [29]. With the continuous improvement in infrastructure and law regulations by the local government, the real estate market in Bangkok has matured, with residential and commercial real estate attracting significant overseas investments.
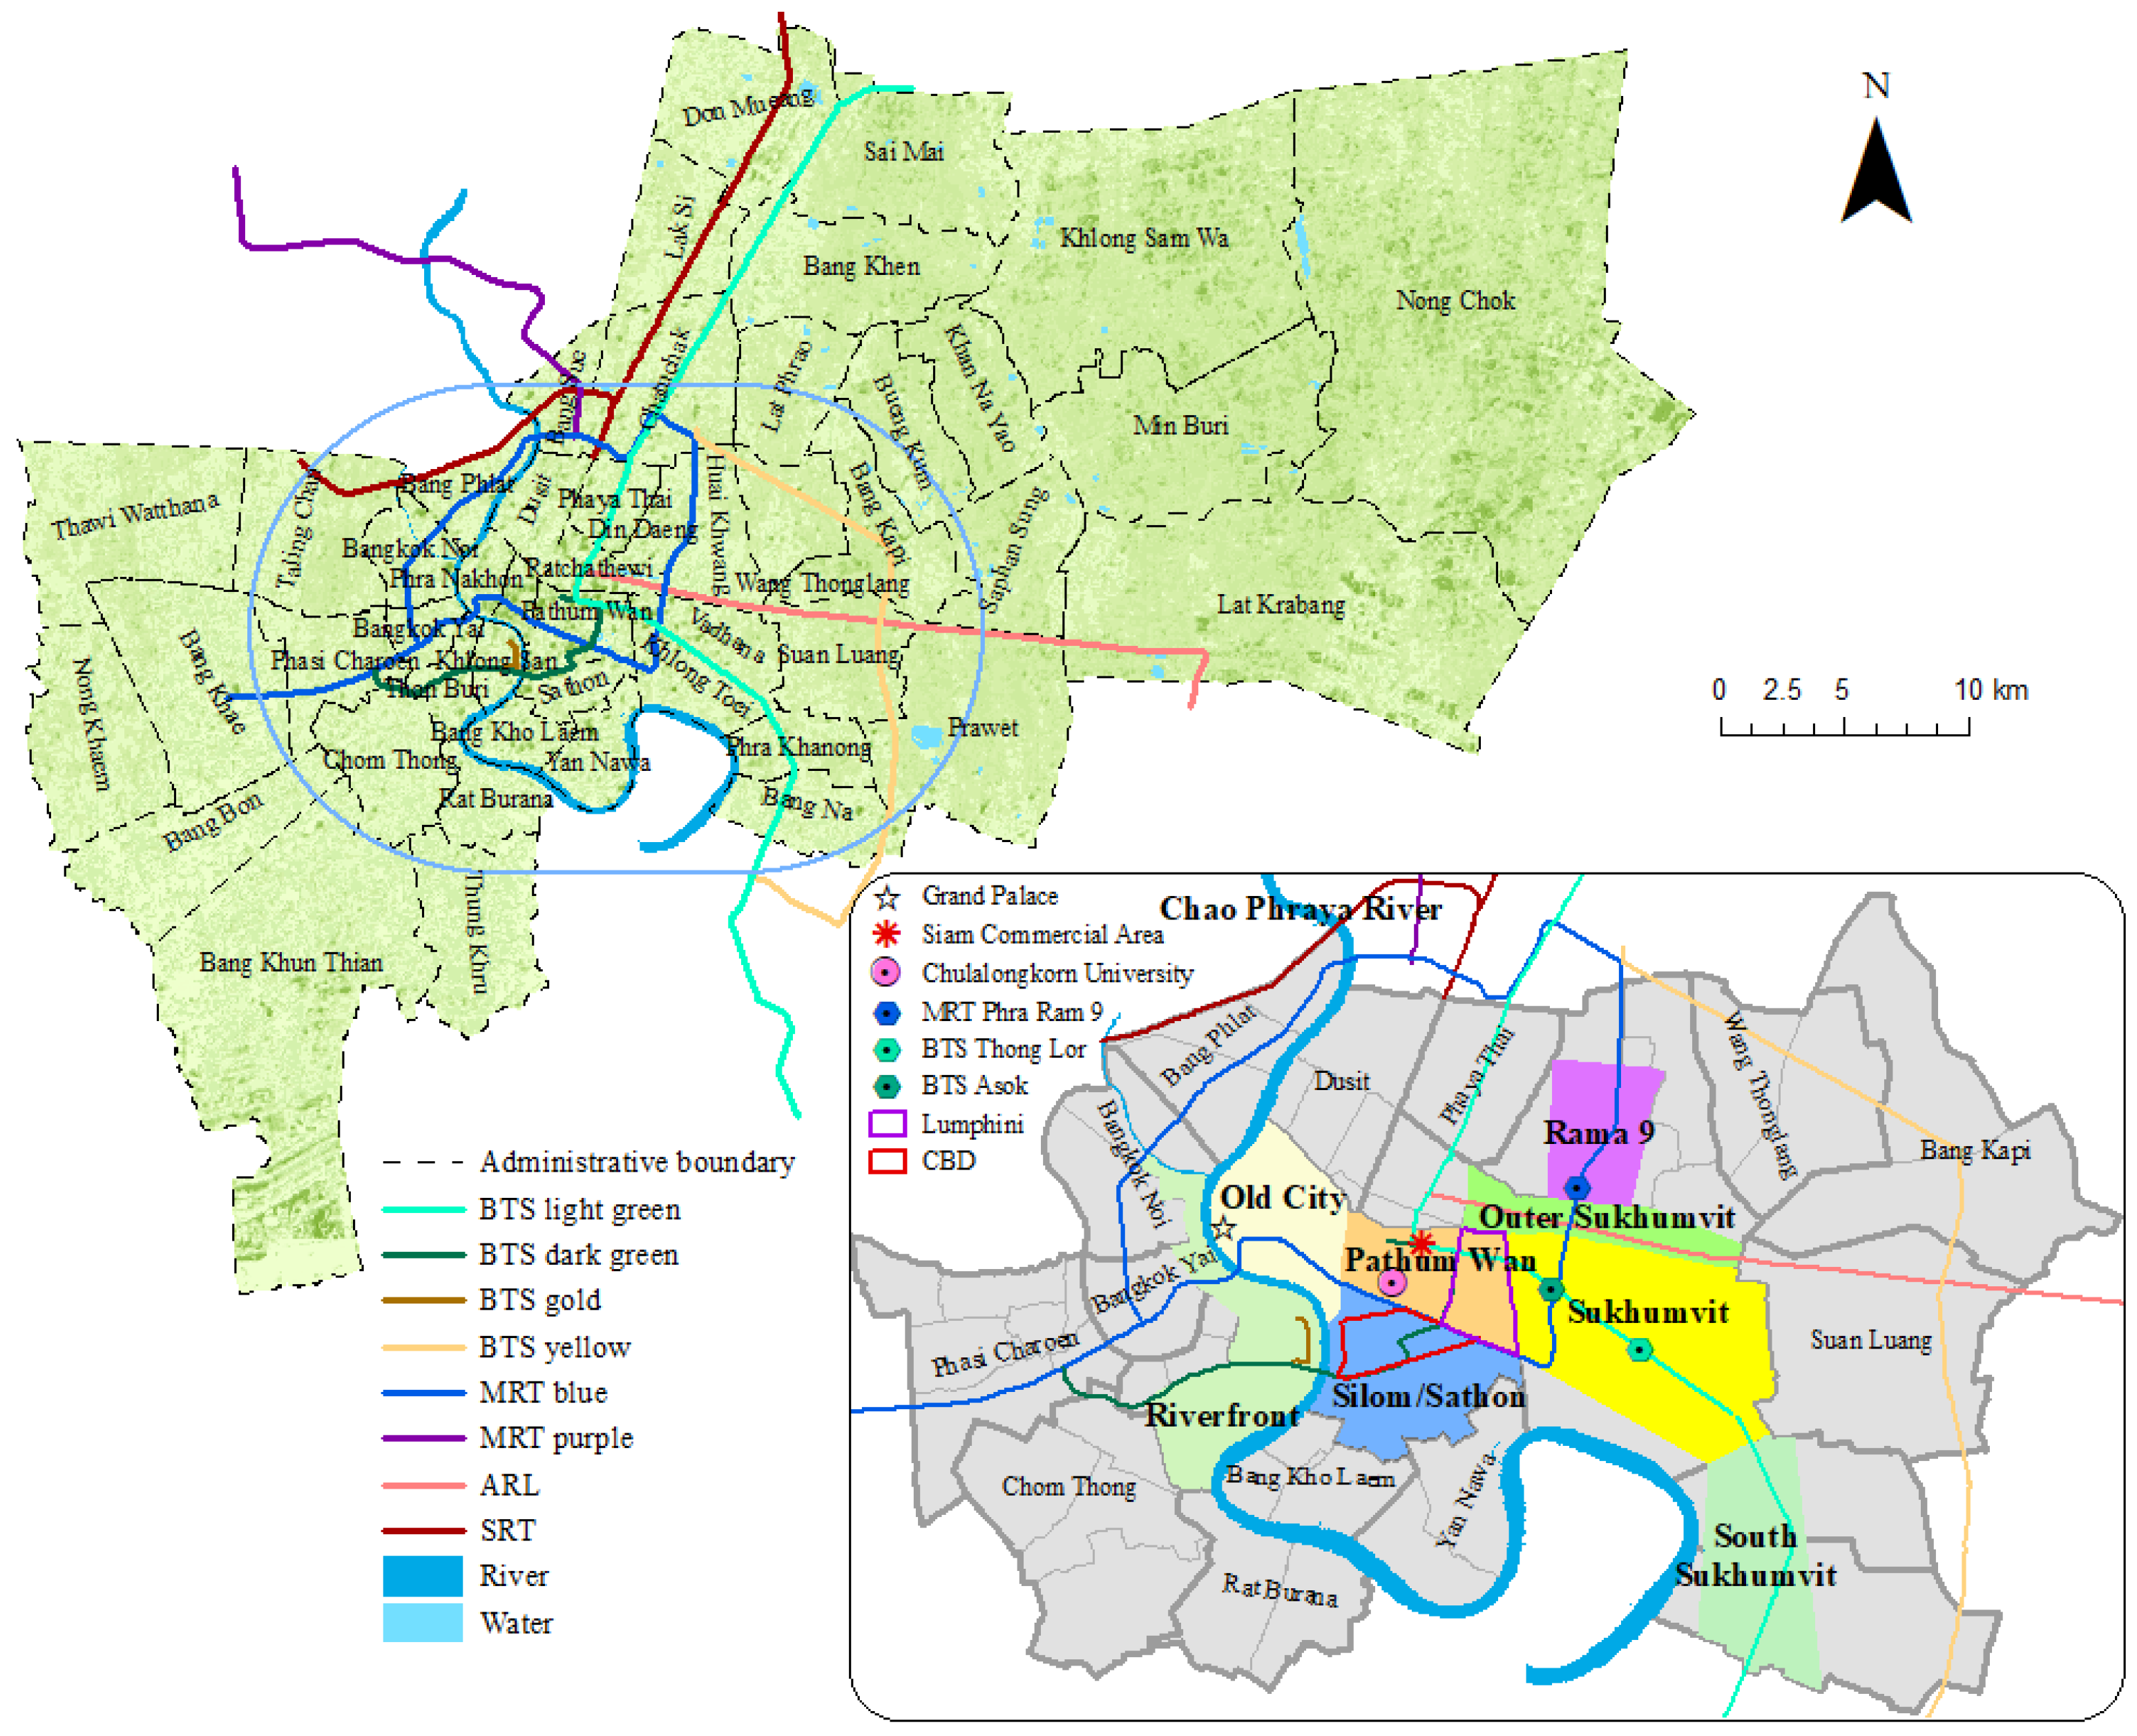
Located in the Chao Phraya River Delta, Bangkok is a low-lying city with a dense network of rivers. Bangkok, with a population of over 10 million, consists of 50 districts (Figure 1). It extends outwards from the Grand Palace at the center. The old city areas on the east bank of the Chao Phraya River are populated with historical buildings, preserving a rich cultural atmosphere with almost no large-scale development. Main downtown areas (Pathum Wan, Silom/Sathon, and Sukhumvit) are adjacent to the east of the old city (Figure 1). Pathum Wan is the most prosperous district in Bangkok [30], with the prestigious Chulalongkorn University and government agencies as well as top commercial complexes such as Central World, Siam Paragon, and Siam Center. Silom/Sathon is Bangkok’s financial hub with a dense network of roads filled with multinational corporations, upscale hotels, and luxury condominiums. Sukhumvit stretches eastward along the BTS and is also home to many upscale hotels, shopping malls, international schools, and private hospitals. The commercial development in Sukhumvit has attracted significant investment from all over the world, and there are many foreigners working and settling here. As a result, commercial properties built in Sukhumvit are popular with foreigners. Anchored by MRT Phra Ram 9, Rama 9 is a new business district on the rise. The comprehensive shopping mall Central Rama 9 and the office building G-Tower, as well as numerous corporate buildings, have gradually developed Rama 9 into one of Bangkok’s business hubs. Northern regions of Bangkok are undergoing rapid development, with the railway station and Don Mueang Airport located there, making it one of the largest transport hubs in Southeast Asia. In contrast, the west bank of the Chao Phraya River is underdeveloped, with facilities and residential areas developed mainly along the river. Most of the residences in urban areas are condominiums. Although the usable area of each condominium is always small, the adjacency to diverse living facilities and convenient transport make condominiums a prime choice for people. However, most of the residences in suburb areas are dominated by detached houses due to the large amount of cheap land.
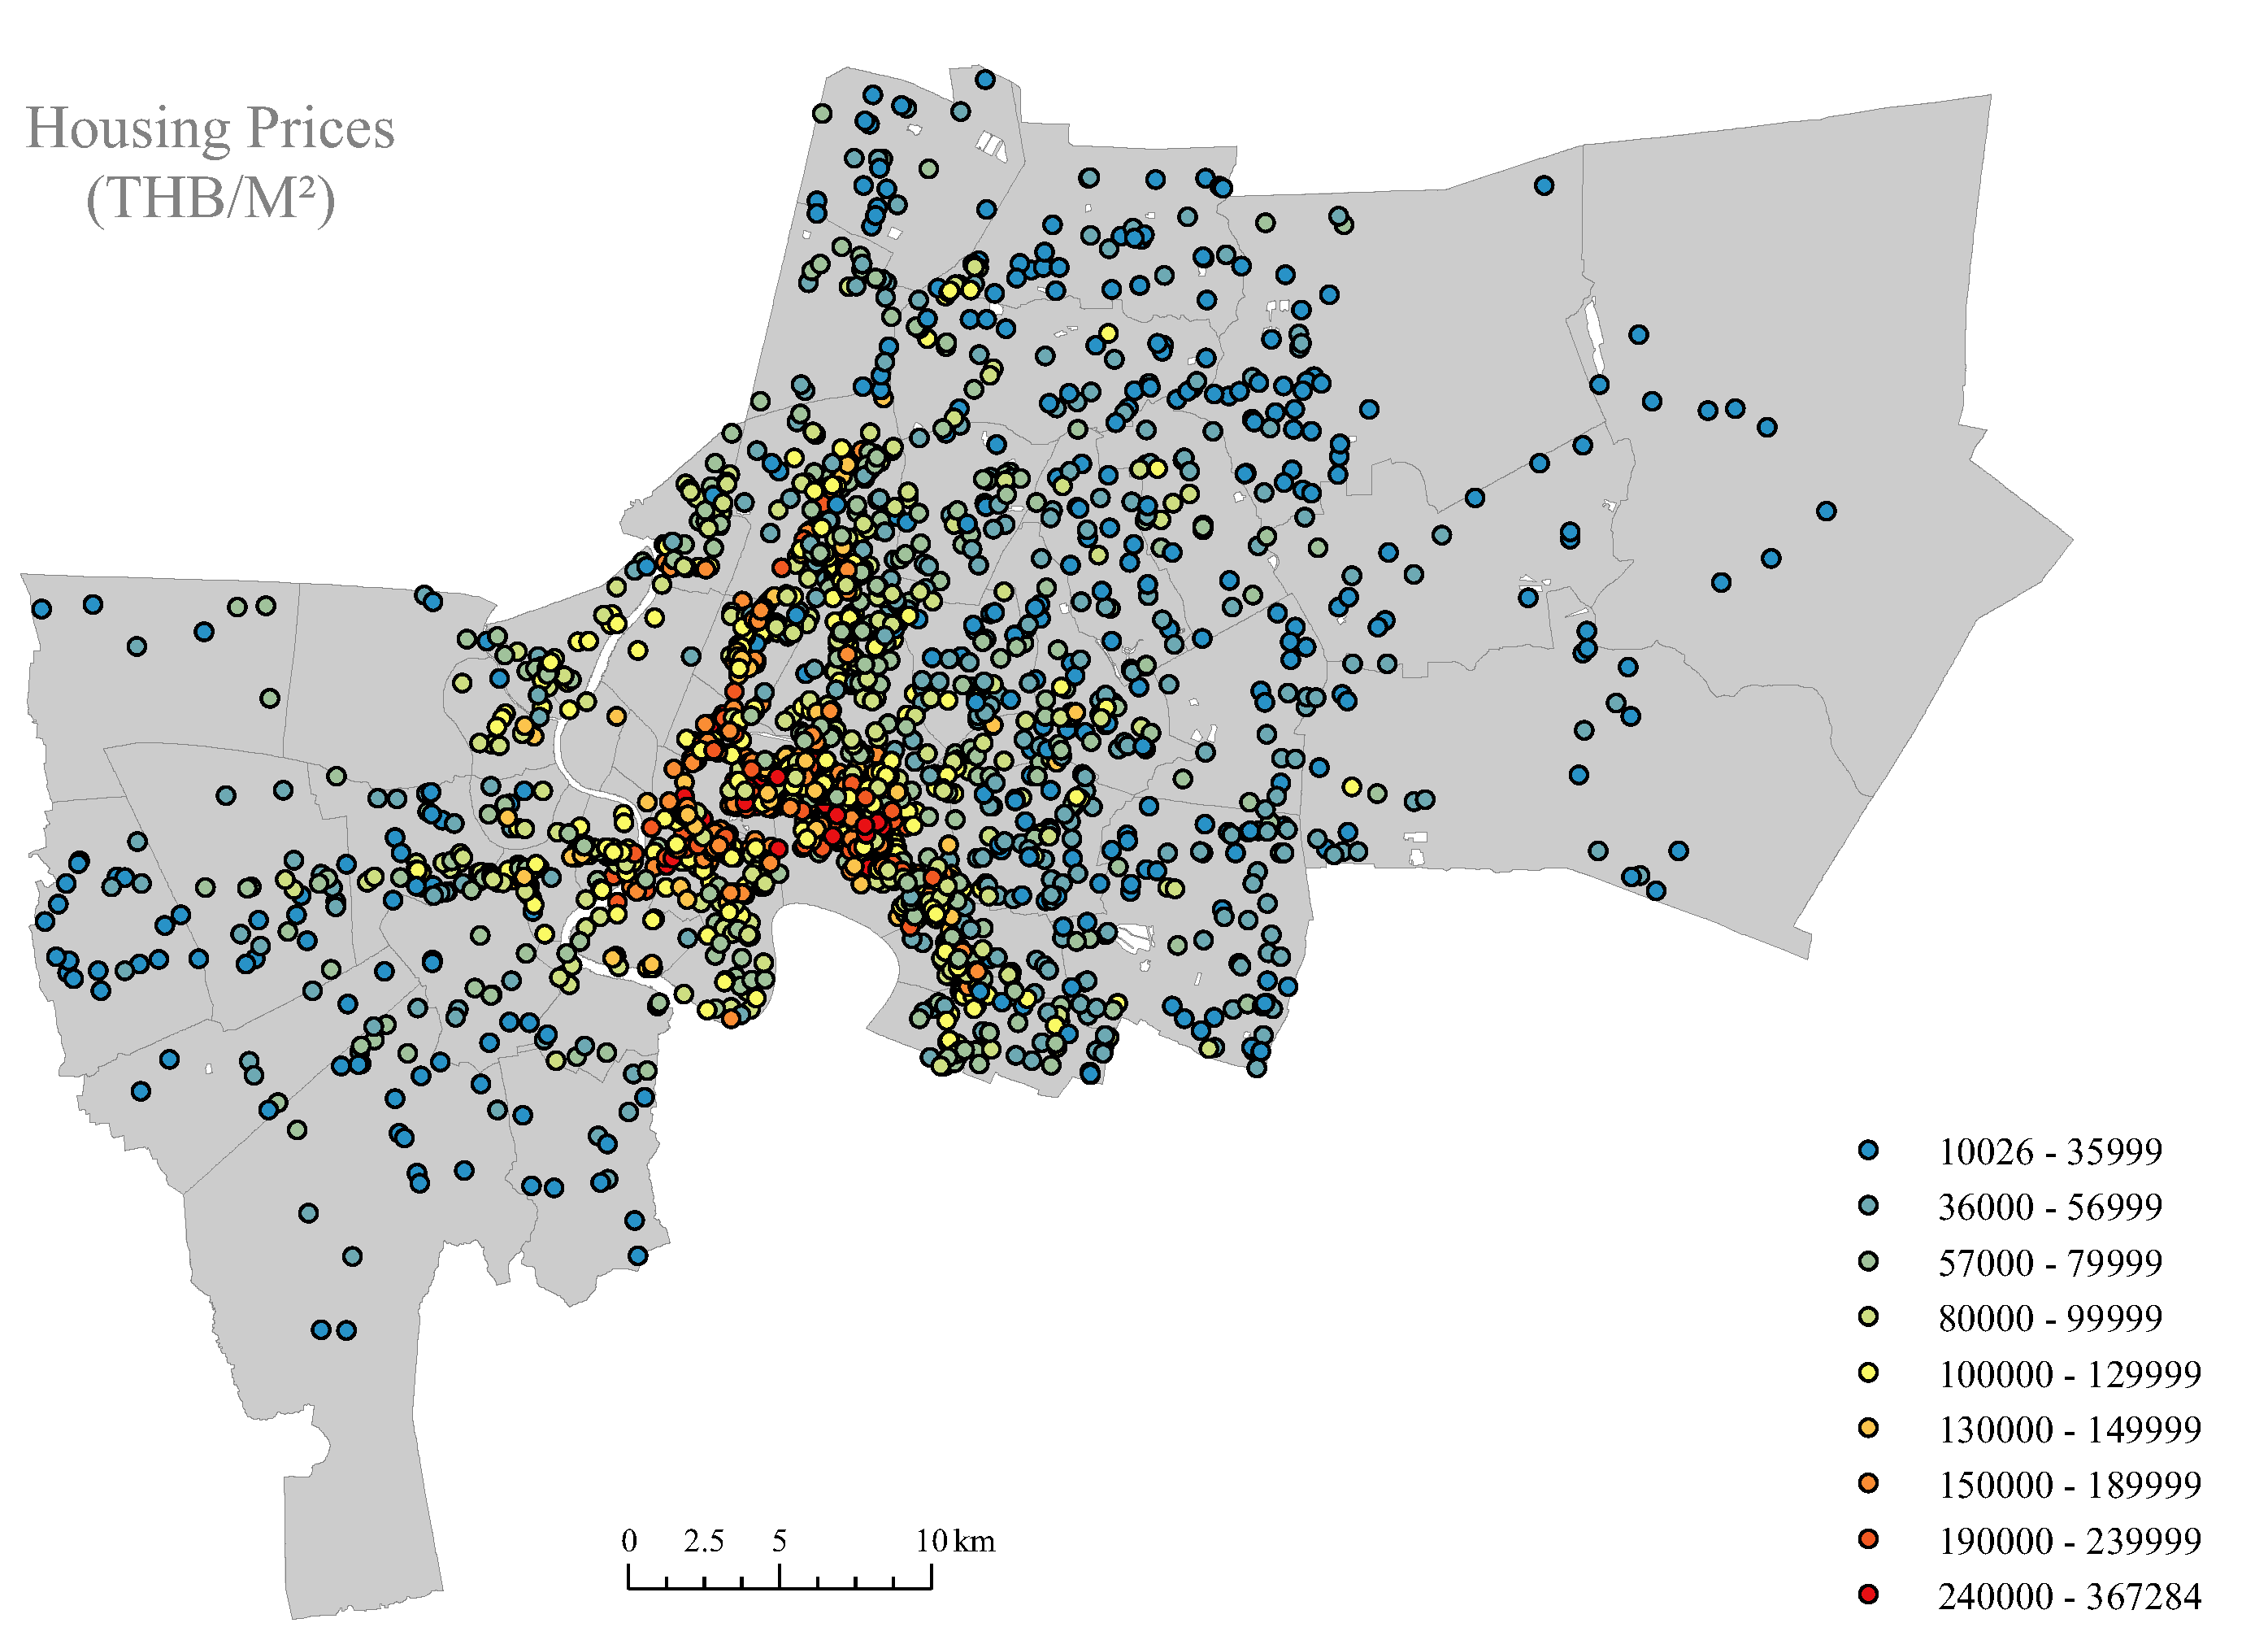
Fazwaz is the Thailand’s largest multilingual real estate brokerage platform founded in 2015. With the most comprehensive and authentic housing information in Thailand, Fazwaz is committed to providing buyers and sellers with secure and transparent transaction services to help them make sound decisions. From the Fazwaz platform, we collected information on 13,175 residences for sale from 2076 different neighborhoods in Bangkok. The collected information included housing prices, location of neighborhood, housing age and furniture status. Residences in the same neighborhood generally have the same location characteristics, so we ignored internal differences inside any neighborhood and focused on the effects of various influential factors on housing prices at the neighborhood level. The average housing price ranged from 10,026 THB/m2 to 367,284 THB/m2, with a mean of 93,530 THB/m2 (Figure 2). The highest housing prices were mainly distributed in the downtown areas on the east bank of the Chao Phraya River (e.g., Pathum Wan, Silom/Sathon, Sukhumvit). From downtown outwards, housing prices gradually decreased.
OpenStreetMap (OSM) can provide an open, freely available map database covering all regions of the world, including geographic information such as roads, buildings, facilities, and administrative boundaries. By utilizing OSM, we selected the following facilities that may affect housing prices in Bangkok: education (prestigious primary school, prestigious secondary school), medical care (general hospital), public transport (metro station, bus stop, train track, gas station), scenery (green space, Chao Phraya River), and business (central business district (CBD), shopping mall, supermarket).

3. Models

The simple ordinary least square (OLS) regression can be used to analyze the effect of various influential factors on housing prices. Due to spatial heterogeneity, the OLS model provides limited explanations for housing price formation mechanisms. Brunsdon et al. [29] proposed a local regression model: geographically weighted regression (GWR). GWR relaxes the assumption of spatial stationarity by allowing the coefficient to change with space, so it can capture the spatial heterogeneity of the relationships between variables in the geographic space better than the OLS. GWR introduces a weight matrix to indicate the influence of surrounding observations on the coefficient estimation of the target object, and the adjacent observations are always assigned a greater contribution to the coefficient estimation. In the real world, the relationships between the dependent variable and the independent variables may appear at different spatial scales. Fotheringham et al. [30] further expanded the fixed bandwidth to multiple bandwidths and then proposed multiscale geographically weighted regression (MGWR), which dynamically adjusts the optimal bandwidth of each independent variable to adapt to the spatial relationship of the data at different scales. Compared with GWR, MGWR has the following improvements: the different influence scales of various variables can reduce the noise interference; the specific bandwidth of a variable reflects its sphere of influence; and the inclusion of multiscale effects provides better explanations for housing price mechanisms, with significant spatial heterogeneity.

3.1. Conceptual Model

In this study, we used the multiscale geographically weighted regression (MGWR) to estimate marginal prices for different factors influencing the final housing sale prices. The whole process is divided into several steps:
Step 1: We used Fazwaz to collect the list prices and internal feature information of 13,175 on-line residences from 2076 different neighborhoods in Bangkok, and we used OpenStreetMap to collect facility information in Bangkok: education (prestigious primary school, prestigious secondary school), medical care (general hospital), public transport (metro station, bus stop, train track, gas station), scenery (green space, Chao Phraya River), and business (central business district (CBD), shopping mall, supermarket). Since 13,175 residences in Bangkok were on sale during the past two years and were impacted significantly by existing facilities near residences, the analysis of these prices can reveal the degree of the impact and scope of the existing facilities.
Step 2: The accessibility distance to some residence is the pathway and mechanism through which different facilities influence the sale price of this residence. This is because whether a residence is close to various facilities can determine the life quality of persons living in this residence. Therefore, in this study, we preprocessed facility data using the Euclidean distance, travel distance, distance score, and facility density to measure facility accessibility (see Section 3.2).
Step 3. In order to delete potential endogeneity, statistical insignificance, and multicollinearity, we employed the method of the stepwise OLS to screen all explanatory variables. Finally, ten variables were retained, and five variables were omitted (see Section 3.3).
Step 4. We used three regression techniques (OLS, GWR, and MGWR) to model spatial changes in housing prices in Bangkok and found that MGWR can more accurately explain almost all of the spatial heterogeneity of housing prices in Bangkok due to the fact that MGWR assigns an optimal bandwidth to each influential factor (see Section 3.4). Since MGWR coefficients can measure the spatial heterogeneity of facility impact degrees on housing prices in Bangkok, which reflect the imbalance of urban facilities and services and is leading to the existence of significantly spatial injustice among Bangkok residents, we can provide some suggestions and recommendations for the land use policy of the Bangkok government in order to finally achieve the aim of spatial justice in the land use of Bangkok.

3.2. Preprocessing

Considering different effects of various facilities, the Euclidean distance, travel distance, distance score, and facility density were used to measure their accessibility. Euclidean distance (ED) considers the straight-line distance under the projected geographic coordinates system, while the travel distance (TD) considers road complexity. Bing Maps API provides both walking and driving options to calculate the travel distance. Due to road traffic restrictions, the routes and resulting distances for walking and driving are slightly different. In order to be consistent with the actual mode of transportation for each resident, if the Euclidean distance is less than 5 km, we calculated the travel distance by the walking route, otherwise we considered the driving route. The usefulness of any facility is greatly reduced outside the service area. The distance score (DS) was based on such an attenuation effect. We set up four buffers for neighborhoods within the maximum buffer and calculated different distance scores as follows:
F i = S 1 × 1 d i d , d i D 1 , S 2 × 1 d i d , D 1 < d i D 2 , S 3 × 1 d i d , D 2 < d i D 3 , a × 1 d i d , d i > D 3 ,
d = max d 1 , d 2 , , d N ,
For neighborhood i , F i is its score for a specific facility, d i is the minimum distance from neighborhood i to that facility, D j is the distance boundary, S j corresponds to the score within the distance range, a is the attenuation factor, and N is the number of neighborhoods in the service radius of the specific facility. The distance boundaries of facilities were determined with [11], and the score setting and scoring criteria are shown in Table 1.
The facility density (FD) was obtained by calculating the kernel density of the facility around the neighborhood as follows:
A j = 1 r 2 i = 1 N 3 π w i 1 d i j r 2 2 ,
where A j is the facility density around the neighborhood j , r is the search radius, N is the number of particular facilities within the service radius of neighborhood j , d i j is the travel distance from neighborhood j to facility i , and w i is the weight of the facility.
In this study, the average housing prices (THB/m2) of neighborhoods were set as the dependent variable, while two kinds of variables were taken as explanatory variables: attributes of the neighborhood and accessibility to public facilities (Table 2). Four measurements (ED, TD, DS, FD) were used to assess the accessibility to different facilities. Among all explanatory variables, neighborhood attributes determine living conditions, the accessibility to public transport facilities determines commuting times, the accessibility to education and medical facilities can affect children’s growth and seniors’ health, the accessibility to scenery facilities reflects the quality of the living environment, and the accessibility to business facilities guarantees convenience in daily life. The distance to green spaces and the Chao Phraya River reflects a positive environmental quality, the distance to train tracks reflects a negative environmental quality (i.e., noise effect), and the distance to a gas station reflects safety. The distance to prestigious primary/secondary schools reflects the education reputation, while the distance to the CBD reflects the business reputation, so these explanatory variables are necessary for each resident and possibly have effects on housing prices.

3.3. Selection of Variables

All fifteen explanatory variables in Table 2 were reanalyzed to eliminate dimensional and variance differences in order to guarantee a fair comparison among influential factors. In order to exclude potential endogeneity, statistical insignificance, and multicollinearity, we employed the method of the stepwise OLS to screen all explanatory variables. Finally, ten variables were retained, and five variables were omitted (Table 3).
First of all, we focused on five omitted explanatory variables (Pop_Den, Hospital_D, Rail_E, Gas_E, and River_E) and explored why their effects were ignorable. Bangkok’s permanent population has increased from about 6 million in 2000 to more than 10 million at present, and its population has gradually entered a stage of high-quality growth, and the spatial distribution mechanism of the population has become mature. In the context of the diminishing marginal benefits of population density in terms of urbanization and the production of new housing, the effect of population density on housing prices was ignored. Bangkok has abundant medical resources in Thailand and is known as one of the destinations for medical tourism [25], driving the rational planning of medical resources and producing ignorable effects on housing prices in Bangkok. Due to the relocation of Bangkok’s railway hub from Hua Lamphong Station to Bang Sue Grand Station in the north suburb, the frequency of trains within core areas has been greatly reduced. Moreover, most of the rail lines run on the suburbs with a low residential density, leading to negative effects of train tracks on housing prices being negligible. Gas stations are concentrated in densely populated areas, and more than 72.2% of the neighborhoods are less than 1 km away from gas stations. Due to the wide/uniform distribution of gas stations and the high demand for housing in densely populated areas, the negative externalities of gas stations have no spatial difference and can be ignored. Noticing that most of the neighborhoods along the Chao Phraya River are concentrated in commercial districts, the accessibility to the Chao Phraya River and the accessibility to businesses appear as multicollinearities in the modeling process. Compared to the higher impacts of the accessibility to businesses, the Chao Phraya River’s effect on housing prices was omitted.

3.4. Model Comparison

We used three regression techniques (OLS, GWR, MGWR) for the hedonic price analysis of housing prices in Bangkok. The modeling performance is demonstrated in Table 4 in terms of three assessment criterions: a higher adjusted R-square (Adj.R2) means that the model can explain the relationships between dependent and explanatory variables more adequately, and the lower the Akaike Information Criterion corrected (AICc) and residual sum of squares, the better the fitting effect of the model. Both GWR and MGWR have significant improvement over OLS in all assessment criteria, due to the fact that these two models spatialize the model parameters by introducing the bandwidth and weight function, resulting in the ability to effectively capture spatial effects. Compared with GWR, the Adj.R2 of MGWR was higher, and the AICc and residual sum of squares were lower, which demonstrates that MGWR can more accurately explain the spatial heterogeneity of housing prices in Bangkok due to the introduction of multiple bandwidths.
The MGWR-based hedonic price analysis assigns an optimal bandwidth to each influential factor, ranging from 44 to 2074, and the specific bandwidths and coefficients are shown in Table 5. The bandwidths of Furniture, PriSch_S, Green_D, Smarket_S, and CBD_D exceeded 2000, which are close to the global scale, meaning that MGWR is more global in estimating the coefficients of these influential factors. Conversely, the coefficient estimates for Intercept, Age, Metro_S, and Bstop_Den are more localized. Moreover, the MGWR results show that the effects of Intercept and Metro_S on housing prices demonstrate significant spatial heterogeneity, but the effects of five factors demonstrate spatial homogeneity: Furniture, Green_D, and CBD_D are negatively correlated with housing prices, while SecSch_S and Smarket_S have positive effects on housing prices.

4. Results

Since MGWR enables a direct measurement of the multiscale variation among different influential factors, we used the MGWR coefficients associated with different factors to mine complex links between housing prices and spatial neighborhood attributes.

4.1. Location

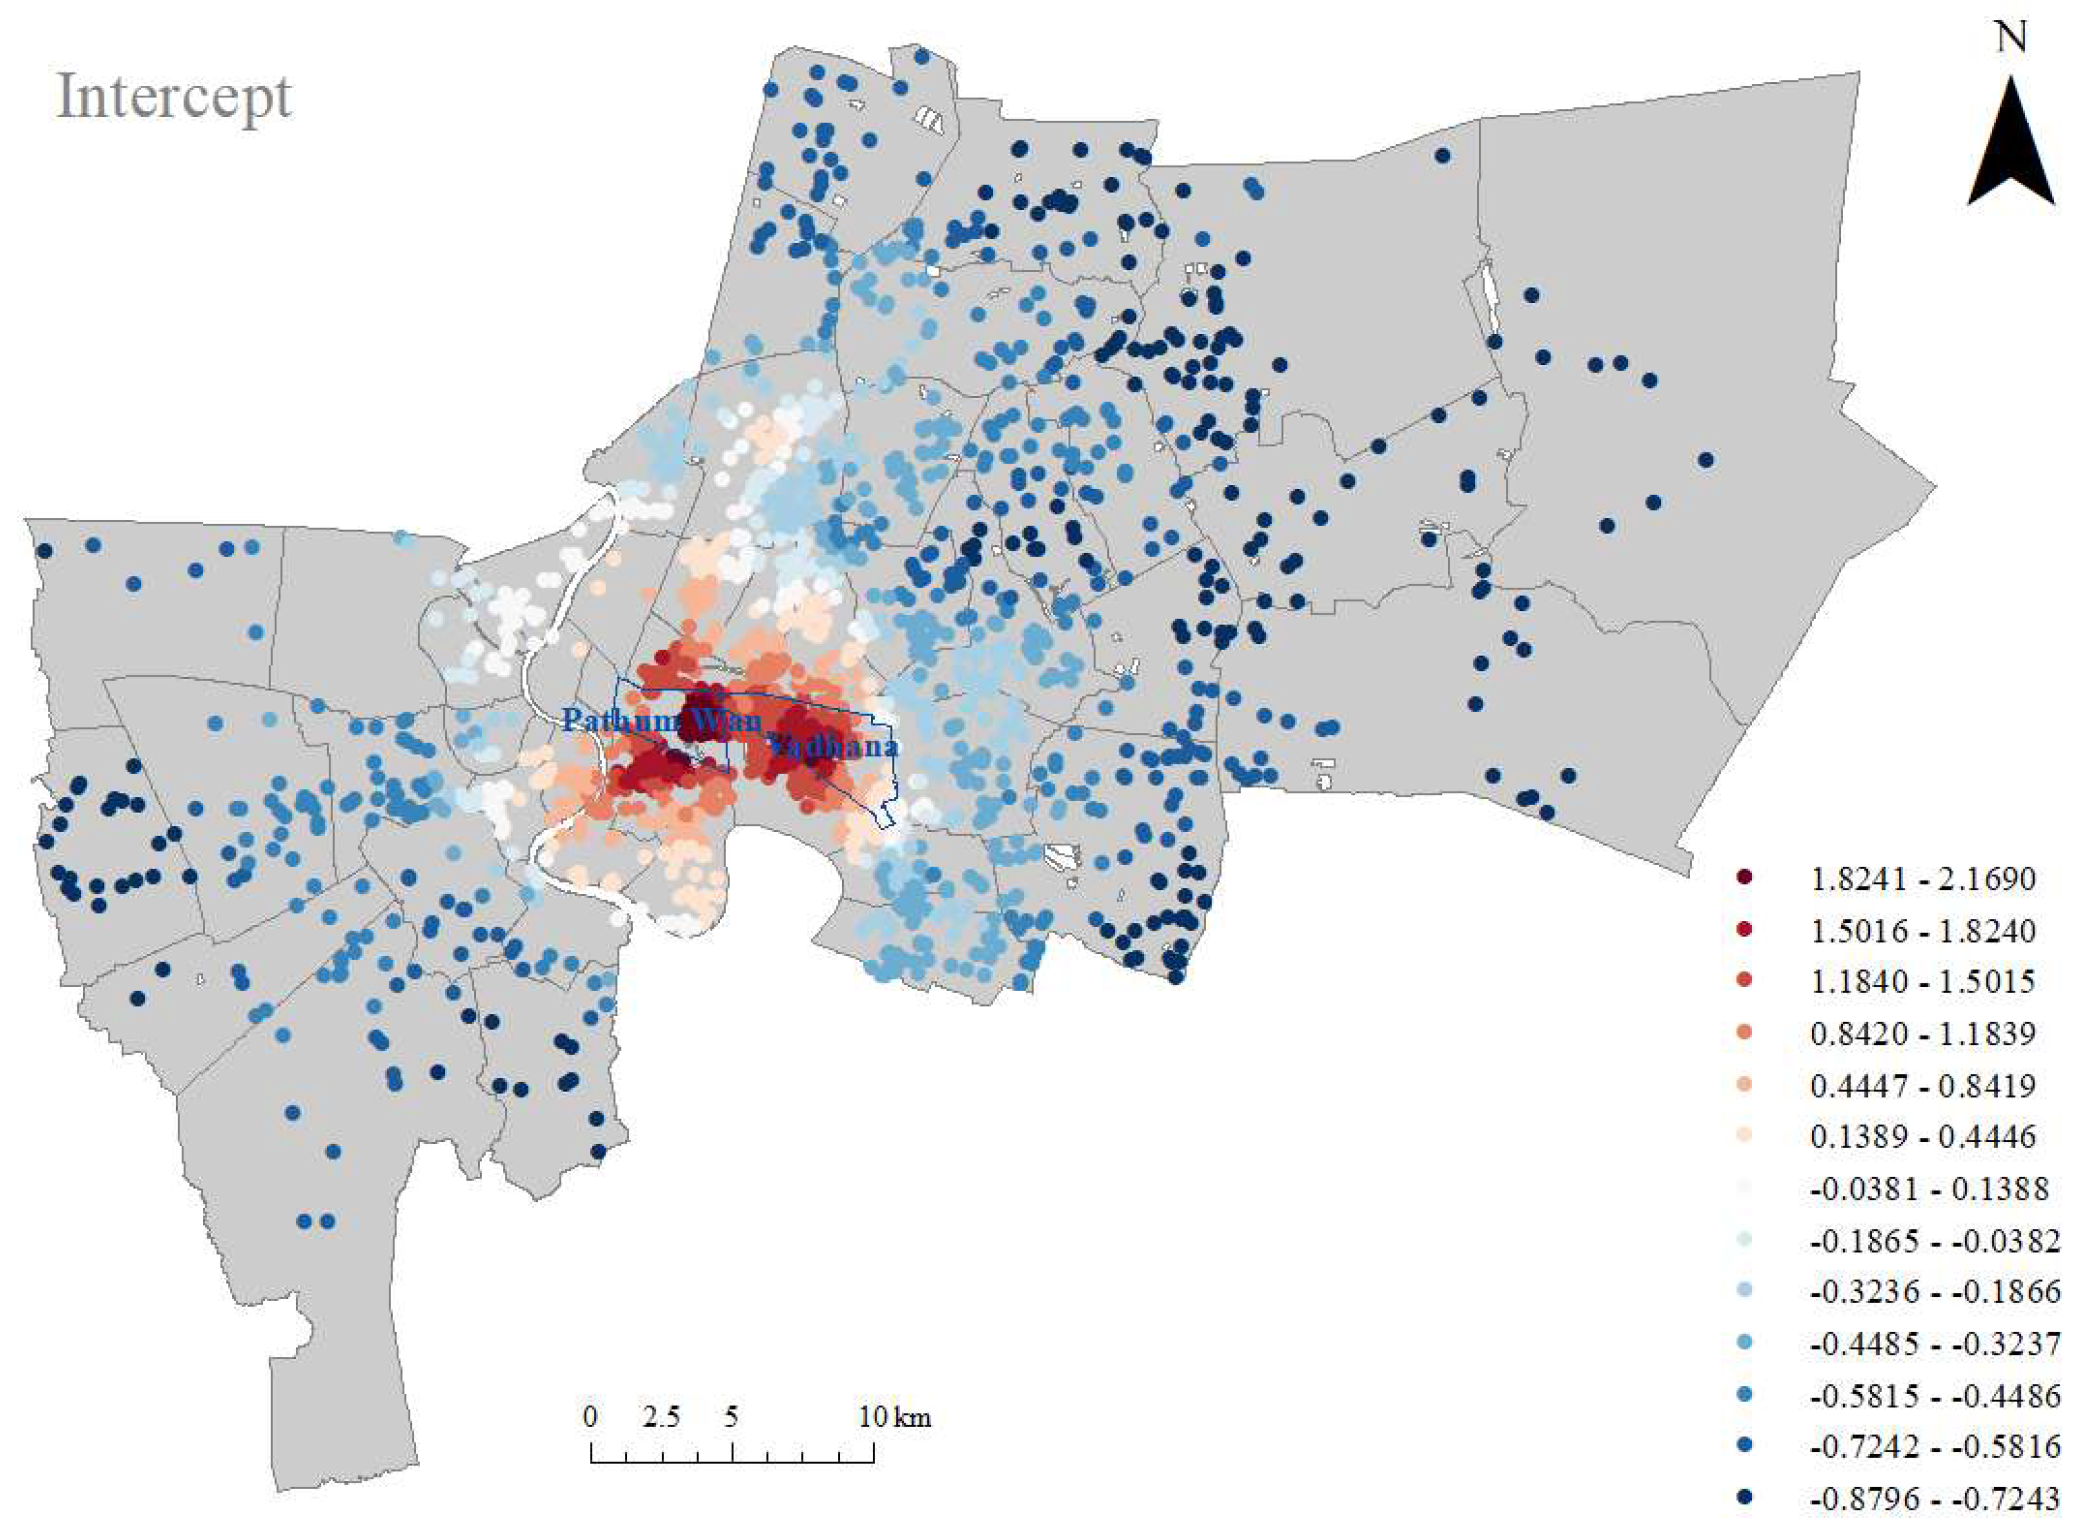
The intercept in MGWR modeling reflects the effect of location on housing prices and demonstrates statistically significant spatial heterogeneity throughout the whole of Bangkok (Figure 3). The closer to downtown areas, the greater the location effect on housing prices. The largest effect degree appears in Pathum Wan, Silom/Sathon, and Sukhumvit, consistent with the highest housing prices in Bangkok. Downtown areas are commercial and financial centers of Bangkok and have a mixed commercial–employment–residential land use. Considering the very limited unplanned land left in the downtown, high profits of enterprises not only lead to a significant increase in housing prices but also cause significant pressure on residential land use. Meanwhile, such a mixed mode of land use has improved the convenience of life and work, leading to a further increase in housing prices. Therefore, any condominium located in downtown areas has a significant premium due to location factors. Conversely, housing prices in suburban areas are a negatively correlated location factor. Being far from downtown areas always causes various inconveniences in life and work, reducing the desire to purchase housing in suburban areas. Moreover, due to sufficient land supply, neighborhoods in suburban areas consist of mostly detached houses, but the land ownership regulations in Thailand restrict foreigners from buying detached houses, which in turn further reduces the demand for houses in suburban areas. With an average elevation of less than 2 m, flooding is a common natural disaster in Bangkok. Inadequate facilities and the conversion of former farmland have weakened the natural drainage capacity, causing suburban areas to be more vulnerable to flood hazards than downtown areas [31,32,33]. Weak flood prevention abilities in suburban areas of Bangkok possibly produce a negative impact on housing prices [34].

4.2. Age and Furniture Status

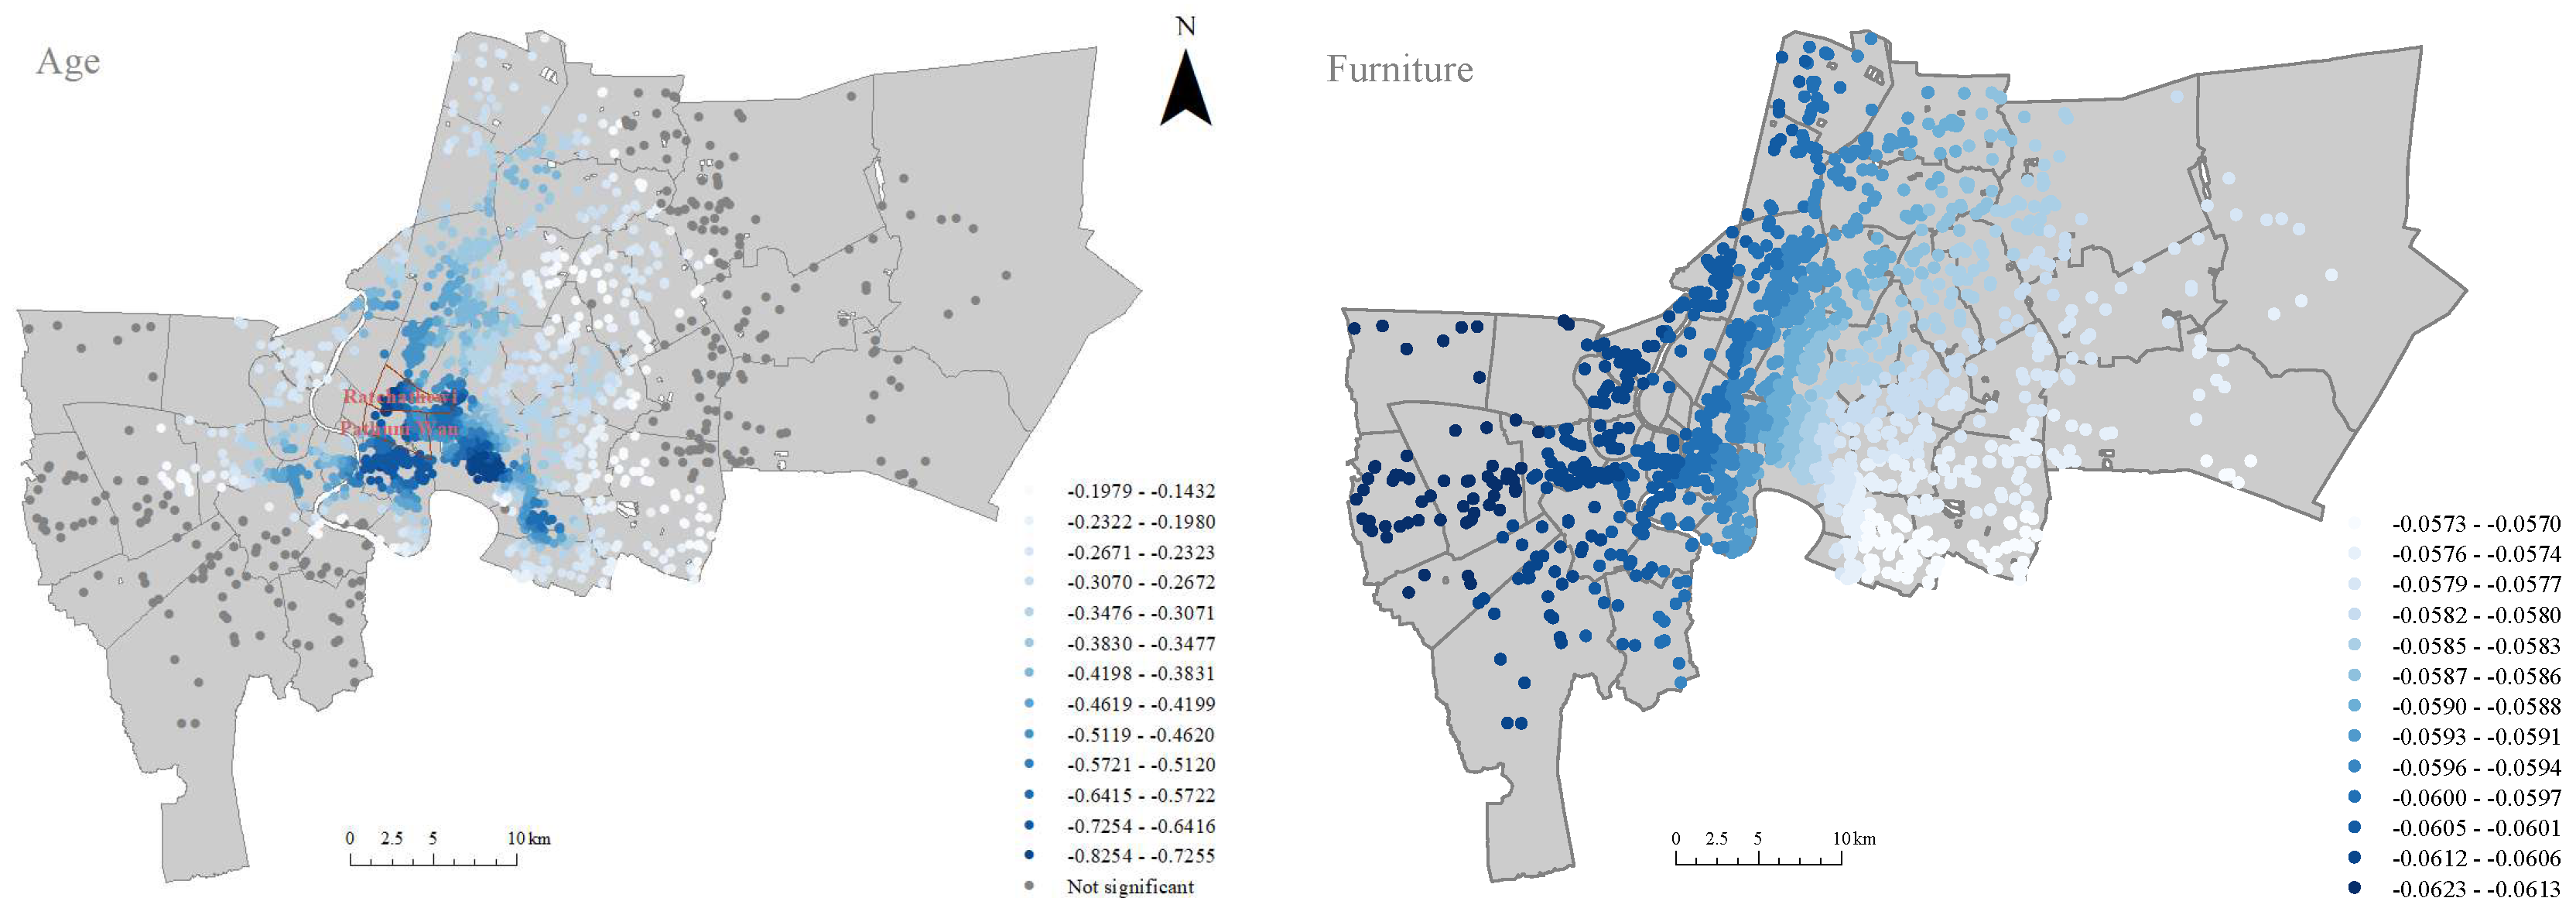
Generally, the housing price is negatively linked with housing age in the whole of Bangkok. Comparing the magnitude of the MGWR coefficient of the housing age and the MGWR intercept, we revealed that the spatial variation in housing age is much smaller than that of location (Figure 4). Housing age effects were statistically significant in downtown areas but insignificant in suburban areas. The main residential type in downtown areas is condominiums. Due to limited lifespans and the difficulty of obtaining bank loans, the younger the age of the condominium, the higher its value. Moreover, the unplanned land in downtown areas is almost exhausted, and newly built condominiums are scarce; combined with better property management and service, newly built condominiums are more attractive than old condominiums. However, in suburban areas, the housing age can be ignored. This is rooted in the difference in residential types. The main residential type in suburban areas is detached houses, while in downtown areas it is condominiums. The value of any detached house includes the value of the land it occupies, leading to significant reductions for the effect of the housing age. At the same time, due to a sufficient land supply with a low population density, relatively old detached houses in suburban areas are always located in mature communities, which are adjacent to various living facilities. This makes some old detached houses more attractive than young detached houses.
Very different from the location and housing age, the effect of the furniture status demonstrates spatial homogeneity with statistical significance, indicated by the fact that the variation range of the MGWR coefficient associated with the furniture status was less than 0.01 throughout the whole of Bangkok (Figure 4). Such spatial homogeneity is possibly driven by overseas demand. As a popular tourist destination, most of the condominiums and detached houses are purchased or rented possibly by oversea investors and tourists who expect them to be equipped with furniture. This leads to the furniture of condominiums being provided by the developers, and detached houses are equipped due to the usage of previous families. At present, about 78.2% of the neighborhoods in Bangkok are fully furnished, and about 12.5% of the neighborhoods are partly furnished. Noticing that in our MGWR modeling a fully furnished status is assigned a score of one and a no furniture status is assigned a score of three, the negativity of the MGWR coefficient associated with furniture means that a fully furnished status can increase housing prices. Due to the fact that the value of furniture is much lower than that of houses, the increase in housing prices is very limited, which demonstrates very small magnitudes of the MGWR coefficient associated with furniture status.

4.3. Green Space

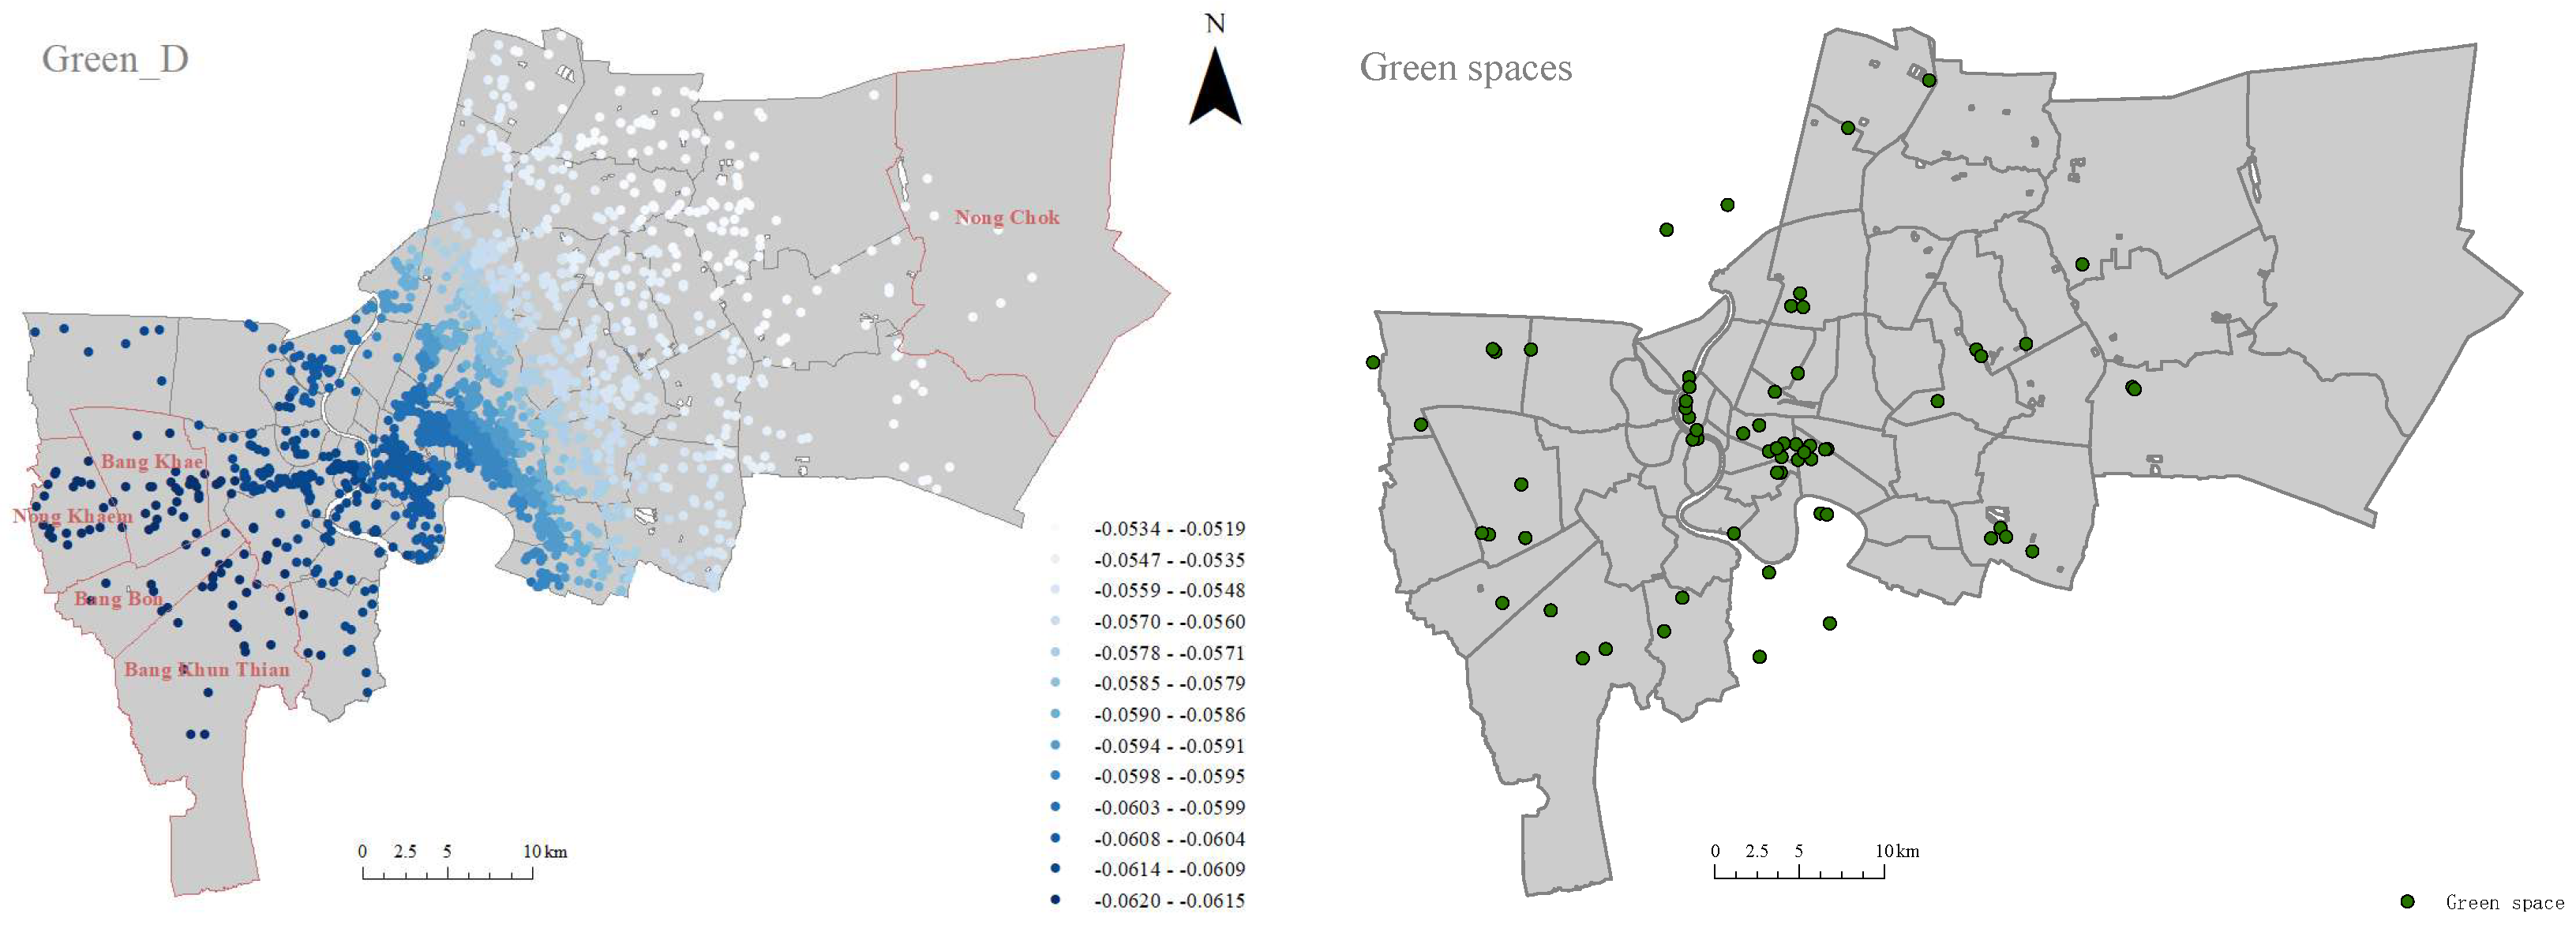
Municipal green space has added value for adjacent housing. Our MGWR coefficient linked with the minimum distance to green space was always negative throughout the whole of Bangkok (Figure 5). Moreover, the p-value of these coeffiecient values was always less than 0.05, passing the statistical significance test. This indicates that being away from green spaces can significantly reduce the value of houses. Western suburbs, including Bang Khun Thian, Bang Bon, Nong Khaem, and Bang Khae, demonstrate a greater effect of green space on housing prices than in the eastern subsurbs. Far from downtown areas on the east bank of the Chao Phraya River, western suburbs consist of low-density residential zones (i.e., detached houses) and have only some established green spaces with a sparse distribution. Green space generally offers local residents a convenient space for both exercise and relaxation, so the largest effect appears in western suburbs. Compared with western suburbs, the effect was minimal in eastern suburbs. Since eastern suburbs have very limited green spaces, the long distance between green spaces and residential areas makes housing prices less susceptible to green spaces compared to other influential factors. Since plenty of green spaces exist in downtown areas and Chao Phraya riverbanks, any downtown condominium adjacent to green space means good environmental and atmospheric conditions, leading to significant impacts of green space on housing prices.

4.4. Education

Thailand’s government adopts an education for all policy [31,32]. Public education in Bangkok is free for all Thai children. Moreover, these public schools also admit foreign children when paying low fees [31]. Since the Thailand government has established a rule of 15 years of free education [32], it is very easy for children to be admitted to primary and secondary schools adjacent to their home. However, compared with private and international schools, public schools are often overcrowded and have low teaching quality. Therefore, we focused on 42 prestigious primary schools and 55 prestigious secondary schools in Bangkok, most of which are private and international schools and are located in the downtown and surrounding areas.
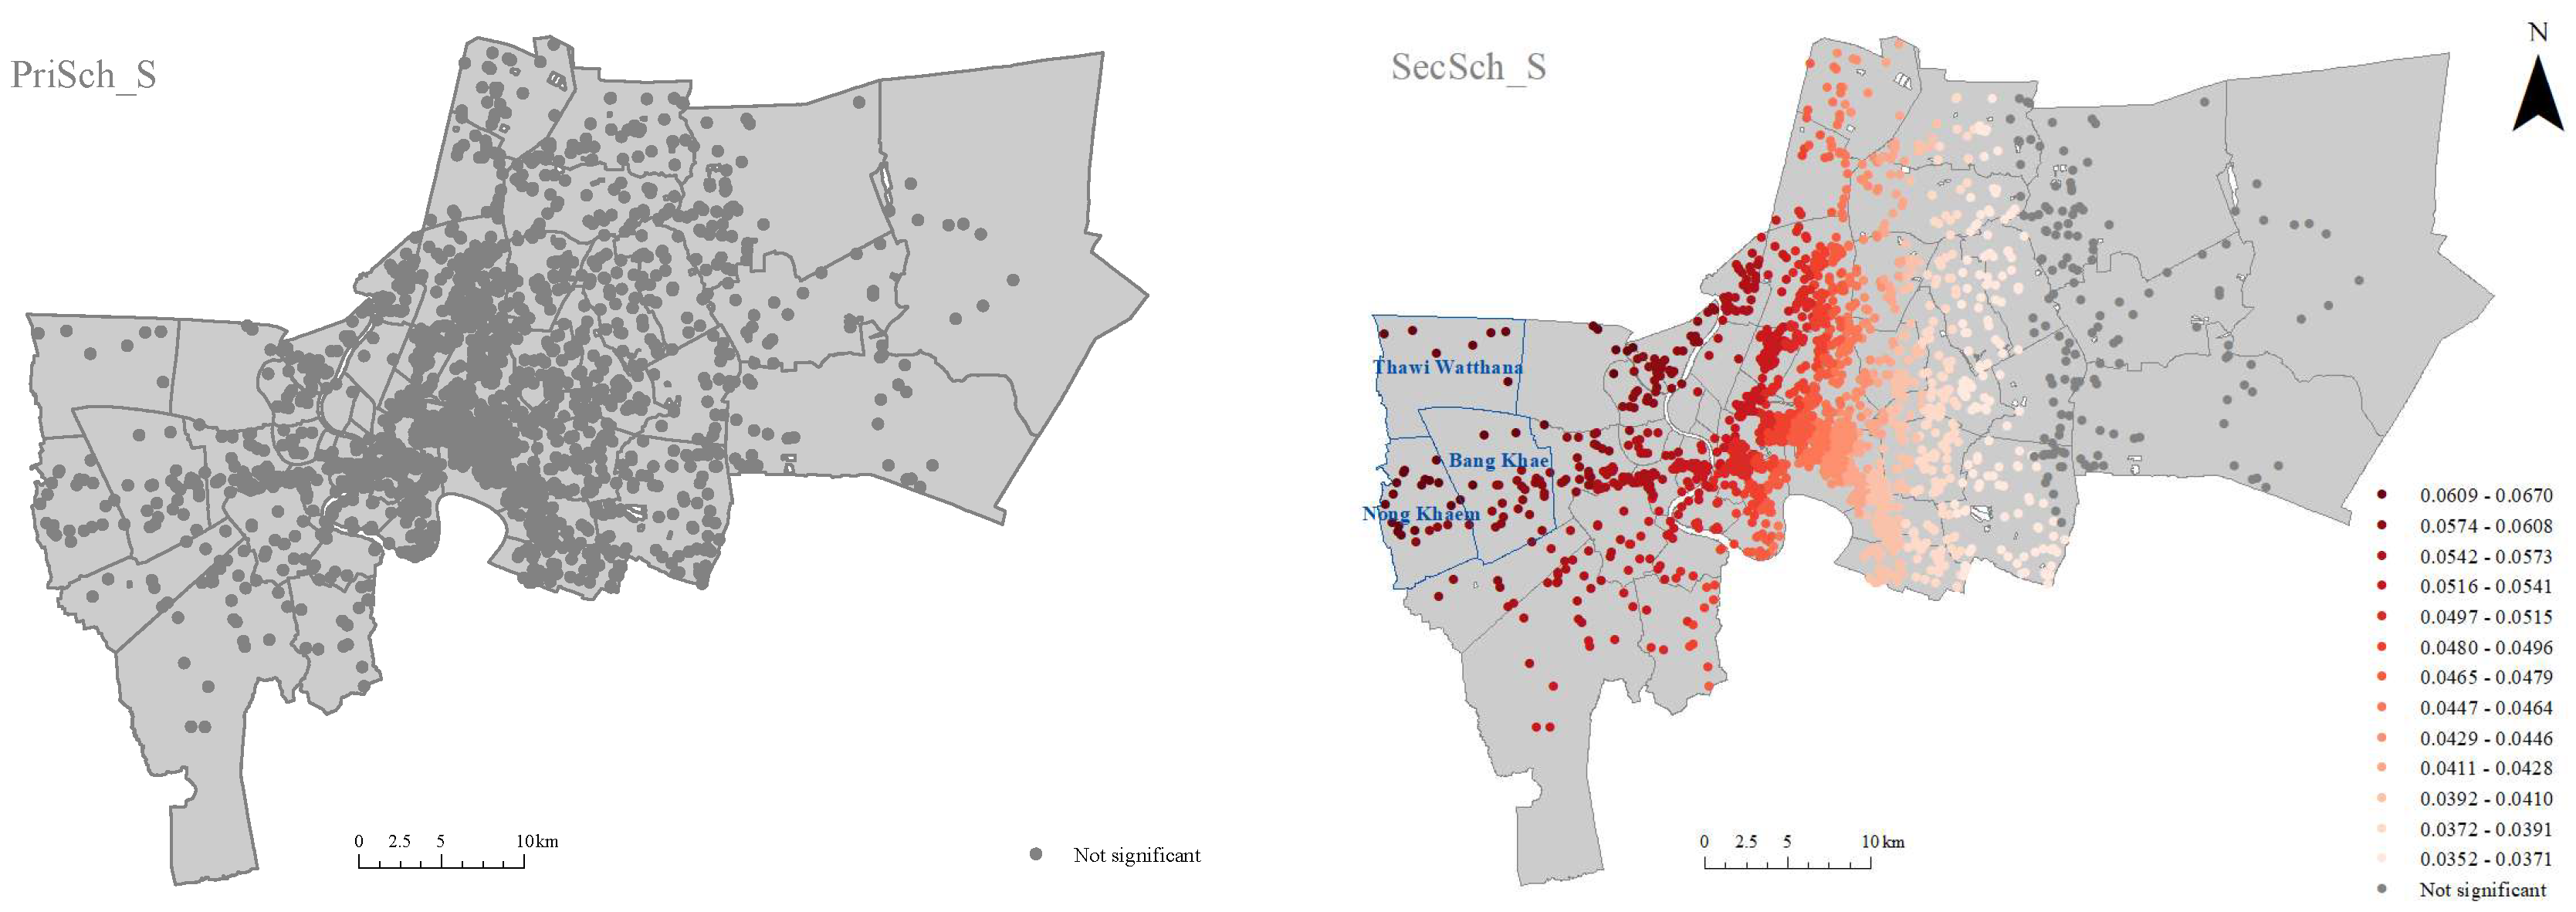
We examined the effect of the efficiency of commuting to prestigious schools on housing prices. Two MGWR coefficients associated with distance scores to primary and secondary schools, respectively, demonstrate that in Bangkok, the proximity to prestigious schools had a positive effect on housing prices (Figure 6). Moreover, the effect of primary and secondary schools shares similar spatial patterns (high in the west and low in the east). Although both the western and eastern suburbs of Bangkok lack prestigious schools, the western suburbs were more sensitive to school accessibility than eastern suburbs, mainly due to the difference in the demographic composition and education needs. Labor-intensive industrial and agricultural production significantly distributed in eastern suburbs attracted a large number of migrant workers, who are not able to afford these prestigious schools with their high fees. The magnitude difference in two MGWR coefficients associated with primary and secondary schools, respectively, shows that secondary schools have a greater effect than primary schools on determining housing prices. Secondary schools play a key role in children’s future entry into universities, leading to many families paying more attention to whether they are adjacent to a prestigious secondary school or not, which in turn affects housing prices further. The significance test of two MGWR coefficients further confirms this point. The MGWR coefficient linked with primary schools was not statistically significant in all regions of Bangkok, while that linked with secondary schools was statistically significant in all regions except for the eastern suburbs.

4.5. Public Transport

Due to uneven urban development and poor road planning, Bangkok is the second-most traffic-congested city in the world, just behind Mexico City. Faced with the pressure of housing prices in the core areas of Bangkok, local residents always prefer homes that can easily reach public transport but are a little far from working places. Moreover, the accessibility to some public transport projects that are still in the planning stages can also have a positive effect on housing prices.
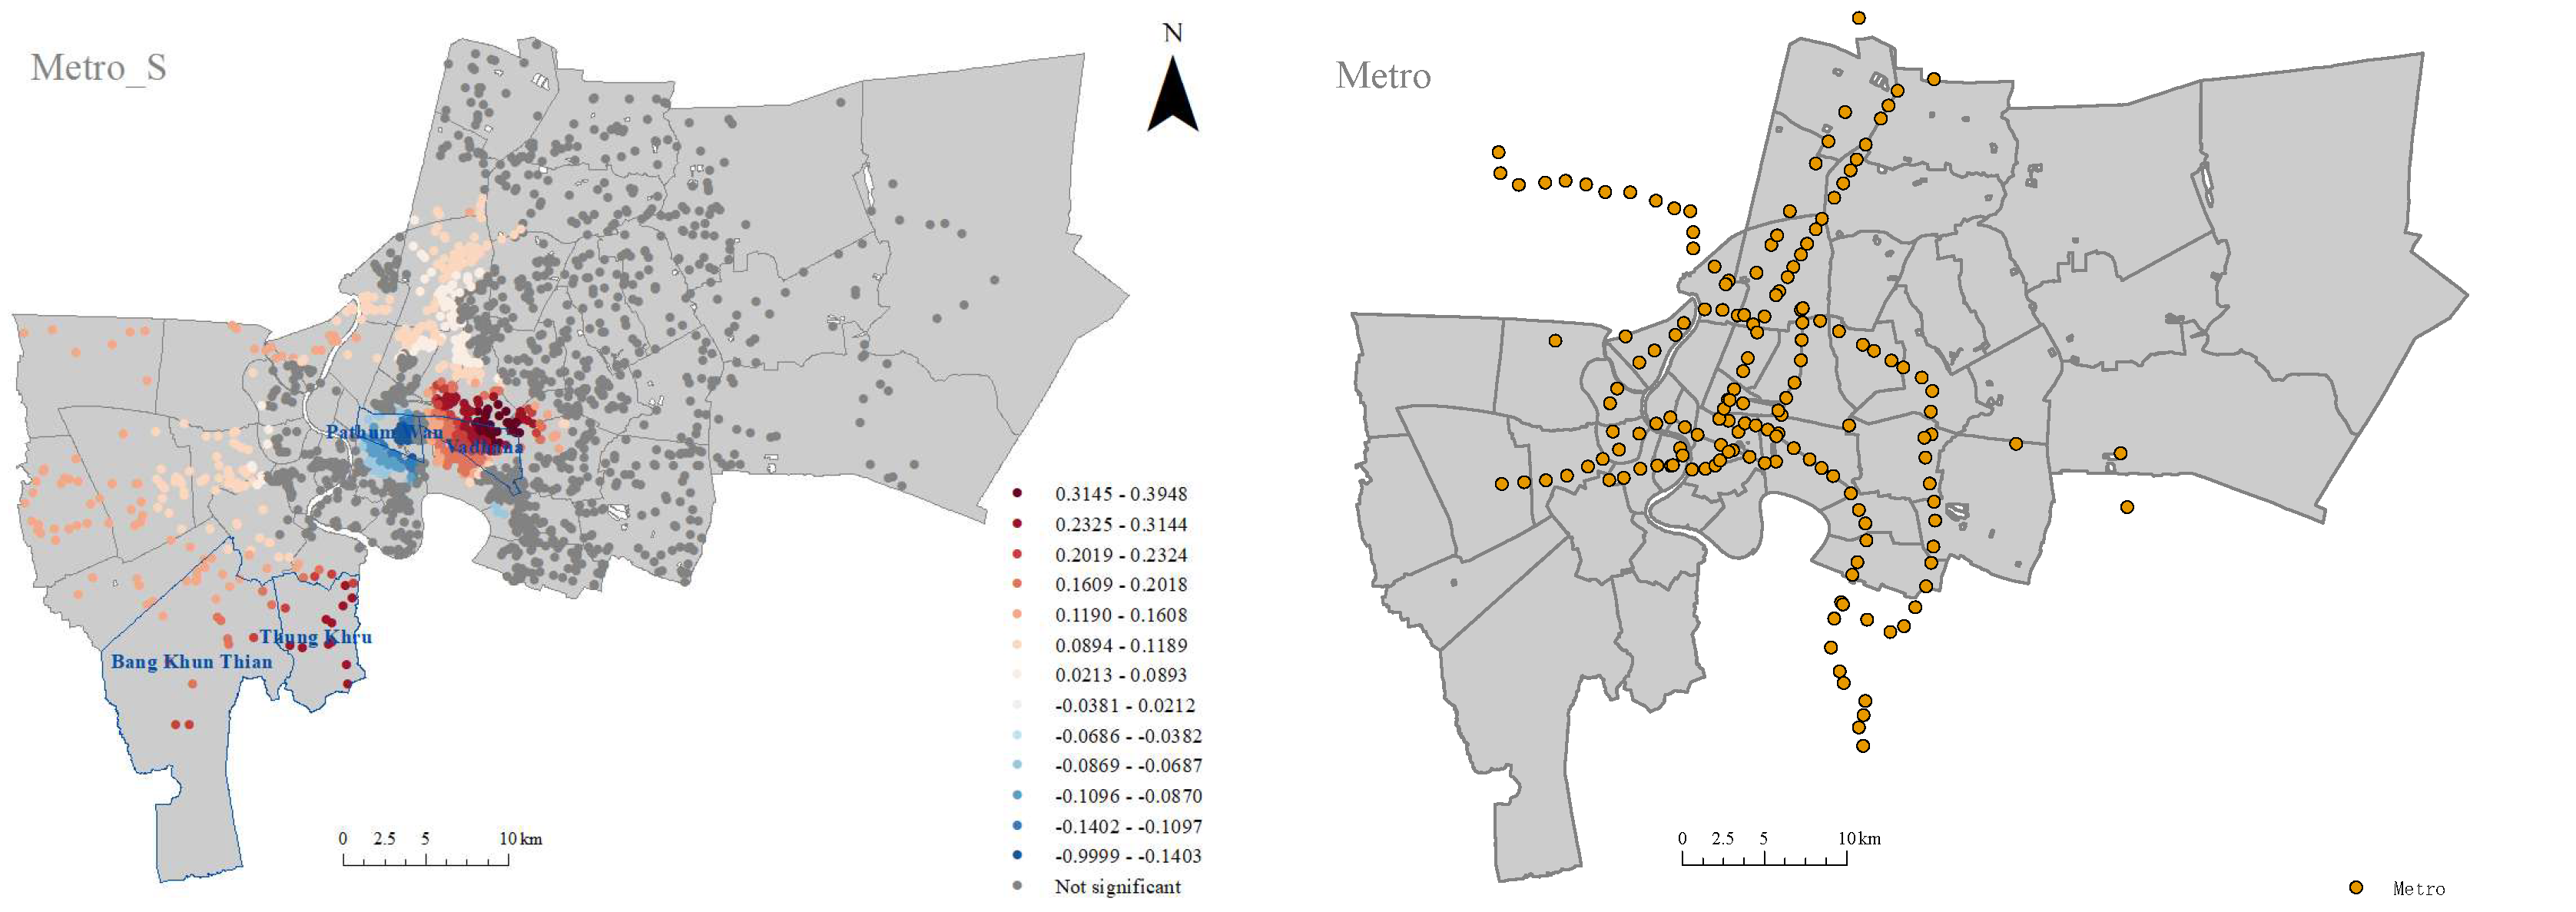
The heaviest congestion in Bangkok always occurs around 17:00 and 18:00. The metro system in Bangkok is the only approach to avoid such a rush hour and reduce commuting times. The MGWR coefficient of distance score to metro stations demonstrates significant spatial heterogeneity (Figure 7). Saving on commuting costs and facilitating accessibility are prominent advantages that metro stations offer to the surrounding neighborhoods. Consequently, adjacency to metro stations was positively correlated with housing prices in almost all neighborhoods of Bangkok. Compared with east suburbs, the effect of adjacency to metro stations in western suburbs passed the statistical significance test. Western suburbs are far away from downtown areas, and metro transit can provide the only fast commute route to downtown areas. More planned metro lines (e.g., SRT extension) will further shorten the commuting time and greatly facilitate the lives of local residents in western suburbs, leading to potential house purchasers being concerned more with the distance to metro stations. Compared with western suburbs, eastern suburbs are far from metro stations, so the effects of the distance to metro stations may be ignored for housing prices. This is confirmed by the fact that the MGWR coefficient of distance score to metro stations did not pass the statistical significance test.
In central Bangkok, the effect of the distance to metro stations demonstrates significant spatial heterogeneity on housing prices: a negative effect in Pathum Wan and a positive effect in Vadhana of Sukhumvit. Pathum Wan is Bangkok’s commercial district with a vibrant economy. Pathum Wan has the highest density of metro stations in Bangkok. Such density does not increase the commuting efficiency of the neighborhoods but causes crowds and noisy environments. The adjacency to metro stations means a lower quality of life, leading to the appearance of negative effects. Compared with Pathum Wan, Vadhana of Sukhumvit own a very limited number of metro stations; the adjacency to metro stations can signifcantly reduce commuting times and costs. Moreover, Vadhana has complete supporting facilities and relatively cheap housing prices, which is an ideal residence for urban workers. Since metro transportation can help to alleviate the high commuting demand of residents, housing prices in Vadhana are sensitive to the distance to metro stations. Near the Chao Phraya riverbank, since the convenience of river transportation can offset that of the metro transportation, the effect of the distance to metro stations was ignored; i.e., the MGWR coefficient of distance score to metro station did not pass the statistical significance test near both banks of the Chao Phraya River.
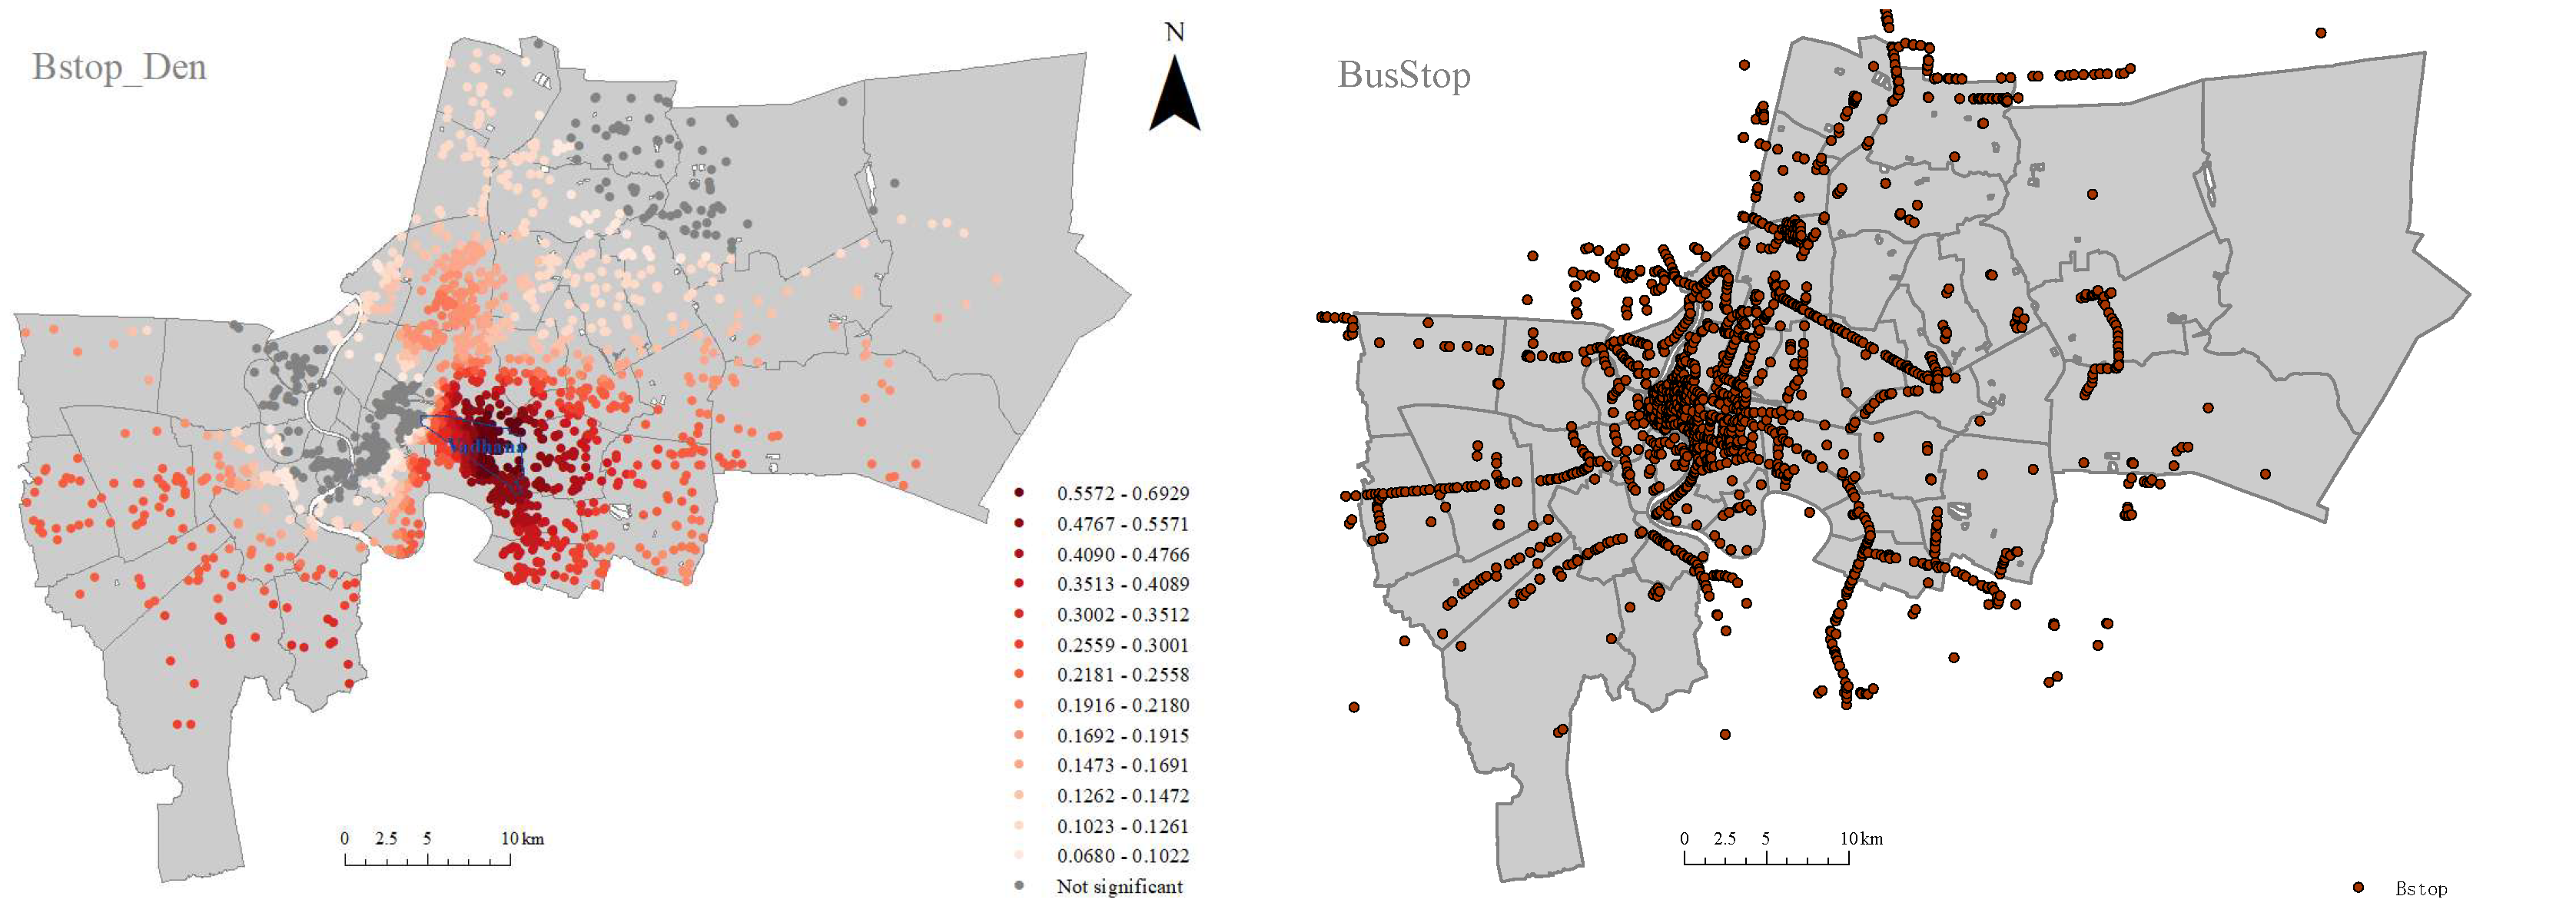
The MGWR coefficient of the bus stop density demonstrates statistical significance over almost the whole of Bangkok (Figure 8); especially, the effect of the accessibility to bus stops is stronger in the south and weaker in the north. Comparing the MGWR coefficient magnitudes of distance score to the metro station and bus stop density, bus transportation not only has a greater effect on metro transportation but also has a larger region with statistically significant effects. This may originate from the fact that bus stops have a higher density and are easier to access than metro stations. Vadhana in Sukhumvit, which is close to downtown areas, is the most sensitive to the accessibility to bus stops, while northeast suburbs are less affected. This may be related to the efficiency of commuting. Due to the scarcity of metro stations and traffic congestion, bus transportation is a more convenient way of commuting for local residents in Vadhana. The adjacency to bus stops can signifcantly reduce commuting times and costs, leading housing prices being affected by the bus stop density. Compared with this, few bus routes and stops exist in the sparse road network of northeastern suburbs, leading to the fact that it always takes a long time by bus to transfer to the downtown areas, so traveling by private car becomes more convenient and reduces residents’ reliance on bus transportation, and the further the effects of bus stop density may be ignored. Although the dense bus network results in high pedestrian accessibility, the effect of the bus stop density on housing prices in the old city and Pathum Wan was ignored. The old city contains famous sightseeing attractions, such as the Golden Buddha Temple and Chinatown. Pathum Wan is the main commerical district, which also attracts a large number of tourists. The very high bus stop density in fewer lanes of the old city and Pathum Wan mainly satisfy the high demand from tourists, not local residents, so it does not provide additional convinience for local residents but causes crowds and a noisy environment.

4.6. Business

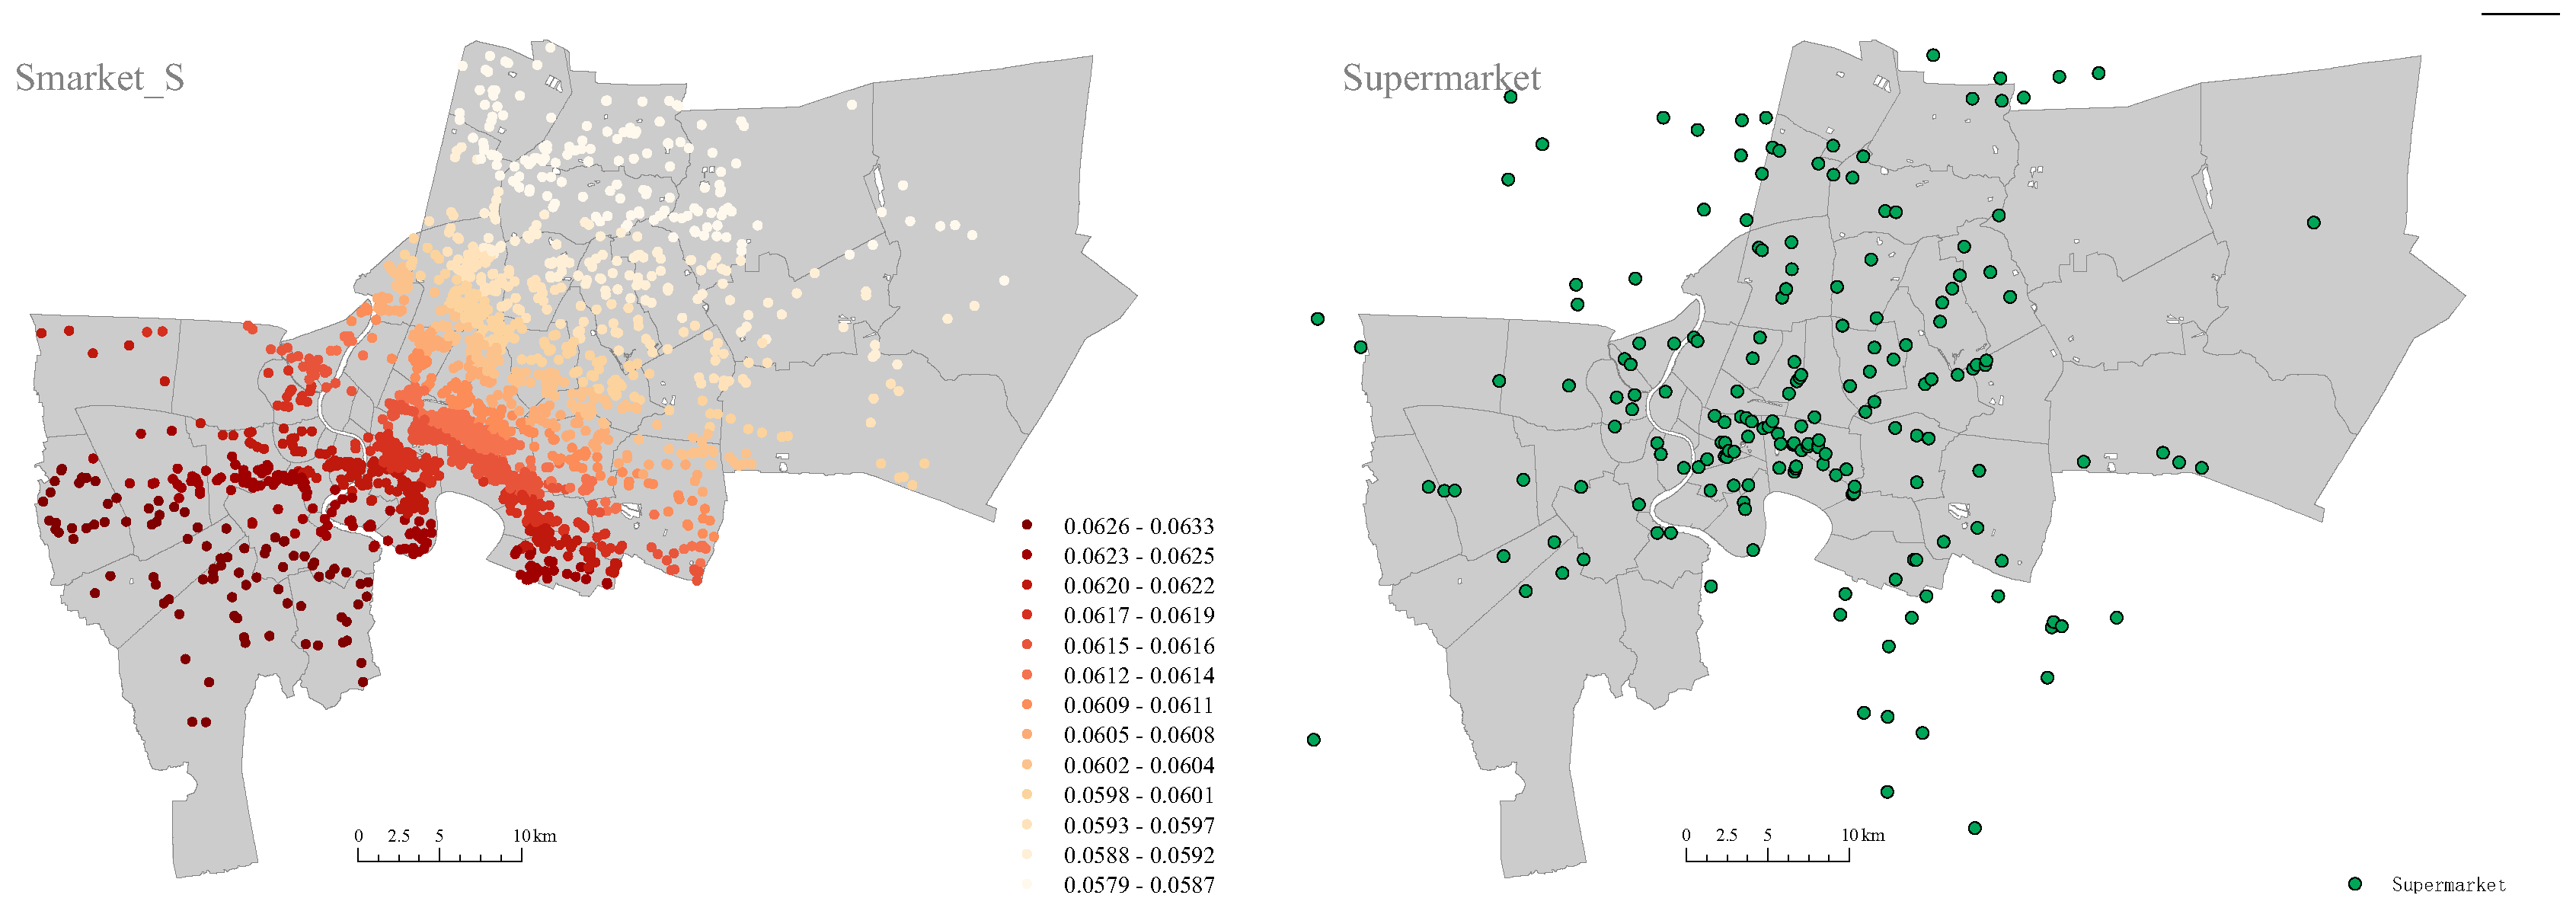
Supermarkets are neighborhood facilities that are convenient for local residents. The MGWR coefficients linked with the distance score to supermarkets were positive throughout the whole of Bangkok and passed the statistical significance test, indicating that the effect of supermarkets can significantly promote housing prices (Figure 9). This originates from the level of economic development and the living habits of the residents. Moreover, the variation range of the MGWR coefficient is less than 0.01, indicating the spatial homogeneity of the effect of supermarkets on housing prices. Western and southern suburbs are still in the development stage, the living needs of residents are growing, and the construction of supermarkets is slightly lagging, so housing prices in these suburbs are slightly more sensitive to the accessibility to supermarkets. In contrast, in the northern suburbs, supermarkets are more evenly distributed, and there are also large supermarkets such as Lotus and Makro at the border with Rangsit, so the supermarket effect on housing prices in the northern suburbs is slightly weaker.
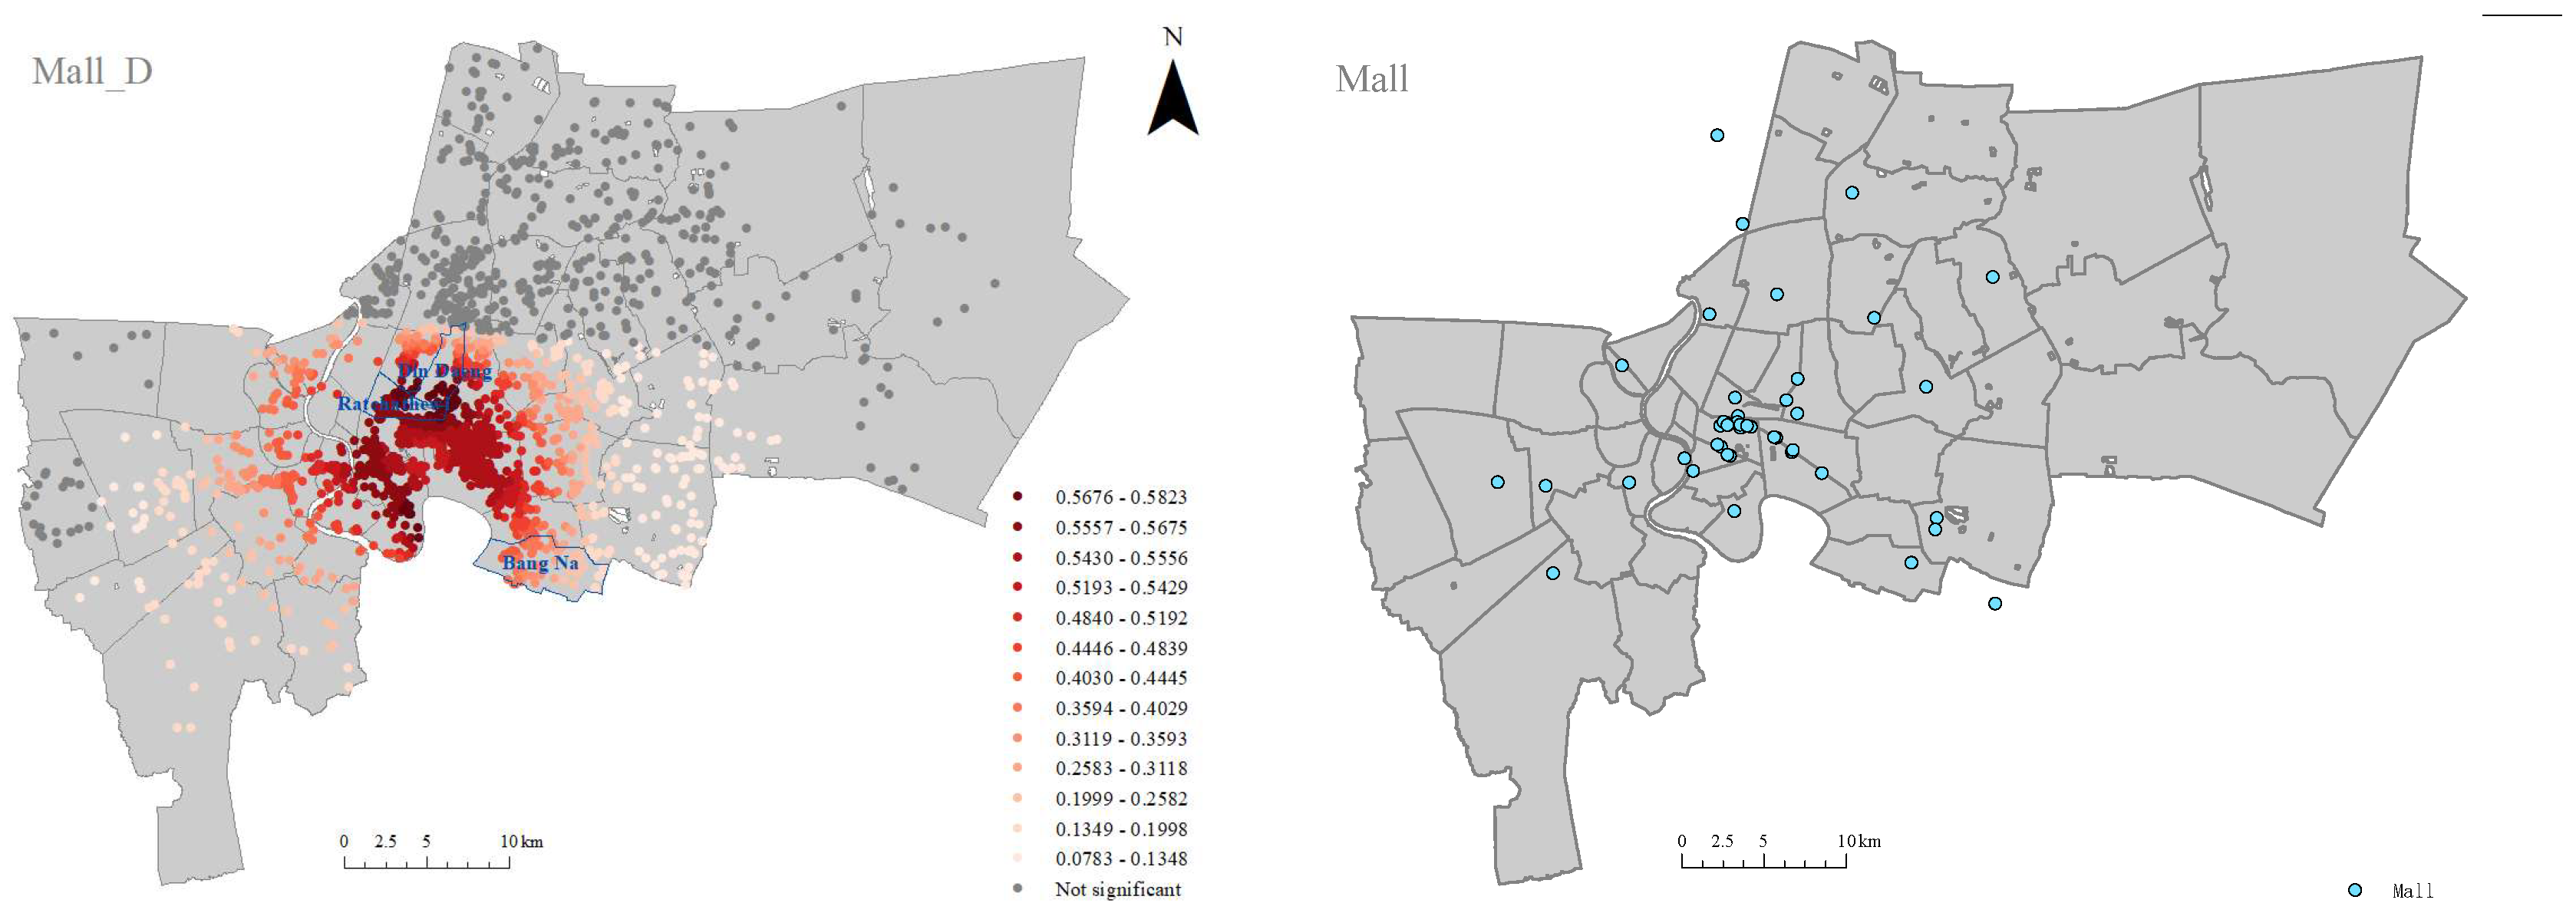
Shopping malls are often built in economically active and densely populated areas, greatly enriching the urban leisure life of residents by providing services such as retail, restaurants, and cinemas. Compared to other facilities, the commercial impact of shopping malls on surrounding residences is complex and may have more external effects due the fact that shopping malls are the combination of shopping, dining, and entertainment. The positivity of MGWR coefficients linked with the minimum distance to shopping malls reveals that the closer the proximity to the shopping malls, the greater its negative effect on housing prices (Figure 10). The largest positive MGWR coefficient appeared in and around Pathum Wan, where there are more than half of the comprehensive malls in Bangkok. Intensive shopping malls in central Bangkok attract a steady stream of visitors, leading to a huge number of negative effects that lower the quality of daily life, including congestion, parking shortages, noise pollution, and crime. Moreover, large commercial complexes such as Siam, Rama 9, and King Power Duty Free attract a large number of overseas visitors. Since central Bangkok is a bustling transportation hub, airport railways, urban rail transit, and expressways frequently intersect. Even in suburb regions with a sparse distribution of shopping malls, the distance to shopping malls is also positively correlated with housing prices, but the degree of the effect is much lower and not statistically significant.
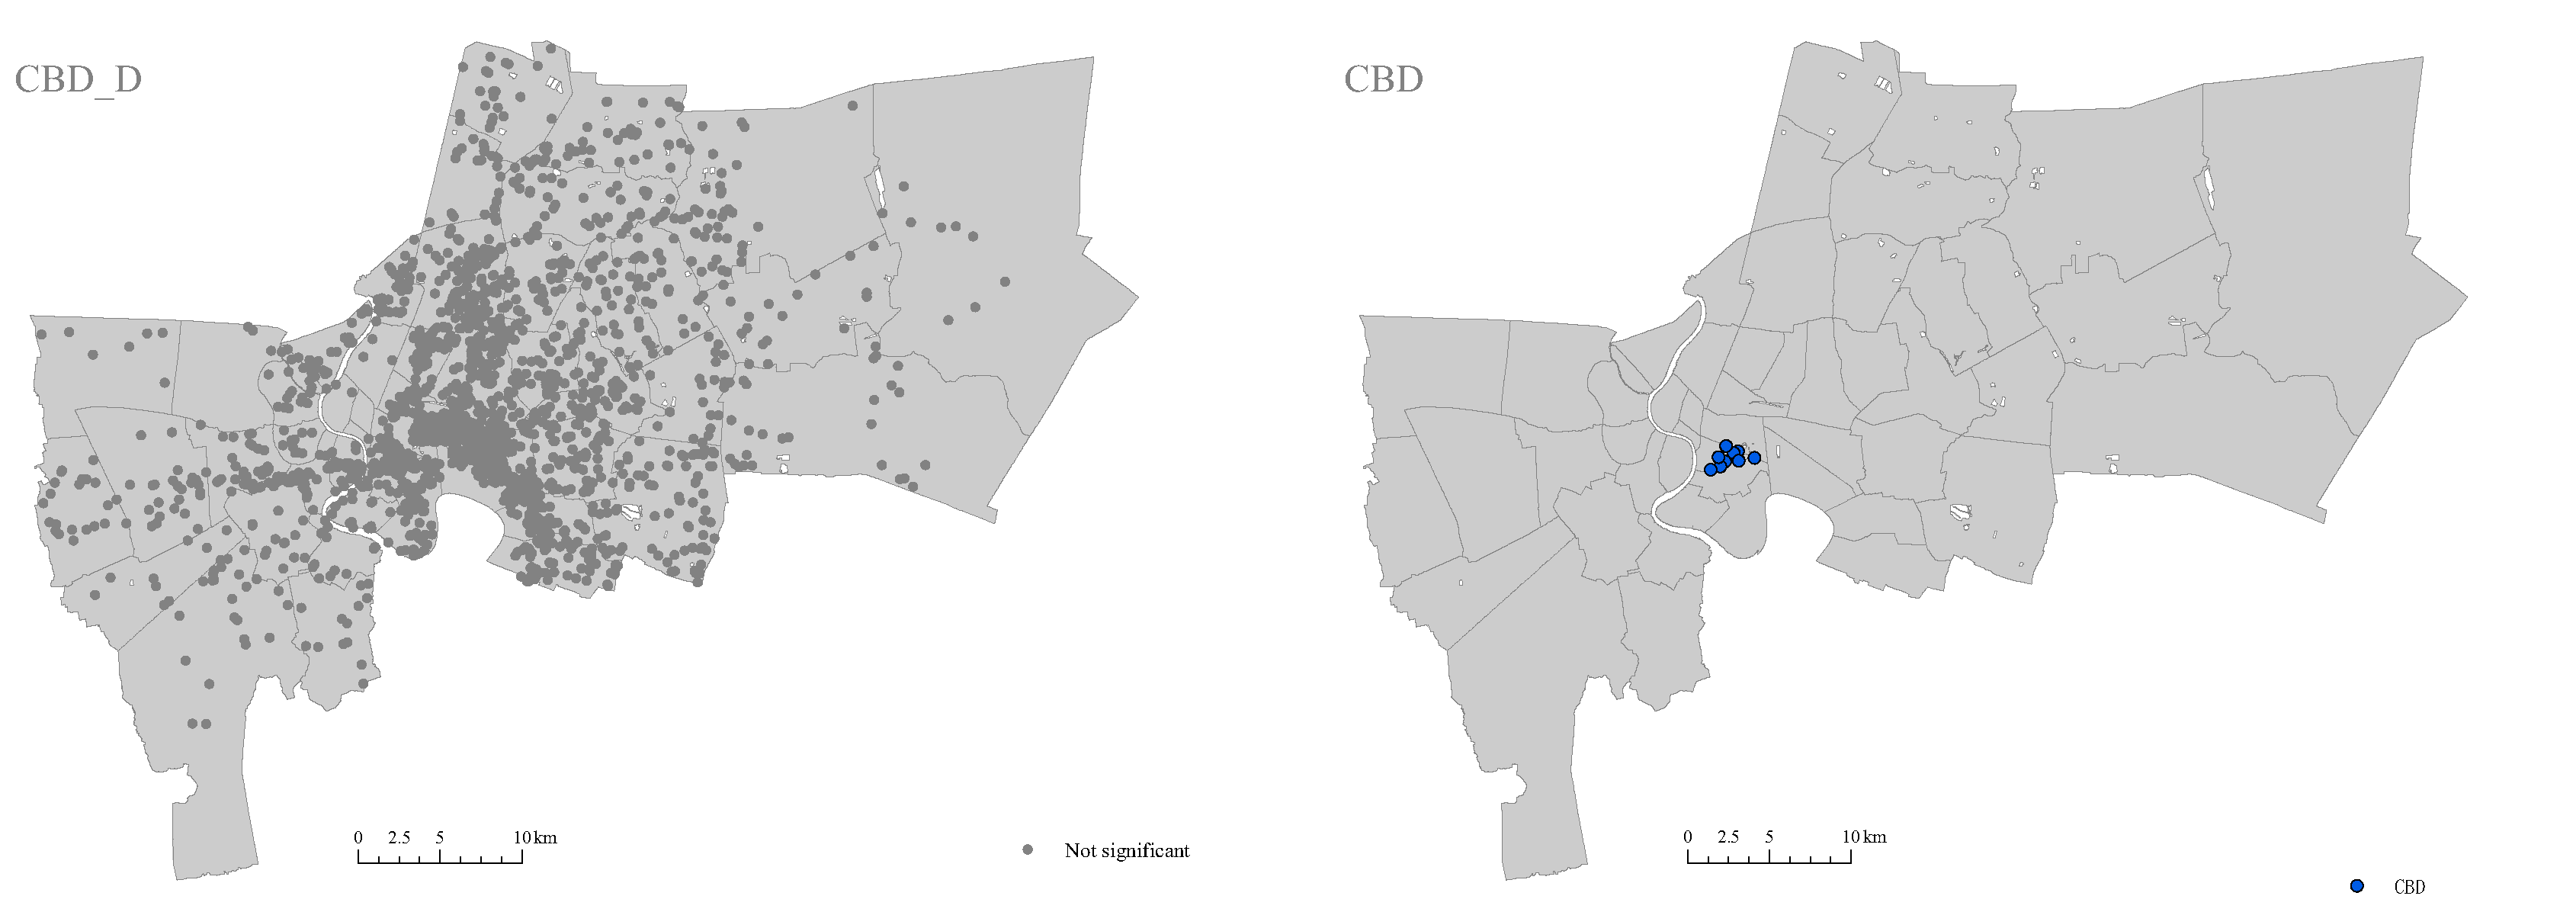
The Sathorn CBD is the most economically active area and is the financial hub of Bangkok. The closer to the CBD, the higher the housing prices (Figure 2), so the distance to the CBD is an important spatial feature for housing prices of each neighborhood [35,36]. The MGWR coefficient linked with the distance to the CBD had no large spatial difference and did not pass the statistical significance test (Figure 11). This means that most of the local residents do not depend on the CBD.

5. Discussion

Bangkok is the largest city of Thailand and the second largest city in Southeast Asia. Differently from the development of real estate in cities of Europe and the US, Bangkok’s real estate exhibits substantial volatility, along with the land use process of rapid urbanization and the upgrading of economic structures. As an international metropolis in a developing country, Bangkok’s real estate is not only constrained by domestic factors but also fluctuates with international economic cycles. Bangkok’s long history, diverse culture, developed economy, and incomplete land infrastructure make the formation of housing prices particularly complex.
At present, only very limited housing price studies have been carried out in Thailand, and only one or two influential factors have been considered. Vichiensan et al. [26] studied a small size of property samples along the BTS Sukhumvit line in Bangkok and found that property values are strongly affected by rail transit. Rinchumphu [27] analyzed the effect of noise pollution on housing prices in Bangkok and found that the extent of the impact was related to the type of house. Vichiensan et al. [28] employed condominium sales data along major rail corridors to reveal that there were significant spatial differences in the driving effect of rail transit on housing prices in Bangkok.
Our study provided a comprehensive assessment of the housing price formation mechanisms of Bangkok and revealed the spatial heterogeneity of impact degrees of neighborhood facilities. Based on 13,175 residence transaction data from 2076 different neighborhoods in Bangkok, our study explored multiscale driving mechanisms of housing prices in Bangkok at the neighborhood level. Since MGWR enables a direct measurement of the multiscale variation among different influential factors, we used the MGWR coefficients associated with different influential factors to mine complex links between housing prices and spatial neighborhood attributes. Our analysis revealed not only the differences in the degree of different influential factors but also the spatial differences in the effect of the same influential factor.
The effect of location on housing prices demonstrated significant spatial heterogeneity throughout the whole of Bangkok. Driven by the amplification effect of land scarcity, any resident has a significant premium in downtown areas and a significant depreciation in suburb areas. However, housing prices demonstrated spatial homogeneity with the housing age in almost the whole of Bangkok, but it was not statistically significant in suburban areas. The spatial variation in the housing age effects was much less than that of location. Similarly to age effects, the furniture status also demonstrated spatial homogeneity effects but had a much smaller degree. In addition, being away from green spaces significantly reduced the value of houses.
In Bangkok, the proximity to prestigious primary and secondary schools had a positive effect on housing prices, and their effect degrees shared similar spatial patterns, but the effect of secondary schools was more significant than primary schools in determining housing prices. This is rooted in the idea that secondary schools play a key role in children’s future entry into ideal universities, leading to many families paying attention to whether they are adjacent to a prestigious secondary school or not.
Bangkok is one of the most congested cities globally [28,37]. Saving on commuting costs and facilitating accessibility are prominent advantages that public transport offers to the surrounding neighborhoods. The effect of the distance to metro stations demonstrated significant spatial heterogeneity; particularly, the high density of metro stations did not increase the commuting efficiency of the neighborhoods but resulted in more negative effects on housing prices. Due to higher density of bus stops compared to metro stations, bus transportation not only had more effects on metro transportation but also had large regions with statistical significance.
The accessibility to business facilities is convenient for local residents. We considered three types of business facilities: supermarkets, shopping malls, and the CBD. The effect of supermarkets could significantly promote housing prices. This is due to the level of economic development and the living habits of the residents. Moreover, the narrow variation range of the MGWR coefficient indicated that the supermarket effect demonstrates spatial homogeneity for housing prices. Compared with supermarkets, shopping malls always attract a steady stream of visitors, leading to a huge number of negative effects that lower the quality of daily life and then lower housing prices. In addition, the effect of the distance from the CBD in downtown Bangkok could be ignored.

6. Conclusions and Recommendation

Our study revealed the spatial heterogeneity of facility impact degrees on housing prices in Bangkok, which originates from the imbalance of urban facilities and services and is leading to the existence of significant spatial injustice among Bangkok residents. The Bangkok government urgently needs to adopt reasonable land use policies to guarantee and enhance the fairness of the accessibility to public facilities, transportation, and services, finally avoiding triggering gentrification and achieving the aim of spatial justice and the healthy development of real estate markets. We found that Bangkok shares the common problem of all megacities; particularly, that densely distributed metro stations in downtown areas do not produce commuting convenience but have negative effects on local housing prices. Under this scenario, urban planning in Bangkok should initiate the establishment of multiple subcenters. By taking the lead in demonstration by the government, it is beneficial to drive the transfer of public services, thereby promoting the transfer of functions such as commerce, culture, and exhibitions in downtown areas. At the same time, any urban planning should fully consider the demand for facilities in specific neighborhoods and traffic congestion and guarantee a reasonable distribution of residences and lower the rapid upward trend of housing prices in downtown areas, e.g., to build more prestigious secondary schools and reduce the number of shopping malls and enhance the commuting convenience among urban center/subcenters and suburbs, as concluded by our MGWR analysis. Our research not only supports urban planning departments of Bangkok to make more reasonable facility planning decisions but also provides new insights on the housing price driving mechanism of other cities in Thailand and ASEAN countries.
Author Contributions

S.L. and Z.Z. are co-first authors. Conceptualization, Z.Z.; Methodology, Z.Z. and S.L.; Software, S.L.; Validation, S.L.; Formal analysis, Z.Z., S.L. and M.J.C.C.; Investigation, S.L. and P.S.; Resources, S.L. and P.S.; Writing—original draft, Z.Z.; Writing—review & editing, Z.Z. and M.J.C.C. All authors have read and agreed to the published version of the manuscript.

Funding

This research received no external funding.

Institutional Review Board Statement

Not applicable.

Informed Consent Statement

Not applicable.

Data Availability Statement

Data available on request due to restrictions.

Conflicts of Interest

The authors declare no conflicts of interest.

References

  1. Jim, C.Y.; Chen, W.Y. Impacts of urban environmental elements on residential housing prices in Guangzhou (China). Landsc. Urban Plan. 2006, 78, 422–434. [Google Scholar] [CrossRef]
  2. Sander, H.A.; Polasky, S. The Value of Views and Open Space: Estimates from a Hedonic Pricing Model for Ramsey County, Minnesota, USA. Land Use Policy 2009, 26, 837–845. [Google Scholar] [CrossRef]
  3. Sheppard, S. Hedonic analysis of housing markets. Handb. Reg. Urban Econ. 1999, 3, 1595–1635. [Google Scholar]
  4. Gatzlaff, D.H.; Haurin, D.R. Sample Selection and Biases in Local House Value Indices. J. Urban Econ. 1998, 43, 199–222. [Google Scholar] [CrossRef]
  5. Basu, S.; Thibodeau, T.G. Analysis of Spatial Autocorrelation in House Prices. J. Real Estate Financ. Econ. 1998, 17, 61–85. [Google Scholar] [CrossRef]
  6. Bourassa, S.C.; Cantoni, E.; Hoesli, M. Spatial Dependence, Housing Submarkets, and House Price Prediction. J. Real Estate Financ. Econ. 2007, 35, 143–160. [Google Scholar] [CrossRef]
  7. Bowen, W.M.; Mikelbank, B.A.; Prestegaard, D.M. Theoretical and Empirical Considerations Regarding Space in Hedonic Housing Price Model Applications. Growth Change 2001, 32, 466–490. [Google Scholar] [CrossRef]
  8. Helbich, M.; Brunauer, W.; Vaz, E.; Nijkamp, P. Spatial Heterogeneity in Hedonic House Price Models: The Case of Austria. Urban Stud. 2013, 51, 390–411. [Google Scholar] [CrossRef]
  9. Hu, H.; Geertman, S.; Hooimeijer, P. Amenity Value in Post-Industrial Chinese Cities: The Case of Nanjing. Urban Geogr. 2014, 35, 420–443. [Google Scholar] [CrossRef]
  10. Hui, E.C.; Zhong, J.W.; Yu, K.H. The Impact of Landscape Views and Storey Levels on Property Prices. Landsc. Urban Plan. 2012, 105, 86–93. [Google Scholar] [CrossRef]
  11. Liang, X.J.; Liu, Y.L.; Qiu, T.Q.; Jing, Y.; Fang, F.G. The effects of locational factors on the housing prices of residential communities: The case of Ningbo, China. Habitat Int. 2018, 81, 1–11. [Google Scholar] [CrossRef]
  12. Huang, Z.Z.; Chen, R.S.; Xu, D.; Zhou, W. Spatial and hedonic analysis of housing prices in Shanghai. Habitat Int. 2017, 67, 69–78. [Google Scholar] [CrossRef]
  13. Cao, K.; Diao, M.; Wu, B. A Big Data–Based Geographically Weighted Regression Model for Public Housing Prices: A Case Study in Singapore. Ann. Am. Assoc. Geogr. 2019, 109, 173–186. [Google Scholar] [CrossRef]
  14. Liu, N.H.; Strobl, J. Impact of neighborhood features on housing resale prices in Zhuhai (China) based on an (M)GWR model. Big Earth Data 2023, 7, 146–169. [Google Scholar] [CrossRef]
  15. Yu, H.C.; Fotheringham, A.S.; Li, Z.Q.; Oshan, T.; Kang, W.; Wolf, L.J. Inference in multiscale geographically weighted regression. Geogr. Anal. 2020, 52, 87–106. [Google Scholar] [CrossRef]
  16. Lu, B.B.; Ge, Y.; Shi, Y.L.; Zheng, J.H.; Harris, P. Uncovering drivers of community-level house price dynamics through multiscale geographically weighted regression: A case study of Wuhan, China. Spat. Stat. 2023, 53, 100723. [Google Scholar] [CrossRef]
  17. Hui, E.C.M.; Zhong, J.W.; Yu, K.H. Heterogeneity in Spatial Correlation and Influential Factors on Property Prices of Submarkets Categorized by Urban Dwelling Spaces. J. Urban Plan. Dev. 2016, 142, 04014047. [Google Scholar] [CrossRef]
  18. Kim, J.H.; Li, W.; Newman, G.; Kil, S.H.; Park, S.Y. The influence of urban landscape spatial patterns on single-family housing prices. Environ. Plan. B Urban Anal. City Sci. 2018, 45, 26–43. [Google Scholar] [CrossRef]
  19. Jang, M.; Kang, C.D. Retail accessibility and proximity effects on housing prices in Seoul, Korea: A retail type and housing submarket approach. Habitat Int. 2015, 49, 516–528. [Google Scholar] [CrossRef]
  20. Koster, H.R.A.; Rouwendal, J. The impact of mixed land use on residential property values. J. Reg. Sci. 2012, 52, 733–761. [Google Scholar] [CrossRef]
  21. Kim, K.; Lahr, M.L. The Impact of Hudson-Bergen Light Rail on Residential Property Appreciation. Pap. Reg. Sci. 2014, 93, 79–97. [Google Scholar] [CrossRef]
  22. Trojanek, R.; Gluszak, M. Spatial and time effect of the subway on property prices. J. Hous. Built Environ. 2018, 33, 359–384. [Google Scholar] [CrossRef]
  23. Wen, H.; Xiao, Y.; Hui, E.C.M.; Zhang, L. Education quality, accessibility, and housing price: Does spatial heterogeneity exist in education capitalization. Habitat Int. 2018, 78, 68–82. [Google Scholar] [CrossRef]
  24. McDowall, S.; Wang, Y.C. An Analysis of International Tourism Development in Thailand: 1994–2007. Asia Pac. J. Tour. Res. 2009, 14, 351–370. [Google Scholar] [CrossRef]
  25. Wilson, A. Foreign Bodies and National Scales: Medical Tourism in Thailand. Body Soc. 2011, 17, 121–137. [Google Scholar] [CrossRef]
  26. Vichiensan, V.; Malaitham, S.; Miyamoto, K. Hedonic Analysis of Residential Property Values in Bangkok: Spatial Dependence and Nonstationarity Effects. J. East. Asia Soc. Transp. Stud. 2011, 9, 886–899. [Google Scholar]
  27. Rinchumphu, D. The Effect of Noise Quality Level on Housing Price in Bangkok Metropolitan Region (BMR), Thailand: A Hedonic Pricing Approach. J. Appl. Geosci. Built Environ. 2019, 1, 1–6. [Google Scholar]
  28. Vichiensan, V.; Wasuntarasook, V.; Hayashi, Y.; Kii, M. Urban Rail Transit in Bangkok: Chronological Development Review and Impact on Residential Property Value. Sustainability 2022, 14, 284. [Google Scholar] [CrossRef]
  29. Minerva. Thailand’s Real Estate Market Overview. 2024. Available online: https://minerva-thailand.com/thailands-real-estate-market-overview/ (accessed on 1 January 2025).
  30. Sapore di Cina. The Pathum Wan Neighborhood in Bangkok: The Complete Guide. Available online: https://www.saporedicina.com/english/pathum-wan-district-bangkok/ (accessed on 1 January 2025).
  31. UNICEF. Education Knows No Border, A Collection of Good Practices and Lessons Learned on Migrant Education in Thailand; UNICEF: New York, NY, USA, 2019. [Google Scholar]
  32. Gauthier, B. Punyasavatsut, Inequalities in Presence of a School Funding Formula: The 15-year Free Education Program in Thailand. Int. J. Educ. Dev. 2019, 70, 102100. [Google Scholar] [CrossRef]
  33. Brunsdon, C.; Fotheringham, A.S.; Charlton, M.E. Geographically Weighted Regression: A Method for Exploring Spatial Nonstationarity. Geogr. Anal. 1996, 28, 281–298. [Google Scholar] [CrossRef]
  34. Fotheringham, A.S.; Yang, W.B.; Kang, W. Multiscale Geographically Weighted Regression (GWR). Ann. Am. Assoc. Geogr. 2017, 107, 1247–1265. [Google Scholar]
  35. Marks, D. The urban political ecology of the 2011 floods in Bangkok: The creation of uneven vulnerabilities. Pac. Aff. 2015, 88, 623–652. [Google Scholar] [CrossRef]
  36. Singkran, N.; Kandasamy, J. Developing a strategic flood risk management framework for Bangkok, Thailand. Nat. Hazards 2016, 84, 933–957. [Google Scholar] [CrossRef]
  37. Ayaragarnchanakul, E.; Creutzig, F. Bangkok’s locked-in traffic jam: Price congestion or regulate parking? Case Stud. Transp. Policy 2022, 10, 365–378. [Google Scholar] [CrossRef]
Figure 1. Geographic conditions and main urban areas of Bangkok.
Land 14 02004 g001
Figure 2. The distribution of housing prices in all neighborhoods.
Land 14 02004 g002
Figure 3. Location effects of housing prices revealed by MGWR intercept distribution.
Land 14 02004 g003
Figure 4. Effects of housing age and furniture status on housing prices.
Land 14 02004 g004
Figure 5. Effect of accessibility to green space and the distribution of green space.
Land 14 02004 g005
Figure 6. Accessibility effect to prestigious primary and secondary schools.
Land 14 02004 g006
Figure 7. Effect of accessibility to metro transport (left) and distribution of metro stations (right).
Land 14 02004 g007
Figure 8. Effect of accessibility to bus stations (left) and distribution of bus stations (right).
Land 14 02004 g008
Figure 9. Distance score effect of supermarkets (left) and distribution of supermarkets (right).
Land 14 02004 g009
Figure 10. Effect of minimum distance to shopping malls (left) and distribution of shopping malls (right).
Land 14 02004 g010
Figure 11. Effect of minimum distance to CBD (left) and the location of CBD (right).
Land 14 02004 g011
Table 1. Descriptions of three buffers and assigned scores.
Distance Boundary (m)Primary SchoolSecondary SchoolMetro StationSupermarketScore
D 1 80010006001000 4   ( S 1 )
D 2 115015008001500 2   ( S 2 )
D 3 1500200010002000 1   ( S 3 )
Table 2. Descriptions of dependent and explanatory variables.
CategoryVariablesMeasureUnitFacility CountExplanation
Dependent variableUnitPrice THB/M2 Housing unit price
Neighborhood
attribute
Age Year Age of neighborhood
Pop_Den Persons/Km2 Population density of the neighborhood
Furniture Point Furniture of the houses in the neighborhood
EducationPriSch_SDSPoint42Distance score to prestigious primary school
SecSch_SDSPoint55Distance score to prestigious secondary school
Medical careHospital_DTDKm84Minimum distance to general hospital
Public
transport
Metro_SDSPoint159Distance score to metro station
Bstop_DenFDUnit/Km21532Kernel density of bus stop
Rail_EEDKm812Minimum Euclidean distance to train track
Gas_EEDKm640Minimum Euclidean distance to gas station
SceneryGreen_DTDKm67Minimum distance to a park with green space
River_EEDKm1Euclidean distance to the Chao Phraya River
BusinessMall_DTDKm44Minimum distance to shopping mall
Smarket_SDSPoint195Distance score to supermarket
CBD_DTDKm1Distance to Sathorn CBD in Bangkok
Table 3. Results of stepwise OLS regression (* indicates significance level).
VariablesCoef.Std. Err.t-Valuep > |t|VIF
Age−0.3460.014−25.2480.000 *1.027Included
Furniture−0.0630.014−4.3630.000 *1.140Included
PriSch_S0.0960.0175.6790.000 *1.574Included
SecSch_S0.0980.0175.6800.000 *1.630Included
Green_D−0.1010.020−5.1990.000 *2.081Included
Mall_D0.0600.0232.5830.010 *2.954Included
Smarket_S0.2100.01613.0220.000 *1.426Included
Metro_S0.0380.0152.5420.011 *1.225Included
Bstop_Den0.1150.0167.0280.000 *1.464Included
CBD_D−0.4010.024−16.4330.000 *3.258Included
Pop_Den Omitted
Hospital_D Omitted
Rail_E Omitted
Gas_E Omitted
River_E Omitted
Table 4. Diagnostic information of models.
R2Adj.R2AICc
OLS0.6230.6213889.315
GWR0.8150.7902944.613
MGWR0.8170.7952876.357
Table 5. Summary statistics of MGWR parameters.
VariablesBandwidthCoefficients
MeanSTDMinMedianMax
Intercept440.2160.849−0.880−0.0812.169
Age90−0.3800.191−0.825−0.3690.027
Furniture2074−0.0590.001−0.062−0.059−0.057
PriSch_S20740.0090.0010.0070.0090.012
SecSch_S17960.0460.0070.0330.0460.067
Green_D2074−0.0580.003−0.062−0.059−0.052
Mall_D4890.3310.215−0.0560.3790.582
Smarket_S20740.0610.0010.0580.0610.063
Metro_S1950.0640.103−0.2210.0680.395
Bstop_Den2510.2320.1600.0290.1810.693
CBD_D2074−0.0340.002−0.038−0.033−0.032
Disclaimer/Publisher’s Note: The statements, opinions and data contained in all publications are solely those of the individual author(s) and contributor(s) and not of MDPI and/or the editor(s). MDPI and/or the editor(s) disclaim responsibility for any injury to people or property resulting from any ideas, methods, instructions or products referred to in the content.