Abstract
The study of tropical landscape dynamics is of critical importance, particularly within protected areas, for evaluating ecosystem functioning and the effectiveness of natural conservation efforts. This study aims to identify landscape dynamics within the Dong Nai Biosphere Reserve (including Cat Tien National Park and the Ma Da Forest) using remote sensing (Landsat and others) and geographic information system methods. The analysis is based on changes in the Enhanced Vegetation Index (EVI), land cover transformations, landscape metrics (Class area, Percentage of Landscape and others), and natural landscape fragmentation, as well as a spatio-temporal assessment of anthropogenic impacts on the area. The results revealed structural changes in the landscapes of the Dong Nai Biosphere Reserve between 2000 and 2024. According to Sen’s slope estimates, a generally EVI growth was observed in both the core and buffer zones of the reserve. This trend was evident in forested areas as well as in regions of the buffer zone that were previously occupied by highly productive agricultural land. An analysis of Environmental Systems Research Institute (ESRI) Land Cover and Land Cover Climate Change Initiative (CCI) data confirms the relative stability of land cover in the core zone, while anthropogenic pressure has increased due to the expansion of agricultural lands, mosaic landscapes, and urban development. The calculation of landscape metrics revealed the growing isolation of natural forests and the dominance of artificial plantations, forming transitional zones between natural and anthropogenically modified landscapes. The human disturbance index, calculated for the years 2000 and 2024, shows only a slight change in the average value across the territory. However, the coefficient of variation increased significantly by 2024, indicating a localized rise in anthropogenic pressure within the buffer zone, while a reduction was observed in the core zone. The practical significance of the results obtained lies in the possibility of their use for the management of the Dongnai biosphere Reserve based on a differentiated approach: for the core and the buffer zone. There should be a ban on agriculture and development in the core zone, and restrictions on urbanized areas in the buffer zone.
1. Introduction
Tropical forests have been under severe anthropogenic pressures from agricultural land expansion, resource exploitation (logging, mining), and urbanization [1,2]. Due to these disturbances, tropical forest ecosystems have degraded, resulting in a decrease in biodiversity [3].
The preservation of tropical ecosystems has remained a central and ongoing priority in environmental policy since the United Nations Conference on Environment and Development in 1992. Tropical ecosystems are characterized by high biodiversity, play a vital role in maintaining the global carbon cycle, and provide numerous ecological functions at both local and regional scales, including the regulation of the hydrological cycle, nutrient cycling, protection of fragile tropical soils from erosion, and mitigation of extreme weather events [4,5,6]. Southeast Asia contains approximately 15% of the world’s tropical forests, which are increasingly threatened by conversion to agricultural land, illegal logging, urban expansion, and infrastructure development that facilitates access to previously undisturbed areas [7].
The Socialist Republic of Vietnam is the only country in the Mekong subregion to have reported a consistent increase in forest cover over the past three decades [8]. From 9.4 million hectares in 1990 to 14.06 million hectares by 2015, accounting for 40.8% of the national territory; by 2019 this figure had reached 41.8%, and by 2030 the Government of Vietnam aims to increase the country’s forest cover to 45%. However, the tactical use of forest land for cash crops (e.g., over-plowing and over-pruning of forest trees) and the insufficient mobilization of resources for afforestation (e.g., labor and funding) have had mixed effects on forest rehabilitation. Although forest area has increased under national programs—such as the DECISION on Approval of the National Action Programme on the Reduction of Greenhouse Gas Emissions through the Reduction of Deforestation and Forest Degradation, Sustainable Management of Forest Resources, and Conservation and Enhancement of Forest Carbon Stocks (REDD+) by 2030, and Decision No. 524/QD-TTg of the Prime Minister approving the Project “Planting One Billion Trees in the Period 2021–2025”—the ecological quality of those forests remains a significant concern. Local authorities have expressed serious concern over ongoing natural forest degradation, as small-scale illegal logging and wildlife poaching continue to occur [9].
In the context of nature conservation, protected areas must be effectively managed to ensure adequate habitat quality and to reduce negative external influences such as deforestation, habitat fragmentation, urban expansion, pollution, pesticide contamination, the spread of invasive species, and hunting [9].
Effective land management of protected areas and their buffer zones is essential for maintaining habitat quality and minimizing the adverse effects of neighboring areas under intensive economic use. However, these vulnerable territories are increasingly at risk due to forest fragmentation, which alters habitat structure and disrupts the continuity of species distributions—potentially leading to biodiversity loss [10].
Additionally, recent research highlights that tropical forests are highly vulnerable to anthropogenic pressures and climate change. Therefore, continuous monitoring of forest conditions within protected areas is of critical importance [11,12].
Remote sensing (RS) methods are now widely employed to study environmental processes. Landscape structure is frequently quantified using open-source toolkits designed for processing satellite data. The growing availability of remote sensing resources, combined with advances in image analysis, has expanded the range of applications for landscape-scale assessments. These techniques provide broad spatial coverage, temporal consistency, and access to extensive open-source datasets, enabling detailed monitoring of geoecological landscape dynamics. RS technologies allow researchers to extract landscape-level information using a variety of spectral vegetation indices (e.g., Tasseled Cap, Leaf Area Index, Normalized Difference Vegetation Index (NDVI) [13].
Among various vegetation indices, the Enhanced Vegetation Index (EVI) is particularly recommended for tropical regions due to its sensitivity to biomass variability in high-productivity environments. It is widely used in land use and land cover classification, as well as for analyzing spatial patterns of landscape structure [14]. The spatial configuration of landscapes affects the movement of energy and matter, including moisture cycling, biogeochemical fluxes, and pollutant transport. Highly fragmented landscapes can accelerate surface runoff and soil erosion, thereby reducing ecosystem resilience to floods, droughts, and other extreme events—especially under conditions of climate change [15]. Fragmentation metrics (e.g., patch size, isolation index, polygon complexity, degree of clustering) provide quantitative indicators of such processes and support assessments of landscape condition and the modeling of future transformations [16].
To quantitatively assess anthropogenic impacts, the concept of hemeroby is employed [17,18]. Originally introduced by J. Jalas [19] to describe human influence on vegetation, the concept was later expanded to encompass entire ecosystems [20]. Hemeroby levels serve as an index of ecological disturbance.
The purpose of this study is to analyze the landscape dynamics of the Dong Nai Biosphere Reserve, which includes Cat Tien National Park and the Ma Da Forest. The study was structured around the following research objectives:
- To examine the dynamics of the EVI vegetation index and land cover;
- To calculate landscape metrics and assess the fragmentation of natural landscapes; and
- To analyze the spatio-temporal dynamics of anthropogenic impact using a Human Disturbance Index (HDI).
2. Materials and Methods
2.1. Study Area
The study area is located within the Dong Nai Biosphere Reserve (formerly known as the Cat Tien Biosphere Reserve), which holds a strategically important position for maintaining the ecological and economic balance of the region and for preserving the unique natural complexes of the southern lowland territories of the Socialist Republic of Vietnam. The reserve is situated in Dong Nai Province, in the southeastern part of southern Vietnam (Figure 1). In this region, the Central Highlands Plateau gradually transitions into the Nam Bo river delta. The total area of the reserve is approximately 9700 km2 and includes a strictly protected zone (core) within Cat Tien National Park and the Ma Da Forest, a buffer zone designated for sustainable forest use, and a transition zone that includes agricultural lands, aquaculture sites, and settlements [21].
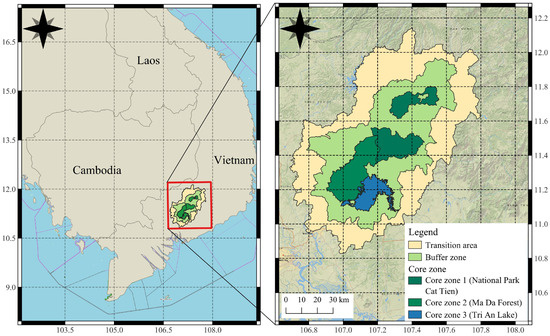
Figure 1.
Geographic location of the study area.
The research was conducted within a tropical monsoon climate zone (Am), which determines the seasonality of precipitation: the dry season extends from November to April, while the wet season occurs from May to October. The mean annual precipitation is 2518 mm, and the mean annual temperature is 26.4 °C. December is on average the coolest month (mean monthly temperature 24.7 °C), whereas April is the hottest (mean monthly temperature 28.3 °C) [22].
The topography is characterized by diverse landforms, including the Chuong Son mountain range, river valleys, semi-plains, mid-elevation hills, and relatively flat surfaces. In this region, the central Vietnamese plateau transitions into the Nam Bo river delta. The area contains scattered lakes, ponds, and wetlands in the eastern part of the Nam Bo delta, as well as the Dong Nai River, the third longest river in Vietnam in terms of both length and basin area [21]. Approximately 70% of the territory lies at elevations between 0 and 200 m, around 20% between 200 and 500 m, and about 10% above 500 m above sea level.
The Dong Nai Biosphere Reserve exhibits high biodiversity of both flora and fauna, which is notable given its relatively small area and limited altitudinal range (Figure 2) [23].
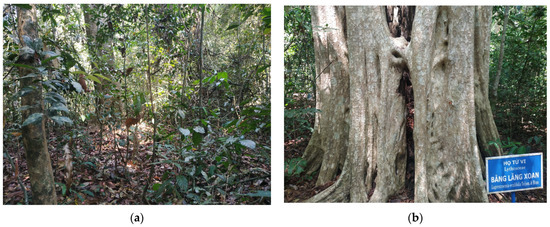
Figure 2.
Types of forest: (a) Ma Da Dipterocarp Forest; (b) Logestriemia—Cát Tiên.
Our study focuses on the core and buffer zones with restricted land use, where the effectiveness of conservation measures for the preservation and restoration of natural ecosystems can be assessed. The most valuable ecosystems, primary rainforests, are protected in the central zone. The buffer zone directly affects the center. There is no environmental protection regime in the transition zone.
2.2. Data Processing
2.2.1. Research Framework
Landscape dynamics within the study area were assessed using remote sensing (RS) methods, including the calculation of vegetation indices, land use/land cover (LULC) classification, landscape metrics, and HDI (Figure 3).
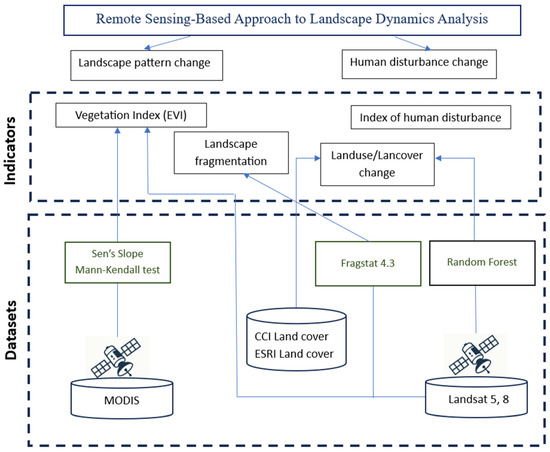
Figure 3.
Methodological framework for analyzing landscape dynamics in the Dong Nai Biosphere Reserve.
2.2.2. Remote Sensing Data
Remote sensing data were obtained using the Google Earth Engine (GEE) cloud computing platform, which provides access to an Application Programming Interface (API) (https://earthengine.google.com/, accessed on 15 August 2025). Google Earth Engine is a geospatial processing service built on the Google Cloud Platform. In this study, the JavaScript Code Editor, a specialized web-based development environment for rapid prototyping, exploration, and Earth Engine App creation, was used. A dedicated web-based development environment for rapid prototyping, exploration, and Earth Engine App creation. Client libraries for JavaScript translate complex geospatial analyses into Earth Engine requests.
Within this platform, data from Landsat 5, Landsat 8, and The Moderate Resolution Imaging Spectroradiometer (MODIS) imagery were processed. The characteristics of the datasets used are summarized in Table 1, and scripts were developed for calculating the spectral indices and metrics described in the following subsections of the methodology.

Table 1.
List of Earth remote sensing data used in the study.
2.2.3. Index Calculation
To assess the condition of ecosystems in the Dong Nai Biosphere Reserve, the following indices were used: Enhanced Vegetation Index (EVI), Normalized Difference Built-up Index (NDBI), Modified Normalized Difference Water Index (MNDWI), and Bare Soil Index (BSI). These indices were calculated from satellite imagery using the formulas presented in Table 2.
Table 2.
Formulas for calculating spectral indices of the Dongnai Biosphere Reserve.
For monitoring ecosystem characteristics of land-cover, the EVI was calculated.
Derived from NDVI, EVI gives finer gradations of biomass to provide a comprehensive analysis of changes in ecosystem characteristics. One of its key advantages is the ability to minimize background noise from soil and atmospheric conditions, which is especially important in tropical areas characterized by high biomass density [28].
The EVI was computed using imagery from the Landsat 8 archive. The Mann–Kendall trend test and Sen’s slope estimator were applied to MODIS time series data covering the period from 2000 to 2024.
Spatial and temporal variations in EVI within the Dong Nai Biosphere Reserve were analyzed for the period 2000–2024 using Sen’s slope method, a non-parametric approach for assessing linear trends.
The Slope value directly reflects the dynamics of the EVI time series. A positive value (Slope > 0) indicates an upward trend, reflecting a gradual increase in EVI; a zero value (Slope = 0) denotes stability and the absence of marked changes; and a negative value (Slope < 0) corresponds to a downward trend, indicating a decrease in EVI [29].
The Mann–Kendall significance test was employed to evaluate the statistical significance of EVI trends. Its advantages lie in the fact that it does not require data to follow a specific distribution and is robust to outliers, which has made it a widely applied method in long-term environmental studies [30,31,32].
In this study, a significance level of α = 0.05 was adopted: trends were considered statistically significant when p ≤ 0.05 and insignificant otherwise. Combining the Mann–Kendall test with Sen’s slope estimator allowed the classification of EVI trends into five categories: significant improvement (slope > 0, p ≤ 0.01), slight improvement (slope > 0, 0.01 < p ≤ 0.05), stable (p > 0.05), slight degradation (slope < 0, 0.01 < p ≤ 0.05), and significant degradation (slope < 0, p ≤ 0.01) [30].
Custom JavaScript code was used within the GEE environment, and final cartographic outputs were visualized using QGIS 3.34 software.
2.2.4. Land Cover Type Data
For the analysis of landscape dynamics, publicly available datasets, such as Land Cover CCI (Climate Change Initiative) and ESRI Land Cover, were primarily selected and analyzed.
CCI Land Cover Data
These datasets are openly provided by the European Space Agency (ESA) and were acquired through the “Global Monitoring of Essential Climate Variables” program, commonly referred to as the “ESA Climate Change Initiative”. This program is designed to deliver a comprehensive, accurate, and timely response to the demanding requirements for highly stable, long-term satellite-derived climate products. Land cover maps were obtained from the official ESA repository and subsequently processed in QGIS 3.34, where they were clipped to the boundaries of the study area, and the spatial extent of each land cover type was quantified [33].
ESRI Land Cover Data
ESRI provides open-access annual land cover maps at 10 m spatial resolution for the period 2017–2024. Existing artificial intelligence (AI)-based land classification models were enhanced through the integration of a massive training dataset consisting of billions of human-labeled image pixels. These models were applied to the entire Sentinel-2 imagery collection for each year, encompassing over 2,000,000 Earth observations across six spectral bands, which formed the basis for the land cover maps. The maps were downloaded from the official ESRI repository, clipped to the boundaries of the study area using QGIS 3.34, and the area of each land cover type was subsequently calculated [34].
Using the Random Forest (RF) Algorithm
For a more accurate analysis of land cover, a land use map was generated based on the interpretation of remote sensing data supplemented by field observations.
Landsat data used for the analysis of the years 2000 and 2024 were obtained at Level-2, Collection 2, Tier-1, which indicates that atmospheric correction was applied using surface reflectance coefficients. This correction removed the influence of aerosol scattering, thin clouds, and other atmospheric effects on the detection and characterization of land surface changes. Information on this processing is provided in the GEE dataset description. To further mitigate cloud-related issues, data were acquired for the dry season of each year (November–April). Additionally, cloud masking was applied using the quality assessment bands available in the Landsat data.
The original spectral bands included: ultra-blue, blue, green, red, near-infrared (NIR), shortwave infrared 1 (SWIR-1), and shortwave infrared 2 (SWIR-2). To improve classification accuracy, spectral indices were calculated, including the Enhanced Vegetation Index (EVI), Normalized Difference Built-up Index (NDBI), Modified Normalized Difference Water Index (MNDWI), and Bare Soil Index (BSI).
Topographic information, specifically elevation and slope, extracted from the ALOS AW3D30 Digital Surface Model (DSM), was also included to enhance classification performance. ALOS AW3D30 is a global DSM produced by the Japan Aerospace Exploration Agency (JAXA) with a spatial resolution of 30 m, matching that of Landsat 5 and 8 data. The data were acquired using the PRISM optical stereoscopic sensor aboard the Advanced Land Observing Satellite (ALOS).
The composite image was normalized and subjected to supervised classification using the Random Forest (RF) algorithm, which has demonstrated higher accuracy compared to other algorithms available in GEE. The RF classifier was trained using field-collected training points combined with enhanced Landsat composite data. The optimal number of decision trees for the classifier was 65.
Superpixel clustering was performed in GEE using the Simple Non-Iterative Clustering (SNIC) algorithm via the ee.Algorithms.Image.Segmentation.SNIC function. The details of this algorithm are described in Achanta To address sample size limitations for training data, we applied the approach of Gómez-Fernández), using regions containing at least 50 pixels each. Overall, 500 training regions were obtained for the study area [35]. These were randomly split into training and validation subsets at a 70/30 ratio. Using this approach, the confusion matrix was computed, allowing the calculation of Overall Accuracy (OA) and the Kappa Index (KI) [36].
Classification accuracy was evaluated using both overall accuracy (0.95) and the Kappa coefficient (0.93), indicating excellent classification performance (Table 3).
Table 3.
Classification accuracy by Kappa coefficient.
The land cover classification was based on prior botanical research conducted within Cat Tien National Park and the Ma Da Forest [37], as well as on the results of our own field observations [37].
2.2.5. Classification of the Land Cover
The land cover map was generated using three complementary approaches, al-lowing for the most effective analysis of spatiotemporal dynamics.
Approach 1. Map Generation Based on the Land Cover CCI Database
These data are openly provided by the European Space Agency and were collected under the “Global Climate Observing System Essential Climate Variables” program (commonly referred to as the “ESA Climate Change Initiative”), which aims to provide comprehensive, timely, and high-quality responses to the complex requirements for long-term, stable satellite climate data. Land cover maps were downloaded from the official website [33].
The Land Cover CCI database includes the following land cover classification: 10—Rainfed cropland, 11—Herbaceous cover, 20—Irrigated cropland, 30—Mosaic cropland > 50%/natural vegetation < 50%, 40—Mosaic natural vegetation > 50%/cropland < 50%, 50—Tree cover, broadleaved, evergreen, closed to open (>15%), 60—Tree cover, broadleaved, deciduous, closed to open (>15%), 70—Tree cover, needle-leaved, evergreen, closed to open (>15%), 100—Mosaic tree and shrub (>50%)/herbaceous cover (<50%), 120—Shrubland, 121—Evergreen shrubland, 130—Grassland, 190—Build up (Urban), 210—Water.
In the QGIS 3.34 geographic information system, the dataset was clipped to the study area, and the area of each land cover type was calculated. The European Space Agency (ESA) has initiated a new program, the Global Monitoring of Essential Climate Variables program (known for convenience as the ESA Climate Change Initiative) to provide an adequate, comprehensive, and timely response to the extremely challenging set of requirements for (highly stable) long-term satellite-based products for climate).
Approach 2. Map Generation Based on the ESRI
ESRI provides open-access annual land cover maps at 10 m resolution for the period 2017–2024. Existing artificial intelligence (AI)-based land classification models were improved by integrating a massive training dataset consisting of billions of hu-man-labeled image pixels. These models were applied to the entire Sentinel-2 image collection for each year, comprising over 2,000,000 Earth observations across six spectral bands, from which the land cover maps were generated. The maps were downloaded from the official website, clipped to the study area in QGIS, and the area of each land cover type was calculated [34].
Classification 2 database includes the following land cover classification: 1—water bodies, 2—tree vegetation, 3—aquatic vegetation, 4—agricultural land, 5—built-up areas, 6—bare soil, 7—herbaceous vegetation.
Approach 3. Classification Using the Random Forest (RF) Algorithm
Given the limitations of open-access land cover datasets—particularly their inability to distinguish between artificial plantations and natural forests, as well as the reduced thematic resolution of the ESRI Land Cover product—a detailed land cover classification was produced for the years 2000 and 2024. This classification was used to assess landscape fragmentation and to calculate landscape metrics.
Classification 3 includes the following land cover classification: Dipterocarp forest, Degraded forest, Bamboo, Lagerstroemia forest, Grassland, Plantation and fruit trees, Agricultural land, Bare soil, Build up areas, Water.
Thus, to assess land cover dynamics, both publicly available monitoring datasets and classifications based on original fieldwork were used. Public datasets included the Land Cover CCI database (1992–2022, spatial resolution: 300 m) and the ESRI Land Cover dataset (available from 2018 onward, resolution: 10 m) [33,34] (Table 4).
Table 4.
Types of ground cover in the various classifications used in the study.
However, the limited classification detail makes it difficult to assess vegetation quality because it does not distinguish between natural and artificial forest plantations. This differentiation is critical for analyzing long-term landscape dynamics.
Unlike the aforementioned open-access databases, the maps generated in this study enabled a more precise assessment of landscape dynamics within the protected area, as natural vegetation was distinguished from artificial plantations and orchards. Land Cover CCI provides a long-term time series, whereas Land Cover ESRI allows the evaluation of dynamics over a 5-year period with high spatial resolution. The classified land cover maps offer a more detailed representation of different land cover classes.
2.2.6. Calculation of Landscape Metrics and Fragmentation Index
There are three main types of landscape metrics, including patch-level metrics, class-level metrics, and landscape-level metrics. In this study, class-level metrics were calculated to evaluate fragmentation within each land cover class. Metrics were selected based on key indicators commonly used in previous studies [38]. Details of the metrics are presented in Table 5.
Table 5.
Description of landscape metrics [39].
Using FRAGSTATS 4.3 software (University of Massachusetts Amherst, Amherst, MA, USA), we calculated the landscape metrics to quantify the landscape change from 2000 to 2024. Raster data of the author-classified land cover types for 2000 and 2024 were used as input for FRAGSTATS 4.3.
2.2.7. Calculation of the Human Disturbance Index
To assess the anthropogenic pressure on the landscapes and its dynamics during the operational period of the protected area, Hemeroby index values was calculated. Hemeroby index values were assigned based on previous research and adjustments proposed for the tropical zone (Table 6) [40,41].
Table 6.
Hierarchy of the LULC type with respect to the hemeroby index (HI).
A 1 km × 1 km fishnet grid was generated using the “Create Fishnet” function in QGIS 3.34. Each grid cell was used as an operational unit for calculations.
The Index of Human Disturbance (IHD) was also calculated [42]. The IHD quantifies human impact resulting from various types and intensities of land cover/land use (LCLU) within an operational-territorial unit [42].
Based on Table 6, each LULC type was assigned an HI value, and the human disturbance index (A) for each cell was calculated using the following equation [42,43]:
where A—Human Disturbance Index for the cell, HIi—Hemeroby Index for land cover type I, Di—area of land cover type i within the cell, D—total cell area, n—number of land use/land cover types within the cell.
2.3. Field Surveys
Fieldwork in the Dong Nai Biosphere Reserve was conducted in March–April 2025 and involved route-based interpretation of satellite imagery. Along these routes, the land cover type was recorded at multiple points. At each location, GPS coordinates and elevation were recorded using a Garmin GPSMAP 64 receiver.
3. Results
3.1. Analysis of EVI
The highest EVI values were observed in vegetation communities dominated by bamboo and palm species, which are typically found in areas with increased moisture near intermittent or permanent watercourses. These communities are also common in areas that have undergone clear-cut logging (Figure 4).
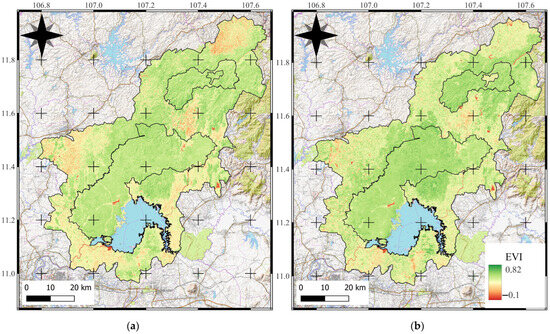
Figure 4.
Spatial distribution of EVI values in 2000 (a) and 2024 (b) across the Dong Nai Biosphere Reserve.
EVI values are lower for Dipterocarpaceae-dominated forests and Lagerstroemia-dominated stands, as the highest-quality satellite images were obtained during the dry season, when these communities undergo leaf renewal. The majority of the area falls within the EVI value range of 0.5 to 0.6.
The results of EVI trend assessment using the Mann–Kendall test and Sen’s slope estimator are presented in Figure 4. From 2000 to 2024, a generally positive EVI trend was identified across 934.4 km2 (67.2%) of the reserve’s core zone and 2170.8 km2 (62%) of the buffer zone.
From 2000 to 2024, the buffer zone saw a general decline in areas with degraded or poorly developed vegetation cover (EVI values from –0.1 to 0.2) totaling 221 km2. However, within the range of –0.1 to 0, the area increased by 61% (11 km2). Simultaneously, areas with EVI values of 0.5–0.6 increased by 43% (85 km2).
Thus, in the buffer zone, contrasting trends are observed: an increase in the proportion of degraded lands (EVI = 0) alongside a simultaneous expansion of highly productive areas (EVI = 0.4–0.6 and above), indicating landscape fragmentation and the intensification of agricultural use within the protected area’s ecosystems.
In the buffer zone, significant EVI degradation was observed in 14% of the territory, and minor degradation in 17%. These areas are mainly located south of Tri An Lake, where settlements have expanded and agricultural land use has intensified. North of Tri An Lake, declines in EVI were associated with the conversion of former forests into plantation and agricultural areas.
In the core zone, a shift toward higher EVI values was recorded, with areas in the 0.5–0.6 range totaling 145.67 km2.
These negative trends had minimal impact on the core zone (affecting less than 1%) and were confined to areas influenced by seasonal fluctuations of water bodies or managed for agriculture and forestry (Figure 5).
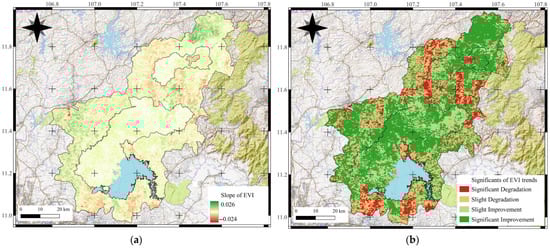
Figure 5.
Sen’s slope (a) and statistical significance of EVI trends (b) in the Dong Nai Biosphere Reserve.
Conversely, 42% of the buffer zone and 58% of the core zone exhibited statistically significant improvements in EVI values.
3.2. Analysis of Land Cover
3.2.1. Land Cover CCI Data
According to the CCI Land Cover dataset, the predominant land cover type within the Dong Nai Biosphere Reserve is evergreen broadleaved forest (tree cover, broadleaved, evergreen, closed to open). Since 1992, a gradual decline in its extent has been observed, with the most pronounced changes occurring between 1992 and 2005 (from 2296 km2 to 1671 km2). From 2015 to 2022, however, a slight recovery was recorded (from 1560 km2 to 1581 km2).
Rainfed croplands represent the second largest land cover category. Their extent increased from 518 km2 in 1992 to 605 km2 in 2012, followed by a slight decrease to 581 km2 in 2022. At the same time, irrigated croplands expanded from 385 km2 to 401 km2. The category mosaic tree and shrub (>50%)/herbaceous cover (<50%) showed a significant in-crease, from 393 km2 to 825 km2, while evergreen shrublands also expanded, from 359 km2 to 466 km2.
Urbanized areas exhibited the most dramatic growth, increasing by a factor of 22, with the most rapid expansion occurring after 2002 (Figure 6).
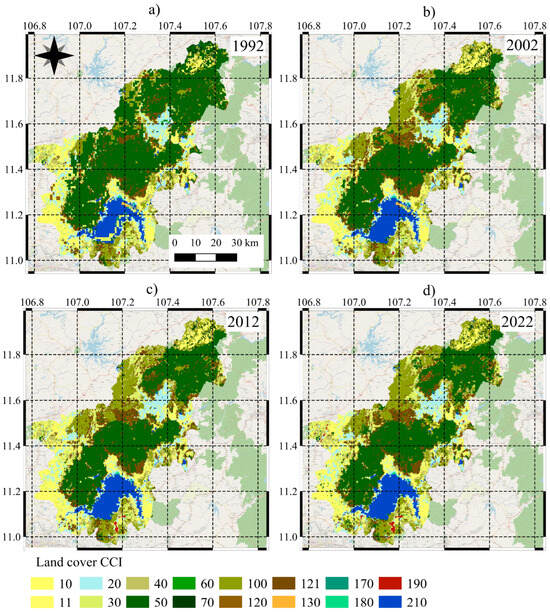
Figure 6.
Land Cover CCI dynamics from 1992 to 2022: (a) 1992, (b) 2002, (c) 2012, (d) 2022 (10—Rainfed cropland, 11—Herbaceous cover, 20—Irrigated cropland, 30—Mosaic cropland > 50%/natural vegetation < 50%, 40—Mosaic natural vegetation > 50%/cropland < 50%, 50—Tree cover, broadleaved, evergreen, closed to open (>15%), 60—Tree cover, broadleaved, deciduous, closed to open (>15%), 70—Tree cover, needleleaved, evergreen, closed to open (>15%), 100—Mosaic tree and shrub (>50%)/herbaceous cover (<50%), 120—Shrubland, 121—Evergreen shrubland, 130—Grassland, 170—Closed (>40%) broadleaved forest or shrubland permanently flooded water, 180—Closed to open (>15%) grassland or woody vegetation on regularly flooded or waterlogged soil, 190—Build up (Urban), 210—Water).
Land Cover CCI data show that the most noticeable changes in the buffer zone from 1992 to 2022 include a 45% decrease in broad-leaved evergreen forests. At the same time, there was a 52% increase in mosaic tree and shrub cover (>50%) mixed with herbaceous vegetation (<50%).
Agricultural land exhibited fluctuations over time: its area increased until 2012, then slightly decreased by 2022. Irrigated agricultural land showed only minor changes. Although urbanized areas occupy only a small portion of the territory, their extent has increased by a factor of 12.8 since 1992, thereby intensifying pressure on the protected area. Overall, the expansion of mosaic forest and shrubland landscapes indicates ongoing fragmentation of natural ecosystems.
It is important to note that major transformations associated with the loss of natural forest cover occurred between 1992 and 2002. Subsequently, these areas were converted to agricultural use, primarily for the cultivation of perennial crops (Table 7).
Table 7.
Land Cover CCI dynamics in the buffer zone of the Dong Nai Reserve (1992–2022), km2.
Regarding land cover dynamics within the core zone of the reserve, the area occupied by broadleaf forest communities decreased from 1118.1 km2 to 1051.4 km2. At the same time, an increase in mosaic and transitional forms of tree vegetation was observed. For example, the area classified as mosaic tree and shrub cover (>50%) with herbaceous vegetation (<50%) decreased by more than half—from 65.7 km2 to 27.2 km2. In addition, the area of shrub-dominated formations increased from 159.1 km2 to 200.0 km2 (Table 8).
Table 8.
Land Cover CCI dynamics in the core zone of the Dong Nai Reserve (1992–2022), km2.
3.2.2. ESRI Land Cover Database
Analysis of ESRI Land Cover data indicates that water bodies remained relatively stable over the study period. Tree cover decreased from 3455 km2 to 2965 km2. Agricultural land demonstrated 44% increase, while urbanized areas expanded by a factor of 1.6. In contrast, herbaceous vegetation declined from 259 km2 to 216 km2 (Figure 7).
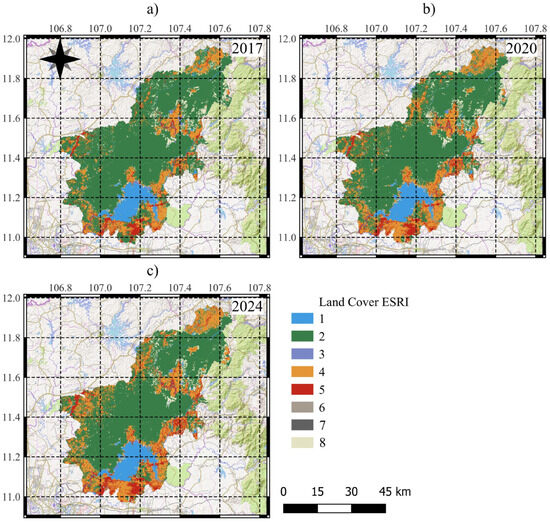
Figure 7.
ESRI Land Cover dynamics in the Dong Nai Biosphere Reserve: (a) 2017, (b) 2020, (c) 2024, km2 (1—water bodies, 2—tree vegetation, 3—aquatic vegetation, 4—agricultural land, 5—built-up areas, 6—bare soil, 7—clouds, 8—herbaceous vegetation).
Analysis of the ESRI Land Cover database revealed that, since 2017, there has been a 23% decline in terrestrial cover dominated by tree vegetation. Concurrently, the area occupied by agricultural crops increased by 33%. Over the five-year period, the extent of residential areas also expanded markedly by 38%. In contrast, the area covered by herbaceous vegetation decreased by 19% from 224.0 km2 to 182.5 km2 (Table 9).
Table 9.
ESRI Land Cover dynamics in the buffer zone of the Dong Nai Biosphere Reserve, km2.
Satellite image analysis combined with field survey results indicates that the pronounced reduction in tree vegetation is likely attributable to timber harvesting in plantations (e.g., teak or Australian acacia), rather than clear-cutting of natural forests. Post-harvest, these areas are classified by the ESRI Land Cover dataset as agricultural land.
In comparison with the buffer zone, the core zone of the Dong Nai Biosphere Re-serve—encompassing the Ma Da Forest and Cat Tien National Park—shows relatively stable tree vegetation dynamics. However, the area of built-up land increased more than two-fold, while agricultural land expanded by 20% from 15.6 km2 to 19.7 km2 (Table 10).
Table 10.
ESRI Land Cover dynamics in the core zone of the Dong Nai Biosphere Reserve, km2.
3.2.3. Land Cover Using the Random Forest (RF) Algorithm
The majority of the Dong Nai Biosphere Reserve is occupied by perennial plantations (35%), degraded forest (24%), and bamboo communities (11%). Between 2000 and 2024, the extent of built-up areas increased fifteenfold, grassland expanded sevenfold, and agricultural land tripled. The area of Lagerstroemia-dominated forest increased by a factor of 3.7, while Dipterocarpaceae forest expanded only slightly (1.1 times). Bare soil has almost completely disappeared (Figure 8, Table 11).
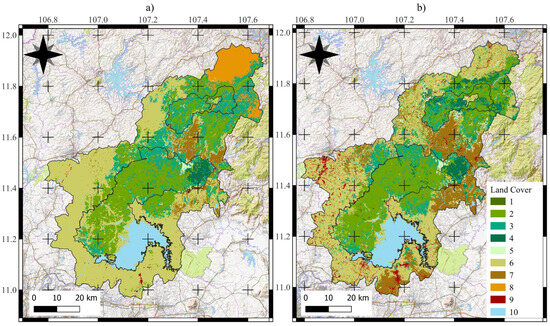
Figure 8.
Land cover classification in the Dong Nai Biosphere Reserve, 2000 (a) and 2024 (b) (1—Dipterocarpaceae forest, 2—Degraded forest, 3—Bamboo communities, 4—Lagerstroemia-dominated forest, 5—Grassland, 6—Perennial plantations, 7—Agricultural land, 8—Bare soil, 9—Build up areas, 10—Water bodies).
Table 11.
Land Cover Using the Random Forest (RF) algorithm of the Dong Nai Biosphere Reserve, km2.
In buffer-zone bamboo forests (declining from 481.3 to 327.8 ha) and degraded forests (from 482.0 to 420.3 ha), both decreased in extent, which can be interpreted as a result of land use conversion as well as successional recovery, with a transition towards Lagerstroemia-dominated forests (expanding from 4.3 to 121.3 ha). Dipterocarp forests were virtually absent throughout the study period. The marked reduction in bamboo communities indicates a shift in dominant vegetation formations. At the same time, grasslands expanded substantially (from 4.9 to 90.2 ha), with an even more pronounced increase in agricultural land (from 220.7 to 707.2 ha). Plantations and fruit trees decreased (from 1908.5 to 1673.1 ha), reflecting their conversion into other land use categories. Build up areas increased more than fifteenfold (from 9.7 to 147.5 ha), indicating the intensification of urbanization processes within the buffer zone. Bare soil nearly disappeared (from 316.6 to 0.1 ha), suggesting its incorporation into agricultural use. Water bodies showed only a slight increase (from 26.6 to 39.4 ha).
Within the core zone, the area of degraded forest expanded considerably (from 745.1 to 852.7 ha), primarily at the expense of previously deforested lands. The extent of dipterocarp forest declined only marginally (from 6.2 to 6.1 ha), indicating the persistence of small relict stands. A marked reduction in bamboo forests (from 350.4 to 265.0 ha) was accompanied by a substantial increase in Lagerstroemia-dominated forests (from 63.2 to 132.8 ha), reflecting successional dynamics and the gradual recovery of arboreal communities. Plantations and fruit trees decreased notably (from 240.4 to 164.2 ha), largely due to land conversion into other categories. Bare soils nearly disappeared (from 10.4 to 0.0 ha), suggesting natural revegetation processes or subsequent land use. Urban areas expanded more than tenfold (from 0.1 to 1.2 ha), underscoring that anthropogenic development, although limited in scale, is nevertheless evident even within the core zone.
3.3. Analysis of Landscape Metrics
3.3.1. Analysis and Dynamics of Landscape Metrics
The Class Area (CA) across different land cover types ranges from 15.16 ha for Bare soil to 179,922.03 ha for Plantations and fruit trees. The Percentage of Landscape (PLAND) varies from 0.0029% for Bare soil to 34.76% for Plantations and fruit trees. The Number of Patches (NP) ranges from 7 for Bare soil to 4439 for Bamboo. The Largest Patch Index (LPI) varies from 0.0009% for Bare soil to 12.94% for Degraded forest. Edge Density (ED) ranges from 0.01 m/ha for Bare soil to 26.23 m/ha for Plantations and fruit trees. The Mean Patch Area (AREA_MN) fluctuates between 2.17 ha for Bare soil and 64.26 ha for Plantations and fruit trees. The Shape Index (SHAPE) shows less variability, ranging from 1.36 for Bare soil to 1.90 for Water (Table 12).
Table 12.
Landscape metrics for different land cover classes in the Dong Nai Biosphere Reserve, 2024.
Artificial forest plantations and perennial crops occupy the largest share of the territory, covering approximately 1799 km2 (34.7%), with the largest single patch accounting for over 10.13% of the total area. The high mean patch area (64 ha) further indicates compact spatial distribution and low fragmentation within this land cover class, confirming its spatial dominance.
Disturbed forests also occupy a substantial proportion of the landscape (24.1%), with relatively high values for both the Largest Patch Index (12.94%) and mean patch area (45.1 ha), suggesting the presence of extensive forest blocks with structurally altered characteristics. Natural forests—those dominated by Dipterocarpaceae (0.14%) and Lagerstroemia (4.81%)—are limited in extent and highly fragmented, as evidenced by low LPI values and small mean patch sizes. These communities occur as isolated remnants scattered across the landscape.
Bamboo communities (11.22%) and grassland (3196%) exhibit relatively uniform spatial distribution, characterized by low LPI values and moderate mean patch sizes. Within the core zone of the reserve, these vegetation types are primarily associated with stream corridors and water bodies. Build up areas (2.84%) and bare soil (15.1 ha%) are represented by small, isolated patches with extremely low values for both the Largest Patch Index (LPI) and mean patch area, indicating high spatial discontinuity. Water bodies (6.3%) exhibit a high mean patch area of 93.5 ha.
According to the results of edge density (ED, m/ha) analysis—which reflects landscape fragmentation and heterogeneity—the highest ED values were recorded for plantation and fruit trees (26.23 m/ha) and bamboo communities (19.51 m/ha), indicating a high degree of boundary dissection within these land cover types. Bamboo communities are spatially associated with areas of increased moisture availability; their branching pattern corresponds to the dendritic structure of the stream network. Similarly, degraded forests show elevated ED values (19.37 m/ha), reflecting their fragmented nature.
Moderate ED values were observed for agricultural land (15.14 m/ha), which are typically characterized by more regular and clearly defined boundaries, and for forests dominated by Lagerstroemia (7.30 m/ha), whose large and relatively intact patches are primarily located within Cat Tien National Park, indicating a more coherent spatial structure. Relatively low ED values were recorded for urban areas (6.80 m/ha) and herbaceous vegetation (4.60 m/ha). The lowest edge density was found in Dipterocarpaceae-dominated forests (0.31 m/ha), consistent with their highly limited spatial extent.
The adjacency matrix (Appendix A) indicates that artificial perennial plantations share extensive boundaries with nearly all major land cover classes, particularly degraded forests (99.99 km), bamboo communities (117.89 km), Lagerstroemia-dominated forests (23.85 km), and agricultural lands (71.19 km). This highlights their central role within the spatial mosaic and their function as transitional zones between natural ecosystems and intensively used agricultural areas. In contrast, intact natural forests exhibit limited edge adjacency with other land cover types, underscoring their spatial isolation within the broader landscape matrix.
Over the 24-year period, substantial changes in landscape metrics were observed. The most pronounced decline was recorded for artificial perennial plantations: their total area (Class Area, CA, USA) decreased from 2154.7 km2 (41.6% of the territory) in 2000 to 1799.2 km2 (34.8%) in 2024 (Table 13). At the same time, NP increased from 2409 to 2800, while the LPI decreased significantly from 30.6% to 10.1%, indicating fragmentation of previously extensive monoculture blocks. ED also rose from 15.8 to 26.2 m/ha, reflecting increasing linear fragmentation.
Table 13.
Landscape metrics for various land cover classes in the Dong Nai Biosphere Reserve, 2000.
Landscape metrics for disturbed forests remained relatively stable over the study period. Bamboo communities experienced a notable reduction in area, with CA declining from 832.5 km2 to 580.5 km2. In parallel, NP increased from 3340 to 4439, and LPI fell from 3.2% to 1.0%. Edge density remained high (19–20 m/ha), indicating an increasing number of smaller, dispersed patches. At the same time irrigated agricultural lands expanded substantially, from 227.9 km2 to 717.1 km2, with NP rising sharply from 1129 to 3520, reflecting active land conversion.
Forests dominated by Dipterocarpaceae showed signs of reduced fragmentation: CA increased slightly from 6.64 km2 to 7.05 km2, NP declined from 184 to 121, LPI remained negligible, and ED decreased from 0.4 to 0.3 m/ha—suggesting consolidation of smaller fragments into more cohesive forest blocks. Bare soil cover nearly disappeared: CA declined drastically from 32,798 ha to just 15 ha, and NP dropped from 493 to 7, indicating reclamation and reuse of these lands, primarily for plantations. Built-up areas expanded markedly—from 982 ha to 14,565 ha—with PLAND increasing from 0.2% to 2.8%. The number of patches more than doubled, LPI remained minimal, and ED doubled, reflecting the continued spatial dispersion of urban infrastructure. Water bodies increased slightly in area, from 31,474 ha to 32,941 ha, with NP rising from 174 to 352. LPI remained constant at 5.5%, while ED increased from 2.2 to 2.9 m/ha. These changes are likely due to river regulation and the construction of artificial ponds and reservoirs in the buffer zone.
3.3.2. Landscape Metrics of Functional Zones of the Biosphere Reserve
The following differences are observed for the calculated metrics at the landscape level of the functional zones of the biosphere reserve (Table 14).
Table 14.
Landscape metrics of functional areas of the reserve.
In 2000, the core zone exhibited relatively low LPI values (24%), which increased by 29% by 2024, indicating the merging of separate fragments. In contrast, the buffer zone showed an opposite trend: its LPI value decreased 2.3-fold.
The edge density (ED) metric increased in both zones of the biosphere reserve, particularly in the buffer zone, where it rose by a factor of 1.8. This reflects the emergence of more dissected landscapes. Similar tendencies were observed for the landscape shape index (LSI), which increased most substantially in the buffer zone (1.8-fold). This indicates that landscape forms became more irregular, with greater total boundary length within these zones. For the MESH index, the core zone experienced a 36% increase, whereas in the buffer zone this value declined threefold, suggesting that landscapes there underwent pronounced fragmentation.
3.3.3. Dynamics of the Human Disturbance Index
The HDI was calculated for the years 2000 and 2024 to assess temporal changes in anthropogenic pressure on the landscape (Figure 9).
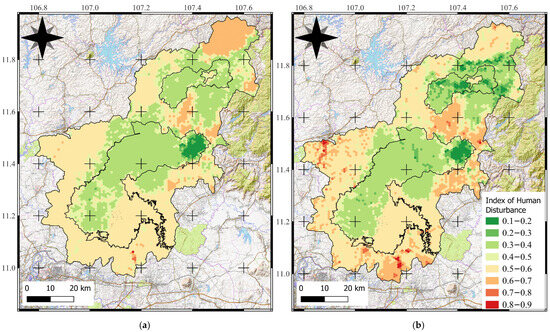
Figure 9.
Spatial distribution of the Human Disturbance Index in 2000 (a) and 2024 (b).
In 2000, areas characterized by low to moderate levels of anthropogenic pressure predominated. The mean HDI value across the study area was 0.478. By 2024, the average remained nearly unchanged at 0.479. However, the spatial distribution of HDI values showed a marked shift: the coefficient of variation increased significantly—from 3.3 in 2000 to 19.1 in 2024.
Regarding the spatial distribution of the Human Disturbance Index (HDI) within the Dong Nai Biosphere Reserve, in 2000 the lowest values were observed in Cat Tien Nation-al Park and the Cat Loc sector (0.34), classifying these landscapes as oligogemerobic. Higher values were recorded for the Ma Da forest block (0.39), corresponding to mesoge-merobic landscapes. In the buffer zone overall, landscapes approached beta-eugemerobic conditions (0.51). By 2024, mean index values in the core zones decreased to 0.32 in the Cat Tien and Cat Loc sectors and to 0.37 in the Ma Da forest block, while in the buffer zone the value slightly decreased from 0.52 to 0.51.
This indicates a growing spatial heterogeneity of human pressure, with localized intensification observed primarily in the buffer zone, while anthropogenic influence within the core zone declined.
Additionally, an increase in disturbance levels was recorded in the area between the two core sectors of the reserve—Cat Tien and Cat Loc—leading to further spatial separation and fragmentation of these ecologically significant units.
4. Discussion
4.1. The Structural Changes in the Landscapes
The results of this study reveal significant structural changes in the landscapes of the Dong Nai Biosphere Reserve between 2000 and 2024.
Positive trends in vegetation recovery have been observed over the past 30–35 years in the Dong Nai Biosphere Reserve, based on the EVI and land cover dynamics. These observed trends are consistent with the findings of previous studies.
Several parts of the Dong Nai Biosphere Reserve have previously been analyzed in studies focusing on vegetation index dynamics and land cover change. For example, NDVI time series from 1973 to 2014 in Lam Dong Province (which includes Cat Tien National Park and Bidoup-Nui Ba National Park) showed overall positive trends in forested areas [44]. A positive trend was also observed across most of the province’s territory [44].
Vegetation recovery occurred unevenly. A combined analysis of temporally distinct land cover maps revealed forest loss during the 1990s, accompanied by a twofold increase in mosaic tree and shrub cover in the affected areas. After 2000, forest restoration became evident, with the area of Lagerstroemia-dominated forest increasing fourfold. Between 2017 and 2022, forest area remained largely stable. These observed trends are corroborated by other studies. For instance, land cover dynamics and vegetation indices were also examined within Cat Tien National Park, excluding the Cat Loc sector, for the period from 1988 to 2019. However, the classification included only five land cover types: broadleaf forests, mixed forests, grasslands, unvegetated lands, and wetlands. Natural vegetation recovery processes have been noted since 2003, with NDVI dynamics indicating improvements [45].
Although EVI trends and Land cover dynamics were generally positive, earlier satellite observations suggest that much of the natural forest cover had already been removed in preceding decades. Conservation efforts have since been implemented to protect the remaining intact forest fragments: Cat Tien National Park was designated a World Heritage Site in 2001, and the Ma Da Forest Reserve was established in 2004.
During the study period, the area experienced intensive agricultural expansion, which contributed to an increase in EVI values. The area of agricultural land increased threefold over the period 2000–2024. However, the recorded rise in EVI does not indicate the recovery of natural ecosystems. On the contrary, it reflects the replacement of native vegetation with agroecosystems, leading to a decline in biodiversity and a simplification of vegetation structure within the protected area.
Data from ESRI Land Cover indicated a decline in forested areas alongside the expansion of agricultural and urban lands. However, this primarily reflects logging in previously transformed plantations rather than deforestation of natural forests.
Land Cover CCI data (1992–2022) confirmed a decrease in the area of tall broadleaved forests with complex vertical structure and an increase in mosaic and shrub vegetation, as well as urbanized or settlement areas, thereby intensifying pressure on protected ecosystems.
4.2. Dynamics of Landscapes of Different Functional Zones
Landscapes across the different functional zones of the Dong Nai Biosphere Reserve exhibit varying dynamics.
According to the Mann–Kendall test and Sen’s slope estimations, a positive EVI trend prevailed in both the core (67.2%) and buffer (62%) zones. Spatial analysis of EVI values indicated a general increase in high-productivity zones (0.5–0.6), particularly within the core zone, suggesting vegetation stabilization or recovery in these areas. The core zone remained relatively stable. However, the inability to differentiate between natural and artificial forests limits the comprehensiveness of the ecosystem assessment.
At the same time, conflicting trends are observed in the buffer zone: some areas showed degradation (EVI near 0) coexist alongside zones of increasing productivity, indicating ongoing landscape fragmentation and growing anthropogenic pressure, primarily driven by agricultural use. Zones of significant decline were localized primarily in the southern buffer zone and in areas converted from forest to agriculture.
Within the core zone, some evidence of vegetation regeneration—particularly of tree species—was observed. Nevertheless, the data do not conclusively confirm successional recovery of primary tropical forest. Notably, a significant decline in EVI values was recorded in the area between the two core sectors of the reserve, threatening ecological connectivity and contributing to the “island effect” within forest ecosystems.
Findings from other researchers support the differentiation between core and buffer zone landscapes. For instance, NDVI time series from 1973 to 2014 in Lam Dong Province indicated that most changes were concentrated in the buffer zones [44].
Study [45] noted that in the majority of inland forest areas, including Cat Tien Na-tional Park, signs of degradation were virtually absent, with changes occurring primarily in the buffer zones. Our analysis confirms that these trends are still ongoing.
4.3. Anthropogenic Factors of Landscape Dynamics
The current land use structure and anthropogenic pressure have significantly affected the natural landscapes of the Dong Nai Biosphere Reserve. In the Ma Da and Cat Tien protected forest areas, this impact is manifested as structural degradation—both vertical and horizontal. During field surveys, the absence of a well-developed upper canopy layer was documented in certain forest plots. Tropical forests are particularly sensitive to disruptions in their vertical structure.
In tall dipterocarp forests, the canopy creates a unique microclimate characterized by high humidity, minimal air circulation beneath the canopy, and the inherently low flammability of dominant overstory species. These characteristics contribute to the natural fire resistance of these ecosystems. The loss of the upper canopy promotes the proliferation of subcanopy tree species and lianas, alters the microclimate by increasing air temperature and direct solar radiation in the understory, and can ultimately raise the risk of fire occurrence [37].
The degradation of forest structure in the study area is also linked to the historical use of defoliants and napalm during the American War in Vietnam. Light dipterocarp forests were especially vulnerable to these chemical impacts. Industrial and selective logging have also played a significant role, particularly in primary forests where large, high-biomass trees still persist [37]. Although such trees typically constitute less than 5% of forest biomass, they may store up to 50% of aboveground carbon [46]. Given the slow growth of many Dipterocarpaceae species, recovery may take over a century—many do not flower or produce seeds until they reach 80–100 years of age [47]. This severely limits the adaptive capacity and long-term stability of forest ecosystems.
In several areas, natural forests have been replaced with managed plantations of fast-growing species such as Australian acacia, primarily harvested for fuelwood. These plantation systems are subject to repeated anthropogenic disturbance, which inhibits the development of stable biogeocoenotic structures. Additionally, perennial fruit plantations (e.g., mango and cashew) are widespread throughout the buffer zone and have also encroached into parts of the core protected area.
Commonly used datasets such as ESRI Land Cover and Land Cover CCI are unable to distinguish these artificial vegetation types. Post-harvest, they are often misclassified as croplands, especially in riparian zones and near artificial water bodies.
Another manifestation of anthropogenic pressure is the regulation of river flow, which has significantly altered the regional hydrological and landscape structure. The largest water body within the core zone of the reserve—Tri An Reservoir (232 km2)—is an artificial impoundment constructed for hydropower generation and water storage.
Settlement areas, as a factor of landscape fragmentation, consist primarily of low-rise buildings. Their extent within the Dong Nai Biosphere Reserve increased 14-fold over the period 2000–2024. The largest populated settlements are located in the southern part of the biosphere reserve’s buffer zone due to their proximity to Ho Chi Minh City. Elsewhere, settlements occur as small fragments scattered within agricultural lands.
Increasing the area of agricultural land due to deforestation is a general trend for the region [48]. For example, a study conducted in Quang Nam Province showed that forest cover had been increasing since 1998 but significantly declined between 2010 and 2020 due to active urbanization and agricultural expansion. Landscape metrics analysis, including patch density, edge density, and largest patch index, indicated an intensification of forest fragmentation [49]. The use of landscape metrics for mapping and analyzing spatial pattern changes in tropical forests in Thua Thien Hue Province from 2007 to 2016 demonstrated that natural forests experienced intensified fragmentation, with an increase in forest landscape area accompanied by a decrease in patch size and disproportionate patch distribution [50].
4.4. Management Recommendations
The dynamics of landscapes in the Dong Nai Biosphere Reserve under increasing anthropogenic pressure, both in the buffer zone and the core area, are compromising the effectiveness of conservation efforts and the achievement of the reserve’s objectives. The conservation regime is best maintained within Cat Tien National Park. Therefore, enhanced protection is required for the Ma Da Forest, which still contains remnants of primary tropical forest. It is recommended to reduce or prohibit the use of forest land for plantation forestry, particularly Australian acacia. To mitigate potential socio-economic impacts on local communities resulting from reduced income from acacia harvesting, the development of ecotourism is suggested. An effective ecotourism model has already been successfully implemented in Cat Tien National Park, featuring established ecological trails, trained guides, and appropriate tourist infrastructure. A similar ecotourism framework could be developed in the Ma Da Forest to support both conservation and local livelihoods.
To ensure the long-term protection of core forest ecosystems, new residential construction within the core zone should be strictly prohibited. Between 2000 and 2024, built-up areas within the reserve’s core zone doubled in extent.
Forest restoration efforts should prioritize native species, especially dipterocarp forests. Establishing a dedicated nursery for seedling propagation and subsequent reforestation is essential. The use of science-based silvicultural practices will enhance the efficiency of forest restoration and accelerate the recovery of native ecosystems.
5. Conclusions
Forest restoration within the Dong Nai Biosphere Reserve has been observed over the past 35 years. Increases in forest cover are indicated by trends in the EVI and land cover dynamics. The area of Lagerstroemia-dominated forest increased by a factor of 3.7, while Dipterocarpaceae forest expanded only slightly (1.1 times).
The Dong Nai Biosphere Reserve is characterized by a complex structure, comprising functional zones with diverse land use types that exhibit different landscape dynamics. While some forest recovery occurs within the core zone, the buffer zone experiences increasing pressures from agricultural expansion and urban development.
The landscapes of the Dong Nai Biosphere Reserve are subject to complex anthropogenic pressures. Landscape metrics derived from the 2024 land cover map showed the spatial dominance of artificial plantations and perennial crops, with high edge densities especially in degraded forests, indicating high fragmentation. Natural forests were found to be the most isolated. The adjacency matrix confirmed that artificial plantations act as transitional zones between natural and agricultural systems.
According to the HDI calculation results, areas with low to moderate anthropogenic pressure predominated in 2000, with an average index value of 0.478 across the territory. By 2024, the average value remained nearly unchanged at 0.479; however, the distribution of values shifted severely. The coefficient of variation increased from 3.3 in 2000 to 19.1 in 2024, indicating a localized intensification of anthropogenic impact in the buffer zone, while anthropogenic pressure decreased within the core zone.
Author Contributions
Conceptualization, R.G., A.K. and D.H.N.; methodology, N.L., R.G. and E.K.; validation, R.G., E.K., T.G., C.N.P., A.K., S.K., D.H.N., V.A.T.D. and E.C.; formal analysis, N.L., R.G., E.K., T.G., P.D., C.N.P., A.K., S.K., D.H.N., V.A.T.D. and E.C.; investigation, N.L., R.G., E.K., T.G., P.D., C.N.P., A.K., S.K., D.H.N., V.A.T.D., T.D.N. (Trung Dung Ngo), T.D.N. (Thanh Dat Ngo) and E.C.; resources, N.L., E.K., C.N.P., A.K., S.K., D.H.N. and V.A.T.D.; data curation, R.G., C.N.P., A.K., S.K., D.H.N. and V.A.T.D.; writing—original draft preparation, N.L., R.G., E.K., T.G., P.D., C.N.P., A.K., S.K., D.H.N., V.A.T.D., T.D.N. (Trung Dung Ngo), T.D.N. (Thanh Dat Ngo) and E.C.; writing—review and editing, N.L., R.G., E.K. and T.G.; visualization, N.L. and E.K.; supervision, R.G., A.K. and D.H.N.; project administration, R.G., A.K. and D.H.N. All authors have read and agreed to the published version of the manuscript.
Funding
This study was carried out within the framework of E-1.3 “Studying the functioning and dynamics of landscapes in Central and Southern Vietnam under anthropogenic pressure and climate change, in order to establish scientific principles for their rational utilization” of Joint Russian-Vietnamese Tropical Research and Technology Center and IBSS state research assignment “Studying the features of the functioning and dynamics of subtropical and tropical coastal ecosystems under the climate change and anthropogenic load using remote sensing, cloud information processing, and machine learning to create a scientific basis for their rational use”, registration number: 124030100030-0.
Data Availability Statement
Dataset available upon request from the authors.
Conflicts of Interest
The authors declare no conflicts of interest. The funders had no role in the design of the study, in the collection, analyses, or interpretation of data, in the writing of the manuscript, or in the decision to publish the results.
Abbreviations
| RS | Remote sensing |
| EVI | Enhanced Vegetation Index |
| ESRI | Environmental Systems Research Institute |
| NDVI | Normalized Difference Vegetation Index |
| LULC | land use/land cover |
| HDI | Human Disturbance Index |
| GEE | Google Earth Engine |
| API | Application Programming Interface |
| NDBI | Normalized Difference Built-up Index |
| MNDWI | Modified Normalized Difference Water Index |
| BSI | Bare Soil Index |
| CA | Class Area |
| PLAND | Percentage of Landscape |
| NP | Number of Patches |
| LPI | Largest Patch Index |
| ED | Edge Density |
| HI | Hemeroby Index |
Appendix A
Table A1.
The f matrix of landscapes, Dongnai biosphere reserve.
Table A1.
The f matrix of landscapes, Dongnai biosphere reserve.
| Land Cover | Dipterocarp Forest | Degraded Forest | Bamboo | Lager- Stroemia Forest | Grassland | Plantation and Fruit Trees | Agriculture Land | Bare Soil | Build Up Areas | Water |
|---|---|---|---|---|---|---|---|---|---|---|
| Dipterocarp forest | 26,536 | 5123 | 60 | 0 | 0 | 269 | 0 | 0 | 0 | 0 |
| Degraded forest | 5123 | 5,319,024 | 178,260 | 59,810 | 6365 | 70,212 | 15,289 | 11 | 507 | 2185 |
| Bamboo | 60 | 178,260 | 2,292,754 | 33,879 | 5170 | 87,634 | 32,248 | 33 | 891 | 2032 |
| Lagerstroemia forest | 0 | 59,810 | 33,879 | 1,001,552 | 4813 | 19,931 | 8189 | 0 | 135 | 495 |
| Grassland | 0 | 6365 | 5170 | 4813 | 380,562 | 27,900 | 29,845 | 9 | 4863 | 1286 |
| Plantation and fruit trees | 269 | 70,212 | 87,634 | 19,931 | 27,900 | 7,698,084 | 137,303 | 130 | 85,271 | 28,729 |
| Agriculture land | 0 | 15,289 | 32,248 | 8189 | 29,845 | 137,303 | 2,984,760 | 3 | 25,765 | 15,289 |
| Bare soil | 0 | 11 | 33 | 0 | 9 | 130 | 3 | 496 | 6 | 0 |
| Build up areas | 0 | 507 | 891 | 135 | 4863 | 85,271 | 25,765 | 6 | 541,580 | 1150 |
| Water | 0 | 2185 | 2032 | 495 | 1286 | 28,729 | 15,289 | 0 | 1150 | 1,442,900 |
References
- Gardner, T.A.; Barlow, J.; Chazdon, R.; Ewers, R.M.; Harvey, C.A.; Peres, C.A.; Sodhi, N.S. Prospects for tropical forest biodiversity in a human-modified world. Ecol. Lett. 2009, 12, 561–582. [Google Scholar] [CrossRef]
- Laurance, W.F.; Sayer, J.; Cassman, K.G. Agricultural expansion and its impacts on tropical nature. Trends Ecol. Evol. 2013, 29, 107–116. [Google Scholar] [CrossRef] [PubMed]
- Barlow, J.; Lennox, G.D.; Ferreira, J.; Berenguer, E.; Lees, A.C.; Nally, R.M.; Thomson, J.R.; de Barros Ferraz, S.F.; Louzada, J.; Oliveira, V.H.F.; et al. Anthropogenic disturbance in tropical forests can double biodiversity loss from deforestation. Nature 2016, 535, 144–147. [Google Scholar] [CrossRef] [PubMed]
- Whitmore, T.C. An Introduction to Tropical Rain Forests; Clarendon Press: Oxford, UK, 1990; 226p. [Google Scholar]
- Pan, Y.; Birdsey, R.A.; Fang, J.; Houghton, R.; Kauppi, P.E.; Kurz, W.A.; Phillips, O.L.; Shvidenko, A.; Lewis, S.L.; Canadell, J.G.; et al. A large and persistent carbon sink in the world’s forests. Science 2011, 333, 988–993. [Google Scholar] [CrossRef] [PubMed]
- Gibbs, H.K.; Ruesch, A.S.; Achard, F.; Clayton, M.K.; Holmgren, P.; Ramankutty, N.; Foley, J.A. Tropical forests were the primary sources of new agricultural land in the 1980s and 1990s. Proc. Natl. Acad. Sci. USA 2010, 107, 16732–16737. [Google Scholar] [CrossRef]
- Obani, I.P.; Obani, Z.I.; Anaeto, P.F.C.; Akroh, T.O.; Nwachukwu, C.S. Impact of Deforestation on Carbon Emissions: A Data-Driven Study of the Amazon and Southeast Asia. Eur. J. Life Saf. Stab. 2025, 50, 17–36. [Google Scholar]
- Nguyen, T.T.H.; Singh, R. (De)Forestation in Vietnam: A political ecology perspective. In E3S Web of Conferences; EDP Sciences: Les Ulis, France, 2020; Volume 203, p. 03013. [Google Scholar]
- Dang, T.K.P.; Van Der Zouwen, M.; Arts, B. Challenges of forest governance: The case of forest rehabilitation in Vietnam. Public Organ. Rev. 2019, 19, 425–452. [Google Scholar] [CrossRef]
- Moraes, M.C.P.; Mello, K.; Toppa, R.H. Protected areas and agricultural expansion: Biodiversity conservation versus economic growth in the Southeast of Brazil. J. Environ. Manag. 2017, 188, 73–84. [Google Scholar] [CrossRef]
- Marsh, C.; Turner, E.; Blonder, B.; Bongalov, B.; Both, S.; Cruz, R.; Elias, D.; Hemprich-Bennett, D.; Jotan, P.; Kemp, V.; et al. Tropical forest clearance impacts biodiversity and function, whereas logging changes structure. Science 2025, 387, 171–175. [Google Scholar] [CrossRef]
- Numata, S.; Yamaguchi, K.; Shimizu, M.; Sakurai, G.; Morimoto, A.; Alias, N.; Azman, N.Z.N.; Hosaka, T.; Satake, A. Impacts of climate change on reproductive phenology in tropical rainforests of Southeast Asia. Commun. Biol. 2022, 5, 311. [Google Scholar] [CrossRef]
- Crowley, M.A.; Cardille, J.A. Remote sensing’s recent and future contributions to landscape ecology. Curr. Landsc. Ecol. Rep. 2020, 5, 45–57. [Google Scholar] [CrossRef]
- Huete, A.R.; Didan, K.; Shimabukuro, Y.E.; Ratana, P.; Saleska, S.R.; Hutyra, L.R.; Yang, W.; Nemani, R.R.; Myneni, R. Amazon rainforests green-up with sunlight in dry season. Geophys. Res. Lett. 2006, 33, 1–4. [Google Scholar] [CrossRef]
- Riitters, K.; Wickham, J.; O’Neill, R.; Jones, B.; Smith, E. Global-scale patterns of forest fragmentation. Conserv. Ecol. 2000, 4, 3. [Google Scholar] [CrossRef]
- McGarigal, K.; Cushman, S.A.; Ene, E. FRAGSTATS v4: Spatial Pattern Analysis Program for Categorical and Continuous Maps; University of Massachusetts: Amherst, MA, USA, 2012. [Google Scholar]
- Grizzetti, B.; Lanzanova, D.; Liquete, C.; Reynaud, A.; Cardoso, A.C. Assessing water ecosystem services for water resource management. Environ. Sci. Policy 2016, 61, 194–203. [Google Scholar] [CrossRef]
- Wellmann, T.; Haase, D.; Knapp, S.; Salbach, C.; Selsam, P.; Lausch, A. Urban land use intensity assessment: The potential of spatio-temporal spectral traits with remote sensing. Ecol. Indic. 2018, 85, 190–203. [Google Scholar] [CrossRef]
- Jalas, J. Hemerobe und hemerochore Pflanzenarten in der zentralen borealen Zone Finnlands. Ann. Bot. Soc. Zool.-Bot. Fenn. Vanamo 1955, 26, 1–100. [Google Scholar]
- Walz, U.; Stein, C. Indicators of hemeroby for the monitoring of landscapes in Germany. J. Nat. Conserv. 2014, 22, 279–289. [Google Scholar] [CrossRef]
- Vietnam National Authority of Tourism. Dong Nai Biosphere Reserve Gets World Recognition. Available online: https://vietnamtourism.gov.vn/en/post/4756 (accessed on 5 October 2025).
- Deshcherevskaya, O.A.; Avilov, V.K.; Ba Duy, D.; Cong Huan, T.; Kurbatova, J.A. Modern Climate of the Cát Tiên National Park (Southern Vietnam): Climatological Data for Ecological Studies. Izv. Atmos. Ocean. Phys. 2013, 49, 819–838. [Google Scholar] [CrossRef]
- Averyanov, L.V.; Phan, K.L.; Nguyen, T.H.; Harder, D.K. Phytogeographic review of Vietnam and adjacent areas of Eastern Indochin. Komarovia 2003, 3, 1–83. [Google Scholar]
- Liu, H.Q.; Huete, A.R. A feedback based modification of the NDV I to minimize canopy background and atmospheric noise. IEEE Trans. Geosci. Remote Sens. 1995, 33, 457–465. [Google Scholar] [CrossRef]
- Liu, Y.; Meng, Q.; Zhang, L.; Wu, C. NDBSI: A normalized difference bare soil index for remote sensing to improve bare soil mapping accuracy in urban and rural areas. Catena 2022, 214, 106265. [Google Scholar] [CrossRef]
- Gao, B.-C. NDWI—A Normalized Difference Water Index for Remote Sensing of Vegetation Liquid Water From Space. Remote Sens. Environ. 1996, 58, 257–266. [Google Scholar] [CrossRef]
- Rikimaru, A.; Roy, P.S.; Miyatake, S. Tropical forest cover density mapping. Trop. Ecol. 2024, 3, 39–47. [Google Scholar]
- Sovann, C.; Tagesson, T.; Vestin, P.; Sakhoeun, S.; Kim, S.; Kok, S.; Olin, S. Characteristics of ecosystems under various anthropogenic impacts in a tropical forest region of Southeast Asia. EGUsphere 2025, 2025, 1–44. [Google Scholar] [CrossRef]
- Gu, Z.; Zhang, Z.; Yang, J.; Wang, L. Quantifying the Influences of Driving Factors on Vegetation EVI Changes Using Structural Equation Model: A Case Study in Anhui Province, China. Remote Sens. 2022, 14, 4203. [Google Scholar] [CrossRef]
- Zhang, Q.; Cao, G.; Zhao, M.; Zhang, Y. kNDVI Spatiotemporal Variations and Climate Lag on Qilian Southern Slope: Sen–Mann–Kendall and Hurst Index Analyses for Ecological Insights. Forests 2025, 16, 307. [Google Scholar] [CrossRef]
- Deng, B.; Liu, C.; Zhang, E.; He, M.; Li, Y.; Duan, X. Satellite Observations Reveal Northward Vegetation Greenness Shifts in the Greater Mekong Subregion over the Past 23 Years. Remote Sens. 2024, 16, 3302. [Google Scholar] [CrossRef]
- He, B.; Wu, X.; Liu, K.; Yao, Y.; Chen, W.; Zhao, W. Trends in Forest Greening and Its Spatial Correlation with Bioclimatic and Environmental Factors in the Greater Mekong Subregion from 2001 to 2020. Remote Sens. 2022, 14, 5982. [Google Scholar] [CrossRef]
- ESA. Land Cover CCI Product User Guide Version 2; Technical Report; ESA: Paris, France, 2017; Available online: https://maps.elie.ucl.ac.be/CCI/viewer/download/ESACCI-LC-Ph2-PUGv2_2.0.pdf (accessed on 15 June 2025).
- ArcGIS Living Atlas of the World. Land Cover. Available online: https://livingatlas.arcgis.com/landcover/ (accessed on 25 September 2025).
- Gómez-Fernández, D.; Salas Lopez, R.; Zabaleta-Santisteban, J.; Medina-Medina, A.; Goñas, M.; Silva-López, J.; Oliva-Cruz, M.; Rojas Briceño, N.B. Landsat images and GIS techniques as key tools for historical analysis of landscape change and fragmentation. Ecol. Inform. 2024, 82, 102738. [Google Scholar] [CrossRef]
- Karra, K.; Kontgis, C.; Statman-Weil, Z.; Mazzariello, J.C.; Mathis, M.; Brumby, S.P. Global Land Use/Land Cover with Sentinel 2 and Deep Learning; IEEE: Manhattan, NY, USA, 2021; pp. 4704–4707. [Google Scholar]
- Kuznetsov, A.N. Tropical Dipterocarp Forest: On the Example of a Closed Tall Wet Lowland Dipterocarp Forest of the Ma Da Massif, Southern Vietnam; Pavlov, V.N., Ed.; GEOS: Moscow, Russia, 2003; 140p. (In Russian) [Google Scholar]
- Li, J.; Zhou, Y.; Li, Q.; Yi, S.; Peng, L. Exploring the effects of land use changes on the landscape pattern and soil erosion of Western Hubei Province from 2000 to 2020. Int. J. Environ. Res. Public Health 2022, 19, 1571. [Google Scholar] [CrossRef]
- McGarigal, K. FRAGSTATS Help; University of Massachusetts: Amherst, MA, USA, 2015; p. 182. [Google Scholar]
- Furtado, L.S.; Pereira, R.V.S.; de Souza, E.B. Hemeroby mapping of the Belém landscape in Eastern Amazon and impact study of urbanization on the local climate. Urban. Sci. 2024, 8, 15. [Google Scholar] [CrossRef]
- Kim, D.; Son, Y. An assessment of landscape perception using a normalized naturalness index in the Greater Seoul Area. Land. 2024, 13, 750. [Google Scholar] [CrossRef]
- Shen, S.; Pu, J.; Xu, C.; Wang, Y.; Luo, W.; Wen, B. Effects of human disturbance on riparian wetland landscape pattern in a coastal region. Remote Sens. 2022, 14, 5160. [Google Scholar] [CrossRef]
- Wang, X.-J.; Liu, G.; Xiang, A.; Qureshi, S.; Li, T.; Dezhuo, S.; Zhang, C. Quantifying the human disturbance intensity of ecosystems and its natural and socioeconomic driving factors in the urban agglomeration in southern China. Environ. Sci. Pollut. Res. 2022, 29, 11493–11509. [Google Scholar] [CrossRef] [PubMed]
- Vogelmann, J.E.; Khoa, P.V.; Lan, D.X.; Shermeyer, J.; Shi, H.; Wimberly, M.C.; Duong, H.T.; Huong, L.V. Assessment of forest degradation in Vietnam using Landsat time series data. Forests 2017, 8, 238. [Google Scholar] [CrossRef]
- Kovyazin, V.; Romanchikov, A.; Anh, D.; Viet, H. Monitoring of forest land use/cover change in Cat Tien National Park, Dong Nai Province, Vietnam using remote sensing and GIS techniques. IOP Conf. Ser. Mater. Sci. Eng. 2020, 817, 012018. [Google Scholar] [CrossRef]
- Stephenson, N.; Das, A.; Condit, R.; Russo, S.; Baker, P.; Beckman, N.; Coomes, D.; Lines, E.; Morris, W.; Rüger, N.; et al. Rate of tree carbon accumulation increases continuously with tree size. Nature 2014, 507, 90–93. [Google Scholar] [CrossRef]
- Hayward, R.; Banin, L.; Burslem, D.; Chapman, D.; Philipson, C.; Cutler, M.; Reynolds, G.; Nilus, R.; Dent, D. Three decades of post-logging tree community recovery in naturally regenerating and actively restored dipterocarp forest in Borneo. For. Ecol. Manag. 2021, 488, 119036. [Google Scholar] [CrossRef]
- Nguyen, D.H.; Ngo, C.Z.; Dang, H.K.; Kuznetsov, A.N. Change in natural and anthropogenic landscapes in the Ngoc Linh Nature Reserve, Central Vietnam. Biodivers. Sustain. Dev. 2024, 9, 49–65. (In Russian) [Google Scholar]
- Thien, B.B.; Phuong, V.T.; Ioshpa, A.R. Assessing the environmental destruction in forest cover using landscape metrics and spatial analysis in Quang Nam province, Vietnam. Environ. Earth Sci. 2025, 84, 360. [Google Scholar] [CrossRef]
- Cat Tuong, T.T.; Tani, H.; Wang, X.; Quang Thang, N. Semi-supervised classification and landscape metrics for mapping and spatial pattern change analysis of tropical forest types in Thua Thien Hue Province, Vietnam. Forests 2019, 10, 673. [Google Scholar] [CrossRef]


Disclaimer/Publisher’s Note: The statements, opinions and data contained in all publications are solely those of the individual author(s) and contributor(s) and not of MDPI and/or the editor(s). MDPI and/or the editor(s) disclaim responsibility for any injury to people or property resulting from any ideas, methods, instructions or products referred to in the content. |
© 2025 by the authors. Licensee MDPI, Basel, Switzerland. This article is an open access article distributed under the terms and conditions of the Creative Commons Attribution (CC BY) license (https://creativecommons.org/licenses/by/4.0/).