Article

Assessing Variations in River Networks Under Urbanization Across Metropolitan Plains Using a Multi-Metric Approach

1
School of Resource and Environmental Sciences, Quanzhou Normal University, Quanzhou 362000, China
2
Key Laboratory of Rural Environmental Remediation and Waste Recycling (Quanzhou Normal University), Fujian Province University, Quanzhou 362000, China
3
School of Geography and Ocean Science, Nanjing University, Nanjing 210023, China
4
State Key Laboratory of Water Disaster Prevention, Nanjing Hydraulic Research Institute, Nanjing 210029, China
5
College of Hydraulic Science and Engineering, Yangzhou University, Yangzhou 225000, China
6
School of Resource and Environmental Sciences, Wuhan University, Wuhan 430079, China
*
Author to whom correspondence should be addressed.
Land 2025, 14(10), 1994; https://doi.org/10.3390/land14101994
Submission received: 31 July 2025 / Revised: 27 September 2025 / Accepted: 1 October 2025 / Published: 4 October 2025
(This article belongs to the Section Urban Contexts and Urban-Rural Interactions)

Abstract

Urbanization, characterized by rapid construction land expansion, has transformed natural landscapes and significantly altered river networks in emerging metropolitan areas. Understanding the historical and current conditions of river networks is crucial for policy-making in sustainable urban development planning. Based on the topographic maps and remote sensing images, this study employs a multi-metric framework to investigate river network variations in the Suzhou-Wuxi-Changzhou metropolitan area, a rapidly urbanized plain with high-density river networks in the Yangtze River Delta, China. The results indicate a significant decline in the quantity of rivers, with the average river density in built-up areas falling from 2.70 km·km−2 in the 1960s to 1.95 km·km−2 in the 2010s, along with notable variations in the river network’s structure, complexity and its storage and regulation capacity. Moreover, shifts in the structural characteristics of river networks reveal that urbanization has a weaker impact on main streams but plays a dominant role in altering tributaries. The analysis demonstrates the extensive burial and modification of rivers across the metropolitan plains. These findings underscore the essence of incorporating river network protection and restoration into sustainable urban planning, providing insights for water resource management and resilient city development in rapidly urbanizing regions.

1. Introduction

Rivers serve as the lifeblood of human civilization, playing vital roles in ecosystems and human societies, including water resource distribution, aquatic ecosystem maintenance, shipping and flood control [1,2]. Although rivers are natural dynamic systems that evolve over time through geomorphic processes such as sedimentation, erosion, and river migration, human activities can upset the steady state of river channels to generate new forms of erosion and aggradation [3,4]. Anthropogenic pressures have interrupted natural evolution of global rivers and triggered dramatic transformations over recent decades [5], altering river network connectivity and influencing regional hydrologic cycles [6,7]. Among human activities, urbanization in response to population growth has been the most significant driver of surface landscape changes, profoundly influencing river networks [8]. For cities that have thrived due to rivers, the fluvial systems and their multifunctionality form the foundation for sustainable urban development [9,10]. Therefore, well-managed urbanization needs to balance urban development and river network evolution.
The growth of urban areas leads to river degradation through paving, channelization, artificial drainage diversion, and sediment accumulation [5,11]. For instance, a study revealed that surface water loss was more frequent close to human settlements and decreases exponentially with increasing distance from urban areas in the United States [12]. Metropolitan areas have experienced rapid urban land increase and population growth, resulting in more intense impacts on regional environments [13]. Consequently, there is increasing concern for state of river networks in metropolitan areas. Research conducted in Japan found a strong link between river burial and urbanization in the Tokyo metropolitan area, where the share of linear rivers climbed from 10% at the beginning of the 20th century to nearly 50% in the year 2020 [14]. Similarly, a study further documented that inappropriate management has led to extensive degradation of low-order river networks in eastern China’s plains, where these waterways were frequently replaced by dense urban infrastructure such as housing and roads [15]. These changes not only endanger public safety and hinder regional modernization but also expose cities to urban decay through river network variations, leading to possible “urban river syndrome” with profound decline in rivers’ physical, chemical and biological properties [16].
In assessments of river network variation, quantitative characteristics such as length and density have been the primary focus [17,18], while topological graph theory has also demonstrated strong applicability in interpreting relatively complex river network structures [19]. However, few studies have employed multi-metric measures to comprehensively analyze changes in various characteristics of river networks, especially in highly urbanized regions subject to intensive human activities. In addition, previous studies examining river channel changes typically defined study areas by administrative or basin boundaries [8,9,20,21]. This approach, however, may overestimate urbanization impacts by failing to exclude rivers within non-urbanized zones. Moreover, significant spatial heterogeneity characterizes urban expansion processes, with urbanization levels varying across different city orientations [12,22]. Consequently, using a multi-metric approach and precisely delineating the spatial interdependencies between actual urbanized zones and hierarchical river network responses becomes critical.
Although urbanization and its associated landscape modifications impact rivers, these changes vary significantly due to differences in the timing and level of urbanization [23]. Consequently, the spatio-temporal patterns of river network variations in response to urbanization also exhibit considerable variation. Research suggests that rivers may transition from being degraded to becoming functionally integrated into the urban landscape in the later stages of urbanization, serving as key infrastructure and achieving a new dynamic equilibrium [5,20]. Indeed, urban expansion affects river networks through diverse pathways. Recent studies also demonstrate that urban development policies and decisions can foster river network protection and restoration, particularly when the impacts of “urban stream syndrome” become severe [24,25,26]. This often occurs as the recognition grows that multifunctional river resources are irreplaceable foundations for sustainable urbanization [10]. This context underscores the mutual adaptation and coordinated evolution between river networks and urban expansion highlighted by scholars [7,27].
Since China’s implementation of series of economic reform policies in the 1970s, rapid urban expansion and diverse land-use transformations have reshaped the national landscape. This process has driven profound urbanization across Chinese cities since the 1980s, leading to the emergence of numerous urban agglomerations nationwide. By 2020, China’s permanent resident urbanization rate exceeded 60% [28], intensifying anthropogenic pressures on river networks. Notably, the Yangtze River Delta urban agglomeration in eastern China, developed on alluvial plains with dense river networks, is one of the most typical agglomerations in China [29]. This study focuses on the Suzhou-Wuxi-Changzhou (SWC) metropolitan area, centrally located within the Yangtze River Delta, to investigate river network variations under urbanization. The primary objective is to conduct a comprehensive analysis of these variations using a multi-metric framework. The findings are expected to provide a theoretical basis for decision-making and policy formulation, contributing to balancing urban development with river network protection.

2. Materials and Methods

2.1. Study Area

The Suzhou-Wuxi-Changzhou (SWC) metropolitan area (located at approximately 119°08′–121°20′ E, 30°47′–32°04′ N) comprises the three prefecture-level cities of Suzhou, Wuxi, and Changzhou in Jiangsu Province, China (Figure 1). The subtropical monsoon climate induces marked seasonality in thermal and hydrologic regimes, where Meiyu and typhoons storms generate mean annual precipitation exceeding 1000 mm, predominantly in flood seasons. The extremely flat terrain supports a dense network of streams, ponds, and lakes. This area also has an extensive system of artificial canals, complementing the natural waterways. The most notable example is the Beijing-Hangzhou Grand Canal, a well-known ancient canal, which traverses the urban centers of three cities. Sharing similar development trajectories, Suzhou, Wuxi, and Changzhou have undergone rapid non-agricultural transformation of land and population over recent decades. Intense land-use change and human activity have profoundly reshaped river networks, contributing to significant aquatic environmental degradation and increased flood frequency. Given the area’s significant socio-economic importance, examining the influence of urban expansion on river network changes is crucial for formulating balanced policies that reconcile development with conservation.

2.2. Research Framework

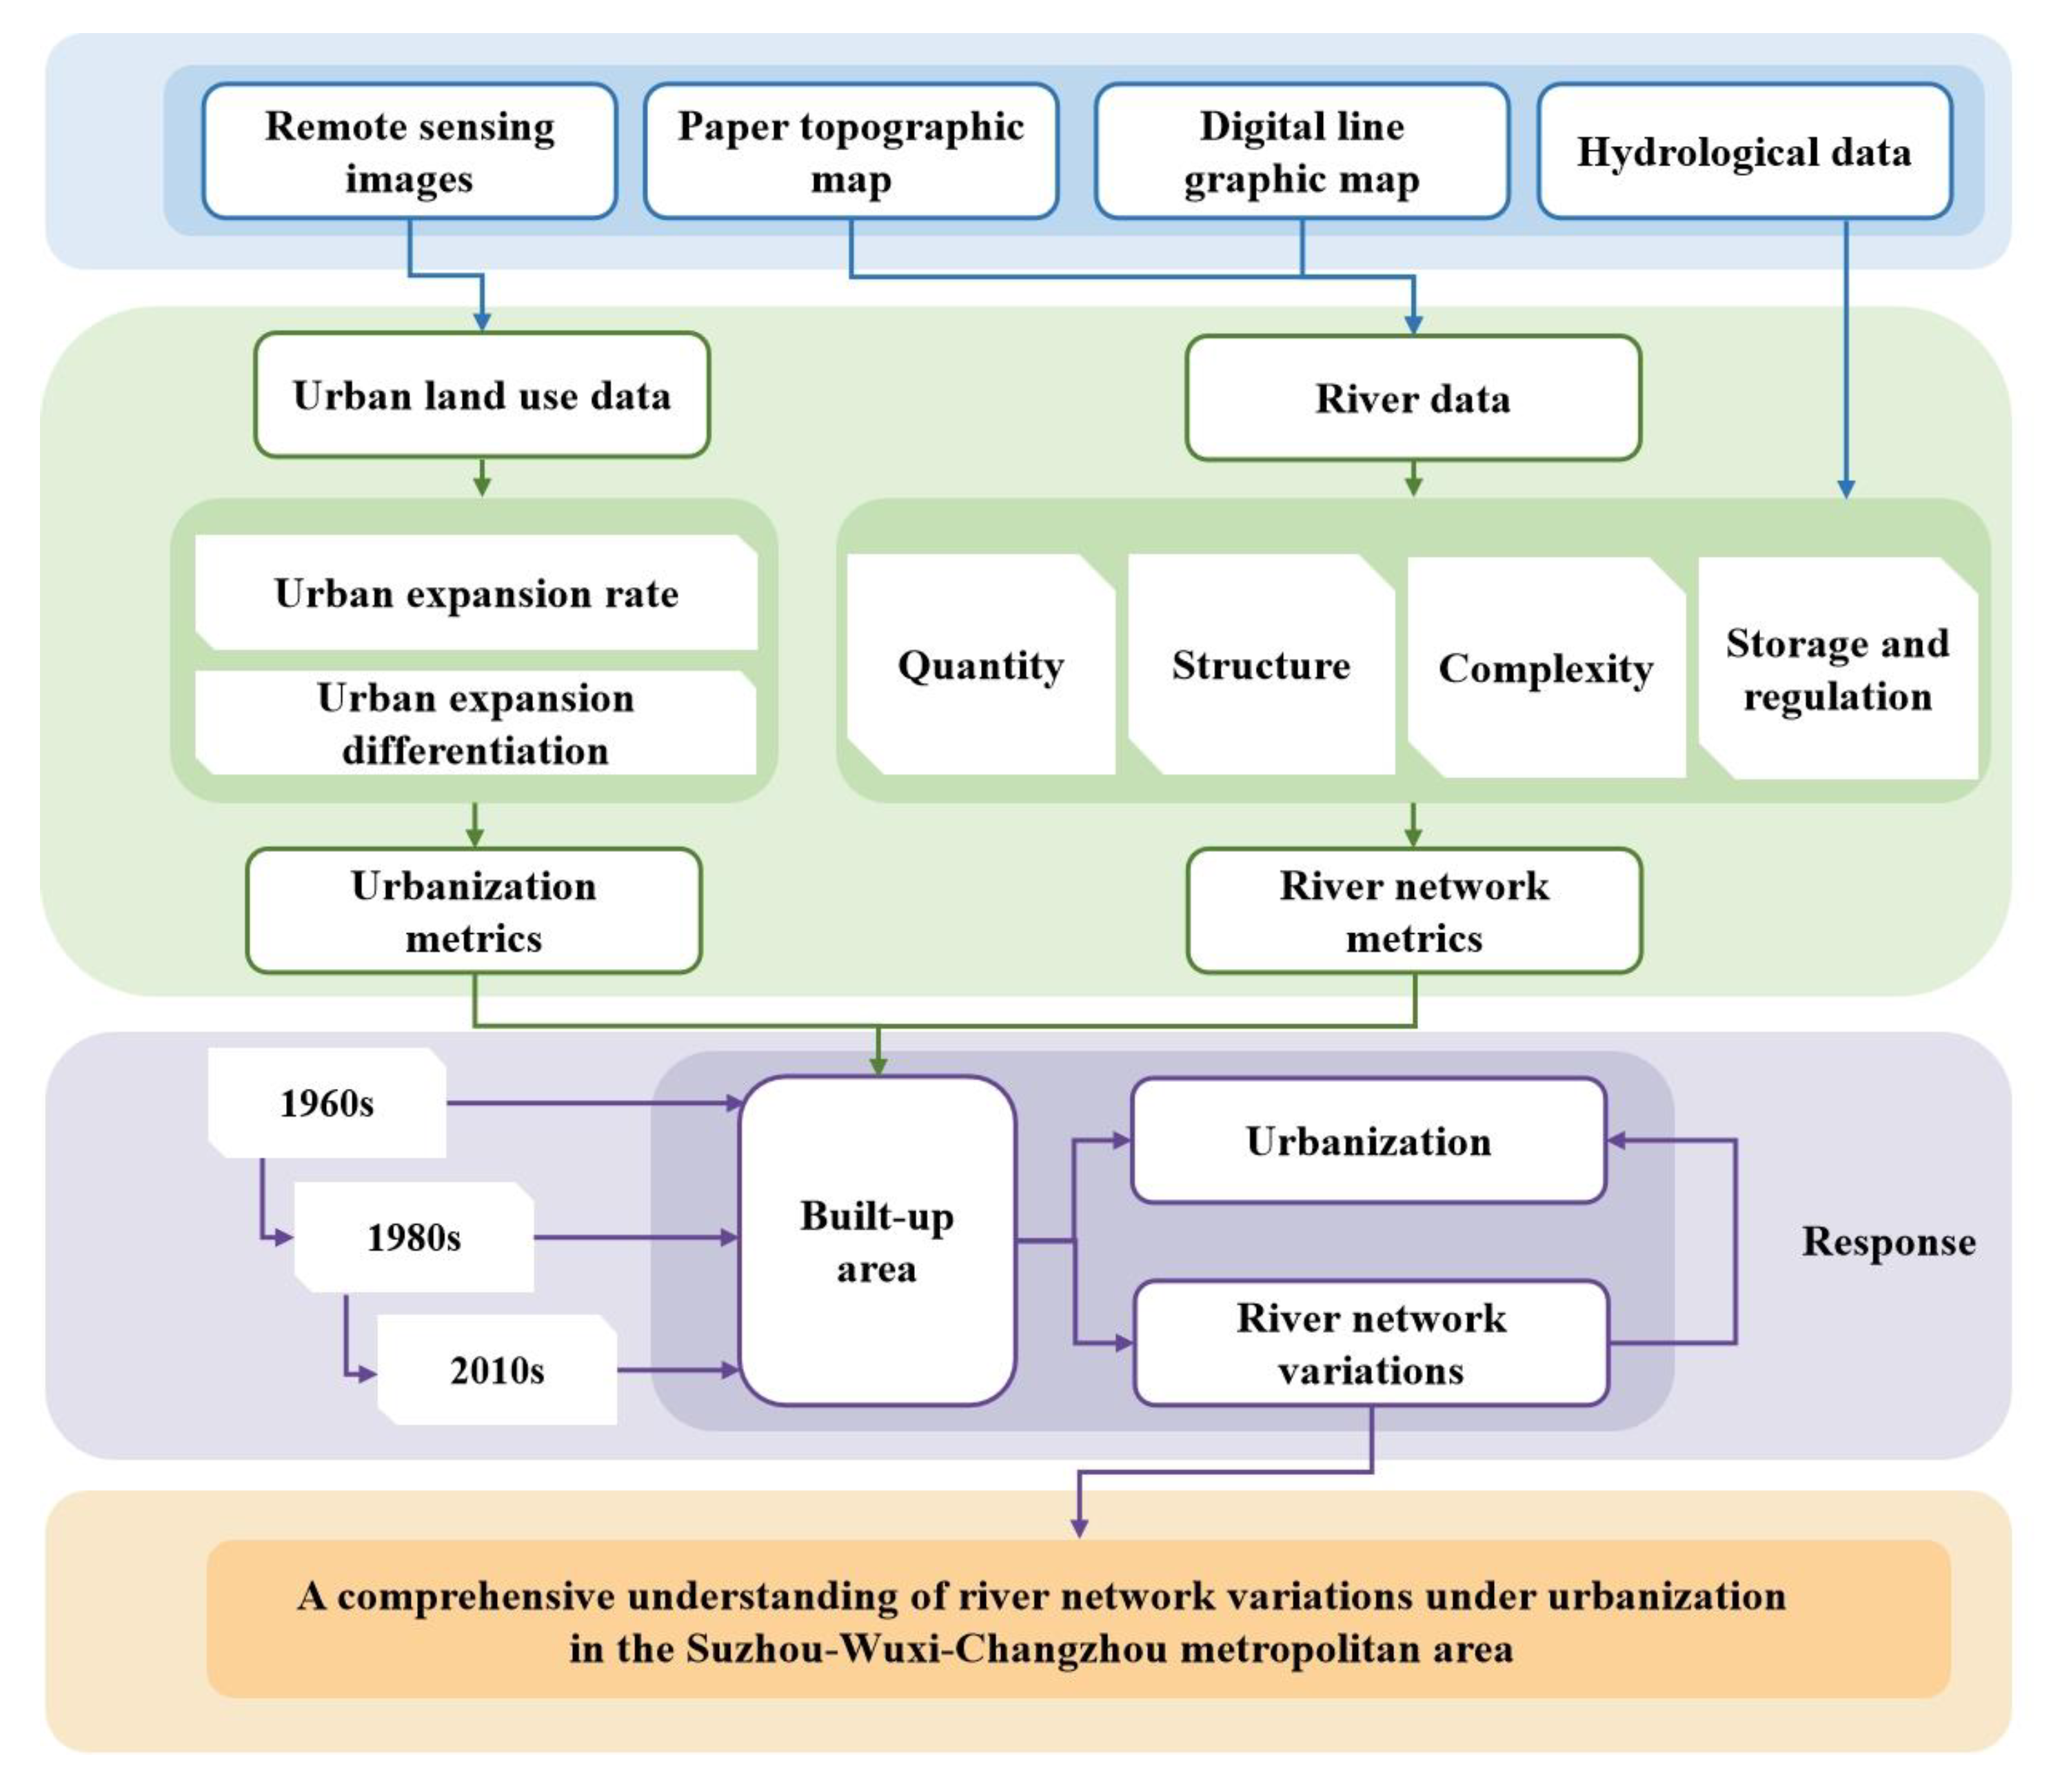
The flowchart of this research is illustrated in Figure 2. First, river data from the 1960s, 1980s, and 2010s were processed using paper topographic maps and DLG data. Urban land use was interpreted from remote sensing images, with the derived built-up areas for these three periods delineating the early, middle, and current urban boundaries, respectively. Second, two urbanization metrics characterizing urban expansion were established to quantify its rate and spatial differentiation. Additionally, various metrics from different dimensions were adopted to characterize river network, encompassing its quantity, structure, complexity, and flood regulation capacity. Third, variations in the river network within urbanized areas and their responses to urbanization metrics were revealed. Finally, this study analyzed how urbanization influenced river networks in the SWC metropolitan area and other typical urban agglomerations.

2.3. Data Acquisition and Preparation

In this study, three representative phases of data, including the 1960s, 1980s, and 2010s, were processed to represent the different distribution patterns of river networks. Historical datasets spanning 1964–1969 (representing the 1960s) and 1980–1983 (representing the 1980s) originated from paper topographic maps at 1:50,000 scale, digitized for analytical use. These data cover several years because early surveying and mapping required significant time to achieve accuracy. By contrast, data records in the 2010s were obtained from a 2015-compiled 1:50,000 digital line graphic (DLG), subsequently updated with high-resolution remote sensing imagery. Additionally, in the actual management practices, rivers are categorized hierarchically based on their status and functions, namely main rivers and tributaries. Main rivers hold higher importance, exhibit greater width, and are primarily used for shipping and flood discharge. In contrast, tributaries are narrower, play a secondary role, and are commonly utilized for regulation and irrigation. For a comprehensive analysis of river network changes, this study also classified rivers into main rivers and tributaries based on width grade, using cartographic representations from paper topographic maps and symbolized widths derived from DLG data. Specifically, main river is considered to be a river with a width of ≥20 m, while tributary is considered to be a river with a width of <20 m. In addition, daily hydrological data of the gauging stations in the study area during 1960–2020 were obtained from the Annual Hydrological Report of China.
To investigate changes in river networks due to urbanization in the metropolitan area, urbanization dynamics were delineated. In fact, urbanization is a multifaceted concept, encompassing socio-economic growth, population increase, and urban land expansion [30]. This study focuses specifically on land-use transformation driven by urban development. Consequently, urbanization is defined here as urban expansion, namely the process of creating the built-up environment to accommodate urban populations and their activities. To identify built-up area, a land use classification was conducted for the SWC metropolitan area using the remote sensing data derived from Landsat images (http://glovis.usgs.gov (accessed on 20 June 2023)). This study prioritized images with minimal cloud cover and optimal quality to ensure clear urban feature representation. Accordingly, three time-series images were selected: one from 1973 (Landsat 1, MSS, 60 m resolution), and others from 1988 (Landsat 5, TM, 30 m resolution) and 2015 (Landsat 8, OLI, 30 m resolution). Due to the lack of earlier remote sensing data, the 1973 image was considered a reasonable representation of 1960s land use for identifying built-up areas. Although urban construction might have caused some land-use changes, such bias was limited prior to the reform and opening-up period, when China’s urbanization rate was relatively slow. The images underwent geometric correction, cropping, reclassification, and other preprocessing steps to facilitate data extraction. All images were resampled to a uniform 60 m resolution for consistency. Land use was interpreted via supervised classification into four categories: urban land, water bodies, forest land, and cultivated land. The interpretation achieved an overall accuracy exceeding 80% and a Kappa coefficient of 0.80, confirming the suitability for this research. These data were used to delineate the built-up areas for each phase.

2.4. Methods

2.4.1. Measuring Urbanization

In this study, two metrics were selected to characterize urbanization for analysis:
(1)
Urban expansion rate (UER)
It represents the increase rate of the urban area between two periods, which is quantified by the extent of urban expansion during a certain period [31]. The calculation formula is as follows:
U E R i = U L A i t 2 U L A i t 1 t 2 t 1
where UERi is the urban expansion rate of spatial unit i; U L A i t 1 and U L A i t 2 denote the urban land area of the spatial unit i at time t1 and t2, respectively. In this study, UER was calculated for two distinct periods: 1960s–1980s and 1980s–2010s.
(2)
Urban expansion differentiation (UED)
It refers to the ratio of the urban expansion rate of a spatial unit to the urban expansion rate of the study area [31], which characterizes the regional difference in urban land expansion and makes the intensity of urban land expansion comparable in different spatial units. The calculation formula is as follows:
U E D i = U L A i t 2 U L A i t 1 × U L A t 1 | U L A t 2 U L A t 1 | × U L A i t 1
where UEDi is the urban expansion differentiation of spatial unit i; U L A i t 1 and U L A i t 2 and denote the urban land area of the spatial unit i at time t1 and t2, respectively; U L A t 1   and U L A t 2   are the total area of urban land at time t1 and t2, respectively. Similarly, UED was calculated for two distinct periods: 1960s–1980s and 1980s–2010s.
Based on the interpreted land use data of three phases, this study utilized the natural break method to cluster the urban land uses to characterize the boundaries of urban built-up area during different periods. Then, the geometric center of the early boundary was used, identified by ArcGIS tools, as the center of a circle to cover each city. Given the difference between the size of the three cities, the radius of the circle for Suzhou, Wuxi, and Changzhou was 20 km, 24 km, and 26 km, respectively. The circles with covered cities were divided into eight equal sectors in eight main directions to detect the spatio-temporal rate and strength of urban expansion using UER and UED.

2.4.2. Assessing Variations in the River Network

According to the previous studies [8,32], combined with the natural evolution of river networks and the history of artificial transformations, seven indicators based on the fluvial geomorphology and river function were selected to comprehensively assess the multi-dimensional characteristics of river networks.
Quantity Characteristics
(1)
River density (Rd)
This metric refers to the total length of river per unit area in a focused region and reflects the degree of river network development and distribution of its density. Its calculation formula is as follows:
R d = L R / A
where LR is the sum of rivers’ lengths (km); A is the total area of the region (km2).
(2)
Proportion of water surface (Wp)
This metric refers to the proportion of an area covered by water bodies. It serves as a direct quantitative index commonly used in river network analysis. Note that within this study, “water surface” includes ponds and lakes connected to rivers, identified from topographic maps and DLG data. Its calculation formula is as follows:
W p = ( A w / A )     100 %
where Aw is the area of the water surface (km2); A is the total area of the region (km2).
Structure Characteristics
(1)
Area-length ratio of main rivers (RAL)
Main rivers serve as the arteries of a river network in the study area. This indicator reflects the size of the main rivers, which is closely linked to drainage capacity. A higher index value corresponds to a larger water area per unit length of river. Its calculation formula is as follows:
R A L = A m / L m
where Am is the total area of the main rivers (km2); Lm is the total length of the main rivers (km).
(2)
Tributary development coefficient (K)
This metric quantifies the ratio of tributary length to main river length, reflecting the structure of the river network. Tributaries are more significant than main rivers for shaping the riverine landscape but are also more susceptible to burial during urban expansion. Therefore, the tributary development coefficient serves as an indicator of tributary preservation. Its calculation formula is as follows:
K = L t / L m
where Lt and Lm are the total length of the tributaries and main rivers (km), respectively.
Complexity Characteristics
Box Dimension (D): This metric quantifies both the fractal characteristics and space-filling ability of geographical features, and it enables the reliable detection of complexity of river networks [33]. This study employs the box-counting method to characterize the scaling properties of complex river networks under human-induced influence within basins. The box dimension is calculated as follows:
D = l i m r 0 l g N ( r ) l g r
where r represents the box side length (tested at 1000, 950, …, 50 m intervals based on mean river length and density), and N(r) denotes the number of boxes containing the river network. Note that the higher the D value, the greater the complexity of the object.
Storage and Regulation Characteristics
Water storage and flood regulation constitute a vital function of river networks, referring to their capacity to retain floodwaters and attenuate flood peaks [34,35]. This function inevitably alters with changes in the quantity, structure, and complexity characteristics of the river networks. To estimate the storage and regulation characteristics, two metrics are employed: Static Storage Capacity (SSC) and Potential Regulation Capacity (PRC). The cross-sections of the river channels were assumed to be isosceles trapezoidal with rectangular water surfaces, and effects of sedimentation and dredging were neglected. This simplification has been effectively applied in previous studies to estimate river networks’ storage and regulation capacity [34,36].
(1)
Static Storage Capacity (SSC)
This metric denotes the volume of water stored per unit area within river networks at ordinary water levels [36]. Higher SSC values generally indicate greater total water storage capacity in regional river networks. Its calculation formula is as follows:
S S C = A w × H A
where A is the total area of the region (km2); Aw is the area of the water surface (km2); and H is mean annual water level at gauging stations (m), based on daily observations.
(2)
Potential regulation capacity (PRC)
This metric quantifies the differential between maximum and normal storage capacities within a given region. River networks typically reach maximum storage capacity when normal water levels rise to designated flood warning levels which are defined as thresholds established by water authorities where flooding may initiate. Given the temporal variability of warning levels due to long-term hydrological shifts, this study substituted the 95th-percentile observed water level for comparative PRC analysis across periods. This substitution is justified by correlations established in previous research between percentile-based water levels and operational flood warning stages, demonstrating its reasonableness and robustness [36].
P R C = A w × ( H w H ) A
where A, Aw and H are defined as in Equation (8); Hw is the warning water level (m), replaced with the 95-percentile water level of the gauging stations.

3. Results

3.1. Temporal and Spatial Characteristics of Urban Expansion

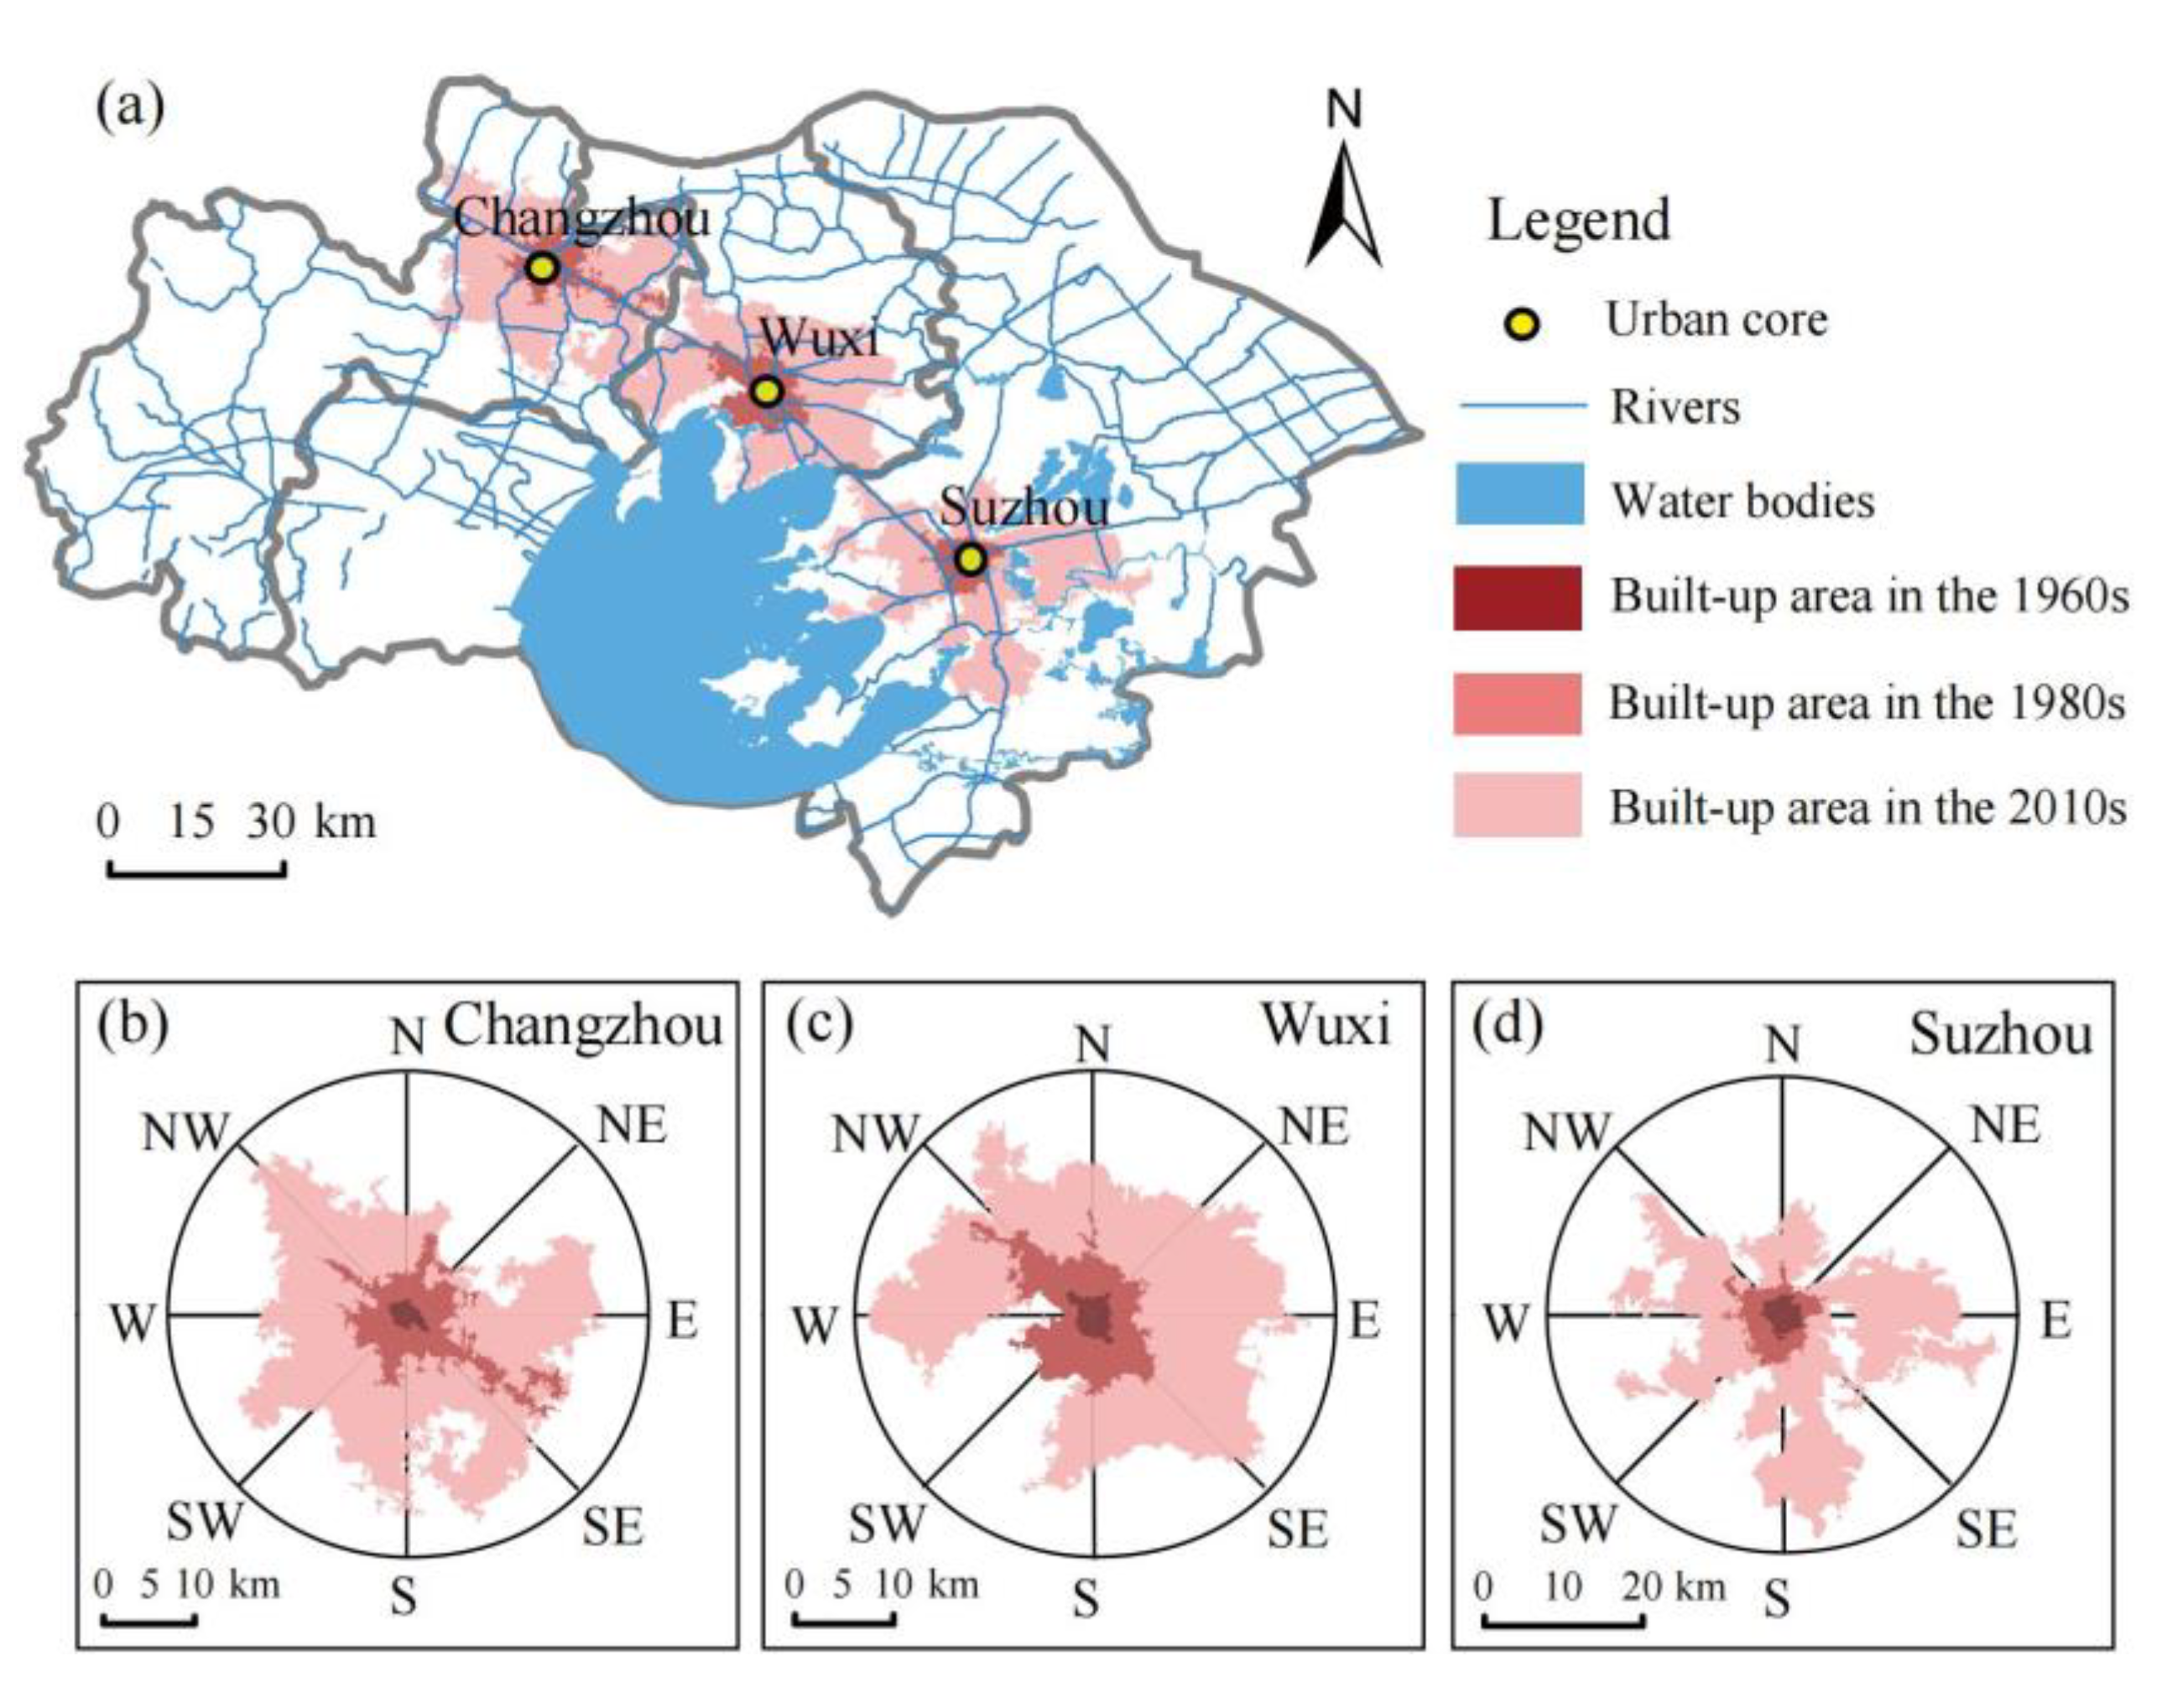
Figure 3 illustrates the spatial pattern of urban expansion in the Suzhou-Wuxi-Changzhou (SWC) metropolitan area. Overlaying urban expansion boundaries from different periods reveals substantial growth in each city’s built-up area, especially from the 1980s to the 2010s. Initial urban areas in the 1960s were primarily distributed along the Beijing-Hangzhou Grand Canal, China’s primary north–south transportation artery. Expansion occurring between the 1960s and 1980s reflects the slower pace of early-stage urbanization, while recent expansion (1980s–2010s) characterizes rapid urbanization. Overall, Suzhou’s early growth expanded outward in all directions, eventually forming a cross-shaped boundary. In contrast, the later spatial pattern across all cities exhibited radial clustering, potentially influenced by the constraining presence of Taihu Lake and urban planning policies.
The geometric center of each city’s earliest built-up area boundary was designated as its urban core, representing the focal point from which urbanized areas expanded outward. The coordinates of these urban cores were: Suzhou (120°36′53″ E, 31°18′54″ N), Wuxi (120°18′96″ E, 31°34′48″ N), and Changzhou (120°00′05″ E, 31°46′41″ N). Subsequently, the Urban Expansion Rate (UER) and Urban Expansion Differentiation (UED) were quantified across the eight directional sectors within the metropolitan area. The results are summarized in Table 1.
The results reveal that the average UER was below 1 km2/a across all cities from the 1960s to 1980s but exceeded 3 km2/a from the 1980s to 2010s. Accordingly, the two periods are characterized as slow urbanization period and rapid urbanization period, respectively. While Wuxi exhibited the highest UER during the slow period, it recorded the lowest rate during rapid urbanization. Conversely, UED values were similar among the three cities in both periods. UED quantifies the relative rate of urban expansion in a specific sector compared to the entire region, thereby highlighting directional disparities. For instance, during the rapid period, Suzhou’s expansion was predominantly oriented towards the east-southeast (E-SE; UED = 2.97), whereas Wuxi and Changzhou expanded mainly northeast-east (NE-E; UED = 2.55) and southeast-south (SE-S; UED = 1.99), respectively. This directional analysis provides a basis for investigating how urban expansion influences river changes along different city axes.

3.2. Multi-Dimensional Variations in River Networks

To visually illustrate the evolution of the river networks, their spatial patterns in the built-up area across three phases are mapped (Figure 4). River networks’ evolution exhibits a close relationship with urbanization, particularly in Suzhou, where urban expansion has historically followed the radial river network. However, from the 1960s to the 2010s, these cities experienced a significant decline in both the number and density of rivers, resulting in a simplified network structure. Notably, the major rivers, typically depicted as long and straight channels, remained largely unchanged. These rivers, primarily excavated or artificially modified from natural channels in ancient times, continue to serve key functions in canal transport and flood drainage. Conversely, a substantial number of shorter, minor streams have vanished due to urban expansion.
The total changes in river networks of the study area are exhibited in Table 2. It shows that the number of rivers in the urban area has significantly decreased. A sharp decline in average river density occurred in built-up areas, falling from 2.70 km·km−2 in the 1960s to 1.95 km·km−2 in the 2010s. Despite having the highest water surface proportion among three cities, Suzhou still experienced a decline from 12.21% (1960s) to 9.60% (2010s). From the structural features of the river perspective, the area-to-length ratio of the main river in Suzhou and Wuxi increased from the 1960s to 2010s, especially the value of Wuxi increased from 41.80 to 48.68, indicating that the size of the main rivers became larger. In terms of the relationship between the main rivers and tributaries, the tributary development coefficients of Suzhou and Wuxi were close, especially since they were identical in the 1980s (2.53 and 2.54, respectively). Compared to the 1960s, the tributary development coefficient of three cities in the 2010s has decreased by an average of 37.6%. To identify which category of tributaries experienced a more pronounced reduction, the tributaries were further categorized into two classes using a width of 10 m as the threshold. The analysis reveals that the river density of tributaries with a width ≥10 m declined from 1.07 km·km−2 in the 1960s to 0.86 km·km−2 in the 2010s, equivalent to a reduction of 19.7%. In contrast, the density of narrower tributaries (<10 m) exhibited a more substantial decline, dropping from 1.13 km·km−2 to 0.64 km·km−2, equivalent to a reduction of 43.4%. These results indicate that narrower tributaries are more susceptible to the impacts of urbanization. Meanwhile, the fractal dimension of Suzhou has remained stable and its mean value is 1.51 over the last decades, while Changzhou’s value decreased from 1.44 to 1.31. In general, changes in the fractal dimension values of rivers in the study area indicate a slight reduction in the complexity of river networks.
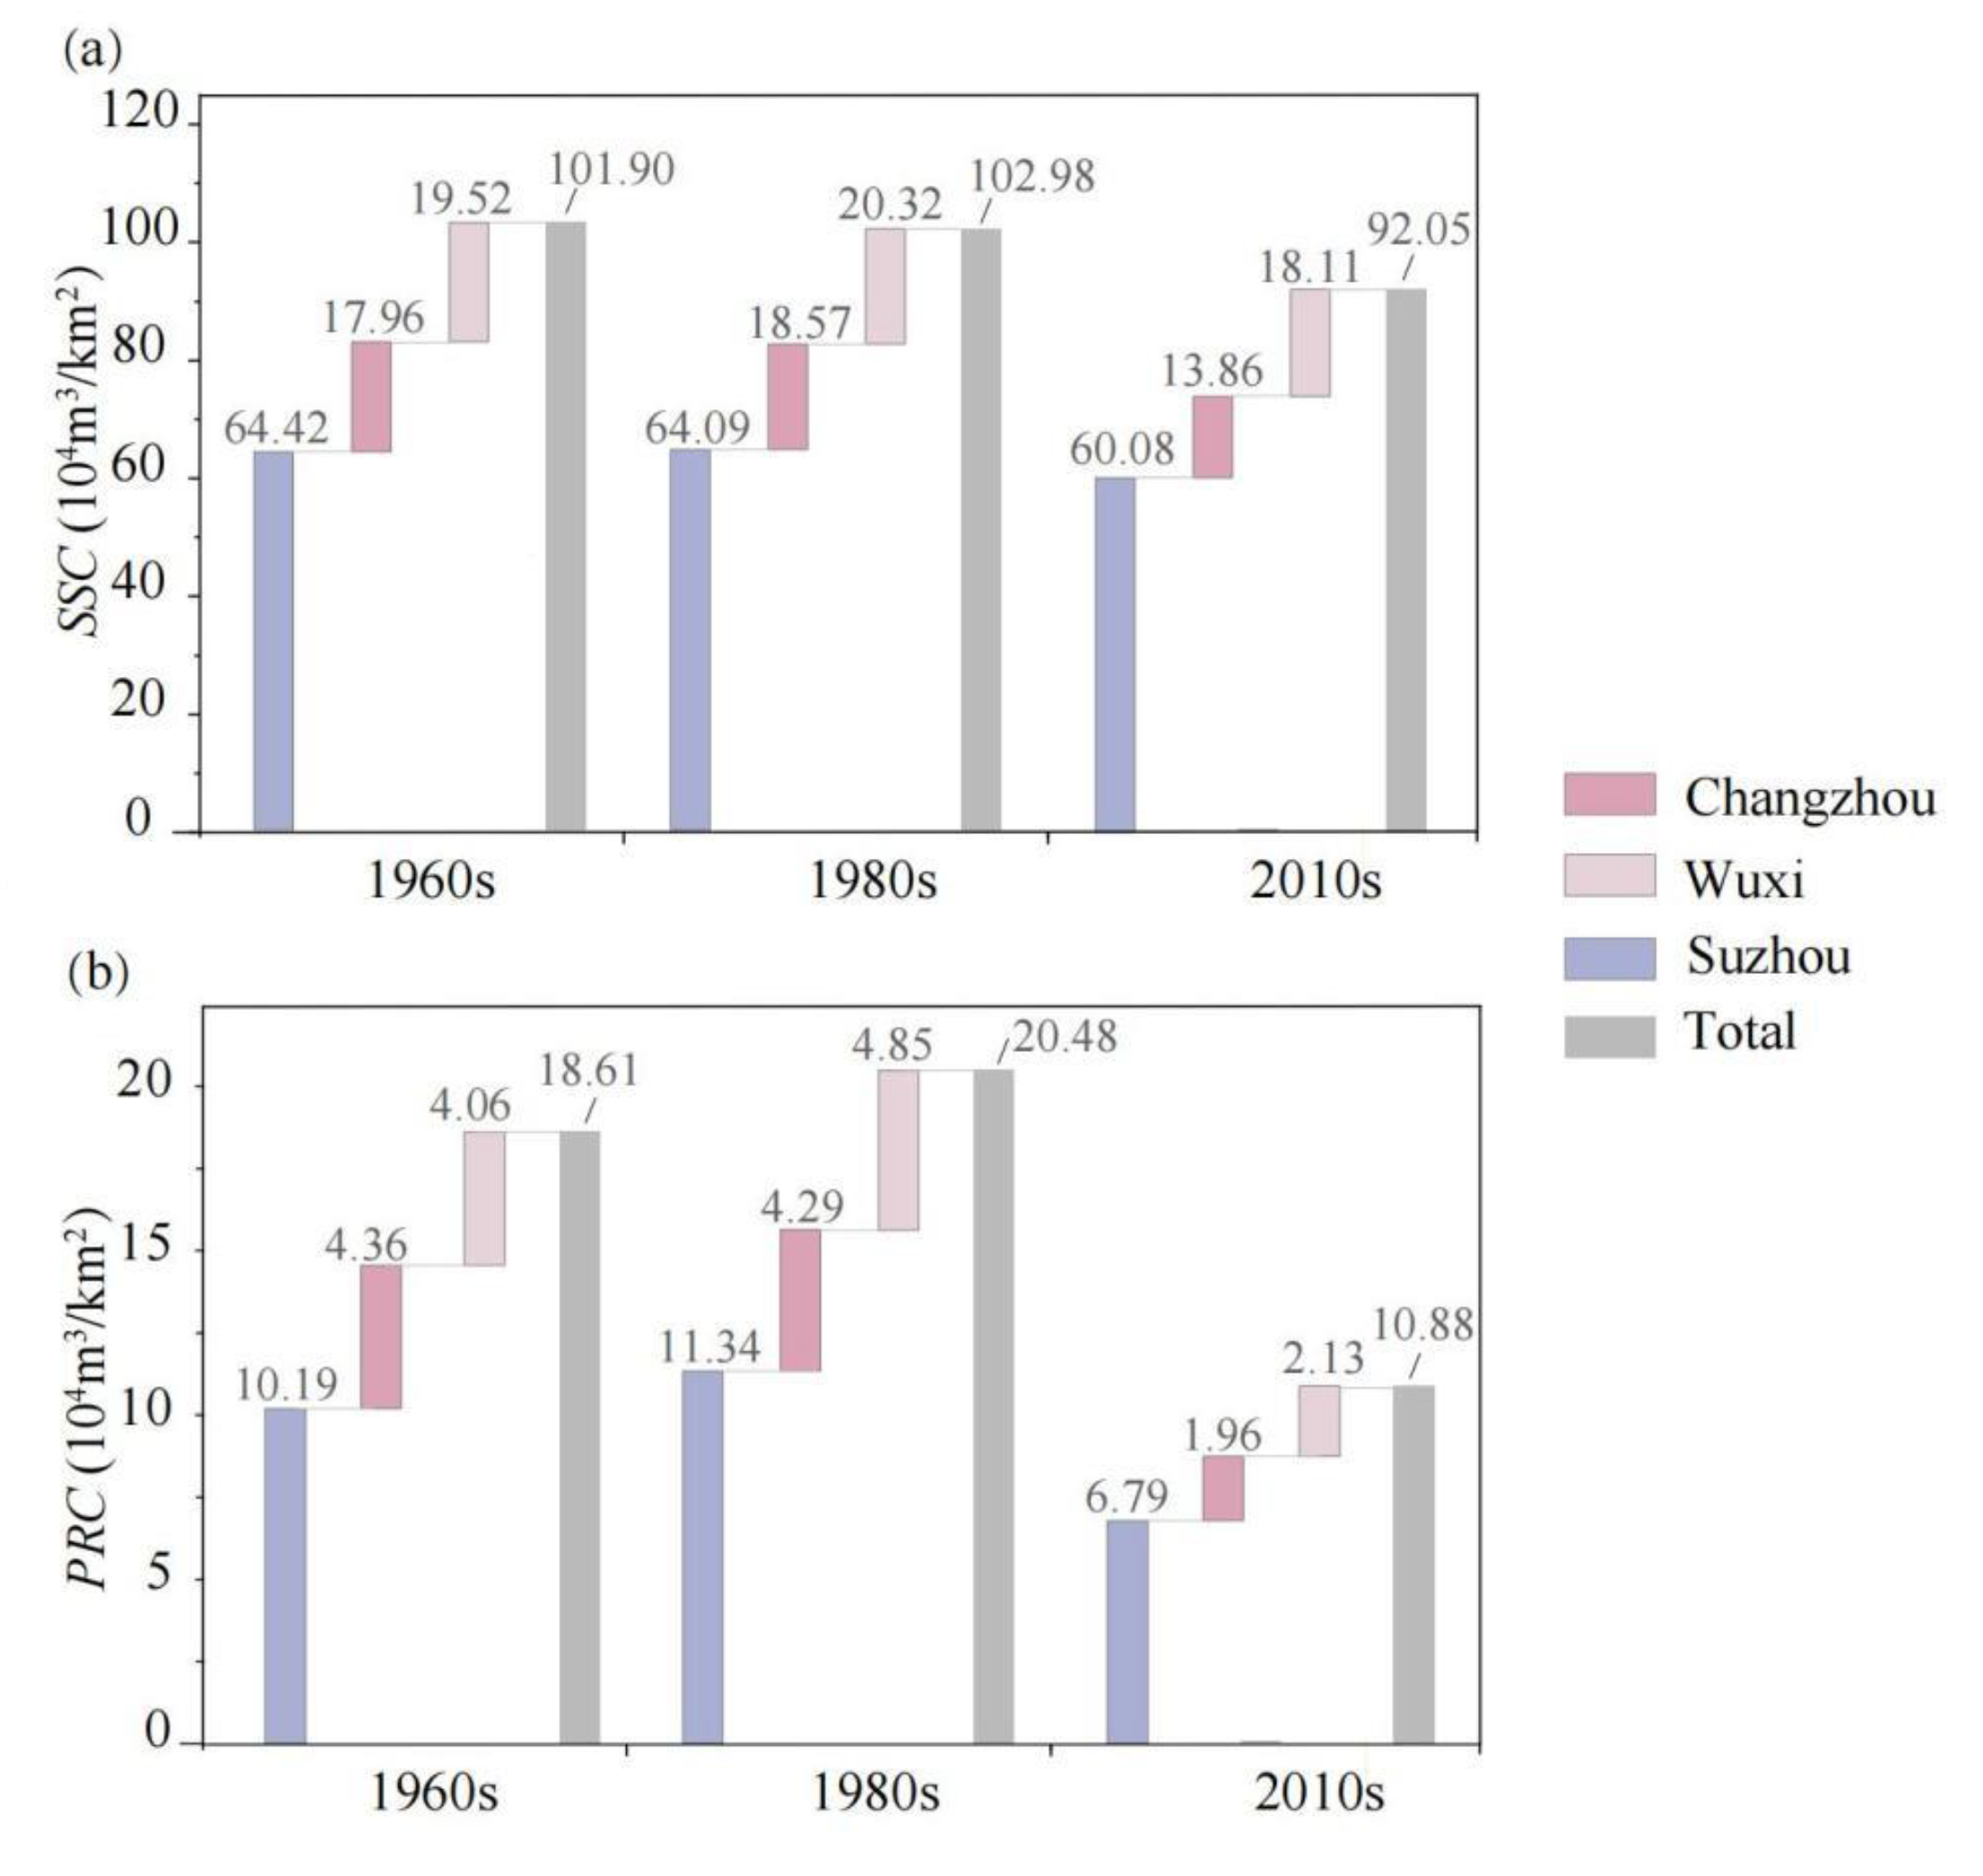
Furthermore, this study estimated storage and regulation characteristics of river networks by calculating the Static Storage Capacity (SSC) and Potential Regulation Capacity (PRC). Results indicate that Suzhou consistently exhibited the highest SSC and PRC values across all periods, signifying its superior storage and regulation capacity among the three cities (Figure 5). The SSC for the entire study area decreased from 101.90 × 10⁴ m3/km2 in the 1960s to 92.05 × 10⁴ m3/km2 in the 2010s. Changzhou, Wuxi and Suzhou experienced substantial reductions in the SSC between the 1980s and 2010s, marked by decreases of 25.3%, 10.9%, and 6.3%, respectively (Figure 5a). Changes in the PRC are shown in Figure 5b. Notably, the PRC increased slightly from the 1960s to the 1980s but declined drastically thereafter until the 2010s, indicating that the degradation of flood regulation function primarily coincided with the rapid urbanization period. Changzhou experienced the largest PRC reduction (−55.0%) compared to the others. In summary, urbanization has driven a declining trend in the river network’s storage and regulation capacity. As natural river patterns are altered to accommodate societal development needs, the original hydrological cycle and associated river functions are inevitably compromised.

3.3. Responses of River Networks to Urbanization

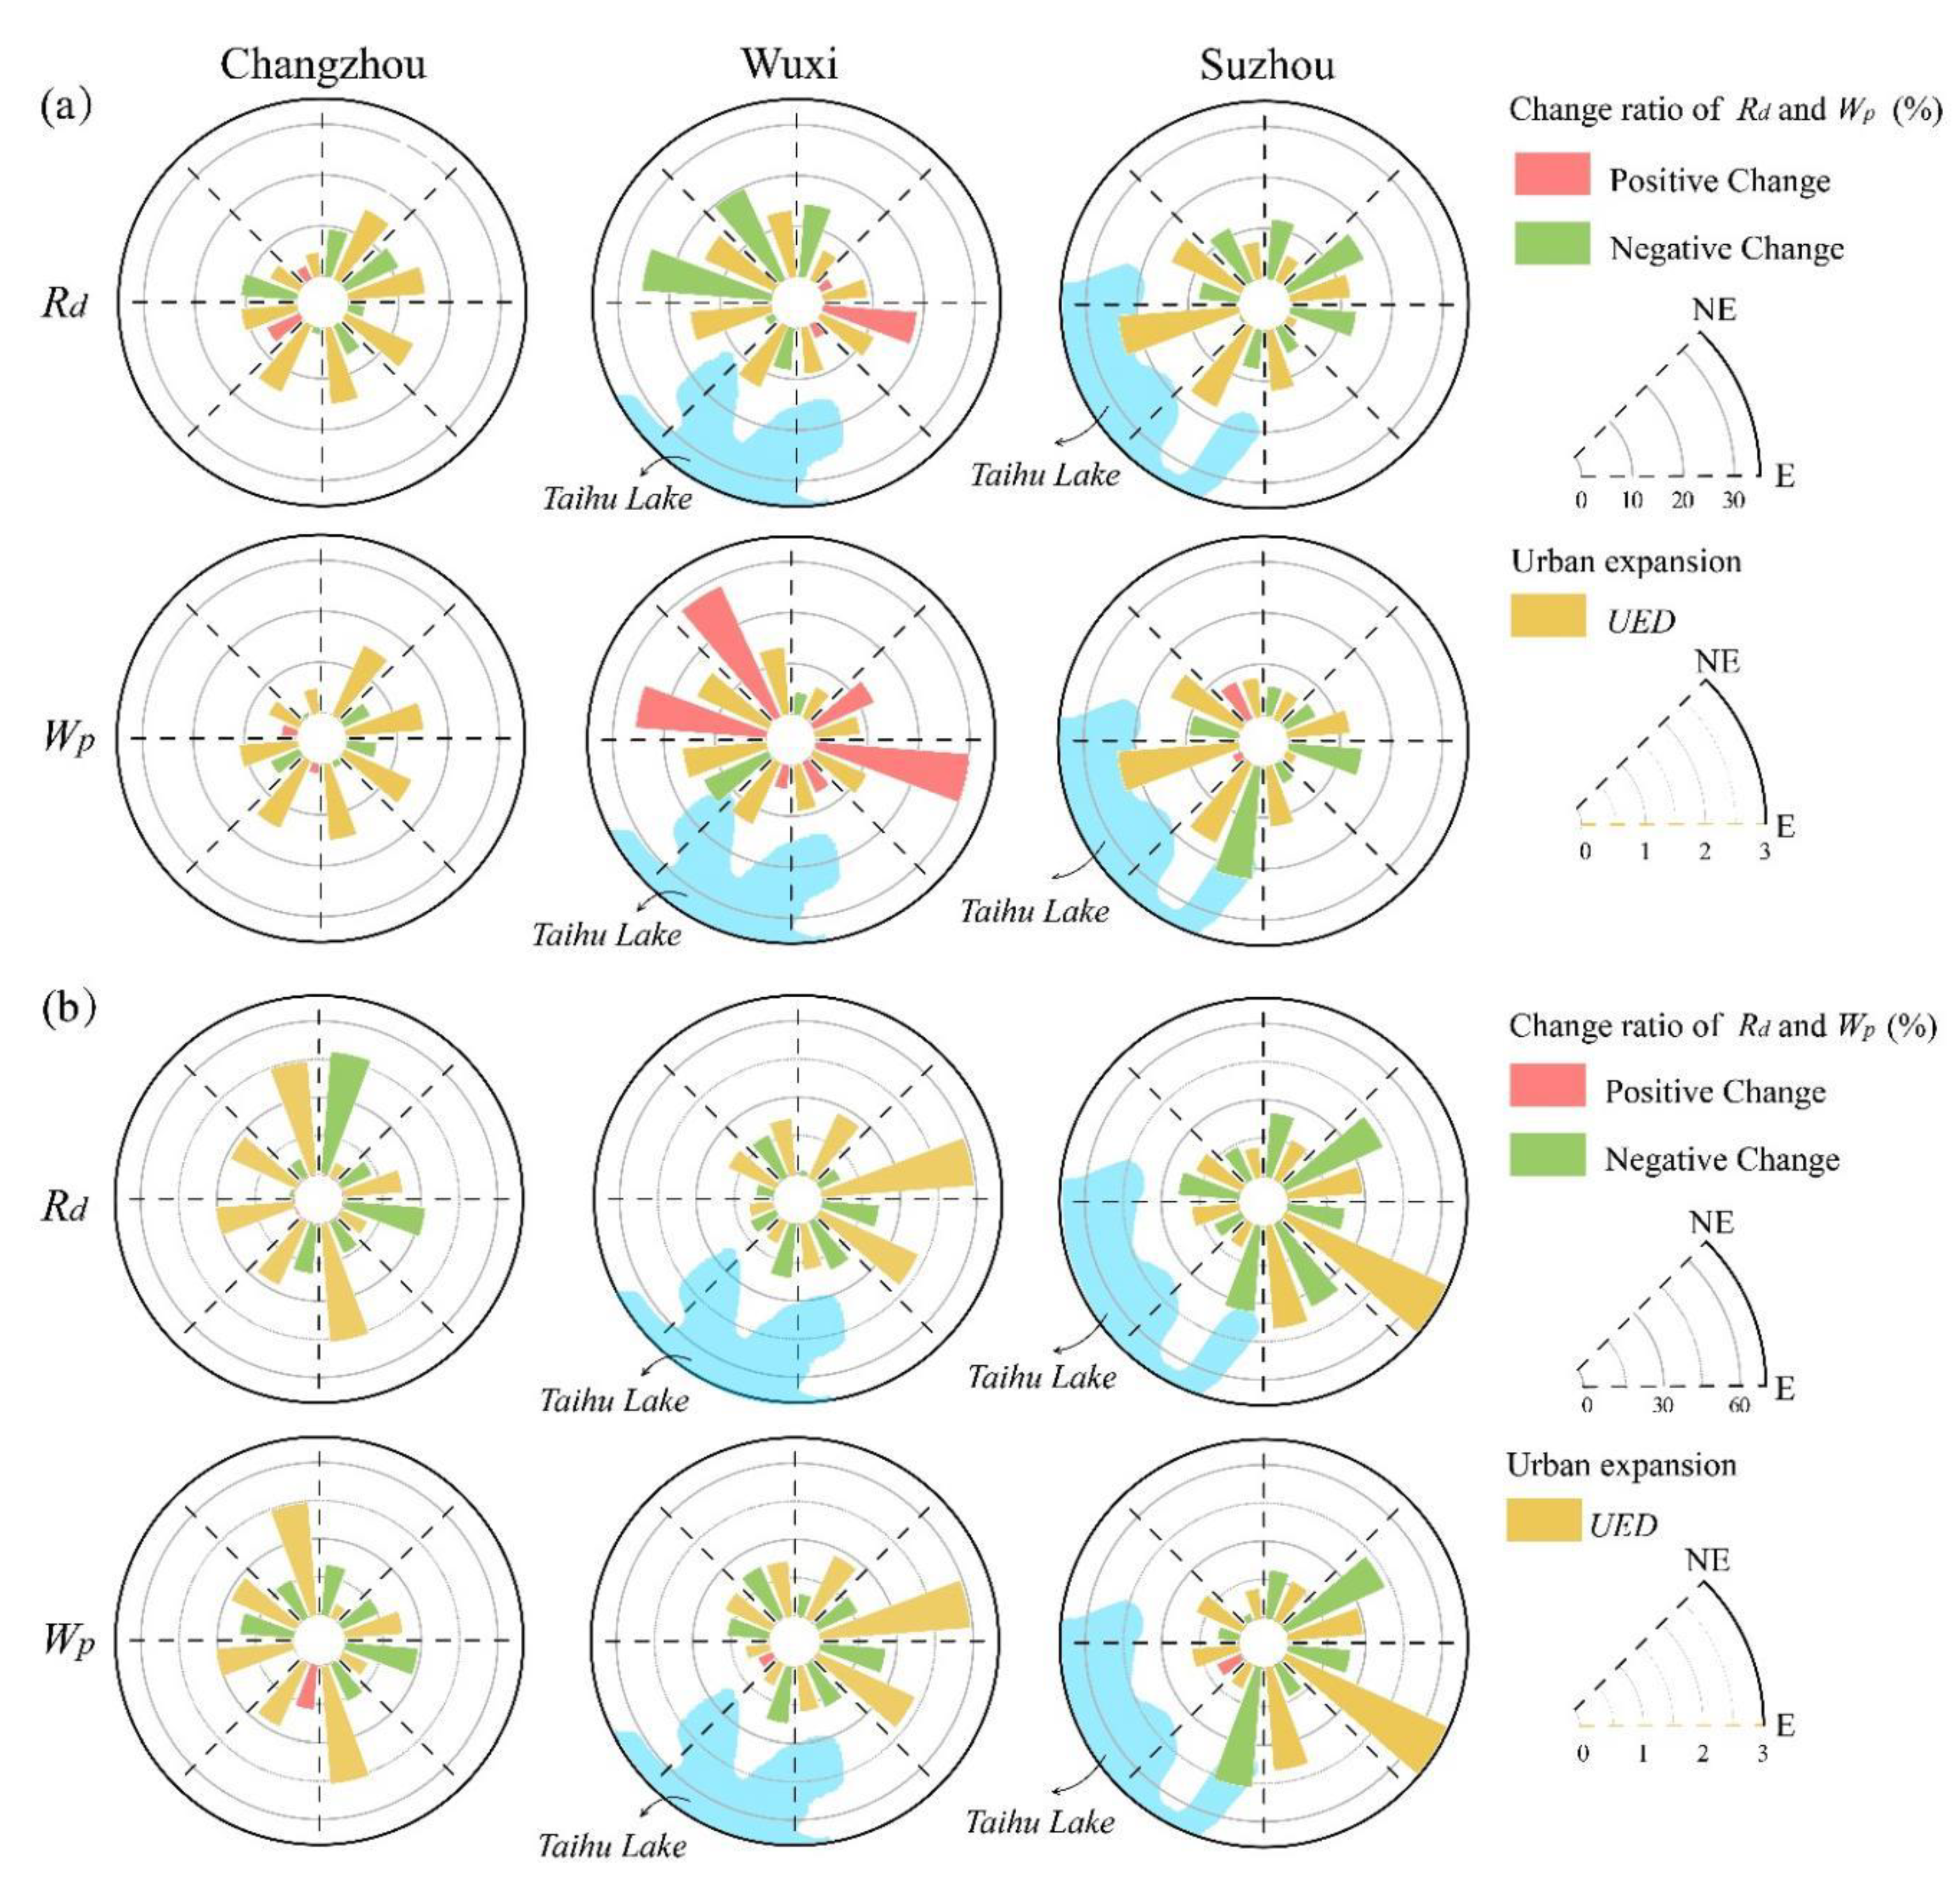
To show the details of the spatial patterns of river network variations under urbanization, how river networks respond to urban expansion is analyzed. Here, the quantity metrics are used because they are direct indicators for describing river changes in the area with dense streams. As already mentioned, the process of urbanization of the study area can be divided into slow urbanization period (1960s–1980s) and rapid urbanization period (1980s–2010s), then changes in river networks’ quantity characteristics across these periods were calculated, mapping their spatial patterns with the corresponding urban expansion differentiation (UED) (Figure 6). Figure 6a,b illustrate the responses of Wp and Rd to UED during the slow urbanization period and the rapid urbanization period, respectively. The individual yellow sector denotes the value of UED of the direction in which it belongs, and another sector in the same direction denotes the river density (Rd) or the proportion of water surface (Wp), where red means positive change and green means negative change. Note that the composite metric for each direction was calculated using the actual urban expansion area. Because expansion was more extensive during the rapid period, the sector values in Figure 6b are larger than those in Figure 6a for a given sector size.
The river density (Rd) of Changzhou has fewer negative changes during the slow urbanization period. Meanwhile, there was an increase in the water surface proportion (Wp), especially for Wuxi. The UED represents the rate of urban expansion in a given area compared to that in the entire area, but results show that higher UED was not always connected with the significant negative changes in rivers. For instance, Suzhou and Wuxi show intense urban expansion towards the Taihu Lake without a significant decrease in Rd during this period. During the rapid urbanization period, the results show that the spatial pattern of the UED is different from the slow period.
From the perspective of spatial unit area, it is obvious that the south-western areas of Suzhou and Wuxi, the most adjacent parts to Taihu Lake, have lower UED during this period, but the two cities tend to develop in the eastern directions. Similarly, Changzhou used to develop in the eastern direction, but it preferred intense urban expansion along the north–south direction during the rapid direction. In terms of the response of river network changes to urban expansion, both Rd and Wp decreased to different degrees. The Rd of three cities has decreased in all directions, with an average change ratio of 25.81%, 13.61%, and 16.83%, respectively. Meanwhile, the Wp of the three cities has decreased with an average change ratio of 18.28%, 15.72%, and 4.2%, respectively. In general, the overall urban expansion leads to noticeable negative changes in the quantity characteristics of river networks during the 1960s–2010s, but the ratio of change also varies about the expansion spatial differentiation with an inconsistency in different directions of urban expansion. At the same time, when the UED was relatively small in some places or periods, there were positive changes in river networks, thus measures in policy and planning might be implemented in response to potential challenges.

4. Discussion

4.1. Common Simplification in River Networks Across Metropolitan Areas

The results in this study show a decrease in the number of rivers and a significant alteration in river network composition. The complexity of the urbanization process results in river network changes that are neither spatially homogeneous nor temporally stationary. A comparison with prior work in other major metropolises helps elucidate comprehensive patterns of river network evolution during urban expansion. For example, the proportion of urban river water area in Guangzhou decreased by 17.66% from 1990 to 2010 [37]. In the urban agglomeration of Nansi Lake Basin, the total length of rivers with a ≥20 m width decreased by 9.6% from the 1980s to the 2010s, while the total length of rivers with a <10 m width declined by 25.22% [38]. As evidenced by prior research, rapid urbanization in China has driven substantial river network transformations in highly urbanized areas. Globally, similar trends have been documented. In the Tokyo metropolitan area, not only did the open channel ratio decrease significantly, but 80% of the tributary length in the Uchi and Shibuya river systems had also disappeared [14]. Another study reported that the City of Detroit lost at least 85% of the stream channels since 1902 [39]. Despite spatio-temporal variations in urbanization context and geographical environment, a notable consistency is that studies report a dramatic decline in river numbers within the metropolises during the urbanization process, primarily due to tributary loss [38,40,41], which is consistent with the main findings of this study. This phenomenon actually indicates the differences in rivers’ functional priorities. Main rivers, often widened or deepened to meet critical water storage and flood control demands, are largely preserved. In contrast, smaller tributaries, serving limited auxiliary functions within the urban system, are far more susceptible to burial during urban expansion [42,43]. Consequently, the large-scale disappearance of tributaries, whether during periods of rapid or slow urban growth, is a primary driver of both the quantitative reduction and structural simplification observed in the river networks of these metropolitan areas.

4.2. Impacts of Local Urbanization on River Network Variations

In general, urban land expansion leads to river network alterations through replacement by impervious surfaces, modification via straightening and channelization, and alteration through artificial drainage and structures. Such anthropogenic changes modify river channel geometry [23]. However, in this process, there is a spatial difference in the impact of urban expansion on the river networks, as changes in the river density and the proportion of water surface are inconsistent in different directions, thus it actually depends on the pattern of urban expansion itself. In the study area, the early development of cities in those areas with dense streams was closely dependent on river networks. For instance, the urban expansion of Changzhou and Wuxi during 1960s–1980s was distributed along the Beijing-Hangzhou Grand Canal and formed a band-shaped area from northwest to southeast (Figure 3). Thus, the Grand Canal and rivers adjacent to the canal were modified by human activities during this period. However, since many rivers experienced modifications, there were fewer changes in the band-shaped area when the urban land gradually expanded outwards.
Policy interventions have played an important role as well. In the early 21st century, projects for inter-basin water transfer and ecological replenishment directly added main channels, while drainage system expansions for flood control increased the area-length ratio of these rivers. Furthermore, policy shifts also explain apparent anomalies: in Wuxi, despite a decrease in river density in the 1980s, the total water surface area increased (Table 2). This was driven by post-reform policies promoting aquaculture, which triggered the excavation of numerous ponds, as documented in local records. However, subsequent rapid urbanization led to the burial of both natural rivers and these artificial ponds, ultimately causing a sharp decline in the water surface area.
In addition, urbanized areas with dense river networks face a dilemma between development needs and flood control capacity. The hydrological characteristics of urban catchments are a primary determinant of how the system as a whole responds to urban expansion and river modification [44,45]. Previous research showed that flood frequency increases as the fractal dimension decreases [46]. As illustrated in Figure 6, both static storage capacity (SSC) and potential regulation capacity (PRC) exhibited decreasing trends, indicating that urban expansion-induced river network changes have compromised their storage and regulation functions. The burial and reshaping of rivers and lakes have reduced river volume and altered channel structure, significantly diminishing the original flood control capacity [35,39]. Compounding these issues, river channels in the Suzhou-Wuxi-Changzhou metropolitan area exhibit bidirectional flow due to the delta plain topography and tidal influences, which complicates flood management and increases vulnerability. Although main rivers have been preserved and dredged, it remains uncertain whether their storage and regulation capacity is sufficient to mitigate extreme flood events.

4.3. Implications for Sustainable Urban-River System

While anthropogenic pressures have profoundly altered river networks, specific engineering interventions, including riverbank stabilization and flood retention ponds, represent necessary approaches to reconcile human safety with hydrological functionality [47]. This is particularly true when they are designed to emulate natural processes, thereby contributing to sustainable development goals. Additionally, there is evidence that suggests that river network degradation is being mitigated to some extent. A weak negative correlation between urbanization level and river network patterns has been observed in the Wuhan metropolitan area [20]. Similarly, certain subregions within the Changsha metropolitan area have recently exhibited slower rates of river network decay despite high-intensity urban expansion [48]. These findings indicate a growing recognition of the adverse impacts of river degradation, prompting local governments to implement measures aimed at improving urban-river system interactions. Although large-scale landscape modifications like extensive impervious surfaces are often irreversible, targeted interventions, such as riparian buffer restoration and green infrastructure, can effectively mitigate their negative impacts.
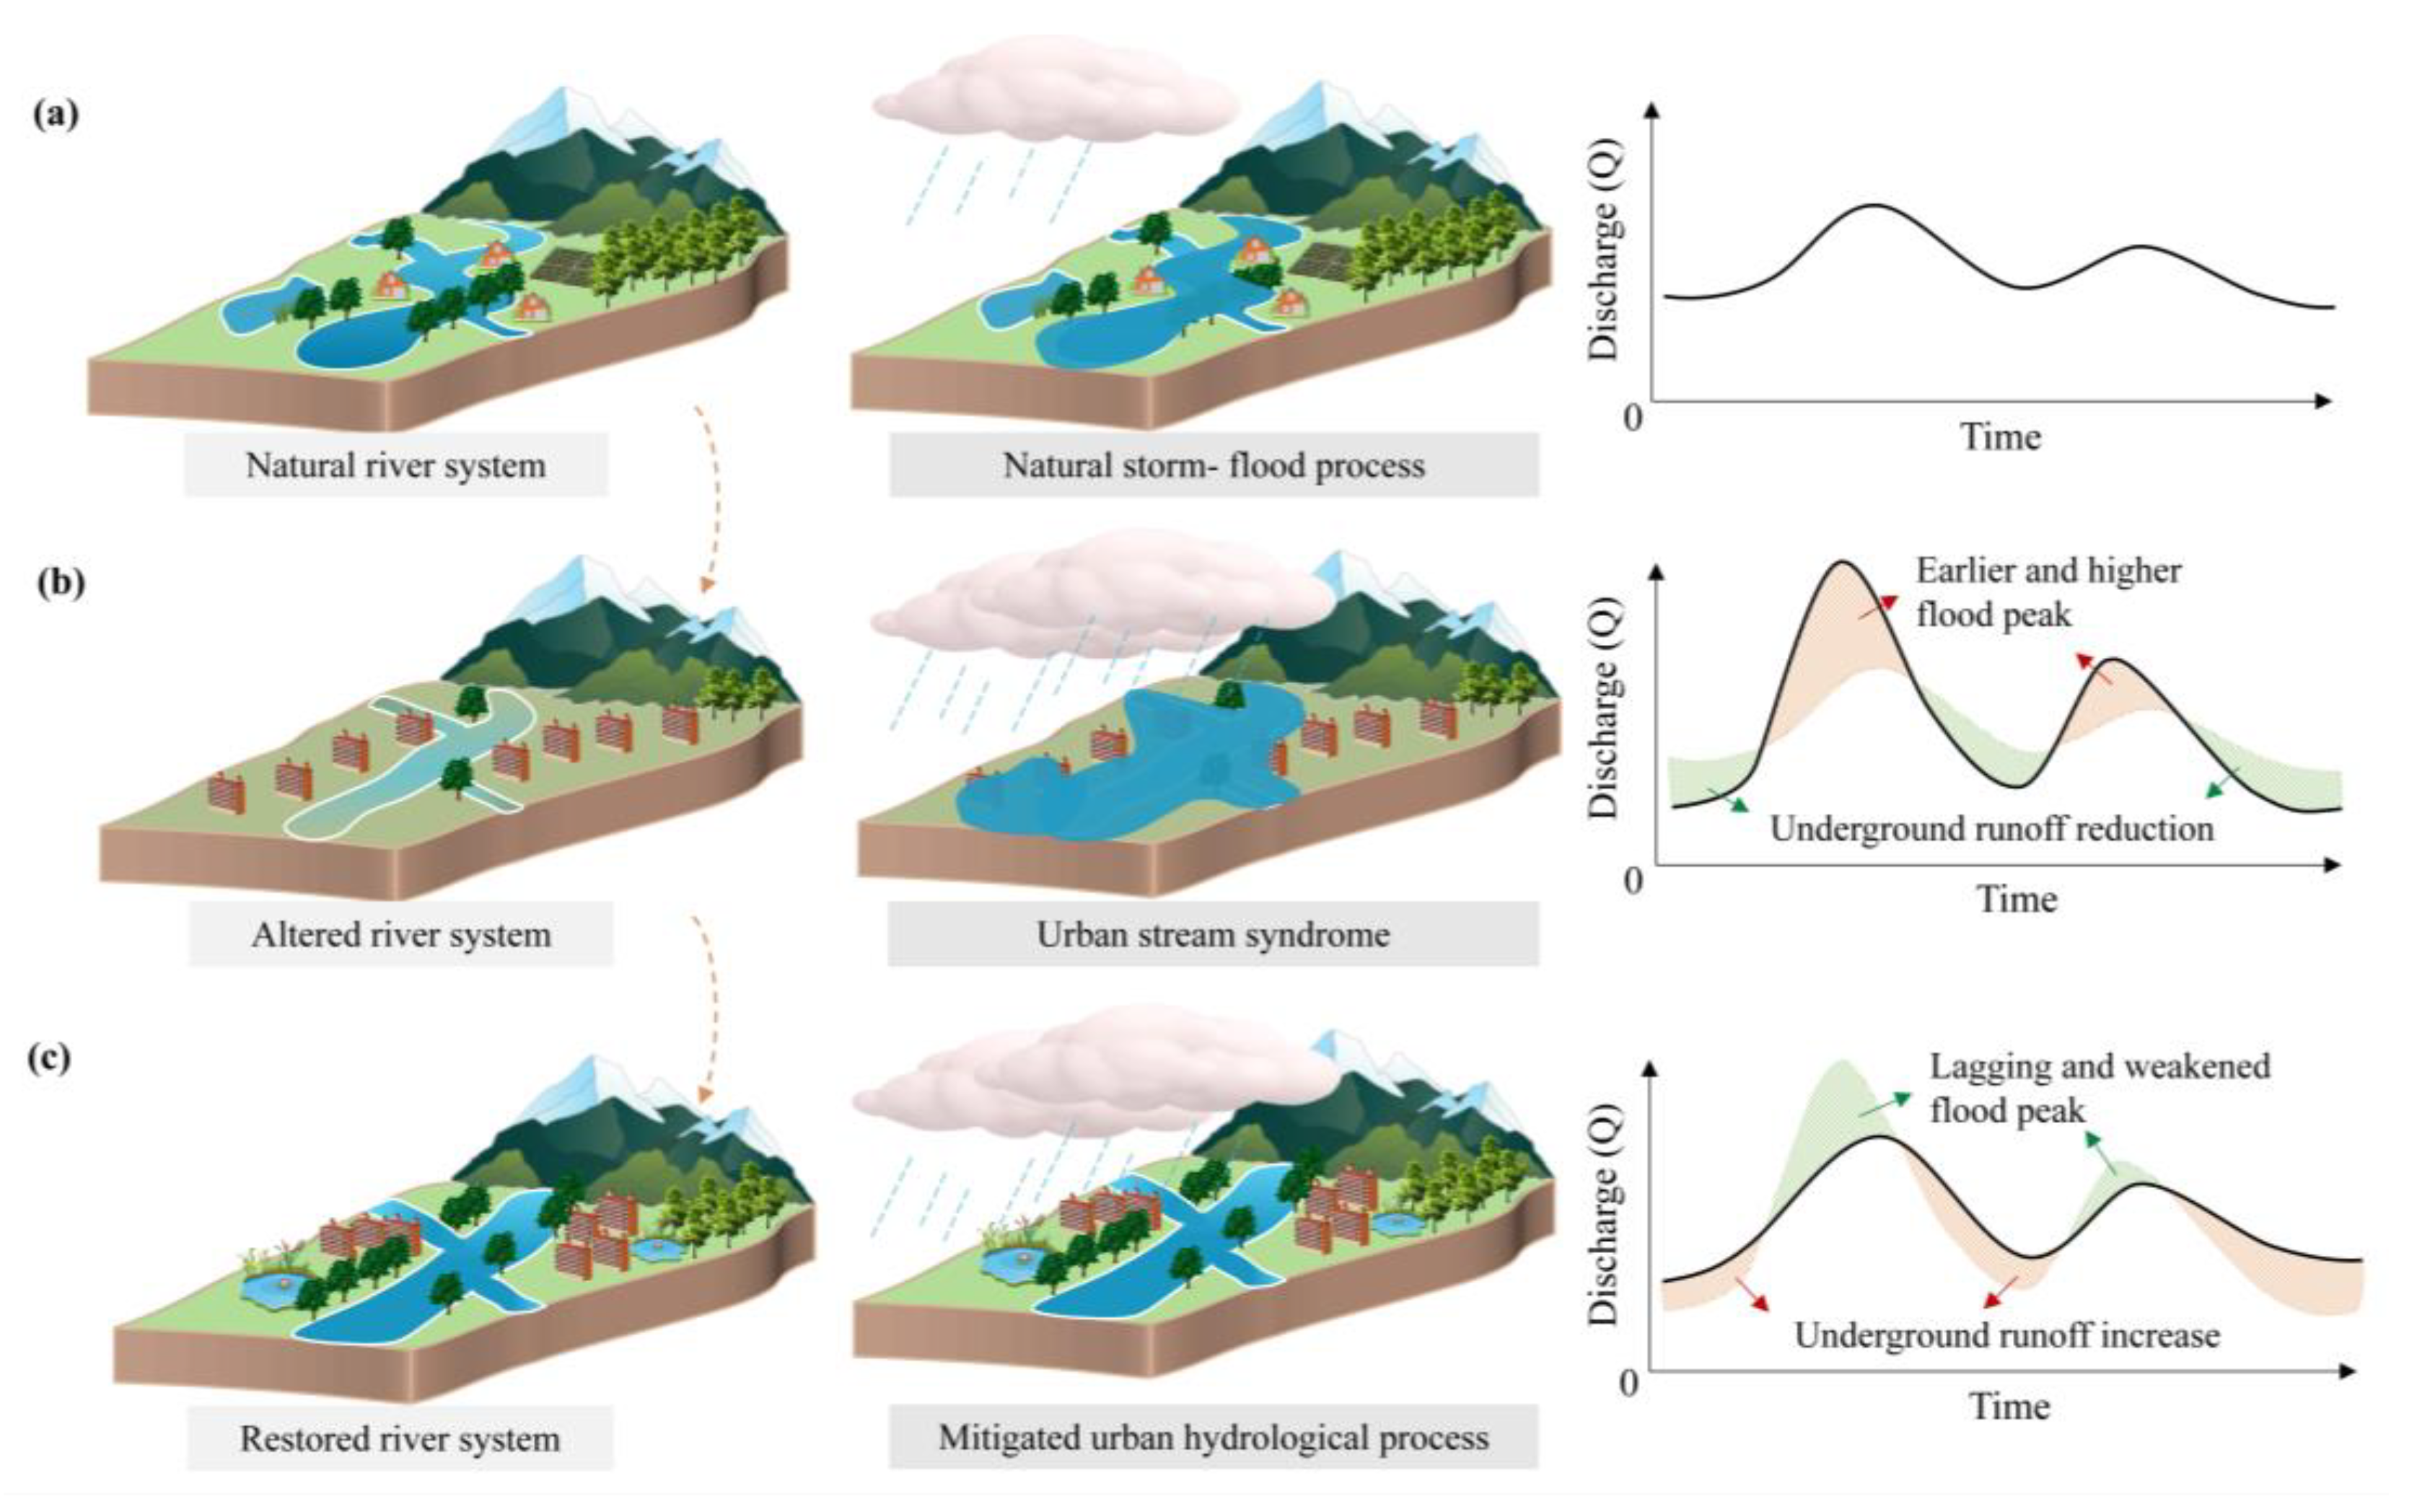
To better illustrate river network variations in urbanized areas, this study generalizes a conceptualized model with three evolution stages as an explanatory framework to help us directly understand the river changes in urban areas (Figure 7). In the initial stage, small-scale cities formed primarily under the constraints of natural environmental factors, such as water resources. With minimal human disturbance, river evolution followed natural patterns, resulting in relatively stable hydrological processes (Figure 7a). However, increasing demand for urban land enhanced the capacity to reshape river networks. Meanwhile, adverse factors, including vegetation destruction, reduction in river network connectivity, and increased impervious surface area [24], led to a sharper increase in flood flows (Figure 7b). This in turn diminished flood carrying and storage capacities [34], posing significant flood risks and losses to urban development. In fact, a recent study has uncovered a significant increasing trend in both the average and flood peak water levels of the major channels in the SWC metropolitan area over the past decades [49]. During this phase, the interaction between urban expansion and river networks was predominantly characterized by negative feedback (manifested as restriction and threat). The intensifying conflict between urbanization and river networks prompted a shift in urban development priorities towards environmental improvement. When the “urban stream syndrome” intensifies, restoration projects are often undertaken [50,51]. River system recovery improves urban hydrological processes, thereby lowering flood peaks and enhancing flood regulation capacity (Figure 7c). However, it is necessary to clarify that “urban river syndrome” is an unexpected consequence of giving priority to immediate urban needs rather than long-term hydrological and ecological functions. Given that well-managed urbanization necessitates a balance between development and river network evolution, some measures that mimic natural functions to reduce negative hydrological effects are conducted, such as sustainable urban drainage systems, green infrastructure, and sponge city [52,53,54]. These approaches represent a modification toward harmonizing urban growth with river network dynamics.

5. Conclusions

This study documented river network variations within built-up areas in the Suzhou-Wuxi-Changzhou metropolitan area. The findings revealed a significant increase in the average urban expansion rate for each city over the past several decades. Concurrently, key quantitative characteristics of river networks in the built-up areas markedly decreased from the 1960s to the 2010s, particularly river density. Furthermore, as the urban expansion rate increased, changes in the river network’s structural characteristics suggested that urban expansion exerted less influence on main rivers but dominated changes in tributaries. The area-length ratio of main rivers remained relatively constant, even increasing in Suzhou and Wuxi over the 1960s–2010s period, leading to a simplification of the river network. Additional adverse changes were identified, such as declines in static storage capacity and potential regulation capacity, primarily attributable to changes in river quantity and structure.
Although recent river dynamics can be precisely analyzed using high-resolution remote sensing imagery, this study highlights that historical topographic maps remain a vital resource for extracting subtle river network information, particularly in areas prior to large-scale land use change induced by urbanization. This approach enables the reconstruction of historical river network modifications to inform optimal urban planning. Furthermore, the results demonstrate that alterations to the river network structure within expansion areas were predominantly driven by the loss of narrower tributaries. Consequently, efforts to restore river networks in developed areas and formulate planning policies in developing areas should emphasize the relationship between main rivers and their tributaries. These findings provide a foundation for future urban development that integrates river network management.
While this study identified the spatio-temporal variations in river networks within a highly urbanized metropolitan area, several limitations should be noted. The analysis focused solely on linking river changes to urban land use, without considering the interactions between these changes and other socio-economic factors associated with urbanization. Therefore, future research requires approaches that integrate natural and social sciences to enable a more comprehensive assessment of urban river networks. In addition, future research should aim to systematically elucidate the hydrological impacts of urban river network changes. The integration of high-resolution data with advanced hydrodynamic models will be key to revealing the underlying mechanisms and strengthening the scientific basis for flood resilience and river restoration.

Author Contributions

Conceptualization, Z.L. and Y.X.; methodology, Z.L.; formal analysis, Z.L. and S.L.; writing—original draft preparation, Z.L. and S.L.; writing—review and editing, M.L., and S.D.; visualization, Z.L. and S.L.; supervision, S.D. and M.L.; project administration, Y.X.; funding acquisition, Y.X. All authors have read and agreed to the published version of the manuscript.

Funding

This research was funded by the National Natural Science Foundation of China (U2240203; 42201128), the Social Science Foundation of Jiangsu Province (24GLC005), and the Belt and Road Special Foundation of the National Key Laboratory of Water Disaster Prevention (2024nkms03).

Data Availability Statement

The raw data supporting the conclusions of this article will be made available by the authors on request.

Conflicts of Interest

The authors declare no conflicts of interest.

References

  1. Nilsson, C.; Reidy, C.A.; Dynesius, M.; Revenga, C. Fragmentation and flow regulation of the world’s large river systems. Science 2005, 308, 405–408. [Google Scholar] [CrossRef] [PubMed]
  2. Cooke, G.; Garbutt, R.; Kijas, J.; Pelizzon, A.; Page, J.; Wessell, A.; Parker, F.B.; Reichelt-Brushett, A. Speaking with the river: Confluence and interdisciplinarity in rivers and river systems. Environ. Plan. Nat. Space 2023, 11, 2721–2739. [Google Scholar] [CrossRef]
  3. Strahler, A.N. Hypsometric (area-altitude) analysis of erosional topography. Geol. Soc. Am. Bull. 1952, 63, 1117–1142. [Google Scholar] [CrossRef]
  4. Ke, L.H.; Xu, J.; Fan, C.Y.; Liu, K.; Chen, T.; Wang, S.D.; Chen, X.B.; Song, L.J.; Song, C.Q. Remote sensing reconstruction of long-term water level and storage variations of a poorly-gauged river in the Tibetan Plateau. J. Hydrol. Reg. Stud. 2020, 40, 101020. [Google Scholar] [CrossRef]
  5. Chin, A. Urban transformation of river landscapes in a global context. Geomorphology 2006, 79, 460–487. [Google Scholar] [CrossRef]
  6. Ashmore, P. Towards a sociogeomorphology of rivers. Geomorphology 2015, 251, 149–156. [Google Scholar] [CrossRef]
  7. Gu, J.Y.; Lee, J.W.; Lee, S.W.; Park, Y.; Park, S.R. Enhancing Stream Ecosystems Through Riparian Vegetation Management. Land 2025, 14, 1248. [Google Scholar] [CrossRef]
  8. Deng, X.J.; Xu, Y.P.; Han, L.F.; Song, S.; Yang, L.; Li, G.; Wang, Y.F. Impacts of urbanization on river systems in the Taihu Region, China. Water 2015, 7, 1340–1358. [Google Scholar] [CrossRef]
  9. Wu, L.; Xu, Y.P.; Xu, Y.; Yuan, J.; Xiang, J.; Xu, X.; Xu, Y. Impact of rapid urbanization on river system in a river network plain. Acta Geogr. Sin. 2018, 73, 104–114. [Google Scholar]
  10. Hein, T.; Hauer, C.; Schmid, M.; Stöglehner, G.; Stumpp, C.; Ertl, T.; Graf, W.; Habersack, H.; Haidvogl, G.; Hood-Novotny, R.; et al. The coupled socio-ecohydrological evolution of river systems: Towards an integrative perspective of river systems in the 21st century. Sci. Total Environ. 2021, 801, 149619. [Google Scholar] [CrossRef]
  11. Julian, J.P.; Wilgruber, N.A.; de Beurs, K.M.; Mayer, P.M.; Jawarneh, R.N. Long-term impacts of land cover changes on stream channel loss. Sci. Total Environ. 2015, 537, 399–410. [Google Scholar] [CrossRef]
  12. Palazzoli, I.; Montanari, A.; Ceola, S. Influence of urban areas on surface water loss in the contiguous United States. AGU Adv. 2022, 3, e2021AV000519. [Google Scholar] [CrossRef]
  13. Gottero, E.; Larcher, F.; Cassatella, C. Defining and regulating peri-urban areas through a landscape planning approach: The case study of Turin Metropolitan Area (Italy). Land 2023, 12, 217. [Google Scholar] [CrossRef]
  14. Itsukushima, R.; Ohtsuki, K. A century of stream burial due to urbanization in the Tokyo Metropolitan Area. Environ. Earth Sci. 2021, 80, 237. [Google Scholar] [CrossRef]
  15. Wu, Y.; Xu, Y.; Zhao, Y.; Luo, Y.; Lu, J.; Chen, Y. Evolution of river network due to urbanization in the Southeast Yinzhou Plain of Yongjiang River Basin, China. J. Clean Prod. 2022, 379, 134718. [Google Scholar] [CrossRef]
  16. Everard, M.; Moggridge, H.L. Rediscovering the value of urban rivers. Urban Ecosyst. 2012, 15, 293–314. [Google Scholar] [CrossRef]
  17. Shreve, R.L. Variation of mainstream length with basin area in river networks. Water Resour. Res. 1974, 10, 1167–1177. [Google Scholar] [CrossRef]
  18. Shi, Y.Q.; Yao, Y.; Zhao, J.; Li, X.Y.; Yu, J.; Qian, G.R. Changes in reticular river network under rapid urbanization: A case of Pudong New Area, Shanghai. Water 2022, 14, 523. [Google Scholar] [CrossRef]
  19. Zhang, X.Y.; Li, F.W.; Zhao, Y. Structural characteristics of the river network and its functional responses in the Haihe River basin based on small-world networks. Adv. Water Sci. 2023, 34, 541–552. [Google Scholar]
  20. Xiao, Y.; Lan, G.; Ou, Y.Q.; Zhang, L.P.; Xia, J. Impact of urbanization on the spatial and temporal evolution of the water system pattern: A study of the Wuhan metropolitan area in China. Ecol. Indic. 2023, 153, 110408. [Google Scholar] [CrossRef]
  21. Song, S.; Zeng, L.; Wang, Y.; Li, G.; Deng, X.J. The response of river network structure to urbanization: A multifractal perspective. J. Clean Prod. 2019, 221, 377–388. [Google Scholar] [CrossRef]
  22. Nedd, R.; Anandhi, A. Land use changes in the southeastern United States: Quantitative changes, drivers, and expected environmental impacts. Land 2022, 11, 2246. [Google Scholar] [CrossRef]
  23. Gregory, K.J.; Chin, A. Evaluation of the imprint of urban channel variation and enlargement. Geogr. J. 2018, 184, 269–292. [Google Scholar] [CrossRef]
  24. Liu, Y.; Huang, X.J.; Yang, H. An integrated approach to investigate the coupling coordination between urbanization and flood disasters in China. J. Clean Prod. 2022, 375, 134191. [Google Scholar] [CrossRef]
  25. Wu, B.H.; Quan, Q.; Yang, S.M.; Dong, Y.X. A social-ecological coupling model for evaluating the human-water relationship in basins within the Budyko framework. J. Hydrol. 2023, 619, 129361. [Google Scholar] [CrossRef]
  26. Wohl, E.; Lane, S.N.; Wilcox, A.C. The science and practice of river restoration. Water Resour. Res. 2015, 51, 5974–5997. [Google Scholar] [CrossRef]
  27. Hooke, J.M. Human impacts on fluvial systems in the Mediterranean region. Geomorphology 2006, 79, 311–335. [Google Scholar] [CrossRef]
  28. Zhang, H.M.; Ma, R.Q.; Cui, L.B.; Tang, G.; Ma, Z.J. Exploring the impacts of energy and environmental constraints on China’s urbanization process. Comput. Ind. Eng. 2022, 169, 108170. [Google Scholar] [CrossRef]
  29. Hou, Y.X.; Zhang, K.R.; Zhu, Y.C.; Liu, W.Y. Spatial and temporal differentiation and influencing factors of environmental governance performance in the Yangtze River Delta, China. Sci. Total Environ. 2021, 801, 149699. [Google Scholar] [CrossRef] [PubMed]
  30. Li, Y.F.; Li, Y.; Wu, W. Threshold and resilience management of coupled urbanization and water environmental system in the rapidly changing coastal region. Environ. Pollut. 2016, 208, 87–95. [Google Scholar] [CrossRef]
  31. Lu, S.S.; Guan, X.L.; He, C.; Zhang, J.L. Spatio-temporal patterns and policy implications of urban land expansion in metropolitan areas: A case study of Wuhan urban agglomeration, central China. Sustainability 2014, 6, 4723–4748. [Google Scholar] [CrossRef]
  32. Yuan, W.; Yang, K.; Tang, M.; Xu, Q.X. Stream structure characteristics and their impact on storage and flood control capacity in the urbanized plain river network. Geogr. Res. 2005, 24, 717–724. [Google Scholar]
  33. He, L.H.; Zhao, H. The fractal dimension of river network and its interpretation. Sci. Geogr. Sin. 1996, 16, 124–128. [Google Scholar]
  34. Deng, X.J.; Xu, Y.P. Degrading flood regulation function of river systems in the urbanization process. Sci. Total Environ. 2018, 622, 1379–1390. [Google Scholar] [CrossRef]
  35. Grill, G.; Dallaire, C.O.; Chouinard, E.F.; Sindorf, N.; Lehner, B. Development of new indicators to evaluate river fragmentation and flow regulation at large scales: A case study for the Mekong River Basin. Ecol. Indic. 2014, 45, 148–159. [Google Scholar] [CrossRef]
  36. Xu, Y.; Xu, Y.P.; Wu, L. Changes in river networks and their storage and regulation capacities in the rapidly urbanized Taihu Basin, China. Hydrol. Process. 2018, 32, 3341–3351. [Google Scholar] [CrossRef]
  37. Chen, K.L.; Wang, X.; Li, D.; Xue, D. The morphological evolution of river and water body in urban area of Guangzhou City in 1990–2010. Sci. Geogr. Sin. 2013, 33, 223–230. [Google Scholar]
  38. Jiang, Y.; Xue, L.F.; Yu, H.X.; Meng, Y.Y. Change of steam structure in the Nansi Lake Basin during the urbanization process since 1980s. J. Lake Sci. 2017, 29, 135–142. [Google Scholar] [CrossRef]
  39. Napieralski, J.A.; Welsh, E.S. A century of stream burial in Michigan (USA) cities. J. Maps 2016, 12, 300–303. [Google Scholar] [CrossRef]
  40. Steele, M.K.; Heffernan, J.B. Morphological characteristics of urban water bodies: Mechanisms of change and implications for ecosystem function. Ecol. Appl. 2014, 24, 1070–1084. [Google Scholar] [CrossRef]
  41. Napieralski, J.A.; Carvalhaes, T. Urban stream deserts: Mapping a legacy of urbanization in the United States. Appl Geogr. 2016, 67, 129–139. [Google Scholar] [CrossRef]
  42. Sear, D.A.; Newson, M.D. Environmental change in river channels: A neglected element. Towards geomorphological typologies, standards and monitoring. Sci. Total Environ. 2003, 310, 17–23. [Google Scholar] [CrossRef]
  43. Pinto, U.; Maheshwari, B.L. River health assessment in peri-urban landscapes: An application of multivariate analysis to identify the key variables. Water Res. 2011, 45, 3915–3924. [Google Scholar] [CrossRef] [PubMed]
  44. Findlay, S.J.; Taylor, M.P. Why rehabilitate urban river systems? Area 2006, 38, 312–325. [Google Scholar] [CrossRef]
  45. James, L.A.; Marcus, W.A. The human role in changing fluvial systems: Retrospect, inventory and prospect. Geomorphology 2006, 79, 152–171. [Google Scholar] [CrossRef]
  46. Zhang, A.; Zheng, C.; Wang, S.; Yao, Y. Analysis of streamflow variations in the Heihe River Basin, northwest China: Trends, abrupt changes, driving factors and ecological influences. J. Hydrol. Reg. Stud. 2015, 3, 106–124. [Google Scholar] [CrossRef]
  47. Tullos, D.; Baker, D.W.; Crowe Curran, J.; Schwar, M.; Schwartz, J. Enhancing resilience of river restoration design in systems undergoing change. J. Hydraul. Eng. 2021, 147, 03121001. [Google Scholar] [CrossRef]
  48. Jiang, Q.; Zheng, B.H. The relationship between the change of water system and the urban land expansion in Changsha. J. Nat. Resour. 2019, 34, 1429–14390. [Google Scholar] [CrossRef]
  49. Luo, S.; Wang, Q.; Xu, Y.P.; Lin, Z.X.; Yu, Z.H. Identifying changes in flood characteristics and their causes from an event-based perspective in the Central Taihu Basin. Sci. Total Environ. 2023, 905, 167131. [Google Scholar] [CrossRef]
  50. Tranmer, A.W.; Caamaño, D.; Arteaga, A.E. Urban stream syndrome: Quantifying topographic variation along an urban-rural gradient. J. Environ. Manag. 2022, 317, 115413. [Google Scholar] [CrossRef]
  51. Brown, A.G.; Lespez, L.; Sear, D.A.; Macaire, J.J.; Houben, P.; Klimek, K.; Brazier, R.E.; Van-Oost, K.; Pears, B. Natural vs anthropogenic streams in Europe: History, ecology and implications for restoration, river-rewilding and riverine ecosystem services. Earth Sci. Rev. 2018, 180, 185–205. [Google Scholar] [CrossRef]
  52. Chapman, C.; Hall, J.W. Designing green infrastructure and sustainable drainage systems in urban development to achieve multiple ecosystem benefits. Sustain. Cities Soc. 2022, 85, 104078. [Google Scholar] [CrossRef]
  53. Hamel, P.; Tan, L. Blue-green infrastructure for flood and water quality management in Southeast Asia: Evidence and knowledge gaps. Environ. Manag. 2022, 69, 699–718. [Google Scholar] [CrossRef] [PubMed]
  54. Meng, M.; Dąbrowski, M.; Stead, D. Governing resilience planning: Organizational structures, institutional rules, and fiscal incentives in Guangzhou. Land 2023, 12, 417. [Google Scholar] [CrossRef]
Figure 1. Location of Suzhou-Wuxi-Changzhou metropolitan area within the Yangtze River Delta, China.
Land 14 01994 g001
Figure 2. Flowchart of the methodology in this study.
Land 14 01994 g002
Figure 3. Spatial pattern of urban expansion in the studied area. (a) the Suzhou-Wuxi-Changzhou metropolitan area; (bd) Changzhou, Wuxi and Suzhou, respectively.
Land 14 01994 g003
Figure 4. Spatial patterns of river networks in the built-up areas of the study area across different phases. (a) Changzhou; (b) Wuxi; (c) Suzhou.
Land 14 01994 g004
Figure 5. Statistical results of the storage and regulation characteristics. (a) Static storage capacity (SSC); (b) Potential regulation capacity (PRC).
Land 14 01994 g005
Figure 6. Variations in river networks’ quantity metrics and the corresponding urban expansion differentiation (UED). (a) Slow urbanization period (1960s–1980s); (b) Rapid urbanization period (1980s–2010s). For each direction, the yellow sector denotes the UED value, while the adjacent sector represents the change in river density (Rd) or water surface proportion (Wp), with red for a positive change and green for negative.
Land 14 01994 g006
Figure 7. Three evolution stages for river networks in the urbanized areas. (a) Natural river network with stable hydrological process; (b) Altered river network by urbanization with significant flood threats; (c) Restored river network with mitigated urban hydrological process.
Land 14 01994 g007
Table 1. Measurements of urban expansion in the Suzhou-Wuxi-Changzhou metropolitan area.
DirectionPeriod 1 (1960s–1980s)Period 2 (1980s–2010s)
UER (km2/a)UEDUER (km2/a)UED
CZWXSZCZWXSZCZWXSZCZWXSZ
N-NE0.780.560.211.310.570.500.942.771.690.281.190.73
NE-E0.780.510.381.320.751.053.375.014.251.002.551.26
E-SE1.920.720.101.260.980.224.114.834.930.501.812.97
SE-S0.591.030.411.300.791.055.093.036.191.990.771.73
S-SW0.791.000.701.261.161.494.041.512.581.180.420.45
SW-W0.720.890.540.971.422.044.171.343.351.320.420.80
W-NW0.721.360.690.571.341.314.024.294.811.220.880.84
NW-N0.391.080.250.441.150.653.543.751.291.910.950.51
Average0.840.890.411.051.021.043.663.323.641.181.121.16
Note: CZ represents Changzhou, WX represents Wuxi, and SZ represents Suzhou.
Table 2. Statistical results of river network variations in the built-up areas of three cities.
MetricsPhaseCZWXSZ
QuantityRiver density
(Rd)/(km·km−2)
1960s2.552.383.17
1980s2.442.213.02
2010s1.581.642.63
Proportion of water surface (Wp)/%1960s5.614.6212.21
1980s5.355.7211.53
2010s3.913.889.60
StructureArea-length ratio of main rivers (RAL)1960s40.5841.8045.57
1980s38.5344.2247.43
2010s38.7448.6849.89
Tributary development coefficient (K)1960s1.653.333.20
1980s1.562.542.53
2010s0.992.092.06
ComplexityFractal dimension (D)1960s1.441.421.52
1980s1.431.441.50
2010s1.311.411.50
Note: CZ represents Changzhou, WX represents Wuxi, and SZ represents Suzhou.
Disclaimer/Publisher’s Note: The statements, opinions and data contained in all publications are solely those of the individual author(s) and contributor(s) and not of MDPI and/or the editor(s). MDPI and/or the editor(s) disclaim responsibility for any injury to people or property resulting from any ideas, methods, instructions or products referred to in the content.