Article

Mitigating Waterlogging in Old Urban Districts with InfoWorks ICM: Risk Assessment and Cost-Aware Grey-Green Retrofits

1
Nanjing Hydraulic Research Institute, Nanjing 210098, China
2
State Key Laboratory of Hydrology, Water Resources and Hydraulic Engineering Science, Nanjing 210098, China
*
Author to whom correspondence should be addressed.
Land 2025, 14(10), 1983; https://doi.org/10.3390/land14101983
Submission received: 1 September 2025 / Revised: 22 September 2025 / Accepted: 29 September 2025 / Published: 1 October 2025

Abstract

Rapid urbanization and frequent extreme events have made urban flooding a growing threat to residents. This issue is acute in old urban districts, where extremely limited land resources, outdated standards and poor infrastructure have led to inadequate drainage and uneven pipe settlement, heightening flood risk. This study applies InfoWorks ICM Ultimate (version 21.0.284) to simulate flooding in a typical old urban district for six return periods. A risk assessment was carried out, flood causes were analyzed, and mitigation strategies were evaluated to reduce inundation and cost. Results show that all combined schemes outperform single-measure solutions. Among them, the green roof combined with pipe optimization scheme eliminated high-risk and medium-risk areas, while reducing low-risk areas by over 78.23%. It also lowered the ponding depth at key waterlogging points by 70%, significantly improving the flood risk profile. The permeable pavement combined with pipe optimization scheme achieved similar results, reducing low-risk areas by 77.42% and completely eliminating ponding at key locations, although at a 50.8% higher cost. This study underscores the unique contribution of cost-considered gray-green infrastructure retrofitting in old urban areas characterized by land scarcity and aging pipeline networks. It provides a quantitative basis and optimization strategies for refined modeling and multi-strategy management of urban waterlogging in such regions, offering valuable references for other cities facing similar challenges. The findings hold significant implications for urban flood control planning and hydrological research, serving as an important resource for urban planners engaged in flood risk management and researchers in urban hydrology and stormwater management.

1. Introduction

Since the earliest forms of human settlement and urban enclosure, cities have played a fundamental role in the development of human civilization, gradually evolving into centers of socioeconomic activity. With the rapid acceleration of urbanization, the transformation of natural underlying surfaces has led to a significant increase in impervious areas and a reduction in runoff concentration time. These changes have substantially increased urban runoff coefficients and peak discharge volumes, placing tremendous pressure on urban drainage systems for both sewage disposal and stormwater management, thereby elevating the risk of pluvial flooding in cities [1,2]. In recent years, the frequency of extreme climate events has been increasing. The Intergovernmental Panel on Climate Change (IPCC), in its Sixth Assessment Report, explicitly pointed out the rising frequency and intensity of extreme rainfall events [3,4,5]. The increasing probability of extreme precipitation has markedly intensified the risk of urban flooding, triggering severe disasters in many cities worldwide. For instance, such events have occurred in Zhengzhou, China (20 July 2021); Beijing, China (23 July 2023); Hagen, Germany (15 July 2021); New York, USA (1 September 2021); Queensland, Australia (27 February 2022); and Seoul, South Korea (8 August 2022). These flood disasters not only damaged urban infrastructure and disrupted transportation systems but also caused substantial property losses and posed serious threats to public safety.
To date, numerous scholars have conducted extensive research on urban pluvial flooding, focusing on various aspects including the hydrodynamic mechanisms of urban inundation processes, causative factor analysis [6,7], flood hazard mapping [8], model development and improvement [9], the assessment of urban waterlogging risk and the impacts of rainfall characteristics, land surface conditions [10], and low impact development (LID) practices [11,12] as well as on the use of historical data in urban flood analysis [13,14]. For instance, Xu Zongxue et al. [15] examined the urban flood disaster mechanism in Jinan, revealing the combined influence of climate change and urbanization, and systematically analyzing the drivers and disaster-inducing processes. Han Feifei et al. [16] investigated the temporal and spatial variations of rainfall in Beijing, conducting a comprehensive study on precipitation patterns and waterlogging causes from the perspectives of temporal trends, spatial distribution, and flood mechanism. Feng Tianyu et al. [17] analyzed the urban waterlogging under different rainfall return periods in the Gutian area, and proposed two “sponge city” retrofitting schemes to evaluate their mitigation effects. These studies provide valuable technical references and analytical frameworks for understanding urban waterlogging under extreme precipitation events.
Recent studies have demonstrated that integrating grey and green infrastructure has emerged as a promising approach for managing urban stormwater runoff [18]. For instance, Sara Al-Zghoul et al. [19] employed a GIS-based hotspot analysis combined with hydrological modeling to guide the strategic placement of permeable pavements in the peripheral blocks of the peri-urban Deir Ghbar community in Jordan, aiming to simultaneously improve walkability and mitigate flood risk. Similarly, Dougaheh et al. [20] simulated flood events in the northeastern districts of Tehran, Iran, and revealed that low impact development (LID) measures can significantly reduce flood volumes at the watershed outlet under scenarios of intensified future rainfall. Yu-Jia Chiu et al. [21] conducted an assessment in four catchments of Taoyuan City, Taiwan, and the results indicated that LID facilities significantly reduced runoff volume and peak discharge under short-duration rainfall conditions, whereas their effectiveness decreased under long-duration rainfall events. Daniel Green et al. [22] evaluated the effectiveness of green infrastructure across different spatial scales and storm intensities, emphasizing that green infrastructure alone cannot fully address urban flooding, and highlighting the necessity of investigating the interactions among blue, green, and grey infrastructure. Jiayue Li et al. [23], using Xiaoguwei Island in Guangzhou, China, as a case study, simulated the impacts of three LID measures—green roofs, sunken green spaces, and permeable pavements—on runoff and node overflow under rainfall return periods ranging from 1 to 100 years. Their results indicated that green roofs performed most effectively as a single measure, whereas the combined application of all three measures yielded the greatest overall benefits. Husnain Tansar et al. [24] demonstrated that integrated green–grey infrastructure schemes substantially outperformed single-measure strategies, achieving up to 39.4% reductions in flood damages and enhancing system resilience to as high as 0.94, with cost-effectiveness increasing under more intense rainfall events. Liu Bo et al. [25], in a study on the renovation of the old urban district of Huainan, found that the optimal cost–benefit outcome was achieved through the combined application of green roofs and permeable pavements. At present, research on green–grey infrastructure applications has primarily focused on the retrofitting of residential streets, exploring the integration potential of green, grey, and hybrid infrastructures in stormwater management, traffic regulation, and ecosystem service provision [26]. Similarly, Hu Yunjin et al. [27] designed sponge city retrofitting schemes for aging residential communities using combinations of permeable pavements and sunken green spaces, and verified their feasibility and effectiveness through simulations conducted with the SWMM model.
However, despite these advances, clear research gaps remain. Existing studies on the integration of grey and green infrastructure have mainly focused on newly developed districts or relatively open urban spaces, where land availability facilitates the implementation of large-scale LID measures. In contrast, compared with newly developed districts, old urban areas are often constrained by land scarcity and insufficient space for facility installation. Their drainage systems are commonly characterized by outdated design standards, pipe sedimentation, structural deterioration, uneven settlement, and inflow–infiltration problems, all of which significantly weaken drainage capacity [28,29]. Systematic studies on the coupled application of grey measures (such as pipe retrofitting) and green measures (such as green roofs and permeable pavements) under such constrained environments remain very limited. At the same time, few investigations have explored how to balance flood mitigation effectiveness, spatial feasibility, and economic cost within compact urban spaces. Addressing these gaps is essential for providing targeted and practical flood-control solutions for old urban districts.
In summary, developing a refined urban pluvial flooding model for old urban districts and conducting in-depth studies on flood forecasting, risk assessment, and decision-making for drainage management are essential measures for flood prevention and mitigation in aging city areas [30]. This study takes a typical old urban district as the research object and employs the Info Works ICM model to simulate inundation processes under different rainfall scenarios. The overflow, waterlogging, drainage network load, and spatial distribution of flood risk in the old district are investigated. Based on the simulation-based evaluation results, the causes of waterlogging are further analyzed. With the dual objectives of minimizing inundation extent and engineering cost, comprehensive governance schemes are developed by integrating pipe network retrofitting, green roofs, and permeable pavements. A practical, cost-conscious, and space-efficient grey–green renovation scheme is proposed for diagnosing drainage defects in aging residential areas, aiming to provide theoretical support for the formulation of flood control and drainage strategies in old urban districts.

2. Study Area

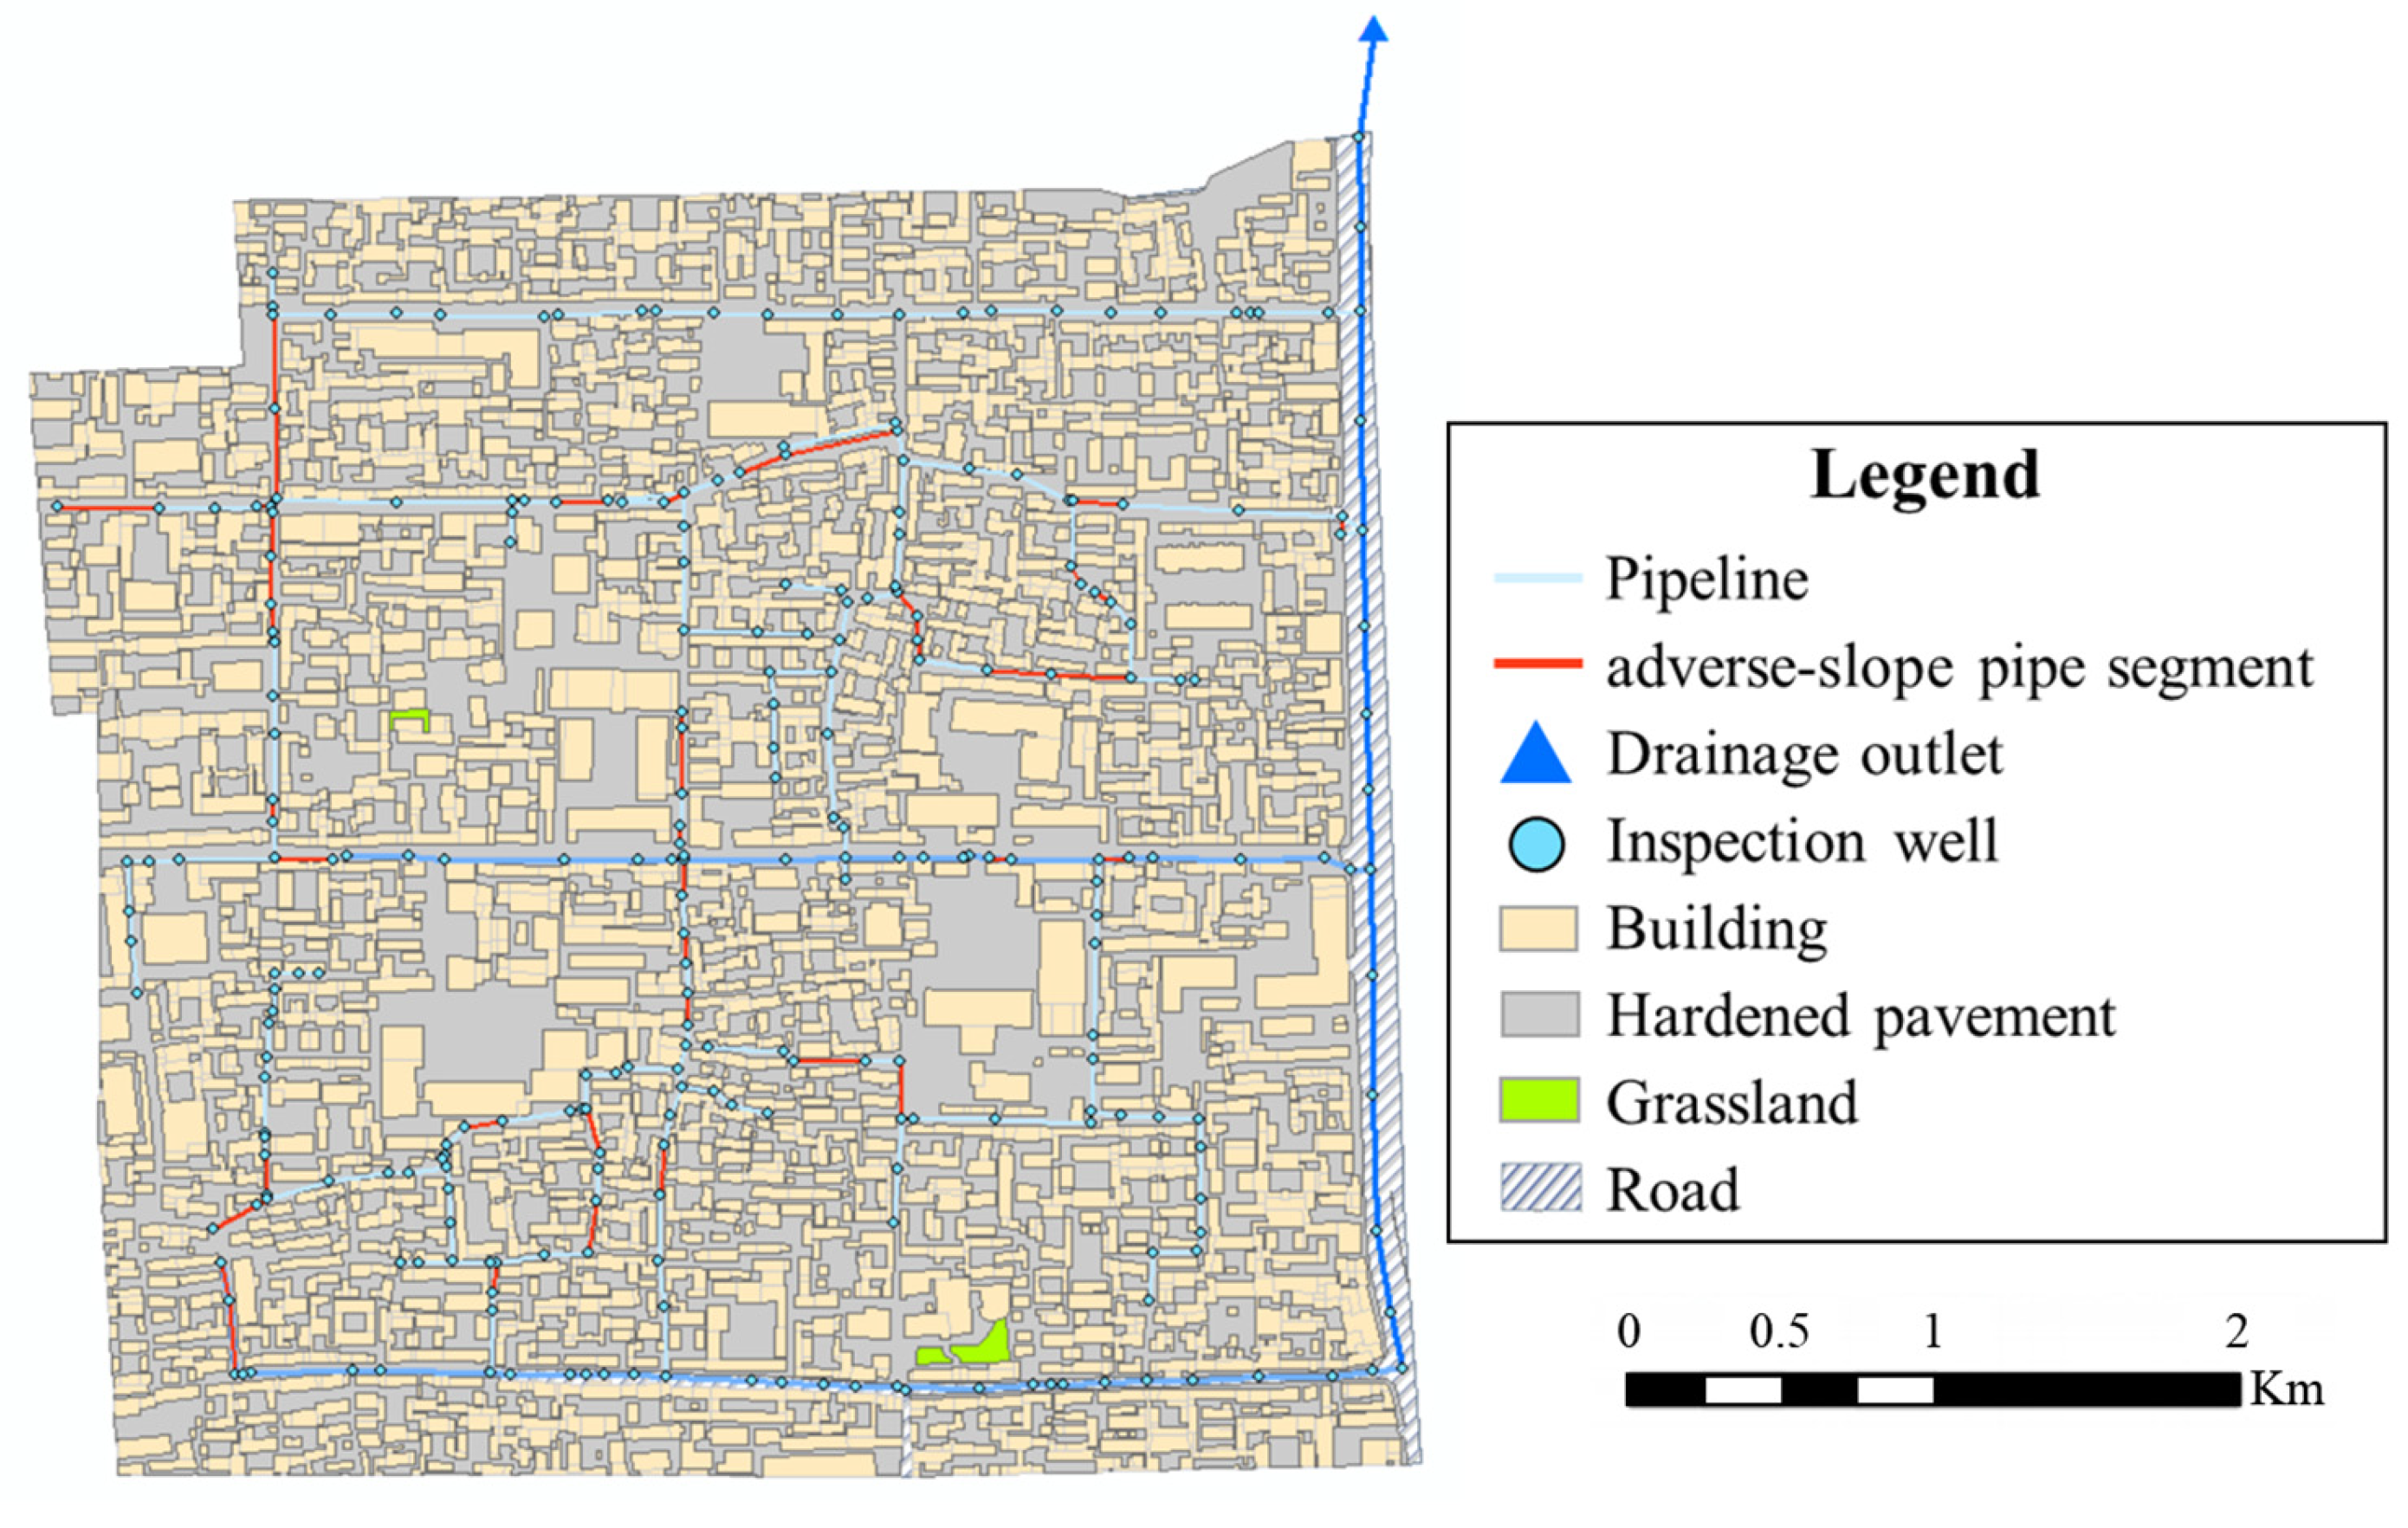
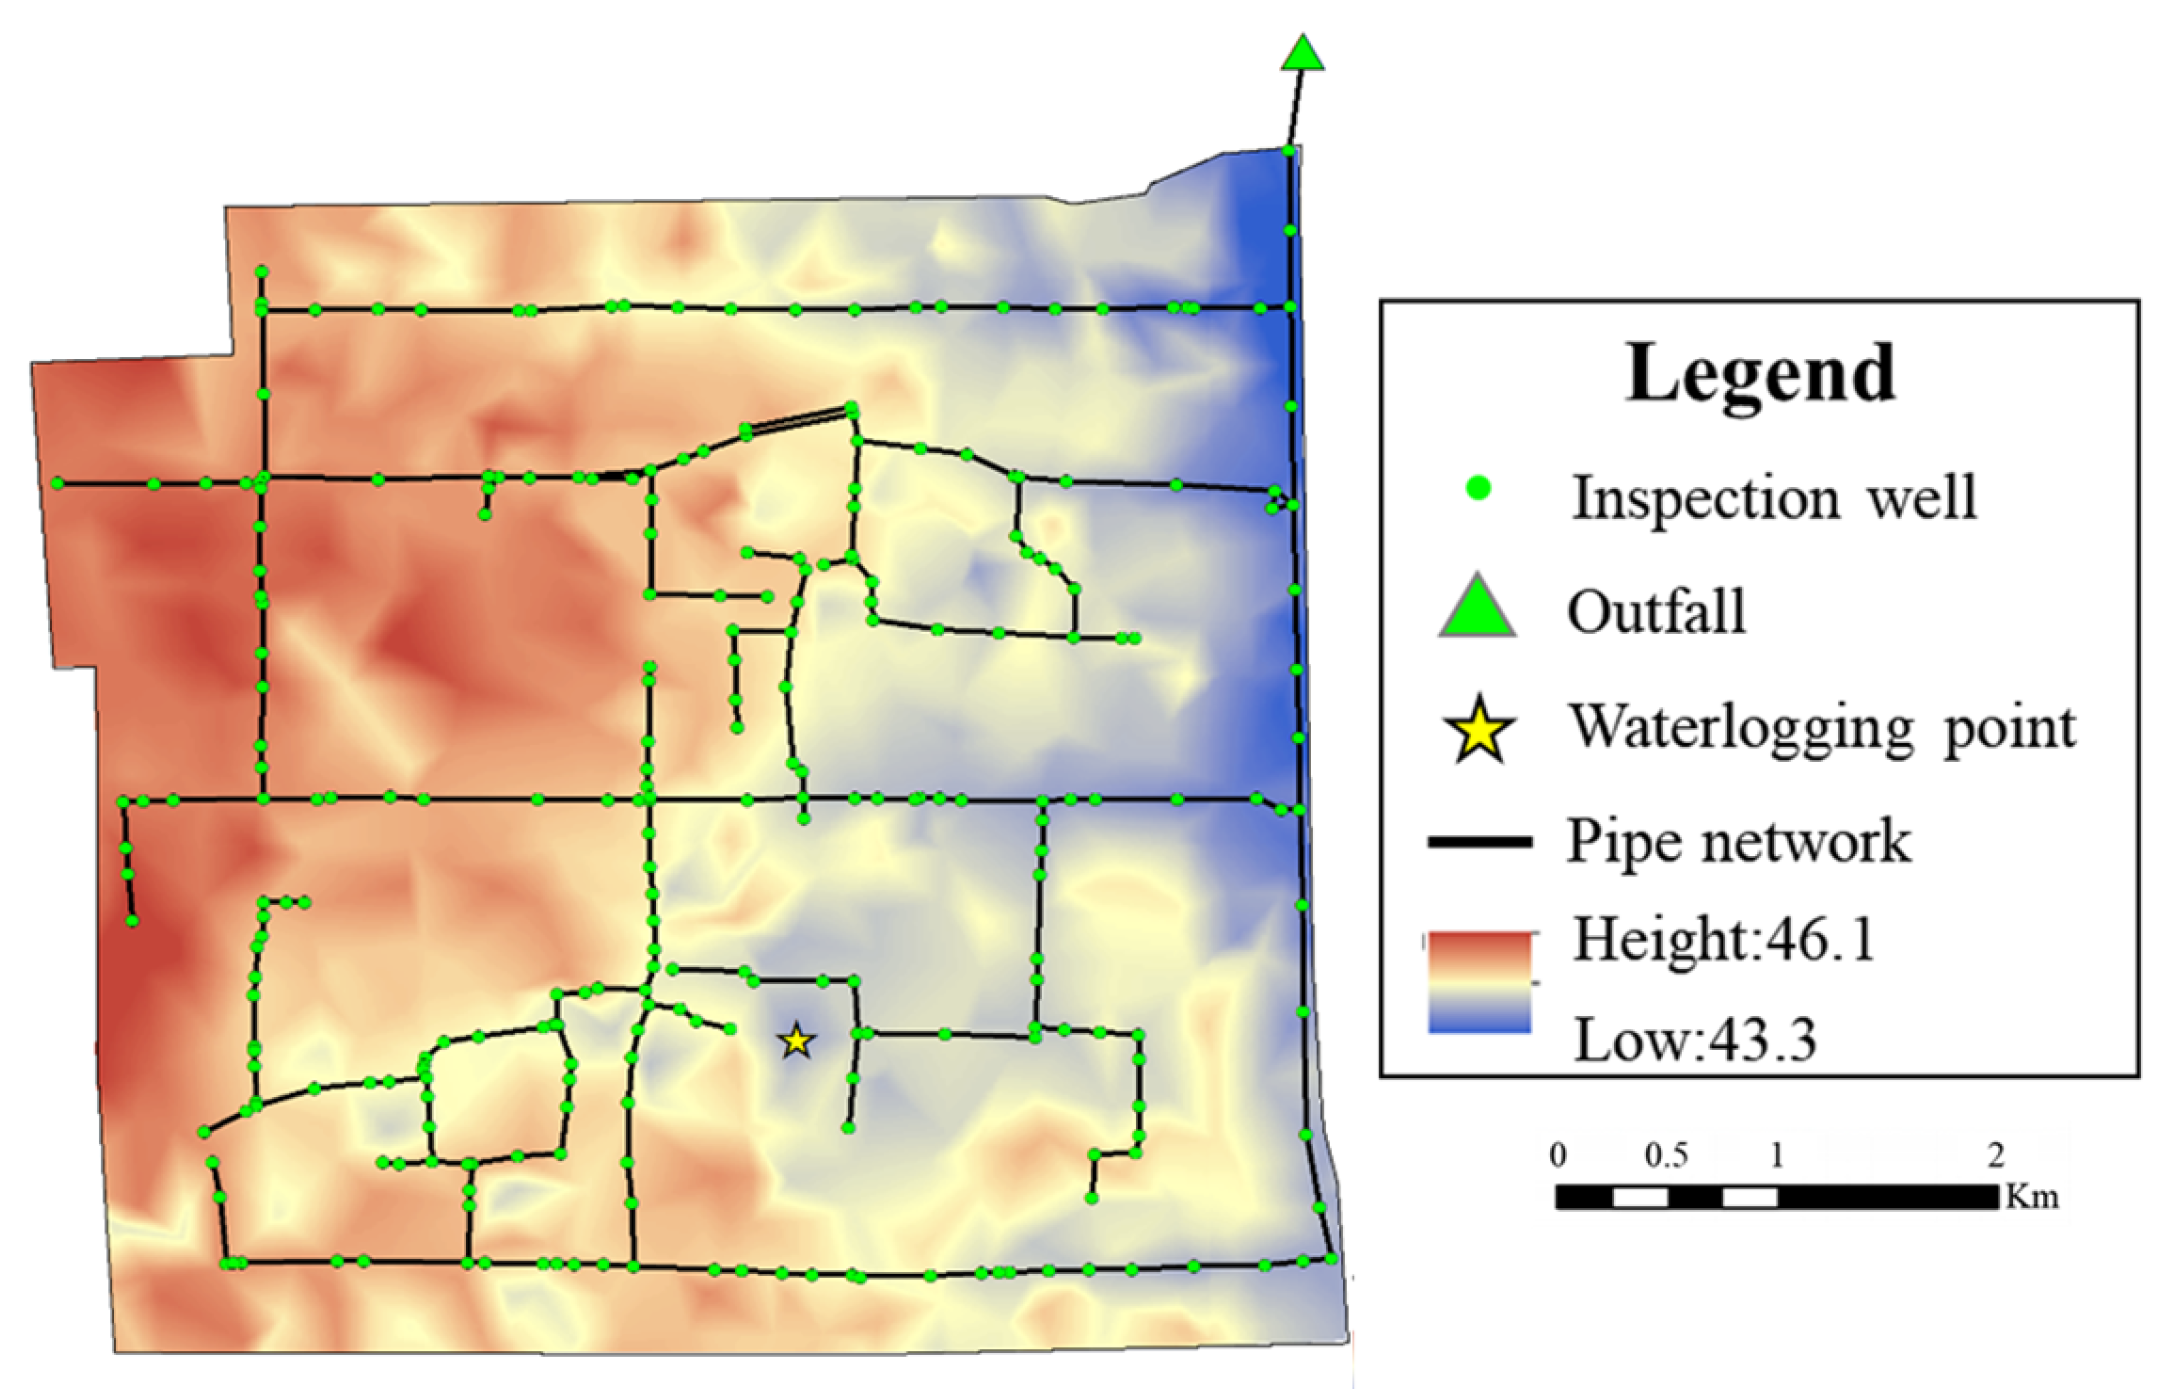
The study area is a representative old urban district located in Jinan City, Shandong Province, China, with a total area of approximately 0.31 km2 and a stormwater drainage network extending about 5.3 km. As a typical compact residential neighborhood developed mainly in the 1980s, it is characterized by extremely limited land resources and a dense building layout, with buildings accounting for 50.4% of the surface area and paved surfaces for 46.6% (Table 1). The drainage system was originally designed to meet only a 1–2-year return period standard, and after decades of operation has experienced aging and uneven pipe settlement, further heightening flood risk. Such conditions severely constrain the implementation of large-scale flood mitigation infrastructure. The drainage system, constructed several decades ago with relatively low design standards, has deteriorated over time and is further affected by pipe aging and reverse slopes, resulting in insufficient discharge capacity. These features mirror the common challenges faced by many old urban districts in China and other rapidly urbanizing regions, thus providing a typical case for investigating urban flood risk and evaluating feasible mitigation strategies. In terms of basic geospatial data, the study has obtained the district boundary, land use classification, and a high-resolution elevation point file. Regarding the stormwater drainage system, detailed pipeline information has been collected, including pipe IDs, lengths, slopes, and other structural attributes, along with key node parameters such as manhole IDs, ground elevation, and invert elevation (Figure 1). For rainfall and inundation monitoring, minute-level precipitation data from three typical heavy rainfall events in 2023 were collected within the study area. These events occurred on: July 21, 00:00–July 22, 14:00, July 29, 11:00–July 30, 14:00, July 31, 00:00–August 1, 13:29 (Figure 2). In addition, field-observed data were collected for one typical inundation point, including the recorded maximum water depth. Real-time water level and discharge data from a drainage monitoring station were also obtained, which provide essential references for model calibration and validation. The data sources are summarized in Table 2.

3. Materials and Methods

3.1. Framework

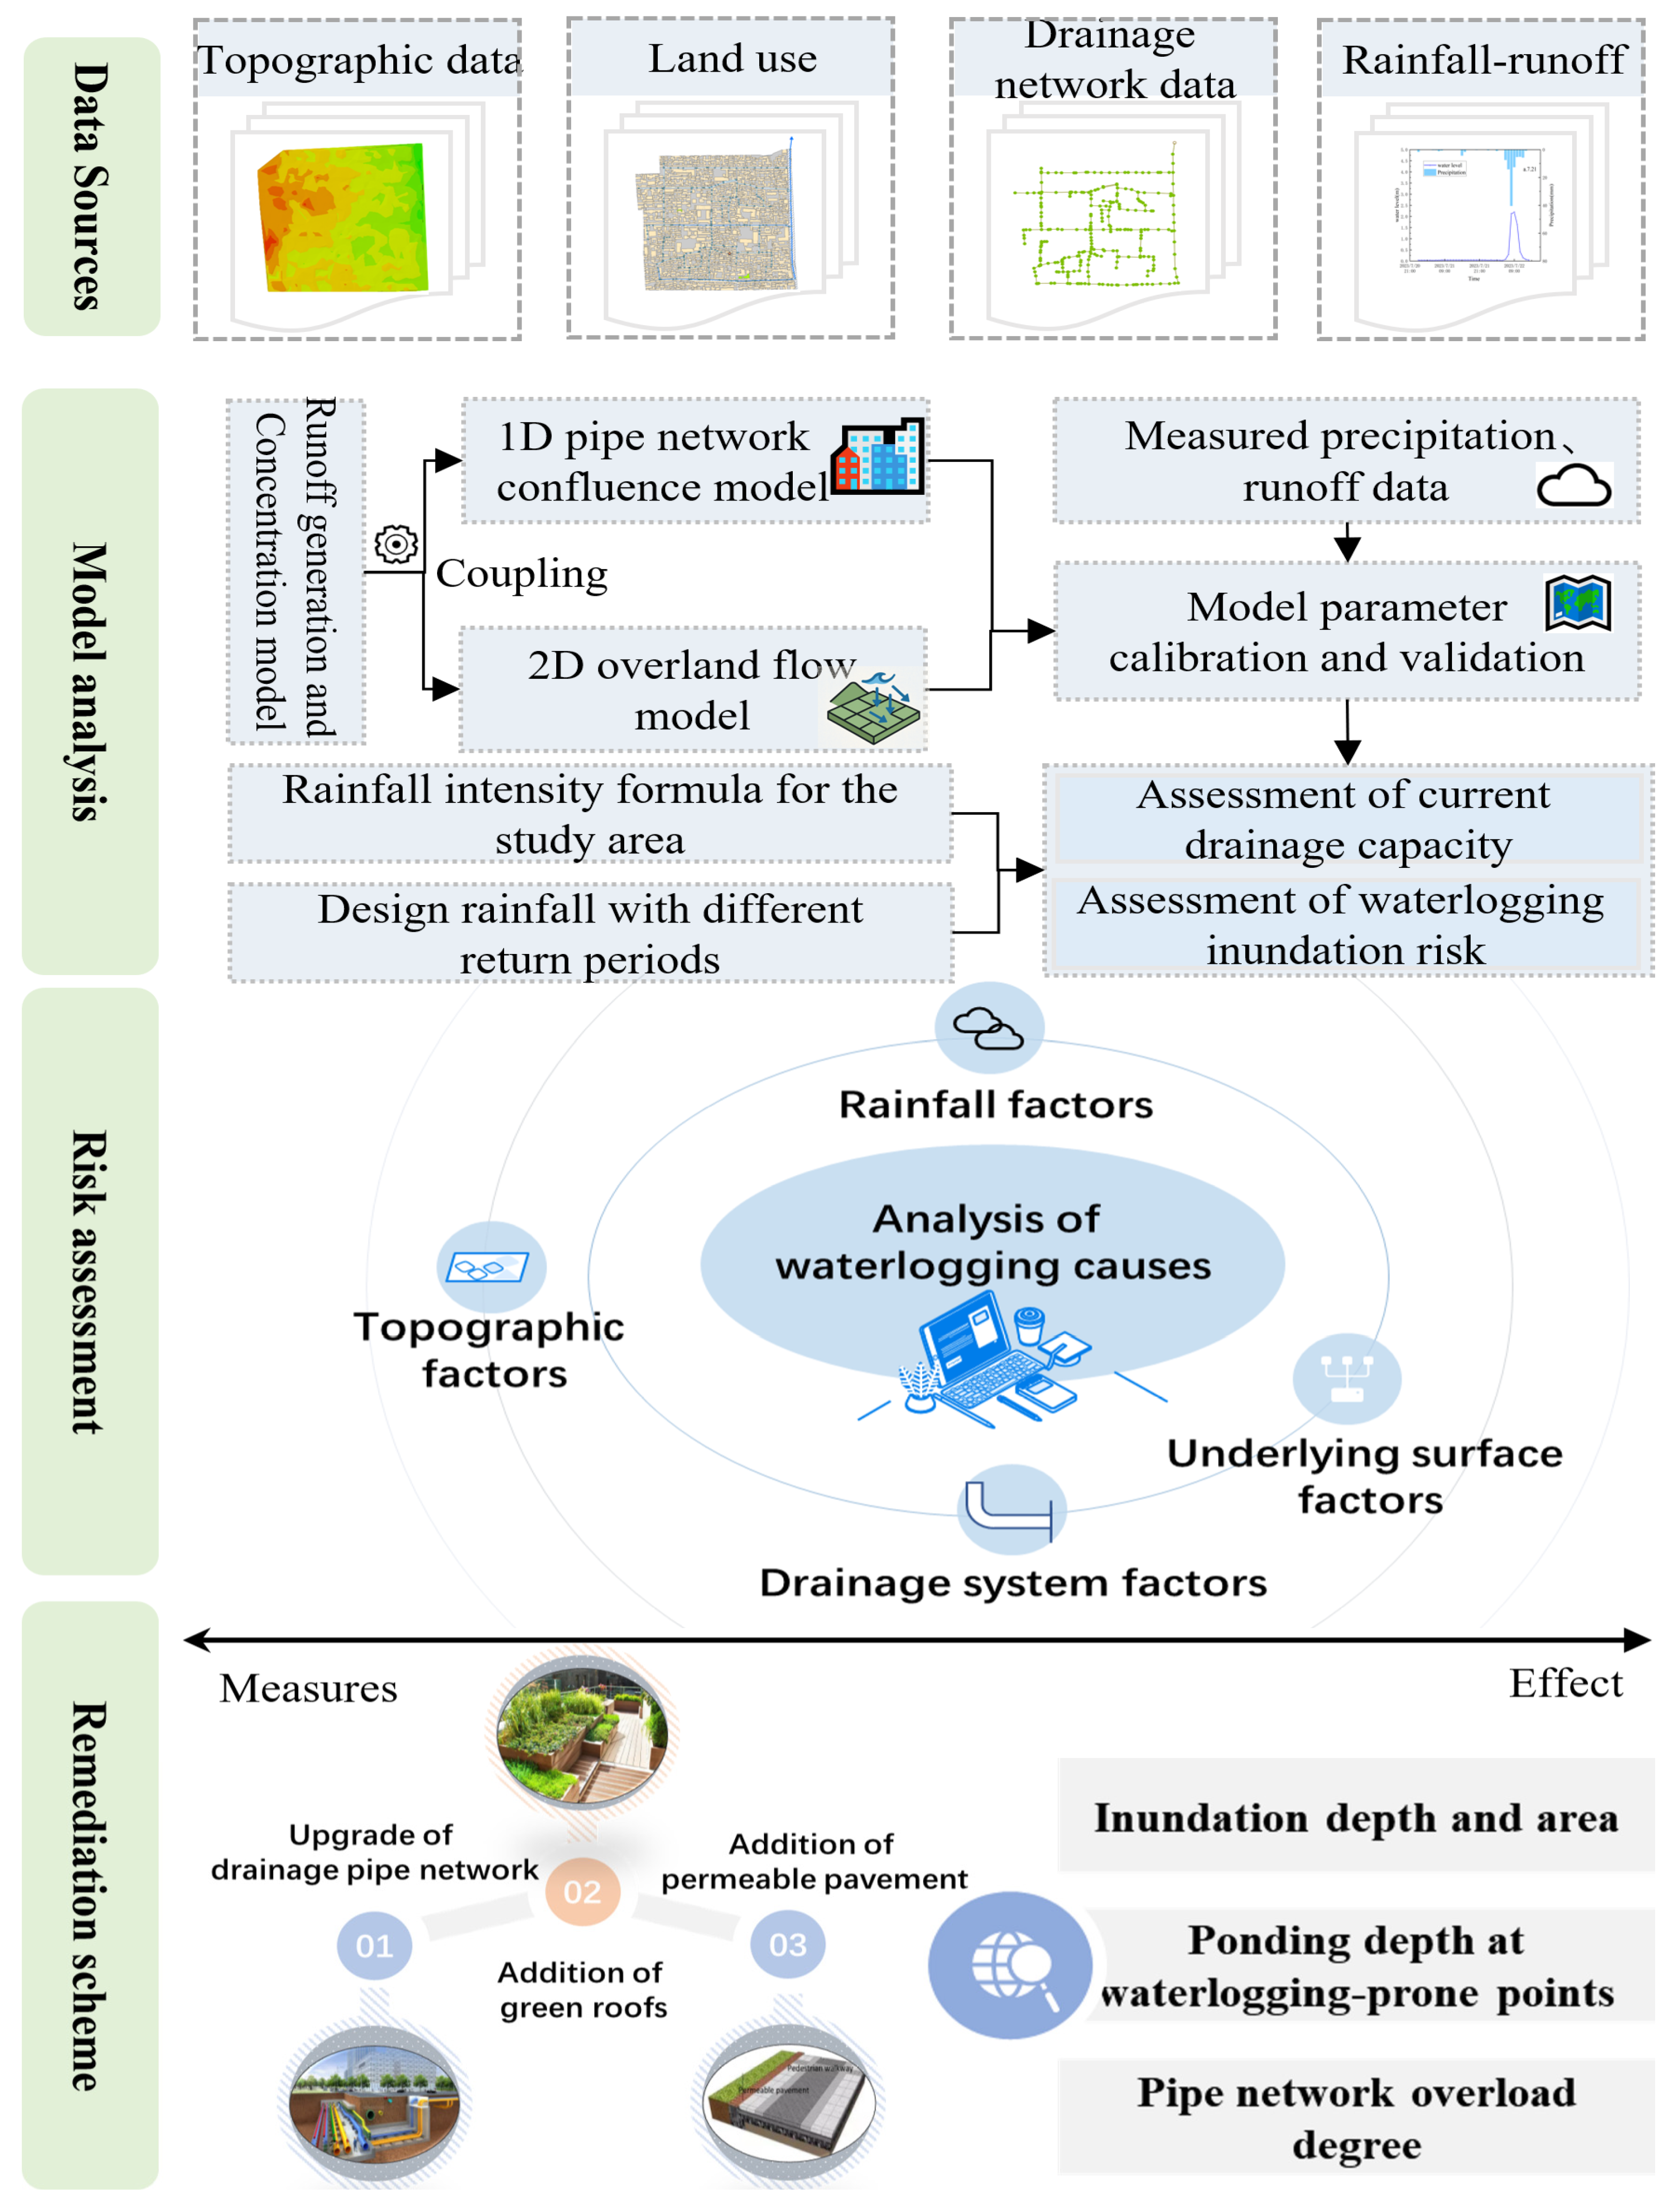
The research framework of this study is shown in Figure 3. Based on stormwater drainage network data, elevation data, and land use information, a rainfall-runoff model and a coupled 1D pipe–2D surface hydrodynamic model were developed [31]. Among the three observed rainfall events, the first two were used for model calibration, while the third event, along with observed inundation depth at a typical waterlogging point, was used for validation. According to the regional storm intensity formula, design hyetographs corresponding to return periods of 1, 2, 5, 10, and 50 years were derived. Each design storm was assumed to last 24 h with a peak coefficient of 0.4. Using the calibrated 1D–2D coupled model, the current drainage capacity of the pipe network was assessed, and inundation processes under various design rainfall scenarios were simulated. Maximum inundation depth maps were generated for each scenario, and the spatial and temporal variations in flood depth were statistically analyzed and compared. To better understand the causes of waterlogging, quantitative analyses were conducted from the perspectives of regional runoff generation and concentration processes, as well as the hydraulic performance of the drainage system. Based on the design rainfall events of different return periods, three categories of engineering measures were considered installation of green roofs, addition of permeable pavements and drainage pipe upgrades. Using a multi-criteria comparison that aims to minimize both inundation area and project cost, optimal combinations of mitigation measures were selected. The performance of each configuration was compared before and after implementation to assess their effectiveness in reducing urban flooding in the study area.

3.2. Establishment of the Urban Waterlogging Model

The InfoWorks ICM (Integrated Catchment Management) model (version 21.0.284, 64-bit, April 2022; Autodesk Innovyze, USA), also known as the integrated urban drainage model, combines a one-dimensional hydraulic model for urban drainage networks and river channels with a two-dimensional surface inundation model within a unified simulation engine [32]. Huaibin Wei et al. [33,34] applied the InfoWorks ICM platform to develop a 1D/2D coupled hydrodynamic model in Zhengzhou to simulate inundation processes under varying storm intensities and durations.
(1)
1D Pipe Network Model
Pipes and manholes are the two primary components of the stormwater drainage network used to construct the runoff concentration model. Based on the characteristics of the drainage infrastructure and the available modeling data, the pipe network and stormwater inlets were schematized. In total, 266 orifices (inlets) and 270 pipe links were defined in the model. Each inlet collects surface runoff from its associated sub-catchment and conveys it into the pipe network through the corresponding manhole.
During the preliminary survey and longitudinal re-leveling prior to the construction of the 1D drainage network model, we found that several pipe reaches in the old residential area exhibited negative gradients (adverse slopes) due to long-term differential ground settlement. According to the slope definition,
S = Δ z L  
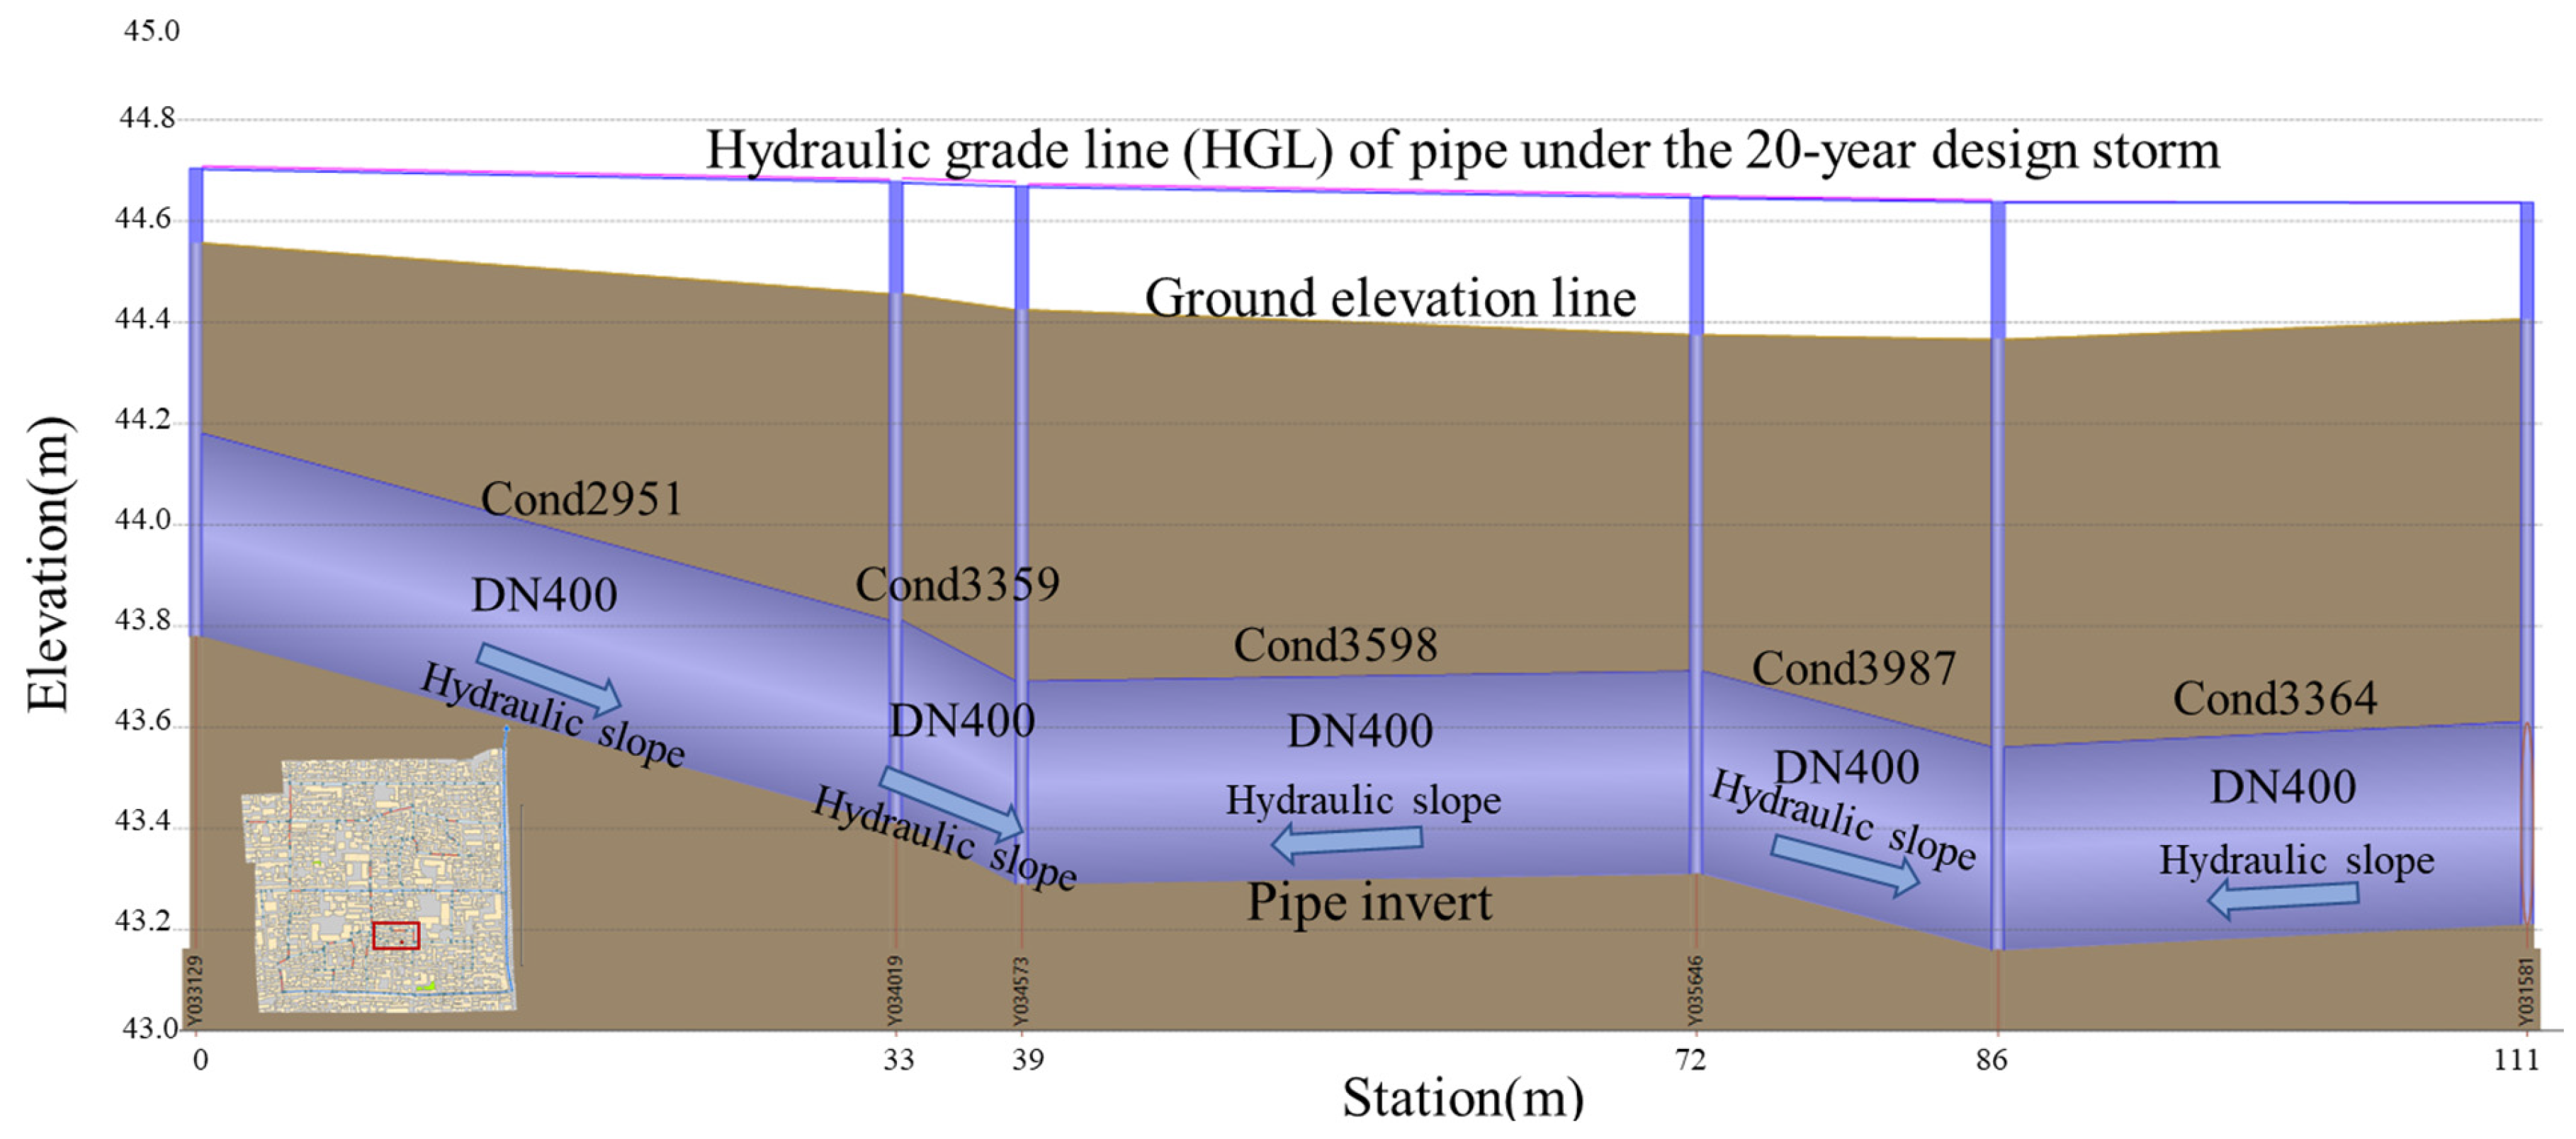
where Δ z is the invert elevation difference between upstream and downstream manholes, and L is the pipe length. Pipe segments with S ≤ 0 were classified as adverse slopes. The figure below illustrates the spatial distribution of adverse-slope pipe segments in the study area. Statistical analysis shows that the total length of adverse-slope pipes is approximately 856.6 m, accounting for 16.2% of the entire network. Such defects are likely caused by a combination of differential settlement, construction deviations, and manhole subsidence (Figure 4). Hydraulically, adverse slopes reduce the effective hydraulic gradient, lower the conveyance capacity, and generate local ponding. Under design storm conditions, these defects hinder stormwater discharge, thereby aggravating surface waterlogging and significantly prolonging the drainage recession time.
(2)
1D Catchment Division
In this study, an automated delineation method was applied to generate sub-catchments based on Thiessen polygon construction from manhole nodes. A total of 266 sub-catchments were defined, corresponding to the 266 drainage nodes. The delineation results are shown in Figure 5. Meanwhile, to address the issue of land surface area distribution within each sub-catchment, the Area Take Off (ATO) method was employed. This tool automatically calculates the runoff-generating surface area for each sub-catchment based on digitized impervious area data.
(3)
Surface Runoff Generation and Routing Model
The runoff model is used to determine the amount of rainfall that becomes surface runoff after initial losses are satisfied. Variations in land surface characteristics significantly affect the amount of runoff generated within each plot. In stormwater modeling, accurate estimation of runoff volume is critical. In InfoWorks ICM, a distributed approach is employed to calculate runoff within each catchment. The study area is first divided into sub-catchments of varying shapes and sizes. Each sub-catchment is then further categorized into different runoff-generating surface types, including green space, road surfaces, pervious areas, and impervious areas.
(4)
2D Surface Overland Flow Model
The 2D overland flow model calculates key parameters such as water depth, flow velocity, and inundation duration within each triangular mesh cell, providing a basis for urban flood risk assessment. This module accurately simulates the routing of surface runoff after stormwater overflows from manholes, enabling the prediction of flood velocity, flow direction, depth, and duration on the ground surface. Surface water movement is largely governed by terrain characteristics, making ground elevation data the most critical input for establishing the 2D overland flow model. Based on the provided elevation point dataset, a Triangulated Irregular Network (TIN) was constructed for the study area. The terrain data were derived from a DEM with a spatial resolution of 30 m (Figure 6), obtained from SRTM3. In addition, we clarified the pre-processing procedures applied to the DEM (e.g., hydrological correction and interpolation with local survey points) to ensure consistency with the drainage network and boundary conditions.
To balance computational accuracy and efficiency, this study adopted an adaptive mesh division based on terrain complexity. Smaller meshes were applied in areas with complex topography, whereas larger meshes were used in relatively flat regions. The mesh size was set as follows: approximately 5–25 m for general two-dimensional areas, 2–10 m for road areas, and 10–20 m for building areas. The adaptive subdivision criterion was based on terrain slope and the density of surface features, which automatically generated denser meshes in regions with greater topographic variation. In total, 125,764 triangular mesh elements were generated. Buildings within the computational domain were treated as impermeable blank areas, with no internal runoff processes considered; walls and building boundaries were treated as solid boundaries with no-flow conditions, forcing surface runoff to bypass them.
(5)
Coupling of the 1D Pipe Network and 2D Surface Overland Flow Model
The coupling between the 1D pipe network and the 2D surface overland flow model was achieved using an orifice-type connection. In this configuration, the orifice is defined from the bottom of a 1D manhole (as the starting point) to the corresponding 2D manhole (as the end point), with the inlet offset determined by the elevation difference between the lower edges of the 1D and 2D manholes.
(1)
When surface runoff is generated, it enters the drainage network through stormwater inlets, enabling hydrological interaction between surface runoff and the pipe system. In the InfoWorks ICM model, this coupling is realized by assigning each sub-catchment to a corresponding manhole. Each sub-catchment can only be connected to a single inlet, while each inlet may receive runoff from multiple sub-catchments.
(2)
When the volume of water in the drainage network exceeds its hydraulic capacity, stormwater overflows through inlets to the ground surface. The excess water then flows across the surface terrain, accumulates in depressions, or eventually re-enters the drainage network. Stormwater inlets thus serve as the hydraulic link between the drainage system and the ground surface, enabling the coupling of the 1D pipe flow and 2D overland flow components. In InfoWorks ICM, this is implemented by setting the flood type of inlets located within the 2D domain to “2D”, thereby activating the exchange between the surface runoff module and the sewer system. In the model configuration, the energy slope versus bed slope was kept as the InfoWorks ICM default setting without modification. The inlet surcharge constraints were also retained as default, allowing the software to automatically govern the head–flow exchange. For the 1D/2D coupling, the default orifice-type exchange was applied, and no additional weir or limiting parameters were introduced. Since these settings were left at standard values, the simulation results are primarily governed by rainfall inputs and the hydraulic geometry of the network, rather than by manual tuning of exchange parameters.

3.3. Calibration and Validation of the Urban Waterlogging Model

To improve the simulation accuracy of the hydrodynamic model and ensure the reliability of the results, model calibration and validation were conducted in accordance with the Technical Code for the Construction and Application of Mathematical Models for Urban Waterlogging Control Systems (TCECS 647-2019) [35].
A manual trial-and-error approach was used for parameter calibration to ensure both accuracy and applicability of the model. Two observed rainfall events—July 21, 00:00 to July 22, 14:00, and July 31, 00:00 to August 1, 13:29 (hereinafter referred to as “7.21” and “7.31”)—were selected for calibration. The event from July 29, 11:00 to July 30, 23:59 (hereinafter “7.29”) was used for model validation.
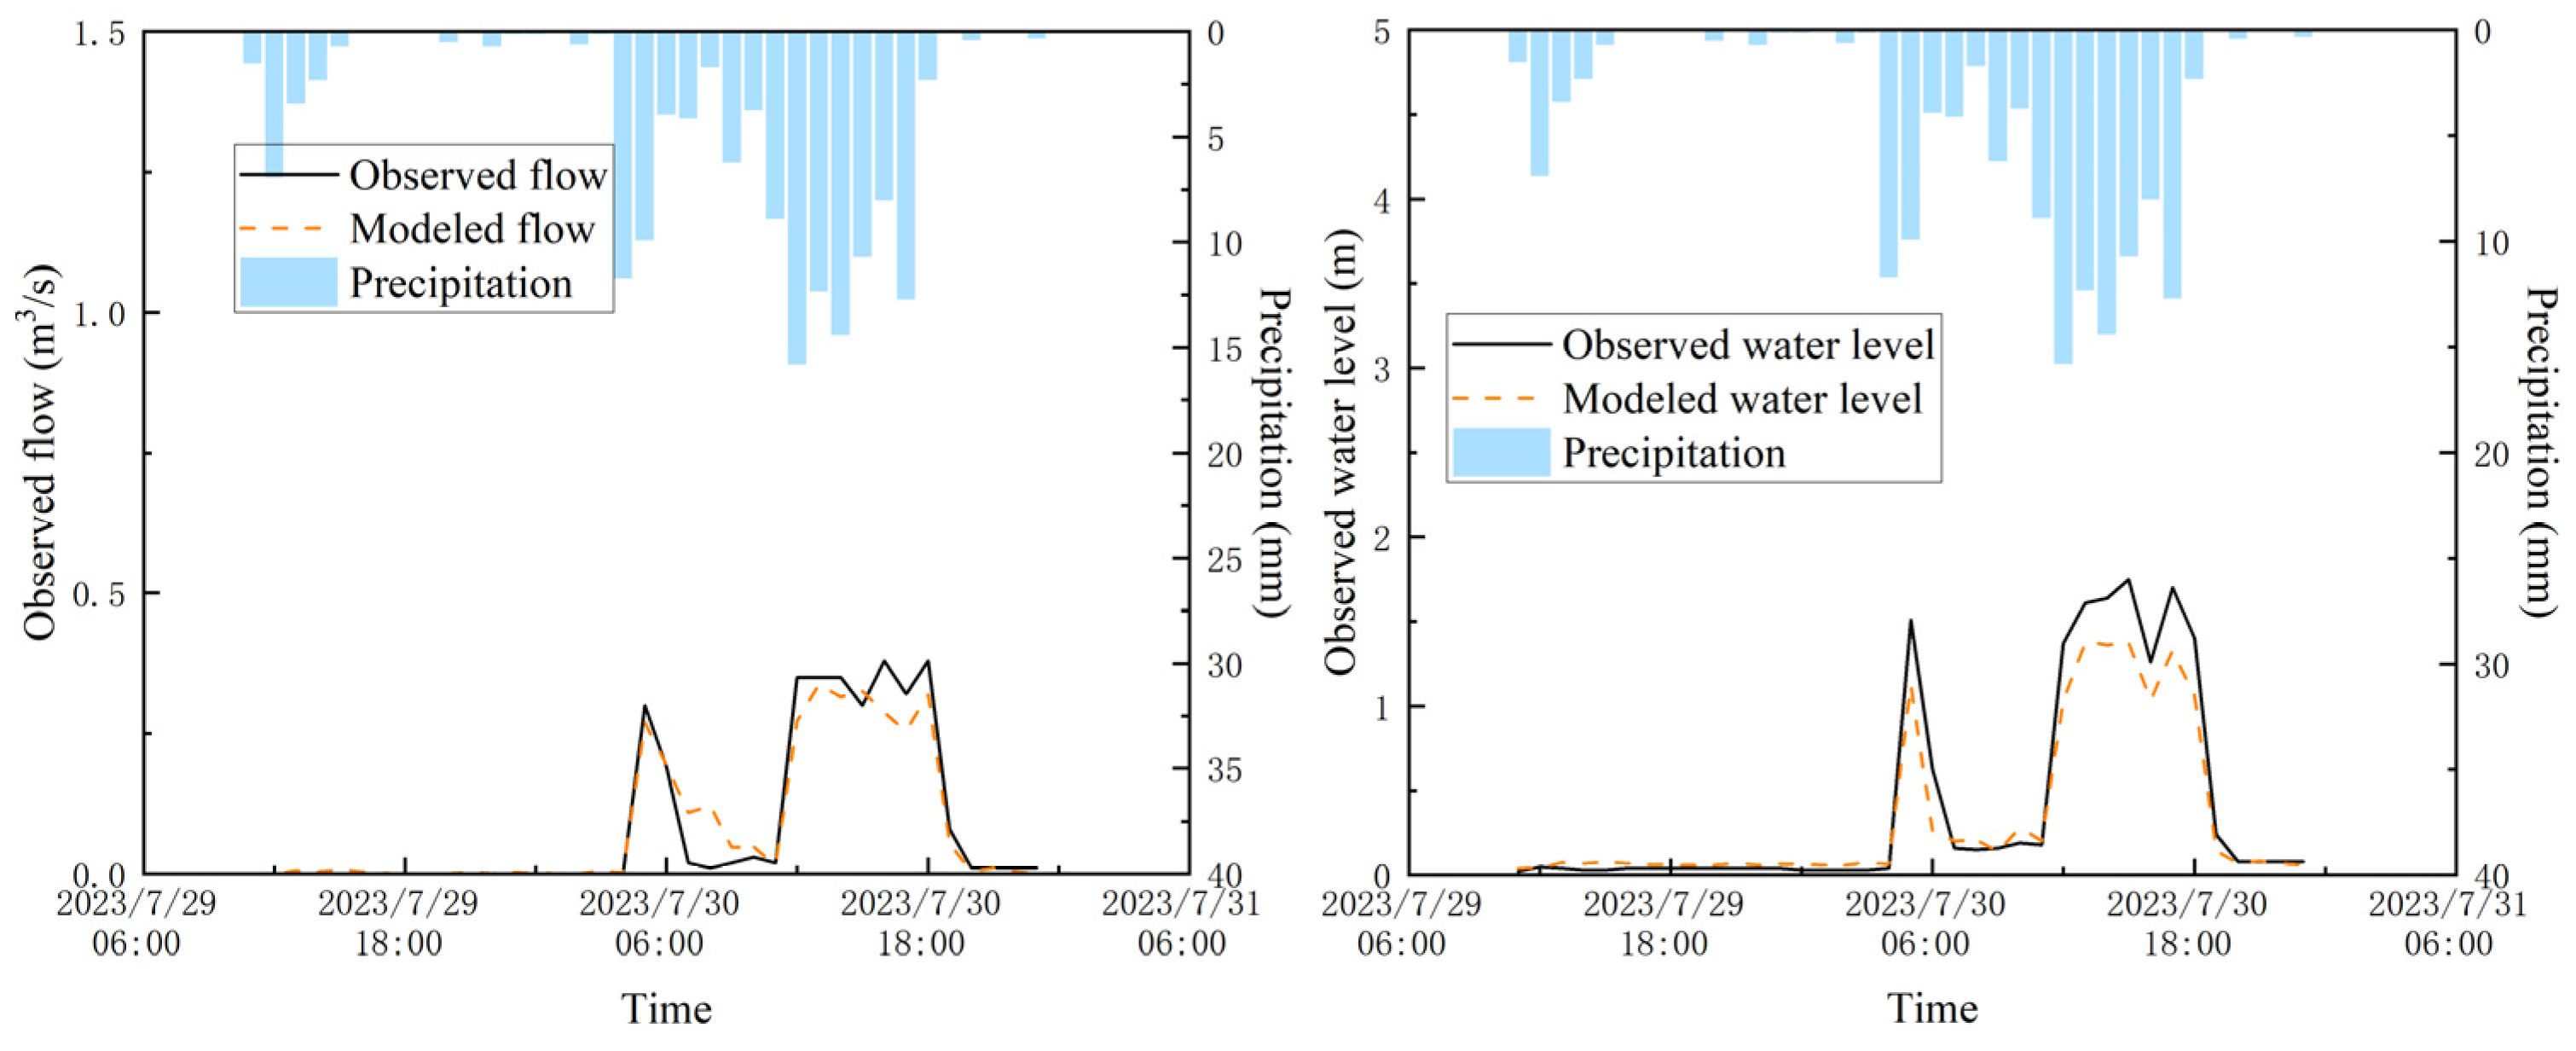
Simulated results were compared against measured data from two monitoring stations located in the midstream region of the study area: a water level monitoring station at manhole node Y035677, and a flow monitoring station at pipe segment Cond3026. The results are shown in Figure 7, Figure 8 and Figure 9. The model’s performance was evaluated using the Nash–Sutcliffe efficiency coefficient (Ens) and the relative error (δ), both of which were used to quantify the agreement between simulated and observed hydrological processes.
High simulation accuracy was achieved across all rainfall events, as shown in the Table 3. In particular, during the validation event on July 29 (7.29), the Nash–Sutcliffe efficiency coefficients (Ens) for the simulated flood processes were all greater than 0.85. This indicates that the calibrated model parameters are effective and that the model possesses strong reliability and practical applicability for simulating urban flood scenarios.
Based on the observed data at the waterlogging point, the simulated water level time series under the 7.29 rainfall event was extracted, as shown in Figure 10. The maximum water depth simulated by the model at this location was 0.32 m, while the observed maximum depth was 0.30 m, resulting in a relative error of 6.7%. Overall, the parameter settings yielded satisfactory results, indicating that the model is suitable for urban waterlogging simulation studies.
The calibration and validation events selected in this study were all high-intensity storms with different temporal distributions, which provides a reasonable basis for testing the reliability of the model. However, under the background of climate change, rainfall characteristics are becoming increasingly variable and extreme. Future research will therefore incorporate a broader set of rainfall events with diverse types and conditions to further enhance the robustness and generalizability of the model results.
It should be noted that this study did not perform a full sensitivity and uncertainty analysis for parameters such as pipe roughness, inlet capacities, and green infrastructure retention depths. This limitation is mainly due to the compact setting of the old district, where high-resolution distributed monitoring data are scarce, making systematic parameter perturbation experiments difficult to validate. Instead, the study emphasized model calibration and validation against multiple observed storm events to ensure the reliability of the simulation results. Future research will incorporate sensitivity screening and uncertainty quantification (e.g., one-at-a-time analysis or Monte Carlo sampling) once more detailed monitoring datasets become available, in order to further enhance the robustness of mitigation strategy evaluation.

3.4. Derivation of Design Rainfall Hyetographs

In this study, design rainfall hyetographs corresponding to return periods of 1, 2, 5, 10, 20, and 50 years were derived based on the local storm intensity formula [36]. A time interval of 5 min was used, with a total rainfall duration of 24 h and a peak coefficient of 0.4. The storm intensity formula is presented in Equation (2), and the resulting design rainfall hyetographs are shown in Figure 11.
q = 1602 ( 1 + 1.037 lg P ) ( t + 11.593 ) 0.681
In the equation: q is the rainfall intensity (L/s·hm2); t is the rainfall duration (min); P is the return period (a).
It should be noted that for small and highly responsive catchments, a critical duration of 1–3 h may be more relevant. Due to data constraints and the scope of this work, multi-duration sensitivity tests were not carried out at this stage. Future research will incorporate multiple storm durations to further enhance the robustness of the conclusions.

4. Results and Discussion

4.1. Evaluation of Drainage Capacity of the Pipe Network

(1)
Evaluation Based on Pipe Flow Capacity
In the assessment of drainage system performance, hydraulic diagnosis is carried out by identifying overload conditions within the pipe network. The term overload condition refers to the operational status of the drainage pipes, which can generally be classified into the following three categories (Table 4):
As shown in Table 5, the drainage performance of the current pipe network declines with increasing design return periods. Under the 1-year return period, approximately 43% of the total pipeline length (2268.1 m) operates under fully filled conditions, and 56.6% (2999.4 m) is already overloaded. When the return period increases to 2 years, all under-capacity segments disappear, and the proportion of overloaded pipes rises to 58.6%. This trend continues as the return period increases: by the 50-year return period, 65.7% of the network (3483.2 m) is overloaded, while only 34.3% (1815.1 m) operates at full capacity.
These results indicate that the existing stormwater drainage system lacks sufficient resilience to handle medium to high return period rainfall events, with a large proportion of the network entering pressure flow or surcharge states even under relatively frequent (2–5 year) storms. Upgrading critical pipe sections is necessary to meet long-term urban flood mitigation demands.
(2)
Evaluation Based on Node Overflow Method
In some cases, it is necessary to adjust the criteria for determining whether the drainage capacity of a pipe has been exceeded. This is because stormwater pipes are typically buried at considerable depths, and the water level can rise above the pipe crown without immediately causing surface flooding, due to the remaining available headspace between the pipe crown and ground level.
A filling degree threshold of 1 may therefore be too conservative. If pressure flow within the pipe is permitted, the occurrence of overflow at manholes can be used as an alternative indicator. In this approach, a pipe is considered hydraulically overloaded if the hydraulic grade line (HGL) exceeds the ground elevation at a manhole. The corresponding overload criterion can be expressed as follows:
δ = H W
In the equation: H represents the hydraulic head at the manhole node (m), and W is the ground elevation at that location. If the result δ ≤ 0, it indicates that the pipe’s drainage capacity meets the requirements of the corresponding design return period. Conversely, if δ > 0, the pipe is considered hydraulically insufficient under that return period.
The assessment results are shown in Figure 12. Approximately 46.9% of the drainage pipes in the study area meet or exceed the capacity required for a 1-year return period, representing the current compliance rate of the system. Among these, 25.9% of the pipes meet or exceed the 2-year standard, 16.6% meet or exceed the 5-year standard, and only 12.8% exceed the 5-year threshold (Table 6). These findings indicate that the drainage capacity of the existing network gradually decreases with increasing return periods, highlighting the system’s limited ability to cope with more extreme rainfall events.

4.2. Urban Waterlogging Inundation Risk Assessment

Using the calibrated 1D pipe–2D surface coupled hydrodynamic model, inundation processes under design rainfall events with return periods of 1, 2, 5, 10, 20, and 50 years were simulated. Inundation depth maps were generated for each scenario, and the variations in maximum water depth were statistically analyzed and compared.
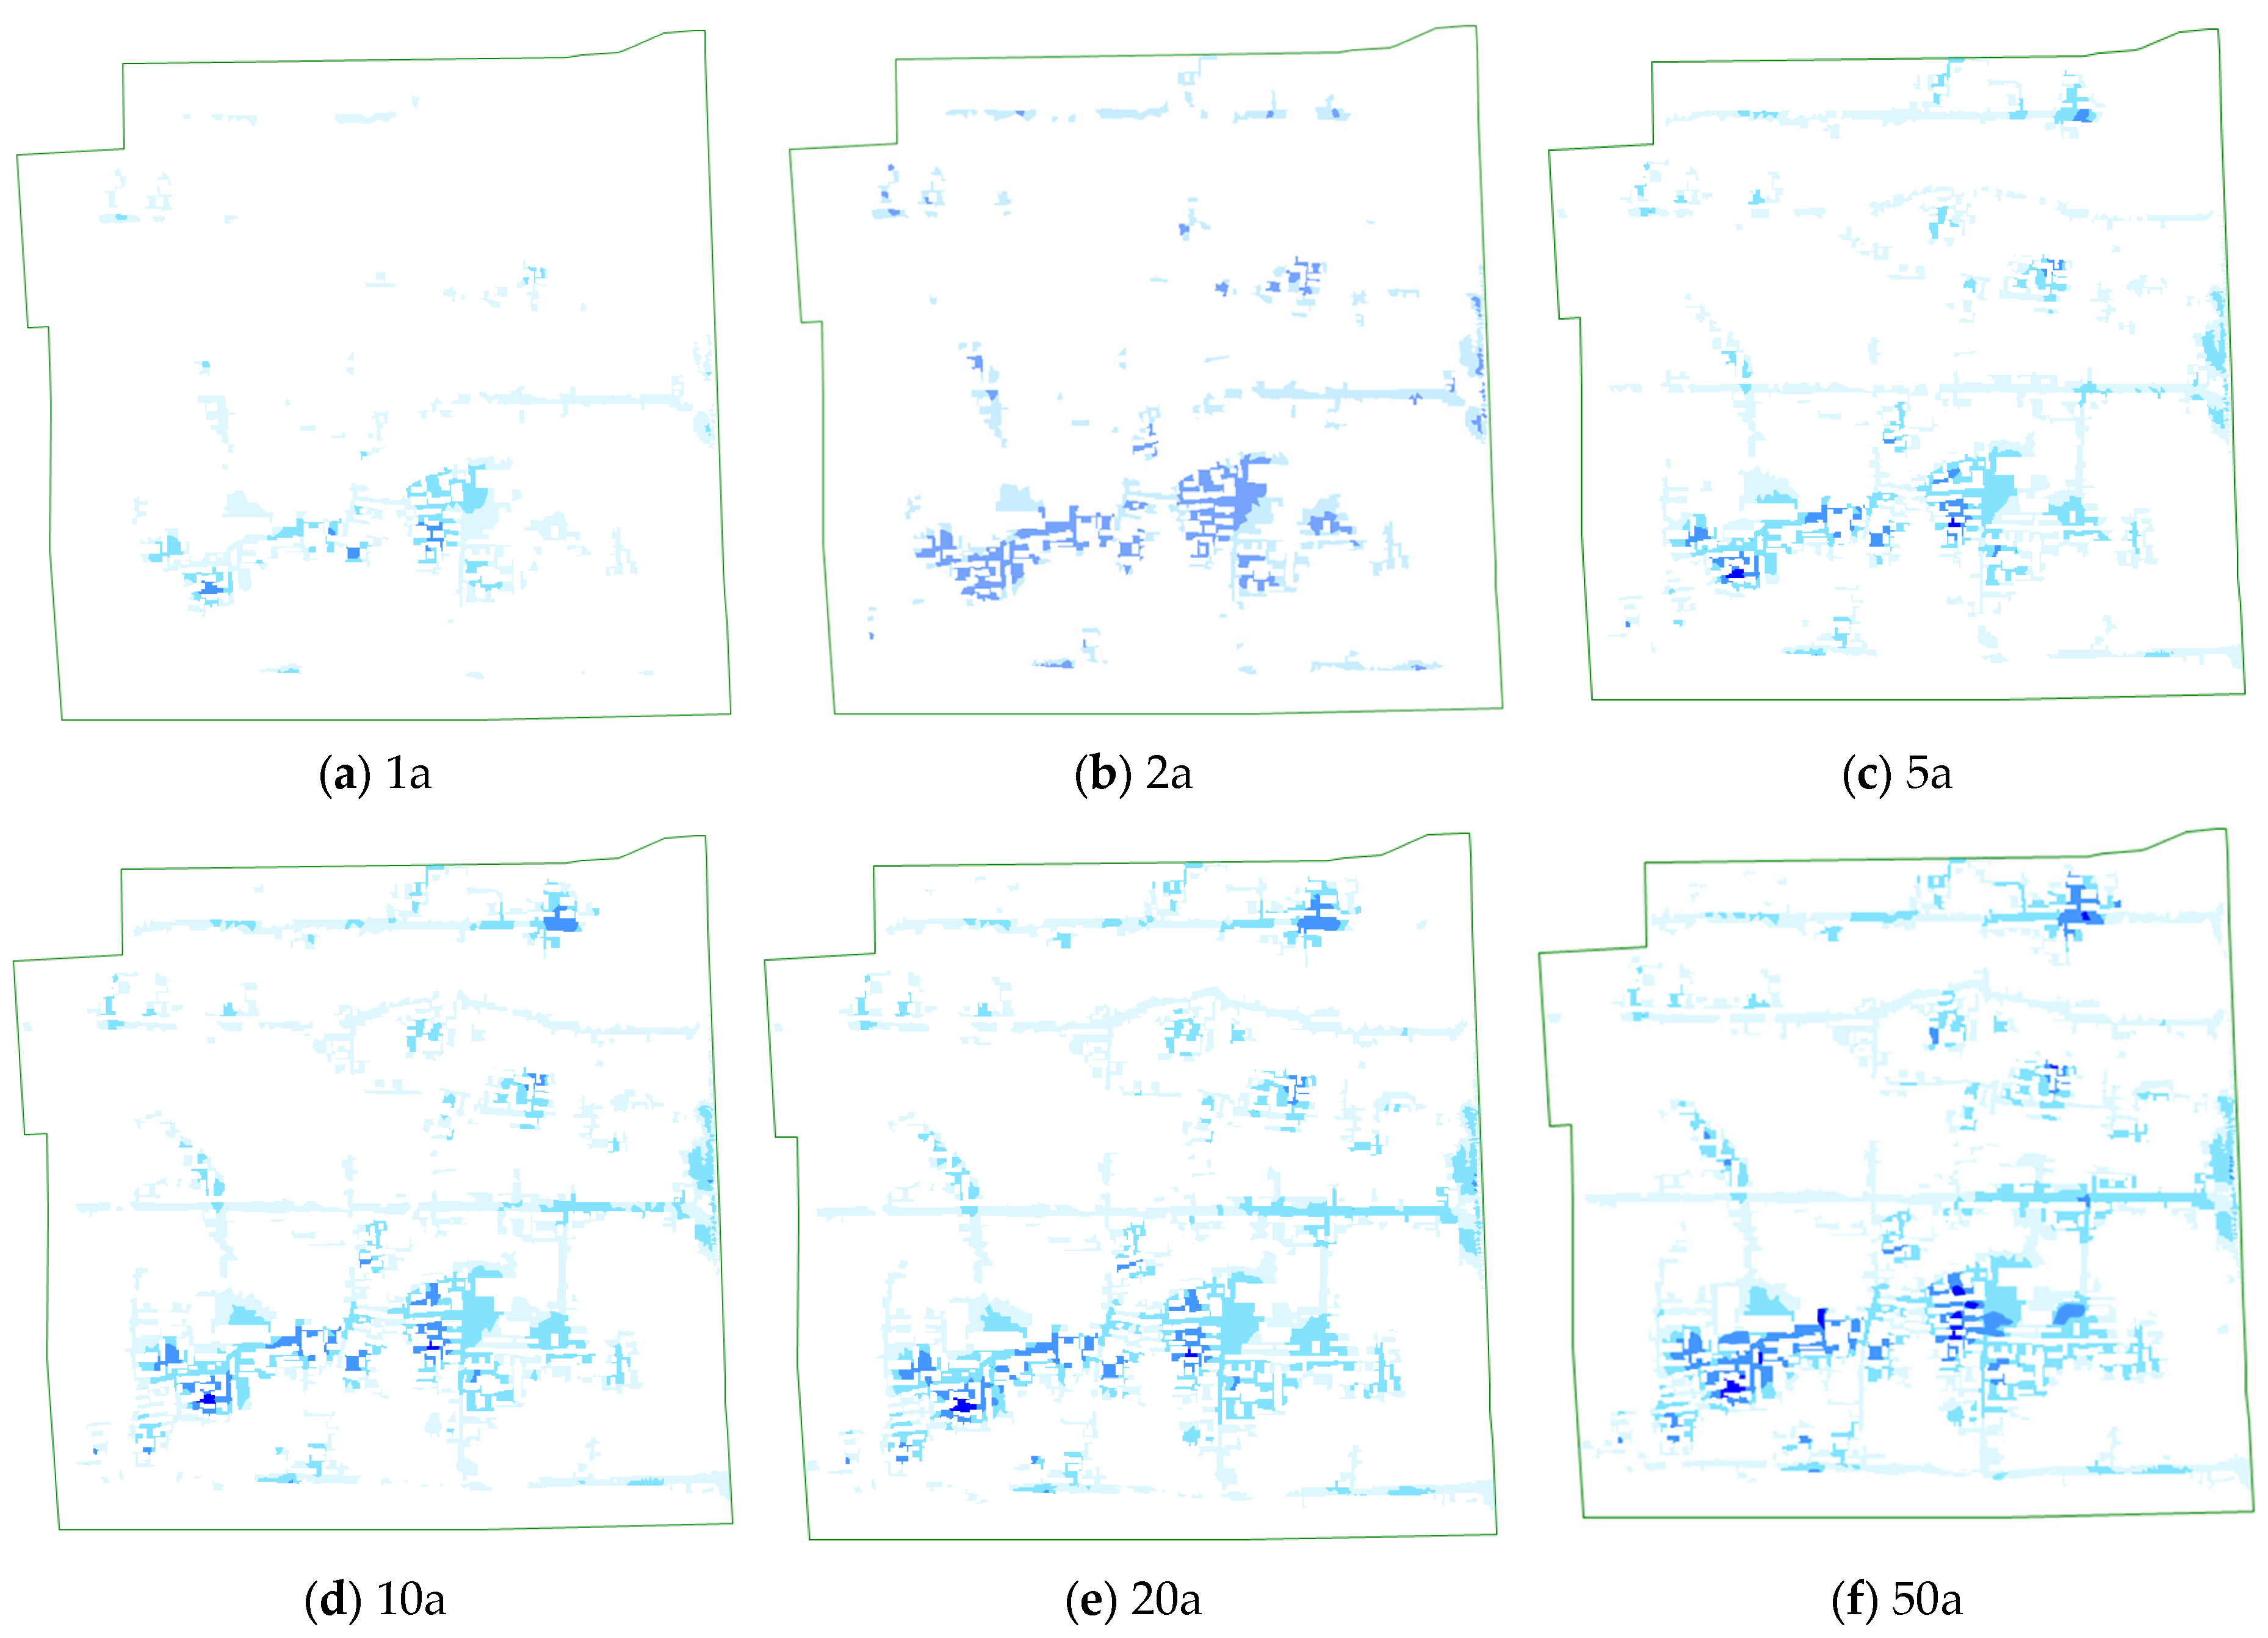
The classification of inundation risk levels is presented in Table 7. Detailed inundation simulation results under different return periods are shown in Figure 13 and Table 8 and Table 9.
As shown in Figure 13, both inundation depth and inundation area increase with the rise in rainfall return period. Combined with the data in Table 9 and Table 10, it is evident that under different rainfall scenarios, the study area exhibits a progressively intensifying trend in inundation severity as rainfall intensity increases. When the return periods are 1 year and 2 years, the maximum water depths are 0.45 m and 0.49 m, respectively, with corresponding inundation areas of 0.0042 km2 and 0.0100 km2. In both cases, inundation is mainly confined to low-risk zones (0.0037 km2 and 0.0090 km2, respectively), with only a small proportion of medium-risk areas and no high-risk areas. Once the return period exceeds 2 years, high-risk inundation zones begin to emerge. Under the 5-year return period scenario, the maximum water depth increases to 0.53 m, and the total inundation area reaches 0.0197 km2, including a high-risk zone of 0.0001 km2. As the return period further increases, the extent of high-risk areas grows steadily. By the 50-year event, the maximum inundation depth reaches 0.79 m, and the total inundated area expands to 0.0435 km2, with high-risk zones accounting for 0.0041 km2—nearly 10% of the total (Figure 14).
In summary, the overall flood risk in the study area is manageable under low- to moderate-intensity rainfall events, with a critical threshold observed between the 2-year and 5-year return periods. As rainfall intensity continues to increase, more attention should be given to emergency response and drainage improvement in high-risk areas.

4.3. Analysis of Waterlogging Causes

To quantitatively analyze the causes of waterlogging at specific locations, key factors such as regional drainage capacity, topographic characteristics, and underlying surface conditions were considered.
(1)
Drainage System Factors
For the waterlogging point under investigation, the upstream drainage pipes connected to the associated catch basin were examined. Relevant design specifications and pipe dimensions were collected, along with data on their designed flow capacities. The cross-sectional flow capacity of the drainage pipes can be calculated using the Manning formula or the Chezy formula.
Q P i p e   d e s i g n = K J
K = 0.3117 d 8 3 n
In the equation: Q P i p e   d e s i g n   is the flow capacity of the pipe section, in m3/s; K is the flow modulus, in m3/s; J is the hydraulic gradient; d is the pipe diameter, in m; n is the roughness coefficient, taking the value of 0.015.
It is evident that the designed flow capacity of the downstream pipes near the waterlogging point is insufficient. For example, the design discharge capacities of pipe segments Cond2551 and Cond3987 are only 0.1890 m3/s and 0.1842 m3/s (Table 10). This limited capacity prevents stormwater from being discharged in a timely manner into the main trunk system, resulting in a hydraulic backwater (surcharge) effect.
In addition, an analysis of the pipe slope distribution in the vicinity of the waterlogging point reveals two pipe segments with adverse slopes in the downstream section (see Figure 15), which further hinder drainage and cause significant upstream water level rise and surface ponding.
According to the drainage capacity distribution map based on node overflow (Figure 12), all nearby pipe segments around the waterlogging point are below the 1-year return period standard. The combined effects of backwater from downstream, adverse slopes, and insufficient pipe capacity exacerbate local water accumulation at the waterlogging point.
(2)
Topographic Factors
The topographic map of the study area is shown in Figure 16. The waterlogging point is located at a local depression within the area, with an elevation of 44.041 m. The surrounding terrain is relatively higher, with elevations exceeding 44.3 m, resulting in a local elevation difference of approximately 0.25 m forming a basin-like low-lying area.
In terms of drainage infrastructure, the top elevations of manholes surrounding the waterlogging point range from 44.34 m to 44.79 m, all situated on relatively higher ground around the point. During heavy rainfall events, stormwater at the waterlogging point is unable to flow into the higher-elevation manholes, limiting effective collection and discharge. As the contributing catchment area and local elevation gradient increase, water accumulates more rapidly and extensively in the lower-lying zone.
(3)
Underlying Surface Factors
The area around the waterlogging point is primarily composed of buildings (accounting for 50%) and impervious pavement (accounting for 47%). The runoff coefficient for these land use types ranges from 0.85 to 0.95. Due to the large proportion of impervious surfaces, short rainfall duration, and limited evaporation losses, the area exhibits high runoff coefficients, rapid runoff generation, and fast concentration processes. As a result, peak flow rates are high, making it easier for water to accumulate in local depressions and cause waterlogging.
(4)
Rainfall Factors
Short-duration intense rainfall is a key driver of urban waterlogging. The drainage infrastructure in the vicinity of the waterlogging point is designed for no more than a 1-year return period, which corresponds to a design rainfall intensity of approximately 15 mm/h. When actual rainfall intensity exceeds this threshold, waterlogging is likely to occur. According to inundation simulation results, under the 50-year return period scenario, the inundation area and maximum depth increased by 925.5% and 175.6%, respectively, compared to the 1-year scenario. Therefore, excessive rainfall is another critical factor contributing to severe urban waterlogging.
Based on the surcharge ratios of the drainage network across different return periods, the node-overflow capacity grading, and the hydraulic diagnosis at inundation hotspots, it is evident that once the design storm exceeds the 2-year level, more than 50% of the pipe network becomes surcharged (Table 5), with local adverse slopes further aggravating backwater effects. Therefore, insufficient drainage capacity is identified as the primary driver of waterlogging in the study area. In addition, the inundation hotspot is located within a local depression about 0.25 m lower than the surrounding terrain (Figure 16), and nearby manhole inverts are generally higher than the ponding point, making it difficult for stormwater to enter the pipe system; thus, topographic depressions serve as a secondary but critical limiting factor. Meanwhile, the land surface is dominated by buildings and paved areas, with an imperviousness ratio of 97% (Table 1). Under short-duration, high-intensity rainfall events, this configuration produces high runoff coefficients and rapid concentration, thereby amplifying peak inflows and delaying water recession. Simulation results indicate that medium-risk zones emerge between the 2- and 5-year storms, while high-risk zones appear in the 10–20-year events and then expand progressively under more extreme return periods. Given that the current model does not allow independent perturbation of the four drivers, this study provides an evidence-based prioritization rather than quantitative shares, and states that future work will employ sensitivity analysis and multi-scenario simulations to achieve quantitative attribution.

4.4. Optimization of Urban Waterlogging Mitigation Measures

In response to the deficiencies of the aging drainage network, such as low design standards and reverse slopes, a zoned pipeline renovation strategy was proposed. To systematically test its effectiveness, six scenarios were designed with varying levels of pipeline optimization. Considering the limited land resources and dense built environment in the study area, traditional flood control measures such as retention tanks, infiltration ditches, or detention zones were deemed infeasible. Therefore, we focused on more practical grey–green retrofit solutions. Specifically, three scenarios combined pipeline optimization with different coverage levels of green roofs, while another three scenarios combined pipeline optimization with permeable pavements. In total, 12 scenarios were established to evaluate both single and combined measures at different implementation scales. The detailed configuration is summarized in Table 11.
In this section, the analysis of waterlogging causes considers multiple mitigation scenarios, including pipe optimization alone, pipe optimization combined with green roofs, and pipe optimization combined with permeable pavements. The cost parameters are derived from local data and the unit cost information of low impact development (LID) facilities provided in the Technical Guide for Sponge City Construction [37], encompassing both construction and operation–maintenance costs [38,39].
(1)
Pipe Network Optimization Strategy
Based on the assessment of drainage capacity in the study area, an optimization plan was developed to address the deficiencies in the existing pipe network. The principles guiding the pipe network retrofit strategy are summarized as follows:
  • The design is based on the current model evaluation results, aiming to fully utilize existing pipe sections that already meet the discharge standards, and to avoid unnecessary demolition or reconstruction.
  • The current pipe layout should be preserved as much as possible to minimize excavation and construction work.
  • If the above strategies fail to achieve the target performance, the addition of new pipelines may be considered.
Engineering Constraints:
  • Modifications are limited to upgrades of the existing system, such as increasing pipe diameters or extending pipe sections.
  • No “large-to-small” pipe connections are allowed; that is, the diameter of downstream pipes must not be smaller than that of upstream pipes.
  • The diameter difference between adjacent pipe segments must not exceed 500 mm.
  • Pipes must remain buried below ground level, and reverse slopes are not permitted.
The drainage network was divided into eight functional zones: Trunk Line 1, Trunk Line 2, Main Line 1, Main Line 2, Main Line 3, Q1, Q2, and Q3 (see Figure 17). Six retrofitting scenarios were developed for these zones. The pipe lengths and corresponding estimated construction costs for each scenario are presented in Table 12. The upgraded pipe lengths for the six scenarios are 2315.9 m, 2315.9 m, 2686.7 m, 2907.1 m, 2649.2 m, and 2204.0 m, with estimated costs of 653,000 yuan, 714,000 yuan, 847,000 yuan, 927,000 yuan, 950,000 yuan, and 683,000 yuan, respectively.
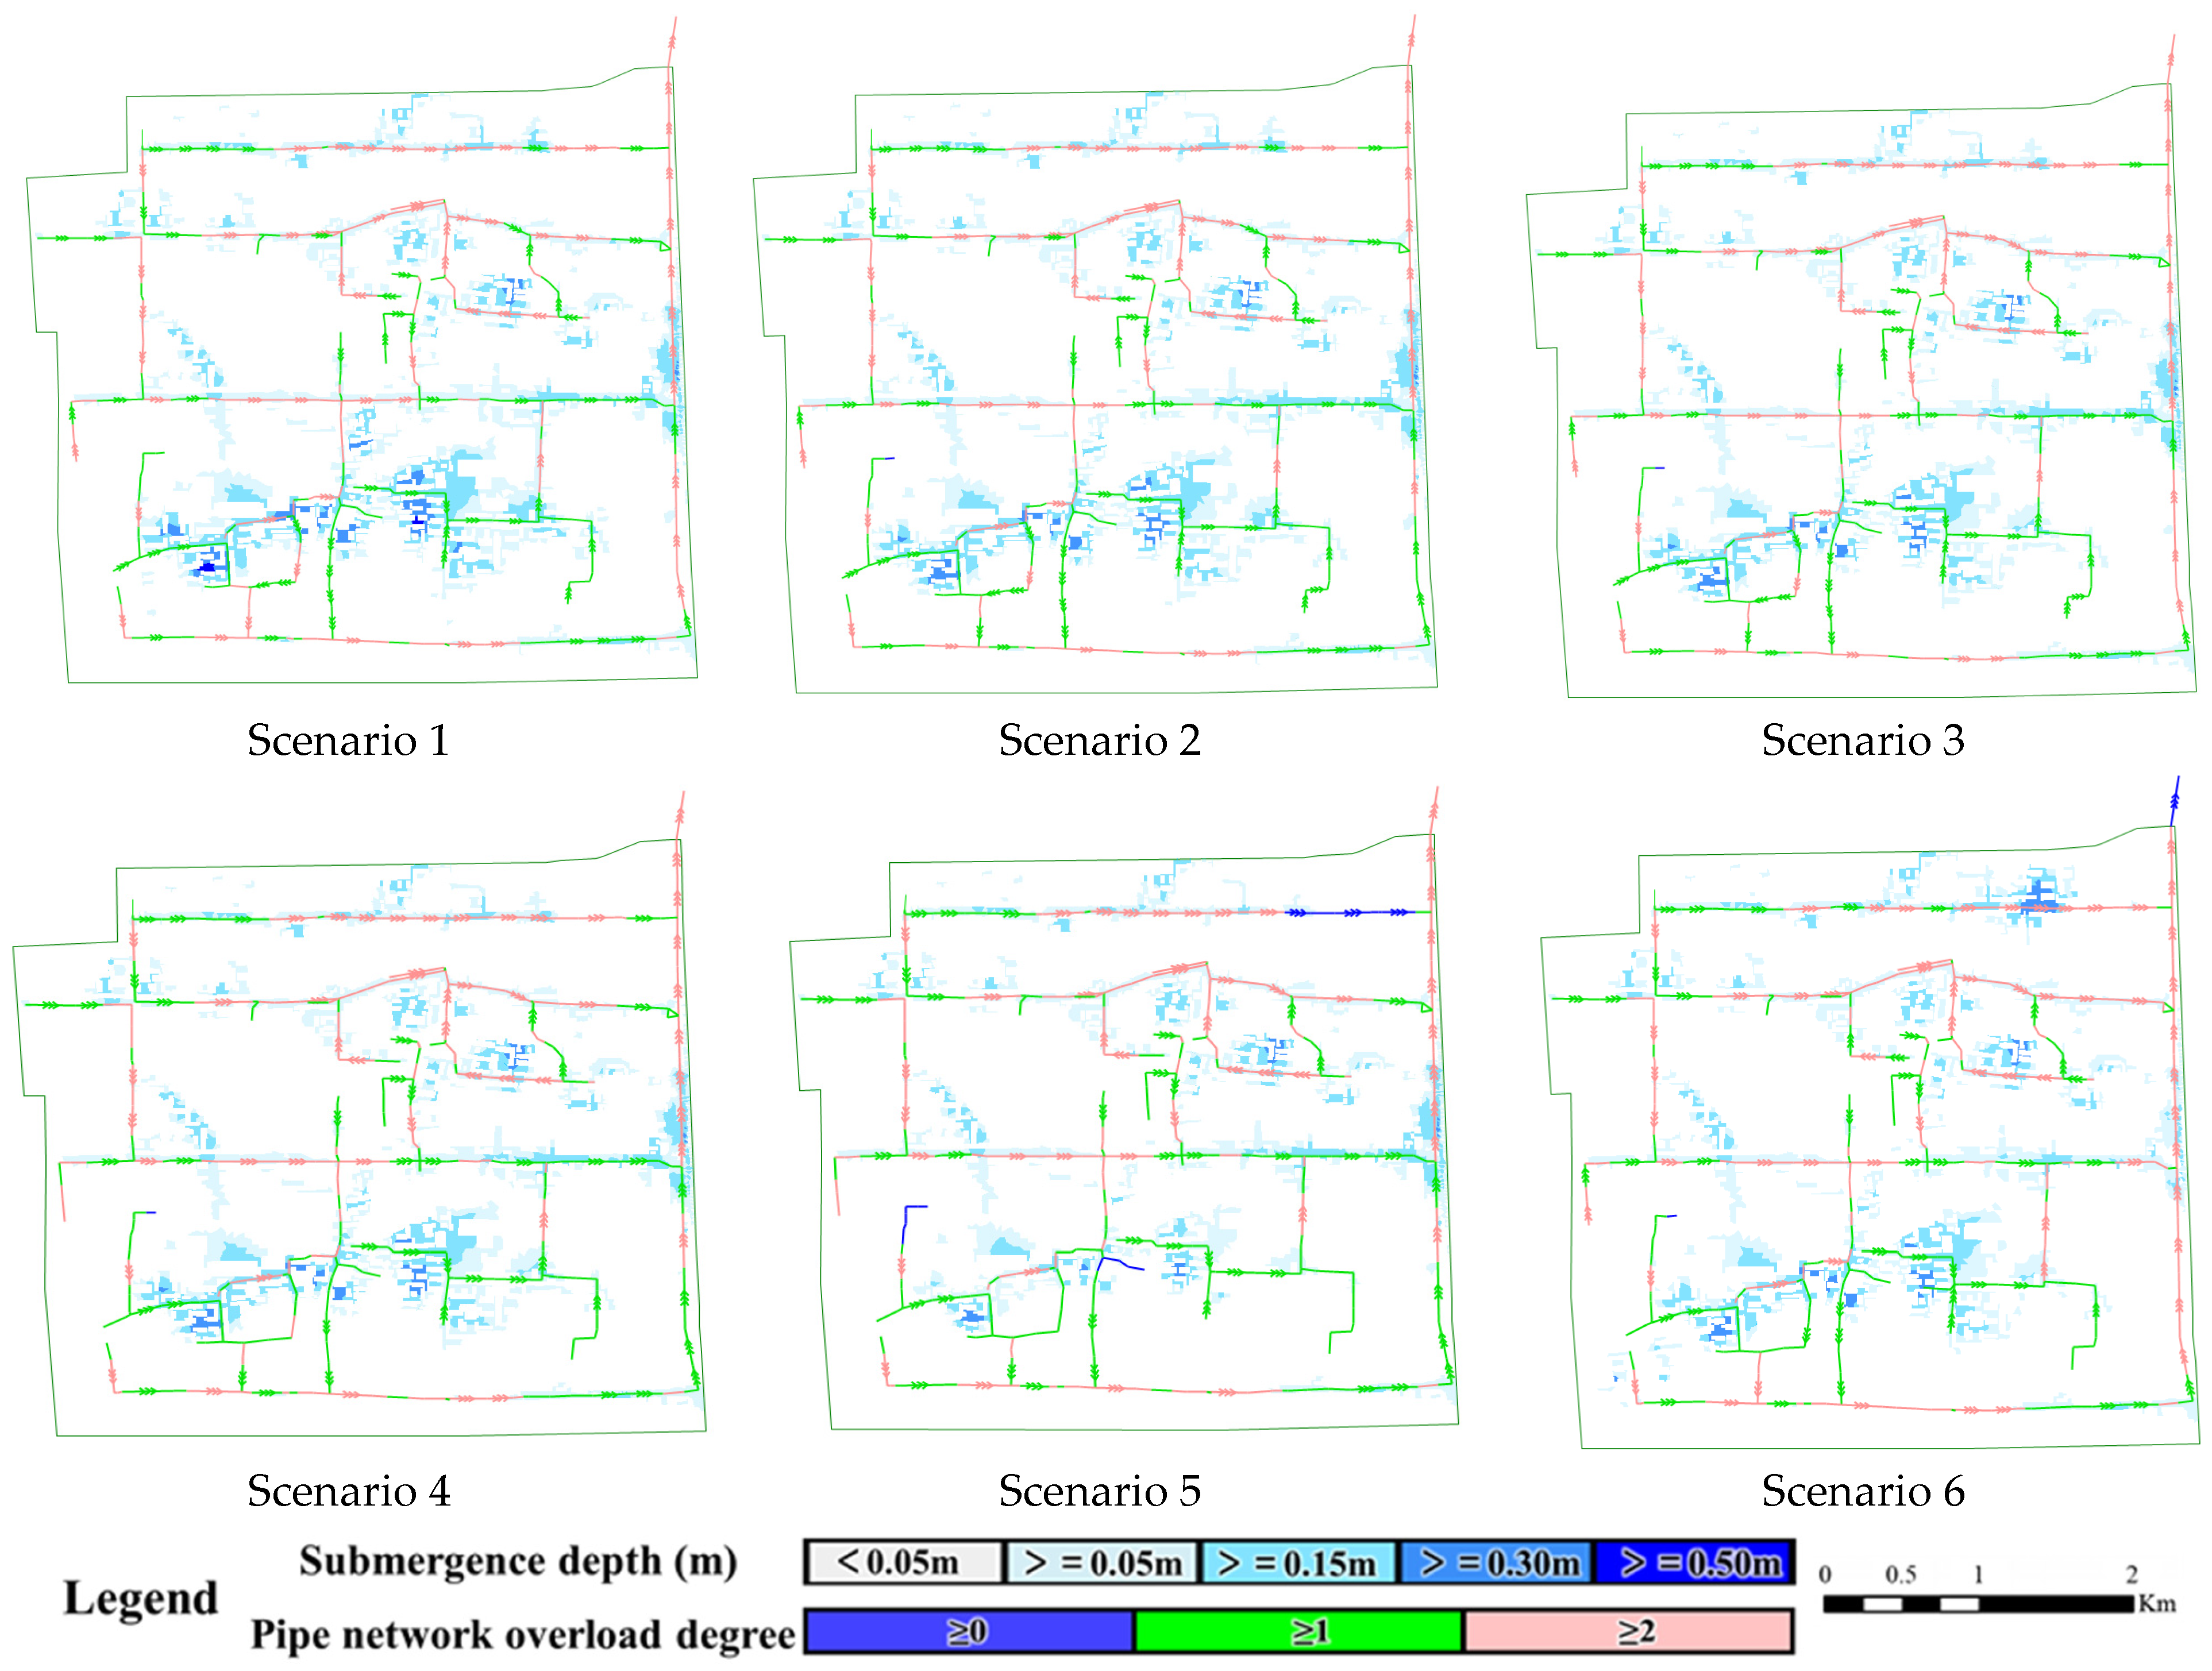
To evaluate the effectiveness of different pipe network retrofit strategies in mitigating urban waterlogging, six scenarios were compared based on simulated results of maximum water depth, inundation area, and risk level distribution. The simulation results under different scenarios are presented in Table 13 and Table 14 and Figure 18. The results show that as the intensity of pipe upgrades increases, both the water depth and inundation extent decrease significantly, while overall inundation risk is effectively reduced.
Scenario 1, representing the minimal intervention scheme, resulted in a maximum water depth of 0.50 m and an inundation area of 0.0155 km2, with high-risk zones still present—indicating limited mitigation effect. Scenarios 2 through 4 progressively expanded pipe diameters and upgrade areas, reducing maximum water depth to 0.46 m and stabilizing inundation area around 0.0129 km2. Although high-risk areas were eliminated, the marginal benefits of additional investment gradually diminished. Scenario 5 adopted large-diameter replacements for most trunk lines, achieving the most significant improvements: the maximum water depth dropped to 0.37 m, and the inundation area shrank to 0.0086 km2. It exhibited the smallest combined area of low- and medium-risk zones and completely eliminated high-risk zones, demonstrating the best overall control performance. Scenario 6 introduced new pipe segments and optimized layout under cost constraints, achieving favorable outcomes with a maximum water depth of 0.45 m and an inundation area of 0.0118 km2—better than Scenarios 2 and 3, but slightly less effective than Scenario 5.
Considering both mitigation effectiveness and construction cost, Scenario 5, despite having a relatively higher cost (approximately 950,000 yuan), provides the most substantial flood alleviation effect and is therefore recommended as the optimal solution in this study.
(2)
Combined Pipe Optimization and Green Roof Strategy
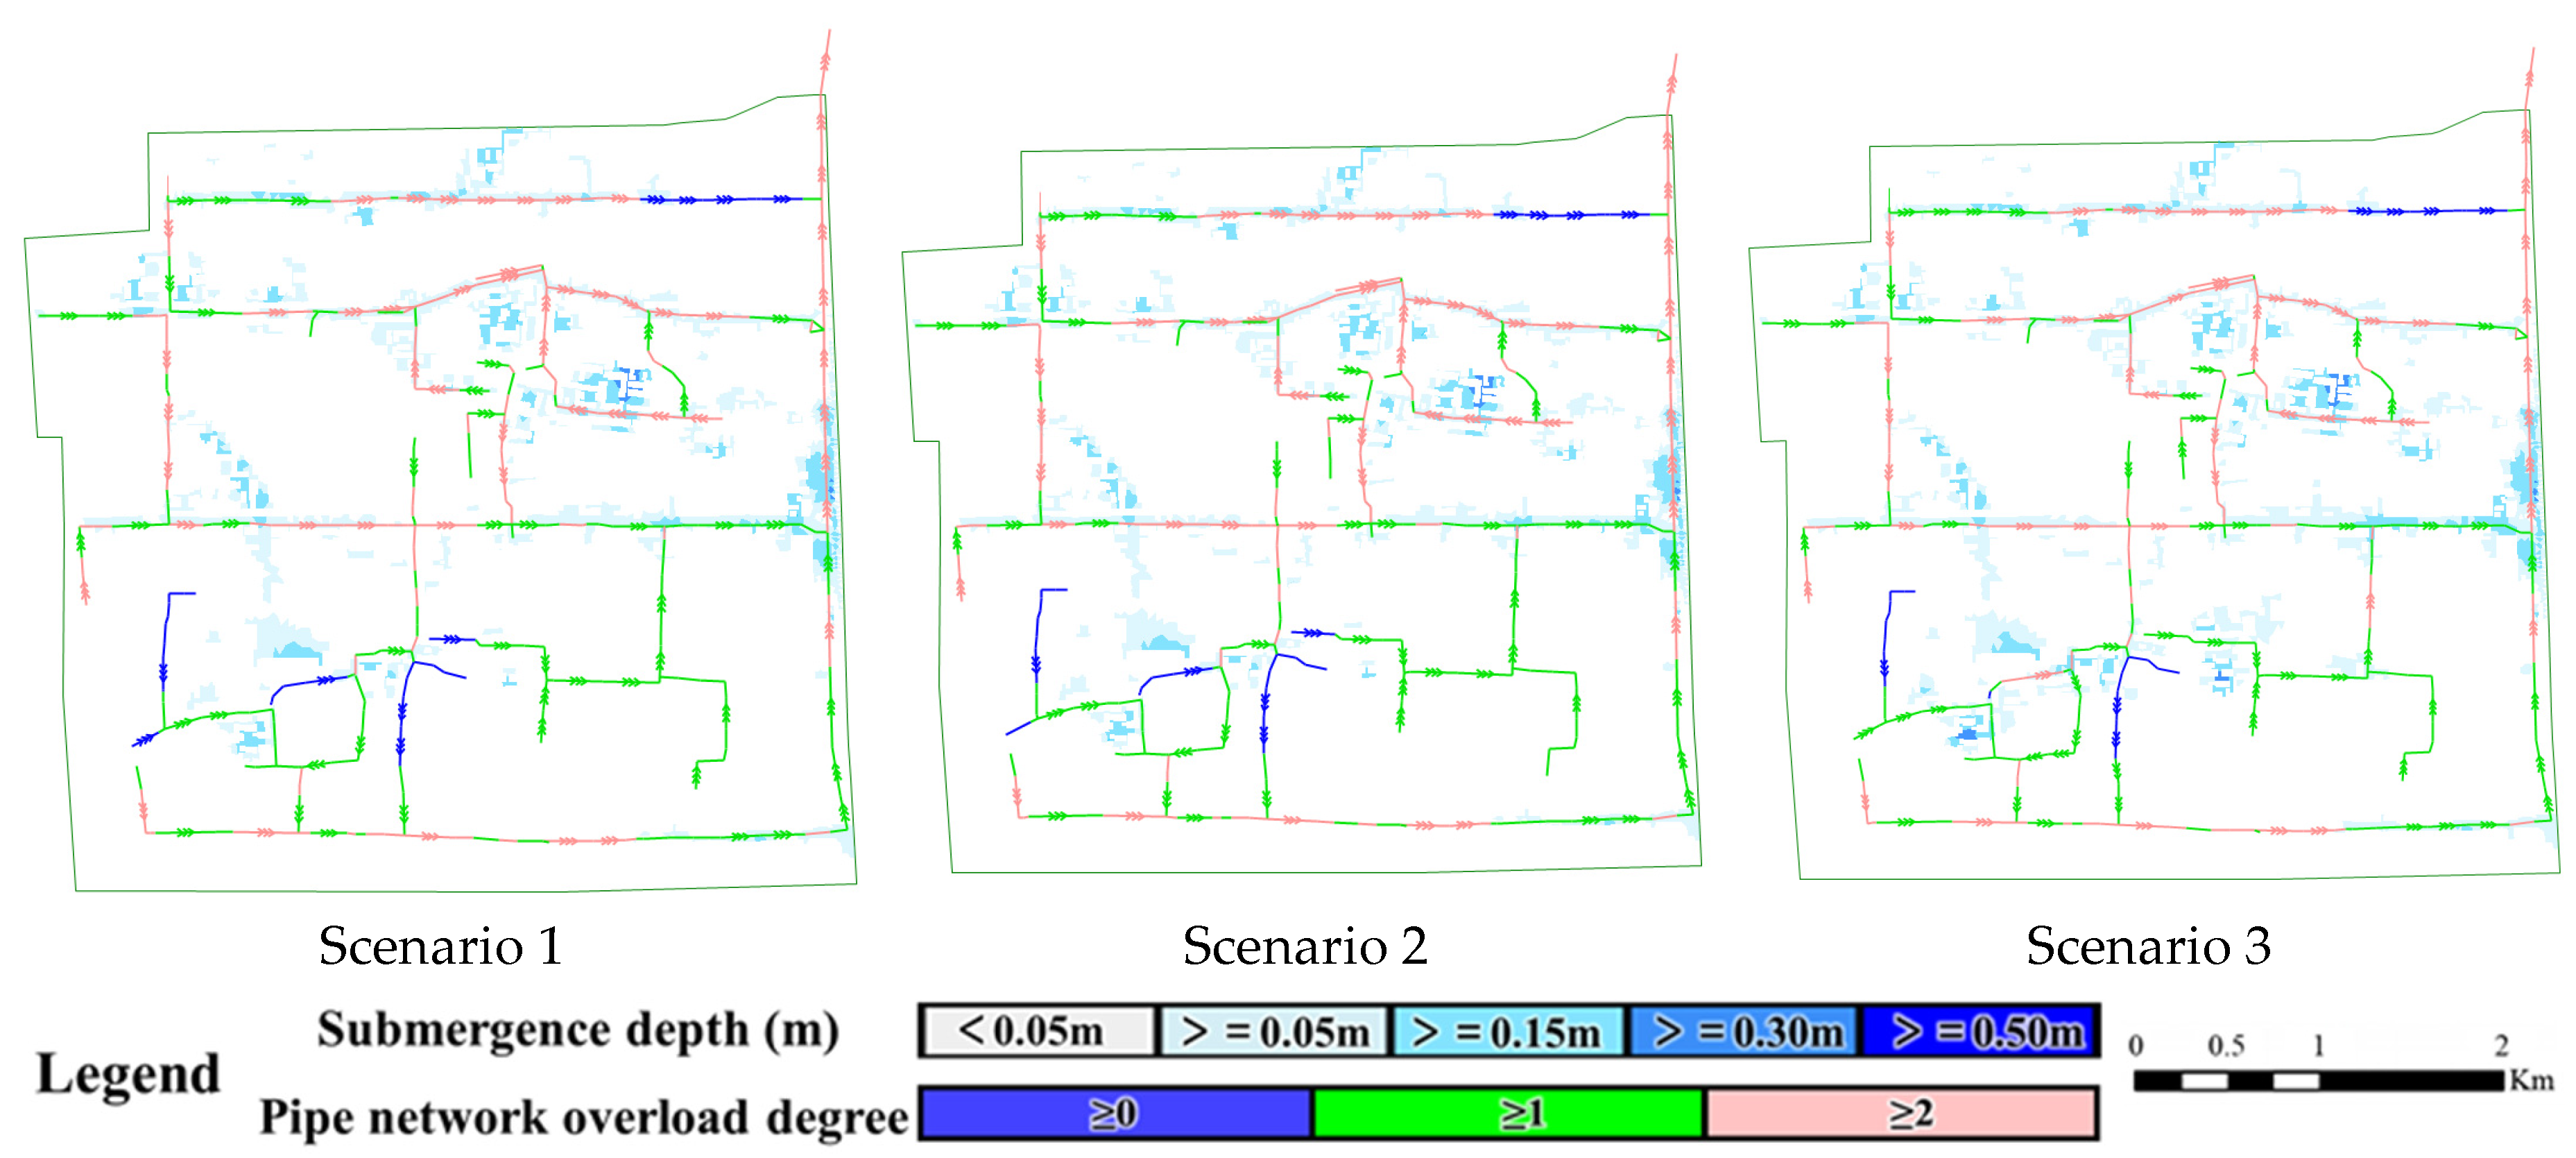
While the application of individual measures can alleviate waterlogging to some extent, localized inundation still occurs in the study area, with the maximum water depth at critical waterlogging points exceeding 0.15 m. In addition, implementing a single mitigation measure alone tends to result in high construction costs. To further enhance the effectiveness of urban waterlogging mitigation in old districts, three combined scenarios were designed by integrating different scales of green roof installations on top of the optimized pipe network configuration. A comparative analysis was conducted to assess their drainage performance and cost-effectiveness.
Therefore, this study proposes a combined mitigation approach, integrating the most effective pipe optimization scenario with green roof measures. Three combined strategies were designed as follows:
Scenario 1: A total green roof area of 732.8 m2 was installed at the waterlogging point, accounting for 0.23% of the total study area. The green roof construction cost was 732,800 yuan, and the pipe retrofit cost was 949,700 yuan, resulting in a total investment of 1,682,500 yuan. Under this scenario, the maximum water depth at the waterlogging point was reduced to 0.15 m.
Scenario 2: Building on Scenario 1, the green roof coverage was further increased to 899.6 m2 (0.29% of the study area). The green roof cost was 899,600 yuan, and the total cost including the pipe upgrade remained at 1,849,300 yuan. The maximum water depth at the waterlogging point remained at 0.15 m.
Scenario 3: A smaller green roof area of 366.4 m2 (0.12% of the study area) was implemented based on the same pipe optimization scheme. The green roof cost was 366,400 yuan, and the total cost was reduced to 1,316,100 yuan. However, the maximum water depth at the waterlogging point increased to 0.29 m.
The simulation results under different scenarios are presented in Figure 19, Table 15 and Table 16. Simulation results indicate that Scenario 1 reduced the maximum water depth at the critical waterlogging point to 0.15 m, with an inundation area of 0.0056 km2. Only a negligible medium-risk area (0.0002 km2) remained, and high-risk zones were entirely eliminated. Although Scenario 2 increased the green roof area by 22.76% and the total construction cost by 9.92% compared to Scenario 1, it did not yield further significant improvements—the maximum inundation depth, area, and risk level distribution remained unchanged. In contrast, Scenario 3 reduced the green roof area by 50% and the total cost by approximately 21.78%, but this led to a rebound in maximum water depth to 0.29 m and an expansion of the inundation area to 0.0069 km2, with larger low- and medium-risk zones.
Overall, Scenario 1 stands out as an effective integration of green infrastructure and traditional grey engineering. It significantly reduces flood risk while keeping costs under control. Scenario 2, despite higher input, exhibits diminishing marginal returns and lower cost-efficiency. Scenario 3, although more economical, shows a marked decline in mitigation performance. Therefore, Scenario 1 is recommended as the optimal integrated mitigation scheme, balancing hydraulic performance and economic viability, and providing a practical solution for flood control in aging urban districts.
(3)
Combined Pipe Optimization and Permeable Pavement Strategy
Building upon the most effective pipe optimization scheme, this study further introduces permeable pavement measures to enhance waterlogging mitigation in the study area. Three combined scenarios were developed, as detailed below:
Scenario 1: A total of 783.1 m2 of permeable pavement was installed in the old urban district, accounting for 0.25% of the study area. The construction cost for the permeable pavement was 313,200 yuan, and the pipe retrofit cost was 949,700 yuan, resulting in a total cost of 1,262,900 yuan. Under this configuration, the maximum water depth at the waterlogging point was 0.33 m.
Scenario 2: An expanded permeable pavement area of 6215 m2 (2.00% of the study area) was implemented. The construction cost of the pavement reached 2,486,000 yuan, and combined with the pipe upgrade cost, the total investment was 3,435,700 yuan. This scenario completely eliminated water accumulation at the waterlogging point.
Scenario 3: A moderate permeable pavement area of 3968 m2 (1.28% of the study area) was installed. The pavement cost was 1,587,200 yuan, and with the pipe upgrade included, the total cost amounted to 2,536,900 yuan. Similar to Scenario 2, no waterlogging occurred at the critical point.
The simulation results under different scenarios are presented in Figure 20 and Table 17. Overall, Scenario I had the lowest cost but offered limited drainage performance, with notable residual ponding and risk zones. Scenario 2 demonstrated the most effective flood mitigation but incurred a significantly higher cost with diminishing marginal returns. Scenario 3 also achieved zero ponding at the key waterlogging point while reducing the total cost by 36.7% compared to Scenario 2, though it resulted in a slightly larger inundation area and higher risk level. Under budget-constrained conditions, Scenario 3 presents a practical and efficient solution, making it the recommended permeable pavement combination scheme for effective urban waterlogging mitigation in old urban districts.

5. Conclusions and Reflection

In this study, the InfoWorks ICM model was employed to construct a coupled hydrodynamic model integrating the stormwater pipe network and surface overland flow for a typical old urban district. Based on observed rainfall data, two events were selected for model calibration and one for validation. The calibrated model was then used to analyze the causes of urban waterlogging from the perspectives of regional runoff generation and confluence relationships, drainage pipe capacity, rainfall intensity, and underlying surface conditions.
To alleviate waterlogging risks under the 20-year return period design rainfall, three categories of engineering measures were considered: green roofs, permeable pavements, and pipe network upgrades. With the dual objectives of minimizing inundation area and total construction cost, twelve mitigation scenarios were developed and compared. The changes in inundation extent, maximum water depth at the waterlogging point, water depth distribution, and pipe network overload were analyzed before and after implementation. Results demonstrated that all combined measures outperformed the single pipe optimization scheme.
By integrating 732.8 m2 of green roofs with the optimal pipe network upgrade, significant mitigation effects were achieved. Under the 20-year rainfall scenario, the high-risk zone was completely eliminated (from 0.0025 km2 to 0), the medium-risk area reduced by 97.62% (from 0.0084 km2 to 0.0002 km2), and the low-risk area shrank by 78.23% (from 0.0248 km2 to 0.0054 km2). The no-risk zone expanded by 10.58% (from 0.2827 km2 to 0.3127 km2). Overall, this scheme effectively reshaped the risk distribution of the study area, providing strong flood mitigation benefits at a moderate cost (total investment of 1.6825 million CNY), achieving a well-balanced trade-off between economic feasibility and performance.
Similarly, by implementing 3968 m2 of permeable pavement (1.28% of the study area) in conjunction with the optimized pipe system, remarkable mitigation was also observed. High-risk zones were eliminated, medium-risk areas reduced by 97.62%, and low-risk areas dropped by 77.42% (to 0.0056 km2), while the no-risk area increased by 10.54% (to 0.3125 km2). In addition, this scheme achieved a “zero water depth” at the critical waterlogging point, offering more thorough control for key locations. However, its total cost reached 2.5369 million CNY—approximately 50.8% higher than the green roof solution.
Therefore, if financial resources are limited and water depth thresholds are not strictly constrained, the green roof–pipe optimization combination offers the best balance between cost and performance, and is recommended as the preferred strategy for broader application. Previous studies [21,24] have shown that permeable pavements can significantly increase the infiltration rate of rainwater during long-duration storms, making them generally more effective than green roofs in such cases. If the goal is to eliminate ponding entirely at critical locations and funding permits, the permeable pavement combination offers superior localized control, making it suitable for priority protection zones.
During the scenario design and simulation process, it was found that scheme configuration relies heavily on subjective judgment and may not represent the global optimal solution. Thus, future research should consider applying multi-criteria comparison techniques or artificial intelligence algorithms to systematically optimize urban waterlogging mitigation strategies under objectives such as minimizing inundation area and cost, thereby identifying the true optimal solution.
It should be noted that in this study the hydrological effects of LID facilities, such as green roofs and permeable pavements, were represented using integrated parameters within InfoWorks ICM. As a result, the separate contributions of retention (temporary surface storage) and infiltration (subsurface percolation) were not explicitly distinguished. This simplification may lead to an overestimation of short-term detention capacity and an underestimation of long-term infiltration benefits, which could affect the precision of runoff generation and flow dynamics representation, particularly under long-duration or high-intensity rainfall conditions. Therefore, while the comparative performance of different scenarios remains valid, the absolute values of mitigation efficiency should be interpreted with caution. Future research should aim to separately parameterize retention and infiltration processes, which would allow a more detailed understanding of the physical mechanisms of LID measures and improve the robustness and accuracy of flood mitigation assessments.
In addition, uncertainties are inevitable in hydrodynamic modeling and cost evaluation. First, rainfall variability is a critical factor. Although this study used the officially published local rainfall intensity formula to construct design storms, it cannot fully capture the stochastic nature of extreme precipitation events. Such variability may influence inundation depths and extents under different return periods, thereby affecting the robustness of scenario comparisons. Second, although real rainfall events were employed to calibrate and validate the pipe roughness in the model, the roughness coefficients may still vary due to pipe aging, sediment deposition, or partial blockages. These changes could lead to deviations in simulated drainage capacity and consequently alter the flood evolution process. Third, cost estimates are subject to market fluctuations and regional differences in labor and material prices, which may influence the evaluation of economic feasibility. Taken together, these uncertainties suggest that while comparative analyses of retrofit scenarios remain valuable, the absolute values of inundation reduction or cost-effectiveness should be interpreted with caution. Future research should incorporate probabilistic analyses, sensitivity tests, or ensembles of scenarios to systematically evaluate these uncertainties and thereby enhance the generalizability of the findings.
This study provides a refined modeling framework and multi-strategy governance scheme for old urban districts. Municipal governments can incorporate the proposed governance strategies into urban drainage master plans and sponge city programs to guide targeted and cost-effective retrofits in compact old districts. Meanwhile, the proposed approach is also applicable to other districts with similar conditions (e.g., limited land resources, dense building distribution, and aging drainage facilities), enabling the formulation of systematic and cost-effective strategies. Such strategies can enhance flood protection capacity, significantly reduce waterlogging risks, and thereby improve urban flood resilience, safeguard residents, tourists, and businesses, reduce damage to buildings and essential services, lower economic losses, and promote the sustainable development of the urban environment.
Author Contributions

Conceptualization, Y.W.; Methodology, Y.W.; Software, Y.W.; Validation, Y.W. and P.L.; Formal analysis, Y.W.; Investigation, Y.W.; Resources, Y.W. and J.L.; Data curation, Y.W.; Writing—original draft, Y.W.; Writing—review & editing, Y.W.; Visualization, Y.W.; Supervision, J.L., T.M. and H.L.; Project administration, J.L., H.L. and A.L.; Funding acquisition, J.L. and T.M. All authors have read and agreed to the published version of the manuscript.

Funding

This research was funded by “Construction and Application of Groundwater Model in the Yangtze River Basin (U2340212)”, “Nanjing Hydraulic Research Institute Anhui Chuzhou Modern Hydrology Field Scientific Observation and Research Station Fund (ahczxd)” and “Postgraduate Thesis Fund of Nanjing Hydraulic Research Institute (Yy525022)”.

Data Availability Statement

All models or data that support the findings of this study are available from the corresponding author upon reasonable request.

Acknowledgments

We thank the anonymous reviewers for their valuable comments.

Conflicts of Interest

The authors declare no conflicts of interest.

References

  1. Li, C.; Cheng, X.; Shen, R.; Liu, Q. New Characteristics and Formation Mechanisms of Flood Disasters under Urbanization Background. Disasters 2019, 34, 57–62. [Google Scholar]
  2. Zhang, J.; Wang, Y.; Liu, C.S. Discussion on Urban Flooding and Prevention Standards in China. J. Hydroelectr. Power 2017, 36, 1–6. [Google Scholar]
  3. Intergovernmental Panel on Climate Change. Climate Change 2021—The Physical Science Basis: Working Group I Contribution to the Sixth Assessment Report of the Intergovernmental Panel on Climate Change, 1st ed.; Cambridge University Press: Cambridge, UK, 2023. [Google Scholar]
  4. Wang, L.; Zhang, B.; Shi, Y.; Han, Z.; Liu, B. Interpretation of the Main Conclusions on Climate Change Impacts and Risks in the IPCC AR6 Report. Clim. Change Res. Prog. 2022, 18, 389–394. [Google Scholar]
  5. Liu, J.; Mei, C.; Liu, H.; Fang, X.; Ni, G.; Jin, W. Key Scientific and Technical Issues in the Joint Prevention and Control of Urban Flood and Inland Flood Disaster Chains in Megacities. Adv. Water Sci. 2023, 34, 172–181. [Google Scholar] [CrossRef]
  6. Zhang, J.; Luo, Q.; Wang, B. Advances in Research on Causes and Countermeasures for Urban Extreme Rainstorm Flood Disasters. Water Resour. Protect. 2024, 40, 6–15. [Google Scholar]
  7. Wu, J.; Lin, K.; Liu, M.; Huang, L. Analysis of Coastal Flood Disaster Causes Based on the Apriori Algorithm. China Rural. Water Conserv. Hydropower 2023, 5, 111–118. [Google Scholar]
  8. Minucci, G.; Molinari, D.; Gemini, G.; Pezzoli, S. Enhancing Flood Risk Maps by a Participatory and Collaborative Design Process. Int. J. Disaster Risk Reduct. 2020, 50, 101747. [Google Scholar] [CrossRef]
  9. Zoppou, C. Review of Urban Storm Water Models. Environ. Modell. Softw. 2001, 16, 195–231. [Google Scholar] [CrossRef]
  10. Su, M.; Zheng, Y.; Hao, Y.; Chen, Q.; Chen, S.; Chen, Z.; Xie, H. The Influence of Landscape Pattern on the Risk of Urban Water-Logging and Flood Disaster. Ecol. Indic. 2018, 92, 133–140. [Google Scholar] [CrossRef]
  11. Gulshad, K.; Szydłowski, M.; Yaseen, A.; Aslam, R.W. A Comparative Analysis of Methods and Tools for Low Impact Development (LID) Site Selection. J. Environ. Manag. 2024, 354, 120212. [Google Scholar] [CrossRef]
  12. Martin-Mikle, C.J.; De Beurs, K.M.; Julian, J.P.; Mayer, P.M. Identifying Priority Sites for Low Impact Development (LID) in a Mixed-Use Watershed. Landsc. Urban Plann. 2015, 140, 29–41. [Google Scholar] [CrossRef]
  13. Gizzi, F.T.; Bovolin, V.; Villani, P.; Potenza, M.R.; Voria, S.; Amodio, A.M. Rewinding the Tape: Documentary Heritage to (Re)discover “Lost” Natural Hazards—Evidence and Inferences from Southern Italy. Sustainability 2024, 16, 2789. [Google Scholar] [CrossRef]
  14. Oliva, A.; Olcina, J. Historical Floods and Territorial Planning: Lessons Learned and Opportunities Lost after the Santa Teresa Flood (1879) in the Segura Basin (Spain). Land 2023, 13, 28. [Google Scholar] [CrossRef]
  15. Xu, Z.; Pang, B.; He, R. Causes of Urban Rainstorm Flood Disasters in a Changing Environment; China Water & Power Press: Beijing, China, 2023. [Google Scholar]
  16. Han, F.; Zhang, X.; Yu, J.; Xu, S.; Zhou, G.; Li, S. Study on Spatiotemporal Dynamic Characteristics of Precipitation and Causes of Waterlogging Based on a Data-Driven Framework. Sci. Total Environ. 2024, 913, 169796. [Google Scholar] [CrossRef]
  17. Feng, T.; Lei, X.; Wang, J.; Zhang, Y. Analysis of Coastal Urban Rainstorm Flooding Based on Infoworks ICM Model. Water Sci. Energy Sci. 2023, 41, 64–68. [Google Scholar] [CrossRef]
  18. Wang, M.; Liu, M.; Zhang, D.; Qi, J.; Fu, W.; Zhang, Y.; Rao, Q.; Bakhshipour, A.E.; Tan, S.K. Assessing and Optimizing the Hydrological Performance of Grey-Green Infrastructure Systems in Response to Climate Change and Non-Stationary Time Series. Water Res. 2023, 232, 119720. [Google Scholar] [CrossRef]
  19. Al-Zghoul, S.; Al-Homoud, M. GIS-Driven Spatial Planning for Resilient Communities: Walkability, Social Cohesion, and Green Infrastructure in Peri-Urban Jordan. Sustainability 2025, 17, 6637. [Google Scholar] [CrossRef]
  20. Dougaheh, M.P.; Ashofteh, P.S.; Loáiciga, H.A. Urban Stormwater Management Using Low-Impact Development Control Measures Considering Climate Change. Theor. Appl. Climatol. 2023, 154, 1021–1033. [Google Scholar] [CrossRef]
  21. Chiu, Y.J.; Chang, L.C.; Lin, Y.T.; Lin, Y.T.; Liu, C.W.; Lee, J.J. Hydrologic Performance Assessment of Low Impact Development Facilities Based on Monitoring Data and SWMM Modeling in an Urban Catchment in Taiwan. Sci. Rep. 2025, 15, 27251. [Google Scholar] [CrossRef]
  22. Green, D.; O’Donnell, E.; Johnson, M.; Slater, L.; Thorne, C.; Zheng, S.; Stirling, R.; Chan, F.K.; Li, L.; Boothroyd, R.J. Green Infrastructure: The Future of Urban Flood Risk Management? Wiley Interdiscip. Rev. Water 2021, 8, e1560. [Google Scholar] [CrossRef]
  23. Li, J.; Zeng, J.; Huang, G.; Chen, W. Urban Flood Mitigation Strategies with Coupled Grey–Green Measures: A Case Study in Guangzhou City, China. Int. J. Disaster Risk Sci. 2024, 15, 467–479. [Google Scholar] [CrossRef]
  24. Tansar, H.; Duan, H.F.; Mark, O. A Multi-Objective Decision-Making Framework for Implementing Green-Grey Infrastructures to Enhance Urban Drainage System Resilience. J. Hydrol. 2023, 620, 129381. [Google Scholar] [CrossRef]
  25. Bo, L.; Guiwen, P.R. Research on LID Facility Layout Optimization Based on SWMM Model. Master’s Thesis, Anhui University of Science and Technology, Anhui, China, 2023. [Google Scholar]
  26. Aleksandrova, K.I.; McWilliam, W.J.; Wesener, A. Status and Future Directions for Residential Street Infrastructure Retrofit Research. Urban Sci. 2019, 3, 49. [Google Scholar] [CrossRef]
  27. Hu, Y.; Bao, J.; Gao, H. Research on Applicable Technologies for Sponge City Renovation in Old Urban Areas Based on SWMM. Water Sci. Energy Sci. 2024, 42, 27–31. [Google Scholar] [CrossRef]
  28. Xiong, L.; Lu, S.; Tan, J. Optimized Strategies of Green and Grey Infrastructures for Integrated Control Objectives of Runoff, Waterlogging and WWDP in Old Storm Drainages. Sci. Total Environ. 2023, 901, 165847. [Google Scholar] [CrossRef]
  29. Cui, P.; Ju, X.; Liu, Y.; Li, D. Predicting and Improving the Waterlogging Resilience of Urban Communities in China—A Case Study of Nanjing. Buildings 2023, 12, 901. [Google Scholar] [CrossRef]
  30. Yu, Z. Study on Urban Flood Risk Analysis and Renovation Evaluation in Old Urban Districts Based on Hydrodynamic Model. Master’s Thesis, Ningbo University, Ningbo, China, 2023. [Google Scholar]
  31. Fan, Y.; Ao, T.; Yu, H.; Huang, G.; Li, X. A Coupled 1D-2D Hydrodynamic Model for Urban Flood Inundation. Adv. Meteorol. 2017, 2017, 2819308. [Google Scholar] [CrossRef]
  32. Wang, K.; Chen, J.; Hu, H.; Tang, Y.; Huang, J.; Wu, Y.; Lu, J.; Zhou, J. Urban Waterlogging Simulation and Disaster Risk Analysis Using InfoWorks Integrated Catchment Management: A Case Study from the Yushan Lake Area of Ma’anshan City in China. Water 2024, 16, 3383. [Google Scholar] [CrossRef]
  33. Wei, H.; Wu, H.; Zhang, L.; Liu, J. Urban Flooding Simulation and Flood Risk Assessment Based on the InfoWorks ICM Model: A Case Study of the Urban Inland Rivers in Zhengzhou, China. Water Sci. Technol. 2024, 90, 1338–1358. [Google Scholar] [CrossRef]
  34. Wei, H.; Zhang, L.; Liu, J. Hydrodynamic Modelling and Flood Risk Analysis of Urban Catchments under Multiple Scenarios: A Case Study of Dongfeng Canal District, Zhengzhou. Int. J. Environ. Res. Public Health 2022, 19, 14630. [Google Scholar] [CrossRef]
  35. China Association for Engineering Construction Standardization. Urban Flood Control System Mathematical Model Construction and Application Guidelines; China Architecture & Building Press: Beijing, China, 2019. [Google Scholar]
  36. Ministry of Housing and Urban-Rural Development of China. Technical Guidelines for the Compilation of Urban Rainstorm Intensity Formula and Determination of Design Rainfall Patterns; Ministry of Housing and Urban-Rural Development of China: Beijing, China, 2014. [Google Scholar]
  37. Ministry of Housing and Urban-Rural Development of China. Technical Guide for Sponge City Construction; Ministry of Housing and Urban-Rural Development of China: Beijing, China, 2014. [Google Scholar]
  38. Wang, J.; Zhou, X.; Wang, S.; Chen, L.; Shen, Z. Simulation and Comprehensive Evaluation of the Multidimensional Environmental Benefits of Sponge Cities. Water 2023, 15, 2590. [Google Scholar] [CrossRef]
  39. Xie, J.; Chen, H.; Liao, Z.; Gu, X.; Zhu, D.; Zhang, J. An Integrated Assessment of Urban Flooding Mitigation Strategies for Robust Decision Making. Environ. Modell. Softw. 2017, 95, 143–155. [Google Scholar] [CrossRef]
Figure 1. General Situation of the Study Area.
Land 14 01983 g001
Figure 2. Observed water level processes during the three rainfall events.
Land 14 01983 g002
Figure 3. Methodological Framework.
Land 14 01983 g003
Figure 4. Distribution map of adverse slope pipe sections.
Land 14 01983 g004
Figure 5. Sub-catchment Delineation Results in the Study Area.
Land 14 01983 g005
Figure 6. Elevation distribution map.
Land 14 01983 g006
Figure 7. Simulated and Observed Flow and Water Level at Node Y035677 during the 7.21 Rainfall Event.
Land 14 01983 g007
Figure 8. Simulated and Observed Flow and Water Level at Node Y035677 during the 7.31 Rainfall Event.
Land 14 01983 g008
Figure 9. Simulated and Observed Flow and Water Level at Node Y035677 during the 7.29 Rainfall Event.
Land 14 01983 g009
Figure 10. Water Depth Simulation at the Waterlogging Monitoring Point.
Land 14 01983 g010
Figure 11. Design Rainfall Hyetograph.
Land 14 01983 g011
Figure 12. Evaluation of the Current Drainage Capacity of the Pipe Network.
Land 14 01983 g012
Figure 13. Spatial Distribution of Inundation Extent under Different Rainfall Return Period Scenarios.
Land 14 01983 g013aLand 14 01983 g013b
Figure 14. Proportion of inundation areas by risk level under different return periods.
Land 14 01983 g014
Figure 15. Distribution of Hydraulic Gradients of Pipe Segments Near the Waterlogging Point.
Land 14 01983 g015
Figure 16. Topographic Analysis of the Study Area.
Land 14 01983 g016
Figure 17. Subdivision of the Study Area and Pipe Network Zoning.
Land 14 01983 g017
Figure 18. Pipe Overload and Surface Inundation by Retrofit Scenario under the Pipe-Network-Optimization Strategy.
Land 14 01983 g018
Figure 19. Pipe Overload and Surface Inundation by Retrofit Scenario under the Combined Pipe Optimization and Green Roof Strategy.
Land 14 01983 g019
Figure 20. Distribution of Pipe Overload and Surface Inundation by Retrofit Scenario under Combined Pipe Optimization and Permeable Pavement Strategy.
Land 14 01983 g020
Table 1. Different Land Surface Types.
Land Use TypesArea (km2)Percentage (%)
Buildings0.160050.4
Roads0.00912.9
Paved Surfaces0.147846.6
Green Spaces0.00050.2
Table 2. Data Sources of the Study.
CategoryData ContentData Source
Geospatial dataDistrict boundary, land use classification, and elevation data (see Figure 1)Landsat 8 OLI imagery (30 m resolution), SRTM DEM (30 m resolution)
Stormwater drainage systemPipeline information: pipe IDs, lengths, slopes, and other structural attributes (see Figure 1)Local Drainage Management Department
Node parameters: manhole IDs, ground elevation, and invert elevation (see Figure 1)
Rainfall data Minute-level precipitation data of three typical heavy rainfall events (see Figure 2):
(1) July 21, 00:00–July 22, 14:00;
(2) July 29, 11:00–July 30, 14:00;
(3) July 31, 00:00–August 1, 13:29
Hydrological Monitoring Stations
Inundation monitoringField observations at a typical inundation pointField survey
Hydraulic monitoringReal-time monitoring data from drainage monitoring stationsLocal Drainage Monitoring Stations
Table 3. Model Performance Metrics for Different Rainfall Events.
Rainfall EventsFlow (m3/s) NSEFlow (m3/s) RMSEWater Level (m)_NSEWater Level (m)_RMSEPeak Timing Error (min)Peak Volume Error (%)
Event 7.210.7620.0500.8200.2220−24.7%
Event 7.310.8210.0540.7900.1770−7.8%
Event 7.290.8530.0360.8930.165−30−15.9%
Table 4. Classification of Pipe Overload Status Based on Feedback Values.
Overload Feedback ValueOperational Status
0 < Overload Value < 1The pipe is not fully filled. The overload value varies between 0 and 1, representing the degree of filling. The actual flow in the pipe is less than its drainage capacity.
Overload Value = 1The pipe is fully filled. The overload value equals 1, indicating that the hydraulic gradient is equal to or less than the pipe slope, and the flow rate does not exceed the maximum drainage capacity.
Overload Value = 2The pipe is fully filled. The overload value equals 2, indicating that the hydraulic gradient exceeds the pipe slope. The flow rate surpasses the pipe’s maximum capacity, meaning the pipe cannot meet the drainage demand.
Table 5. Evaluation Results of the Current Drainage Capacity of the Pipe Network.
Design Return PeriodStatistics of Pipe Overload Conditions
0 < Overload Value < 1 (Under Capacity)Overload Value = 1 (Fully Filled)Overload Value = 2 (Overloaded)Total Length (m)
1-year30.82268.12999.45298.3
2-year02191.73106.65298.3
5-year02157.93140.45298.3
10-year02126.33172.05298.3
20-year02084.63213.75298.3
50-year01815.13483.25298.3
Table 6. Evaluation of Pipe Network Drainage Capacity under Different Return Periods.
Drainage Capacity (Return Period)Pipe Length (m)Proportion (%)
Less than 1-year2814.353.1%
1–2 years1110.821.0%
2–5 years496.09.4%
5–10 years198.53.7%
10–20 years155.72.9%
20–50 years62.01.2%
Greater than 50 years462.58.7%
Table 7. Classification of Inundation Risk Levels.
Risk Level Water Depth (m) Inundation Duration
No Risk<0.15
Low Risk0.15–0.30>0.5 h
Medium Risk0.30–0.50>0.5 h
High Risk>0.50
Table 8. Urban Waterlogging Simulation Results under Different Rainfall Return Periods.
Simulation ScenarioTotal Rainfall (mm)Maximum Rainfall Intensity (mm/h)Maximum Inundation Depth (m)Inundation Area (km2)
1a90.782.70.450.0042
2a127.4108.50.490.0100
5a167.4142.60.530.0197
10a197.7168.40.560.0275
20a228.0194.30.620.0346
50a268.1228.40.790.0435
Table 9. Area Statistics of Inundation Risk Levels under Different Rainfall Return Period Scenarios.
Risk Level1a2a5a10a20a50a
No Risk (km2)0.31420.30820.29870.29090.28270.1848
Low Risk (km2)0.00370.00900.01600.02080.02480.0591
Medium Risk (km2)0.00050.00110.00350.00640.00840.0403
High Risk (km2)0.00000.00000.00010.00030.00250.0341
Total (km2)0.31830.31830.31830.31830.31830.3183
Table 10. Design Flow Capacity of Pipe Segments Near the Waterlogging Point.
Pipe IDLength (m)Pipe TypeDiameter/Width (mm)Design Flow Capacity (m3/s)
Cond295133.4CIRCULAR0.40.1890
Cond33596.0CIRCULAR0.40.2550
Cond359832.2CIRCULAR0.4Adverse Slope
Cond398714.4CIRCULAR0.40.1842
Cond336425.2CIRCULAR0.4Adverse Slope
Table 11. Overview of scenario settings.
Scenario TypeMeasuresNo. of ScenariosNotes
Pipeline renovation (zoned)Pipeline optimization6Different levels of pipe upgrading
Grey–green combined retrofit 1Pipeline optimization + Green roofs3Varying coverage levels of green roofs
Grey–green combined retrofit 2Pipeline optimization + Permeable pavements3Varying coverage levels of permeable pavements
Table 12. Pipe Upgrade Scenarios and Corresponding Construction Costs.
ZoneDiameter (mm)Length (m)Cost (10 k yuan)Diameter (mm)Length (m)Cost (10 k Yuan)Diameter (mm)Length (m)Cost (10 k Yuan)
Retrofitting SchemeScenario 1Scenario 2Scenario 3
Main Trunk 1\1000370.813.3
Main Trunk 2\
Main Line 1800517.416800517.416800517.416
Q1700579.216.2800579.218800579.218
Q2600281.16.7800281.18.7800281.18.7
Q3700501.914.1800501.915.6800501.915.6
Main Line 2700303.28.5800303.29.4800303.29.4
Main Line 3700133.13.7700133.13.7700133.13.7
Total\2315.965.3\2315.971.4\2315.984.7
Retrofitting SchemeScenario 4Scenario 5Scenario 6 (New pipe segment)
Main Trunk 11000370.813.31000370.813.3New pipe segment: 800 mm diameter, 30.8 m in length
Main Trunk 21000220.47.91000220.47.9
Main Line 1800517.4161000405.514.6800405.512.6
Q1800579.2181000579.220.9800579.218
Q2800281.18.71000281.110.1800281.18.7
Q3800501.915.61000355.912.8800501.915.6
Main Line 2800303.29.41000303.210.9800303.29.4
Main Line 3700133.13.7900133.14.4700133.14.1
Total\2907.192.7\2649.295\2234.868.3
Table 13. Simulation Results by Retrofit Scenario under the Pipe-Network-Optimization Strategy.
Simulation ScenarioMax Water Depth at Waterlogging Point (m)Inundation Area of Study Area (km2)
Scenario 10.500.0155
Scenario 20.470.0138
Scenario 30.470.0129
Scenario 40.460.0129
Scenario 50.370.0086
Scenario 60.450.0118
Table 14. Inundation Risk Area Statistics by Retrofit Scenario under the Pipe-Network-Optimization Strategy.
Risk LevelScenario 1Scenario 2Scenario 3Scenario 4Scenario 5Scenario 6
No Risk (km2)0.30280.30450.30550.30550.30980.3067
Low Risk (km2)0.01350.01270.01180.01190.00810.0101
Medium Risk (km2)0.00190.00110.00100.00090.00040.0014
High Risk (km2)0.00010.00000.00000.00000.00000.0000
Table 15. Simulation Results by Retrofit Scenario under the Combined Pipe Optimization and Green Roof Strategy.
Simulation ScenarioMax Water Depth at Waterlogging Point (m)Inundation Area of Study Area (km2)
Scenario 10.150.0056
Scenario 20.150.0056
Scenario 30.290.0069
Table 16. Inundation Risk Area Statistics by Retrofit Scenario under the Combined Pipe Optimization and Green Roof Strategy.
Risk LevelScenario 1Scenario 2Scenario 3
No Risk (km2)0.31270.31270.3114
Low Risk (km2)0.00540.00540.0066
Medium Risk (km2)0.00020.00020.0003
High Risk (km2)0.00000.00000.0000
Total (km2)0.31830.31830.3183
Table 17. Inundation Risk Area Statistics by Retrofit Scenario under Combined Pipe Optimization and Permeable Pavement Strategy.
Risk LevelScenario 1Scenario 2Scenario 3
No Risk (km2)0.31200.31350.3125
Low Risk (km2)0.00620.00470.0056
Medium Risk (km2)0.00010.00010.0002
High Risk (km2)0.00000.00000.0000
Total (km2)0.31830.31830.3183
Disclaimer/Publisher’s Note: The statements, opinions and data contained in all publications are solely those of the individual author(s) and contributor(s) and not of MDPI and/or the editor(s). MDPI and/or the editor(s) disclaim responsibility for any injury to people or property resulting from any ideas, methods, instructions or products referred to in the content.