Abstract
Cropland abandonment, a global challenge, necessitates comprehensive monitoring to achieve the zero hunger goal. Prior monitoring approaches to cropland abandonment often face constraints in resolution, time series, drivers, prediction, or a combination of these. Here, we proposed an artificial intelligence framework to comprehensively monitor cropland abandonment and tested the framework in Hengyang City, China. Specifically, we first mapped land cover at 30 m resolution from 1985 to 2023 using Landsat, stable sample points, and a machine learning model. Subsequently, we constructed the extent, time, and frequency of cropland abandonment from 1986 to 2022 by analyzing pixel-level land-use trajectories. Finally, we quantified the drivers of cropland abandonment using machine learning models and predicted the spatial distribution of cropland abandonment risk from 2032 to 2062. Our results indicated that the abandonment maps achieved overall accuracies of 0.88 and 0.78 for identifying abandonment locations and timing, respectively. From 1986 to 2022, the proportion of cropland abandonment ranged between 0.15% and 4.06%, with an annual average abandonment rate of 1.32%. Additionally, the duration of abandonment varied from 2 to 38 years, averaging approximately 14 years, indicating widespread cropland abandonment in the study area. Furthermore, 62.99% of the abandoned cropland experienced abandonment once, 27.17% experienced it twice, and only 0.23% experienced it five times or more. Over 50% of cropland abandonment remained unreclaimed or reused. During the study period, tree cover, soil pH, soil total phosphorus, potential crop yield, and the multiresolution index of valley bottom flatness emerged as the five most important environmental covariates, with relative importances of 0.087, 0.074, 0.068, 0.050, and 0.043, respectively. Temporally, cropland abandonment in 1992 was influenced by transportation inaccessibility and low agricultural productivity, soil quality degradation became an additional factor by 2010, and synergistic effects of all three drivers were observed from 2012 to 2022. Notably, most cropland had a low abandonment risk (mean: 0.36), with only 0.37% exceeding 0.7, primarily distributed in transitional zones between cropland and non-cropland. Future risk predictions suggested a gradual decline in both risk values and the spatial extent of cropland abandonment from 2032 to 2062. In summary, we developed a comprehensive framework for monitoring cropland abandonment using artificial intelligence technology, which can be used in national or regional land-use policies, warning systems, and food security planning.
1. Introduction
Croplands serve as the cornerstone of global food security [1], yet over the past five decades, cropland abandonment has escalated into a pressing worldwide challenge, jeopardizing agricultural sustainability [2,3]. While estimates vary, satellite-based studies have revealed that approximately 79 million hectares of cropland were abandoned globally since 2003 and 101 million hectares since 1992 [4]. This phenomenon is particularly acute in Europe, Russia, Central and East Asia, and the Americas [4], with nations such as China, Chile, and Argentina experiencing pronounced abandonment rates. Aligned with the United Nations’ Sustainable Development Goals (SDGs)—specifically SDG 2 (zero hunger)—the systematic monitoring of cropland abandonment is imperative to mitigate its cascading impacts on food systems.
Despite its urgency, accurately mapping cropland abandonment remains technically complex, and standardized monitoring protocols are lacking. Current approaches predominantly employ statistical inference or remote sensing [5,6]. Statistical methods, including household surveys and field interviews [7,8], are constrained by high costs, limited spatial coverage, and an inability to resolve temporal dynamics. Conversely, remote sensing provides scalable and cost-efficient monitoring solutions. Two primary remote sensing strategies exist [9]: (1). the spectral-based detection of abandonment through time series satellite imagery, (2). multi-temporal land cover change analysis to track cropland transitions. The former approach is hindered by the spectral variability arising from post-abandonment ecological succession [5,10,11]. For example, abandoned croplands may evolve into grasslands or bare soil, generating spectral overlaps with fallow land and impeding accurate classification [12].
Land cover change detection addresses these limitations by capitalizing on temporal consistency and crop succession patterns, thereby reducing the misclassification risks associated with spectral ambiguities. However, this method faces two key challenges [5]: sensor resolution limitations and the need for annual training data. Coarse-resolution sensors (e.g., AVHRR or MODIS) often underestimate scattered abandonment due to pixel mixing [13], whereas medium-resolution sensors (e.g., Landsat and Sentinel) enable finer spatiotemporal monitoring. In addition, recent advances [9,14] in feature generalization allow the creation of annual land cover maps without repetitive training data collection. Two techniques are commonly used: (1). phenological normalization to harmonize inter-annual image differences, (2). stable sample-based classification leveraging spectral invariants across years. The former is impractical due to heterogeneous crop management practices, whereas the latter offers a viable solution by utilizing spectral similarity in stable land covers [6]. Importantly, this method also makes it easy to capture abandonment dynamics, including the initiation, termination, duration, and frequency—critical metrics for monitoring cropland abandonment [15].
Cropland abandonment is driven by regionally heterogeneous factors [2,3,7,16], including labor shortages, low agricultural productivity, soil quality degradation, inadequate infrastructure, policy changes, and socio-political instability. Traditional statistical analyses often oversimplify these interactions by assuming linear causality, neglecting the non-linear and synergistic nature of abandonment drivers [8,17,18]. Machine learning models, particularly when coupled with interpretability tools like Shapley additive explanations (SHAP), provide a powerful alternative. Machine learning models can unravel complex driver interactions, quantify variable importance, and predict abandonment risks—capabilities essential for sustainable land-use planning [4,10,19]. Despite emerging studies’ efforts leveraging existing land-use products [1], three critical limitations persist in current datasets [20]: (1). substantial discrepancies emerge in both quantitative estimates and spatial delineations of agricultural land, particularly across heterogeneous landscapes; (2). marked inconsistencies exist in fundamental methodological approaches, including data provenance and classification schemas; (3). a notable absence of comparative analyses evaluating performance differentials among machine learning architectures. These collective limitations present significant challenges for the robust characterization of spatiotemporal patterns in cropland abandonment and impede comprehensive investigations into its underlying drivers.
China epitomizes the global cropland abandonment crisis, with hilly and mountainous regions being disproportionately affected [3,21]. These areas contend with dual pressures of ecological vulnerability and rural–urban migration, undermining national initiatives to enforce cropland protection policies. To address this challenge, we developed an artificial intelligence-driven framework for comprehensive abandonment monitoring, using Hengyang City—a representative hilly region in China—as a case study. Our objectives are threefold: (1) to map spatiotemporal abandonment patterns from 1985 to 2023, (2) to quantify drivers using interpretable machine learning, (3) to predict current and future abandonment risks. This work advances methodological frameworks for global cropland monitoring, particularly in regions with complex terrain.
2. Materials and Methods
2.1. Artificial Intelligence Framework
Figure 1 illustrates the proposed artificial intelligence-driven framework. The workflow comprises four key phases: (1). Multi-source data integration: We aggregated heterogeneous datasets including remote sensing imagery, land-use products, and environmental covariates. (2). Stable sample construction: Leveraging Landsat imagery, Google Earth data, and existing land-use products, we established stable sampling points across land-use categories. Each sampling point underwent rigorous validation through Normalized Difference Vegetation Index (NDVI), Normalized Difference Moisture Index (NDMI), and Enhanced Vegetation Index (EVI) trend analyses, supplemented by manual verification via high-resolution Google Earth imagery. (3). Feature extraction and classification: Topographic, spectral, textural, and phenological features were extracted from stable samples. These features were processed using Google Earth Engine and its embedded machine learning model to generate annual land cover maps (1985–2023). Temporal consistency checks were implemented to minimize classification errors. (4). Cropland abandonment analysis: Python 3-based algorithms identified abandonment events based on predefined criteria (≥2 years of non-use) and crop succession patterns, delineating the information on the initiation, termination, duration, and frequency of cropland abandonment. Validation was performed using stratified random sampling of abandoned/non-abandoned plots. Finally, machine learning models coupled with the SHAP framework quantified abandonment drivers and projected historical/future risks. This framework enhances land-use management and supports global food security initiatives.
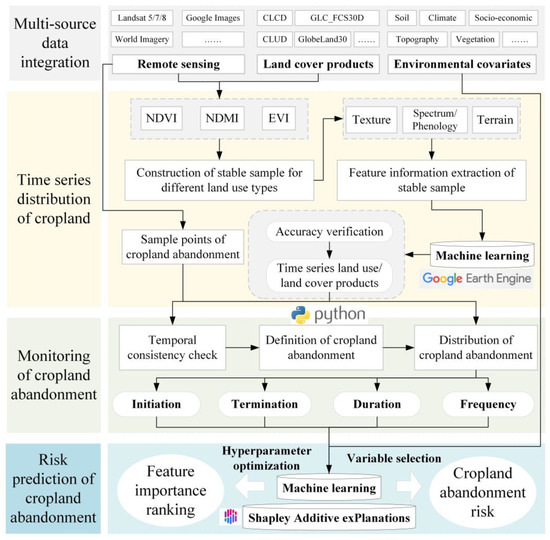
Figure 1.
Artificial intelligence framework for comprehensive monitoring of cropland abandonment.
2.2. Data Sources and Preprocessing
The data sources in this study mainly include remote sensing data, feature engineering data, land cover datasets, and environmental covariates. Among them, remote sensing data, including Landsat-5 TM, Landsat-7 ETM+, Landsat-8 OLI, and Landsat-9 OLI images, were preprocessed on the Google Earth Engine platform. Standardized workflows included radiometric calibration, atmospheric correction, and geometric rectification. To mitigate cloud contamination, the bitmask algorithm was applied to mask cloudy pixels. Annual composite images (1985–2023) were generated through the median value synthesis of all available cloud-free scenes. Surface reflectance conversion utilized sensor-specific scaling factors and offsets to minimize spectral variability. In addition, we derived eighteen variables annually for feature engineering [7,14,22,23], including six spectral features of blue, green, red, NIR, SWIR1, and SWIR2; four textural metrics of the gray level co-occurrence matrix as contrast, correlation, homogeneity, and entropy; five vegetation indicators of NDVI, NDMI, EVI, modified normalized difference water index, and normalized difference built-up index; and three topographic parameters of elevation, slope, and aspect. The calculation formulas for all vegetation indices are provided in the Supplementary Text.
Six land cover datasets, including CNLUCC, CLCD, CACD, GlobeLand30, ESRI10, and SinoLC_1, were harmonized for sample generation. Among them, CNLUCC [24] comprises 30 m resolution Chinese land-use maps (1980–2020; 5-year intervals), CLCD [22] comprises 30 m annual land cover maps of China (1985–2022), CACD [25] comprises a 30 m cropland-specific dataset in China (1986–2021), GlobeLand30 [26] comprises 30 m global land cover maps (2000, 2010, 2020), ESRI10 [27] comprises a 10 m global land cover product (2017–2022), and SinoLC_1 [28] comprises a 1 m high-resolution land cover map of China (2023). All datasets except CACD were reclassified into six standardized categories (cropland, forest, grassland, water, impervious, and barren) at 30 m resolution (Table S1). In addition, thirty-seven spatiotemporal variables influencing abandonment were collected, including socio-economic, climatic, topographic, and edaphic factors. Table 1 lists the variables, abbreviations, periods, resolutions, and data sources of all environmental covariates. To ensure spatial and temporal consistency across all explanatory variables and to align with the 30 m resolution of our land cover maps, a standardized preprocessing workflow was applied: (1) Spatial resolution harmonization: All covariates with a native resolution coarser than 30 m (e.g., 1 km climate and soil data) were resampled to 30 m using bilinear interpolation. (2) Temporal gap-filling: For datasets with missing data in certain years (e.g., gaps in real GDP data), we implemented a nearest year gap-filling approach. (3) Treatment of temporally invariant variables: Topographic variables derived from the digital elevation model, such as slope, aspect, and curvature, were treated as temporally invariant over the study period (1985–2023). These procedures ensured that each pixel–year combination in our spatiotemporal dataset had a complete set of predictor variables, thereby maintaining the integrity and stability of the subsequent machine learning analyses.

Table 1.
Environmental covariates used for spatiotemporal mapping in the study area.
2.3. Study Area and Construction of Stable Sample
The study area is located in Hengyang City, a major grain-producing region in central southern Hunan Province, China (Figure S1a). Encompassing 15,310 km2, this area serves as a national commercial grain base, with primary crops including rice, legumes, vegetables, and oilseeds. Accelerated urbanization and rural labor migration have triggered cropland abandonment [38], exacerbated by recurrent seasonal droughts and floods. Topographically, the elevation ranges from 39 m to 1300 m, with mountainous and hilly terrain constituting 48% of the total area. This geomorphology typifies China’s hilly regions, making Hengyang an ideal case study for analyzing abandonment trends in similar landscapes.
To construct stable samples for annual land cover mapping (1985–2023), we implemented a four-step protocol: (1). Original sample construction: Over 2000 sample points were manually constructed based on Google Earth Engine and field surveys. (2). The construction of unchanged land-use areas: Cropland, forest, grassland, water, impervious, and barren areas were extracted from six harmonized datasets, CNLUCC, GlobeLand30, ESRI10, SinoLC_1, CLCD, and CACD; the spatial intersections of land cover types across datasets were identified through iterative masking. (3). Cross analysis: Extracting potential stable samples based on original sample points and unchanged land-use areas. (4). Validation: Samples were verified using 0.49 m resolution Google Earth imagery, LandTrendr temporal profiles in Google Earth Engine, and field investigation. NDVI, NDMI, and EVI trends were analyzed via the Mann–Kendall test. For instance, a sample was confirmed as forest if its NDVI trajectory matched known forest phenology. To construct a final dataset that was both accurate and balanced, we implemented a two-tiered strategy for sample quantity control. For classes exceeding the target sample size (~150): If the number of validated points for a class (e.g., cropland) was larger than the target, we performed spatial random sampling to select exactly 150 points. For classes falling below the target sample size: If the removal of non-conforming points caused a class’s sample size to drop below the target, we actively returned to the pool of “unchanged land-use areas” to select new candidate points for that specific class. It should be noted that we are not using existing data products to directly generate stable samples, but rather to rapidly identify land-use types that have remained largely unchanged over the past three decades. The final dataset comprised 881 stable samples annually: 150 points each for cropland, forest, grassland, water, and impervious, and 131 for barren (Figure S1b).
2.4. Identification and Accuracy Assessment of Cropland Abandonment
Cropland abandonment [19] was defined as the conversion of cropland to natural vegetation (grassland, forest, or barren), excluding transitions to impervious or water areas (which were classified as occupied). Aligning with prior studies [3,15,16,17,39], we operationalized abandonment as ≥2 consecutive years of non-agricultural use. This conservative threshold enhances cross-study comparability and avoids overestimation from short-term fallowing (typically ≤1 year in China). In addition, a sliding window approach (3-year window, 1-year step) was applied to Landsat-derived land cover data (1985–2023) to suppress spurious changes. During this process, land cover classes were encoded into three types: a represents cropland, b represents natural vegetation, and c represents impervious and water. For each window, if the central pixel’s class (“a”, “b”, or “c”) occurred ≥2 times, it retained its original classification. Otherwise, adjacent pixels within the window determined the central pixel’s class. In the latter case, if flanking pixels differed, the central pixel remained unchanged, and if flanking pixels matched, the central pixel adopted their class. The detailed process can be found in previous studies [6,21,40].
In abandonment detection, a pixel was flagged as abandoned if it transitioned from “a” to “b” and persisted as “b” for ≥2 subsequent years. Recurrent abandonment events within the study period were counted as frequency, with the initiation year marked at the first “b” occurrence and the termination year at the last “b” (or labeled “unending” if ongoing in 2023). Total “b” persistence defined abandonment duration. To evaluate the spatial accuracy of cropland abandonment, 740 samples (370 abandoned, 370 non-abandoned) were randomly selected for confusion matrix analysis (Figure S1c). For temporal accuracy, we manually annotated the abandonment initiation year using high-resolution Google Earth time series and Landsat spectral indices. These were aggregated into 3-year intervals (e.g., 1986–1988), with approximately 50 samples per interval (n = 1817), including 1447 abandoned and 370 non-abandoned areas (Figure S1d). Based on the above samples, we assessed their accuracy by calculating the overall accuracy (OA) and Kappa coefficient.
2.5. Machine Learning Models and Accuracy Assessment
To evaluate the performance of machine learning algorithms in cropland abandonment mapping, we implemented six widely used models [5,7,10,15]: Logistic Regression (LR), Support Vector Classification (SVC), K-Nearest Neighbors (KNN), eXtreme Gradient Boosting (XGBoost), Categorical Boosting (CatBoost), and Random Forest (RF). Technical descriptions of these algorithms are provided in the Supplementary Text. Building on prior studies [41,42], we addressed three key machine learning challenges—feature selection, hyperparameter optimization, and model interpretability—through a systematic workflow: (1). Feature importance screening: A preliminary RF model with default parameters identified the top 20 environmental covariates from thirty-seven candidate variables (Table 1) to mitigate overfitting risks. (2). Hyperparameter tuning: Grid search with 3-fold cross-validation-optimized critical parameters (Table S2), balancing model accuracy and computational efficiency. (3). Model interpretation: The SHAP framework [43] quantified covariate contributions to abandonment predictions.
For model training, we constructed a balanced dataset comprising 2000 samples (50% abandoned, 50% non-abandoned) extracted from spatiotemporally consistent cropland masks (1985–2023) or abandonment results (1986–2022). The dataset was partitioned into 70% training and 30% testing sets. Model selection prioritized the area under the curve (AUC) and Kappa metrics. Notably, temporal land cover mapping exclusively employed RF due to its robustness with limited features (n = 20). Using 617 stable samples for training and 264 for validation, we achieved temporally consistent classifications evaluated through OA, producer’s accuracy (PA), user’s accuracy (UA), and the Kappa coefficient. By randomly and uniformly selecting 20,000 points (Figure S1e), our dataset reliability was also validated with existing data products such as CNLUCC, GlobeLand30, ESRI10, SinoLC_1, CLCD, and CACD. For future risk projection, a Long Short-Term Memory (LSTM) [44] network was trained on temporal pixel sequences (70% training, 30% testing). Performance was assessed using the coefficient of determination (R2) and root mean square error (RMSE). The calculation formulas for the specific evaluation indicators mentioned above have been explained in detail in previous studies [41,42].
3. Results
3.1. Spatiotemporal Evolution of Cropland
The annual land cover classification achieved OA values of 0.83–0.98 and Kappa coefficients of 0.78–0.97 (Figure 2), demonstrating high consistency. The minimum accuracy occurred in 1986 (OA = 0.83, Kappa = 0.78), peaking in 2018 (OA = 0.98, Kappa = 0.97). From 1985 to 2023, over 50% of years had an OA greater than 0.9, and years below 0.9 were usually before 2000—a pattern mirrored in Kappa trends. The classification accuracy analysis across land cover categories (Figure S2) revealed significant variations in both PA and UA. Cropland demonstrated the highest classification reliability, with PA values ranging between 0.96 and 1.00 and UA values of 0.91–1.00. This was followed by forest and impervious (PA/UA: 0.85–1.00), with water and grassland showing moderate accuracy levels (PA/UA: 0.62–1.00). Barren exhibited the lowest and most variable performance metrics, displaying PA values of 0.21–1.00 and UA values of 0.40–1.00. Overall, PA and UA for different land cover classifications from 1985 to 2023 were typically above 0.8. Inter-dataset comparisons showed moderate-to-strong agreement with existing products (Kappa = 0.44–0.70; OA = 0.65–0.83), with high consistency in cropland, forest, and impervious areas (Figure S3). Notably, our cropland area estimates exhibited significantly lower overestimation (vs. official statistics) compared with CACD (Figure S4). Spatiotemporally, cropland area fluctuated with an overall 4.73% increase (1985–2023), peaking in 2005 and reaching a minimum in 1989 (Figure 2). Spatial patterns aligned with regional topography and socio-economic gradients (Figure 3), confirming the robustness of our classification framework.
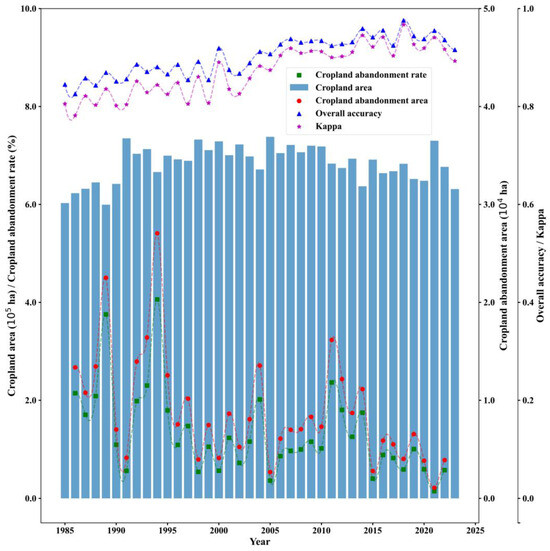
Figure 2.
Cropland and abandoned areas and rates from 1985 to 2023.
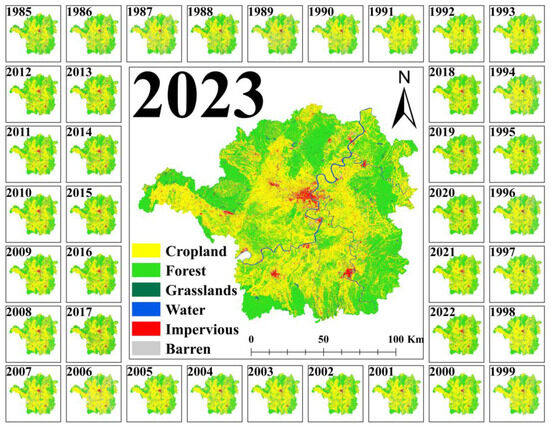
Figure 3.
Land cover from 1985 to 2023 in the study area.
3.2. Spatiotemporal Distribution of Cropland Abandonment
Our abandonment maps demonstrated a robust performance, with an OA of 0.88 and Kappa coefficient of 0.76 for distinguishing abandoned versus non-abandoned cropland over the study period (Table S3). The temporal accuracy indicated that the OA and Kappa were 0.78 and 0.52, respectively. However, the temporal accuracy varied annually, yielding OA and Kappa ranges of 0.61–0.93 and 0.30–0.83, respectively. Notably, the OA of most periods exceeds 0.80, confirming reliable temporal monitoring (Figure S5). Spatiotemporally, cropland abandonment constituted a prevalent land-use transition, with 330,151 hectares (52.29% of 2023 cropland area) abandoned cumulatively—equivalent to an annual average of 8923 hectares. Annual abandonment rates fluctuated between 0.15% and 4.06% from 1986 to 2022, averaging 1.32%. For example, the abandonment rate increased between 1991 and 1994 and decreased between 1994 and 1996. Similarly, the abandonment rate increased from 2002 to 2004 and decreased in 2005. Overall, it showed a fluctuating downward trend with increasing years, indicating that the phenomenon of abandonment has been alleviated. Peak abandonment occurred in 1994 (27,047 ha) and 1989 (22,512 ha), with their cropland abandonment accounting for as much as 4.06% and 3.75%, respectively, while minima were observed in 2021 (0.15%), 2005 (0.36%), and 2015 (0.40%).
Geographically, abandonment clustered in southern and northwestern regions (Hengnan County, Leiyang City, Hengyang County, and Changning City), with plains exhibiting higher abandonment rates (65.24%) compared with hilly (22.75%) and mountainous areas (12.01%) (Table S4). The slope analysis revealed that 49% of abandoned croplands occurred on slopes > 6° (Table S5). In addition, abandonment initiation years predominantly preceded 2002, with sporadic occurrences post 2007 limited to southern areas (Figure 4). Over 50% of abandoned cropland remained unrestored by 2023. The duration analysis showed abandonment persisting for 2–38 years (mean = 14 years), with 43.73% of areas abandoned <10 years and 26.57% > 20 years (Figure S6). Frequency mapping revealed 1–8 abandonment events per pixel, where single abandonment dominated (62.99%), followed by double (27.17%) and ≥5 events (0.23%).
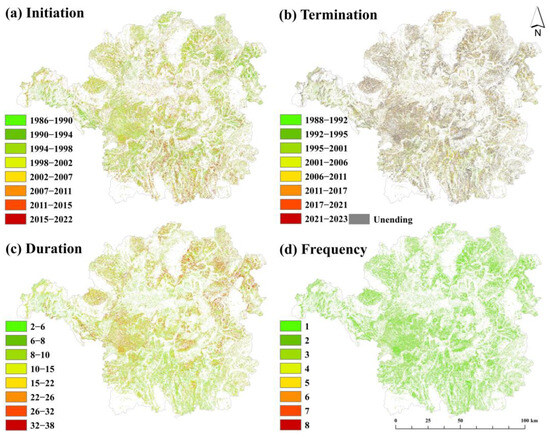
Figure 4.
Spatiotemporal distribution of cropland abandonment for (a) Initiation; (b) Termination; (c) Duration; and (d) Frequency.
3.3. Spatiotemporal Drivers of Cropland Abandonment
The model performance evaluation identified RF as the optimal algorithm, achieving training/test set AUC values of 0.98/0.91 and Kappa coefficients of 0.84/0.62, respectively (Figure 5; Figure S7). XGBoost and CatBoost performed comparably, while KNN, LR, and SVC underperformed. Notably, XGBoost demonstrated a comparable performance with RF, achieving a marginally higher test set Kappa coefficient (0.65 vs. 0.62) while maintaining a similar prediction accuracy. The spatiotemporal patterns of cropland abandonment risk were systematically mapped using an RF model across multiple temporal scales (1992–2022). Notably, we analyzed changes across four periods at decadal intervals, including the most recent year 2022 and the preceding decades’ starting years: 1992, 2002, and 2012. Our results revealed the model’s robust temporal generalizability, with training set Kappa coefficients maintaining substantial agreement levels (0.75–0.87) and test set metrics consistently exceeding moderate reliability thresholds (0.63–0.75).
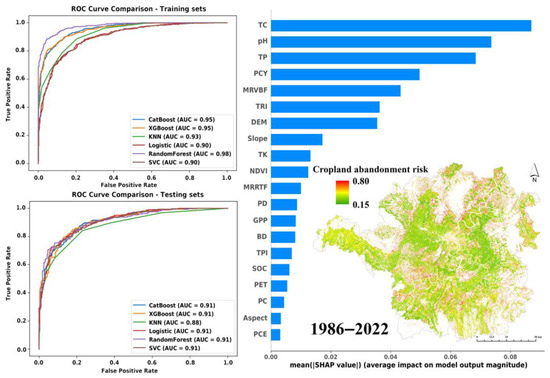
Figure 5.
Driving mechanisms and risk values of cropland abandonment from 1986 to 2022 (TC represents tree cover; TP represents soil total phosphorus; PCY represents potential crop yield; MRVBF represents multiresolution index of valley bottom flatness; TRI represents terrain ruggedness index; DEM represents digital elevation model; TK represents soil total potassium; NDVI represents Normalized Difference Vegetation Index; MRRTF represents multiresolution index of ridge top flatness; PD represents population density; GPP represents gross primary productivity; BD represents soil bulk density; TPI represents topographic position index; SOC represents soil organic carbon; PET represents potential evapotranspiration; PC represents plan curvature; PCE represents profile curvature).
Employing an integrated RF and SHAP framework, we systematically quantified the temporal dynamics of environmental determinants influencing cropland abandonment across the study period (Figure 6). During the entire study period (1986–2022), tree cover (TC), soil pH, soil total phosphorus (TP), potential crop yield (PCY), and the multiresolution index of valley bottom flatness (MRVBF) were identified as the five most influential environmental covariates, with SHAP values of 0.087, 0.074, 0.068, 0.050, and 0.043, respectively. In this study, these determinants can be categorized into three clusters: transportation inaccessibility (TC, MRVBF), soil quality degradation (pH, TP), and low agricultural productivity (PCY). The dominant environmental covariates demonstrated temporal variations across different study periods. In 1992, the dominant covariates were TC, PCY, MRVBF, slope, and annual minimum temperature, indicating that transportation inaccessibility and low agricultural productivity were the main factors. In 2002, they evolved into pH, TC, TP, digital elevation model (DEM), and PCY, indicating that they increased the impact of soil quality degradation compared with 1992. Similarly to the influencing factors throughout the global period, the five most important environmental covariates became TC, pH, TP, MRVBF, and PCY in 2012. In addition, DEM, TC, TP, MRVBF, and PCY were the five most important environmental covariates in 2022, indicating that cropland abandonment was affected by the synergistic effects of transportation inaccessibility, soil quality degradation, and low agricultural productivity, but the impact of transportation inaccessibility was increasing. These findings underscore the evolving interplay of biophysical and socio-economic drivers in shaping abandonment patterns.
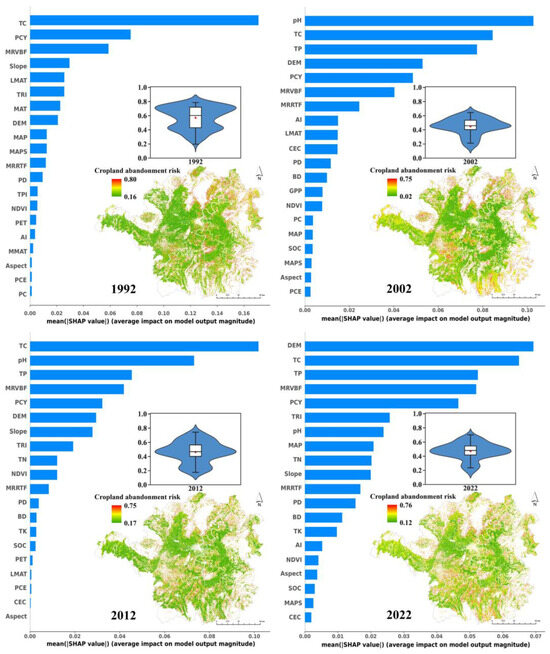
Figure 6.
Driving mechanisms and risk values of cropland abandonment during four typical periods (TC represents tree cover; PCY represents potential crop yield; MRVBF represents multiresolution index of valley bottom flatness; LMAT represents annual minimum temperature; TRI represents terrain ruggedness index; MAT represents mean annual temperature; DEM represents digital elevation model; MAP represents mean annual precipitation; MAPS represents mean annual press; MRRTF represents multiresolution index of ridge top flatness; PD represents population density; TPI represents topographic position index; NDVI represents Normalized Difference Vegetation Index; PET represents potential evapotranspiration; AI represents aridity index; MMAT represents annual highest temperature; PCE represents profile curvature; PC represents plan curvature; TP represents soil total phosphorus; CEC represents cation exchange capacity; BD represents soil bulk density; GPP represents gross primary productivity; SOC represents soil organic carbon; TN represents soil total nitrogen; TK represents soil total potassium).
3.4. Prediction of Cropland Abandonment Risk
Using the RF model and the top 20 environmental covariates, we predicted the cropland abandonment risk in the study area from 1986 to 2022. The risk value (ranging from 0 to 1) reflects the probability of abandonment, with higher values indicating a greater likelihood. Figure 5 demonstrated that most cropland exhibited a low abandonment risk, with an average value of 0.36 (Table S6). Only 0.37% of cropland showed a high risk (>0.7), primarily located in transitional zones between cropland and non-cropland. Annual risk predictions from 1992 to 2022 revealed spatial–temporal variations (Figure 6). For instance, high-risk areas in 1992 were concentrated in the northeast, expanded southwestward and southeastward by 2002, and became more dispersed with reduced intensity by 2012. Notably, scattered regions in 2022 exhibited rising risk values. However, low risk values (e.g., <0.4) do not guarantee immunity from abandonment, as approximately 30% of actual abandoned plots fell within this range. This underscores the complexity of abandonment dynamics, particularly the influence of sudden factors (e.g., extreme weather, policy shifts) not fully captured by the model.
To forecast future trends, we developed an LSTM model using 1992–2012 risk data as the input and 2022 data as the target, with 1% grid sampling. The model achieved a robust performance (Figure S8): test set metrics included R2 = 0.68 and RMSE = 0.11, while training set results were slightly better, indicating a reliable predictive performance. Projections for 2032–2062 (Figure 7) show a consistent decline in abandonment risk. In 2032, the average risk decreased to 0.29, with high-risk zones (0.35–0.45) reduced in extent. By 2042, high-risk areas further narrowed (0.30–0.35), and average values remained stable. Subsequent decades saw significant reductions: average risks dropped to 0.25 in 2052 and 0.18 in 2062, with high-risk zones confined to values below 0.3. These projections suggest the substantial mitigation of abandonment risks over time in the study area.
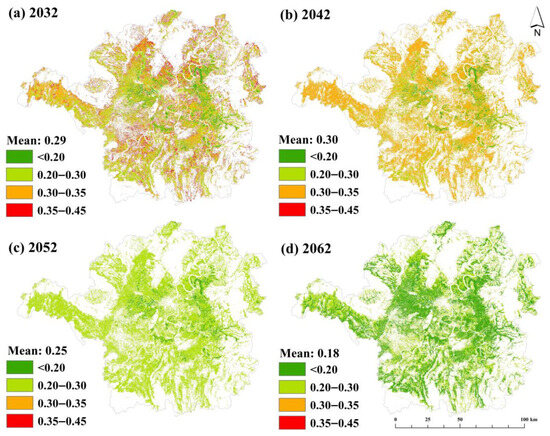
Figure 7.
Risk prediction of cropland abandonment for (a) 2032; (b) 2042; (c) 2052 and (d) 2062.
4. Discussion
In this study, we proposed an artificial intelligence framework for the comprehensive monitoring of cropland abandonment by integrating multi-source remote sensing data, multiple platforms, and models. This framework systematically elucidates the spatiotemporal distribution patterns and driving mechanisms of cropland abandonment in the study area from 1986 to 2022, while simulating the evolutionary characteristics of abandonment risks over the next 40 years. Our contributions are highlighted in the following aspects.
First, our framework enables the high-resolution spatiotemporal mapping of cropland at 30 m resolution. To achieve annual cropland classification, we developed a semi-automatic method to generate stable sample points as training data for each year. This approach significantly improves the efficiency of sample collection, which is traditionally a labor-intensive step in cropland classification [6,11,14]. The classification accuracy of our method surpasses that of mainstream land cover products, particularly in distinguishing cropland categories. This demonstrates the capability of our method to acquire high-quality samples efficiently, addressing challenges related to historical data scarcity and providing insights for constructing consistent training datasets at national or global scales. Notably, previous studies [45,46,47] often assumed inter-annual stability in spectral reflectance and phenology, overlooking significant variations influenced by regional factors, crop types, land-use intensity, and climate [39,48,49]. Our method resolves this limitation by annually updating a Random Forest model using stable sample points and their feature data, thereby eliminating the reliance on prior assumptions and enhancing adaptability. Furthermore, the integration of multi-source satellite data (e.g., Landsat) via Google Earth Engine allows access to long-term, high-resolution imagery at minimal cost, overcoming the constraints of the coarse spatiotemporal resolution in historical datasets.
Second, our framework provides a robust approach for monitoring cropland abandonment. Unlike studies [19,50] relying on phenological thresholds, our method—which is critical for large-scale mapping—identifies abandonment through inter-annual land cover trajectories and a sliding window analysis, circumventing the need for the arbitrary change magnitude thresholds of other classes. Earlier studies faced limitations due to coarse-resolution data [19,51], sparse temporal coverage [5,52], or insufficient causal analysis [6,39]. For instance, coarse-resolution pixels often mask small-scale cropland changes [13]; though Landsat’s 30 m resolution mitigates this issue. By analyzing land cover trajectories derived from annual maps, we identified key abandonment periods in the study area. For example, abandonment rates rose continuously from 1987 to 1989, coinciding with China’s economic reforms and the shift in rural labor to non-agricultural sectors [17]. A subsequent surge from 1991 to 1994 aligned with accelerated urbanization. Between 2002 and 2004, abandonment increased due to reforestation policies but declined after 2004 [23], when agricultural tax abolition revitalized farming incentives. A temporary rise from 2015 to 2016 likely reflects updated reforestation guidelines approved in 2014 [51]. In general, our land cover classification exhibited high accuracy for cropland, forest, and impervious surfaces, but performance for barren lands was notably lower and more variable. This is a common challenge in remote sensing-based classifications, as barren areas often exhibit spectral similarity to fallow cropland, especially in arid or semi-arid regions where soil exposure is frequent. In the study area, barren lands constitute a minor proportion of the landscape, and their confusion with abandoned cropland is limited due to the dominance of vegetation succession patterns.
Third, our analysis reveals that cropland abandonment rates in the study area averaged 1.32% annually (0.15–4.06%) from 1986 to 2022—lower than China’s national average (3.68–6.89%) [51] but comparable to rates in the southern Jiangsu economic zone (0.4–8.5%) [17] and Yangtze River Basin (0.68–3.0%) [39]. Crucially, definitional variations in “cropland abandonment” significantly influence rate comparability. For instance, studies [6,10] defining abandonment as 3–5 years of non-use in mountainous regions reported rates of 21.84–28.71%, far exceeding our findings. The temporal dimension of abandonment also exhibits definitional sensitivity; while national or regional studies [16,21,39] suggest that 19–28% of cropland experienced at least one abandonment episode (slightly below our 30.73% finding), our observed mean abandonment duration (14 years) aligns with global averages [53], underscoring methodological consistency. These comparative analyses not only highlight the critical role of operational definitions in abandonment research but also validate the spatial–temporal rationality of our results.
Fourth, our results identified three primary drivers of cropland abandonment in the study area: transportation inaccessibility, soil quality degradation, and low agricultural productivity. Variables such as terrain complexity (TC, MRVBF, DEM), agricultural productivity (PCY), and soil properties (pH, TP, TK) are critical determinants. These findings corroborate prior studies [18,40,52], highlighting that abandonment predominantly occurs in areas with challenging terrain, inadequate infrastructure, and low soil fertility. Notably, the relative importance of environmental variables exhibits temporal dynamics. Historically, farmers preferentially abandoned plots with low agricultural potential due to diminished economic returns. However, post-2000 agricultural mechanization in China intensified terrain-mediated constraints—slopes exceeding 6° (containing 49% of abandoned parcels) substantially increased machinery operation costs and infrastructure maintenance difficulties. This topographic barrier reduces cropland connectivity and elevates labor inputs compared with flat terrain, creating compounding effects on soil degradation and cultivation efficiency. Although not directly modeled, labor scarcity emerges as a critical amplifier through two pathways: (1). Rural–urban migration during 2002–2013 caused an average annual decline of 11.33 million in agricultural labor availability. (2). Residual labor was preferentially allocated to accessible plots, leaving marginal lands (0.2–1.2 acres/household) disproportionately abandoned [38]. This dual mechanism explains why transportation inaccessibility transitioned from secondary to primary abandonment drivers in the mechanization era. Furthermore, dynamic socio-economic factors such as population migration, changes in population density, distance to major roads or cities, and policy shifts significantly modulated the spatiotemporal patterns of cropland abandonment. For instance, a declining population density directly reduced the supply of agricultural labor, while remote areas with high transportation costs and low market accessibility were more prone to abandonment. Policy changes, such as the introduction of agricultural subsidies, land reform, or urbanization policies, also directly influenced farmers’ decisions by altering economic incentives, interacting with environmental drivers to collectively shape abandonment risks. In general, our findings corroborate national-scale studies [3,54,55] demonstrating that terrain complexity and labor scarcity increase abandonment likelihood. In addition, our framework not only evaluates historical risks but also provides forward-looking predictions, addressing a critical gap in existing studies [55,56]. The predicted decline in abandonment aligns with China’s stringent cropland protection policies, notably the “1.8 billion mu cropland red line” (implemented since 2009) and the 2019 cropland balance policy. These measures have effectively curbed non-agricultural land conversion and have driven the observed downward trend in abandonment rates. By integrating multi-temporal data and machine learning, this framework offers a scalable tool for proactive land management, supporting global efforts to balance agricultural sustainability and urbanization pressures.
Despite the robust performance of our AI-driven framework, several limitations and application challenges should be acknowledged. First, the definition of cropland abandonment remains challenging. While a threshold of two or more years of non-use was adopted to minimize the inclusion of short-term fallowing—a practice uncommon in our study region—this criterion may not be directly transferable to areas with prevalent shifting cultivation or seasonal fallowing (e.g., parts of Southeast Asia or Sub-Saharan Africa), where it could lead to overestimation. Second, the 30 m spatial resolution of Landsat data introduces mixed-pixel effects, particularly in landscapes with small and fragmented cropland parcels, which may limit the detection of sub-pixel changes. Third, the framework relies on a limited set of manually curated samples for model training; although rigorously validated, mislabeled samples could propagate errors across the time series. Moreover, when applied in data-scarce regions (e.g., parts of Africa or South America) or socio-economically distinct contexts (e.g., post-Soviet or conflict-affected zones), the method may face additional constraints related to the availability of high-resolution reference data or the relevance of dominant drivers (e.g., labor migration vs. land tenure issues). Nevertheless, the core components of our approach—Landsat-based annual mapping, trajectory-based abandonment detection, and SHAP-enhanced interpretability—remain inherently transferable. We emphasize that the local calibration of definitions, feature sets, and sampling strategies will be essential to ensure a robust performance across diverse geographical and socio-economic settings.
5. Conclusions
In this study, we integrated multi-source remote sensing data (e.g., Landsat, Google Earth imagery) and machine learning models (e.g., RF, LSTM) to monitor cropland abandonment. By generating stable annual sample points, we streamlined land cover classification and employed a sliding window method to identify abandonment timing, location, and frequency. Our abandonment maps demonstrated a robust performance, with an OA of 0.88 and a Kappa coefficient of 0.76 for distinguishing abandoned versus non-abandoned cropland over the study period. Our results also revealed that cropland abandonment shows a widespread yet fluctuating downward trend over time. This trend aligns with China’s stringent cropland protection policies, such as the “1.8 billion mu cropland red line” and the cropland balance system, which have mitigated non-agricultural land conversion. These findings underscore the framework’s potential to support long-term cropland conservation, enhance food security, and inform global studies on spatiotemporal patterns and drivers of abandonment. Overall, the proposed framework offers a scalable and adaptable tool for advancing cropland monitoring efforts worldwide.
Supplementary Materials
The following supporting information can be downloaded at: https://www.mdpi.com/article/10.3390/land14101984/s1, Figure S1: Location of the study area (a), land cover samples (b), abandoned and non-abandoned samples (c), samples of abandonment year detection (d), and grid sample points (e); Figure S2: Accuracy of producers and users based on Random Forest models for different land cover types in the study area from 1985 to 2023; Figure S3: Confusion matrix between land cover in this study (LU2020 and LU2022) and several widely used land cover products (CNLUCC, GlobeLand30, ESRI10, SinoLC_1, and CLCD); Figure S4: Cropland area comparison and differences between our land cover data and CACD; Figure S5: Overall accuracy and Kappa coefficient for the timing of cropland abandonment in the study area; Figure S6: The proportion of the initiation year, termination year, duration year, and frequency of cropland abandonment; Figure S7: Kappa values of training and testing sets for different machine learning models and different time periods; Figure S8: Prediction of scatter plots using the training and testing sets of the Long Short-Term Memory network model; Table S1: Transformation rules of different land cover products; Table S2: Different model hyperparameter settings based on grid search method; Table S3: Spatial and temporal accuracy of cropland abandonment; Table S4: Proportion of cropland abandonment under different landforms; Table S5: Proportion of cropland abandonment under different slopes; Table S6: Proportion of the risk range of cropland abandonment based on Random Forest model from 1986 to 2022 (average value 0.36); Supplementary Text. Technical descriptions of the algorithm and formula.
Author Contributions
Conceptualization, Y.J.; methodology, Y.J.; software, Y.J.; validation, Y.J.; formal analysis, Y.J.; investigation, Y.J.; resources, Y.J.; data curation, Y.J.; writing—original draft preparation, Y.J.; writing—review and editing, Y.J. and Z.G.; visualization, Y.J.; supervision, Y.J.; project administration, Y.J.; and funding acquisition, Y.J. and Z.G. All authors have read and agreed to the published version of the manuscript.
Funding
This work was supported by the Strategic Priority Research Program of Chinese Academy of Sciences (XDA0440404).
Data Availability Statement
The data that support the findings of this study are available from the corresponding author upon reasonable request.
Conflicts of Interest
The authors declare no conflicts of interest.
References
- Wu, X.R.; Zhao, N.; Wang, Y.W.; Ye, Y.L.; Wang, W.; Yue, T.X.; Zhang, L.Q.; Liu, Y.S. The potential role of abandoned cropland for food security in China. Resour. Conserv. Recycl. 2025, 212, 108004. [Google Scholar] [CrossRef]
- Olsen, V.M.; Fensholt, R.; Olofsson, P.; Bonifacio, R.; Butsic, V.; Druce, D.; Ray, D.; Prishchepov, A.V. The impact of conflict-driven cropland abandonment on food insecurity in South Sudan revealed using satellite remote sensing. Nat. Food 2021, 2, 990–996. [Google Scholar] [CrossRef] [PubMed]
- Guo, A.D.; Yue, W.Z.; Yang, J.; Xue, B.; Xiao, W.; Li, M.M.; He, T.T.; Zhang, M.X.; Jin, X.; Zhou, Q.S. Cropland abandonment in China: Patterns, drivers, and implications for food security. J. Clean. Prod. 2023, 418, 138154. [Google Scholar] [CrossRef]
- Zheng, Q.M.; Ha, T.; Prishchepov, A.V.; Zeng, Y.W.; Yin, H.; Koh, L.P. The neglected role of abandoned cropland in supporting both food security and climate change mitigation. Nat. Commun. 2023, 14, 6083. [Google Scholar] [CrossRef] [PubMed]
- Jiang, Y.L.; He, X.K.; Yin, X.G.; Chen, F. The pattern of abandoned cropland and its productivity potential in China: A four-years continuous study. Sci. Total Environ. 2023, 870, 161928. [Google Scholar] [CrossRef]
- Wang, J.; Guan, Y.J.; Wang, H.Y.; Zhou, W. Identifying and monitoring of abandoned farmland in key agricultural production areas on the Qinghai-Tibet Plateau: A case study of the Huangshui Basin. J. Environ. Manag. 2024, 354, 120380. [Google Scholar] [CrossRef]
- Hong, C.Q.; Prishchepov, A.V.; Jin, X.B.; Han, B.; Lin, J.H.; Liu, J.P.; Ren, J.; Zhou, Y.K. The role of harmonized Landsat Sentinel-2 (HLS) products to reveal multiple trajectories and determinants of cropland abandonment in subtropical mountainous areas. J. Environ. Manag. 2023, 336, 117621. [Google Scholar] [CrossRef]
- Wang, Y.H.; Yang, A.X.; Yang, Q.Y. The extent, drivers and production loss of farmland abandonment in China: Evidence from a spatiotemporal analysis of farm households survey. J. Clean. Prod. 2023, 414, 137772. [Google Scholar] [CrossRef]
- Yin, H.; Brandao, A.; Buchner, J.; Helmers, D.; Iuliano, B.G.; Kimambo, N.E.; Lewinska, K.E.; Razenkova, E.; Rizayeva, A.; Rogova, N.; et al. Monitoring cropland abandonment with Landsat time series. Remote Sens. Environ. 2020, 246, 111873. [Google Scholar] [CrossRef]
- Guo, Y.C.; Song, W. Spatial distribution and simulation of cropland abandonment in Wushan County, Chongqing, China. Sustainability 2019, 11, 1367. [Google Scholar] [CrossRef]
- Zhang, T.T.; Yang, J.Y.; Zhou, H.; Dai, A.J.; Tan, D.L. Abandoned cropland mapping and its influencing factors analysis: A case study in the Beijing-Tianjin-Hebei region. Catena 2024, 239, 107876. [Google Scholar] [CrossRef]
- Rose, S.; Kraatz, S.; Kellndorfer, J.; Cosh, M.H.; Torbick, N.; Huang, X.D.; Siqueira, P. Evaluating NISAR’s cropland mapping algorithm over the conterminous United States using Sentinel-1 data. Remote Sens. Environ. 2021, 260, 112472. [Google Scholar] [CrossRef]
- Ozdogan, M.; Woodcock, C.E. Resolution dependent errors in remote sensing of cultivated areas. Remote Sens. Environ. 2006, 103, 203–217. [Google Scholar] [CrossRef]
- Du, Z.R.; Yang, J.Y.; Ou, C.; Zhang, T.T. Agricultural land abandonment and retirement mapping in the Northern China crop-pasture band using temporal consistency check and trajectory-based change detection approach. IEEE Trans. Geosci. Remote Sens. 2022, 60, 4406712. [Google Scholar] [CrossRef]
- Lu, D.; Su, K.C.; Wang, Z.P.; Hou, M.J.; Li, X.X.; Lin, A.W.; Yang, Q.Y. Patterns and drivers of terrace abandonment in China: Monitoring based on multi-source remote sensing data. Land Use Policy 2025, 148, 107388. [Google Scholar] [CrossRef]
- Han, Z.; Song, W. Spatiotemporal variations in cropland abandonment in the Guizhou–Guangxi karst mountain area, China. J. Clean. Prod. 2019, 238, 117888. [Google Scholar] [CrossRef]
- Hou, D.W.; Meng, F.H.; Prishchepov, A.V. How is urbanization shaping agricultural land-use? Unraveling the nexus between farmland abandonment and urbanization in China. Landsc. Urban Plan. 2021, 214, 104170. [Google Scholar] [CrossRef]
- Hong, C.Q.; Prishchepov, A.V.; Bavorova, M. Cropland abandonment in mountainous China: Patterns and determinants at multiple scales and policy implications. Land Use Policy 2024, 145, 107292. [Google Scholar] [CrossRef]
- Levers, C.; Schneider, M.; Prishchepov, A.V.; Estel, S.; Kuemmerle, T. Spatial variation in determinants of agricultural land abandonment in Europe. Sci. Total Environ. 2018, 644, 95–111. [Google Scholar] [CrossRef]
- Cui, Y.F.; Dong, J.W.; Zhang, C.; Yang, J.L.; Chen, N.; Guo, P.; Di, Y.Y.; Chen, M.X.; Li, A.W.; Liu, R.G. Validation and refinement of cropland map in southwestern China by harnessing ten contemporary datasets. Sci. Data 2024, 11, 671. [Google Scholar] [CrossRef]
- Zhang, M.X.; Li, G.Y.; He, T.T.; Zhai, G.; Guo, A.D.; Chen, H.; Wu, C.F. Reveal the severe spatial and temporal patterns of abandoned cropland in China over the past 30 years. Sci. Total Environ. 2023, 857, 159591. [Google Scholar] [CrossRef]
- Yang, J.; Huang, X. The 30 m annual land cover dataset and its dynamics in China from 1990 to 2019. Earth Syst. Sci. Data 2021, 13, 3907–3925. [Google Scholar] [CrossRef]
- Li, S.Z.; Xiao, J.; Lei, X.Y.; Wang, Y.H. Farmland abandonment in the mountainous areas from an ecological restoration perspective: A case study of Chongqing, China. Ecol. Indic. 2023, 153, 110412. [Google Scholar] [CrossRef]
- Liu, J.Y.; Kuang, W.H.; Zhang, Z.X.; Xu, X.L.; Qin, Y.W.; Ning, J.; Zhou, W.C.; Zhang, S.W.; Li, R.D.; Yan, C.Z.; et al. Spatiotemporal characteristics, patterns, and causes of land-use changes in China since the late 1980s. J. Geogr. Sci. 2014, 24, 195–210. [Google Scholar] [CrossRef]
- Tu, Y.; Wu, S.B.; Chen, B.; Weng, Q.H.; Bai, Y.Q.; Yang, J.; Yu, L.; Xu, B. A 30 m annual cropland dataset of China from 1986 to 2021. Earth Syst. Sci. Data 2024, 16, 2297–2316. [Google Scholar] [CrossRef]
- Chen, J.; Chen, J.; Liao, A.P.; Cao, X.; Chen, L.J.; Chen, X.H.; He, C.Y.; Han, G.; Peng, S.; Liu, M.; et al. Global land cover mapping at 30 m resolution: A POK-based operational approach. ISPRS J. Photogramm. Remote Sens. 2015, 103, 7–27. [Google Scholar] [CrossRef]
- Karra, K.; Kontgis, C.; Statman-Weil, Z.; Mazzariello, J.C.; Mathis, M.; Brumby, S.P. Global land use/land cover with Sentinel 2 and deep learning. In Proceedings of the 2021 IEEE international geoscience and remote sensing symposium IGARSS, Brussels, Belgium, 12 October 2021; pp. 4704–4707. [Google Scholar]
- Li, Z.H.; He, W.; Cheng, M.F.; Hu, J.X.; Yang, G.Y.; Zhang, H.Y. SinoLC-1: The first 1 m resolution national-scale land-cover map of China created with a deep learning framework and open-access data. Earth Syst. Sci. Data 2023, 15, 4749–4780. [Google Scholar] [CrossRef]
- Liu, F.; Wu, H.; Zhao, Y.; Li, D.; Yang, J.L.; Song, X.; Shi, Z.; Zhu, A.X.; Zhang, G.L. Mapping high resolution National Soil Information Grids of China. Sci. Bull. 2022, 3, 328–340. [Google Scholar] [CrossRef]
- Shangguan, W.; Dai, Y.J.; Liu, B.Y.; Zhu, A.X.; Duan, Q.Y.; Wu, L.Z.; Ji, D.Y.; Ye, A.Z.; Yuan, H.; Zhang, Q.; et al. A China Dataset of Soil Properties for Land Surface Modeling. J. Adv. Model. Earth Syst. 2013, 5, 212–224. [Google Scholar] [CrossRef]
- Li, J.L.; He, H.B.; Zeng, Q.H.; Chen, L.D.; Sun, R.H. A Chinese soil conservation dataset preventing soil water erosion from 1992 to 2019. Sci. Data 2023, 10, 319. [Google Scholar] [CrossRef]
- Wu, Y.Z.; Shi, K.F.; Chen, Z.Q.; Liu, S.R.; Chang, Z.J. An Improved Time-Series DMSP-OLS-like Data (1992–2023) in China by Integrating DMSP-OLS and SNPP-VIIRS. Harvard Dataverse, V5. 2021. Available online: https://doi.org/10.7910/DVN/GIYGJU (accessed on 1 January 2024).
- Gao, J.; Shi, Y.; Zhang, H.; Chen, X.; Zhang, W.; Shen, W.; Xiao, T.; Zhang, Y. China regional 250 m normalized difference vegetation index data set (2000–2023). Natl. Tibet. Plateau/Third Pole Environ. Data Cent. 2023, 2, 946–952. [Google Scholar]
- Chen, J.D.; Gao, M.; Cheng, S.L.; Hou, W.X.; Song, M.L.; Liu, X.; Liu, Y. Global 1 km × 1 km gridded revised real gross domestic product and electricity consumption during 1992–2019 based on calibrated nighttime light data. Sci. Data 2022, 9, 202. [Google Scholar] [CrossRef]
- Peng, S.Z.; Ding, Y.X.; Wen, Z.M.; Chen, Y.M.; Cao, Y.; Ren, J.Y. Spatiotemporal change and trend analysis of potential evapotranspiration over the Loess Plateau of China during 2011–2100. Agric. For. Meteorol. 2017, 233, 183–194. [Google Scholar] [CrossRef]
- Peng, S.Z.; Ding, Y.X.; Liu, W.Z.; Li, Z. 1 km monthly temperature and precipitation dataset for China from 1901 to 2017. Earth Syst. Sci. Data 2019, 11, 1931–1946. [Google Scholar] [CrossRef]
- Cai, Y.T.; Xu, X.C.; Zhu, P.; Nie, S.; Wang, C.; Xiong, Y.J.; Liu, X.P. Unveiling spatiotemporal tree cover patterns in China: The first 30 m annual tree cover mapping from 1985 to 2023. ISPRS J. Photogramm. Remote Sens. 2024, 216, 240–258. [Google Scholar] [CrossRef]
- Chen, C.; Li, J.Q. Analysis and countermeasures of abandoned farmland in Southern rural areas of China: A case study of Qidong County, Hengyang City, Hunan Province. Sci. Technol. Vis. 2014, 3, 317+334. [Google Scholar]
- Long, Y.Q.; Sun, J.; Wellens, J.; Colinet, G.; Wu, W.B.; Meersmans, J. Mapping the spatiotemporal dynamics of cropland abandonment and recultivation across the Yangtze River Basin. Remote Sens. 2024, 16, 1052. [Google Scholar] [CrossRef]
- Lu, D.; Wang, Z.P.; Li, X.X.; Zhou, Y.J. Evaluation of the efficiency and drivers of complemented cropland in Southwest China over the past 30 years from the perspective of cropland abandonment. J. Environ. Manag. 2024, 351, 119909. [Google Scholar] [CrossRef]
- Huang, J.; Liu, J.; Ye, Y.C.; Jiang, Y.M.; Lai, Y.Y.; Qin, X.B.; Zhang, L.; Jiang, Y.F. Mapping soil properties in the Haihun River sub-watershed, Yangtze River Basin, China, by integrating machine learning and variable selection. Sensors 2024, 24, 3784. [Google Scholar] [CrossRef]
- Li, W.F.; Jiang, Y.F.; Ye, Y.C.; Guo, X.; Shi, Z. Spatiotemporal interpretable mapping framework for soil heavy metals. J. Clean. Prod. 2024, 468, 143101. [Google Scholar] [CrossRef]
- Lundberg, S.; Lee, S.I. A unified approach to interpreting model predictions 2017. In Proceedings of the 31st Conference on Neural Information Processing Systems, Long Beach, CA, USA, 4–9 December 2017; pp. 1–10. Available online: https://proceedings.neurips.cc/paper_files/paper/2017/file/8a20a8621978632d76c43dfd28b67767-Paper.pdf (accessed on 1 January 2024).
- Wang, Z.G.; Hu, B.F.; Zhang, C.; Atkinson, P.M.; Wang, Z.F.; Xu, K.; Chang, J.F.; Fang, X.K.; Jiang, Y.F.; Shi, Z. How the Air Clean Plan and carbon mitigation measures co-benefited China in PM2.5 reduction and health from 2014 to 2020. Environ. Int. 2022, 169, 107510. [Google Scholar] [CrossRef]
- Siachalou, S.; Mallinis, G.; Tsakiri-Strati, M. A hidden markov models approach for crop classification: Linking crop phenology to time series of multi-sensor remote sensing data. Remote Sens. 2015, 7, 3633–3650. [Google Scholar] [CrossRef]
- Chen, X.R.; Zhan, Y.L.; Liu, Y.; Gu, X.F.; Yu, T.; Wang, D.K.; Liu, Q.X.; Zhang, Y.; Zhang, Y.Z. Improving the classification accuracy of annual crops using time series of temperature and vegetation indices. Remote Sens. 2020, 12, 3202. [Google Scholar] [CrossRef]
- Ni, R.G.; Tian, J.Y.; Li, X.J.; Yin, D.M.; Li, J.W.; Gong, H.L.; Zhang, J.; Zhu, L.; Wu, D.L. An enhanced pixel-based phenological feature for accurate paddy rice mapping with Sentinel-2 imagery in Google Earth Engine. ISPRS J. Photogramm. Remote Sens. 2021, 178, 282–296. [Google Scholar] [CrossRef]
- Mei, Q.H.; Zhang, Z.; Han, J.C.; Song, J.; Dong, J.W.; Wu, H.Q.; Xu, J.L.; Tao, F.L. ChinaSoyArea10m: A dataset of soybean-planting areas with a spatial resolution of 10 m across China from 2017 to 2021. Earth Syst. Sci. Data 2024, 16, 3213–3231. [Google Scholar] [CrossRef]
- Wijesingha, J.; Dzene, I.; Wachendorf, M. Evaluating the spatial–temporal transferability of models for agricultural land cover mapping using Landsat archive. ISPRS J. Photogramm. Remote Sens. 2024, 213, 72–86. [Google Scholar] [CrossRef]
- Wang, X.Y.; He, Y.B.; Zha, Y.; Chen, H.C.; Wang, Y.Y.; Wu, X.Y.; Ning, J.; Feng, A.R.; Han, S.N.; Luo, S.J. Mapping winter fallow arable lands in Southern China by using a multi-temporal overlapped area minimization threshold method. Giscience Remote Sens. 2024, 61, 2333587. [Google Scholar] [CrossRef]
- Zhu, X.F.; Xiao, G.F.; Zhang, D.J.; Guo, L.L. Mapping abandoned farmland in China using time series MODIS NDVI. Sci. Total Environ. 2021, 755, 142651. [Google Scholar] [CrossRef]
- Chaudhary, S.; Wang, Y.K.; Dixit, A.M.; Khanal, N.R.; Xu, P.; Fu, B.; Yan, K.; Liu, Q.; Lu, Y.F.; Li, M. A synopsis of farmland abandonment and its driving factors in Nepal. Land 2020, 9, 84. [Google Scholar] [CrossRef]
- Crawford, C.L.; Yin, H.; Radeloff, V.C.; Wilcove, D.S. Rural land abandonment is too ephemeral to provide major benefits for biodiversity and climate. Sci. Adv. 2022, 8, eabm8999. [Google Scholar] [CrossRef]
- Li, S.F.; Li, X.B.; Xin, L.J.; Tan, M.H.; Wang, X.; Wang, R.J.; Jiang, M.; Wang, Y.H. Extent and distribution of cropland abandonment in Chinese mountainous areas. Resour. Sci. 2017, 39, 1801–1811. [Google Scholar]
- Zeng, J.; Luo, T.; Chen, W.X.; Gu, T.C. Assessing and mapping cropland abandonment risk in China. Land Degrad. Dev. 2024, 35, 2738–2753. [Google Scholar] [CrossRef]
- Ma, Y.C.; Wang, J.S.; Xiong, J.H.; Sun, M.Z.; Wang, J.Y. Risk assessment for cropland abandonment in mountainous area based on AHP and PCA—Take Yunnan Province in China as an example. Ecol. Indic. 2024, 158, 111287. [Google Scholar] [CrossRef]
Disclaimer/Publisher’s Note: The statements, opinions and data contained in all publications are solely those of the individual author(s) and contributor(s) and not of MDPI and/or the editor(s). MDPI and/or the editor(s) disclaim responsibility for any injury to people or property resulting from any ideas, methods, instructions or products referred to in the content. |
© 2025 by the authors. Licensee MDPI, Basel, Switzerland. This article is an open access article distributed under the terms and conditions of the Creative Commons Attribution (CC BY) license (https://creativecommons.org/licenses/by/4.0/).