1. Introduction
Recent advances in Machine Learning (ML) and Deep Learning (DL) technologies have transformed various industries, including geographic mapping [
1,
2]. Modern Geospatial Artificial Intelligence (GeoAI) modeling techniques introduce new AI methods for generating, updating, and analyzing spatial datasets, fundamentally reshaping how geographic information is produced, maintained, and consumed. For example, GeoAI-generated spatial data (i.e., map features of all types) can quickly create detailed representations of built environments, essential for urban planning, disaster management, environmental monitoring, and many other location-based services and downstream applications.
Among the many areas where GeoAI has shown significant promise is for predicting map features (e.g., roads, buildings), which involves applying advanced computer vision and DL techniques to the problem of keeping crowd-source mapping platforms such as OSM up-to-date [
3]. However, as AI models increasingly become tested for automating the VGI mapping process (e.g., by maintaining the completeness/correctness of online maps), concerns regarding their accuracy and reliability have increasingly become more important.
For example, OpenStreetMap (OSM) is a collaborative, crowd-source mapping platform that enables the public to create and edit map features across the globe [
4]. OSM datasets are widely used in various applications, including navigation, urban planning, and environmental monitoring. Yet maintaining the accuracy and completeness of OSM map data, especially in fast-changing urban areas or under-mapped remote areas, remains a significant challenge. To address this, OSM relies on human volunteers (VGI mappers) to manually input/update map feature data. This approach, while effective, is labor-intensive and suffers from varying feature quality/detail, leading to data reliability concerns and delays in updating online maps, particularly in regions that are not well-covered by local VGI contributors [
5].
To address these limitations, recent research has explored the use of GeoAI techniques to assist/automate the creation and maintenance of online map data [
6]. Among these, Generative Adversarial Networks (GANs) have emerged as a promising approach for generating synthetic map feature data that closely resembles real-world objects—like buildings. These generative AI models [
3,
7] leverage large datasets of satellite imagery to quickly produce detailed maps of built environments. They are specifically designed to generate geospatial data that could be seamlessly integrated into OSM, thereby significantly reducing the time and effort required for manual map edits.
However, despite the promise of GeoAI, few studies have systematically evaluated AI-generated building footprints using independent, geometry-specific metrics. Prior work often relies solely on completeness or centroid-based positional accuracy, which may conflate different types of errors and fail to capture subtle shape deviations, especially in complex or occluded urban environments. This study addresses this gap by combining conventional Quality Assurance (QA) metrics with qualitative assessments, offering a more comprehensive framework for evaluating AI-generated geospatial data.
This paper assesses the reliability of GeoAI-generated building footprint data specifically for its applicability to keeping online OSM maps up-to-date. Importantly, this study is strictly analytical and does not involve the final upload or integration of AI-generated data into the live OSM map. We recognize the OpenStreetMap community’s concerns regarding their “Automated Edits Code of Conduct” and agree that any future use of GeoAI-derived data should comply with OSM guidelines, including prior consultation, transparency, and manual or semi-automated validation processes.
This study focuses on four key spatial data quality metrics:
completeness;
shape accuracy;
positional accuracy; and
qualitative assessment. The current live OSM database is utilized as the benchmark for evaluating our
OSi-GAN and
OSM-GAN AI outputs against OSi (Ordnance Survey Ireland) “ground truth” building footprints. These evaluation metrics are well-established in the geospatial literature as critical indicators of data accuracy and usability [
8,
9,
10,
11]. Completeness measures the extent to which the AI model successfully captures all the relevant map features (i.e., buildings in our case) from new satellite imagery of an area [
12]. Measuring shape accuracy and positional accuracy is essential for ensuring that AI-generated data conforms to actual building geometries and locations in the real-world, which is fundamental for urban planning and related applications [
13,
14]. A final qualitative assessment adds a subjective measure that can capture nuances missed by quantitative measurements alone, especially in complex urban environments.
Taken together, these four components provide a more robust basis for evaluating GeoAI-generated data quality, emphasizing the importance of map feature validation before it is uploaded and utilized in downstream LBS applications.
Figure 1 illustrates an example of GeoAI-generated building footprints detected in a satellite image of the Grangegorman area of Dublin city.
In addition to assessing these metrics, this paper aims to demonstrate that such traditional geo-evaluation measures, while useful, may not fully capture the nuances of AI-generated map data specifically. Comparing synthetic (i.e., predicted map features) to real-world spatial datasets serves to show the strengths and limitations of contemporary GeoAI-generated map data, highlighting areas where further studies could be carried out.
2. Background and Related Work
OpenStreetMap, established in 2004, has grown into a vital geospatial resource for many value-added location-based services, supporting navigation, urban planning, disaster response, and environmental monitoring [
15]. The utility of these downstream applications is highly dependent on the accuracy, completeness, and currency of the OSM database. However, ensuring up-to-date and accurate mapping is challenging due to OSM’s reliance on manual VGI contributions, which can be inconsistent in coverage and quality, especially in underpopulated or economically disadvantaged regions [
15].
To address these limitations, current research has increasingly turned to automated mapping techniques, particularly those leveraging GeoAI. Recent advances in Deep Neural Networks (DNNs) and Generative Adversarial Networks (GANs) have demonstrated substantial promise for automating the extraction of spatial features from satellite imagery [
16,
17,
18,
19,
20]. For instance,
OSM-GAN [
3] and
Poly-GAN [
7] leverage widely available satellite imagery (Google Earth) to generate accurate building footprints, thereby enabling rapid online map updating in areas with sparse VGI contributions.
These recent advances have significantly demonstrated the utility of GeoAI techniques for generating geospatial data. For example, hybrid DL frameworks, such as Mobile-UNet combined with GANs, have shown high F1 scores (0.62–0.75) across complex landscapes [
21]. Two-stage GAN-based enhancement pipelines (e.g., DeOldify and Real-ESRGAN) have also enabled accurate feature extraction from degraded historical imagery, achieving mAP scores of over 85% [
22]. These methods now serve not just as generators but also as pre-processing tools for improving input data fidelity.
A promising new development in geospatial analysis is the emergence of GeoAI Foundation Models, which are trained on large-scale, unlabeled remote sensing data using self-supervised learning [
23]. Once fine-tuned on small task-specific datasets, these models can generalize across a variety of geospatial tasks (e.g., classification, segmentation, and object detection), thereby minimizing the need for extensive labeled data from each location [
23,
24]. By reducing reliance on extensive labeled data from each region, they offer a scalable approach to mapping, especially for under-mapped areas, while helping to close long-standing gaps in global geospatial coverage.
However, while these advances demonstrate the technical capability of AI for automated mapping, they also reveal an active debate in the literature regarding the adequacy of traditional Quality Assurance frameworks. Existing metrics, primarily completeness, positional accuracy, and overlap-based measures such as Jaccard Similarity, are often designed for conventional, human-curated VGI datasets. Consequently, while JSC remains useful for evaluating extents of feature overlap and thus, implicitly, spatial alignment, it may inadequately describe shape nuances and boundary-level errors inherent in AI-generated outputs.
As such, incorporating GeoAI into the traditional (manual) mapping workflow demonstrates a need for a more systematic Quality Assurance (QA) framework. While traditional QA metrics, such as completeness, shape accuracy, and positional accuracy, remain central, studies suggest that QA should also monitor complex building geometries and their semantic correctness. Intrinsically, contemporary GeoAI-based generative models require a more nuanced and adaptable quality evaluation strategy [
25,
26,
27].
Therefore, our approach explicitly positions itself within this debate by proposing a QA framework that combines both conventional and geometry-specific metrics (
Table 1). Specifically, we use JSC to measure alignment and overlap coverage between generated and reference features and Hausdorff Distance (HD) to evaluate fine-grained shape deviations independent of spatial alignment [
28]. This hybrid strategy provides a more robust and interpretable assessment of AI-generated building footprints, as it overcomes the limitations of existing studies that rely on centroid-based only positional measures.
In summary, Mooney et al. (2010) emphasized the foundational importance of QA for “traditional” VGI maps and proposed a framework for assessing positional accuracy, completeness, and attribute consistency [
10]. More recent QA studies have commonly adopted overlap-based metrics such as the Intersection over Union (IoU) or Jaccard Similarity Coefficient (JSC) to evaluate the geometric similarity between conjugate shapes [
31]. While JSC is useful for assessing feature alignment and overlap agreement, it mixes shape and positional differences, making it less suitable for independently evaluating shape accuracy. To address this, we incorporate both JSC and Hausdorff Distance (HD) into our QA approach, where JSC is used to measure spatial alignment and overlap consistency, and HD serves as a boundary-based metric that quantifies maximum shape deviation. This combination provides a more comprehensive and independent accuracy measure of AI-generated building footprints.
3. Methodology
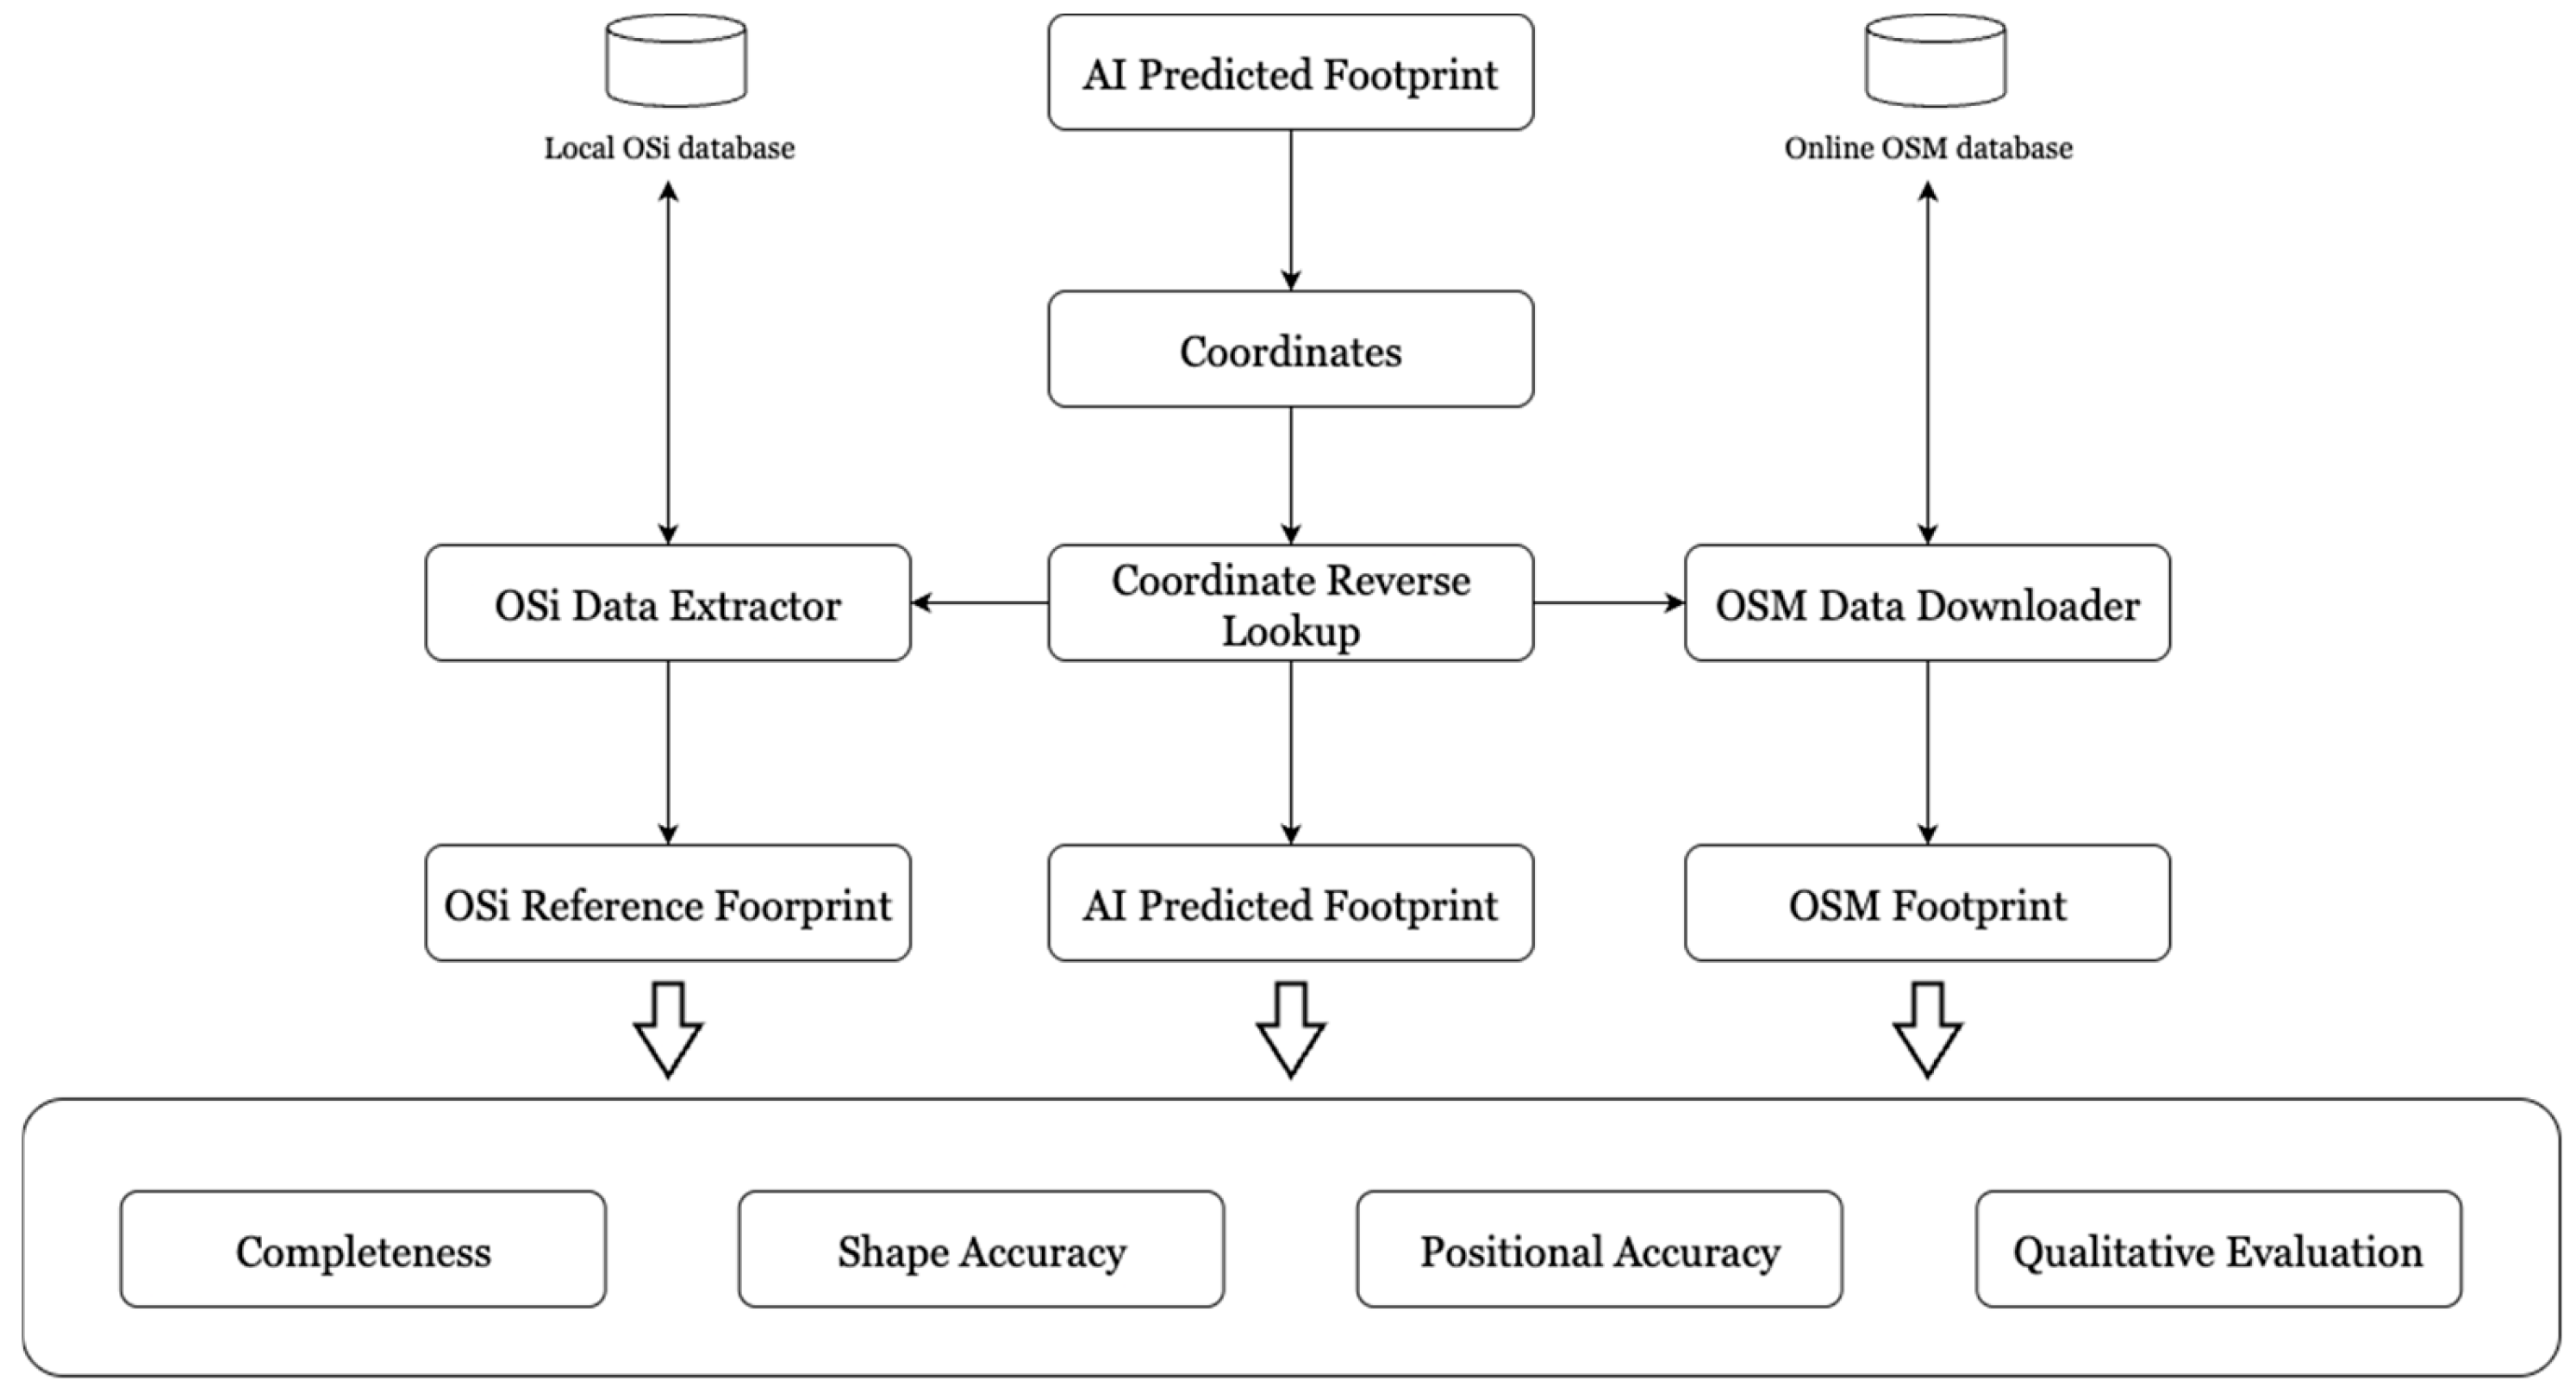
As discussed, this study presents a multi-phase QA methodology to evaluate the reliability, spatial accuracy, and usability of GeoAI-generated building footprints. The process incorporates both quantitative and qualitative assessments across four key phases: data preparation, completeness analysis, shape accuracy evaluation, and positional accuracy assessment, followed by a qualitative visual inspection. Two benchmark datasets are used in this study: OSi as the authoritative “ground truth” and OpenStreetMap as the representative crowd-source dataset. This dual-reference approach allows for a balanced evaluation of GeoAI outputs in terms of both authoritative correctness and VGI reality.
Figure 2 outlines the overall QA process followed in this mapping workflow.
3.1. Data Preparation Phase
Ordnance Survey Ireland, Ireland’s national mapping agency, is the official source of authoritative spatial data for the country and is widely used in commercial and academic geospatial research applications [
31]. Its building footprints (i.e., vector data derived from high-resolution orthophotos, LiDAR scans, and field surveys) serve as the reference dataset for all QA comparisons in this study due to their spatial accuracy and geometric fidelity.
AI-generated predictions of building footprints (first comparison dataset) were acquired from two sources (these resolution settings were selected based on a previous study [
6], in which we evaluated 16 GAN models trained and tested across varying spatial granularities; the models used here were chosen for their performance in terms of stability and predictive accuracy across real-world datasets):
The evaluation process begins by acquiring AI-generated vector predictions and extracting ground coordinates from their resulting footprints. These coordinates are then used to retrieve the corresponding polygons from the OSi dataset. OSM building footprints are simultaneously extracted from the live OSM database to form the second comparison dataset.
This three-fold comparison between AI-generated footprints based on different data sources (
OSM-GAN and
OSi-GAN), live OSM data, and the reference OSi dataset is designed to assess and highlight discrepancies in building geometries and positional accuracy derived from various mapping methods, ultimately determining the relative strengths and limitations of each approach. The spatial datasets are first transformed into a consistent coordinate reference system, specifically EPSG:2157 (
https://epsg.io/2157 (accessed on 29 September 2025)) (Irish Transverse Mercator), to ensure the uniformity of metric-based evaluations throughout the QA process. A summary of the datasets used in this QA workflow is provided in
Table 2 below.
While this study focuses on building footprints in Ireland, the proposed QA methodology assessing completeness, positional accuracy, and shape accuracy can be applied to other geographic regions. Performance metrics may vary depending on urban density, building morphology, or OSM coverage in the target area.
We acknowledge that this study introduces multiple sources of variation from using different vector datasets (i.e., OSM and OSi footprints) and different imagery sources (i.e., Google Earth and OSi orthophotos) to train/evaluate the GeoAI models. While this reflects practical end-to-end data pipelines in real-world GeoAI workflows, it also introduces a confounding factor that limits the ability to isolate the influence of a single variable (e.g., vector data quality vs. image characteristics). As such, the comparison between
OSM-GAN and
OSi-GAN should be interpreted as a comparison of
combined data pipelines rather than isolated components [
6].
3.2. Completeness
Completeness is considered a fundamental QA metric that quantifies the degree to which a spatial dataset captures all relevant features in a given area [
12,
32,
33]. In this context, completeness was evaluated by comparing both AI-generated and current OSM footprints (i.e., the three
comparison datasets in this study) against the OSi reference dataset using a map feature relationship model as follows:
1:1—perfect match.
1:0—omission in the comparison dataset.
0:1—commission in the comparison dataset.
1:many/many:1—segmentation differences.
many:many—complex matching.
Only 1:1, many:1, and many:many matches were counted as “complete” for the purpose of the completeness score. Omission (1:0) and over-segmentation (1:many) relationships were excluded, as they indicate missing or fragmented features [
34] (see
Figure 3).
This metric provides a clear understanding of dataset coverage and agreement, helping to reveal not only the raw quantity of features detected, but also the quality of those detections relative to real-world structures.
3.3. Shape Accuracy
Shape accuracy was assessed using two complementary metrics: Hausdorff Distance (HD) and Jaccard Similarity Coefficient (JSC). This dual-measure approach allows for a more nuanced evaluation of AI-generated building footprints by independently capturing both geometric fidelity and spatial alignment.
Hausdorff Distance (HD) is a boundary-based metric that quantifies the maximum deviation between the edges of two shapes. It measures the degree of dissimilarity by identifying the greatest distance from a point on one polygon to the closest point on the corresponding polygon. Formally, the directed Hausdorff Distance between two-point sets
A and
B is defined as
Therefore, the symmetric (undirected) Hausdorff Distance is then computed as
For each comparison, building footprints were first converted into discrete point sets representing their boundaries. HD was then calculated between each footprint in the test dataset (OSM, OSM-GAN, and OSi-GAN) and its corresponding footprint in the OSi reference dataset. Only 1:1-matched buildings were included to avoid distortions caused by over- or under-segmentation. The resulting HD values were aggregated to compute descriptive statistics (mean, standard deviation, min, max), offering insight into the typical and extreme geometric deviations across datasets.
The Jaccard Similarity Coefficient (JSC), also known as the Intersection over Union (IoU), was used to assess the area-based coverage and alignment between polygons. It is calculated as the ratio of the area of intersection to the area of union between two polygons. While JSC is influenced by both shape and position, it remains a useful indicator of overall spatial agreement. Values close to 1.0 indicate strong overlap and therefore alignment (orientation), whereas lower values suggest misalignment or geometric (shape) mismatch.
By using both HD and JSC, we distinguish between shape fidelity (boundary-level deviations) and spatial alignment (area-based similarity), allowing for a more comprehensive accuracy assessment of AI-generated building outlines (See
Figure 4).
3.4. Positional Accuracy
Positional accuracy is a core spatial data quality metric that assesses the shift between a dataset’s features and their true locations on the ground [
13,
29,
35]. In this study, it is measured as the Euclidean distance between centroids of corresponding building footprints. By comparing centroid coordinates between AI-generated and OSM footprints and those from the OSi dataset, this analysis reveals both systematic spatial shifts and random positional errors (
Figure 5).
Together, these similarity metrics provide a multi-dimensional evaluation of AI-generated building footprints. Completeness measures the extent of building feature detection, shape accuracy evaluates geometric fidelity independent of feature position/orientation, and centroid-based positional accuracy quantifies feature displacement. Qualitative assessment complements these by capturing nuanced aspects of building representation and contextual relevance. However, each metric has limitations: for example, centroid-based positional accuracy may overlook edge misalignments, while HD does not directly account for missing features. Combining these metrics with visual inspection ensures a more balanced evaluation of GeoAI outputs.
4. Results and Discussion
4.1. Completeness
This analysis evaluates how carefully each comparison dataset captures the building features present in the authoritative OSi reference dataset.
Table 3 summarizes the frequency and percentage of feature matching relationships across the three datasets: OSM (baseline),
OSi-GAN, and
OSM-GAN.
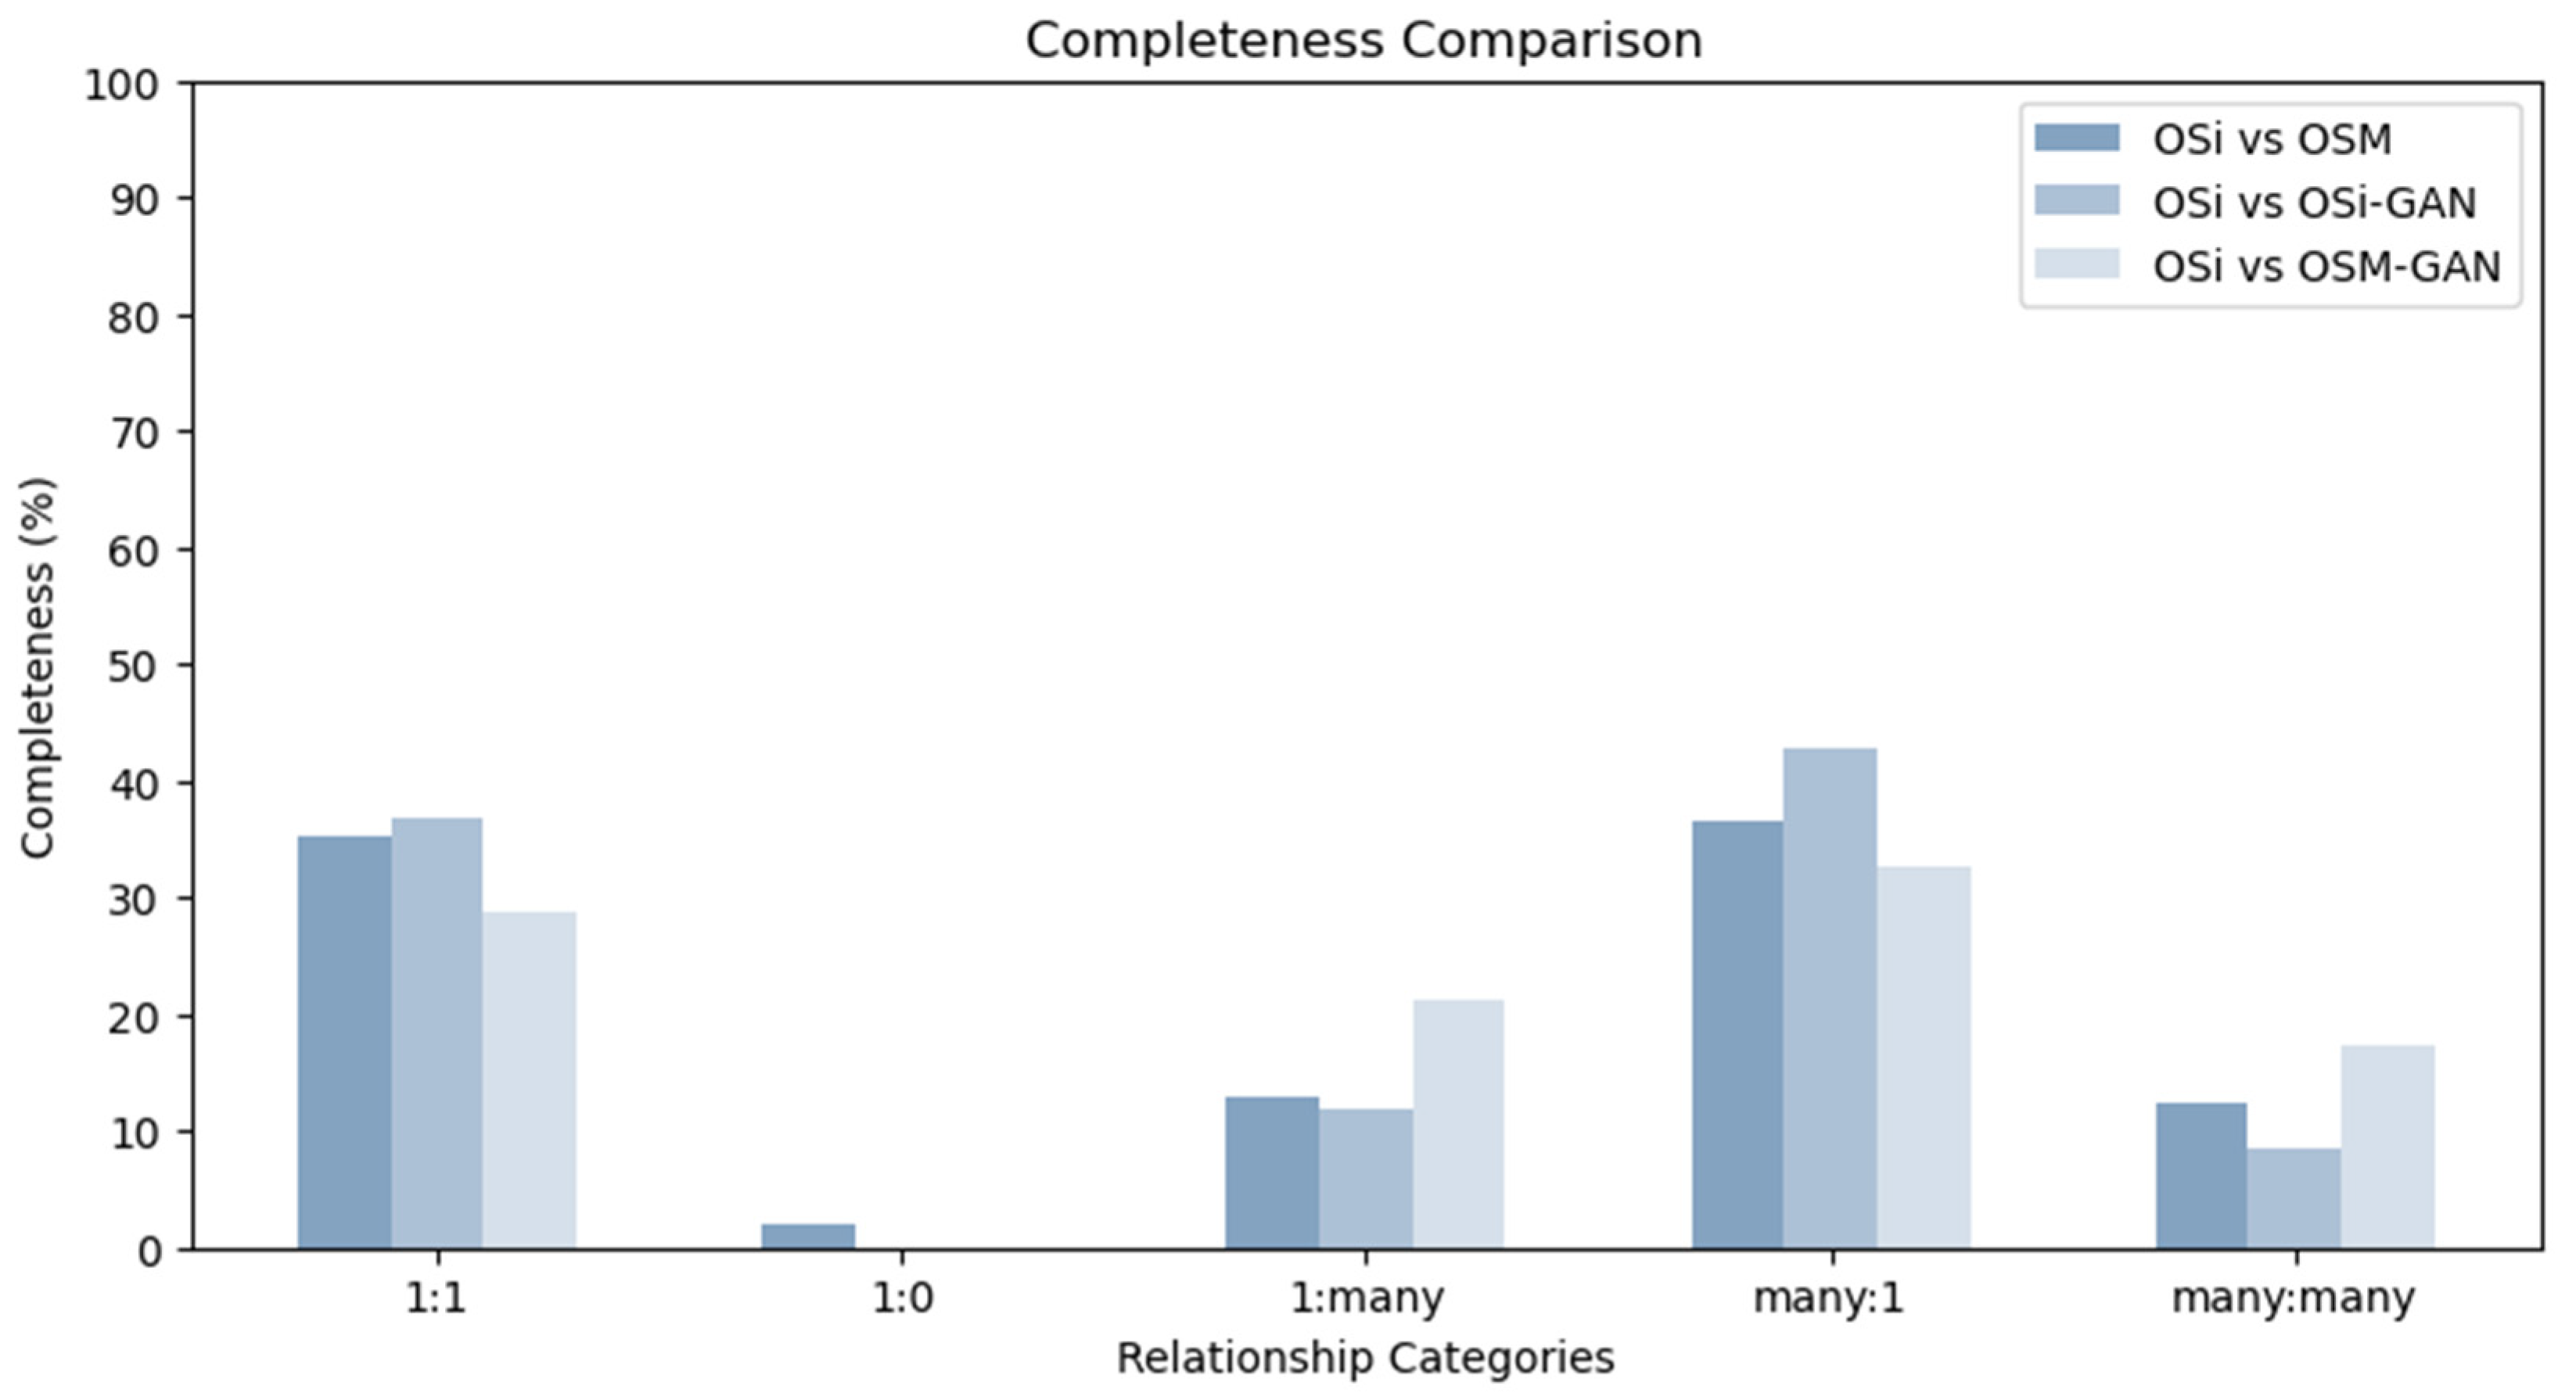
OSM footprints exhibit moderate completeness but also contain omissions (1:0), over-segmentation (1:many), and aggregation (many:1). Interestingly, both AI-generated datasets achieved zero missing features (1:0), indicating much improved feature recall. The OSi-GAN model outperforms both OSM and OSM-GAN in overall completeness (88.17%), likely due to its training on high-quality OSi vectors. OSM-GAN shows reduced completeness (78.87%), consistent with the more variable nature of its VGI training data (OSM vectors). A bar chart can visually represent completeness analysis results for each relationship category, comparing OSM- and AI-generated footprint completeness percentages with OSi (
Figure 6).
These results demonstrate that GeoAI models, particularly those trained on authoritative “ground truth” data, can approach or exceed traditional VGI mapping in feature coverage. However, completeness alone does not imply geometric or locational fidelity, leading to further evaluations below.
4.2. Shape Accuracy
Shape accuracy was assessed using two complementary metrics: Hausdorff Distance (HD) for boundary-level discrepancies and Jaccard Similarity Coefficient (JSC) for area-based alignment. Both metrics were computed for 1:1-matched buildings across the three datasets.
Table 4 presents a summary of the HD values for each comparison dataset, including mean distances, variability, and extreme cases. Among the datasets,
OSM-GAN achieved the lowest mean HD (3.29 m), suggesting closer geometric shape agreement with the OSi reference. OSM followed with a mean of 5.33 m, while
OSi-GAN had the highest mean HD (6.54 m). Higher standard deviations indicate increasingly inconsistent performance, particularly in geometrically complex areas. OSM’s variability could reflect its diverse crowdsource digitizing practices, while
OSi-GAN’s higher HD could stem from visual artifacts (e.g., clouds, shadows, occlusions) in aerial imagery.
Table 5 shows the corresponding JSC values.
OSM-GAN again outperforms the other comparison datasets with a mean JSC of 0.61, followed by
OSi-GAN (0.55) and OSM (0.52). However,
OSM-GAN also exhibits the highest variance (σ = 0.37), indicating uneven overlap positioning across features. The lowest JSC values (0.00) in all datasets point to instances of severe mismatches or failed detections.
These empirical results highlight distinct trade-offs between datasets. OSM-GAN, trained on VGI data, shows better shape alignment and lower boundary deviation but at the cost of higher inconsistency. OSi-GAN, despite training on authoritative vectors, performs worse in boundary fidelity—likely due to noise in the imagery or more intricate detail in the structures. Taken together, the combined use of HD and JSC provides a more comprehensive picture of map feature shape quality by separately measuring geometric deviation and spatial alignment.
4.3. Positional Accuracy
Positional accuracy was evaluated using Euclidean distance calculations between centroids of 1:1-matched building footprints.
Table 6 compares the results.
OSM exhibits the worst feature positional accuracy of 2.71 m (~9 ft.), likely due to inconsistent manual digitization methods and a lack of standard background imagery registration.
OSi-GAN improves accuracy significantly to 1.83 m (~6 ft.) but still incorporates some errors. Shadows can distort the learned representations and lead to inaccuracies in centroid placement.
OSM-GAN demonstrates the highest positional accuracy (1.02 m), likely due to more consistent/shadow-minimized nadir satellite imagery from Google Earth. While centroid-based measures alone do not capture feature orientation misalignments, it exhibit a reliable proxy for positional quality in most applications (see
Figure 5).
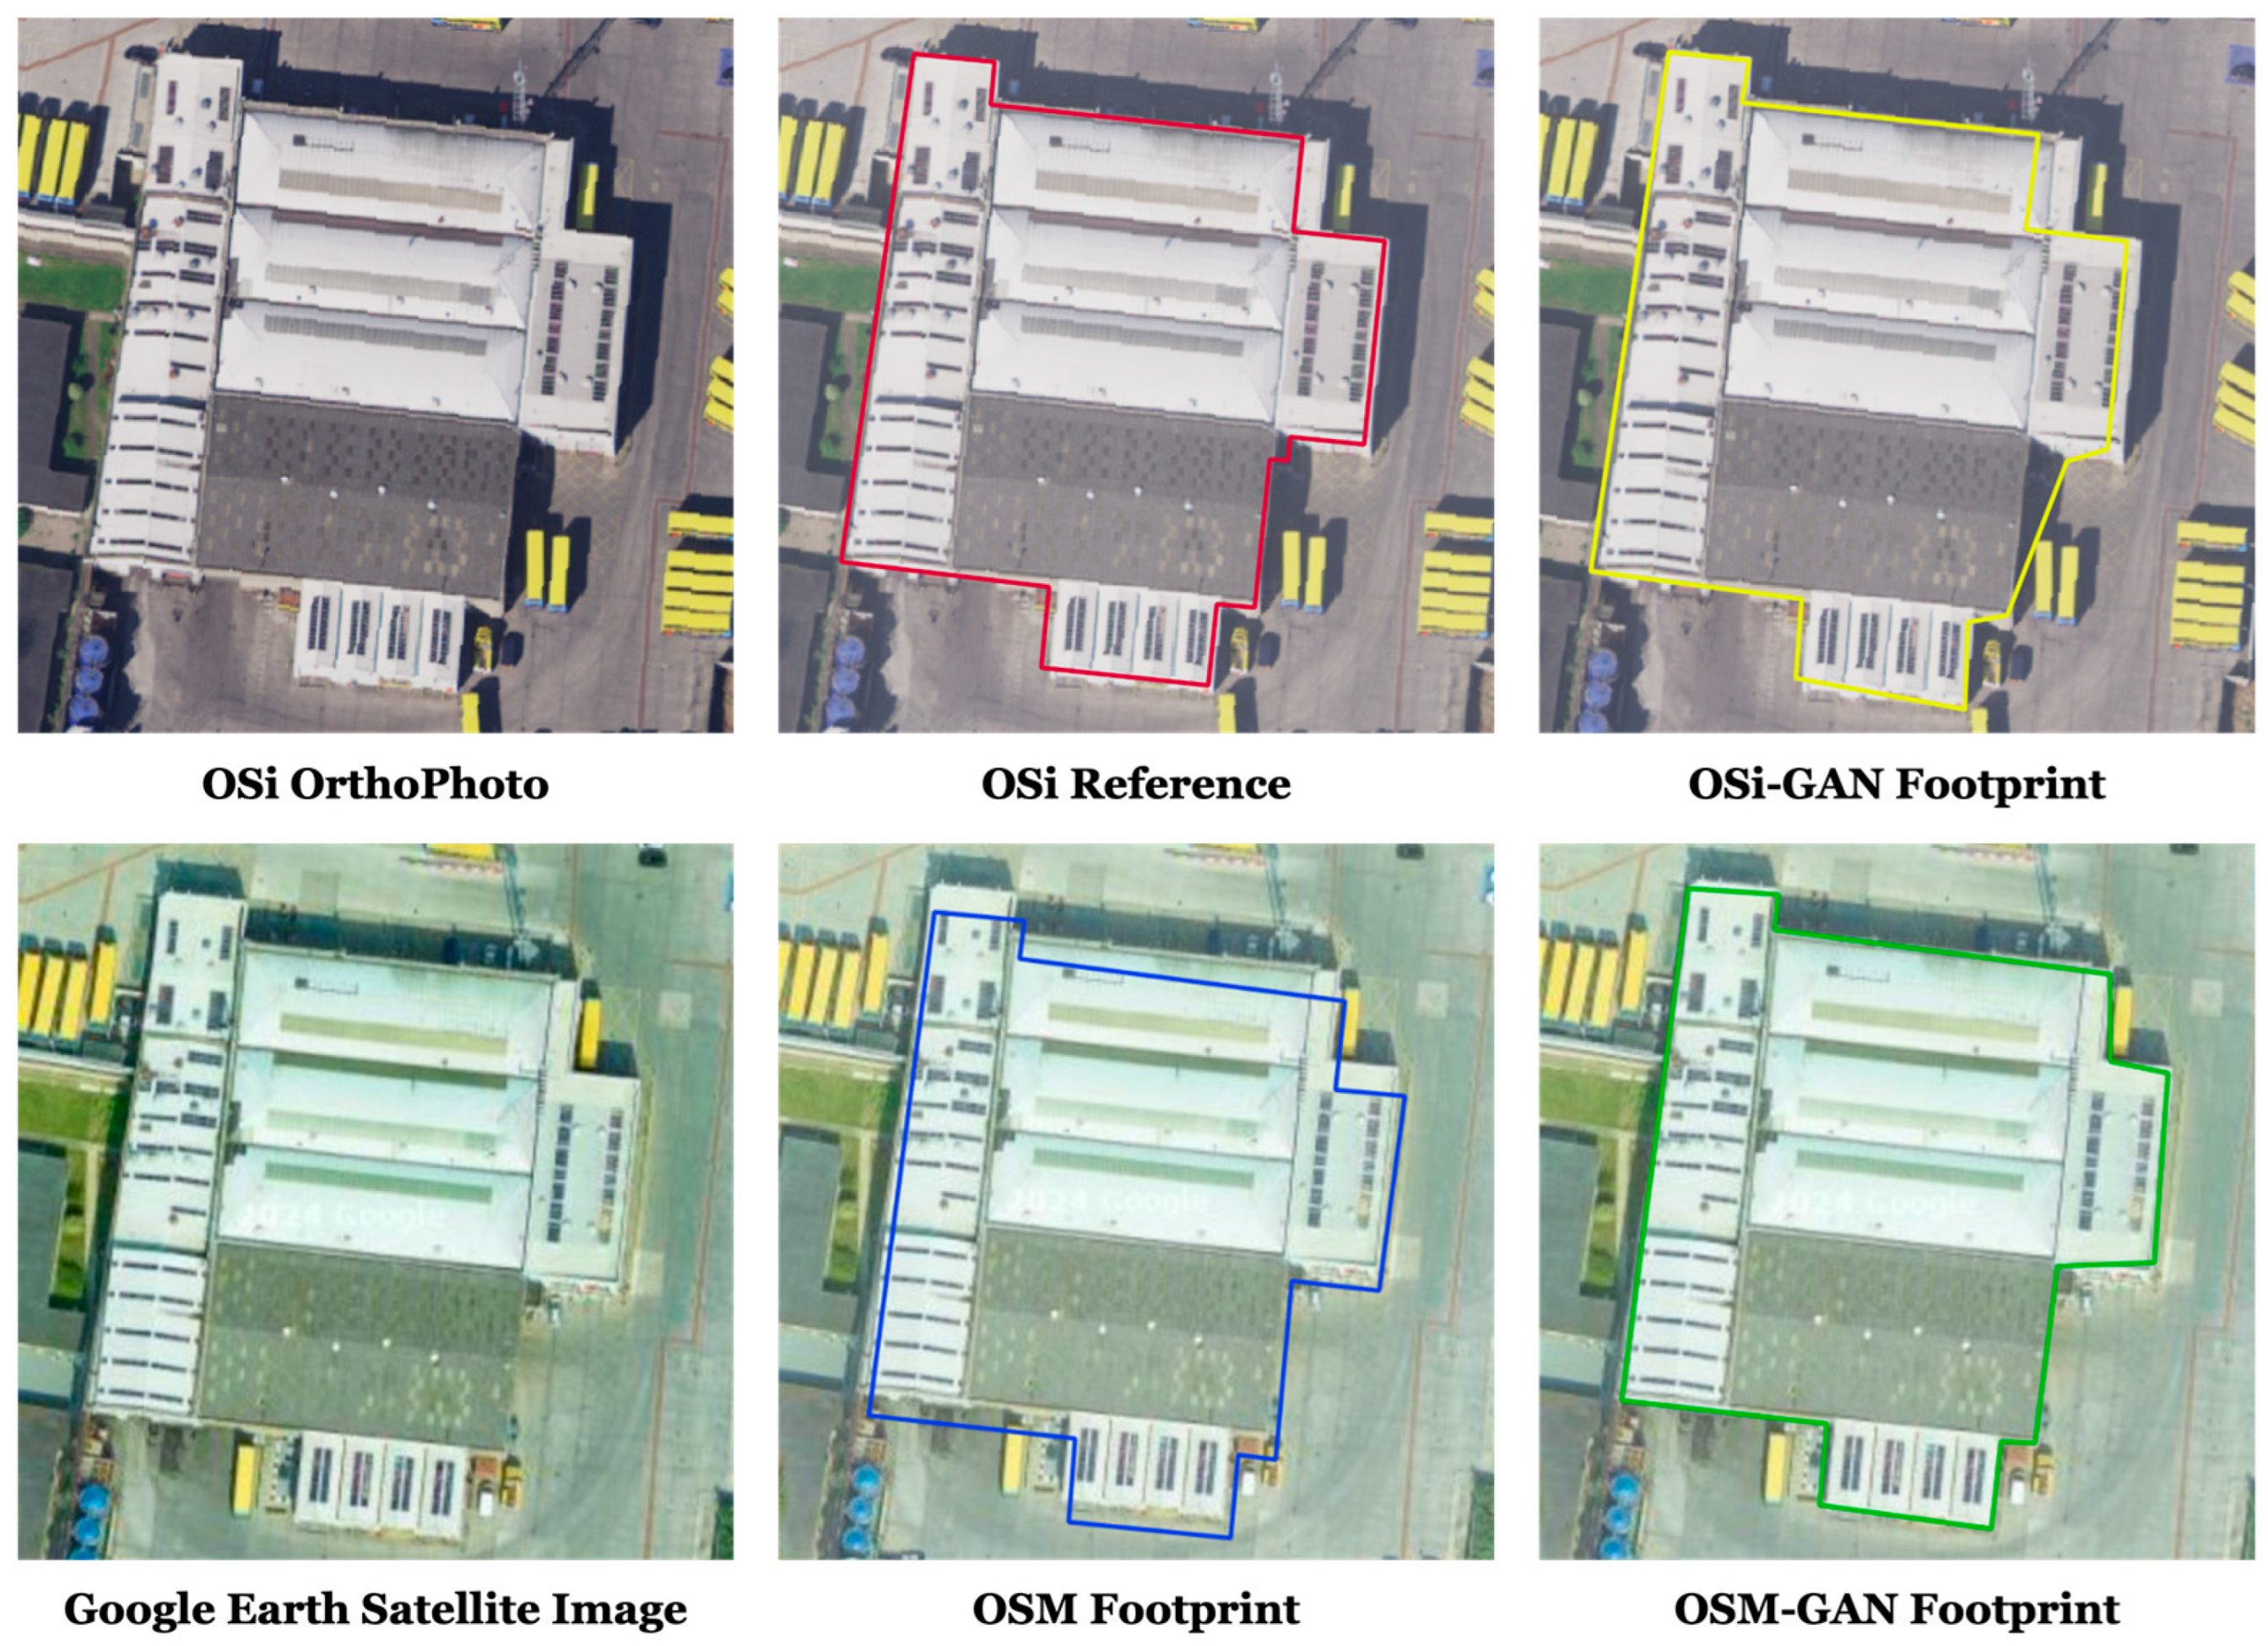
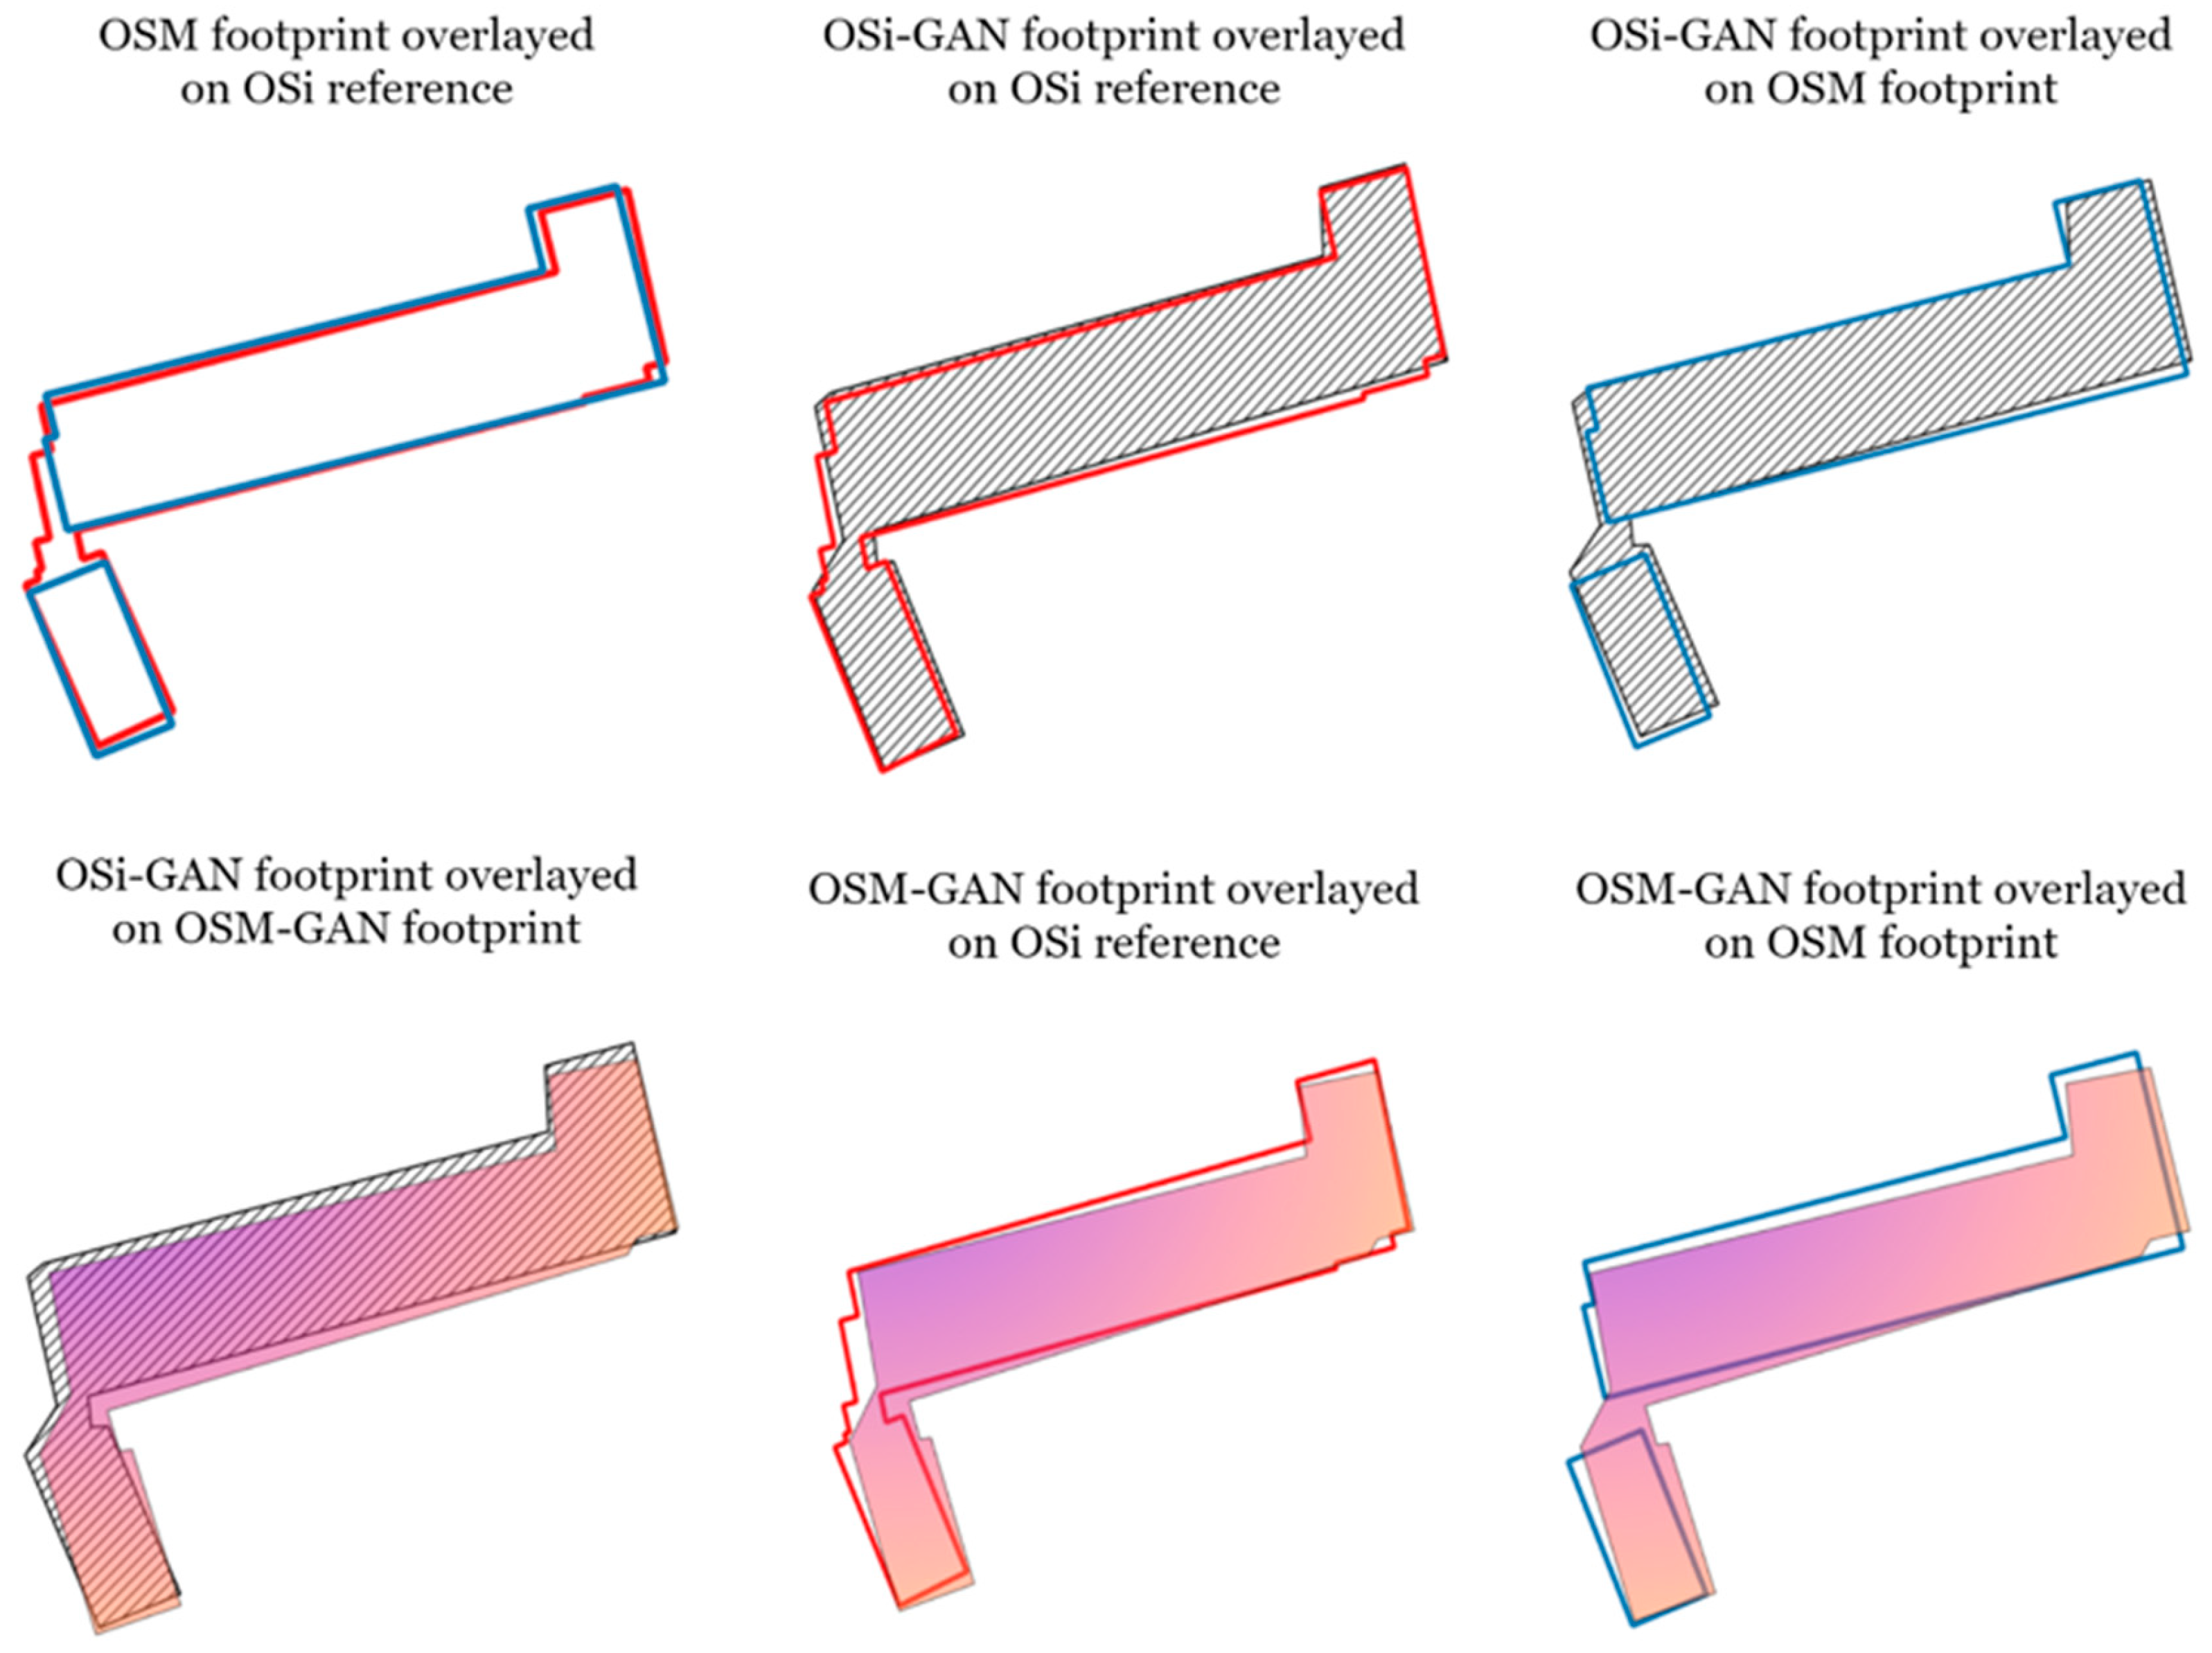
In the example qualitative vector-on-raster overlay scenario shown in
Figure 7, the
OSi-GAN output exhibits clear alignment with the OSi orthophoto background. This demonstrates consistency not only in shape and positional accuracy but also in feature orientation, affirming that buildings are correctly oriented to the reference dataset. Similarly,
OSM-GAN buildings exhibit positive agreement when compared to their corresponding Google Earth image background. This alignment illustrates contemporary GeoAI capacity to adhere to the characteristics of its respective training data sources to produce predictions (synthetic data) that closely match reference (real-world) datasets.
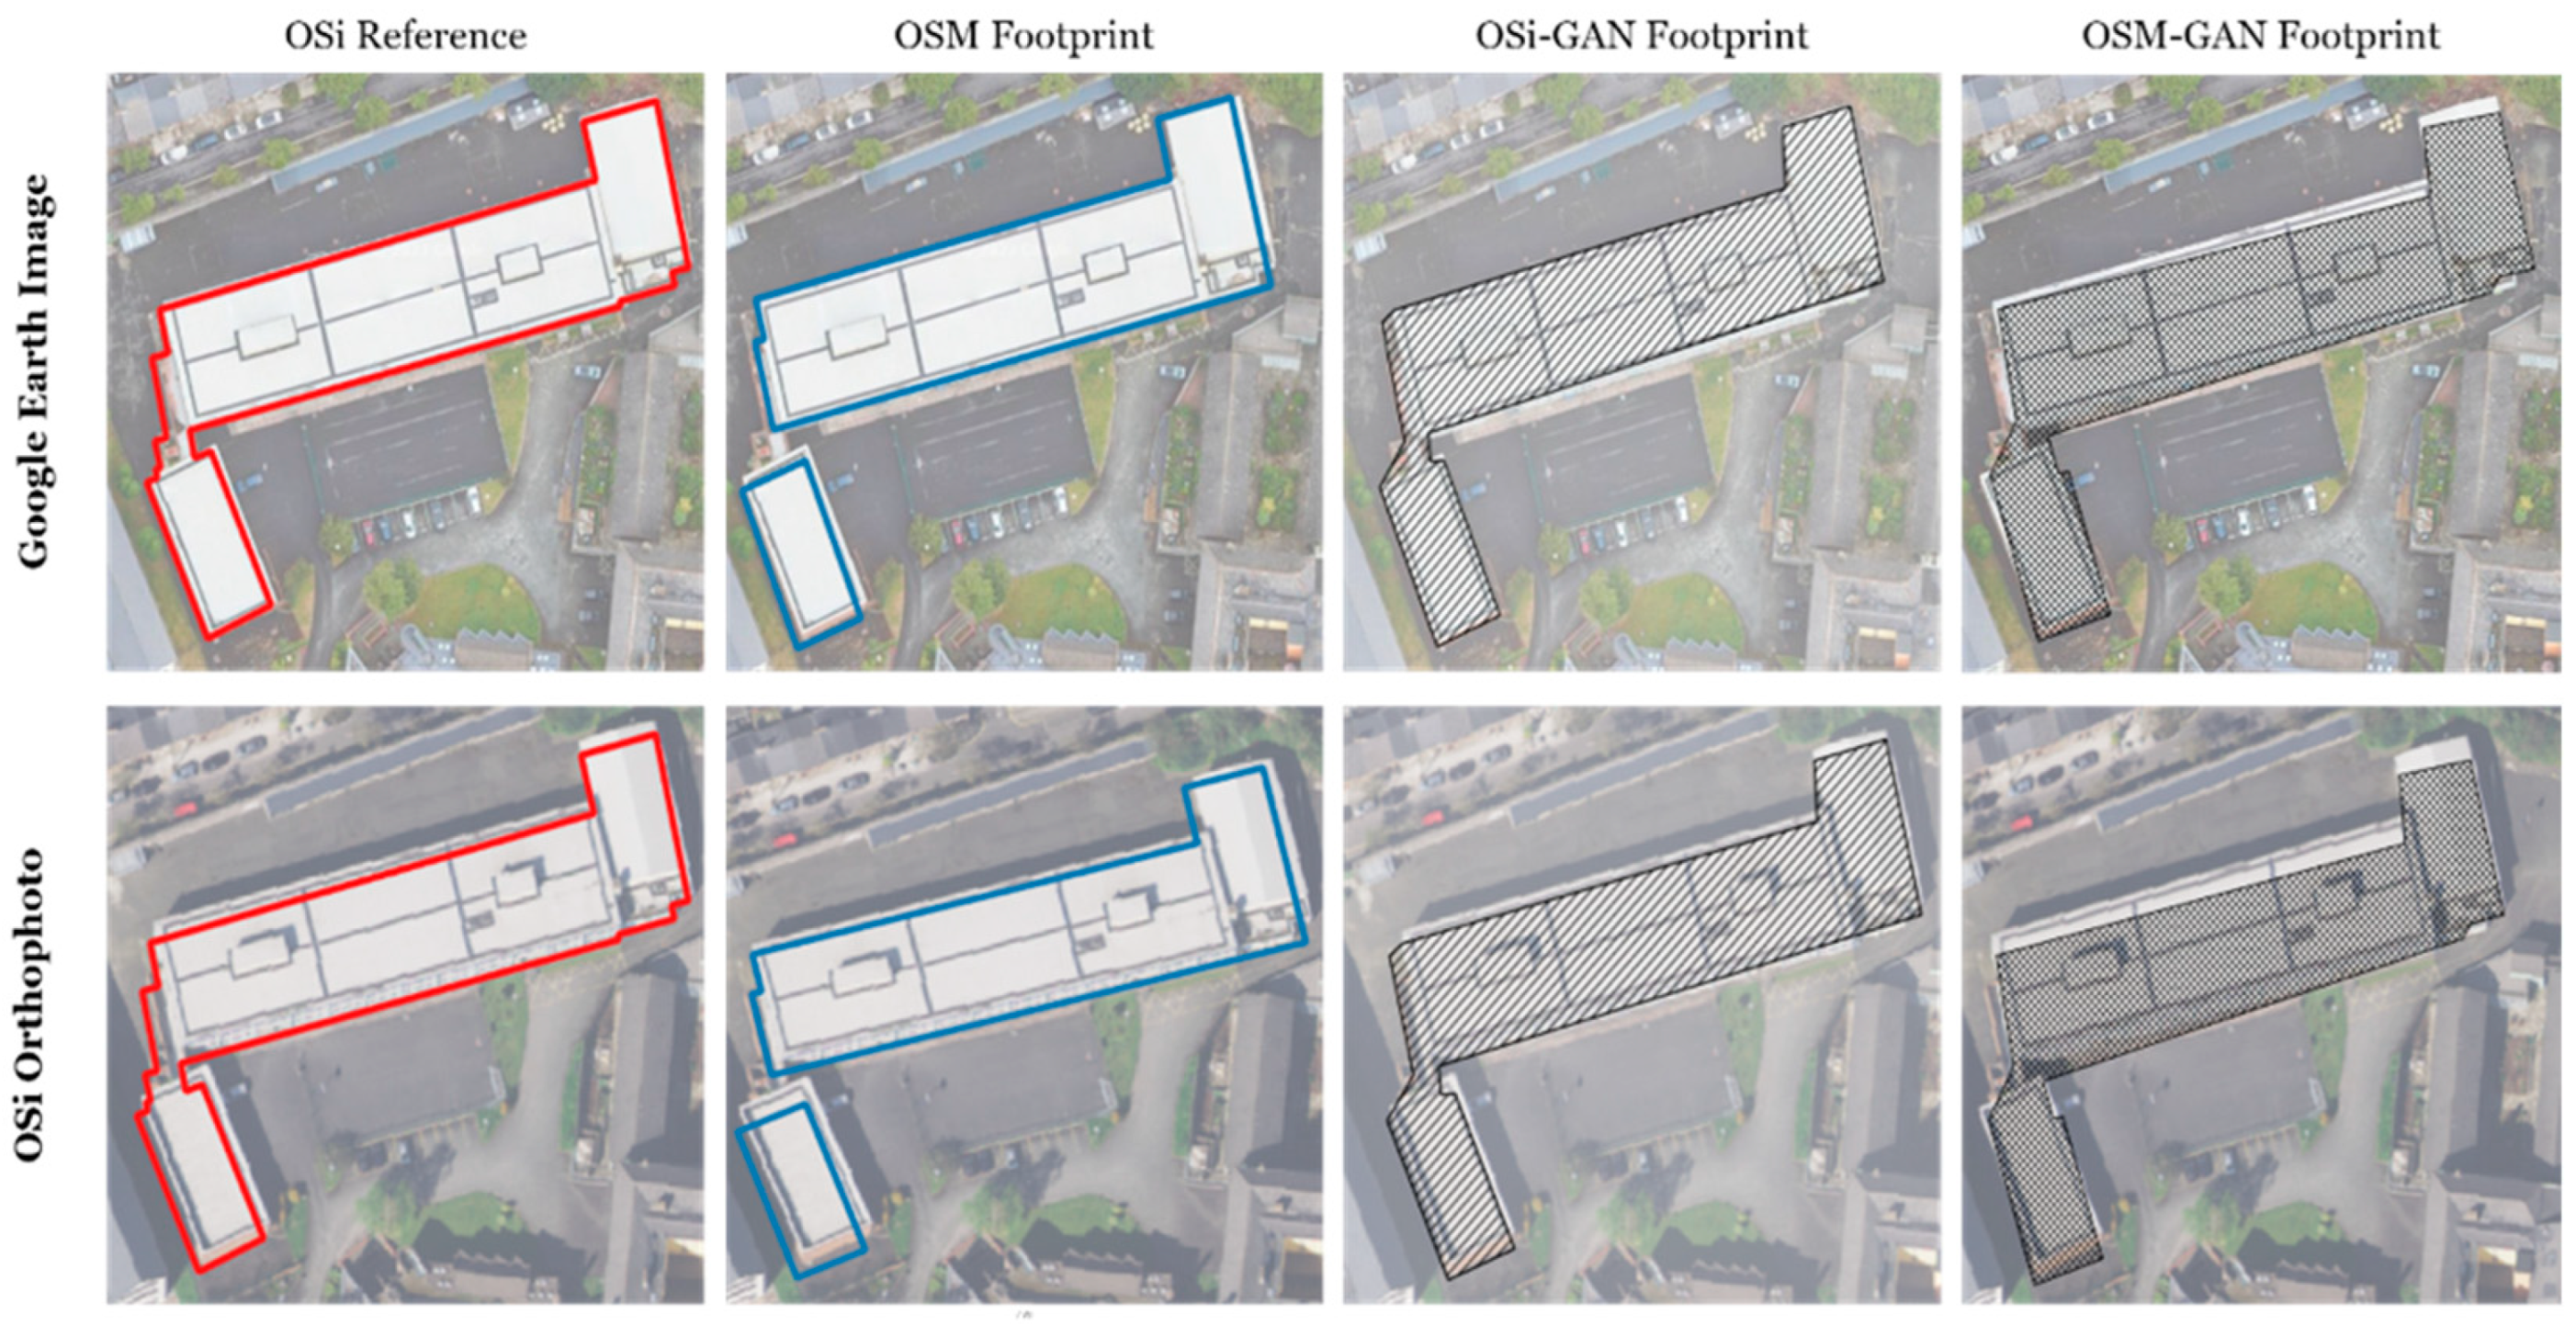
Figure 8 expands this view with a vector-on-vector overlay, showing clear geometric and positional alignment in AI-generated features relative to both OSM and OSi datasets.
In contrast, the differences in performance between OSi-GAN and OSM-GAN reflect the influence of training data characteristics. OSi-GAN achieves higher completeness due to its authoritative OSi training vectors, but its shape accuracy is slightly lower, likely because detailed reference geometries make it sensitive to shadows and closely spaced buildings. In contrast, OSM-GAN exhibits higher shape fidelity, possibly benefiting from smoother, more generalized OSM training data, though at the cost of lower completeness. These results highlight a trade-off between completeness and geometric precision linked to the source of training data. They also show that AI model performance may vary across regions with different urban densities or mapping coverages, suggesting the need for more adaptable or hybrid training approaches.
5. Conclusions
This study evaluated the reliability of GeoAI-generated building footprints for updating crowd-source maps. It considered the established spatial data quality metrics of completeness, shape accuracy, and positional accuracy, along with a qualitative (visual) assessment. To better capture the overall fidelity of building shapes, we adopted a dual-measure approach, employing both the Jaccard Similarity Coefficient (JSC) to evaluate shape alignment and Hausdorff Distance (HD) to assess boundary-level deviations independent of feature position. This approach enables a more comprehensive understanding of both overlap and spatial divergence, addressing the limitations of relying on a single metric to fully capture shape variances.
Our results show that both GeoAI models tested (OSM-GAN and OSi-GAN) outperforms current VGI data (OSM) in terms of completeness and positional accuracy. However, absolute shape accuracy remains a challenge, particularly in visually occluded areas (e.g., tree cover, shadows) and for buildings with complex geometries. While OSM-GAN demonstrates better average shape alignment (higher JSC) and lower HD, it exhibits greater variability across cases, underscoring the trade-offs between training data quality and model generalization.
These findings highlight the potential of GeoAI to enhance crowdsource mapping workflows, especially where timely, high-quality spatial data updates are needed. At the same time, our evaluation shows that quantitative QA methods alone may not fully capture all structural irregularities, semantic mismatches, or alignment inconsistencies in AI-generated data.
To address these gaps, we suggest that a more systematic, multi-dimensional QA framework is needed—one capable of assessing feature-level correctness, structural complexity, and semantic validity. As such, future work could explore comparisons based on high-fidelity reference points, such as building corners or edge networks, and incorporate machine-augmented but human-verified QA workflows to manage complexity on a larger scale. Importantly, such frameworks should be standardized across datasets and online mapping platforms like OpenStreetMap to ensure consistency, trust, and reproducibility.
A second research direction could improve the experimental design by decoupling confounding variables such as image and vector training sources. In this study, both the imagery (e.g., Google Earth vs. OSi orthophotos) and the training vectors (e.g., OSM vs. OSi footprints) varied across models, which limits the ability to isolate the influence of individual contributing factors. Future experiments can better control these variables, for example, by training multiple GeoAI models using the same imagery but different vector sources, or vice versa. This would enable a clearer assessment of how training data quality and image characteristics independently affect model performance and serve to improve the generalizability of evaluation outcomes in real-world mapping applications.
Furthermore, it is important to acknowledge that the findings are based on Irish data, and performance may vary across regions with different urban densities, architectural styles, or OSM coverages. Urban centers, suburban peripheries, and rural areas focus on different model behaviors, and variations across continents such as Europe, North America, or East Asia will likely further affect model performance. Nevertheless, the proposed QA methodology is applicable in general across regions and can support comparative analyses globally, although retraining or adapting GeoAI models to local environments is recommended.
Beyond technical QA implications, these findings hold practical value for disciplines such as urban planning, land-use monitoring, geography, and environmental governance. Particularly in regions with limited mapping resources or rapidly changing built environments, validated GeoAI outputs can reduce the burden of manual digitization and enable more responsive planning interventions. As such, this work can contribute to broader scientific and policy contexts concerned with sustainable urban development and spatial equity.
This work represents an initial investigation into the need to formalize QA practices for GeoAI outputs in general and underscores a particular requirement for more standardized, reproducible evaluation protocols for VGI datasets. Such QA practices are essential to ensure the accuracy, applicability, and trustworthiness of AI-assisted mapping in real-world scenarios as GeoAI becomes increasingly embedded in urban governance, environmental monitoring, and risk assessment applications.

