Article

Revealing Influencing Mechanisms and Spatial Pattern of Soil Cadmium Through Geodetector and Spatial Analysis

1
Shandong Institute of Geological Sciences, Jinan 250013, China
2
Key Laboratory of Gold Mineralization Processes and Resources Utilization, MNR, Jinan 250013, China
3
Shandong Key Laboratory of Mineralization Processes and Resources Utilization of Strategic Metal Minerals (Preparatory), Jinan 250013, China
4
Institute of Geographic Sciences and Natural Resources Research, Chinese Academy of Sciences, Beijing 100101, China
5
Technical Centre for Soil, Agricultural and Rural Ecology and Environment, Ministry of Ecology and Environment, Beijing 100012, China
6
Key Laboratory of Coupling Process and Effect of Natural Resources Elements, Beijing 100055, China
*
Author to whom correspondence should be addressed.
Land 2025, 14(10), 1975; https://doi.org/10.3390/land14101975
Submission received: 13 August 2025 / Revised: 20 September 2025 / Accepted: 28 September 2025 / Published: 30 September 2025
(This article belongs to the Topic Water-Soil Pollution Control and Environmental Management)

Abstract

Elucidating the dominant factors governing heavy metal accumulation and their spatial heterogeneity in soils is fundamental to implementing science-based environmental management protocols. In this study, a Geodetector model, spatial interpolation, bivariate local Moran’s I (BLMI), and hotspot analysis were adopted to reveal the spatial pattern and driving mechanisms of soil cadmium (Cd) across six townships in southern Shimen County, Hunan Province. Results showed that Cd accumulation in the study area was predominantly controlled by natural factors, though anthropogenic contributions were also significant. Strata (q = 0.068), soil type (q = 0.045), and atmospheric deposition (q = 0.046) emerged as the most influential factors. The interaction between different driving factors exhibited a synergistic enhancing effect. Spatial interpolation revealed elevated Cd concentrations primarily clustered in central and western regions, particularly concentrated in Jiashan Town. BLMI analysis confirmed significant spatial correlations between Cd distribution and driving factors, and hotspot areas showing strong spatial coherence with strata and soil type. This study provides valuable insights for understanding the driving mechanisms of soil heavy metal pollution and informs targeted contamination control strategies.

1. Introduction

With the progress and development of society, heavy metals have shown significant accumulation in soil [1,2]. Heavy metals can harm human health through the food chain and have attracted widespread public concern [3,4,5]. Soil heavy metal pollution originates from multiple sources, including soil parent materials, agricultural activities, transport activities, atmospheric deposition, topography, landuse types, and soil types [2,6,7,8,9,10]. These factors collectively shape the spatial distribution patterns of soil heavy metals. Identifying their potential sources is critical for clarifying the driving mechanisms behind heavy metal accumulation, which is of great significance for heavy metal pollution control and management.
Numerous previous studies have employed multivariate statistical analysis and receptor models for pollution source apportionment. These methods can identify potential heavy metal sources and quantify their relative contributions [11,12]. However, they primarily focus on mathematical relationships within datasets while neglecting spatial dependencies between driving factors and heavy metals, exhibiting inherent limitations [13]. Furthermore, heavy metal influences involve complex and heterogeneous factors encompassing both numerical (e.g., distance metrics) and categorical variables (e.g., soil types), posing analytical challenges in handling mixed data types [14]. The Geodetector model emerges as a novel statistical framework specifically designed to quantify spatial stratified heterogeneity and reveal underlying driving mechanisms. The Geodetector model accommodates both continuous and discrete variables while uniquely enabling the detection of interaction effects between paired driving factors [15]. Thus, the Geodetector offers distinct advantages in investigating the spatial variation of heavy metals. Existing studies have successfully applied it to identify driving factors, yielding robust results [13,16].
Understanding the spatial distribution of soil heavy metals is fundamental for assessing pollution levels and implementing targeted control measures [17]. Currently, the spatial distribution of soil heavy metals is typically derived using spatial interpolation methods [18]. Traditional spatial prediction techniques, such as Kriging (based on geostatistical principles) and Inverse Distance Weighting (based on distance decay principles), are widely employed [19]. Although spatial interpolation can reveal the spatial distribution characteristics of heavy metals, it struggles to elucidate the spatial association patterns between these metals and their driving factors [20]. The bivariate local Moran’s I effectively captures the spatial dependence and interaction mechanisms between variables by quantifying their association within local spatial units [21]. Hotspot analysis, on the other hand, identifies clusters of high and low values (hot and cold spots) within a region; overlaying these spots with driving factors can then intuitively demonstrate the correspondence between critical areas and these factors [14]. Integrating multiple methods not only reveals the spatial variation trends of heavy metals but also enhances our understanding of their spatial heterogeneity patterns.
Preliminary investigations have revealed the presence of soil Cd pollution in the southern region of Shimen County, Hunan Province. However, the pollution driving mechanisms and spatial distribution characteristics have not yet been systematically studied. Based on this, six counties in southern Shimen, Hunan, were selected as the research area. Geodetector model was adopted to analyze the driving mechanism of Cd accumulation. The ordinary Kriging interpolation method was used to obtain the spatial distribution pattern of soil Cd. Bivariate local Moran’s I (BLMI) was conducted to reveal spatial clustering and autocorrelation patterns of Cd concentrations and driving factors. Hotspot analysis and driving factor overlay visually demonstrate the spatial correspondence between high-value clusters and relevant factors. The objectives of this study are to (1) identify the main driving factors of soil Cd; (2) characterize the spatial distribution of soil Cd; (3) establish the spatial correlations between Cd concentrations and key driving factors; and (4) reveal the influencing mechanisms of the driving factors. This study can provide support for the analysis of the driving mechanisms of heavy metal elements and subsequent pollution control.

2. Materials and Methods

2.1. Study Area, Sampling, and Chemical Analysis

The research area is located in six townships in the southern part of Shimen County, Hunan Province, China (Figure 1). The study area is situated in a transitional monsoon climatic zone between central subtropical and typical subtropical regions, characterized by a mean annual temperature of 18.4 °C and annual precipitation of 1390.3 mm. Sampling was conducted in 2015, and a total of 673 sampling points were collected. A portable GPS was used to record the locations of sampling points. All the samples were stored in plastic bags and transported to the laboratory. The soil samples were air dried at room temperature, ground, and sieved through a 0.149 mm nylon sieve (200 mesh). Cd concentration was determined by inductively coupled plasma mass spectrometry (PE DRC-e, Waltham, MA, USA). The standard reference material (GSS-1, GSS-8) was used for quality control, and the recovery was within 100 ± 10%.

2.2. Potential Driving Factors

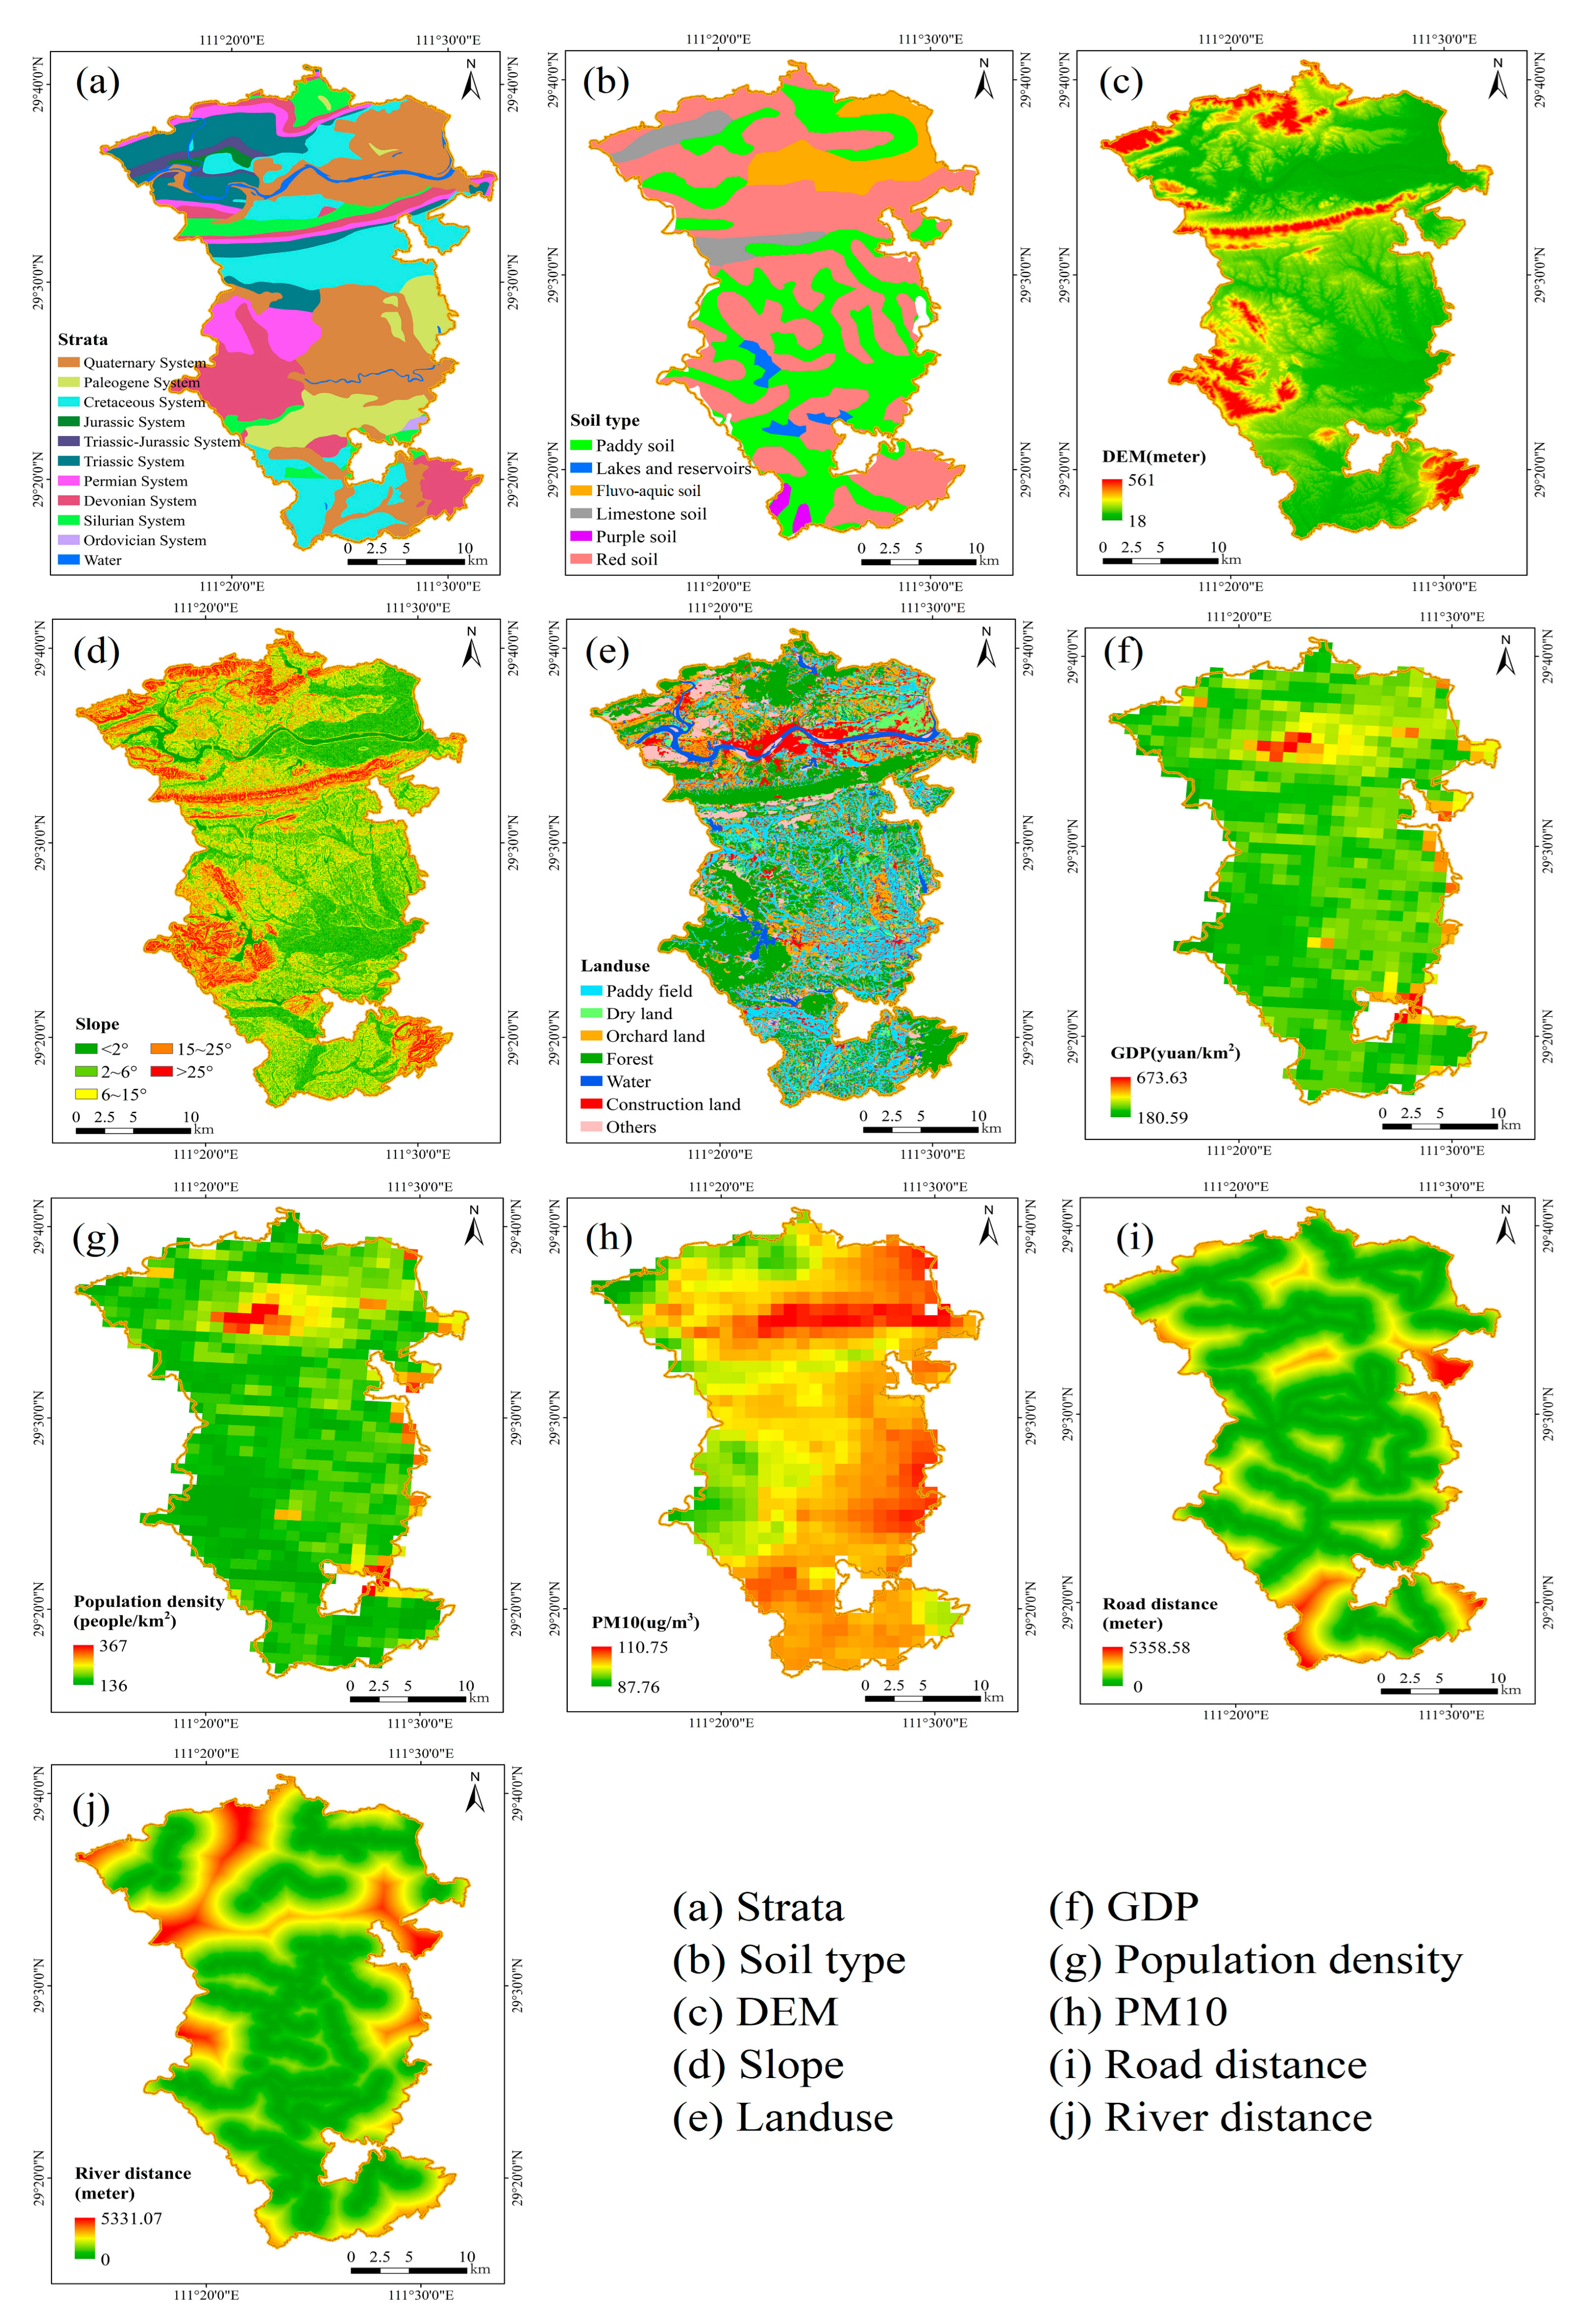
Soil heavy metals are affected by the combined effects of natural and anthropogenic factors. In this paper, 10 potential driving factors influencing soil heavy metals were selected for analysis (Figure 2). Natural factors include strata, soil type, topography, and slope; anthropogenic factors include landuse types, GDP, population density, atmospheric deposition, distance to roads, and distance to rivers. The specific descriptions of the driving factors are as follows:
(1)
Strata
Soil parent material refers to the loose substances formed by the weathering of rocks. Magmatic activities, sedimentation, and other geological processes can affect the mineral composition and chemical properties of parent materials. As the material basis for soil formation, parent material plays an extremely important role in the process of soil formation [22]. There are significant differences in heavy metal concentrations among different parent materials, which fully indicates that parent material is a key factor leading to the enrichment of heavy metals in cultivated soil [23]. The strata in the study area mainly include the Quaternary system, Paleogene system, Cretaceous system, Jurassic system, Triassic–Jurassic system, Triassic system, Permian system, Devonian system, Silurian system, and Ordovician system.
(2)
Soil type
Differences exist in soil physical and chemical properties, such as pH value, organic matter content, clay particle content, and redox status among different soil types. These properties play an important role in the accumulation of heavy metals [24]. Therefore, the heavy metal contents may vary across different soil types [25]. The soil types involved in this study mainly include paddy soil, fluvo-aquic soil, limestone soil, purple soil, and red soil. Under the Chinese Soil Taxonomy (CST), the five soil types are classified as follows: paddy soil (Anthrosols), red soil (Ferralosols), limestone soil and purple soil (Primosols), and fluvo-aquic soil (Semi-aquic soils).
(3)
Digital Elevation model (DEM)
Topography and geomorphology play an important role in the migration and distribution of soil heavy metals. Soils developed in different geomorphic units often exhibit strong spatial heterogeneity in their trace element contents [26]. In this study, the resolution of the DEM data is 12.5 m.
(4)
Slope
Slope is an important topographic factor affecting the migration and distribution of heavy metals. Steeper slopes increase the risk of soil erosion and loss, leading to the migration and accumulation of heavy metals [27,28]. In this paper, the slope data were obtained through slope analysis in ArcGIS 10.8 software (ESRI, Redlands, CA, USA) based on DEM data.
(5)
Landuse type
The intensity of agricultural activities may vary among different landuse types. Pesticides and chemical fertilizers are potential sources of heavy metals, and previous studies have shown that long-term application of pesticides and chemical fertilizers may lead to heavy metal pollution in soil [29]. The landuse types in the study area mainly include paddy field, dry land, orchard land, forest, construction land, other land, and water areas.
(6)
Gross Domestic Product (GDP)
GDP level can, to a certain extent, characterize the level of industrialization in a region. Generally, the higher the degree of industrialization, the more waste emissions from industry, which in turn leads to more severe soil heavy metal pollution [30]. Considering the long-term impact of GDP on heavy metals, the weighted average values of four stages (2000, 2005, 2010, and 2015) were adopted to characterize the degree of influence of economic activities on heavy metals.
(7)
Population density
Population density can generally characterize the intensity of human activities. Typically, in areas with higher population density, soil is more significantly affected by human activities, and the content of heavy metals in soil is usually higher [31]. In this paper, considering the impact of factors such as population migration and mobility, the population density of four periods (2000, 2005, 2010, and 2015) was selected, and their weighted average was used to characterize the influence of population density on the accumulation of heavy metals.
(8)
Atmospheric deposition
Atmospheric deposition is a significant source of soil heavy metals [8]. In this study, PM10 is used as an indicator of atmospheric deposition. The impact of atmospheric deposition on soil heavy metals was characterized by calculating the weighted average of PM10 data over a 15-year period from 2001 to 2015 to obtain the deposition data for the study area.
(9)
Road distance
Traffic activities have an obvious impact on the accumulation of soil heavy metals. Previous studies have also indicated that traffic activities are an important factor influencing soil heavy metals [32]. In this paper, the distance from sampling points to roads was calculated to characterize the degree of influence of traffic activities on soil heavy metals.
(10)
River distance
River irrigation is also an important factor contributing to the accumulation of soil heavy metals. Irrigation with river water containing heavy metals can lead to the accumulation of soil heavy metals [33]. In this paper, the distance to rivers was calculated using ArcGIS 10.8 software to characterize the degree of influence of river irrigation on heavy metals.

2.3. Methods

2.3.1. Geodetector

The Geodetector model is a new statistical method used to detect spatial heterogeneity and reveal the driving factors behind it [15]. This method has clear physical significance and does not require linear assumptions. Its basic principle can be stated as follows: Suppose the study area is divided into several sub-regions. If the sum of the variances of all sub-regions is less than the total variance of the region, it indicates the existence of spatial heterogeneity; if the spatial distributions of two variables tend to be consistent, it means there is a statistical correlation between them. The Geodetector model includes a factor detector, interaction detector, risk detector, and ecological detector. In this study, the factor detector and interaction detector were mainly used. Their explanatory power is measured by the q value, and its expression is as follows.
q = 1 h = 1 L N h σ h 2 N σ 2 = 1 S S W S S T
S S W = h = 1 L N h σ h 2 ,   S S T = N σ 2
In the above formula, h = 1, …, L represents the classification and partitioning of independent or dependent variables; Nh and N denote the number of units in sub-region h and the total number of units in the entire region, respectively; σh2 and σ2 are the variances of sub-region and the entire region, respectively; SSW and SST stand for the sum of intra-layer variances and the total variance, respectively. The q value ranges from 0 to 1, with a larger q value indicating a stronger explanatory power of the independent variable for the dependent variable [15].
An interaction detector was used to detect the interactive influences between two different factors. The basic principle of interaction is to quantify the difference between “the impact of a single factor” and “the superimposed impact of multiple factors”, so as to determine whether there are synergistic, antagonistic, or independent relationships between factors, thereby revealing the joint action mechanism between different factors.

2.3.2. Ordinary Kriging (OK)

OK is an interpolation method that performs unbiased and optimal interpolation of regionalized variables in unsampled areas using original data and characteristic parameters of the semivariogram model. Its advantage lies in making maximum use of the various information provided by spatial sampling. The OK interpolation method is based on semivariogram theory and structural analysis. The semivariogram can effectively measure spatial autocorrelation and variability, and its formula is as follows:
γ ( h ) = 1 2 N ( h ) i = 1 N ( h ) Z ( x i ) Z ( x i + h ) 2
Z * ( x 0 ) = i = 1 n λ i Z ( x i )
In the above formula, N(h) represents the number of point pairs with an interval of h within the study area. Z(xi) and Z(xi + h) are the measured values at points xi and xi + h, respectively, and h is the distance between two separated sample points. Z(x0) is the predicted value at the unknown point x0, n is the number of sample points, and λi is the weight value of the sample point.

2.3.3. Bivariate Local Indicators of Spatial Association

Based on the assumption that two closely related variables tend to show a similar spatial pattern, Bivariate local Moran’s I (BLMI) was used to determine spatial correlations between Cd concentrations and driving factors using Geoda 1.20 (http://geodacenter.github.io (accessed on 20 July 2025)) [34]. The results can be divided into five categories: high–high, high–low, low–low, low–high, and not significant [35]. The study area was divided into 836 grid cells (1 km × 1 km), and spatial analysis of the grid data was conducted with BLMI.
I k l = x i k j = 1 n w i j x j l
where x i k and x j l are the values of variables k and l at locations i and j, respectively. w i j is the spatially weighted matrix between i and j. n is the number of objects in the analysis. If I k l is significantly positive or negative, k at position i is observably correlated with l in the adjacent area; if not, there is no obvious correlation between them.

2.4. Data Source and Processing

The data on potential driving factors in this study were obtained from the following sources: Geological formation data (1:200,000) was provided by the China Geological Survey. Soil type data, DEM (12.5 m resolution), GDP, and population density were obtained from the Resource and Environment Science Data Platform (https://www.resdc.cn/ (accessed on 25 June 2025)). Slope data were derived from DEM data using slope analysis in ArcGIS 10.8. Landuse data (10 m resolution) was obtained from Global Land Cover Data by Tsinghua University. PM10 concentrations were extracted from the China High Air Pollutants (CHAP) dataset, produced by the research team of Dr. Wei Jing and Prof. Li Zhanqing at the University of Maryland (https://zenodo.org/records/6449937 (accessed on 8 July 2025)). Road and river distribution data were primarily acquired from the National Catalogue Service for Geographic Information of China (https://www.webmap.cn/commres.do?method=result25W (accessed on 25 June 2025)).
When conducting data analysis based on the Geodetector model, continuous variables need to be discretized [15]. The cut points of slope to each sampling points were obtained from Land Industry Management Standards of the People’s Republic of China (TD/T 1055-2019), which divides slope into 5 stratifications: slope < 2°, 2° ≤ slope < 6°, 6° ≤ slope < 15°, 15° ≤ slope < 25°, and slope ≥ 25° [36]. The other numerical data for driving factors were transformed into 3 categories using the natural break method before entering into the Geodetector model [37].

3. Results and Discussion

3.1. Detection of Driving Factors by Geodetector Model

Geodetector analysis results (Figure 3) indicated that five factors—strata, soil type, DEM, GDP, and atmospheric deposition—exerted a significant driving influence (p < 0.05) on the spatial distribution of Cd in the study area, with q values ranging from 0.01 to 0.068. Among natural factors, strata (q = 0.068) and soil type (q = 0.045) demonstrated the most significant influence on Cd, while DEM (q = 0.010) also showed a driving effect. Regarding anthropogenic factors, atmospheric deposition (q = 0.046) and GDP (q = 0.010) also had significant impacts on Cd accumulation. In contrast, five other factors—slope, landuse type, population density, road distance, and river distance—showed no significant impact on Cd accumulation.
The interaction detector analysis within the Geodetector framework revealed significant interactions among different driving factors (Figure 4), all of which exhibited enhancement effects. A heatmap was employed in this study to visualize the strength of these interactions between factors (factors not statistically significant in the factor detector were excluded from the figure). Following interaction, the q values for the driving factor pairs ranged from 0.01 to 0.114. The strongest interaction was observed between strata and soil type (q = 0.114), followed by that between atmospheric deposition and soil type (q = 0.106). It is noteworthy that in the factor detector results, strata, soil type, and atmospheric dust deposition also demonstrated relatively high individual q values, highlighting their significant roles in Cd accumulation within the study area.

3.2. Spatial Distribution of Cd Concentration

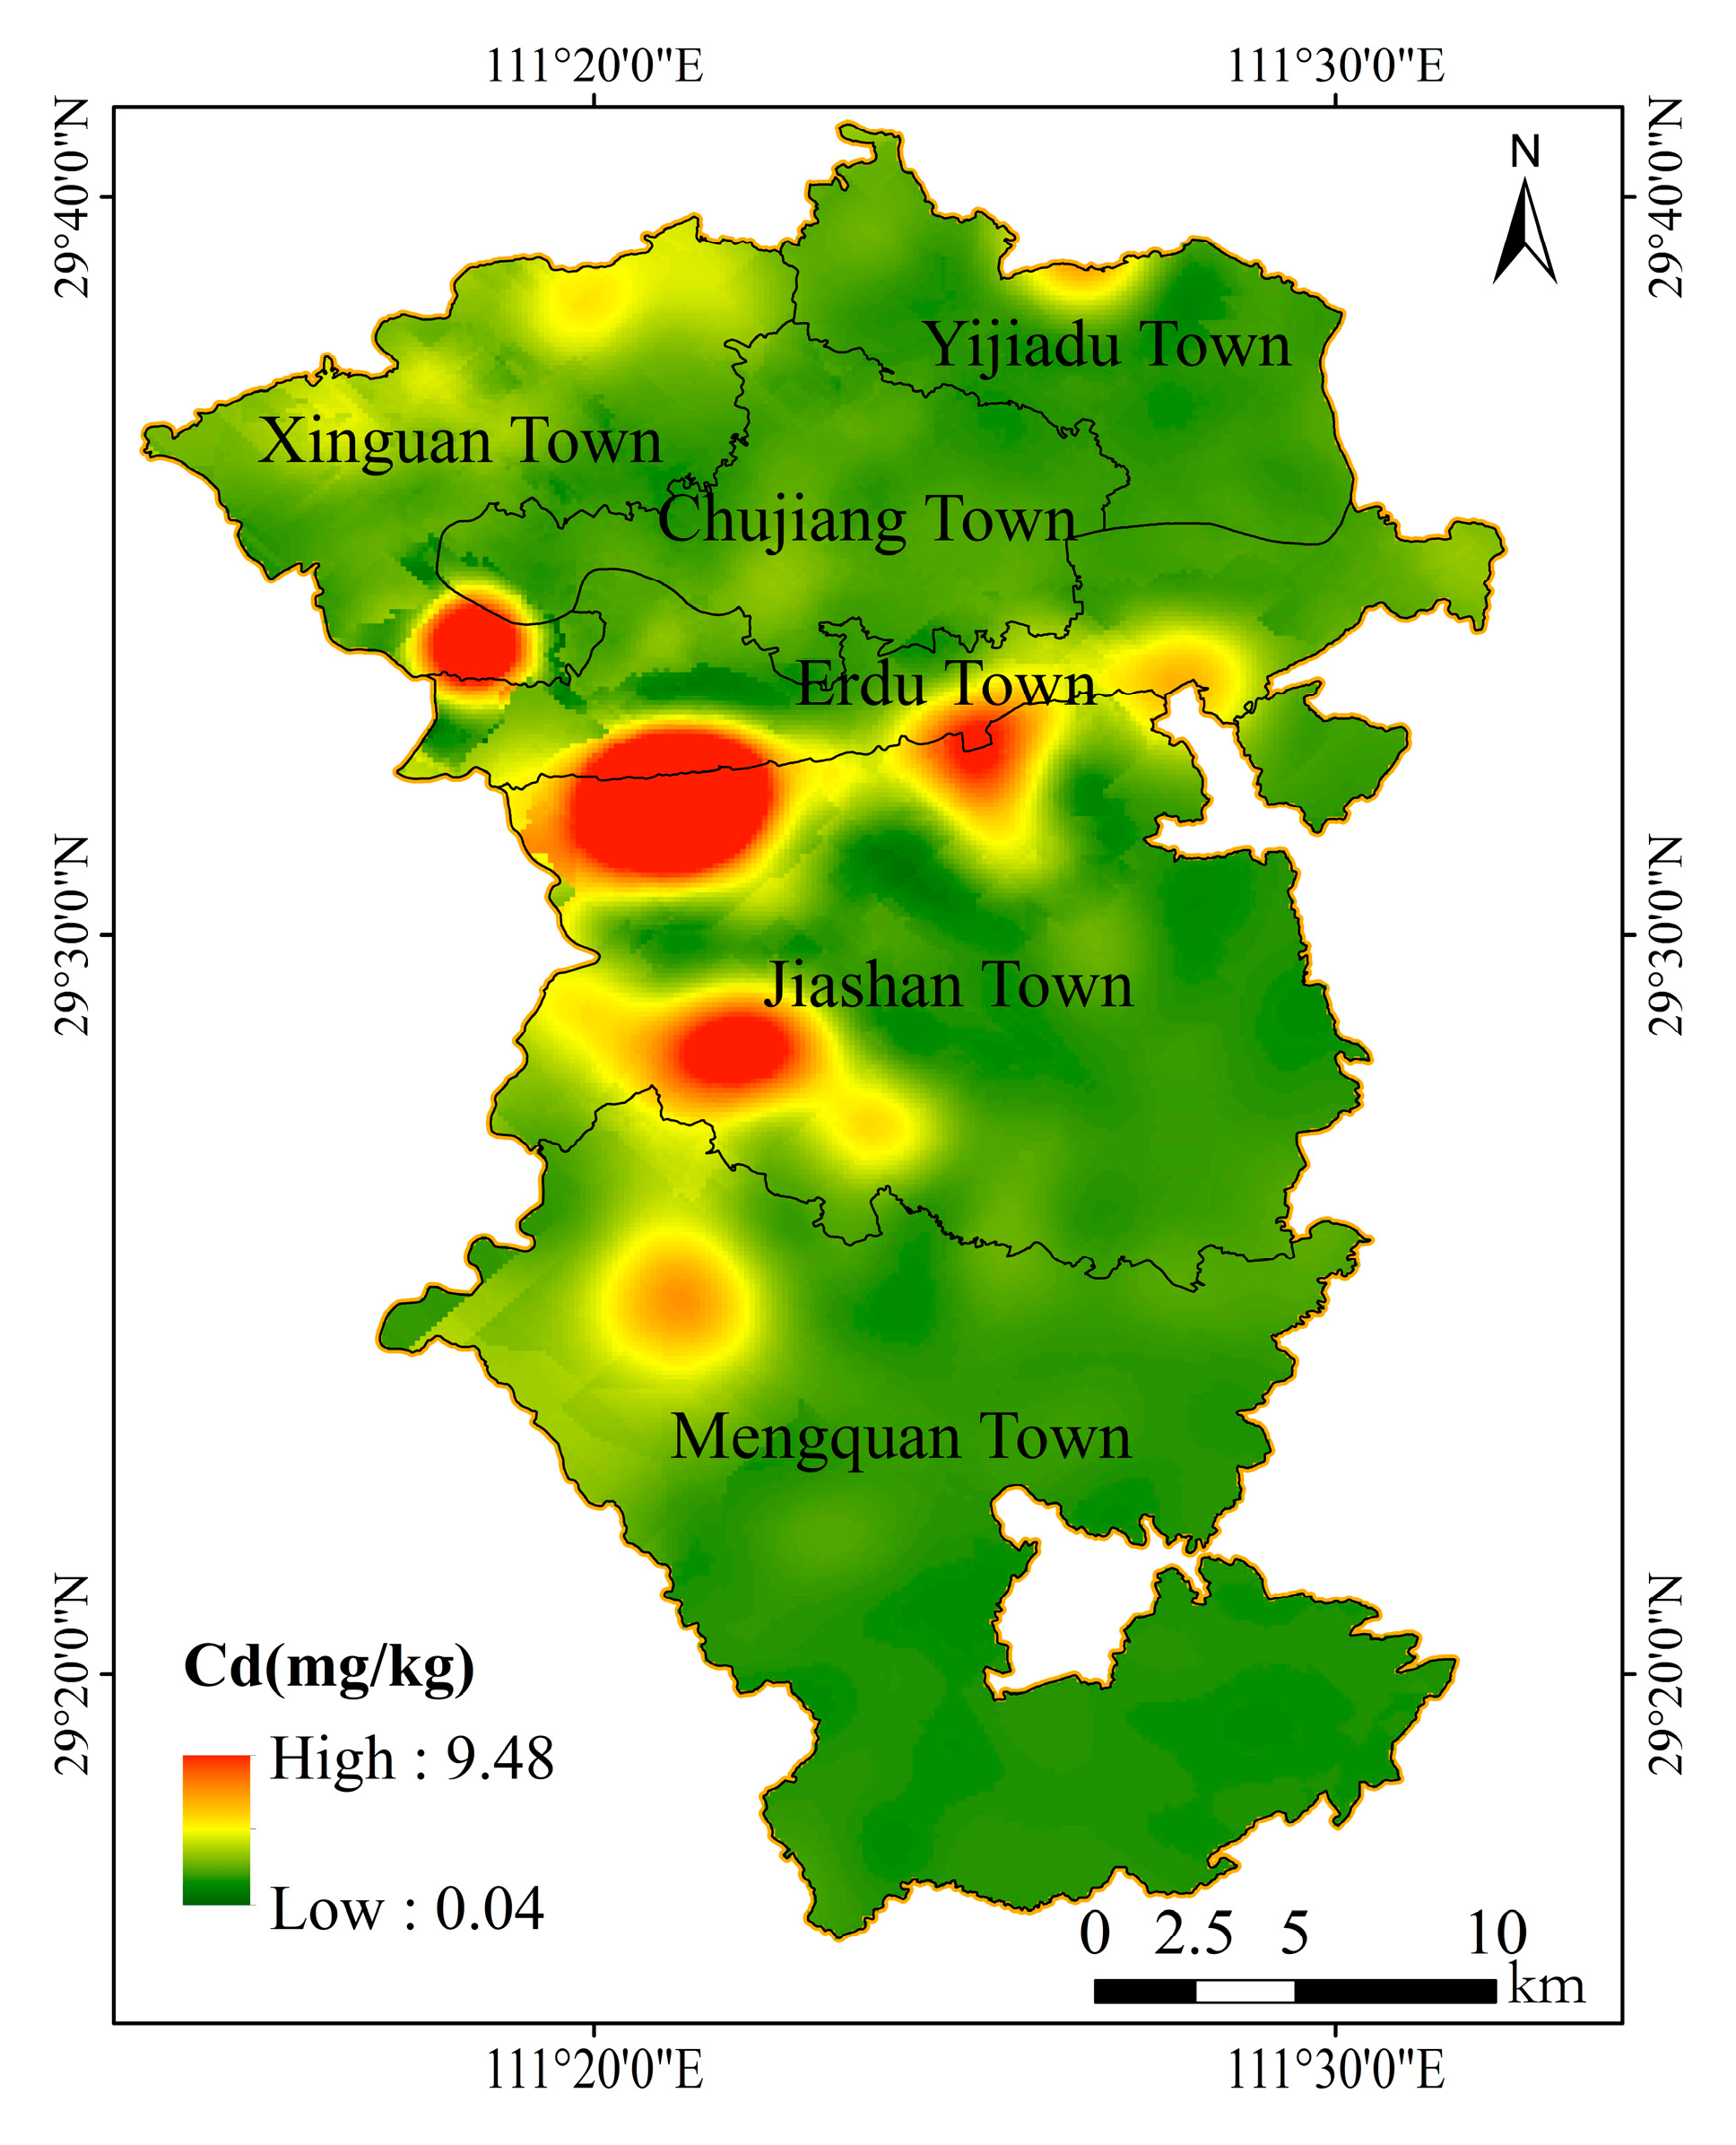
The spatial distribution of soil Cd in the study area was analyzed using Ordinary Kriging interpolation. Prior to interpolation, the semivariogram for Cd was fitted using GS+9.0 software. The Gaussian model provided the best fit, with a coefficient of determination (R2) of 0.69, a range of 3325 m, and a nugget effect of 10.27%. These fitting parameters indicated a very strong spatial autocorrelation of Cd within the study area [38]. As shown in Figure 5, high-concentration areas were found to be predominantly clustered in the central-western region of the study area, with Jiashan Town representing the main concentration zone. Elevated Cd levels were also observed in the northern region, encompassing Xinguan Town and Yijiadu Town. Although sporadic high-value pockets occurred in the southern Mengquan Town, Cd concentrations across this region were generally relatively low.

3.3. Spatial Association Between Cd Concentrations and Driving Factors

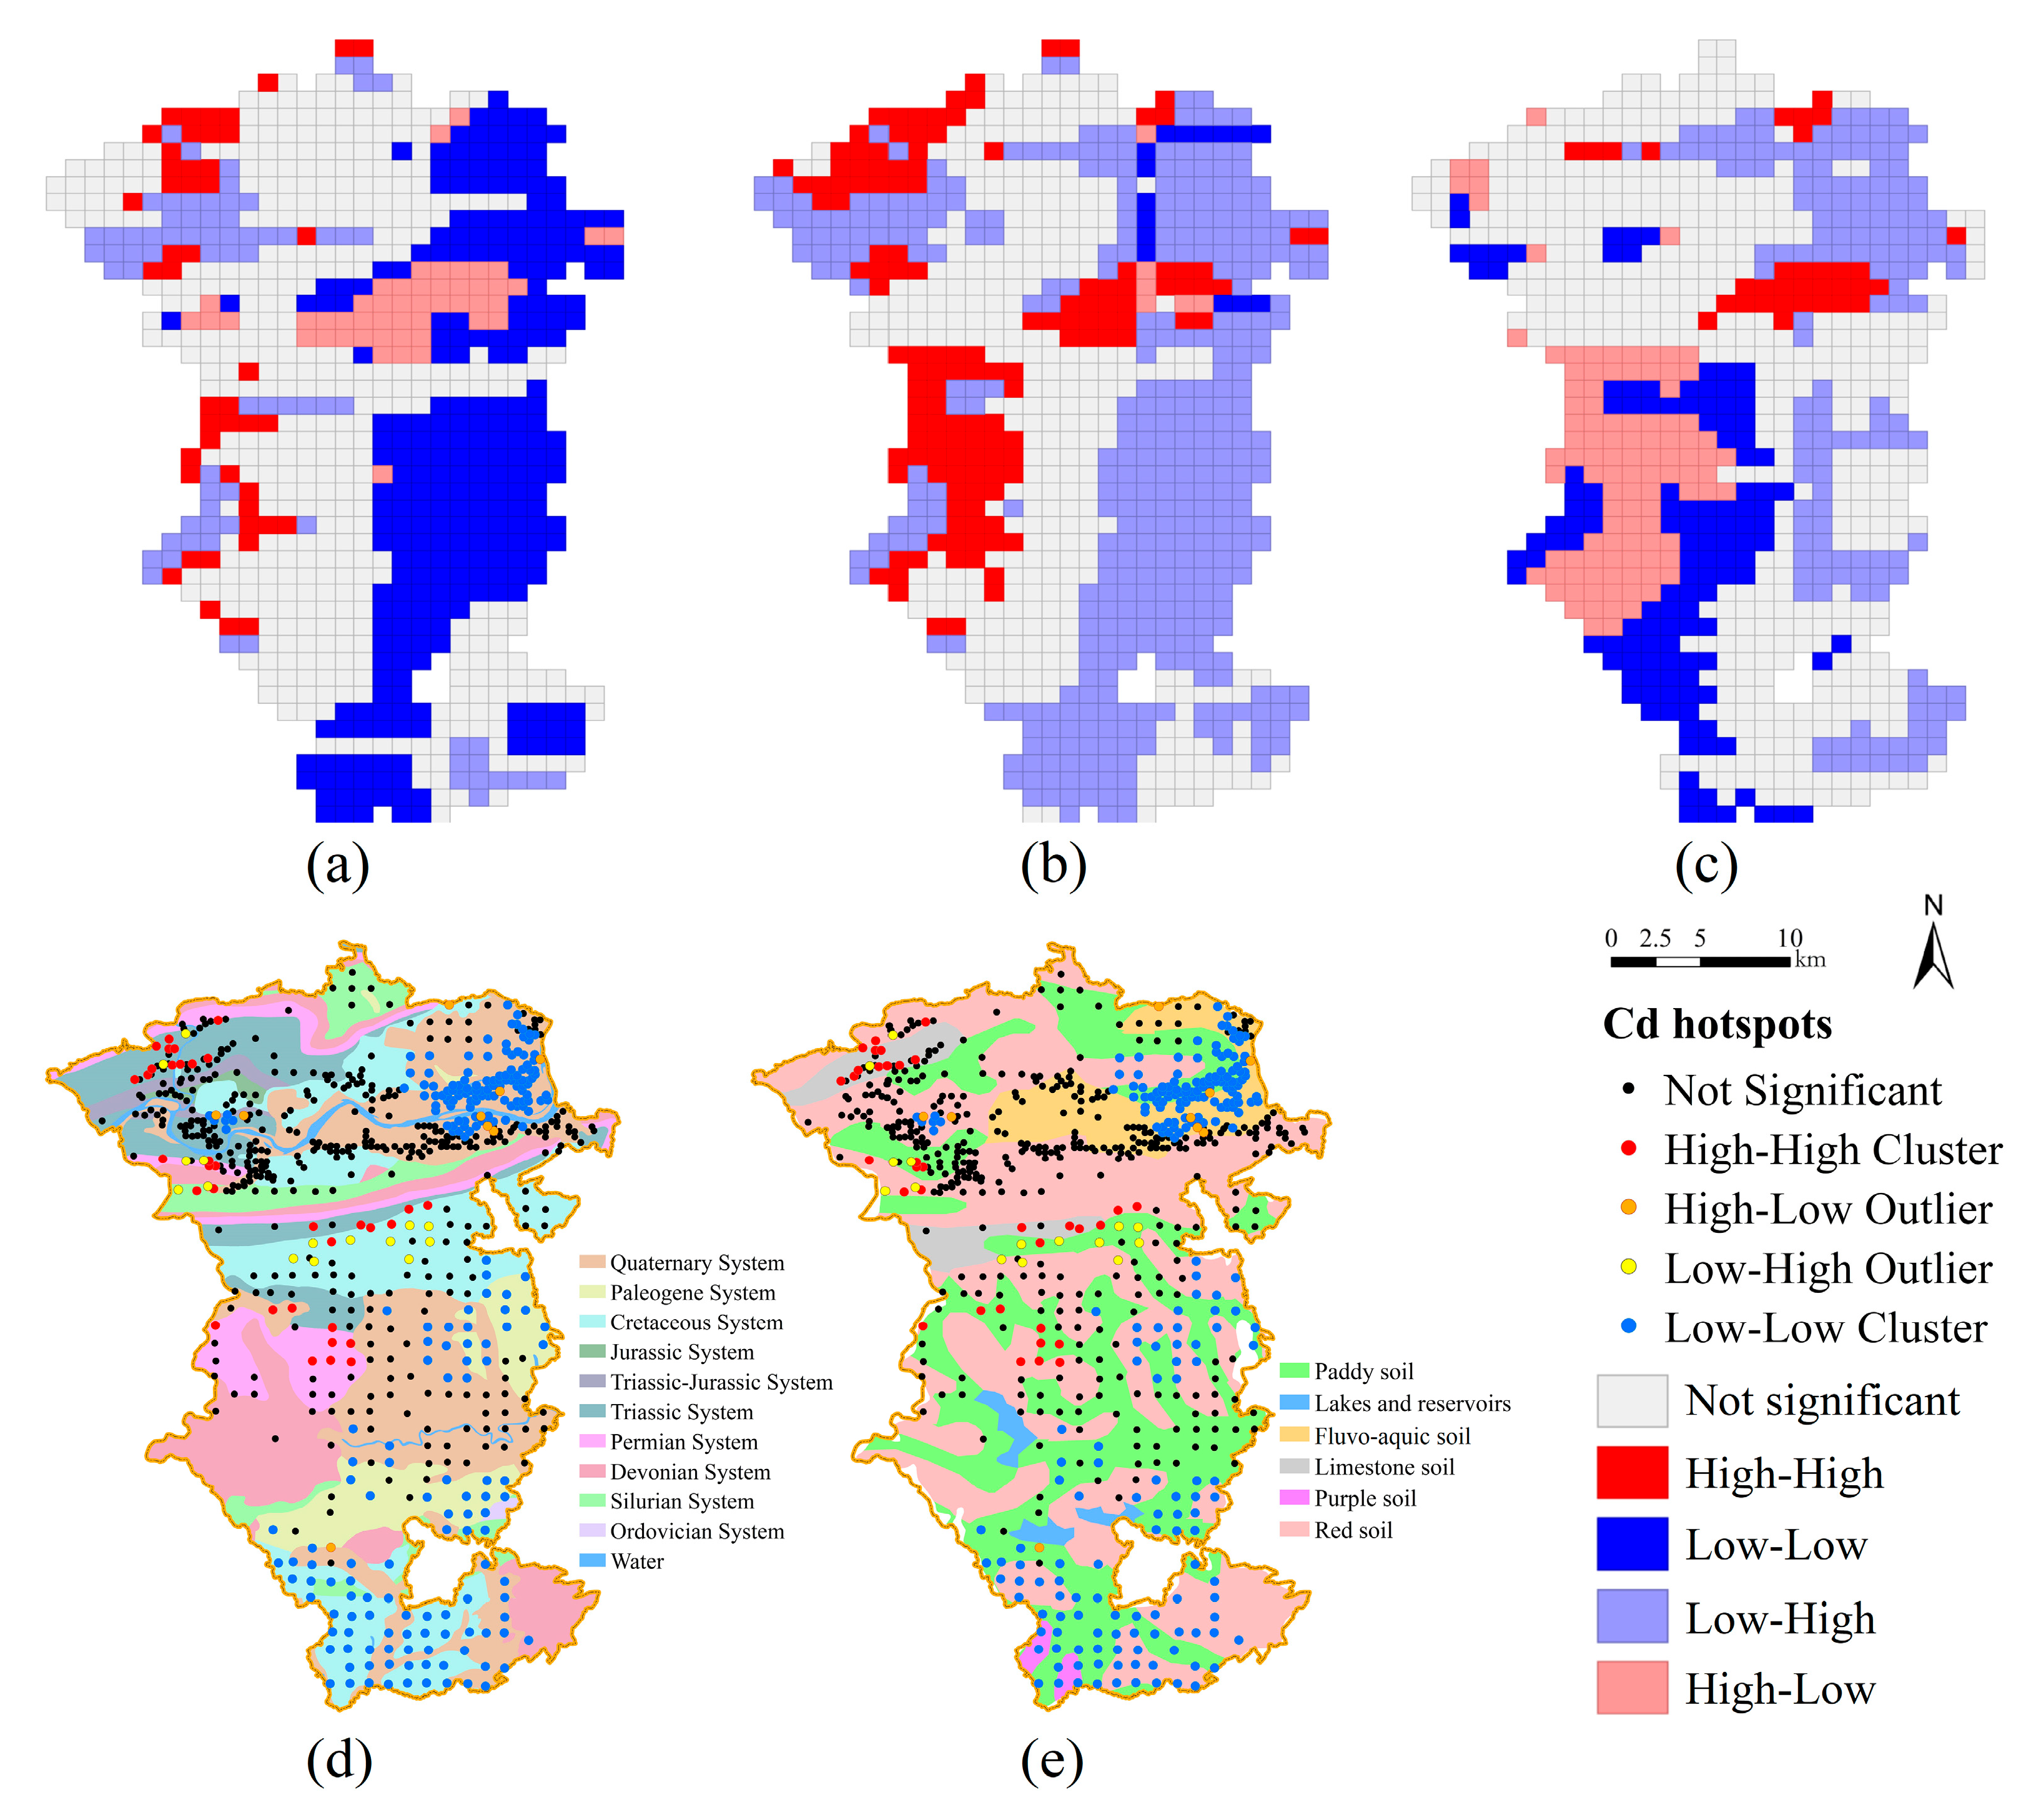
In this study, the spatial correlations of Cd concentrations and three numerical driving factors (DEM, atmospheric deposition, and GDP) were analyzed by BMLI. Spatial correlation maps of Cd concentrations and the three numerical driving factors are shown in Figure 6a–c. The high–high areas were of great concern because of the co-existence of high Cd concentrations and high driving factor values [21]. The high–high clusters of Cd and DEM were scattered in the northwestern and western areas, indicating a synergistic effect of topography on Cd accumulation [39]. In contrast, the high–high clusters of Cd and atmospheric deposition were concentrated in the northwest, west, and central regions, suggesting notable impacts from atmospheric deposition [8]. The low–high areas (low Cd but high atmospheric deposition) in the western area were attributed to the naturally low background Cd levels (0.20–0.39 mg/kg) in Quaternary, Paleogene, and Cretaceous strata, where deposition probably had limited influence. For Cd and GDP, small high–high clusters sporadically occurred in central areas, reflecting localized anthropogenic contributions [40]. Notably, extensive high–low areas (high Cd but low GDP) in the west were primarily driven by natural factors.
Hotspot analysis was employed to identify spatial clusters (hotspots and coldspots) of Cd in the study area. By overlaying with strata and soil type data, the spatial correlations between Cd distribution and driving factors were revealed. The results showed that Cd hotspots were primarily concentrated in the northwestern and central regions, while coldspots dominated the northeastern, eastern, and southern areas. Spatial overlay analysis (Figure 6d,e) demonstrated a strong consistency between Cd hotspots and the two factors. For strata, Cd hotspots predominantly occurred in Permian and Triassic strata. In terms of soil type, they were mainly associated with limestone soil and paddy soil.

3.4. Main Driving Factors That Influence Soil Cd Concentration

The soil Cd content in the study area was significantly influenced by geological strata. Soils derived from strata of different geological ages exhibit significant differences in Cd concentrations (Figure 7). The results showed that soil samples derived from Permian strata had the highest mean Cd content (1.17 mg/kg), followed by Triassic (0.65 mg/kg) and Devonian strata (0.56 mg/kg). This pattern aligns with some previous studies: Chen et al. [41] reported that Permian carbonate rocks had a mean Cd content (0.25 ± 0.14 mg/kg) significantly higher than that of the upper continental crust (UCC, 0.098 mg/kg) and the global average for carbonate rocks (0.035 mg/kg). They also found that Triassic clastic rocks contained Cd at a mean concentration of 0.23 ± 0.097 mg/kg, 2.3 times the UCC value. Further supporting the geological influence, Jiang et al. [42] demonstrated in the typical Se-enriched area of Enshi that concentrations of both Se and Cd in rocks and soils increased from the Cambrian to the Triassic period, peaking during the Permian.
Soil type was also a significant factor influencing Cd levels in the study area. Different soil types exhibited variations in physicochemical properties such as pH, organic matter content, soil texture, and redox potential. These factors are closely related to the adsorption, desorption, migration, and transformation processes of heavy metals [24]. The box plot of Cd content across different soil types is shown below (Figure 8). Based on the average Cd content measured, the ranking among soil types was as follows: limestone soil (1.18 mg/kg) > paddy soil (0.43 mg/kg) > red soil (0.40 mg/kg) > fluvo-aquic soil (0.32 mg/kg) > purple soil (0.16 mg/kg). In this study, the average Cd content in limestone soil was nearly three times that in paddy and red soils, and over seven times higher than in purple soil. Previous studies indicate that primary Cd enrichment occurs in some limestone strata due to regional geological activities, such as volcanic eruptions and hydrothermal activities. For example, limestone in the karst region of Southwest China generally has high Cd background values, and soils developed from its weathered materials exhibit significantly higher Cd content than those derived from clastic rock parent materials [43]. Heavy metal elements, including Cd, often undergo significant enrichment during the weathering and soil-forming processes of carbonate rocks. For instance, soils developed from limestone in the Jura Mountains of Switzerland have an average Cd content of 0.82 mg/kg, which far exceeds the local soil element background values [44]. The Cd content in paddy soils within the study area was also relatively high, with an average value of 0.43 mg/kg. Heavy metal content in paddy soils is of particular concern for human health, as over half of the world’s population relies on rice as a staple food [45]. Data compiled from research show that the average cadmium concentration in Chinese paddy soils ranges from 0.018 to 4.230 mg/kg. Regions with excessive Cd levels are concentrated in the Yangtze River Basin and southeastern coastal areas, including Hunan, Jiangsu, Chongqing, Guangxi, Zhejiang, and Guangdong [46]. The mean concentrations of Cd in paddy soil from Abakaliki, Nigeria, ranged from 1.036 ± 1.86 mg/kg. Cd in most of the soil samples exceeded some Nigerian and international standards [47].
Atmospheric deposition is considered an important source of heavy metal accumulation [48]. In this study, atmospheric deposition was also found to contribute significantly to the accumulation of Cd. Previous studies have shown that heavy metal content in atmospheric deposition is often significantly higher than that in soil [49]. Atmospheric deposition is one of the primary sources of Cd pollution in China. Between 1999 and 2015, the average atmospheric Cd deposition flux across China was 0.41 mg/(m2·yr) [50]. In Hunan Province, the Cd deposition fluxes were 1.77 mg/(m2·yr) (2000–2010) and 0.86 mg/(m2·yr) (2010–2020), substantially higher than the national average [51]. Hunan Province, known as the home of non-ferrous metals in China, experiences frequent activities such as mining and smelting. This leads to elevated heavy metal content in its atmospheric deposition, further contributing to severe heavy metal accumulation in local soils [52]. Historical records indicate mining activities for limestone and coal within Shimen County, which may have influenced Cd accumulation to some extent. Furthermore, in this study, GDP was also identified as a factor promoting heavy metal accumulation. GDP can indirectly reflect the intensity of human activities, consequently indicating the level of agricultural intensification and industrial development [53]. The application of pesticides and fertilizers is a significant source of soil heavy metals, and industrial waste discharges also contribute to their accumulation [54,55]. Generally, higher GDP tends to be associated with stronger human activities, which facilitates the accumulation of soil heavy metals [56].
In this study, DEM was also identified as a significant factor influencing Cd accumulation. DEM affects the migration and transformation of heavy metals, thereby reshaping their spatial distribution patterns [27]. Under different topographic conditions, variations occur in water flow and soil erosion processes. Runoff can transport heavy metal particles from the soil and deposit them in downstream areas [57]. Concurrently, topography influences landuse patterns, as flatter terrain is generally more accessible for development. This may lead to increased agricultural inputs and consequently contribute to heavy metal accumulation [9].

3.5. Limitations and Perspective

Although the main driving factors and spatial distribution characteristics of soil Cd have been identified and obtained, there are still certain limitations in this study. Firstly, there are many factors affecting heavy metals. Although many important driving factors have been included, some other driving factors may still be omitted, which, to a certain extent, makes the analysis results less comprehensive. For example, agricultural activities are actually an important factor in the accumulation of Cd pollution [58]. However, such data are difficult to obtain and quantify at the research scale; therefore, they are not considered in this study. Secondly, the research area of this paper is relatively small, which requires higher data resolution. Although data such as atmospheric deposition and GDP can reflect spatial differences to a certain extent, their resolution is still limited, which will have an adverse impact on the analysis results. In future research, higher-resolution data can be used to obtain more accurate analysis results. Thirdly, the final q value derived from the Geodetector is subject to variation depending on the discretization method and the number of strata applied to the independent variables [59]. The interactions between driving factors and heavy metals are relatively complex. This study reveals the driving mechanisms and spatial distribution patterns of Cd in the study area. In subsequent research, various methods such as machine learning could be employed to validate the model results, enhancing their rationality and reliability. Additionally, analyzing temporal variations of heavy metals is also worth exploring, as it can provide clearer insights into their changes over time.

4. Conclusions

This study, conducted in six townships of southern Shimen County, Hunan Province, revealed that natural factors (particularly strata, soil type, and DEM) were the dominant drivers of soil Cd accumulation, with significant anthropogenic contributions from atmospheric deposition and GDP. Critically, synergistic interactions between factors, most notably between strata and soil type, exerted a stronger influence on Cd accumulation than individual factors alone. Spatially, high Cd concentrations were concentrated in the central and western regions (especially Jiashan Town), with sporadic occurrences in the north and south. Spatial cluster maps of Cd concentrations and three numerical driving factors (DEM, atmospheric deposition, and GDP) were qualitatively generated using BMLI. High–high levels of Cd and driving factors should be given priority attention when taking specific prevention and control measures. The spatial distribution of Cd hotspots corresponds with both strata (Permian, Triassic) and soil types (limestone soil, paddy soil). These findings collectively clarify the key drivers and spatial distribution patterns of Cd in the study area, providing a scientific basis for targeted pollution source identification and precision control strategies. The proposed methodological framework is also applicable to heavy metal pollution research in similar regions.

Author Contributions

J.W. contributed to conceptualization, methodology, writing—original draft, writing—review and editing, and visualization. J.Y. and C.Z. contributed to writing—review and editing, and supervision. X.T. and X.Z. contributed to methodology. W.Z., H.X., and X.L. contributed to supervision. All authors have read and agreed to the published version of the manuscript.

Funding

This study was supported by the Open Foundation of the Key Laboratory of Coupling Process and Effect of Natural Resources Elements (2024KFKT004) and the Shandong Provincial Natural Science Foundation (ZR2024QD217).

Data Availability Statement

The data that support the findings of this study are available upon request from the corresponding author.

Conflicts of Interest

The authors declare no conflicts of interest.

References

  1. Liu, J.; Kang, H.; Tao, W.; Li, H.; He, D.; Ma, L.; Tang, H.; Wu, S.; Yang, K.; Li, X. A spatial distribution—Principal component analysis (SD-PCA) model to assess pollution of heavy metals in soil. Sci. Total Environ. 2023, 859, 160112. [Google Scholar] [CrossRef]
  2. Yu, X.; Feng, W.; Song, F.; Han, Y.; Miao, Q.; Goncalves, J.M. Characterisation of heavy metals and microbial communities in urban river sediments: Interactions and pollution origin analysis. Environ. Res. 2025, 280, 121925. [Google Scholar] [CrossRef]
  3. Zang, Z.; Liu, S.; Li, Y. Spatial distribution of cadmium and lead in wheat grains and their environmental driving factors in major grain-producing areas, China. Ecol. Indic. 2025, 175, 113589. [Google Scholar] [CrossRef]
  4. Cao, H.; Liu, J.; Deng, P.; Beiyuan, J.; Li, L.; Wei, X.; Du, Z.; Chen, Y.; Lai, J.; Wang, J. Chromium accumulation in rice cultivated by distinctive chromium contaminated soils: The effects of geochemical speciation and microbial community. Environ. Pollut. 2025, 370, 125847. [Google Scholar] [CrossRef] [PubMed]
  5. Khan, S.; Cao, Q.; Zheng, Y.M.; Huang, Y.Z.; Zhu, Y.G. Health risks of heavy metals in contaminated soils and food crops irrigated with wastewater in Beijing, China. Environ. Pollut. 2008, 152, 686–692. [Google Scholar] [CrossRef]
  6. Sun, Y.; Yang, J.; Li, K.; Gong, J.; Gao, J.; Wang, Z.; Cai, Y.; Zhao, K.; Hu, S.; Fu, Y.; et al. Differentiating environmental scenarios to establish geochemical baseline values for heavy metals in soil: A case study of Hainan Island, China. Sci. Total Environ. 2023, 898, 165634. [Google Scholar] [CrossRef] [PubMed]
  7. Liang, N.; Zhang, C.; Zhang, Y.; Jiang, N.; Yang, J.; Geng, N.; Zhang, R.; Zhang, H.; Chen, J. Pollution levels, distribution characteristics and risk assessment of heavy metals (HMs) in road dust in major cities of China. J. Hazard. Mater. 2025, 494, 138733. [Google Scholar] [CrossRef]
  8. Feng, W.; Guo, Z.; Xiao, X.; Peng, C.; Shi, L.; Ran, H.; Xu, W. Atmospheric deposition as a source of cadmium and lead to soil-rice system and associated risk assessment. Ecotoxicol. Environ. Saf. 2019, 180, 160–167. [Google Scholar] [CrossRef]
  9. Duan, X.; Zhang, G.; Rong, L.; Fang, H.; He, D.; Feng, D. Spatial distribution and environmental factors of catchment-scale soil heavy metal contamination in the dry-hot valley of Upper Red River in southwestern China. Catena 2015, 135, 59–69. [Google Scholar] [CrossRef]
  10. Qiao, P.; Dong, N.; Yang, S.; Gou, Y. Quantitative analysis of the main sources of pollutants in the soils around key areas based on the positive matrix factorization method. Environ. Pollut. 2021, 273, 116518. [Google Scholar] [CrossRef]
  11. Zhao, L.; Yan, Y.; Yu, R.; Hu, G.; Cheng, Y.; Huang, H. Source apportionment and health risks of the bioavailable and residual fractions of heavy metals in the park soils in a coastal city of China using a receptor model combined with Pb isotopes. Catena 2020, 194, 104736. [Google Scholar] [CrossRef]
  12. Cai, L.-M.; Wang, Q.-S.; Wen, H.-H.; Luo, J.; Wang, S. Heavy metals in agricultural soils from a typical township in Guangdong Province, China: Occurrences and spatial distribution. Ecotoxicol. Environ. Saf. 2019, 168, 184–191. [Google Scholar] [CrossRef] [PubMed]
  13. Ma, Y.; Li, Y.; Fang, T.; He, Y.; Wang, J.; Liu, X.; Wang, Z.; Guo, G. Analysis of driving factors of spatial distribution of heavy metals in soil of non-ferrous metal smelting sites: Screening the geodetector calculation results combined with correlation analysis. J. Hazard. Mater. 2023, 445, 130614. [Google Scholar] [CrossRef] [PubMed]
  14. Yang, J.; Wang, J.; Qiao, P.; Zheng, Y.; Yang, J.; Chen, T.; Lei, M.; Wan, X.; Zhou, X. Identifying factors that influence soil heavy metals by using categorical regression analysis: A case study in Beijing, China. Front. Environ. Sci. Eng. 2020, 14, 37. [Google Scholar] [CrossRef]
  15. Wang, J.; Xu, C. Geodetector: Principle and prospective. Acta Geogr. Sin. 2017, 72, 116–134. [Google Scholar]
  16. Zeng, W.; Wan, X.; Wang, L.; Lei, M.; Chen, T.; Gu, G. Apportionment and location of heavy metal(loid)s pollution sources for soil and dust using the combination of principal component analysis, Geodetector, and multiple linear regression of distance. J. Hazard. Mater. 2022, 438, 129468. [Google Scholar]
  17. Sun, Y.Q.; Lei, S.G.; Zhao, Y.B.; Wei, C.; Yang, X.C.; Han, X.T.; Li, Y.Y.; Xia, J.N.; Cai, Z. Spatial distribution prediction of soil heavy metals based on sparse sampling and multi-source environmental data. J. Hazard. Mater. 2024, 465, 133114. [Google Scholar]
  18. Xie, Y.F.; Chen, T.B.; Lei, M.; Yang, J.; Guo, Q.J.; Song, B.; Zhou, X.Y. Spatial distribution of soil heavy metal pollution estimated by different interpolation methods: Accuracy and uncertainty analysis. Chemosphere 2011, 82, 468–476. [Google Scholar] [CrossRef]
  19. Liu, G.; Zhou, X.; Li, Q.; Shi, Y.; Guo, G.L.; Zhao, L.; Wang, J.; Su, Y.Q.; Zhang, C. Spatial distribution prediction of soil As in a large-scale arsenic slag contaminated site based on an integrated model and multi-source environmental data. Environ. Pollut. 2020, 267, 115631. [Google Scholar]
  20. Liu, Q.Y.; Zhao, W.H.; Ma, J.; Zhou, Y.Z.; Wu, Y.H.; Qu, Y.J.; Sun, Y. Spatial clustering and source-specific risk of combined pollutants in soils from an industrial area in Shanxi Province, China. Environ. Pollut. 2022, 299, 118925. [Google Scholar] [CrossRef]
  21. Huang, G.X.; Wang, X.H.; Chen, D.; Wang, Y.P.; Zhu, S.X.; Zhang, T.; Liao, L.; Tian, Z.; Wei, N. A hybrid data-driven framework for diagnosing contributing factors for soil heavy metal contaminations using machine learning and spatial clustering analysis. J. Hazard. Mater. 2022, 437, 129324. [Google Scholar] [CrossRef] [PubMed]
  22. Moore, J.A.; Kimsey, M.J.; Garrison-Johnston, M.; Shaw, T.M.; Mika, P.; Poolakkal, J. Geologic Soil Parent Material Influence on Forest Surface Soil Chemical Characteristics in the Inland Northwest, USA. Forests 2022, 13, 1363. [Google Scholar] [CrossRef]
  23. Zinn, Y.L.; de Faria, J.A.; de Araujo, M.A.; Araujo Skorupa, A.L. Soil parent material is the main control on heavy metal concentrations in tropical highlands of Brazil. Catena 2020, 185, 104319. [Google Scholar] [CrossRef]
  24. Zhong, X.; Chen, Z.; Li, Y.; Ding, K.; Liu, W.; Liu, Y.; Yuan, Y.; Zhang, M.; Baker, A.J.M.; Yang, W.; et al. Factors influencing heavy metal availability and risk assessment of soils at typical metal mines in Eastern China. J. Hazard. Mater. 2020, 400, 123289. [Google Scholar] [CrossRef] [PubMed]
  25. Xu, J.; Xiao, P. Influence factor analysis of soil heavy metal based on categorical regression. Int. J. Environ. Sci. Technol. 2022, 19, 7373–7386. [Google Scholar] [CrossRef]
  26. Jyoti, V.; Saini-Eidukat, B.; Hopkins, D.; DeSutter, T. Naturally elevated metal contents of soils in northeastern North Dakota, USA, with a focus on cadmium. J. Soils Sediments 2015, 15, 1571–1583. [Google Scholar] [CrossRef] [PubMed]
  27. Wang, S.Y.; Xiong, Z.A.; Han, X.X.; Wang, L.Q.; Liang, T. Unveiling the spatial differentiation drivers of major soil element behavior along traffic network accessibility. Environ. Pollut. 2024, 342, 123045. [Google Scholar]
  28. Ding, Q.; Cheng, G.; Wang, Y.; Zhuang, D. Effects of natural factors on the spatial distribution of heavy metals in soils surrounding mining regions. Sci. Total Environ. 2017, 578, 577–585. [Google Scholar]
  29. Qin, G.; Niu, Z.; Yu, J.; Li, Z.; Ma, J.; Xiang, P. Soil heavy metal pollution and food safety in China: Effects, sources and removing technology. Chemosphere 2021, 267, 129205. [Google Scholar] [CrossRef]
  30. Wang, X.; Sun, Y.; Zhang, L.; Mei, Y. Spatial variation and influence factor analysis of soil heavy metal As based on geoDetector. Stoch. Environ. Res. Risk Assess. 2021, 35, 2021–2030. [Google Scholar] [CrossRef]
  31. Chen, W.D.; Cai, Y.K.; Zhu, K.; Wei, J.; Lu, Y.T. Spatial heterogeneity analysis and source identification of heavy metals in soil: A case study of Chongqing, Southwest China. Chem. Biol. Technol. Agric. 2022, 9, 50. [Google Scholar] [CrossRef]
  32. Wang, M.; Zhang, H. Accumulation of Heavy Metals in Roadside Soil in Urban Area and the Related Impacting Factors. Int. J. Environ. Res. Public Health 2018, 15, 1064. [Google Scholar] [CrossRef] [PubMed]
  33. Wang, L.X.; Yan, B.X.; Zhu, L.L.; Ou, Y. The effect of reclamation on the distribution of heavy metals in saline-sodic soil of Songnen Plain, China. Environ. Earth Sci. 2015, 73, 1083–1090. [Google Scholar]
  34. Song, X.Y.; Sun, Y.; Wang, H.J.; Huang, X.M.; Han, Z.L.; Shu, Y.L.; Wu, J.H.; Zhang, Z.L.; Zhong, Q.C.; Li, R.X.; et al. Uncovering soil heavy metal pollution hotspots and influencing mechanisms through machine learning and spatial analysis. Environ. Pollut. 2025, 370, 125901. [Google Scholar] [CrossRef] [PubMed]
  35. Zhou, R.; Chen, J.; Cui, S.W.; Li, L.; Qian, J.B.; Zhao, H.; Huang, G.X. A data-driven framework to identify influencing factors for soil heavy metal contaminations using random forest and bivariate local Moran’s I: A case study. J. Environ. Manag. 2025, 375, 124172. [Google Scholar]
  36. Huang, S.; Xiao, L.; Zhang, Y.; Wang, L.; Tang, L. Interactive effects of natural and anthropogenic factors on heterogenetic accumulations of heavy metals in surface soils through geodetector analysis. Sci. Total Environ. 2021, 789, 147937. [Google Scholar] [PubMed]
  37. Tao, H.; Liao, X.; Li, Y.; Xu, C.; Zhu, G.; Cassidy, D.P. Quantifying in fluences of interacting anthropogenic-natural factors on trace element accumulation and pollution risk in karst soil. Sci. Total Environ. 2020, 721, 137770. [Google Scholar]
  38. Chang, Y.H.; Scrimshaw, M.D.; Emmerson, R.; Lester, J.N. Geostatistical analysis of sampling uncertainty at the Tollesbury Managed Retreat site in Blackwater Estuary, Essex, UK: Kriging and cokriging approach to minimise sampling density. Sci. Total Environ. 1998, 221, 43–57. [Google Scholar]
  39. Tang, Y.Y.; Zhang, D.H.; Xu, H.G.; Dai, L.L.; Xu, Q.Y.; Zhang, Z.J.; Jing, X.D. The role of topography feedbacks in enrichment of heavy metal elements in terrace type region. Front. Environ. Sci. 2024, 12, 1291917. [Google Scholar] [CrossRef]
  40. Chen, L.F.; Cai, X.Y.; Cao, M.X.; Liu, H.W.; Liang, Y.; Hu, L.G.; Yin, Y.G.; Li, Y.B.; Shi, J.B. Long-term investigation of heavy metal variations in mollusks along the Chinese Bohai Sea. Ecotoxicol. Environ. Saf. 2022, 236, 113443. [Google Scholar] [CrossRef]
  41. Chen, M.Z.; Li, X.X.; Cao, X.X.; Yang, W.T.; Wu, P.; Hao, H.Y.; Fei, Z.J.; Gao, Y.N. Soil-forming accumulation of heavy metals in geological high background areas: Constraints of structure, lithology, and overlying soil geochemistry. J. Geochem. Explor. 2024, 263, 107518. [Google Scholar] [CrossRef]
  42. Jiang, C.; Zhou, W.; Yang, L.; Yan, J.; Tu, S.; Yuan, Y.; Wang, D.; Cheng, H. Geochemical relationship and profile distribution of Selenium and Cadmium in typical Selenium-enriched areas in Enshi. Chemosphere 2023, 338, 139423. [Google Scholar] [CrossRef]
  43. Wen, Y.; Li, W.; Yang, Z.; Zhang, Q.; Ji, J. Enrichment and source identification of Cd and other heavy metals in soils with high geochemical background in the karst region, Southwestern China. Chemosphere 2020, 245, 125620. [Google Scholar] [CrossRef]
  44. Quezada-Hinojosa, R.P.; Matera, V.; Adatte, T.; Rambeau, C.; Foellmi, K.B. Cadmium distribution in soils covering Jurassic oolitic limestone with high Cd contents in the Swiss Jura. Geoderma 2009, 150, 287–301. [Google Scholar] [CrossRef]
  45. Ali, W.; Mao, K.; Zhang, H.; Junaid, M.; Xu, N.; Rasool, A.; Feng, X.; Yang, Z. Comprehensive review of the basic chemical behaviours, sources, processes, and endpoints of trace element contamination in paddy soil-rice systems in rice-growing countries. J. Hazard. Mater. 2020, 397, 122720. [Google Scholar] [CrossRef]
  46. Zou, M.; Zhou, S.; Zhou, Y.; Jia, Z.; Guo, T.; Wang, J. Cadmium pollution of soil-rice ecosystems in rice cultivation dominated regions in China: A review. Environ. Pollut. 2021, 280, 116965. [Google Scholar] [CrossRef]
  47. Ihedioha, J.N.; Ogili, E.O.; Ekere, N.R.; Ezeofor, C.C. Risk assessment of heavy metal contamination of paddy soil and rice (Oryza sativa) from Abakaliki, Nigeria. Environ. Monit. Assess. 2019, 191, 350. [Google Scholar] [CrossRef] [PubMed]
  48. Peng, H.; Chen, Y.; Weng, L.; Ma, J.; Ma, Y.; Li, Y.; Islam, M.S. Comparisons of heavy metal input inventory in agricultural soils in North and South China: A review. Sci. Total Environ. 2019, 660, 776–786. [Google Scholar] [CrossRef] [PubMed]
  49. Hu, W.; Wang, H.; Dong, L.; Huang, B.; Borggaard, O.K.; Hansen, H.C.B.; He, Y.; Holm, P.E. Source identification of heavy metals in peri-urban agricultural soils of southeast China: An integrated approach. Environ. Pollut. 2018, 237, 650–661. [Google Scholar] [CrossRef]
  50. Ni, R.; Ma, Y. Current inventory and changes of the input/output balance of trace elements in farmland across China. PLoS ONE 2018, 13, e0199460. [Google Scholar] [CrossRef] [PubMed]
  51. Tang, L.-l.; Fu, B.-m.; Wu, Y.; Cai, F.-c.; Ma, Y.-b. Linking atmospheric emission and deposition to accumulation of soil cadmium in the Middle-Lower Yangtze Plain, China. J. Integr. Agric. 2023, 22, 3170–3181. [Google Scholar] [CrossRef]
  52. Yu, P.Y.; Shao, X.Y.; Wang, M.D.; Zhu, Z.; Tong, Z.L.; Peng, J.W.; Deng, Y.C.; Huang, Y. Effects of atmospheric deposition on heavy metal contamination in paddy field systems under different functional areas in ChangZhuTan, Hunan Province, China. Sci. Total Environ. 2024, 933, 172953. [Google Scholar] [CrossRef] [PubMed]
  53. Mu, Y.; Cui, J.X.; Liu, A.D.; Wang, S.; Shi, Q.J.; Wang, J.; Wei, S.Q.; Zhang, J.Z. Interactions and quantification of multiple influencing factors on cadmium accumulation in soil-rice systems at a large region. Sci. Total Environ. 2023, 881, 163392. [Google Scholar] [CrossRef] [PubMed]
  54. Yang, Q.Q.; Li, Z.Y.; Lu, X.N.; Duan, Q.N.; Huang, L.; Bi, J. A review of soil heavy metal pollution from industrial and agricultural regions in China: Pollution and risk assessment. Sci. Total Environ. 2018, 642, 690–700. [Google Scholar] [CrossRef]
  55. Men, C.; Liu, R.M.; Xu, L.B.; Wang, Q.R.; Guo, L.J.; Miao, Y.X.; Shen, Z.Y. Source-specific ecological risk analysis and critical source identification of heavy metals in road dust in Beijing, China. J. Hazard. Mater. 2020, 388, 121763. [Google Scholar] [CrossRef]
  56. Zhao, M.L.; Wang, H.J.; Sun, J.X.; Tang, R.; Cai, B.Y.; Song, X.Y.; Huang, X.M.; Huang, J.; Fan, Z.Q. Spatio-temporal characteristics of soil Cd pollution and its influencing factors: A Geographically and temporally weighted regression (GTWR) method. J. Hazard. Mater. 2023, 446, 130613. [Google Scholar] [CrossRef] [PubMed]
  57. Feng, Y.X.; Yu, X.Z.; Zhang, H. A modelling study of a buffer zone in abating heavy metal contamination from a gold mine of Hainan Province in nearby agricultural area. J. Environ. Manag. 2021, 287, 112299. [Google Scholar] [CrossRef]
  58. Yang, Y.; Chen, W.; Wang, M.; Peng, C. Regional accumulation characteristics of cadmium in vegetables: Influencing factors, transfer model and indication of soil threshold content. Environ. Pollut. 2016, 219, 1036–1043. [Google Scholar] [CrossRef]
  59. Song, Y.; Wang, J.; Ge, Y.; Xu, C. An optimal parameters-based geographical detector model enhances geographic characteristics of explanatory variables for spatial heterogeneity analysis: Cases with different types of spatial data. Giscience Remote Sens. 2020, 57, 593–610. [Google Scholar] [CrossRef]
Figure 1. Spatial distribution of sampling points.
Land 14 01975 g001
Figure 2. Potential driving factors of soil heavy metals.
Land 14 01975 g002
Figure 3. Identification of potential driving factors.
Land 14 01975 g003
Figure 4. Interaction results of important driving factors.
Land 14 01975 g004
Figure 5. Spatial distribution of soil Cd.
Land 14 01975 g005
Figure 6. Spatial association between Cd concentrations and main driving factors. (a) Cd concentrations and DEM; (b) Cd concentrations and PM10; (c) Cd concentrations and GDP; (d) Cd hotspots and strata; (e) Cd hotspots and soil type.
Land 14 01975 g006
Figure 7. Boxplot of Cd contents in different strata.
Land 14 01975 g007
Figure 8. Boxplot of Cd contents in different soil types.
Land 14 01975 g008
Disclaimer/Publisher’s Note: The statements, opinions and data contained in all publications are solely those of the individual author(s) and contributor(s) and not of MDPI and/or the editor(s). MDPI and/or the editor(s) disclaim responsibility for any injury to people or property resulting from any ideas, methods, instructions or products referred to in the content.