Abstract
Recently, cross-city recreation has received a considerable amount of attention to meet the challenges of today’s rapid urbanization, the limited green space in cities, and the increasing demand for urban residents to interact with natural environments. We use China’s Capital Economic Circle as a case study to examine the influence of cross-city recreation on park green space accessibility. Using a Normalized Difference Vegetation Index and an Multi-mode two-step floating catchment area (M2SFCA) model, different travel modes across the space were explored. The results show the following: (1) The landscape of multi-scale Park green space (PGS) accessibility in the study area exhibits a gradual decrease in accessibility from the core area to the periphery. (2) Cross-city recreation changes the spatial distribution of accessibility, with the emergence of hotspots having the greatest impact on PGS accessibility at the scale of 50–100 ha and above. (3) At the urban scale, the multi-scale PGS of peripheral urban areas is higher than central urban areas, and affected by cross-city recreation, this feature is more significant in urban core areas. Our research helps urban planners to develop effective regional environmental planning policies for the green development of urban agglomerations.
1. Introduction
The rapid global urbanization has led to urban sprawl and high intensity [1]. Meanwhile, limited green space and high population density constrain urban residents’ interaction with nature [2]. The conflict between human demand for nature and limited green space has become a major problem in rapidly urbanizing cities and has caused unfair allocation of urban parks among various socioeconomic groups and regions [3,4]. In this context, residents are gradually turning to cross-city recreation. The park green space at the urban–rural border between cities has become the focus of urban planning. In order to solve this imbalance, it is necessary to evaluate the spatial equity of park green space among cities. Therefore, accessibility has drawn attention to an important indicator for accessing equity in urban space and planning parks [5].
2. Literature Review
The early conception of accessibility focused on the difficulty or cost of traveling from one location to another, including distance, time, and financial costs [6]. Subsequently, accessibility has been widely used to assess the spatial equity of urban parks and urban public facilities [7,8,9,10,11]. In terms of urban parks, research on accessibility can be categorized into two types. The first type of research discusses the spatial change and/or supply–demand distribution of urban parks by constructing multiple green space indicators [12,13,14,15]. Case studies have primarily focused on urban parks within urban built-up areas. Most published research on urban park accessibility has focused on a single urban scale, ignoring the proximity effect and the sharing of urban fringe green space between cities. This exclusive focus on accessibility at the city level fails to address practical needs, and the research scope needs to shift to the city and urban scale. Urban agglomerations represent clusters of cities with compact spatial organization and strong economic ties, which is a defining characteristic of global cities in recent decades [16,17,18]. In the context of urban agglomerations, it is necessary to investigate the accessibility of urban parks and identify underserved regions.
The second type of accessibility research has focused on different social groups [19,20,21,22]. The resulting evidence from recent equity studies has been mixed but often indicates disparities based on socioeconomic or ethnic classification within cities. The opportunities for socioeconomically disadvantaged groups to access environmental amenities (green space access and opportunity) have always been limited, and the phenomenon of environmental injustice is widely present in major cities [23,24]. However, it is still worthwhile to further investigate whether there are inequalities in the accessibility of parks and green spaces within urban agglomerations.
In measuring urban parks’ accessibility, five methods are commonly used [25]: container methods (based on administrative boundaries, assuming equal access within a defined area) [26], coverage methods (calculating the area within a given distance or time threshold), minimum distance methods (measuring the shortest route from population locations to the nearest park), travel cost methods (considering time, distance, or economic cost as impedance), and gravity-based methods (incorporating distance decay effects and the relative attractiveness of destinations) [27,28]. Each method has its own disadvantages and applied scope. Among these methods, the two-step floating catchment area (2SFCA) and its improved models, which utilize the principles of gravity-based methods, are commonly employed. In simple terms, the 2SFCA model works in two steps. First, each park is considered as a service center, and the available green space area is compared to the surrounding population within a defined travel time. Second, each community is evaluated by summing up the accessibility of all parks that can be reached within the travel time threshold. This process integrates three travel modes (walking, public transport, and car) and incorporates a quality coefficient based on the Normalized Difference Vegetation Index (NDVI) to reflect the attractiveness of different parks. In this way, the model captures both the supply–demand balance and the actual travel conditions that influence residents’ ability to access green space [29,30].
In terms of methodology, few studies have measured urban parks’ accessibility and fairness from multi-scale (i.e., beyond city boundaries) and multiple travel modes (e.g., walking, bus, and car). In real life, people often use different travel methods to visit urban parks. Therefore, integrating multiple travel modes into traditional accessibility studies is an emerging field of research. Taking the multiple travel modes into accessibility measurement consideration has scientific reference value for studying the rationality, accessibility, and fairness of spatial distribution of urban green spaces in a more comprehensive manner. With the improvement in quality of life and transportation convenience, it has become easier for urban residents to cross city boundaries. Therefore, in this study, we integrate three modes of travel—walking, public transport, and car—into the 2SFCA method to measure the park green space accessibility under multiple travel modes.
From an indicator perspective, early studies often overlooked non-spatial influences. However, park green space accessibility is influenced by various attributes, including function, type, landscape quality, number of facilities, built features [31], physical activity [32], and psychological factors [33]. These non-spatial factors can lead to different attractiveness of the park to residents, thereby affecting residents’ inclination to visit the urban park. Therefore, this study introduces the Normalized Difference Vegetation Index (NDVI) as a new parameter to measure the attractiveness and landscape quality of park green spaces, aiming to correct the traditional accessibility model.
Our study, taking China’s Capital Economic Circle (CCEC) as the study area, combined with the internet map served by big data, a Gaussian-based 2SFCA model with multiple travel modes (walking, bus, and car) and Normalized Difference Vegetation Index (NDVI) were constructed. By setting four different search radii, the accessibility of urban parks in the region was calculated and analyzed. The goal is to examine the spatial pattern variations in accessibility and fairness of park green spaces (PGS) in CCEC.
The main specific research questions are as follows:
- (1)
- Considering variations in spatial scales and multiple travel modes, what are the spatial characteristics of park green space accessibility within China’s Capital Economic Circle, and how are areas with insufficient services geographically distributed?
- (2)
- How does residents’ cross-city recreational behavior influence differences in park green space accessibility across various spatial scales and cities, and what are the underlying factors contributing to these differences?
3. Data and Methodology
3.1. Study Area
The CCEC, located in the North China Plain of China, serves as the national capital region, which is one of the most dynamic, open, innovative, and population-absorbing regions in China, focusing on improving the green spatial structure of cities and sharing the ecological environment. Along with China’s rapid economic growth and urbanization, the Capital Economic Circle, with the capital city, which assumes complex functions, at its core and with a radius covering Tianjin and Hebei provinces, has become an important carrier for China’s participation in global competition.
However, numerous studies indicate that rapid urbanization in the Beijing–Tianjin–Hebei region has led to intensified ecological stress, including the degradation of ecosystem functions, deterioration of air quality, and increasing water scarcity, all of which pose significant challenges for regional sustainable development [16,17,18]. To meet the need for sustainable development, the government has formulated a series of national strategies and measures, with a particular focus on improving the green space structure and ecological environment construction and sharing in CCEC. According to the government’s policies, “Beijing will not be built as a premier district alone; the ultimate solution to the problem is to rely on the overall development of the region”. The planning of a one-hour traffic circle around the capital and the provincial capital provides an efficient and convenient modern transport system for the integrated development of tourism (Hebei Territorial Spatial Planning (2021–2035)). In CCEC, seven cities centered on the capital city of Beijing were selected as examples for the study area, including Beijing and six prefecture-level cities (including Zhangjiakou, Chengde, Tangshan, Tianjin, Langfang, and Baoding City) directly adjacent to Beijing. Because these select six cities are closely related to Beijing, they are key areas in CCEC for future government planning practices. We will provide a reference for exploring the PGS accessibility at the regional level and the impact of cross-city recreation.
3.2. Data Collection
In this case study, the research unit was community (village) administrative divisions, and multiple sources of data were utilized to explore the accessibility of park green spaces. First, communities (villages) administrative divisions from the municipal districts of 7 cities, including 19,457 communities (villages), were extracted from the Resource and Environment Science and Data Center (https://www.resdc.cn/Default.aspx, accessed on 28 March 2023). Second, 2018 population data of 7 municipal districts was obtained from the website (https://www.worldpop.org/geodata/listing?id=74, accessed on 28 March 2023). Third, greenfield data, including park area, entrances and exits, etc., were collected from the 2018 POI data (https://www.resdc.cn/Default.aspx, accessed on 28 March 2023). Fourth, Normalized Difference Vegetation Index (NDVI) was extracted from the Geospatial Cloud 2020 Remote Sensing Image resources for interpretation (https://www.gscloud.cn/search, accessed on 28 March 2023).
In this study, thresholds are defined as maximum acceptable travel times (time thresholds) used to measure accessibility. A time threshold sets a limit on how long residents are assumed to travel to reach a park. For example, based on existing research and planning standards, we used 15 min for parks of 5–10 ha, 30 min for parks of 11–50 ha, 1 h for parks of 51–100 ha, and 2 h for parks ≥100 ha. Parks located beyond these thresholds are considered outside the effective service range for residents. Moreover, time thresholds less than 10 min often result in zero accessibility values. Hence, our research employs the modified Gaussian-based 2SFCA method, which integrates the coefficient of attractiveness (NDVI) of PGS into the model based on net distance while considering different modes of travel (walking, public transportation, and car). We discuss the accessibility of PGS for integrated cross-city recreation and intra-city recreation in the CCEC by using examples of 15 min, 30 min, 1 h, and 2 h as time thresholds.
We selected 562 green spaces greater than 5 ha within the research area, taking into account their comprehensive benefits. According to the Urban Residential Area Planning and Design Standards (GB50180–2018) and related green space research literature [34,35], the PGS was divided into four classes according to the scale. Each class of PGS has a specific accessibility time threshold, which represents the longest acceptable time for residents to reach that particular class of PGS (Table 1).

Table 1.
China’s Capital Economic Circle multi-scale park green space classification statistics.
3.3. Methodology
3.3.1. Travel Time Calculation from Community to PGS
From the above literature reviews, traditional 2SFCA methods based on ArcGIS network analysis have a common drawback in that they fail to reflect PGS accessibility under multiple travel modes and are unable to identify individuals’ preferred routes to green spaces [36]. In particular, it is challenging to calculate accessibility by simulating public transport, and traditional methods cannot reflect real-time traffic conditions. Due to insufficient road network data collection details, the analysis results of accessibility often suffer from large errors.
As spatial perception and mobile positioning technologies rapidly evolve, the road network data provided by Internet map servers can accurately report the road network and related actual traffic conditions [37]. At present, some scholars have directly obtained travel time data through map service interfaces provided by internet map service providers (similar to Google navigation), which not only saves the workload of collecting road network data but also avoids result errors caused by road network inaccuracy [38]. Therefore, the Application Programming Interface (API) of the Internet Map Developer Platform creates new possibilities for accessibility research. The multi-source data collection in this study mainly comes from the API module of an Internet Map Service Provider (https://lbs.amap.com, accessed on 28 March 2023). The specific steps of the process are as follows:
The first step involves using 19,457 communities in the study area as the origin point (O) and the entrance of 562 PGS as the destination (D) and batch sending requests to the Internet Map Route Planning API server to obtain navigation routes. By utilizing traffic network data, information about the road conditions, and real-time updates as the background layers of the map, the optimal travel times and distances for each community and green space are obtained under three different travel modes (walking, public transportation, and car). In the second step, we divide each travel distance in the database by the average speed of each mode of transportation to obtain a standard time, compare it with the previously obtained travel time, select travel time data with an error greater than 30 min, and manually correct it based on the average navigation time queried by the map software.
3.3.2. Multi-Mode Two-Step Floating Catchment Area Method
The study applies a modified multi-mode two-step floating catchment area (M2SFCA) method to measure PGS accessibility, considering walking, public transport, and car travel modes. The calculation process of the M2SFCA is as follows:
- (1)
- Set the catchments for PGS: Use the PGS as the supply centers and search all the communities (villages) within their service areas. Calculate the total population of these communities to obtain the supply-to-demand ratio for each PGS.
- (2)
- Set catchments for communities (villages): Use the communities as the demand centers and find all the PGS within their respective areas. Sum up the supply-to-demand ratios for each PGS to determine the accessibility for the communities.
The influence of travel time and PGS quality on residents’ travel intentions and choices was considered to improve the M2SFCA methodology. We combined the park attractiveness coefficient (NDVI) with the M2SFCA model to obtain the modified Gaussian-based M2SFCA method. Here is the calculation process of the multi-mode Gaussian-based M2SFC:
To more accurately measure accessibility under multiple travel modes, we established a priority sequence for residents’ travel behavior (Table 2). Walking was regarded as the preferred mode; if the park green space (PGS) could be reached within the walking threshold, only the walking time and corresponding community population were included in the calculation. If the walking threshold was exceeded, public transport was considered as the second option. Finally, if neither walking nor public transport allowed residents to reach the PGS within the threshold, car travel was applied. This stepwise calculation ensures that the accessibility model reflects actual travel choices and population distribution more realistically.

Table 2.
Mode selection table for travel methods.
The Gaussian decay function assigns higher weights to shorter travel times within the maximum acceptable threshold. The critical thresholds were defined as 15, 30, 60, and 120 min for different PGS classes. Travel times vary by mode (walking, public transport, car) and were obtained from Internet map APIs. If the travel time exceeds the threshold, the accessibility weight is zero. The indices were standardized so that i denotes the PGS and j denotes the community unit.
Step 1: Calculate the supply-to-demand ratio of each PGS using the following Formula (1):
where Ri refers to the supply-to-demand ratio of PGS i. Si refers to the area of PGS i. Ci is the normalized attraction coefficient evaluated based on the Normalized Difference Vegetation Index (NDVI) of the PGS, ranging from 0 to 1; a higher value means greater attraction. refer to the population of community (village) j that reaches green space i through M1, M2, and M3 within the time threshold. refer to the travel time between walking, public transportation, and car arrival at green space i and community (village) j. Wij is the Gaussian time decay function between i and j, as shown in Formula (2):
Step 2: Calculate the sum of the supply-to-demand ratios of accessible PGS for each community (village) within the time threshold, representing the PGS accessibility for the community. This is calculated using the following Formula (3):
where Ai is the park green space reachability of community i. A higher value indicates a higher level of PGS accessibility for the community.
4. Results
4.1. The PGS Accessibility Landscapes Under the Multi-Model
Figure 1 shows the spatial distribution of accessibility for multi-scale PGS, which was divided into five levels using the Jenks natural breaks method: low, higher-low, medium, high, and higher high. The areas with higher high accessibility are mainly located in the western and northern parts of Beijing, the southeastern part of Zhangjiakou, the southwestern part of Chengde, and small areas in the northeast part of Baoding. These areas are situated around the northwest of Beijing and are distant from each city center. Regions with high accessibility are primarily found in the eastern and southern parts of Beijing, the east and north of Zhangjiakou, and the north of Chengde, as well as other adjacent highly accessible areas, indicating a tendency towards proximity to Beijing. Medium accessibility areas are mainly located at the periphery of the high accessibility areas, mostly mixed with higher-low accessibility areas, including the central city of Beijing, north and east of Chengde, north and west of Zhangjiakou, east of Baoding, south of Langfang, and most of Tangshan and Tianjin. The areas with low accessibility are mainly the peri-urban regions (the transitional zones located at the edge of built-up urban areas, where urban and rural land uses, functions, and populations intersect) of the study area, the border of Zhangjiakou and Chengde, as well as the central city of Chengde. The western and northern areas (e.g., the Beijing–Zhangjiakou–Chengde corridor) benefit from proximity to large and extra-large parks, such as national forest parks and mountain ecological reserves. Terrain constraints in these mountainous regions limit dense urban construction, but they preserve substantial green resources, which translates into higher accessibility values. By contrast, the eastern and southern areas (e.g., Tangshan, Langfang) are characterized by dense built-up areas, rapid industrialization, and limited per capita UGS supply, leading to lower accessibility levels. These results are consistent with earlier findings that accessibility tends to be lower in highly urbanized plains with fragmented green space distribution [39,40].
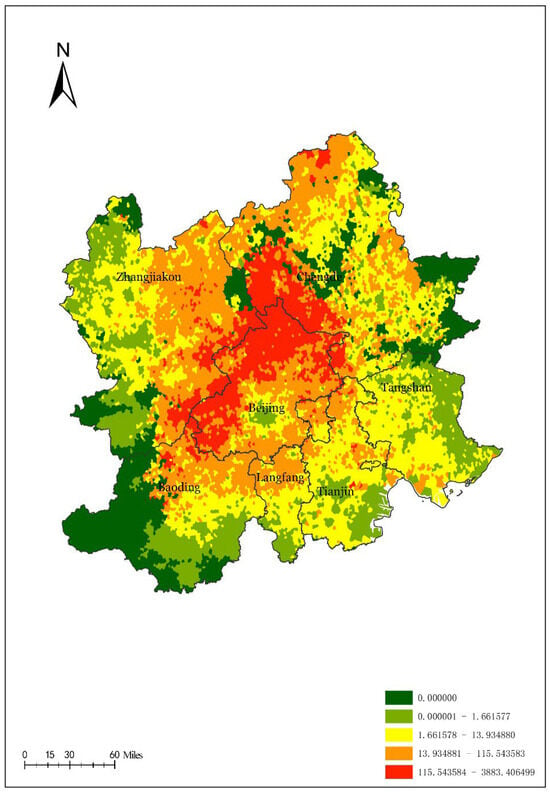
Figure 1.
The overall spatial pattern of PGS accessibility.
4.2. Disparities in PGS Accessibility Across Different Scales
The disparities in PGS accessibility across different scales are depicted in Figure 2, Figure 3, Figure 4 and Figure 5. Typically, the spatial coverage of subdistricts that can be served by PGS increases as the threshold increases. Only a few regions performed inconsistently, such as the central city of Chengde, which had higher accessibility under the 10–50 ha scale PGS scenario, and the central city of Baoding, which had higher accessibility at a threshold value of 50–100 ha scale PGS scenario. However, at a threshold of ≥100 ha scale green space scenario, the PGS service could cover almost the entire study area.
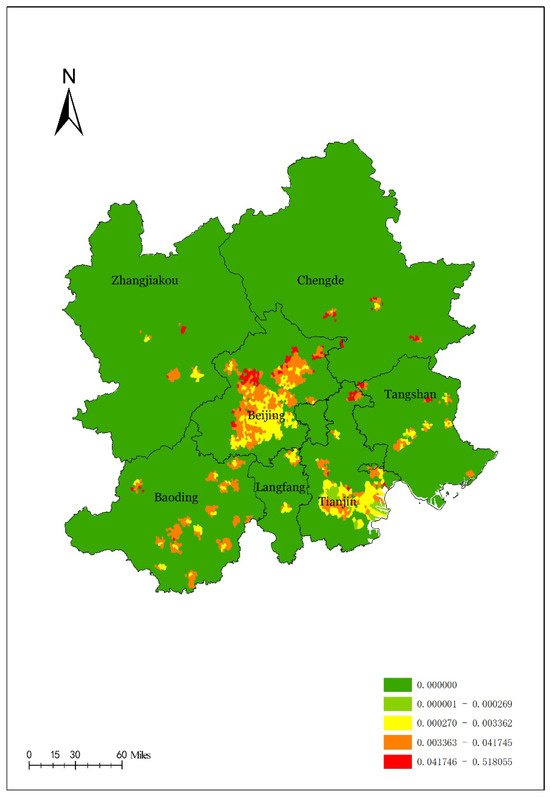
Figure 2.
The accessibility spatial pattern of PGS at 5–10 ha in CCEC.
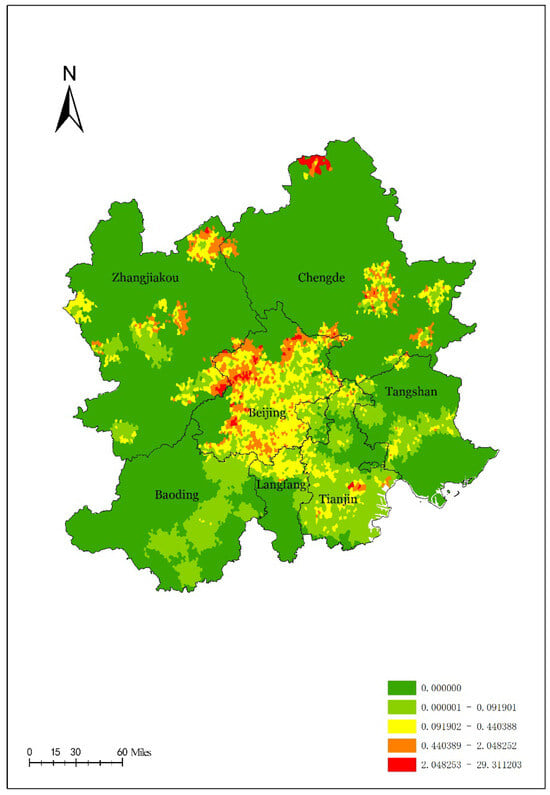
Figure 3.
The accessibility spatial pattern of PGS at 10–50 ha in CCEC.
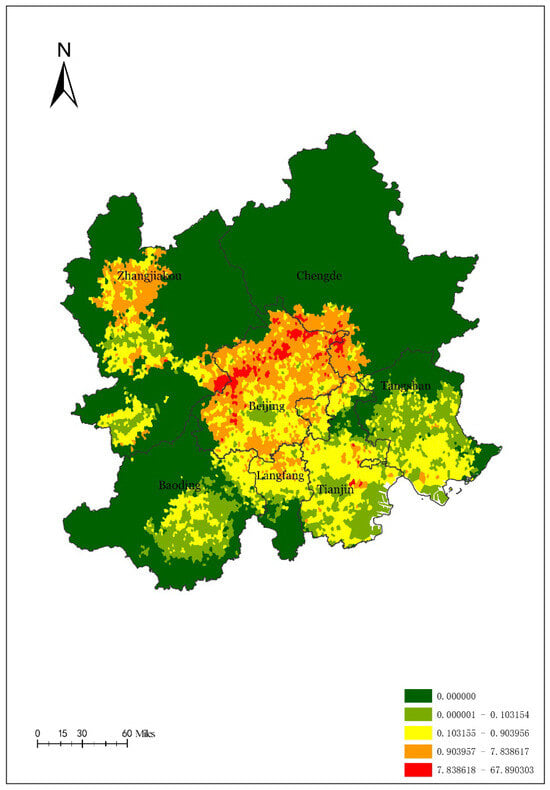
Figure 4.
The accessibility spatial pattern of PGS at 50–100 ha in CCEC.
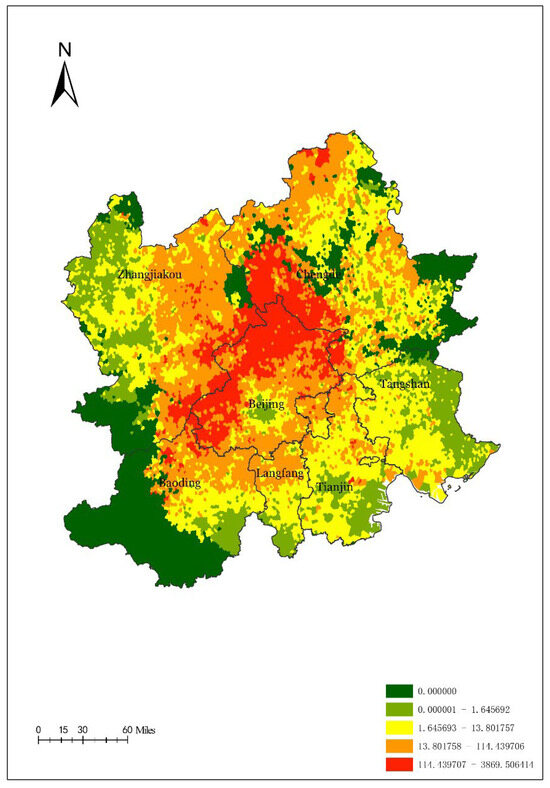
Figure 5.
The accessibility spatial pattern of PGS above 100 ha in CCEC.
The spatial distribution of PGS accessibility in the study area is not significantly influenced by cross-urban recreation in the scenario of 5–10 ha PGS and 10–50 ha PGS. In the 5–10 ha scale PGS scenario, the higher high accessibility areas, high accessibility areas and medium accessibility areas are located in the central areas of Beijing and Tianjin, forming the heart of the urban agglomeration. By contrast, the higher-low accessibility areas and low accessibility areas are the peripheral cities of the urban agglomeration, and most of the study area belongs to these two accessibility levels. In the 10–50 ha scale PGS scenario, the higher high accessibility areas and high accessibility areas are mainly located in northwestern Beijing, eastern Tianjin, eastern Chengde City, and a small part of the central city of Zhangjiakou, which also shows poor accessibility to the peripheral cities.
The spatial distribution of PGS accessibility in the study area is most affected by cross-city recreation in the context of the 50–100 ha scale PGS scenario and above 100 ha scale PGS scenario. These two scales emerge in some hotspots, with Beijing as the center, including parts of Zhangjiakou, Chengde, Baoding, Langfang, and Tianjin, which are close to Beijing. In the 50–100 ha scale PGS scenario, the higher high accessibility areas and high accessibility areas move to most of Beijing and the adjacent southwestern Chengde, northern Langfang, and western Zhangjiakou and begin to show a ring-shaped layout structure around Beijing. The medium accessibility areas are located in most of Tianjin and Tangshan City, northern Langfang, eastern Baoding, and western and southern Zhangjiakou. At a green space scale of ≥100 ha scale PGS scenario, the higher high accessibility areas move further from northwestern Beijing to southeastern Zhangjiakou and western Chengde, and the high accessibility areas show a clear tendency around Beijing.
4.3. Disparities in PGS Accessibility with and Without Cross-City Recreation Impacts in Different Cities
To investigate the impact of cross-city recreation on the spatial distribution of PGS accessibility at the urban scale, a comparative analysis of PGS accessibility was conducted for the cities surrounding Beijing. As shown in Figure 6, Figure 7, Figure 8 and Figure 9, the spatial coverage of six sub-regions around Beijing that can be served by PGS increases as the threshold increases. Accounting for the influence of cross-city recreation, the average PGS accessibility of these cities shows an increase at multiple scales due to the pervasiveness of green space recreation services from Beijing. Specifically, for the 1-h and 2-h scenarios, residents in the eastern part of Chengde and the western part of Zhangjiakou have significantly higher accessibility per capita. The area of medium to high accessibility has increased, especially at the urban–urban interface.
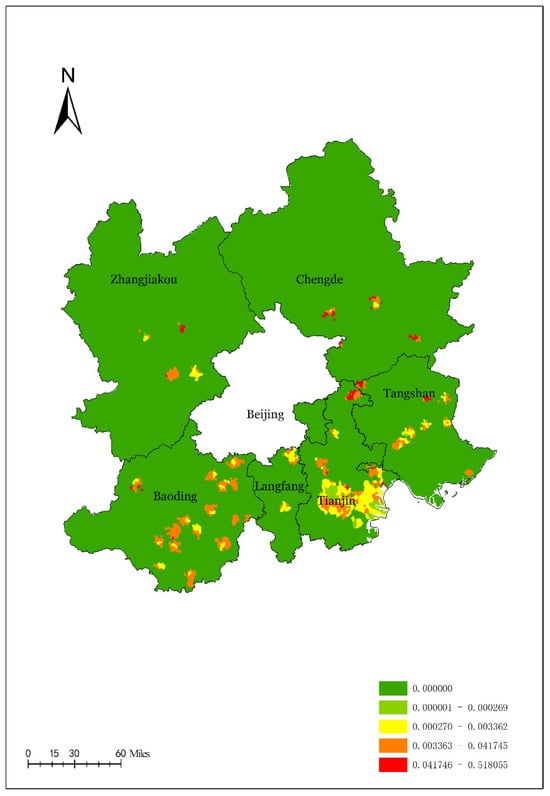
Figure 6.
The accessibility spatial pattern of PGS at 5–10 ha in six cities around Beijing.
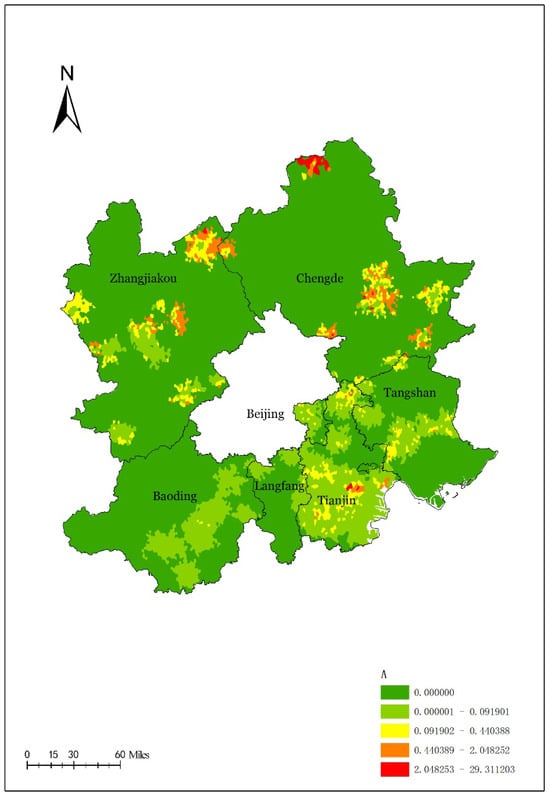
Figure 7.
The accessibility spatial pattern of PGS at 10–50 ha in six cities around Beijing.
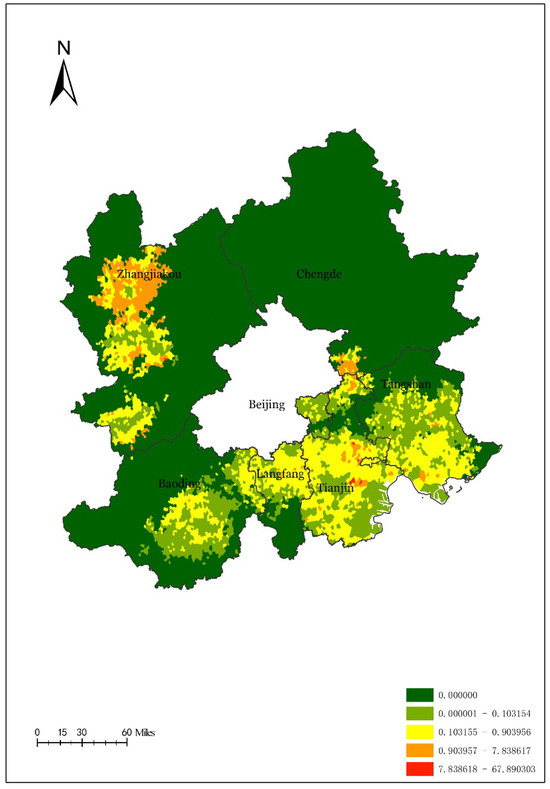
Figure 8.
The accessibility spatial pattern of PGS at 50–100 ha in six cities around Beijing.
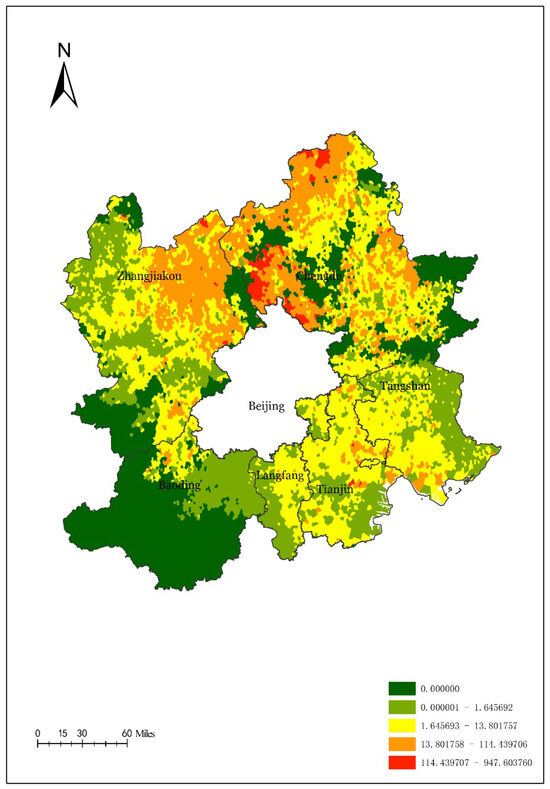
Figure 9.
The accessibility spatial pattern of PGS above 100 ha in six cities around Beijing.
Beijing’s multi-scale PGS accessibility varies slightly with and without the influence of cross-city recreation. As shown in Figure 10, Figure 11, Figure 12 and Figure 13, the outer urban areas of Beijing generally have high accessibility to PGS due to their abundant availability and relatively small community populations. However, central urban areas tend to have lower accessibility due to high population density and limited availability of PGS. This indicates that the per capita PGS resources in central urban areas are not in line with the needs of densely populated communities.
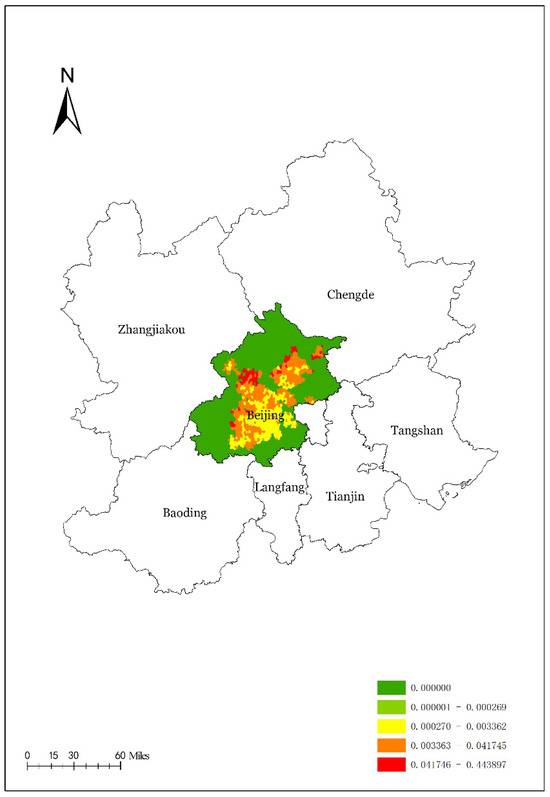
Figure 10.
The accessibility spatial pattern of PGS at 5–10 ha in Beijing.
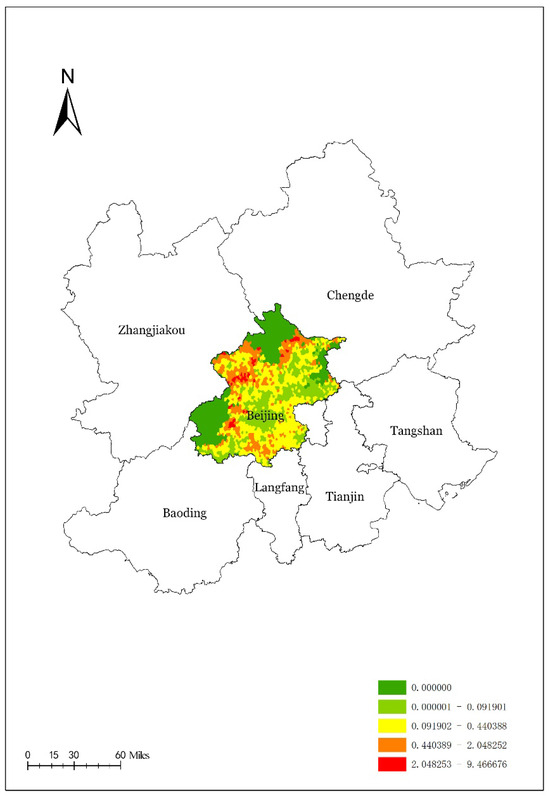
Figure 11.
The accessibility spatial pattern of PGS at 10–50 ha in Beijing.
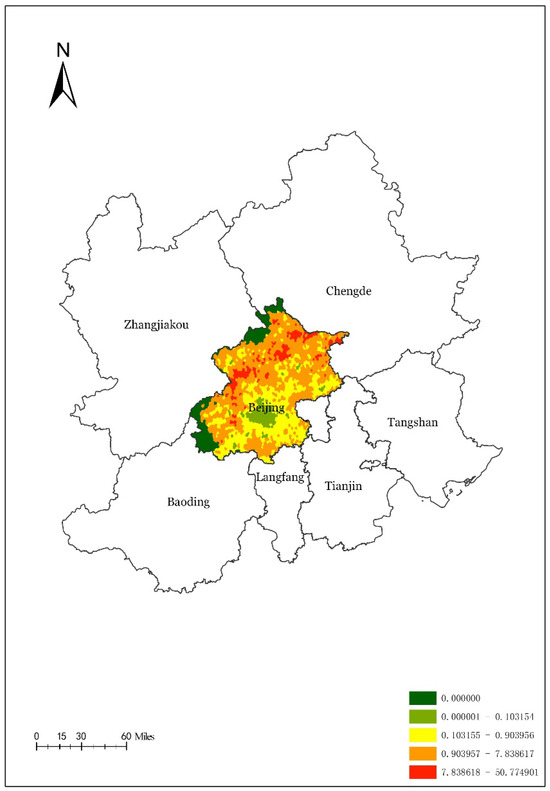
Figure 12.
The accessibility spatial pattern of PGS at 50–100 ha in Beijing.
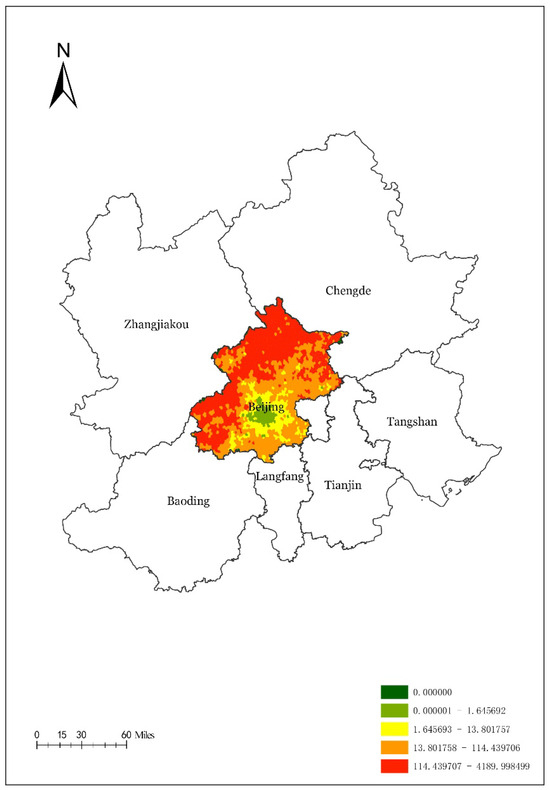
Figure 13.
The accessibility spatial pattern of PGS above 100 ha in Beijing.
Regarding the overall spatial distribution, Chengde, Zhangjiakou, and Baoding face relative shortages of their PGS resources. However, southwest Chengde, east Zhangjiakou, and northeast Baoding are close to Beijing, and within the 1–2 h cross-city recreation time, they are more benefited from the large green spaces in the outer urban areas of Beijing, thus increasing the accessibility.
5. Discussions
5.1. Spatial Distribution of PGS Accessibility
This paper investigates the multi-scale spatial distribution of PGS accessibility in CCEC by the multi-mode Gaussian-based 2SFCA model. This comprehensive accessibility model takes into account multiple modes of transport and non-spatial factors to calculate the spatial characteristics of PGS accessibility at different scales. The investigation also considers the influence of cross-city recreation on PGS accessibility, providing important theoretical and practical implications.
Firstly, from the perspective of multi-scale PGS accessibility, the core area of the CCEC has significantly higher PGS accessibility than the peripheral cities. The higher-high accessibility areas are concentrated in Beijing, while the high accessibility areas are mainly concentrated in the adjacent areas of Beijing (i.e., southeast of Zhangjiakou, southwest of Chengde, and north of Baoding). The spatial distribution of PGS accessibility shows a single-center aggregation pattern, characterized by a circle structure that decreases from the core to the periphery and from north to south. The results of this study are in line with most of the previous studies conducted on urban agglomerations but contrast with the results of the Pearl River Delta urban agglomeration (PRDUA), where accessibility to ecological space recreation services is higher in the periphery areas than the core area [41]. The possible reasons for this discrepancy include population density, traffic conditions, distribution of PGS recreation spaces, and planning policies. CCEC benefits from the “capital one-hour traffic circle” policy. Beijing has formed a convenient transportation network with the surrounding areas; the southeastern Zhangjiakou, southwestern Chengde, and northern Baoding are located within the one-hour traffic circle around the capital, enjoying the benefits of easy access to PGS in Beijing. Additionally, the low population density of communities (villages) in these areas contributes to the high accessibility in the core area of the urban agglomeration. However, cities in the PRDUA are separated by the Pearl River Estuary (due to differences in the shape of the PRDUA and a lack of efficient transportation connections [41]).
Secondly, the overall PGS accessibility at various scales is similar to the distribution of PGS accessibility at multiple scales. PGS accessibility has spatial heterogeneity and changes with temporal–spatial scale [12]. As the catchment size increases, there is a strengthening trend of spatial agglomeration, and areas with high accessibility gradually expand. Most urban core areas are in the range of low or medium reachability level. This view aligns with previous research [42], which also indicates a gradual decrease in multi-scale PGS accessibility from outer urban areas to central urban areas [43].
5.2. Influence of Cross-City Recreation on the Accessibility Pattern of PGS
The growing trend of sharing PGS recreational services between cities requires a shift in focus from the individual city scale to the entire regional scale. This approach can help avoid the “edge effect” caused by city boundaries [40]. The edge effect of green space accessibility in urban agglomerations refers to the phenomenon whereby communities located near administrative boundaries of cities can benefit from large-scale parks or ecological spaces in adjacent municipalities. As a result, the effective service area of park green spaces extends beyond a single city’s jurisdiction, creating intercity ‘shared zones’ of accessibility. In this paper, we analyze the impact of cross-city recreation on the PGS accessibility in urban agglomerations and compare the PGS accessibility under the influence of cross-city recreation at the regional and individual city scale. Since some PGS located along urban boundaries may attract tourists from surrounding cities [40], there is a difference between the evaluation of the PGS accessibility under the influence of cross-city recreation and the PGS accessibility in a single city [44]; this is consistent with our findings. For example, in the Beijing–Chengde interface, residents in southwestern Chengde benefit from large-scale parks (>50 ha) located in the northern suburbs of Beijing, which become accessible within a 1–2-h travel threshold. Similarly, in the Beijing–Zhangjiakou and Beijing–Baoding borders, peripheral communities show significantly higher accessibility than central urban districts, despite having fewer local parks, because they can rely on cross-boundary access to Beijing’s extra-large green spaces.
Moreover, this study reveals that optimizing the scale of PGS at the urban agglomeration level can significantly enhance cross-city recreational services. Previous research has examined travel time sensitivity thresholds at the urban scale ranging from 30 to 90 min [45], suggesting that smaller thresholds result in greater variations in the range of PGS accessibility [40]. Consistent with these findings, we also observe that as the scale of PGS increases, the service radius of the PGS accessibility model expands to serve a larger number of communities and residents; consequently, the accessibility values for the same community (village) undergo constant changes. However, we also found that when the threshold of the accessibility radius increases to 60 min and above (PGS size expands to more than 50 ha), the changes in the PGS accessibility in parts of Zhangjiakou and Chengde that received cross-city recreation impacts were more significant. Similarly, Zhang [40] has proved that the 90-min threshold is a “turning point” for evaluating the country park accessibility, and a smoothing effect occurs after it is exceeded. We believe that (60 min travel range) green space with a scale of more than 50 ha could serve as an important indicator for improving intercity green space accessibility.
Finally, we compared the differences in the impact of cross-city recreation on PGS accessibility among various cities. It was found that cross-city recreation has only significantly improved the accessibility of PGS in some areas (Chengde, Zhangjiakou, Baoding), and there are still some cities (such as Tangshan, Langfang, etc.) that have not significantly changed, especially in the southern part of the CCEC. Relevant studies have proved that this has a relationship with the size of the PGS recreation area that can provide shared services in the area under the accessibility radius of cross-city recreation, which can also be mutually confirmed with the conclusion of this study.
5.3. Implications for Policy and Planning
As the development of China’s first-tier cities has entered a stable stage, a number of city agglomerations have emerged around megacities. The balanced development of the region and the achievement of the sharing of ecological and economic resources among city agglomerations is a common direction for future social development [46]. In light of our study, areas with low accessibility levels have been more accurately identified. Therefore, it is recommended to construct new PGS within acceptable threshold times or focus on enhancing the spatial utilization and quality of PGS within the entire region and enhance their level of transportation accessibility. For example, there is a large area of unused green space, such as forests and wetlands, distributed in urban fringe areas. Establishing an ecological compensation and economic cooperation relationship between high-supply and high-demand areas of PGS recreational services can be beneficial. A systematic plan should be developed for the territorial spatial pattern of the entire region, promoting the integration of green development in CCEC.
Furthermore, urban internal planning is suggested to focus on eliminating the spatial mismatch between supply and demand of green space recreational services. Medium-scale PGS (5–10 ha and 10–50 ha) should be strategically distributed to optimize the supply–demand relationship across different reachable radii of the city and reduce disparities between central and peripheral urban areas. It is also desirable to reserve a certain amount of green space in high-density urban central areas as part of urban renewal projects, and for the construction land that has been demolished and vacated, the strategy of “leaving white space to increase green” should be implemented to avoid high-density development again. Transforming irregular or small open spaces into mini parks or micro-green spaces can help augment the green space supply in central urban areas. By strategically adding medium-scale parks or transforming small vacant plots into micro-green spaces in central urban areas, part of the excessive population pressure can be alleviated and redistributed, ensuring a better balance between population size and available green space supply.
5.4. Limitations and Future Studies
This paper also has some limitations. Firstly, due to the large number and scale of PGS studied, the attractiveness coefficient in the multi-mode Gaussian-based 2SFCA model mainly considers the index of NDVI. However, factors such as on-site amenities and programs also significantly affect residents’ choice of PGS [13,33,45]. Therefore, a new method for calculating the attractiveness coefficient should be proposed. For instance, the small-scale PGS could be evaluated by considering the facilities, and the large-scale park could consider incorporating factors such as site proportion or public ratings. Although Internet map APIs provide dynamic traffic information, our correction step still relied partly on assumed average travel speeds. This simplification does not fully capture traffic variability during peak hours, which may lead to deviations in accessibility estimates, particularly in central urban areas. Future research could integrate real-time traffic big data or temporal traffic simulations to improve the accuracy of accessibility modeling.
Secondly, although the modified M2SFCA model integrates multi-mode travel times across municipal boundaries, it does not explicitly parameterize institutional or infrastructural constraints, such as toll stations, intercity transfer penalties, or administrative barriers to cross-city travel. As a result, some accessibility values may be optimistic, particularly in cases where cross-city trips are limited by differential transport networks or policy restrictions. Future research could integrate more detailed intercity transport datasets, such as origin–destination surveys, high-frequency traffic data, or explicit interjurisdictional impedance factors, to improve representation of these regional constraints.
Thirdly, the population data is modeled based on census and remote sensing data. This introduces inherent uncertainties, including potential discrepancies between modeled estimates and actual resident populations at fine spatial scales (e.g., community/village level). Such inaccuracies could affect the calculated supply-to-demand ratio (Ri) in the M2SFCA model, particularly in rapidly urbanizing peri-urban areas where population dynamics are complex. An overestimation of population in each community would lead to an underestimation of its accessibility score, and vice versa. Furthermore, NDVI is a proxy for landscape quality and may not fully capture other aspects of park attractiveness that influence user choice, such as maintenance, facilities, or aesthetic design. The sensitivity of our model to the Ci parameter means that uncertainties in NDVI could propagate into the final accessibility scores. We attempted to minimize this by normalizing the index, but this inherent limitation remains [47,48]. A more comprehensive multi-criteria evaluation incorporating additional park attributes would strengthen future models.
Lastly, we did not conduct a full statistical comparison (e.g., Gini coefficient changes, correlation improvements) between the classical and modified models. Instead, we provided descriptive evidence by presenting spatial patterns that more realistically reflect cross-city accessibility, especially in peri-urban areas. We now clearly state that although these results suggest improved sensitivity, the absence of direct comparative metrics is a limitation that should be addressed in future research.
6. Conclusions
Taking the China’s Capital Economic Circle as an example, this paper improved the traditional two-step mobile search method, comprehensively considered multiple transportation modes (walking, public transportation, and cars), and introduced the NDVI to calculate the spatial pattern characteristics of multi-scale PGS accessibility. Additionally, a comparative study is conducted to examine the impact of cross-city recreation on the distribution of PGS accessibility between cities. The main conclusions of this research include the following three points:
(1) The multi-scale PGS accessibility landscape of CCEC exhibits a gradual decrease from the core area to the periphery. (2) Cross-city recreation changes the spatial distribution of accessibility, with the emergence of hotspots having the greatest impact on PGS accessibility at the scale of 50–100 ha and above. (3) At the urban scale, the peripheral urban areas generally have higher PGS accessibility of various scales compared to the central urban areas, and affected by cross-city recreation, this feature is more pronounced in urban core areas than in the surrounding peripheral cities. (4) The structure and quality of green spaces vary with their proximity to accessibility hotspots. Parks located closer to hotspots tend to face higher recreational pressure due to greater population inflows, which may accelerate issues of overuse, maintenance burden, and ecological stress. In contrast, green spaces situated at greater distances from hotspots, particularly those in peri-urban areas, often exhibit higher vegetation quality (as reflected by NDVI values) and lower human disturbance, thereby providing opportunities for ecological conservation and cross-city recreation. These spatial differences highlight the importance of balancing green space distribution and quality improvement strategies across core and peripheral zones in urban agglomerations. Our findings can be beneficial to urban planners in formulating effective regional environmental planning policies. They can provide valuable insights to accurately promote the integration of green development within the context of urban agglomerations.
Author Contributions
Conceptualization, Y.Z., X.S., Z.L. (Zhen Lin) and Z.L. (Ziqing Liu); methodology, X.S. and Y.Z.; validation, Y.Z., Z.L. (Zhen Lin) and Z.L. (Ziqing Liu); formal analysis, Y.Z.; investigation, Y.Z. and X.S.; resources, Z.L. (Zhen Lin) and J.L.; data curation, X.S., Y.Z. and J.L.; writing-original draft preparation, Y.Z. and X.S.; writing-review and editing, Y.Z. and Z.L. (Ziqing Liu); visualization, Y.Z.; supervision, Z.L. (Zhen Lin); project administration, Z.L. (Zhen Lin). All authors have read and agreed to the published version of the manuscript.
Funding
This research was funded by [Research on Policy Mechanisms and Technical Pathways for the implementation of Urban physical examination] grant number [Y05J25005] and [Research on the Integration and Demonstration of Key Technologies for Low-Carbon Construction of Urban Blue-Green Spaces] grant number [2022YFC3802605]. And The APC was funded by [Research on Policy Mechanisms and Technical Pathways for the implementation of Urban physical examination].
Data Availability Statement
The original contributions presented in this study are included in the article material. Further inquiries can be directed to the corresponding authors.
Conflicts of Interest
Author Yao Zhao was employed by the the China Urban Construction Design & Research Institute Co., Ltd. Author Junhui Liang was employed by the Beijing Duyi Planning Consulting Co., Ltd. The remaining authors declare that the research was conducted in the absence of any commercial or financial relationships that could be construed as a potential conflict of interest.
References
- Haaland, C.; Bosch, V.C. Challenges and strategies for urban green-space planning in cities undergoing densification: A review. Urban For. Urban Green. 2015, 14, 760–771. [Google Scholar] [CrossRef]
- Soga, M.; Gaston, K.J. Extinction of experience: The loss of human-nature interactions. Front. Ecol. Ecol. Environ. 2016, 14, 94–101. [Google Scholar] [CrossRef]
- Wüstemann, H.; Kalisch, D.; Kolbe, J. Access to urban green space and environmental inequalities in Germany. Landsc. Urban Plan. 2017, 164, 124–131. [Google Scholar] [CrossRef]
- Rigolon, A.; Flohr, T.L. Access to parks for youth as an environmental justice issue: Access inequalities and possible solutions. Buildings 2014, 4, 69–94. [Google Scholar] [CrossRef]
- Lee, G.; Hong, I. Measuring spatial accessibility in the context of spatial disparity between demand and supply of urban park service. Landsc. Urban Plan. 2013, 119, 85–90. [Google Scholar] [CrossRef]
- Morris, J.M.; Dumble, P.L.; Wigan, M.R. Accessibility indicators for transport planning. Transp. Res. Part A 1979, 13, 91–109. [Google Scholar] [CrossRef]
- Tan, P.Y.; Samsudin, R. Effects of spatial scale on assessment of spatial equity of urban park provision. Landsc. Urban Plan. 2017, 158, 139–154. [Google Scholar] [CrossRef]
- Xiao, Y.; Wang, Z.; Li, Z.G.; Tang, Z.L. An assessment of urban park access in Shanghai: Implications for the social equity in urban China. Landsc. Urban Plan. 2017, 157, 383–393. [Google Scholar] [CrossRef]
- Tsou, K.W.; Hung, Y.T.; Chang, Y.L. An accessibility-based integrated measure of relative spatial equity in urban public facilities. Cities 2005, 22, 424–435. [Google Scholar] [CrossRef]
- Chang, H.S.; Liao, C.H. Exploring an integrated method for measuring the relative spatial equity in public facilities in the context of urban parks. Cities 2011, 28, 361–371. [Google Scholar] [CrossRef]
- Delmelle, E.C.; Casas, I. Evaluating the spatial equity of bus rapid transit-based accessibility patterns in a developing country: The case of Cali, Colombia. Transp. Policy 2012, 20, 36–46. [Google Scholar] [CrossRef]
- Hu, S.J.; Song, W.; Li, C.G.; Lu, J. A multi-mode Gaussian-based two-step floating catchment area method for measuring accessibility of urban parks. Cities 2020, 105, 102815. [Google Scholar] [CrossRef]
- Dony, C.C.; Delmelle, E.M.; Delmelle, E.C. Re-conceptualizing accessibility to parks in multi-modal cities: A Variable-width Floating Catchment Area (VFCA) method. Landsc. Urban Plan. 2015, 143, 90–99. [Google Scholar] [CrossRef]
- La Rosa, D. Accessibility to green spaces: GIS based indicators for sustainable planning in a dense urban context. Ecol. Indic. 2013, 25, 240–251. [Google Scholar] [CrossRef]
- Zhang, J.G.; Cheng, Y.Y.; Wei, W.; Zhao, B. Evaluating spatial disparity of access to public parks in gated and open communities with an improved G2SFCA model. Sustainability 2019, 11, 5910. [Google Scholar] [CrossRef]
- Fang, C.L.; Zhou, C.H.; Gu, C.L.; Chen, L.D.; Li, S.C. Theoretical analysis of interactive coupled effects between urbanization and eco-environment in mega-urban agglomerations. Acta Geol. Sin. (Engl. Ed.) 2016, 71, 531–550. [Google Scholar] [CrossRef]
- Fang, C.; Cui, X.; Li, G.; Bao, C.; Wang, Z.; Ma, H.; Sun, S.; Liu, H.; Luo, K.; Ren, Y. Modeling regional sustainable development scenarios using the Urbanization and Eco-environment Coupler: Case study of Beijing-Tianjin-Hebei urban agglomeration, China. Sci. Total Environ. 2019, 689, 820–830. [Google Scholar] [CrossRef]
- Zhou, D.; Tian, Y.; Jiang, G. Spatio-temporal investigation of the interactive relationship between urbanization and ecosystem services: Case study of the Jingjinji urban agglomeration, China. Ecol. Indic. 2018, 95, 152–164. [Google Scholar] [CrossRef]
- Dai, D. Racial/ethnic and socioeconomic disparities in urban green space accessibility: Where to intervene? Landsc. Urban Plan. 2011, 102, 234–244. [Google Scholar] [CrossRef]
- Boone, C.G.; Buckley, G.L.; Grove, J.M.; Sister, C. Parks and people: An environmental justice inquiry in Baltimore, Maryland. Ann. Am. Assoc. Geogr. 2009, 99, 767–787. [Google Scholar] [CrossRef]
- Sister, C.; Wolch, J.; Wilson, J. Got green? Addressing environmental justice in park provision. GeoJournal 2010, 75, 229–248. [Google Scholar] [CrossRef]
- Moore, L.V.; Evenson, K.R.; McGinn, A.P.; Brines, S.J. Availability of recreational resources in minority and low socioeconomic status areas. Am. J. Prev. Med. 2008, 34, 16–22. [Google Scholar] [CrossRef]
- Nesbitt, L.; Meitner, M.J.; Girling, C.; Sheppard, S.R.J.; Lu, Y. Who has access to urban vegetation? A spatial analysis of distributional green equity in 10 US cities. Landsc. Urban Plan. 2019, 181, 51–79. [Google Scholar] [CrossRef]
- Kabisch, N.; Haase, D. Green justice or just green? Provision of urban green spaces in Berlin, Germany. Landsc. Urban Plan. 2014, 122, 129–139. [Google Scholar] [CrossRef]
- Talen, E. Neighborhoods as service providers: A methodology for evaluating pedestrian access. Environ. Plan. B Plan. Des. 2003, 30, 181–200. [Google Scholar] [CrossRef]
- Vaughan, K.B.; Kaczynski, A.T.; Stanis, S.A.W.; Besenyi, G.M.; Bergstrom, R.; Heinrich, K.M. Exploring the distribution of park availability, features, and quality across Kansas City, Missouri by income and race/ethnicity: An environmental justice investigation. Ann. Behav. Med. 2013, 45, 28–38. [Google Scholar] [CrossRef]
- McCormack, G.R.; Rock, M.; Toohey, A.M.; Hignell, D. Characteristics of urban parks associated with park use and physical activity: A review of qualitative research. Health Place 2010, 16, 712–726. [Google Scholar] [CrossRef]
- Luo, W.; Wang, F. Measures of spatial accessibility to health care in a GIS environment: Synthesis and a case study in the Chicago region. Environ. Plan. B Plan. Des. 2003, 30, 865–884. [Google Scholar] [CrossRef]
- Xing, L.; Liu, Y.; Wang, B.; Wang, Y.; Liu, H. An environmental justice study on spatial access to parks for youth by using an improved 2SFCA method in Wuhan, China. Cities 2020, 96, 102405. [Google Scholar] [CrossRef]
- Luo, W.; Qi, Y. An enhanced two-step floating catchment area (E2SFCA) method for measuring spatial accessibility to primary care physicians. Health Place 2009, 15, 1100–1107. [Google Scholar] [CrossRef] [PubMed]
- Ibes, D.C. A multi-dimensional classification and equity analysis of an urban park system: A novel methodology and case study application. Landsc. Urban Plan. 2015, 137, 122–137. [Google Scholar] [CrossRef]
- Kaczynski, A.T.; Potwarka, L.R.; Saelens, B.E. Association of park size, distance, and features with physical activity in neighborhood parks. Am. J. Public Health 2008, 98, 1451–1456. [Google Scholar] [CrossRef]
- Wang, D.; Brown, G.; Liu, Y. The physical and non-physical factors that influence perceived access to urban parks. Landsc. Urban Plan. 2015, 133, 53–66. [Google Scholar] [CrossRef]
- Yang, W.Y.; Li, X.; Chen, H.L.; Cao, X.S. Multi-scale accessibility of green spaces and its equity in Guangzhou based on multi-mode two-step floating catchment area method (M2SFCA). Acta Ecol. Sin 2021, 41, 6064–6074. [Google Scholar] [CrossRef]
- Wood, L.; Hooper, P.; Foster, S.; Bull, F. Public green spaces and positive mental health—Investigating the relationship between access, quantity and types of parks and mental wellbeing. Health Place 2017, 48, 63–71. [Google Scholar] [CrossRef]
- Chen, Y.; Yue, W.Z.; La Rosa, D. Which communities have better accessibility to green space? An investigation into environmental inequality using big data. Landsc. Urban Plan. 2020, 204, 103919. [Google Scholar] [CrossRef]
- Hao, F.L.; Wang, S.J.; Xie, D.C.; Yu, T.T.; Feng, Z.X. Space-time accessibility of commercial centers in Changchun urban area based on internet map service. Econ. Geogr. 2017, 37, 68–75. [Google Scholar] [CrossRef]
- Zheng, Z.C.; Zhang, L.J.; Qin, Y.C.; Xie, Z.X.; Rong, P.J.; Li, Y. Accessibility to medical care services of urban residents based on internet map service in Kaifeng City. Resour. Sci. 2018, 40, 2307–2316. [Google Scholar] [CrossRef]
- Wei, F. Greener urbanization? Changing accessibility to parks in China. Landsc. Urban Plan. 2017, 157, 542–552. [Google Scholar] [CrossRef]
- Zhang, J.; Cheng, Y.; Zhao, B. How to accurately identify the underserved areas of peri-urban parks? An integrated accessibility indicator. Ecol. Indic. 2021, 122, 107263. [Google Scholar] [CrossRef]
- Wang, F.Y.; Wang, K.Y.; Liu, H.C. Evaluation and influence factors of spatial accessibility of ecological space recreation service in the Pearl River Delta Urban Agglomeration: A modified Two-step Floating Catchment Area method. Acta Ecol. Sin 2020, 40, 3622–3633. [Google Scholar] [CrossRef]
- Tao, Q.; Tao, Y.; Ou, W.X. Spatial variation of supply and demand relationships of recreational service in the Yangtze River Delta. Acta Ecol. Sin 2021, 41, 1777–1785. [Google Scholar] [CrossRef]
- Liang, X.; Tian, H.; Li, X.; Huang, J.L.; Hu, G. Modeling the dynamics and walking accessibility of urban open spaces under various policy scenarios. Landsc. Urban Plan. 2021, 207, 103993. [Google Scholar] [CrossRef]
- Rossi, S.D.; Byrne, J.A.; Pickering, C.M. The role of distance in peri-urban national park use: Who visits them and how far do they travel? Appl. Geogr. 2015, 63, 77–88. [Google Scholar] [CrossRef]
- Xing, L.J.; Liu, Y.F.; Liu, X.J. Measuring spatial disparity in accessibility with a multi-mode method based on park green spaces classification in Wuhan, China. Appl. Geogr. 2018, 94, 251–261. [Google Scholar] [CrossRef]
- Ouyang, X.; Tang, L.S.; Wei, X.; Li, Y.H. Spatial interaction between urbanization and ecosystem services in Chinese urban agglomerations. Land Use Policy 2021, 109, 105587. [Google Scholar] [CrossRef]
- Zhong, C.; Chen, J.; Yi, B.; Li, H. Examining the reliable trend of global urban land use efficiency from 1985 to 2020 using robust indicators and analysis tools. Habitat Int. 2025, 163, 103477. [Google Scholar] [CrossRef]
- Goodchild, M.F. How well do we really know the world? uncertainty in GIScience. J. Spat. Inf. Sci. 2020, 20, 97–102. [Google Scholar] [CrossRef]
Disclaimer/Publisher’s Note: The statements, opinions and data contained in all publications are solely those of the individual author(s) and contributor(s) and not of MDPI and/or the editor(s). MDPI and/or the editor(s) disclaim responsibility for any injury to people or property resulting from any ideas, methods, instructions or products referred to in the content. |
© 2025 by the authors. Licensee MDPI, Basel, Switzerland. This article is an open access article distributed under the terms and conditions of the Creative Commons Attribution (CC BY) license (https://creativecommons.org/licenses/by/4.0/).