Abstract
Stream bank erosion poses significant threats to societal well-being and ecosystem services. Despite its importance, studies in Greece have been limited. This study evaluated stream bank erosion categories using the geographic information system (GIS) and the Bank Erosion Hazard Index (BEHI). Five stream reaches with different characteristics were selected near Drama, Greece. The GIS was used to map the stream and riparian area characteristics and to locate the BEHI sampling plots. The BEHI was employed to classify bank erosion vulnerability. The Categorical Principal Components Analysis (CatPCA) analysis was used to determine the factors that influence erosion. The study reaches, except for one, had high, very high, and extreme stream bank erosion exceeding 28%. Two reaches had greater than 40% of the banks without erosion. Substantial differences in erosion categories (%) were detected due to different fluvio-geomorphologic and anthropogenic pressures. Based on the CatPCA, agricultural and urbanized riparian areas experienced high, very high, and extreme bank erosion. Reaches with perennial flow had limited erosion. In addition, straight reaches had many human interventions. Although mitigation measures had been taken, they have not been effective. Thus, the responsible authorities should consider adopting nature-based solutions to maintain and restore riverine and riparian areas.
1. Introduction
Soil erosion is a natural process that has become one of the most important environmental problems. It causes damage to human infrastructure, reduces land productivity, and degrades ecosystems [1,2,3] and is detrimental for the nation and globe (Gross Domestic Product (GDP)) [4]. The accelerated soil erosion is the result of human activities, such as agricultural intensification, urbanization, and deforestation along with climate change [5,6,7]. One of the dominant forms of soil erosion is stream bank erosion that is episodic by nature [8,9]. This is the result of the many factors that influence it along with the diverse process that can cause it. Typically, subaerial processes are prevalent in headwater reaches, fluid entrainment processes in mid-basin locations, and mass failure in lower reaches [10,11,12].
Erosion and deposition in the stream are fundamental processes for the functioning of river ecosystems [13]. They create unique landscapes (e.g., floodplains, riparian areas, and deltas) while their habitats have adapted and thrive in these disturbance-driven environments [14,15,16,17,18]. They provide many important and unique ecosystem services to human society. Unfortunately, the accelerated bank erosion, that many streams experience today, exceed the natural thresholds of these ecosystems. This accelerated erosion degrades them and, if it continues, will cause irreversible changes (e.g., channel widening, channel depth, incision, habitat loss, increased sediment pollution, etc.).
Natural undisturbed streams and rivers are in a state of dynamic equilibrium. Specifically, the streamflow discharge, stream channel slope, sediment median size, and sediment load are in a dynamic equilibrium [19]. In natural rivers or streams these factors have adjusted through time so that erosion and deposition are the same through time. The major land-uses changes that have occurred or are occurring around the world, along with the stream-channel anthropogenic alterations, have disrupted this dynamic equilibrium [20,21,22,23]. This is reflected in streams through excessive steam bank erosion, deposition, or both [24].
Climate change is further disrupting this dynamic equilibrium [25]. This is due to alterations in the rainfall and snowfall patterns and amounts and intensity, along with the increase in temperatures and evapotranspiration rates. Floods are more frequent and fiercer, and droughts are more extreme and last longer [16,26]. It is expected in the future, that due to the climate crisis, water erosion will increase by 30–66% [27].
With conservation practices initially focusing on surface soil erosion reduction, without always reducing surface water runoff volumes, there was a shift in the stream sediment main contributors [28,29,30,31]. Specifically, stream bank erosion became the major sediment contributor to streams and rivers. Several studies reported stream bank contributions to the sediment load as high as 90%, particularly in agricultural watersheds [32,33,34].
Accelerated erosion rates along extensive sections of streams and rivers increase flooding chances, thus threatening agricultural land production, human villages, towns, and cities, and can even endanger human lives [35,36,37,38,39,40]. They also damage human infrastructures such as bridges, roads, and dikes [41,42,43,44]. The increased sedimentation of eroded material lessens reservoir storage capacity and causes problems with navigational transportation [45]. Finally, excessive nonpoint source pollutants reduce water quality [46,47,48,49,50,51,52,53].
Numerous and diverse methods have been developed to measure and comprehend stream bank erosion [54]. Traditional field methods include erosion pins, Gerlach traps, and cross-section surveys. Field methods using advanced sensors include ultrasonic technology, photo-electronic erosion pins, thermal consonance timing principle, and terrestrial laser scanners [55,56,57,58,59,60]. The above-mentioned methods are accurate but require many hours of field work and measure a relatively limited reach length. On the other hand, remote sensing can provide a rapid assessment and is being widely applied by utilizing either satellite or unmanned aerial systems (UAS) [61,62,63,64,65,66,67]. Such methods increase the spatial extent of the studied stream and rivers, although specialized expertise is required.
In many cases, a visual assessment protocol is ideal for preliminary monitoring for stream and river restoration. These protocols are typically easy to comprehend and implement and can be applied in a relatively short period of time for large reaches of streams and rivers. Several have been developed and are being utilized, such as the Stream Visual Assessment Protocol (SVAP) [68], Bank Erosion Hazard Index (BEHI) [69], and Qualitat del Bosc de Ribera (QBR) [70]. Each of these protocols are specialized and focus either on the stream, riparian area, or stream bank. These protocols can identify problematic areas for more advanced research or to implement targeted nature-based solutions (NbS). Typically, limited training is required, and thus it can be used easily and effectively by the responsible agencies and even volunteers.
A geographic information system (GIS) is another efficient tool for agencies, land, and water managers. They can support the decision-making processes related to the planning and management of land-uses, natural ecosystems, transportation, services in urban areas, etc. [71]. This information allows managers to do preparatory work before going to the field. Specifically, it can provide hydrologic and morphometric information about the stream/river and/or watershed of interest to identify the potential ideal reaches to implement a visual protocol [65]. Researchers have effectively combined the utility of GIS and visual assessment protocols [72].
Overall, very few studies in Greece have focused on stream bank erosion [67]. Currently the data on the bank condition of streams in Greece are lacking [65]. Another gap is on potential applicable tools that could be utilized to assess stream banks cost-effectively [65]. In this study, the aim was to assess stream bank erosion in different stream reaches of the Regional Unit of Drama in Greece. The first hypothesis was that the different streams would have different stream bank erosion vulnerability because of the fluvio-geomorphic characteristics and anthropogenic pressures. These streams are representative of Greece and the entire Balkan region. This assessment was performed by utilizing GIS tools and the BEHI protocol. Fluvio-geomorphologic and anthropogenic factors that impact stream bank erosion were also investigated. The second hypothesis was that certain factors would emerge as more important for stream bank erosion vulnerability.
2. Materials and Methods
2.1. The Study Area
The studied streams chosen to assess bank erosion are within the Regional Unit of Drama (the center of Regional Unit in Greek Grid is X: 515,000 Y: 4,565,000) (Figure 1). The Regional Unit of Drama occupies an area of 3468 km2 and consists of 5 municipalities: Doxato, Drama, Kato Nevrokopi, Paranesti, and Prosotsani. The climate is mediterranean, with cold winters and hot summers. One of the main characteristics of the area is the abundance of water as it has several springs and streams [73]. The focus was on tributaries of Aggitis River. Aggitis River’s watershed belongs hydrologically to the River Basin District of Eastern Macedonia (GR11) of Greece [74]. In particular, five (5) stream reaches were selected (Figure 2). They were selected because of their relative proximity to the City of Drama which allowed the assessment of different anthropogenic impacts. The selected stream reaches had different characteristics but are typical of the region. They were classified into two stream flow categories: “perennial streams” with permanent flow and “intermittent—streams” with periodic flow streams (typically no flow during the summer). The streams of Monastiraki-Ag. Varvara (X: 511,621.06 Y: 4,554,945.92) and Nea Amisos (X: 510,333.66 Y: 4,552,511.20) are perennial, while the streams of Kallifytos (X: 512,873.63 Y: 4,554,665.99), Adriani-Doxato (X: 521,184.50 Y: 4,550,391.90), and Zoodohos Pigi (X: 509,458.24 Y: 4,555,198.71) are intermittent [73,74]. Table 1 presents each reach’s total length, the date of the field measurements, the total number of sampling plots, and the distance between the plots.
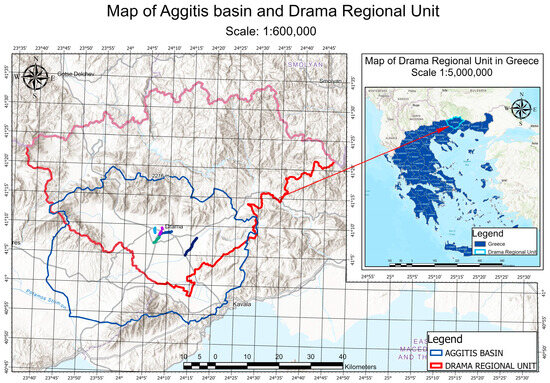
Figure 1.
The studied stream reaches (depicted with different colors) were within the Aggitis River watershed (blue line) and the Regional Unit of Drama in Greece (red line). Monastiraki-Agia Varvara Stream (purple line), Adriani-Doxato stream (Dark Blue line), Kallifytos stream (Blue line), Nea Amisos stream (green line) and Zoodohos Pigi Stream (lite blue line).
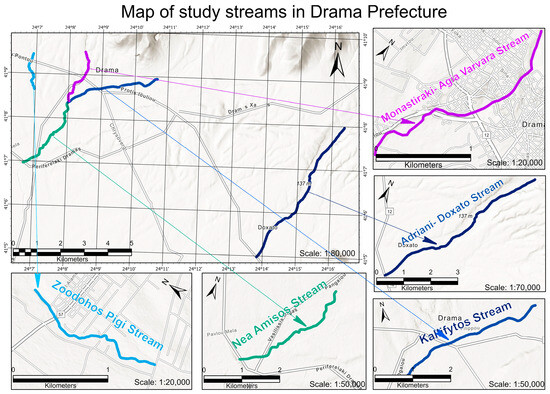
Figure 2.
The location of the five selected stream reaches assessed for stream bank erosion. A close-up of each stream reach is also presented. Monastiraki-Agia Varvara Stream (purple line), Adriani-Doxato stream (Dark Blue line), Kallifytos stream (Blue line), Nea Amisos stream (green line) and Zoodohos Pigi Stream (lite blue line).

Table 1.
The studied stream reaches length, date of field measurements, plot numbers, and distance between sampling plots.
2.2. Utilizing Geographic Information Systems (GIS)
2.2.1. Primary Data
GIS were used to analyze the primary data (shapefiles) of the five study reaches. These data were complimentary and would allow us to classify the different reaches based on various characteristics. All primary data were processed in ArcGIS Pro 2.5. The main data source was Copernicus [75]. Specifically, the following files were downloaded from the Copernicus site:
- Corine 2018 (Land-Uses);
- EU-Hydro River Network Database 2006–2012;
- Greek Regional Units (former Prefectures).
It should be noted that, to verify the above-mentioned riparian land-use from Corine 2018, ground truthing was conducted, while google map imagery and UAV survey (when possible, due to riparian vegetation) were also utilized. This was deemed necessary because some land-uses from the Corine 2018 survey were classified wrongly. Thus, ground truthing and imagery allowed the correction of the Corine 2018 land-use layers. Finally, through GIS, maps were extracted to showcase the results and allow their better comprehension [76]. Such visuals can help conservation measures to be more acceptable by policy makers and the general public which should lead to the more sustainable mitigation of stream bank erosion.
2.2.2. Digitization and Data Export
The ArcGIS Pro 2.5 was also used to digitize the study stream reaches, to delineate the riparian zones, and to select the sampling locations to implement the BEHI protocol. Once the selected stream reaches centerline was digitized, their length was calculated. To create the riparian zone, the buffer tool was utilized. Specifically, a distance of 50 m was selected and established from the digitized stream centerline. Within these 50 m buffers, the land-uses were determined to categorize each specific reach’s riparian areas. Through GIS, a systematic sampling was applied to select the BEHI locations (an example can be seen in Figure 3). The BEHI protocol suggests that the minimum distance between plots should be 100 m. In our case, the above suggestion was followed in three studied reaches. For the other two reaches that were more homogenous (fluvio-geomorphologically) based on our field sampling survey, the distance used was 150 m for the Zoodohos Pigi stream and 200 m, for the Nea Amisos stream. Once the sampling plots distances were determined, GIS provided the exact sampling location, and these were exported as KML files. This type of format allowed the plot location on mobile devices via the Google Earth app to be uploaded and the implementation of the BEHI protocol.
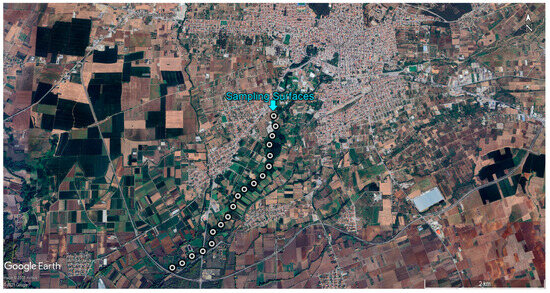
Figure 3.
The systematic selection of the BEHI sample plots through GIS for the Nea Amisos stream reach, in Google Earth.
2.3. Τhe Bank Erosion Hazard Index (BEHI)
The BEHI is utilized to evaluate the effects of stream bank erosion on the total watershed sediment contribution [69]. This index estimates the condition of the channel and the potential bank erosion susceptibility of a specific bank. It is a practical and efficient tool to assess stream banks in regard to their ecological status and restoration needs [77,78]. Another advantage is that it allows relatively quickly to assess the bank conditions over large lengths of a stream but also helps prioritize areas that need to be targeted for restoration [79]. The BEHI can be applied to all stream types [80,81].
Specifically, the BEHI assesses the level of erosion on the banks of streams. It is multi-metric and semi-quantitative and includes estimates and measurements. Some of these include the ratio of bank height/bankfull discharge height, the ratio of rooting depth/bank height, root density, bank angle, percent of surface protected by vegetation, and uniform dimensional pieces of rocks [69]. It consists of three fill-in sheets. In the first sheet (Pre-Screening BEHI Questionnaire), the criteria determine if a sampling plot should be further assessed. Specifically, it has six criteria, and the sampling plot should meet at least 2 of them to be further evaluated for bank erosion. These criteria are the following:
- The percentage of the bank toe that is protected.
- The existence of undercuts.
- The existence of stratification and if a layer has erodible material.
- If the banks exceed 3 m in height and the percentage of bank soil exposed.
- The percentage of roots lacking soil material.
- The percentage of the bank lacking rooted vegetation.
If it does not meet the conditions described in the pre-screening sheet, then erosion is considered very low, or none exist [82], and no assessment is required. In the second sheet the indicators that need to be assessed are the following:
- Date, weather condition, and the personnel recording the information.
- The bank number (#) being assessed.
- The GPS coordinates.
- The pictures along both banks.
- The side of the stream being assessed (left or right).
- The bank height (m) from the toe to the top of the bank.
- The bank length (m).
- The number of questions answered with a “yes” (#) in the pre-screening sheet.
- The distance to infrastructure (m) and its type.
- The unvegetated mid-channel bar/braided channel, exposed tree roots, etc.
- The composition of the bank material.
- The visually estimated root depth (m) and density (%), vertically.
- The slope of the lower (undercutting) and the entire bank.
- The visually estimated stream bank vegetative protective layer (%).
- The visually determined number (#) of stratified layers.
Finally, in the third sheet the indicators are graded to determine the erosion category of the assessed bank. All the scores from the above-described indicators (second sheet) are added to calculate the overall modified BEHI score and afterwards its category. Lower scores of BEHI indicate a more stable bank condition and a lower erosion potential, while higher scores signify a greater vulnerability. The categories are seven:
- Without erosion.
- Very low.
- Low.
- Moderate.
- High.
- Very high.
- Extreme.
2.4. Statistical Analysis—Linear Regression
The linear regressionanalysis is used to understand and predict the linear relationship between a Dependent Variable (Y) and one or more Independent Variables (X). It uses a mathematical equation, such as Y = β0 + β1X + ε, to model this relationship, where β0 is the intercept, β1 is the slope (which indicates the change in Y for a unit change in X), and ε is the error term. The goal is to find the “best fit” line that minimizes the differences between the predicted and actual values; and often uses the method of least squares. A number of different modles will be tested. The parameters of partial analysis (R, R2, standard error, etc.) of the linear regression allows the best statistical models based on the dataset to be chosen. In addition a number of different criteria were estimated to futher assess the utility of the difffeent models developed. The analysis was performed with the IBM SPSS Statistics 21.0 software
2.5. Statitiscal Analysis—Categorical Principal Component Analysis (CatPCA)
The categorical principal component analysis (CatPCA) is a generalization of the principal component analysis (PCA), which reduces the variables in a dataset to a small number of principal components that represent the information in the variables as closely as possible [83]. Its ability to simultaneously handle variables at different levels of analysis (nominal, ordinal, and numeric) and to deal with nonlinear relationships between variables has resulted in its use as an exploratory technique in many environmental studies [84,85,86]. The reason for preferring PCA is because it can handle multicollinearity and reduce noise by eliminating components with low variance and detect outliers. These advantages outweigh the disadvantages such as scaling of the data and computational complexity.
The analysis was performed to determine the variables (factors) that most influence the erosion levels in the streams studied. These studied variables included severe stream flow, stream pattern (meandering or straight), riparian land-use, stream channel slope, anthropogenic interventions, BEHI erosion level categories, and soil coefficient. These were grouped into different categories, to find statistically significant differences. The analysis was performed with the IBM SPSS Statistics 21.0 software. The grouping was performed with the SPSS categories module. Finally, the optimal quantification of the categorical modes of each variable was achieved through an iterative Alternating Least Squares model [87].
3. Results
3.1. Riparian Land-Uses
The percentages of the riparian land-uses in each of the stream reaches studied are shown in Figure 4. In all stream reaches the largest percentage was in some type of agriculture management (non-irrigated land, complex cultivation patterns, or permanently irrigated land), although these differed in each stream reach. The Kallifytos stream reach was characterized by 27% complex farming systems and 37% non-irrigated agricultural land. It also had a considerably higher percentage of discontinuous urban fabric (36%) compared to the other reaches. The Monastiraki-Agia Varvara stream reach was dominated by non-irrigated agricultural land (91%) and the rest was in complex farming systems (3%) and discontinuous urban fabric (4%). The Adriani-Doxato stream reach mostly had non-irrigated agricultural land (93%) while the remaining areas had discontinuous urban fabric (7%). The Zoodohos Pigi stream reach was also dominated by non-irrigated agricultural land (75%), but it must be highlighted that it had the highest percentage of industrial or commercial units (22%). A small percentage of discontinuous urban fabric (2%) was also present. Finally, the Nea Amisos stream reach was entirely covered by agriculture (18% permanently irrigated land and 82% non-irrigated agricultural land).
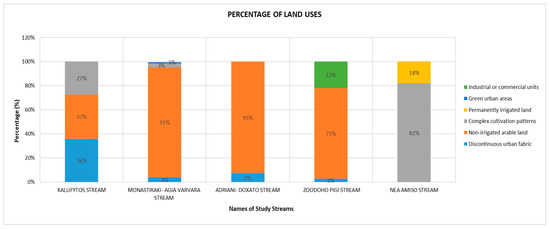
Figure 4.
The riparian land-use percentages of the studied stream reaches based on the adjusted Corine 2018 utilizing ground truthing and google map imagery.
3.2. Stream Reaches—Stream Bank Erosion Categories
The percentages of the bank erosion categories in each stream reach are presented in Figure 5. In the Kallifytos reach, the highest percentage found was without erosion (43%), followed by very low erosion (23%). However, 28% of plots experienced erosion (high, very high, and extreme erosion). Moving on to Monastiraki-Ag. Varvara reach, the largest percentage of stream banks were without erosion (69%). The eroded banks (high, very high, and extreme erosion) covered 18% of the total length. The Adriani-Doxato reach had substantially different results from the previous two reaches. High erosion had the highest percentage (38%) followed by extreme (30%) and very high (20%). Only 4% of the plots assessed were without erosion. The Zoodohos Pigi reach had four erosion categories. Specifically, 45% were assessed with moderate erosion, 36% with high erosion, and 9% with very high. Banks with low erosion were 9%. Since many plots had high, very high, and extreme erosion, this indicated that stream bank erosion is a serious concern in this reach. Finally, in the Nea Amisos reach, the largest percentage of sampled plots was assessed with low erosion (36%) and only 8% without erosion. Still 32% of plots had considerable erosion (high, very high, and extreme).
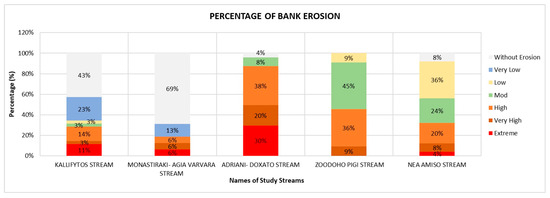
Figure 5.
The percentage of stream bank erosion categories based on the BEHI assessment in the five studied reaches.
When comparing the five stream reaches studied (Figure 5), the Adriani-Doxato had 88% of its banks with high, very high, and extreme levels. The Zoodohos pigi stream reach followed with 45%. The Nea Amisos and Kallifytos streams had similar percentages, 32% and 28%, respectively. Finally, the Monastiraki-Ag. Varvara stream had the lowest percentage (18%) of erosion. Overall, Monastiraki-Ag. Varvara and Kallifytos stream had primarily stable stream banks (without erosion 69% and 43%, respectively). The situation was very different for the other three stream reaches that were studied. Specifically, two of the stream reaches (Adriani-Doxato and Nea Amisos) had less than 10% of their banks stable (without erosion) while one (Zoodohos Pigi) had no banks without erosion.
3.3. Linear Regression Analysis
In the linear regression analysis, three different models were developed with different variables to assess their results. These models had the following variables:
- Μodel 1 (all variables): BEHI erosion level categories (Dependent Variable = Y), stream flow (St.Fl.), riparian land-uses (Ri.La.Us.), meander or straight channels (Me.St.Ch.), existence or not of anthropogenic interventions (Ex.An.In.), and soil factor (So.Fa.) and stream channel slope (St.Ch.Sl.) (Independent Variables).
Y = 1.017 − 0.945 × (St.Fl.) + 0.356 × (Ri.La.Us.) − 0.040 × (Me.St.Ch.) + 0.626 × (Ex.An.In.) + 0.920 × (So.Fa.) + 0.578 × (St.Ch.Sl.)
- Μodel 2 (anthropogenic variables): BEHI erosion level categories (Dependent Variable = Y), riparian land-uses (Ri.La.Us.), meander or straight channels (Me.St.Ch.), and existence or not of anthropogenic interventions (Ex.An.In.) (Independent Variables).
Y = 5.908 − 0.240 × (Ri.La.Us.) − 0.780 × (Ex.An.In.) − 0.128 × (Me.St.Ch.)
- Μodel 3 (fluvio-geomorphologic variables): BEHI erosion level categories (Dependent Variable = Y), stream flow (St.Fl.), meander or straight channels (Me.St.Ch.), and soil factor (So.Fa.) and stream channel slope (St.Ch.Sl.) (Independent Variables).
Y = 1.928 − 0.266 × (St.Fl.) + 0.056 × (Me.St.Ch.) + 0.739 × (So.Fa.) + 0.551 × (St.Ch.Sl.)
Table 2 provides the values of partial analysis parameters for each of the three models. This allowed us to compare the three developed models. In addition to further compare these models’ different criteria were utilized and are presented in Table 3.
Table 2.
The studied stream reaches length, date of field measurements, plot numbers, and distance between sampling plots.
Table 3.
The studied stream reaches length, date of field measurements, plot numbers, and distance between sampling plots.
The above results show the following:
- Model 1 is the best overall, having the lowest AIC, SBC, APC, and PRESS. It also has the highest R2, and the F was very significant (<0.001). Cp = 6 indicates that it has the right number of variables (probably ~5). The Durbin–Watson value = 1.364 indicates some positive autocorrelation, but much less than the others. It is the most balanced model: good fit, correct complexity, and decent predictive ability.
- Model 2 is poor in all indices: AIC, BIC, APC, PRESS, and DW. It also has the highest R2, and the F was very significant (<0.001). p = 4 indicates that it probably has too few variables. DW = 0.825 is very low, indicating strong positive autocorrelation—a serious violation of the assumption. The model is underspecified and poor at predicting.
- Model 3 is fair and superior to Model 2, but inferior to Model 1 with a marginally acceptable Cp and APC. Model 3 is fair and superior to Model 2 and inferior to Model 1. It has a marginally acceptable Cp and APC. Still, PRESS is higher than Model 1. DW = 1.214 shows enough autocorrelation, but less than Model 2. Its R2 was slightly lower, and the Model 1 and the F were very significant (<0.001). It can be considered a “second choice.”
Overall, based on the above comparisons, Model 1, which uses all variables, had the best results. Therefore, all factors, when incorporated, best predict stream bank erosion instead of focusing on just some of them. This also shows that the parameters selected to better understand stream bank erosion impact it.
In addition, the coefficients of the variables (predictors) for only Model 1 (this was chosen as the more suitable model out of the three) were estimated. These are presented in Table 4. Based on the p-values, soil factor, and stream channel slope, stream flow and riparian land-use were significant (0.05). In contrast, meandering or straight channels and existence or not of anthropogenic interventions were not significant.
Table 4.
The coefficients of the predictors (variables) of Model 1. This was selected based on the partial analysis and criteria estimates as the best and include all variables (fluvio-geomorphologic and anthropogenic).
3.4. Categorical Principal Component Analysis (CatPCA)
Seven variables (factors) were used in the CatPCA. Five were on the nominal scale, one on the ordinal, and one on the numerical scale. The variables used were the following: stream flow (nominal 1–2), meandering or straight channel (nominal 1–2), riparian land-use (nominal, 1–6), stream channel slope (nominal, 1–5), existence or not of anthropogenic interventions (nominal, 1–2), erosion categories based on the BEHI (ordinal, 1–7) and soil coefficient (numeric, 1–3). The convergence criterion value of 0.0001 was met after eight iterations.
The two-dimensional solution resulted in eigenvalues of k1 = 1.157 and k2 = 0.843 for the first (PC1) and second principal component (PC2), respectively. The eigenvalue K1 exceeded the acceptance value of 1, while K2 did not [88]. This, combined with the fact that 92.8% of the total variance could be explained by PC1 and PC2, suggested the use of a two-dimensional analysis for this dataset.
Table 5 describes the values of the variable loads for the two main components. The variables “stream flow” and “BEHI erosion level categories” presented very high negative values in relation to PC1. The variables “soil coefficient” and “stream channel slope” had very positive values in relation to PC1. These three variables form a group that can be interpreted as fluvio-geomorphologic conditions that heavily affect bank erosion. “Streamflow”, “meandering or straight channels”, and “existence or not of infrastructure” had high positive values in relation to PC2. The second and third variable can form a group interpreted as anthropogenic impacts. Such actions can accelerate stream bank erosion. Finally, the “riparian land-uses”, “BEHI erosion level categories”, and “stream channel slope” had high negative values in relation to PC2. This is the first time that riparian land-use was an important variable. Riparian land-use also belongs to the anthropogenic impacts groups. Stream channel slope is part of the fluvio-geomorphologic conditions.
Table 5.
The component loadings of the variables used in the categorical principal components’ analysis (CatPCA).
The CatPCA scores on the variable categories were used to create a scatter plot. The coordinates for the variable categories along each dimension are shown in Figure 6. Some variable categories were consistent, so five groups were developed. Specifically, for Group 1, there was consistency between the following categories: soil coefficient factor with a value oof 0.27 (moderate-high) and the stream channel slope with nearly level or with very gentle slopes. Group 2 consisted of the categories: straight reaches with the existence of anthropogenic interventions and a soil coefficient factor of 0.24 (moderate). Group 3 consisted of the two land-uses, discontinuous urban fabric and complex cultivation patterns, and the three erosion level categories, extreme, very high, and high. Group 4 was formed by the categories of permanent stream flow and reaches without erosion. Finally, the last group (5) was formed by the categories without anthropogenic interventions and meandering stream reach.
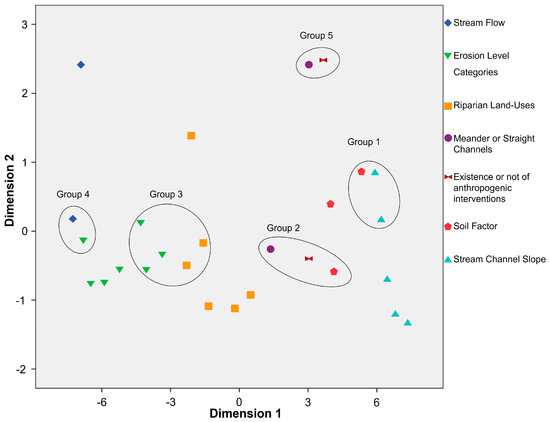
Figure 6.
The joint plot of the variable categories used in the Categorical Principal Components Analysis (CatPCA).
4. Discussion
4.1. The Kallifytos Stream
For the Kallifytos reach, approximately half of its length had stable banks. Still approximately 1/3 of its bank had high, very high, and extreme erosion that should be a concern. Excessive erosion was detected in certain sections of this reach, particularly near the Irish bridge (Figure 7b). This specific type of bridge functions, unintentionally, as a barrier that reduces the speed of the water. This resulted in some banks upstream from the bridge experiencing intense erosion (Figure 7a), while the stream bed stored large amounts of transported sediments. In contrast, downstream as the speed of the water decreases, the existing vegetation was typically not impacted by flood waters. Thus, the riparian vegetation thrived and provided protection to the bank (Figure 7c). Overall, this human infrastructure altered the stream’s dynamic equilibrium leading to erosion and deposition [17]. It must be also noted that downstream from our study reach, a substantial length of the stream runs through an extensive culvert (~729 m). This is the part of the stream that flows underground of Drama City from the east to the west. The adoption of measures to mitigate the high sediment transport because of accelerated bank erosion is vital to maintain the bridge and the culvert clean. Otherwise, the accumulation of deposits in them could lead to serious flooding problems to Drama City. Furthermore, the culvert could also face structural instability issues.
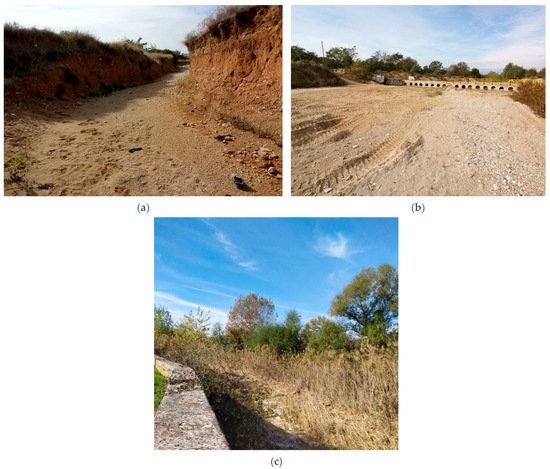
Figure 7.
Sampled plots in the Kallifytos reach: (a) upstream from the Irish Bridge, (b) at the Irish Bridge, and (c) downstream from the Irish bridge.
4.2. The Monastiraki-Ag. Varvara Stream
The Monastiraki-Ag. Varvara reach had more stable banks (approximately 2/3 of its banks) than Kallifytos reach. Still approximately 1/5 of the banks had high, very high, and extreme erosion. The sampled plots with banks devoid of vegetation had excessive erosion. Due to the urban sprawl of the city, this stream had undergone anthropogenic modifications in its form in several sections (culverts, cemented stream banks, etc.). The culvert (~382 m) flows underground the Drama City and occupies the middle section of our sampled reach from the north to the south. Overall, the section upstream from the culvert had banks with high susceptibility to erosion (Figure 8a). This is why there are also several bank reinforcements measures (engineering works) (Figure 8b). This section has intermittent flow and a relatively high stream channel slope. On the contrary, the section downstream from the culvert that flows through the city park (Ag. Varvara) was completely covered by vegetation, with slow-moving water (shallow stream channel slopes) (Figure 8d). The rich and healthy vegetation in combination with the shallow stream channel slope (perennial but slow-moving water), led to limited bank erosion (Figure 8c).
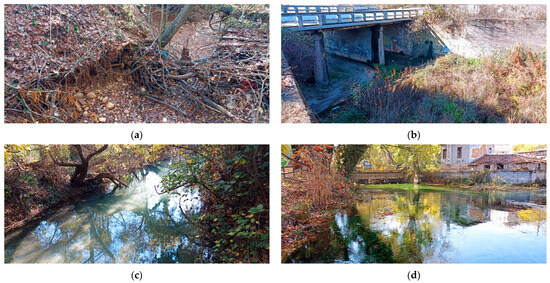
Figure 8.
Sampled plots in the Monastiraki-Ag. Varvara stream reach: (a) high erosion at the upstream sampled plot, (b) upstream from a bridge where bank reinforcements are evident, (c) a plot with minimal erosion and extensive vegetation cover, and (d) plot within the Ag. Varvara Park.
4.3. The Adriani-Doxato Stream
The Adriani-Doxato reach, along almost its entire length (9/10), had high, very high, and extreme stream bank erosion. Most of its riparian areas had limited to no vegetation (Figure 9). In addition, during the field measurements, grazing by goats and sheep was observed near the stream banks, which removed the grass vegetation. Unfortunately, the riparian area and stream banks were further degraded since garbage and construction material were frequently dumped there (Figure 9b,c). The stream banks were also tall and appeared unstable (Figure 9d). It is important to note that there were several failed human infrastructures and large amounts of material deposited on the stream bank and bed (observed during the field measurements). Examples of failed infrastructure included a broken dam embankment, damaged gabions, and a fallen bridge. This showcases that the stream has had high flows and erosion events in the past. These human interventions should be considered ineffective in comparison to the erosion problems that the BEHI presented. Other measures (e.g., NbS) need to be adopted to effectively mitigate the high sediment transport because of accelerated stream bank erosion [89]. Compared to the other selected study reaches, the Adriani-Doxato stream presented the most unstable stream banks.
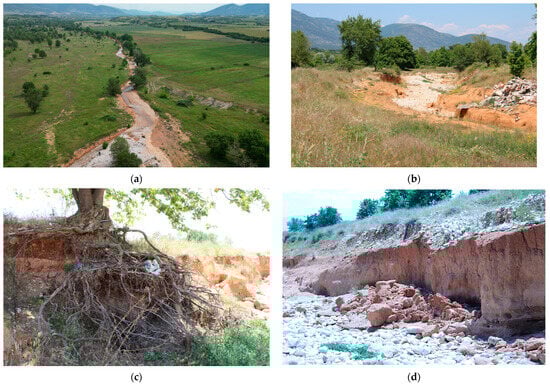
Figure 9.
Sampled plots in the Adriani-Doxato stream reach: (a) limited to no vegetation on the stream banks and high erosion present, (b) construction material dumped in the riparian area, (c) garbage presence and root exposure that indicates high erosion, and (d) extremely high bank erosion.
4.4. The Zoodochos Pigi Stream
In the Zoodochos Pigi reach, there were four categories of erosion (low, moderate, high, and very high). High and very high erosion was observed primarily in the upstream sections of the reach. This is the point where several tributaries meet. Another important aspect, witnessed during field measurements, was the garbage and construction materials in several sections near the banks of the stream (Figure 10). There are several marble processing factories near the stream. However, despite the presence of these factories there were no strong erosion phenomena, as the banks were covered by sparse but tall trees with large crowns. This resulted in the surface areas covered with vegetation and the banks with extensive root systems that helped stabilize them. In addition, the banks of the stream were relatively short.
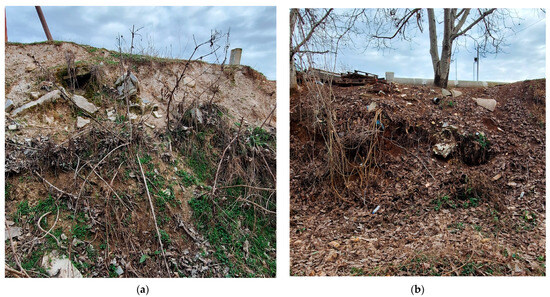
Figure 10.
Sampled plots in the Zoodohos pigi stream reach: (a,b) dumped construction materials in two different plots next to marble processing factories.
4.5. The Nea Amisos Stream
The studied reach of Nea Amisos had mainly low levels of erosion or banks without erosion (approximately on half of its length). It was also observed that, even on the banks, where agricultural crops dominated, there was low or moderate erosion. This was related to the fact that the riparian vegetation was well established near the banks in these sections which protected them from the erosion process (Figure 11). Well-established natural riparian vegetation has proven to mitigate stream bank erosion [8]. The dense root systems stabilize the bank soil, while the vegetation can also protect from high stream flows. In addition, the microclimatic conditions do not allow harsh conditions (subaerial processes, e.g., freeze/thaw and drought) that make the banks more vulnerable to erosion [90]. The low stream channel slope resulted in the reduced speed of the water flow, and thus the erosion potential was low (Figure 11a,b). Overall, only in sections, where the soil was prone to erosion (soil coefficient = 0.27), erosion levels were high.

Figure 11.
Sampled plots in the Nea Amisos stream reach: (a) a plot with a shallow stream slope, sediment deposits, and healthy riparian vegetation and (b) a plot with a shallow stream slope, ponded water, and healthy riparian vegetation.
4.6. The Bank Erosion Hazard Assessment (BEHI) Overall Outcomes
This study showcased that bank erosion is a frequent phenomenon in the streams surrounding and running through Drama City. Worrisome was the fact that only the Monastiraki-Ag. Varvara stream reach had less than 20% of its banks with high, very high, and extreme erosion. Typically, high quality streams have less than 20% of their lengths with high, very high, and extreme bank erosion [31]. Having an assessment tool that can, quickly and for large reaches, identify the banks of high erosion is essential to sustainably mitigate this phenomenon that leads to serious environmental issues [67]. Detailed field measurements are time-consuming and require considerable resources to complete. The utilization of BEHI can help identify sites of erosion that should be targeted for restoration efforts to mitigate stream bank erosion cost-effectively [72]. NbS should be the preferred restoration approach.
4.7. The Linear Regression Outcomes
The focus will be on Model 1, which based on the comparison, provided the best predictions. The partial analysis R2 indicates that the variables included in this model explain approximately 33% of the variance (R2 = 0.33) of stream bank erosion. The overall correlation coefficient (R = 0.574) reflects a moderate relationship. Although this leaves a substantial proportion of variation unexplained, the model is statistically significant (p < 0.001), suggesting that the predictors (variables) collectively capture meaningful processes influencing erosion. Among the predictors, soil factor (p < 0.001) and stream channel slope (p = 0.006) emerged as the strongest contributors. Stream flow (p = 0.036) and riparian land-use (p = 0.014) showed weaker but still significant relationships, while channel type (meandering or straight) and anthropogenic interventions did not reach statistical significance. These results highlight the varying levels of influence exerted by geomorphic and land-use factors in driving stream bank erosion [8,67].
The relatively modest explanatory power of Model 1 underscores the complexity of erosion processes [9,58], which are likely shaped by additional fluvial, geomorphological, ecological, and anthropogenic variables not captured in the current dataset. Nevertheless, the findings provide valuable exploratory insights, particularly given the challenges of integrating qualitative (categorical) and quantitative predictors in this type of analysis.
Importantly, the sample size in this study was limited, which constrains the generalizability of the findings. This limitation should be acknowledged when interpreting the results, as smaller datasets increase the risk of bias and reduce statistical power. Future research with larger and more diverse datasets will be conducted to further validate these relationships and to incorporate additional drivers of stream bank erosion.
Despite these limitations, the study contributes to the growing body of knowledge on erosion dynamics by providing an integrated assessment of geomorphic, hydrological, and land-use factors. By identifying soil characteristics and slope as particularly influential, it offers a basis for prioritizing future monitoring and management strategies.
4.8. The CatPCA Outcomes
Based on the component loading table (Table 5) two major influential groups were formed: the “fluvio-geomorphologic” and “anthropogenic impacts.” The presence or not of water flow (fluvio: intermittent or perennial flow) impacts riparian vegetation but also stream functionality. This was also evident in the CatPCA graph with the consistency found between perennial stream flow and banks without erosion. Riparian areas adjacent to perennial stream flow have denser and hydrophytic vegetation compared to intermittent, particularly in semi-arid regions such as the Mediterranean [16]. Human activities, such as water diversion within the stream channel and the existence of water pumps in the riparian areas for irrigation purposes adjacent to agricultural lands, are troubling. These activities reduce stream baseflow; in the long term, streams shifting from perennial to intermittent or from intermittent to ephemeral flow should be expected [16]. These changes in the stream flows should further degrade stream and riparian functionality which is already being exacerbated due to climate change. The above also showcased the interconnection between the fluvio-geomorphologic and anthropogenic groups.
A common practice in streams and rivers worldwide has been their channelization that negatively impacts the natural aquatic and adjacent riparian ecosystems [91]. The CatPCA graph showed that the anthropogenic infrastructure was present in the channelized reaches and absent in the meandering reaches. Channelizing the streams increases channel slope and stream bank erosion vulnerability, and thus inevitably bank stabilization works need to be constructed. This was the case in these studied stream reaches. Based on our field observations these constructions were not as successful as expected and, in many cases, needed to be repaired. Utilizing NbS is a more sustainable alternative to stabilize the stream banks and channels.
The reaches in the CatPCA graph that were straightened and had anthropogenic infrastructure were also correlated with a specific soil coefficient. These reaches had moderate soil erodibility (based on the soil factor) and, along with the channelization, could be the reason why stabilizing structures needed to be constructed. The soil coefficient (considered important based on the variable loading analysis) expresses the soil erosivity of the banks and should impact erosion susceptibility [92].
Stream channel slope (an important variable based on the CatPCA loading analysis) influences bank stability [93]. As slope increases, so does the stream water velocity and energy that are directly related to soil erosivity. In the CatPCA graph, very gentle slopes were correlated to moderate-high soil erosivity. This was not expected. Still in these reaches, sediment depositions were quite frequent (based on our field observations), and thus, the bank material was not very stable and vulnerable to erosion.
Many studies have found a correlation between stream bank erosion and riparian land-uses [31] (also indicated as important in the variable loading analysis), especially when comparing conservation to agricultural practices. In the CaTPCA graph, reaches with severe, very high, and high erosion were correlated with discontinuous urban fabric and complex cultivation. Agriculture and urban sprawl enhance stream bank erosion while natural, undisturbed riparian vegetation stabilizes banks [22,84]. Riparian vegetation in rivers alters flow conditions, and therefore sedimentary processes, protects banks with their dense root systems and by growing in areas with deposits, enriches the river system with coarse organic material, etc. [94,95,96,97,98]. The stream banks in all five streams that were covered with dense and healthy riparian vegetation (Figure 12) had low levels of erosion or no erosion [31]. The removal of the riparian vegetation in the streambed and especially on stream banks is a common antiflood practice in Greece that should be avoided since it can increase erosion.
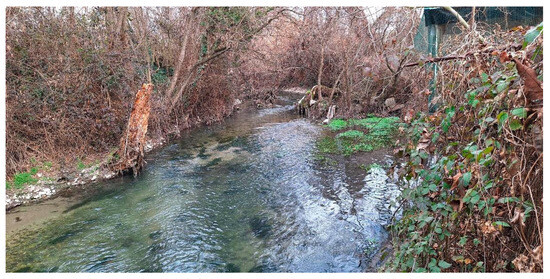
Figure 12.
Riparian areas with dense vegetation had no erosion, as was the case in the Monistiraki-Ag. Varvara stream.
4.9. Practices/Policy Reccommendations
The high percentages of stream banks with high, very high, and sever erosion indicated that efforts need to be taken to mitigate this phenomenon. Policy makers, stakeholders, and the general public should understand the need to conserve and re-establish riparian vegetation on such banks. NbS, such as vegetated riprap or joint planting composed of live stakes, brush layering, and willow bundles, should also be adopted to mitigate extreme stream bank erosion. It is also important to mention that, in the riparian areas where the existence of water was permanent and anthropogenic interventions limited, the riparian vegetation was very dense.
During the field measurements, the existence of garbage was quite frequently observed. The presence of garbage and litter is indicative of degraded riparian areas (e.g., less healthy vegetation) that typically have higher susceptibility to erosion [97]. In addition, household waste, construction material, and residues from logging operations were present. Actions and measures need to be taken to minimize these illegal phenomena. A potential NbS to reduce litter in the stream water are the placement of litter traps [98]. Otherwise, the ecosystems services offered by the riparian and riverine areas including bank protection will continue to degrade.
With global biodiversity rapidly declining and extinction rates higher than ever [99], protected and healthy riverine and riparian ecosystems should be prioritized since they can become biodiversity sanctuaries. This is related to the many ecosystem services and unique diverse habitats they offer [100]. Mitigation of accelerated erosion is essential for their conservation and restoration that should help meet several of the UN Sustainable Development Goals. Most countries’ conservation efforts rally on market-based instruments like biodiversity offsets that have proven to be ineffective. Shmelev (2025) [101] suggests stronger, evidence-based approaches are needed for genuine ecosystem restoration and sustainable conservation strategies. Studies such as this one provide evidence-based data and insights that land and water managers can utilize to sustainably mitigate accelerated erosion in riverine and riparian ecosystems.
5. Conclusions
The five streams had significant differences in bank erosion despite being relatively close to each other. This highlights that stream bank erosion is highly influenced by different fluvio-geomorphologic but also anthropogenic factors. A high percentage of the banks in all five stream reaches, unfortunately had high, very high, and extreme erosion that exceeded those of natural undisturbed streams. Measures need to be taken to try to substantially reduce this excessive erosion. The importance of riparian vegetation was highly evident. Riparian banks that were bare were clearly more susceptible to erosion than vegetated ones. Therefore, maintaining or re-establishing native riparian vegetation can be an important conservation practice. Other NbS might also be required to be implemented on banks with very high and extreme erosion to provide long-term sustainable and aesthetically pleasing mitigation measures. This was evident because in many cases the current human infrastructure of the streams did not produce the desired results. In many cases, these engineering works even increased the erosion problems. As a result, local, regional, and national responsible authorities for watershed management should incorporate NbS (e.g., vegetated riprap, joint planting composed of live stakes, brush layering, willow bundles, litter traps, etc.) in their plans. Stream bank erosion mitigation measures should become more environmentally friendly in Greece unless it is absolutely needed to implement classical engineering works.
Author Contributions
Conceptualization, G.N.Z., P.K. and V.I.; methodology, G.P.; software, G.P.; validation, G.P., G.G. and P.K.; formal analysis, G.P.; data curation, G.P.; writing—original draft preparation, G.P.; writing—review and editing, G.G., P.K., V.I. and G.N.Z.; visualization, G.P.; supervision, P.K., V.I. and G.N.Z.; project administration, G.N.Z. All authors have read and agreed to the published version of the manuscript.
Funding
This research was funded by the Joint Operational Black Sea Programme 2014–2020 and the Project BSB 963 “Protect-Streams-4-Sea”, with the financial assistance of the European Union. The content of this publication is the sole responsibility of the authors and, in no case, should it be considered to reflect the views of the European Union.
Data Availability Statement
Data are unavailable due to privacy restrictions. Reports of the funded project can be found in http://websites3.teiemt.gr/p4sea (accessed on 2 August 2025).
Conflicts of Interest
The authors declare no conflicts of interest.
Abbreviations
The following abbreviations are used in this manuscript:
| BEHI | Bank Erosion Hazard Index |
| CatPCA | Categorical Principal Component Analysis (CatPCA) |
| GDP | Gross Domestic Product |
| GIS | Geographic Information System |
| NbS | Nature-bases Solutions |
| QBR | Qualitat del Bosc de Ribera |
| SVAP | Stream Visual Assessment Protocol |
References
- Pimentel, D.; Burgess, M. Soil erosion threatens food production. Agriculture 2013, 3, 443–463. [Google Scholar] [CrossRef]
- García-Ruiz, J.M.; Beguería, S.; Nadal-Romero, E.; González-Hidalgo, J.C.; Lana-Renault, N.; Sanjuán, Y. A meta-analysis of soil erosion rates across the world. J. Soil Water Conserv. 2015, 239, 160–173. [Google Scholar] [CrossRef]
- Barberena, I.; Luquin, E.; Campo-Bescós, M.A.; Eslava, J.; Giménez, R.; Casalí, J. Challenges and Progresses in the detailed estimation of sediment export in agricultural watersheds in Navarra (Spain) after two decades of experience. Environ. Res. 2023, 234, 116581. [Google Scholar] [CrossRef]
- Sartori, M.; Philippidis, G.; Ferrari, E.; Borrelli, P.; Lugato, E.; Montanarella, L.; Panagos, P. A linkage between the bio-physical and the economic: Assessing the global market impacts of soil erosion. Land Use Policy 2019, 86, 299–312. [Google Scholar] [CrossRef]
- Poesen, J. Soil erosion in the Anthropocene: Research needs. Earth Surf. Process. Landf. 2018, 84, 64–84. [Google Scholar] [CrossRef]
- Li, K.; Yang, J.; Wang, J.; Wang, Z.; Zeng, Y.; Borrelli, P.; Hubacek, K.; Hu, Y.; Xu, B.; Fang, N.; et al. Human-altered soil loss dominates nearly half of water erosion in China but surges in agriculture-intensive areas. One Earth 2024, 7, 2008–2018. [Google Scholar] [CrossRef]
- Ma, Z.; Xia, C.; Cao, S. Cost–Benefit Analysis of China’s Natural Forest Conservation Program. J. Nat. Conserv. 2020, 55, 125818. [Google Scholar] [CrossRef]
- Zaimes, G.N.; Tamparopoulos, A.E.; Tufekcioglu, M.; Schultz, R.C. Understanding stream bank erosion and deposition in Iowa, USA: A seven-year study along streams in different regions with different riparian land uses. J. Environ. Manag. 2021, 287, 112352. [Google Scholar] [CrossRef]
- Margenot, A.J.; Zhou, S.; McDowell, R.; Hebert, T.; Fox, G.; Schilling, K.; Richmond, S.; John, L.; Kovar, J.L.; Wickramarathne, N.; et al. Streambank erosion and phosphorus loading to surface waters: Knowns, unknowns, and implications for nutrient loss reduction research and policy. J. Environ. Qual. 2023, 52, 1063–1079. [Google Scholar] [CrossRef] [PubMed]
- Thorne, C.R. Processes and Mechanics of Bank Erosion. In Gravel-Bed Rivers: Fluvial Processes, Engineering and Management; Hey, R.D., Bathurst, J.C., Thorne, C.R., Eds.; John Wiley & Sons: Chichester, UK, 1982; pp. 227–271. [Google Scholar]
- Lawler, D.M.; Thorne, C.R.; Hooke, J.M. Bank Erosion and Instability. In Applied Fluvial Geomorphology for River Engineering and Management; Thorne, C., Hey, R., Newson, M., Eds.; Wiley: Chichester, UK, 1997; pp. 137–172. [Google Scholar]
- Lawler, D.M. Process Dominance in Bank Erosion Systems. In Lowland Floodplain Rivers: Geomorphological Perspectives; Carling, P., Petts, G., Eds.; John Wiley & Sons: Chichester, UK, 1992; Chapter 5. [Google Scholar]
- Florsheim, J.L.; Mount, J.F.; Chin, A. Bank erosion as a desirable attribute of rivers. BioScience 2008, 58, 519–529. [Google Scholar] [CrossRef]
- Naiman, R.J.; Décamps, H.; Pollock, M. The role of riparian corridors in maintaining regional biodiversity. Ecol. Appl. 1993, 3, 209–212. [Google Scholar] [CrossRef]
- Engel, F.L.; Rhoads, B.L. Interaction among mean flow, turbulence, bed morphology, bank failures and channel planform in an evolving compound meander loop. Geomorphology 2012, 163, 70–83. [Google Scholar] [CrossRef]
- Zaimes, G.N. Mediterranean riparian areas—Climate change implications and recommendations. J. Environ. Biol. 2020, 41, 957–965. [Google Scholar] [CrossRef]
- Zhou, Y.Y.; Tang, Q.H. Meandering characteristics of the Yimin River in Hulun Buir Grassland, Inner Mongolia, China. Remote Sens. 2022, 14, 2696. [Google Scholar] [CrossRef]
- Davis, S.; Grainger, M.; Pfeifer, M.; Pattison, Z.; Stephens, P.; Sanderson, R. Restoring riparian habitats for benefits to biodiversity and human livelihoods: A systematic map protocol for riparian restoration approaches in the tropics. Environ. Evid. 2025, 14, 2. [Google Scholar] [CrossRef]
- Lane, S.N.; Tayefi, V.; Reid, S.C.; Yu, D.; Hardy, R.J. Interactions between sediment delivery, channel change, climate change and flood risk in a temperate upland environment. Earth Surf. Process. Landf. 2006, 32, 429–446. [Google Scholar] [CrossRef]
- Hawley, R.J.; MacMannis, K.R.; Wooten, M.S.; Fet, E.V.; Korth, N.L. Suburban stream erosion rates in northern Kentucky exceed reference channels by an order of magnitude and follow predictable trajectories of channel evolution. Geomorphology 2020, 352, 106998. [Google Scholar] [CrossRef]
- Li, Y.; Tang, C.; Huang, Z.; Hussain, Z.K.S.; Are, T.P.; Abegunrin, T.P.; Qin, Z.; Guo, H. Increase in farm size significantly accelerated stream channel erosion and associated nutrient losses from an intensive agricultural watershed. Agric. Ecosyst. Environ. 2020, 295, 106900. [Google Scholar] [CrossRef]
- Iakovoglou, V.; Zaimes, G.N.; Gounaridis, D. Riparian areas in urban settings: Two case studies from Greece. Int. J. Innov. Sustain. Dev. 2013, 7, 271–288. [Google Scholar] [CrossRef]
- Surian, N.; Rinaldi, M. Morphological response to river engineering and management in alluvial channels in Italy. Geomorphology 2003, 50, 307–326. [Google Scholar] [CrossRef]
- Fox, G.A.; Purvis, R.A.; Penn, C.J. Streambanks: A net source of sediment and phosphorus to streams and rivers. J. Environ. Manag. 2016, 181, 602–614. [Google Scholar] [CrossRef]
- Li, Z.; Fang, H. Impacts of climate change on water erosion: A review. Earth-Sci. Rev. 2016, 163, 94–117. [Google Scholar] [CrossRef]
- Yin, C.; Bai, C.; Zhu, Y.; Shao, M.; Han, X.; Qiao, J. Future soil erosion risk in China: Differences in Erosion driven by general and extreme precipitation under climate change. Earth’s Future 2025, 13, e2024EF005390. [Google Scholar] [CrossRef]
- Borrelli, P.; Robinson, D.A.; Panagos, P.; Lugato, E.; Yang, J.E.; Alewell, C.; Wuepper, D.; Montanarella, L.; Ballabio, C. Land use and climate change impacts on global soil erosion by water (2015–2070). Proc. Natl. Acad. Sci. USA 2020, 117, 21994–22001. [Google Scholar] [CrossRef]
- Simon, A.; Klimetz, L. Relative magnitudes and sources of sediment in benchmark watersheds of the Conservation Effects Assessment Project. J. Soil Water Conserv. 2008, 63, 504–522. [Google Scholar] [CrossRef]
- Wilson, C.G.; Kuhnle, R.A.; Bosch, D.D.; Steiner, J.L.; Starks, P.J.; Tomer, M.D.; Wilson, G.V. Quantifying relative contributions from sediment sources in Conservation Effects Assessment Project watersheds. J. Soil Water Conserv. 2008, 63, 523–532. [Google Scholar] [CrossRef]
- Belmont, P.; Gran, K.B.; Schottler, S.P.; Wilcock, P.R.; Day, S.S.; Jennings, C.; Lauer, J.W.; Viparelli, E.; Willenbring, J.K.; Engstrom, D.R.; et al. Large shift in source of fine sediment in the upper Mississippi River. Environ. Sci. Technol. 2011, 45, 8804–8810. [Google Scholar] [CrossRef]
- Zaimes, G.N.; Tufekcioglu, M.; Schultz, R.C. Riparian land-use impacts on stream bank and gully erosion in agricultural watersheds: What we have learned. Water 2019, 11, 1343. [Google Scholar] [CrossRef]
- Kronvang, B.; Andersen, H.E.; Larsen, S.E.; Audet, J. Importance of bank erosion for sediment input, storage and export at the catchment scale. J. Soils Sediments 2013, 13, 230–241. [Google Scholar] [CrossRef]
- Caitcheon, G.G.; Olley, J.M.; Pantus, F.; Hancock, G.; Leslie, C. The dominant erosion processes supplying fine sediment to three major rivers in tropical Australia, the Daly (NT), Mitchell (Qld) and Flinders (Qld) Rivers. Geomorphology 2012, 151–152, 188–195. [Google Scholar] [CrossRef]
- Olley, J.; Brooks, A.; Spencer, J.; Pietsch, T.; Borombovits, D. Subsoil erosion dominates the supply of fine sediment to rivers draining into Princess Charlotte Bay, Australia. J. Environ. Radioact. 2013, 124, 121–129. [Google Scholar] [CrossRef]
- Moody, J.A. The effects of discharge and bank orientation on the annual riverbank erosion along Powder River in Montana, USA. Geomorphology 2022, 403, 108134. [Google Scholar] [CrossRef]
- Liu, L.; Zhu, L.; Chen, D.; Ran, Q.; Tang, H.; Yan, J.; Liu, L. Assessing the modulation of outer bank erosion by slump blocks: A case study from Marqu Meadow, China. Geomorphology 2024, 458, 10926. [Google Scholar] [CrossRef]
- Pinter, N.; Heine, R.A. Hydrodynamic and morphodynamic response to river engineering documented by fixed-discharge analysis, Lower Missouri River, USA. J. Hydrol. 2005, 302, 70–91. [Google Scholar] [CrossRef]
- Pimentel, D. Soil erosion: A global threat to sustainable agriculture and environmental threat. Soil Water Conserv. 2012, 67, 21–25. [Google Scholar]
- Pierce, F.J.; Lal, R. Monitoring the impact of soil erosion on crop productivity. In Soil Erosion Research Methods; Soil Water Conservation Society: Ankeny, IA, USA, 2017; pp. 235–263. [Google Scholar]
- Li, X.; Cooper, A.J.; Plater, A.J. Quantifying erosion hazards and economic damage to critical infrastructure in river catchments: Impact of a warming climate. Clim. Risk Manag. 2021, 32, 100287. [Google Scholar] [CrossRef]
- Douglas, M.M.; Dunne, K.B.J.; Lamb, M.P. Sediment entrainment and slump blocks limit permafrost riverbank erosion. Geophys. Res. Lett. 2023, 50, L10274. [Google Scholar] [CrossRef]
- Hoang, L.; Fenner, R.A. System interactions of stormwater management using sustainable urban drainage systems and green infrastructure. Urban Water J. 2016, 13, 739–758. [Google Scholar] [CrossRef]
- Fluixá-Sanmartín, J.; Altarejos-García, L.; Morales-Torres, A.; Escuder-Bueno, I. Climate change impacts on dam safety. Nat. Hazards Earth Syst. Sci. 2018, 18, 2471–2488. [Google Scholar] [CrossRef]
- Samadi, A.; Amiri-Tokaldany, E.; Davoudi, M.H.; Darby, S.E. Experimental and numerical investigation of the stability of overhanging riverbanks. Geomorphology 2013, 184, 1–19. [Google Scholar] [CrossRef]
- Midgley, T.L.; Fox, G.A.; Heeren, D.M. Evaluation of the bank stability and toe erosion model (BSTEM) for predicting lateral retreat on composite streambanks. Geomorphology 2012, 145–146, 107–114. [Google Scholar] [CrossRef]
- Kotak, B.G.; Prepas, E.E.; Hrudey, S.E. Blue green algal toxins in drinking water supplies: Research in Alberta. Lake Line 1994, 14, 37–40. [Google Scholar]
- Martin, A.; Cooke, G.D. Health risks in eutrophic water supplies. Lake Line 1994, 14, 24–26. [Google Scholar]
- Merz, B.; Kreibich, H.; Schwarze, R.; Thieken, A. Assessment of economic flood damage. Nat. Hazards Earth Syst. Sci. 2010, 10, 1697. [Google Scholar] [CrossRef]
- Welter, G.; Bieber, S.; Bonnaffon, H.; Deguida, N.; Socher, M. Cross-sector emergency planning for water providers and healthcare facilities. J. Am. Water Work. Assoc. 2010, 102, 68–78. [Google Scholar] [CrossRef]
- Ross, D.S.; Wemple, B.C.; Willson, L.J.; Balling, C.M.; Underwood, K.L.; Hamshaw, S.D. Impact of an extreme storm event on river corridor bank erosion and phosphorus mobilization in a mountainous watershed in the northeastern United States. JGR Biogeosci. 2019, 124, 18–32. [Google Scholar] [CrossRef]
- Bashagaluke, J.B.; Logah, V.; Opoku, A.; Sarkodie-Addo, J.; Quansah, C. Soil nutrient loss through erosion: Impact of different cropping systems and soil amendments in Ghana. PLoS ONE 2018, 13, e0208250. [Google Scholar] [CrossRef]
- Grenon, G.; Singh, B.; Sena, A.D.; Madramootoo, C.A.; Sperber, C.; Goyal, M.K.; Zhang, T. Phosphorus fate, transport and management on subsurface drained agricultural organic soils: A review. Environ. Res. Lett. 2021, 16, 013004. [Google Scholar] [CrossRef]
- Lin, S.S.; Shen, S.L.; Zhou, A.; Lyu, H.M. Assessment and management of lake eutrophication: A case study in Lake Erhai, China. Sci. Total Environ. 2020, 751, 2021. [Google Scholar] [CrossRef]
- Lawler, D.M. The measurement of river bank erosion and lateral channel change: A review. Earth Surf. Process. Landf. 1993, 18, 777–821. [Google Scholar] [CrossRef]
- Lawler, D.M. The importance of high-resolution monitoring in erosion and deposition dynamics studies: Examples from estuarine and fluvial systems. Geomorphology 2005, 64, 1–23. [Google Scholar] [CrossRef]
- Myers, D.T.; Rediske, R.R.; McNair, J.N. Measuring streambank erosion: A comparison of erosion pins, total station, and terrestrial laser scanner. Water 2019, 11, 1846. [Google Scholar] [CrossRef]
- Zaimes, G.N.; Emmanouloudis, D.; Iakovoglou, V. Estimating soil erosion in Natura 2000 areas located on three semi-arid Mediterranean islands. J. Environ. Biol. 2012, 33, 277–282. [Google Scholar]
- Zaimes, G.N.; Ioannou, K.; Iakovoglou, V.; Kosmadakis, I.; Koutalakis, P.; Ranis, G.; Emmanouloudis, D.; Schultz, R.C. Improving soil erosion prevention in Greece with new tools. J. Eng. Sci. Technol. Rev. 2016, 9, 66–71. [Google Scholar] [CrossRef]
- Resop, J.P.; Hession, W.C. Terrestrial Laser Scanning for Monitoring Streambank Retreat: Comparison with Traditional Surveying Techniques. J. Hydraul. Eng. 2010, 136, 794–798. [Google Scholar] [CrossRef]
- Resop, J.P.; Hendrix, C.; Wynn-Thompson, T.; Hession, W.C. Channel Morphology Change after Restoration: Drone Laser Scanning versus Traditional Surveying Techniques. Hydrology 2024, 11, 54. [Google Scholar] [CrossRef]
- King, C.; Baghdadi, N.; Lecomte, V.; Cerdan, O. The application of remote-sensing data to monitoring and modelling of soil erosion. Catena 2005, 62, 79–93. [Google Scholar] [CrossRef]
- Zaimes, G.N.; Gounaridis, D.; Fotakis, D. Assessing riparian land-uses/vegetation cover along the Nestos River in Greece. Fresenius Environ. Bull. 2011, 20, 3217–3225. [Google Scholar]
- Wallace, L.; Lucieer, A.; Watson, C.; Turner, D. Development of a UAV-LiDAR system with application to forest inventory. Remote Sens. 2012, 4, 1519–1543. [Google Scholar] [CrossRef]
- Ganasri, B.P.; Ramesh, H. Assessment of soil erosion by RUSLE model using remote sensing and GIS-A case study of Nethravathi Basin. Geosci. Front. 2016, 7, 953–961. [Google Scholar] [CrossRef]
- Gkiatas, G.T.; Koutalakis, P.D.; Kasapidis, I.K.; Iakovoglou, V.; Zaimes, G.N. Monitoring and quantifying the fluvio-geomorphological changes in a torrent channel using images from unmanned aerial vehicles. Hydrology 2022, 9, 184. [Google Scholar] [CrossRef]
- Yavuz, M.; Tufekcioglu, M. Assessment of flood-induced geomorphic changes in Sidere Creek of the mountainous basin using small UAV-based imagery. Sustainability 2023, 15, 11793. [Google Scholar] [CrossRef]
- Koutalakis, P.; Gkiatas, G.; Xinogalos, M.; Iakovoglou, V.; Kasapidis, I.; Pagonis, G.; Savvopoulou, A.; Krikopoulos, K.; Klepousniotis, T.; Zaimes, G.N. Estimating stream bank and bed erosion and deposition with innovative and traditional methods. Land 2024, 13, 232. [Google Scholar] [CrossRef]
- Bjorkland, R.; Pringle, C.M.; Newton, B. A stream visual assessment protocol (SVAP) for riparian landowners. Environ. Monit. Assess. 2001, 68, 99–125. [Google Scholar] [CrossRef]
- Rosgen, D.L. A practical method of computing streambank erosion rate. In Proceedings of the 7th Federal Inter-Agency Sedimentation Conference, Reno, NV, USA, 25–29 March 2001; U.S. Geological Survey, U.S. Army Corps of Engineers, U.S.D.A. Forest Service: Reston, VA, USA, 2001; Volume 2, pp. 1–17. [Google Scholar]
- Munné, A.; Prat, N.; Solá, C.; Bonada, N.; Rieradevall, M. A simple field method for assessing the ecological quality of riparian habitat in rivers and streams: QBR index. Aquat. Conserv. Mar. Freshw. Ecosyst. 2003, 13, 147–163. [Google Scholar] [CrossRef]
- Maguire, D.J. An overview and definition of GIS. In Geographical Information Systems: Principles and Applications; Wiley: Hoboken, NJ, USA, 1991; Volume 1, pp. 9–20. [Google Scholar]
- Savopoulou, A.; Giatas, G.; Pagonis, G.; Iakovoglou, V.; Zaimes, G.N. Visual protocols and GIS as preliminary investigative tools to locate potential ecoengineering in streams and riparian areas. Procedia Environ. Sci. Eng. 2017, 4, 227–234. [Google Scholar]
- Gkiatas, G.; Kasapidis, I.; Koutalakis, P.; Iakovoglou, V.; Savvopoulou, A.; Germantzidis, I.; Zaimes, G.N. Enhancing urban and sub-urban riparian areas through ecosystem services and ecotourism activities. Water Supply 2021, 21, 2974–2988. [Google Scholar] [CrossRef]
- Bariamis, G.; Paschos, G.; Baltas, E. Land Accounts in the River Basin Districts of Greece. Environ. Process. 2018, 5, S213–S237. [Google Scholar] [CrossRef]
- Copernicus Data Spece Ecosystem. Available online: https://dataspace.copernicus.eu/ (accessed on 15 April 2025).
- Vrieling, A.; de Jong, S.M.; Sterk, G.; Rodrigues, S.C. Timing of erosion and satellite data: A multi-resolution approach to soil erosion risk mapping. Int. J. Appl. Earth Obs. Geoinf. 2008, 10, 267–281. [Google Scholar] [CrossRef]
- Tullos, D.D.; Penrose, D.L.; Jennings, G.D.; Cope, W.G. Analysis of functional traits in reconfigured channels: Implications for the bioassessment and disturbance of river restoration. J. N. Am. Benthol. Soc. 2009, 28, 80–92. [Google Scholar] [CrossRef]
- Simpson, A.; Turner, I.; Brantley, E.; Helms, B. Bank erosion hazard index as an indicator of near-bank aquatic habitat and community structure in a southeastern Piedmont stream. Ecol. Indic. 2014, 43, 19–28. [Google Scholar] [CrossRef]
- Kim, T.T.; Ngoc, P.; Nga, T.N.Q.; Nguyet, N.T.T.; Truong, H.N.; Diem, P.T.M.; Phung, N.K.; Bay, N.T. Modifying BEHI (Bank Erosion Hazard Index) to map and assess the levels of potential riverbank erosion of highly human impacted rivers: A case study for Vietnamese Mekong river system. Environ. Earth Sci. 2023, 82, 554. [Google Scholar] [CrossRef]
- Nosrati, K.; Rostami, M.; Azarpar Kivi, M. Estimation of Taleghan river bank erosion risk using BEHI model. J. Nat. Environ. Hazards 2021, 9, 129–144. [Google Scholar]
- Hasanuzzaman, M.; Bera, B.; Islam, A.; Shit, P.K. Estimation and prediction of riverbank erosion and accretion rate using DSAS, BEHI, and REBVI models: Evidence from the lower Ganga River in India. Nat. Hazards 2023, 118, 1163–1190. [Google Scholar] [CrossRef]
- Newton, S.E.; Drenten, D.M. Modifying the bank erosion hazard index (BEHI) protocol for rapid assessment of streambank erosion in northeastern Ohio. JoVE 2015, 13, e52330. [Google Scholar]
- Tsioras, P.A. Status and job satisfaction of Greek forest workers. Small-Scale For. 2012, 11, 1–14. [Google Scholar] [CrossRef]
- Zaimes, G.N.; Kiosses, C. Experts views on water scarcity and flooding from six countries around the Black Sea region. Desal. Water Treat. 2021, 216, 118–128. [Google Scholar] [CrossRef]
- Singh, S.; Kansal, M.L. A comparative study of morphometric, hydrologic, and semi-empirical methods for the prioritization of sub-watersheds against flash flood-induced landslides in a part of the Indian Himalayan Region. Environ. Sci. Pollut. Res. Int. 2023, 31, 53796–53822. [Google Scholar] [CrossRef]
- Płaczkowska, E.; Kijowska-Strugała, M.; Prokop, P.; Wiejaczka, Ł.; Lekah, J. Channel head morphometry in the precipitation gradient from semi-arid to arid climates. CATENA 2025, 254, 109007. [Google Scholar] [CrossRef]
- Young, F.W.; Takane, Y.; De Leeuw, J. The principal components of mixed measurement level multivariate data: An alternating least squares method with optimal scaling features. Psychometrika 1978, 43, 279–281. [Google Scholar] [CrossRef]
- Nikiforov, V. Bounds on graph eigenvalues II. Linear Algebra Appl. 2007, 427, 183–189. [Google Scholar] [CrossRef]
- Stavropoulos, S.; Zaimes, G.N.; Filippidis, E.; Diaconu, D.C.; Emmanouloudis, D. Mitigating flash floods with the use of new technologies: A Μulti-criteria decision analysis to map flood susceptibility for Zakynthos Island, Greece. J. Urban Reg. Anal. 2020, 12, 233–248. [Google Scholar] [CrossRef]
- Zaimes, G.N.; Gounaridis, D.; Iakovoglou, V.; Emmanouloudis, D. Riparian area studies in Greece: A literature review. Fresenius Environ. Bull. 2011, 20, 1470–1477. [Google Scholar]
- Heritage, G.; Entwistle, N. Impacts of river engineering on river channel behaviour: Implications for managing downstream flood risk. Water 2020, 12, 1355. [Google Scholar] [CrossRef]
- Masoodi, A.; Majdzadeh Tabatabai, M.R.; Noorzad, A.; Samadi, A. Effects of soil physico-chemical properties on stream bank erosion induced by seepage in northeastern Iran. Hydrol. Sci. J. 2017, 62, 2597–2613. [Google Scholar] [CrossRef]
- Church, M. Channel stability: Morphodynamics and the morphology of rivers. In Rivers–Physical, Fluvial and Environmental Processes; Rowiński, P., Radecki-Pawlik, A., Eds.; Springer: Cham, Switzerland, 2015; pp. 281–321. [Google Scholar]
- Corenblit, D.; Tabacchi, E.; Steiger, J.; Gurnell, A.M. Reciprocal interactions and adjustments between fluvial landforms and vegetation dynamics in river corridors: A review of complementary approaches. Earth Sci. Rev. 2007, 84, 56–86. [Google Scholar] [CrossRef]
- Gurnell, A. Plants as river system engineers. Earth Surf. Process. Landf. 2014, 39, 4–25. [Google Scholar] [CrossRef]
- Cesarini, G.; Scalici, M. Riparian vegetation as a trap for plastic litter. Environ. Pollut. 2022, 292, 118410. [Google Scholar] [CrossRef]
- Koutalakis, P.; Gkiatas, G.; Iakovoglou, V.; Zaimes, G.N. New technologies to assess and map an urban riparian area in Drama, Greece, and determine opportunity sites for litter traps. Sustainability 2023, 15, 15620. [Google Scholar] [CrossRef]
- Schismenos, S.; Zaimes, G.N.; Iakovoglou, V.; Emmanouloudis, D. Environmental sustainability and ecotourism of riparian and deltaic ecosystems: Opportunities for rural Eastern Macedonia and Thrace, Greece. Int. J. Environ. Stud. 2019, 76, 675–684. [Google Scholar] [CrossRef]
- IPBES. Global Assessment Report on Biodiversity and Ecosystem Services of the Intergovernmental Science-Policy Platform on Biodiversity and Ecosystem Services; Brondizio, E.S., Settele, J., Díaz, S., Ngo, H.T., Eds.; IPBES Secretariat: Bonn, Germany, 2019; p. 1148. [CrossRef]
- Shmelev, S.E.; Agbleze, L.; Spangenberg, J.H. Multidimensional Ecosystem Mapping: Towards a More Comprehensive Spatial Assessment of Nature’s Contributions to People in France. Sustainability 2023, 15, 7557. [Google Scholar] [CrossRef]
- Shmelev, S.E. Biodiversity Offset Schemes for Indonesia: Pro et Contra. Sustainability 2025, 17, 6283. [Google Scholar] [CrossRef]


Disclaimer/Publisher’s Note: The statements, opinions and data contained in all publications are solely those of the individual author(s) and contributor(s) and not of MDPI and/or the editor(s). MDPI and/or the editor(s) disclaim responsibility for any injury to people or property resulting from any ideas, methods, instructions or products referred to in the content. |
© 2025 by the authors. Licensee MDPI, Basel, Switzerland. This article is an open access article distributed under the terms and conditions of the Creative Commons Attribution (CC BY) license (https://creativecommons.org/licenses/by/4.0/).