Article

Coupling Coordination Relationship and Evolution Prediction of Water-Energy-Food-Wetland Systems: A Case Study of Jiangxi Province

1
State Key Laboratory of Lake and Watershed Science for Water Security, Nanjing Institute of Geography and Limnology, Chinese Academy of Sciences, Nanjing 211135, China
2
University of Chinese Academy of Sciences, Beijing 100049, China
3
Poyang Lake Wetland Research Station, Nanjing Institute of Geography and Limnology, Chinese Academy of Sciences, Jiujiang 332899, China
4
Jiangxi Research Academy of Ecological Civilization (Office of the Mountain-River-Lake Development Committee of Jiangxi Province), Nanchang 330036, China
5
College of Ecological and Environmental Engineering, Qinghai University, Xining 810016, China
*
Author to whom correspondence should be addressed.
Land 2025, 14(10), 1960; https://doi.org/10.3390/land14101960
Submission received: 19 August 2025 / Revised: 18 September 2025 / Accepted: 19 September 2025 / Published: 28 September 2025
(This article belongs to the Special Issue Carbon Cycling and Carbon Sequestration in Wetlands)

Abstract

Against the backdrop of global population growth and intensified resource competition, the sustainable development of the water-energy-food system (WEF) is facing challenges. Wetlands, as key ecological hubs, play a crucial role in regulating water cycles, energy metabolism, and food production, thus serving as a breakthrough point for resolving the bottleneck of resource synergy. Incorporating wetlands into the WEF framework helps us comprehensively understand and optimize the interrelationships among water, energy, and food. This paper proposes an indicator system based on WEFW to study the coupling of water-energy-food-wetland systems and analyzes the evolution of the comprehensive development index of WEFW and its coupling relationship in Jiangxi Province from 2001 to 2022. It uses the grey correlation model to explore the sustainable development capacity of wetland resources, water resources, energy resources, and food resources in Jiangxi Province, and employs a geographical detector model to quantify the contribution of wetlands to WEFW. The research results show that (1) the comprehensive evaluation of WEFW systems in various cities in Jiangxi Province has generally improved, but there is imbalance in regional development. Cities such as Nanchang and Jiujiang have performed well, while cities like Jingdezhen and Xinyu need to enhance resource integration and sustainable development. (2) The coupling coordination degree (CCD) has experienced a process of “stability-fluctuation-recovery”, with a significant increase after 2014, and the spatial differentiation characteristics are obvious. (3) Wetlands play a dominant role in the spatial differentiation of CCD, and their interaction with water, energy, and food resources significantly enhance the explanatory power of their impact on CCD. (4) The grey model indicates that the CCDs of WEFW systems in most cities of Jiangxi Province have a projected annual growth rate of 1.8% (2022–2032), reaching 0.71–0.73 in leading cities. These results emphasize the importance of wetland protection and sustainable resource management in promoting regional coordinated development. The research and prediction of the coupling coordination relationship of water-energy-food-wetland systems can provide a scientific basis for the sustainable development of Jiangxi Province and also offer important scientific references for other regions to achieve a balance between ecological protection and resource utilization.

1. Introduction

Water resources, energy resources, and food resources are the fundamental material basis for human production and life and also the key driving forces for the development of society and ecosystems [1]. There is a fragile balance among these three resources, and the balance of the three is highly vulnerable to the impact of a single resource being disturbed. At the same time, the shrinkage of wetlands, climate change, population growth, economic development, and urbanization are significantly exacerbating the risks and pressures on natural resources. Notably, socio-economic factors such as rural–urban migration and regional industrial structure adjustment further reshape the WEF system’s balance—for instance, labor shortage reduces food production efficiency, while industrial expansion increases energy demand and water competition, which have not been fully addressed in existing regional WEF studies [2]. Since the “Water, Energy and Food Security Network” Bonn Conference in 2011, resource nexus management has become a core topic in sustainable development research [3]. The WEF nexus relationship research emphasizes seeking the optimal utilization of resources and sustainable development paths by deeply understanding the complex interactions of these three basic resources, while also addressing the risks and conflicts caused by environmental changes and human activities [4], providing an important scientific basis for formulating effective resource management policies.
Currently, cross-disciplinary collaborative research on the water–energy–food system is receiving significant attention. Scholars have proposed the WEF–nature framework [1], a cross-regional industrial structure optimization model considering water, energy, food, land, and carbon constraints [5], and a cultivated land sustainable utilization evaluation system based on the water–earth–energy–food relationship [6], emphasizing the need to break through the limitations of departmental management and integrate ecosystem services to enhance resource security [7]. For instance, Lin Zhang [8] used the entropy weight method and comprehensive evaluation model to conduct a comprehensive assessment of the E-WEF system in the Yellow River Basin. Wei Qi Yuan [9] used the PLUS and InVEST models to assess the spatio-temporal changes in the water–energy–food relationship, providing valuable insights. Hao Lingang [10] analyzed the internal relationships among the five Central Asian countries using the TOPSIS method, revealing the main factors affecting WEF security. However, although these studies have made progress in expanding the WEF linkage framework and integrating ecosystem elements, the core role of wetlands as an ecological hub as crucial as forests in WEF system has been systematically overlooked. Wetlands support WEF security through water conservation, carbon sink, and biodiversity maintenance [11,12,13], but this role has been threatened by their uneven distribution and large-scale degradation (over 50% lost due to agricultural expansion and urbanization [14,15]). Taking the Poyang Lake wetland in Jiangxi Province as an example, its biodiversity maintenance function directly supports the survival of over 200 species of aquatic organisms in the basin. The annual economic output of related fishery resources amounts to 1.2 billion yuan, accounting for 18% of the total freshwater fishery output value in the province; At the same time, the carbon sink capacity of the Poyang Lake wetland reaches 3.2 t C/(hm2·a), equivalent to offsetting 1.2 million tons of industrial CO2 emissions annually [16]. Calculated based on a carbon trading price of 60 yuan/t, the annual carbon sink economic value is approximately 720 million yuan. Furthermore, wetlands regulate the local microclimate through the transpiration of vegetation and the evaporation of water bodies, lowering the average summer temperature of surrounding farmland by 1.5–2.0 °C. This effectively alleviates high-temperature stress on rice plants and reduces annual grain yield losses by approximately 80,000 tons, thereby indirectly ensuring the food supply security of the region [17,18]. Their current area only accounts for 6% of the land [19], yet they support the survival of 40% of species. This large-scale degradation not only leads to the loss of biodiversity but also directly weakens the ability of wetlands to support the security of the WEF system, exacerbates the risk of resource conflicts, and highlights the urgency and necessity of integrating wetland elements in WEF research.
Internationally, the progress of WEFW coupling research has gradually gained attention. Researchers in the United States have analyzed the key role of wetlands in regional water resource management and food production through system dynamics models, finding that wetlands can significantly improve water resource utilization efficiency and food production [20]. In India, specific conservation projects have emphasized the importance of wetlands’ ecological services and maintaining regional sustainable development, especially in responding to climate change and ensuring food security [21]. Beyond the U.S. and India, European studies on WEFW systems focus on temperate agricultural wetlands and adopt lifecycle assessment (LCA) to evaluate energy consumption of wetland restoration but rarely link wetland functions to food production resilience—unlike this study, which integrates food subsystem indicators into the WEFW coupling framework [22]. In Africa, Ouma et al. analyzed the impact of wetland loss on smallholder farming, but their research relied on qualitative interviews rather than quantitative models to measure system coordination, highlighting the methodological gap addressed by this study’s multi-model integration [13]. These international practices—such as the U.S.’s market-oriented wetland compensation and India’s eco-agricultural integration—provide valuable references for regional WEFW management. However, current research on China’s subtropical wetlands lacks direct comparisons with these international cases, making it difficult to fully highlight the uniqueness of wetland–resource synergy in densely populated agricultural regions. In China, the number of studies on WEFW coupling research has gradually increased in recent years. Researchers have explored the positive impact of wetland restoration on regional water resource security and food production, emphasizing the importance of wetlands’ ecological functions in optimizing resource allocation [23]. For example, some studies have revealed through empirical analysis the contribution of wetlands to enhancing the resilience of agricultural ecosystems and have explored the roles of different types of wetlands in regulating water resources and supporting food security [24]. Domestically, studies on the Yangtze River Basin emphasize water–energy coupling but treat wetlands as a secondary ecological factor rather than a core subsystem—this study differs by elevating wetlands to a key dimension of the WEF framework, constructing a dedicated wetland subsystem index. Additionally, research on Northeast China’s wetlands focuses on cold-temperate wetland agricultural adaptation, while this study targets subtropical Poyang Lake wetlands, exploring unique synergies that are not addressed in cold-region studies [25,26]. Although the necessity of incorporating wetlands into the comprehensive WEF framework has become increasingly evident, current research still has significant shortcomings: (1) Existing studies on WEFW frameworks mostly remain at conceptual discussions or the macro-scale analysis, lacking systematic and dynamic empirical evaluations at typical regional scales (such as the provincial level). (2) There is a lack of in-depth analysis and quantitative verification of how wetland elements specifically affect and enhance the internal synergy mechanisms of WEF systems, especially their dominant role in spatial differentiation patterns. (3) Forward-looking predictive research on the future evolution trends of regional WEF systems is relatively weak, making it difficult to effectively support the formulation of adaptive management policies.
Jiangxi Province, as an important ecological barrier and agricultural powerhouse in southern China, possesses abundant wetland resources [27]. It plays a crucial role in irrigation and water supply, fishery production, biodiversity conservation, and climate regulation [15,28,29]. The wetland restoration projects implemented in this province in recent years have initially demonstrated their potential to support regional resource security. However, the research on the collaborative mechanism of the WEFW system in Jiangxi Province is still in its infancy and urgently needs to be advanced by constructing an integrated assessment framework to deeply reveal the contribution of wetlands, this key ecological element, to the resilience and coordinated development of the regional resource system. Given the rich wetland resources in Jiangxi Province and its crucial position in regional resource security, especially considering Poyang Lake as the largest freshwater lake in China, its ecological functions play an irreplaceable role in water, energy, and food security. Therefore, including Poyang Lake in the WEFW comprehensive framework for in-depth analysis will help us better understand the core role of wetlands in promoting regional sustainable development and provide empirical evidence for policy formulation. Poyang Lake is not only an important water source, but also provides significant support for agriculture, fisheries, and biodiversity conservation in the surrounding areas. Thus, incorporating Poyang Lake into the WEFW comprehensive framework for in-depth analysis will contribute to a better understanding of the central role of wetlands in promoting regional sustainable development and provide empirical evidence for policy formulation. This study takes Jiangxi Province as a demonstration case to explore the WEFW system’s coupling coordination relationship, with the aim of providing region-specific insights rather than claiming global generalizability—its applicability to other regions (e.g., areas with different wetland types or resource endowments) will require further comparative validation based on local data.
However, current research still lacks a comprehensive understanding of the crucial role of wetlands in the WEF system. As important ecological hubs, the water conservation and water quality purification functions of wetlands have not been fully incorporated into the WEF coupling model, and the regulatory effects of wetlands are often overlooked in the existing water–energy–food conflict analysis. Taking Poyang Lake as an example, the degradation of wetlands has led to a decline in water resource regulation capabilities, exacerbating the contradiction between energy and food production, highlighting the urgency of deepening research on the WEF coupling model. Through in-depth research on wetlands in Jiangxi Province, new insights and empirical support can be provided for achieving sustainable management of water, energy, and food. Based on this, this study aims to achieve the following core goals: (1) Assess the annual change trend of the comprehensive evaluation index of water, energy, food, and wetlands (WEFW) in Jiangxi Province, revealing the overall improvement status. (2) Analyze the spatiotemporal evolution pattern of the coupling coordination degree (CCD) of the WEFW system in Jiangxi Province, clarifying the development trajectory of its coordination level. (3) Focus on quantifying the dominant role of wetland elements in the spatial differentiation pattern of CCD, analyzing the interaction mechanism between water resources, energy, and food factors and its enhancing effect on the explanatory power of CCD. (4) Use the grey prediction model to simulate the change trend of the CCD of the WEFW system in Jiangxi Province over the next 10 years, providing a forward-looking basis for optimizing regional resource management policies and wetland protection strategies. The research results will provide scientific support for deepening the WEF coupling theory and promoting sustainable development in Jiangxi Province and similar regions.

2. Materials and Methods

This study integrated remote sensing monitoring data, statistical yearbooks, water resource bulletins and other multi-source data to construct a comprehensive database covering four dimensions: hydrology, wetlands, agriculture and energy. An evaluation index system including the wetland subsystem was established. It broke through the traditional “water-food-energy” triad framework and incorporated the wetland subsystem into it. The entropy weight method and CRITIC method were used to determine the weights of each index to ensure that the evaluation system is both scientific and reasonable and can reflect regional heterogeneity. The GRA-TOPSIS and CCD models were used to quantify the coupling coordination level of the WEFW system and its subsystems, revealing the spatio-temporal evolution patterns, and focusing on the regulatory effect of wetland dynamic changes on the coupling relationship. Secondly, the geographic detector was used to analyze the dominant driving factors of the CCD under the influence of the wetland linkage. Finally, the GM (1,1) model was used to predict the CCD in the next 10 years. The technical route is shown in Figure 1.

2.1. Study Area

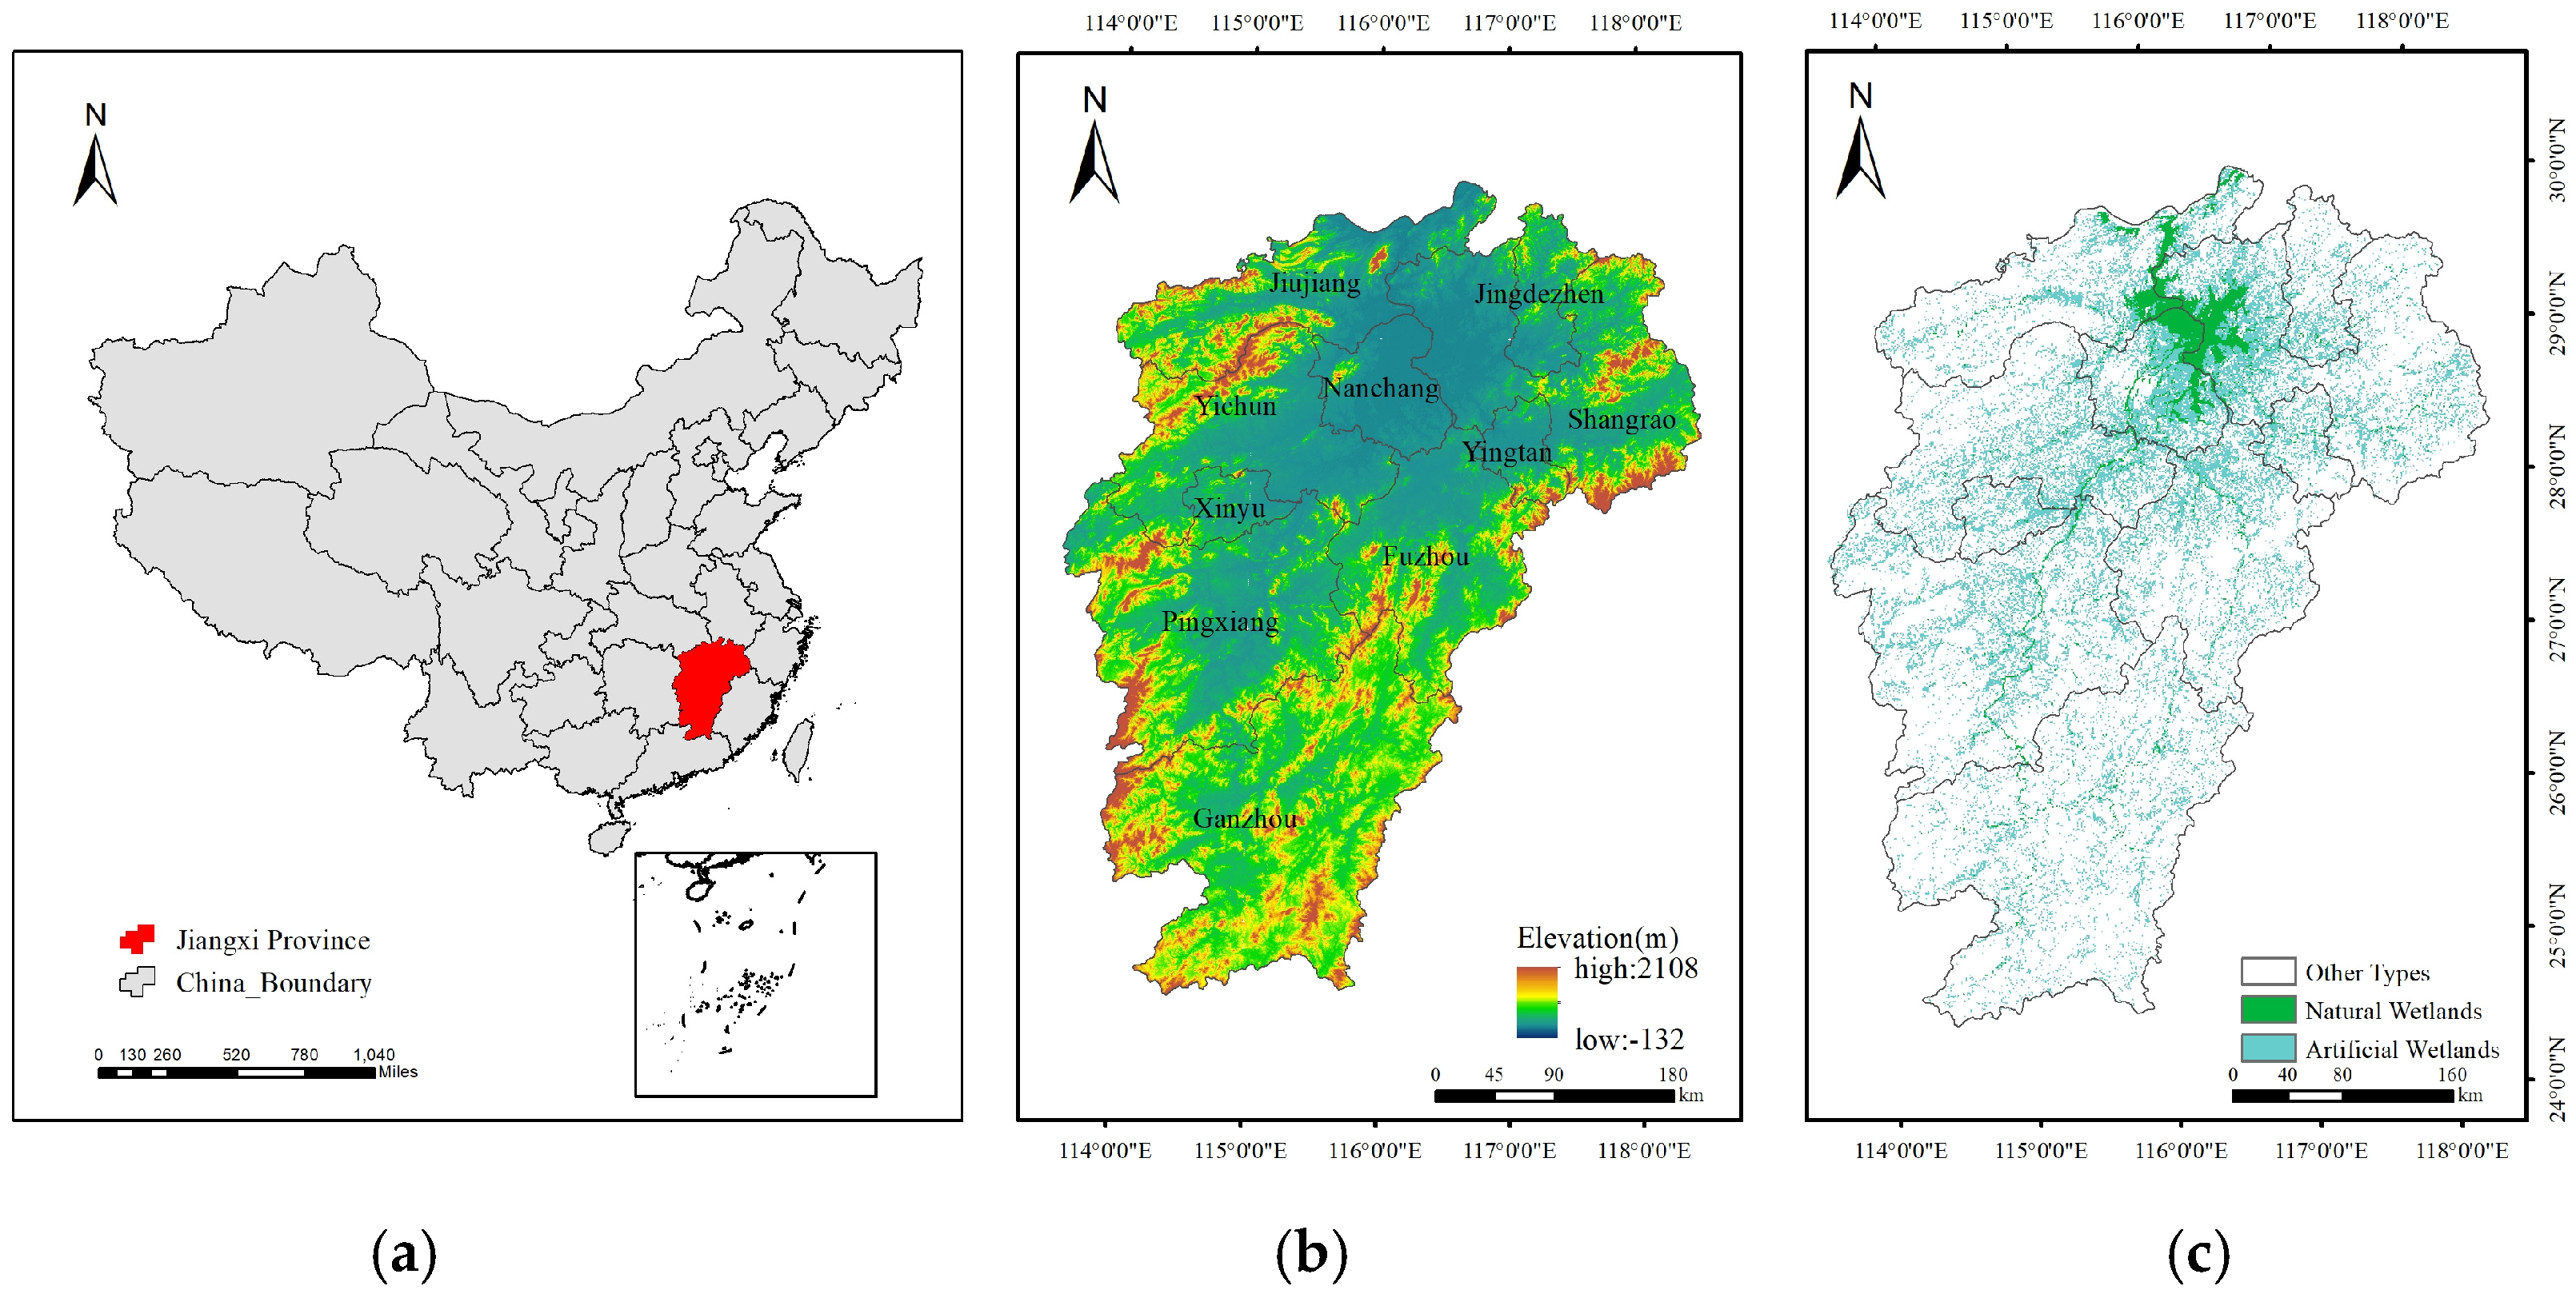
Jiangxi Province (24°29′–30°04′ N, 113°34′–118°28′ E) is located in the southeast of China, with a total area of 166,900 square kilometers, accounting for 1.7% of the country’s land area. Its specific location is shown in Figure 2. Jiangxi Province has numerous wetlands. For instance, the Poyang Lake wetland located within the province is renowned as an important freshwater wetland in China and globally. In 2022, the wetland area of the province was 12,758 square kilometers, including 56 important wetlands. Through the implementation of wetland restoration projects, 109 provincial-level and above wetland parks and 23 nature reserves have been established [27]. However, in recent years, the decline in the water level of Poyang Lake has led to an expansion of the exposed area of wetlands [30,31], compounded by encroachment, pollution, and other threats, resulting in prominent problems of biodiversity loss and ecological function degradation [32]. The wetlands mentioned in this article include natural wetlands (such as rivers, lakes, tidal flats [coastal intertidal mud/sand areas], and tidal flats [seasonally inundated sediment deposits on river and lake shores]) and artificial wetlands (reservoirs, ponds, paddy fields, and river channels).

2.2. Theoretical Framework

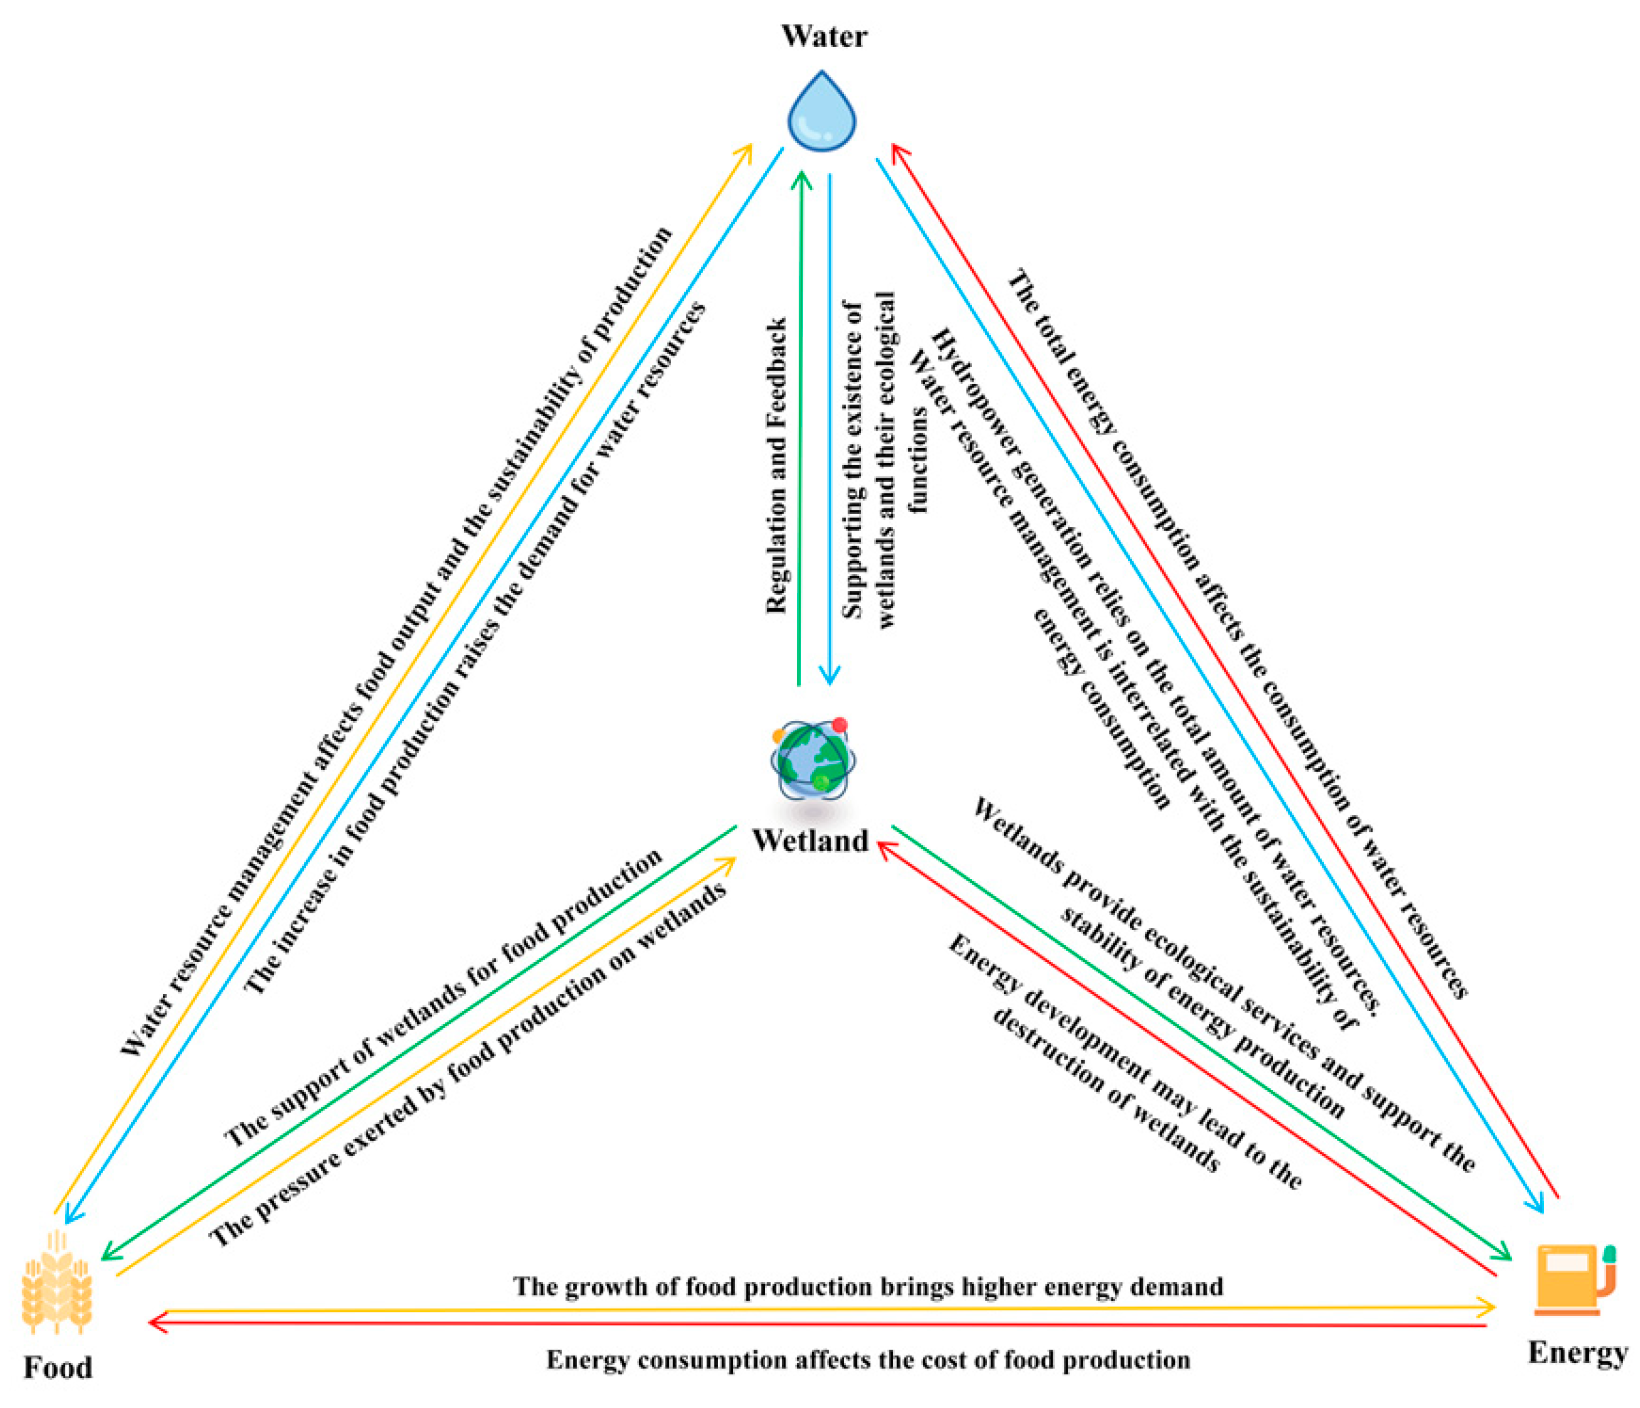
We proposed a hybrid framework, WEFW, emphasizing the crucial role of wetlands in water, energy, and food security. This article incorporates wetlands into the classic triangular relationship of water, energy, and food security for a comprehensive analysis of their interactions. As shown in Figure 3, there are very significant interdependencies among WEFW subsystems.
There is a close interdependence between wetlands and the water resources subsystem [33,34]. Water resource management directly affects the ecological functions of wetlands. Excessive exploitation of water resources may lead to the degradation of wetlands, and the degradation of wetlands will in turn directly affect their water storage capacity [35,36]. Between wetlands and agriculture, the expansion of food production may lead to a reduction in the area of wetlands [37], while the ecological services provided by wetlands support food production [38,39]. Between wetlands and energy, wetlands provide ecological services that support the stability of energy production [40,41], and energy development may lead to the destruction of wetlands [42]. Between water and agriculture, water resource management affects food output and the sustainability of production [42,43], and the increase in food production demand increases the demand for water resources [44]. Between water and energy, the total energy consumption affects water resource consumption [45], and hydropower relies on the total amount of water resources. The sustainability of water resource management and energy consumption are interrelated [46]. Between agriculture and energy, the growth of food production leads to higher energy demand [47], and energy consumption affects the cost of food production [46,48].

2.3. Construction of the Index System and Data Sources

This study set the indicators for each subsystem based on the interaction logic of the four sub-systems and selected the relevant indicators according to the principles of systematicness, representativeness, operability, and accessibility. The indicator system of WEFW is divided into four dimensions: the water resource subsystem, food subsystem, energy subsystem, and wetland subsystem. The criterion layer of the water resource subsystem includes three dimensions: total water resources and sources, water use structure and consumption, and water resource utilization efficiency and management. The criterion layer of the food subsystem includes two dimensions: food availability and food sustainability. These indicators reflect key socio-economic drivers of the WEF system: higher disposable income increases demand for high-quality food and energy-intensive household appliances, while changes in consumption patterns further influence water use for food processing—linking socio-economic development to WEF resource allocation. The criterion layer of the energy subsystem includes two dimensions: total amount and growth rate, and efficiency and development elasticity. The criterion layer of the wetland subsystem includes two dimensions: wetland structure characteristics and ecological function and diversity characteristics. Based on the above theoretical framework, an indicator system was constructed, which includes a total of 27 indicators (Table 1). In the table, the positive or negative signs after each indicator represent the direction of the effect of that indicator on the coupling coordination degree of the system. Positive indicators indicate that an increase in the value will have a positive contribution to the coordination degree of the WEFW system, while negative indicators indicate that an increase in the indicator value will have a suppressive effect on the system’s coordination degree. The weighting method used for evaluation is shown in Appendix A.
The data on water resources, energy, and food all come from the “Jiangxi Province Water Resources Bulletin” and “Jiangxi Province Yearbook”, covering information from 2001 to 2022. To address potential deviations between statistical data and actual conditions, this study adopted three verification strategies: (1) Cross-validation with remote sensing data: For key wetland indicators, Landsat-8/9 satellite images were used to extract wetland boundaries annually, and the consistency between interpreted results and statistical data was checked. (2) Ground-truth sampling: In 5 typical degraded wetland areas, 150 field sampling plots were set up during 2018–2022 to measure actual wetland vegetation coverage and water storage capacity, correcting statistical deviations caused by subjective reporting. (3) Integration of third-party monitoring data: Data on wetland degradation were supplemented by the ‘Poyang Lake Wetland Ecological Monitoring Annual Report’ and ‘Jiangxi Provincial Ecological Environment Status Bulletin’, which independently track wetland ecological changes and reduce reliance on a single data source. The indicators of wetland structure characteristics, including patch density, landscape shape index, patch connectivity index, and Shannon diversity index, were analyzed using the Fragstats model based on 30-m resolution digital elevation model data [49].

2.4. Evaluation Method

2.4.1. The GRA-TOPSIS Model

TOPSIS (Technique for Order Preference by Similarity to an Ideal Solution) was initially proposed by C. L. Hwang and K. Yoon in 1981 and is an effective multi-objective decision-making comprehensive evaluation method [50]. The TOPSIS ideal solution similarity ranking method is used for multi-attribute decision analysis. The application principle of the TOPSIS method is to establish an equation for the degree of closeness of the evaluated object to the ideal solution, rank them based on the degree of closeness, and comprehensively evaluate the superiority or inferiority of the indicators by considering factors such as proximity degree and the distance between the indicators and the positive and negative ideal solutions, thereby obtaining the research results [51]. In the current research on WEF system evaluation, most of them adopt either a single TOPSIS method or the entropy–weight–TOPSIS combination method [52]. However, these methods have limitations when dealing with the correlation and ambiguity issues of WEF system indicators: firstly, they merely rely on “distance” to evaluate the superiority or inferiority of the evaluation objects, failing to fully consider the complex correlation characteristics among the internal indicators of the WEF system; secondly, when the weights of indicators in multiple subsystems are similar, these methods have difficulty effectively distinguishing the actual differences in the evaluation objects, and are prone to providing insufficient discrimination of the evaluation results [53,54,55]. Although the traditional TOPSIS method is simple and clear in its calculations, it has some limitations in the calculation of degree of proximity, such as being unable to reflect trend changes in the data, and it is difficult to determine superiority or inferiority when the distance between the evaluated object and the positive and negative ideal solutions is the same. It is necessary to clarify here that the positive ideal solution refers to a hypothetical solution in multi-attribute decision-making where each evaluation criterion achieves its optimal value. It can be understood as the collection of the best performances of all evaluation objects in terms of each criterion, representing the ideal state in the decision-making process, while the negative ideal solution is a hypothetical solution where each evaluation criterion is at its worst value, that is, the collection of the worst performances of each criterion, representing the undesirable state in the decision-making process.
By introducing grey correlation analysis into TOPSIS, it can more effectively reflect the degree of closeness of the evaluated object to the ideal solution from the perspectives of curve similarity and position distance, thereby making the analysis results more reasonable and reliable [56]. Given the particularity of the WEF system, the GRA-TOPSIS method adopted in this study, on the one hand, captures the trend consistency of the indicators of each subsystem of WEF through grey correlation analysis, which compensates for the deficiency of the traditional TOPSIS method that only focuses on “distance from position”, and solves the problem of “similar results and low discrimination” in the existing WEF evaluation [57]. The specific process is shown in Appendix B.

2.4.2. CCD Model

The calculation of the CCD of the WEFW system in this study requires the “comprehensive evaluation index of water, energy, food, and wetland subsystems” output by the GRA-TOPSIS model in Section 2.4.1 as the core input parameter. Since GRA-TOPSIS has corrected the deviations of traditional evaluations, its output results can more accurately reflect the actual levels of each subsystem, providing a reliable foundation for the calculation of coupling degree and coordination degree. Coupling refers to a mechanism where different systems have mutual influence and interaction. Coupling degree can be used to study the degree of mutual influence between systems. The greater the coupling degree, the stronger the dependency of the relationship between the systems, and vice versa. Although the evaluation of the WEFW system can reflect the overall situation of the region, its guiding significance for actual policies is limited. Therefore, many studies have explored the coordination relationship between WEFW systems. Currently, research usually uses the CCD model to measure the coordination degree of different subsystems, focusing on their mutual connections [58].
The core variable of the model is the comprehensive development index of the four subsystems: water, energy, food, and wetlands. This index is calculated through the GRA-TOPSIS model in Section 2.4.1 and has been standardized to the range of [0,1], ensuring the comparability of calculations across subsystems. A “synergy term” is constructed by multiplying the four subsystem indices. The core logic of this term lies in reflecting the interdependence among the subsystems. A “development foundation term” is constructed by summing the four subsystem indices, with the aim of avoiding misjudging “low-level balance” as high coupling. To ensure that the coupling degree results fall within the range of [0,1], the square root of the synergy term is taken 4 times and then compared with the development foundation term. Finally, the coupling degree formula of the WEFW system is derived:
C i = W 1 i W 2 i E i F i 4 W 1 i + W 2 i + E i + F i
In summary, although these studies provide important perspectives for understanding the WEFW system, there are still limitations in revealing the coupling relationship between subsystems and their influencing factors. Therefore, this study adopts the CCD model to more accurately measure the interaction among water, energy, food, and wetlands, highlighting the key role of wetlands in the WEFW system. This paper constructs the coupling degree model of the WEFW system, with the formula as follows:
In the formula: C represents the coupling degree, where 0 ≤ C ≤ 1. However, the coupling degree can only represent the strength of the correlation among the three systems but cannot reflect the coordinated development status of the relationships among the three. To measure the coordination degree between the WEFW subsystems, a CCD model is introduced.
D i = C i T i
T i = α W 1 i + ε W 2 i + β E i + γ F i
D represents the CCD, where 0 ≤ D ≤ 1. C is the coupling degree; T is the comprehensive evaluation index of the WEFW composite system. The larger the value of D, the stronger the CCD, and the better the coupling coordination and development of the WEF system.
The stage division of the CCD is shown in Table 2.

2.5. Geographical Detector Model

When studying the WEFW system, quantifying the contribution of wetlands is of great significance. The geographical detector, as an effective spatial analysis tool, is widely used to assess the influencing factors of ecosystem services [59,60]. The geographical detector is a technology that identifies the spatial differences in a certain attribute and reveals the factors causing such differences. The geographical detector is a tool for detecting and utilizing the spatial differentiation of geographical phenomena, and the principle of factor detection is to determine the explanatory power (q) of the independent variable X on the dependent variable Y by comparing the sum of within-layer variances with the total variance of the entire area [61]. This method includes factor detection, interaction detection, risk detection, and ecological detection. It can reveal the relationship between wetlands and water, energy, and food production, thereby quantifying the contribution of wetlands to the WEFW. Compared with principal component analysis (PCA) and regression analysis, the advantage of the geographical detector lies in its ability to directly handle spatial data, analyze the spatial correlation between variables, and have greater adaptability [62,63]. Although PCA performs well in dimensionality reduction, it has limitations in spatial heterogeneity analysis [64]; regression analysis assumes a linear relationship and may ignore nonlinear effects [65]. Therefore, in this study, four subsystems were selected as independent variables, and CCD was taken as the dependent variable. Using factor detection and interaction detection methods, the influencing factors and their interactions at the coupling coordination level in the WEFW network were obtained to more accurately reflect the key role of wetlands in the WEFW network. The calculation formula of the geographical detector is as follows:
q = 1 h = 1 L N h σ h 2 N σ 2
In the formula: q represents the explanatory power of the influencing factor, with a value range of [0,1]. The larger the value, the stronger the influence of this factor on the CCD; L represents the number of factor partitions; Nh represents the number of samples within partition h; N refers to the total number of samples; σ 2 and σ h 2 refer to the variance of the CCD in Jiangxi Province and the variance of partition h.
The analytical variables for the geographical detector in this study are directly determined based on the results in Section 2.4.1, using the subsystem indices output by GRA-TOPSIS as independent variables, and the WEFW CCD in Section 2.4.2 as the dependent variable. Through this setting, it is possible to precisely detect the explanatory power of each subsystem for the overall coordination level of WEFW. Moreover, the capturing ability of GRA-TOPSIS for the trend of indicators can reduce the interference of measurement deviations of independent variables on the detection results.

2.6. GM (1,1) Forecasting Model

The grey system theory was proposed by Professor Deng Julong from Huazhong University of Science and Technology in 1982. After years of development, it has become an important method for prediction, decision-making, and system analysis in various fields such as society, economy, and science and technology. This theory is particularly suitable for system analysis where the time series is short, the statistical data is scarce, and the information is incomplete, and thus has been widely applied. It is important to note that the GM (1,1) model, as a core tool of grey system theory, relies on two key assumptions: (1) the system follows a quasi-exponential growth trend; (2) the original data has good smoothness (i.e., small inter-annual fluctuations). The grey forecasting model is an effective forecasting tool based on the grey system theory. This model generates and processes the original data to enhance its regularity, establishes a differential equation model, and obtains the predicted value through cumulative reduction [66]. In summary, the GM (1,1) can accurately capture the dynamic change trends of the system in cases of scarce or incomplete data, demonstrating high prediction accuracy and practicality. In terms of other available models, the SD and ABM models require a large amount of high-frequency and multi-dimensional microdata [67,68]. However, this study focuses on the macro panel data of Jiangxi Province from 2001 to 2022. Some key indicators have annual statistical gaps, which makes it difficult to meet the requirements of SD for data integrity and refinement. Moreover, the prediction logic of the GM (1,1) model is simple and its results have strong interpretability. Policy makers can clearly understand the derivation process of “historical coupling coordination trend future prediction value”, which facilitates the direct conversion of the prediction results into targeted measures. Therefore, this study chooses to use the GM (1,1) model to predict the CCD of the WEF system, with the aim of providing reference points for relevant policies. The modeling process is shown in Appendix C.

3. Results

This chapter conducts a four-part empirical analysis to reveal the development patterns of the WEFW system in Jiangxi Province: 3.1 focuses on the spatio-temporal changes in the comprehensive development index of the WEFW system in various cities, clearly identifying regional development differences; 3.2 analyzes the coupling and coordination characteristics of wetlands and each subsystem, as well as the WEFW as a whole, comparing the differences between the WEFW and the WEF system; 3.3 uses the geographic detector to quantify the contribution of each subsystem to the coupling coordination degree, highlighting the role of wetlands; and 3.4 uses the GM (1,1) model to predict the trend of coordination degree from 2024 to 2032, providing a direction for policies. Each section progresses step by step, comprehensively presenting the current status, mechanism, and future potential of the WEFW system.

3.1. The Comprehensive Performance Evaluation Result of the WEFW System

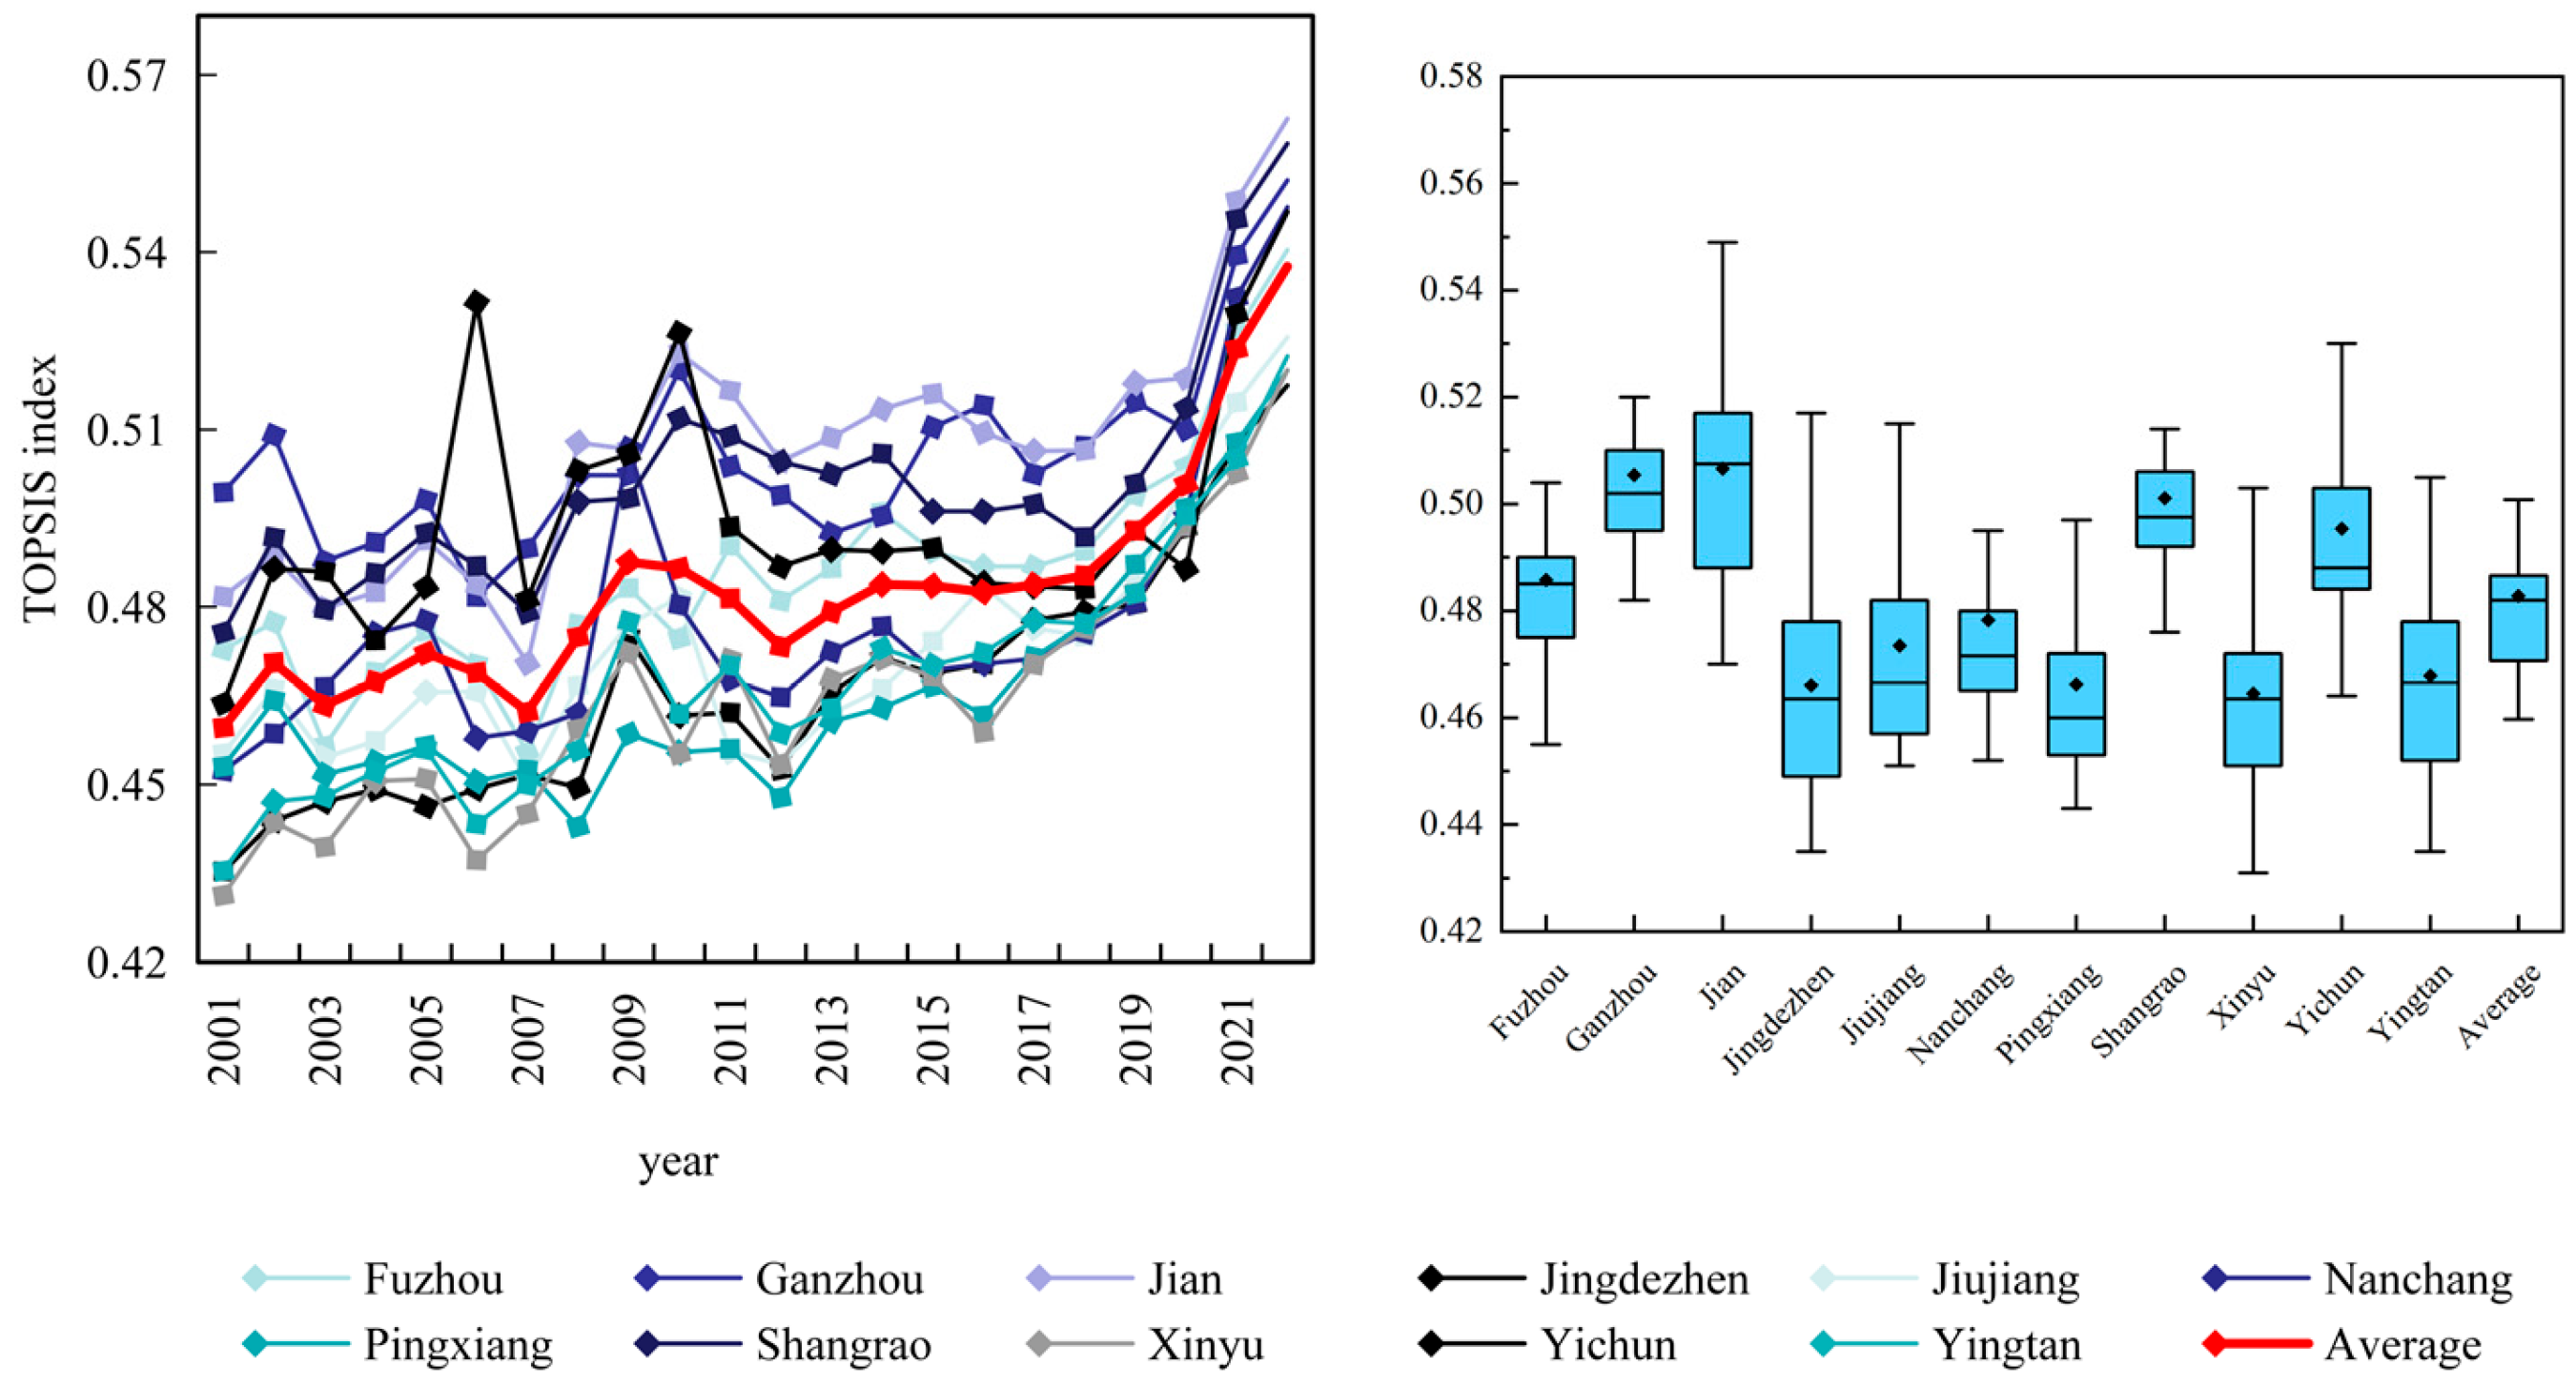
According to the data shown in Figure 4, from 2001 to 2022, the comprehensive evaluation results of Jiangxi Province showed certain fluctuations and an upward trend. Overall, the comprehensive development level of Jiangxi Province in WEFW management gradually improved. During this period, the comprehensive evaluation value showed a clear upward trend. For example, Fuzhou and Yichun reached the highest values of 0.527 and 0.547, respectively, in 2021 and 2022, indicating continuous progress of these two regions in WEFW management. Additionally, the comprehensive evaluation results of Ganzhou and Ji’an also steadily increased, especially Ji’an, with its comprehensive evaluation value increasing from 0.518 in 2018 to 0.563 in 2022, an increase of 8.68%. However, not all cities showed a consistent growth trend.
In terms of the time dimension, the performance differences among some cities were significant. Jingdezhen’s comprehensive evaluation maintained a fluctuation range of ±2.3% (2001–2012), but it began to rise slowly after 2013 and reached 0.517 in 2022; although it improved, the overall improvement was relatively small. Moreover, based on the average value of the comprehensive evaluation results in Jiangxi Province, it can be observed that the overall development level of the region showed a year-on-year upward trend. In the early stage (2001–2010), the average value fluctuated between 0.4596 and 0.4722, with relatively slow development. Since 2011, the average value gradually rose to 0.4792, and accelerated after 2017, rising from 0.4825 to 0.5376 in 2022.
In terms of spatial distribution, the comprehensive evaluation results of each city showed significant differences. Ji’an and Yichun were relatively prominent in overall performance, especially Yichun, which reached 0.547 in 2022, reflecting the comprehensive performance of this region in WEFW management. In contrast, Jingdezhen and Xinyu had lower comprehensive evaluation values, indicating that there is still room for improvement in resource integration and sustainable development.
In conclusion, in the comprehensive performance assessment of WEFW, Jiangxi Province’s overall development level improved, and there were significant differences both in time and space.

3.2. Analysis of Coupling and Coordinated Development of WEFW Systems

3.2.1. Coupling and Coordination Degree Between Wetlands and Other Subsystems

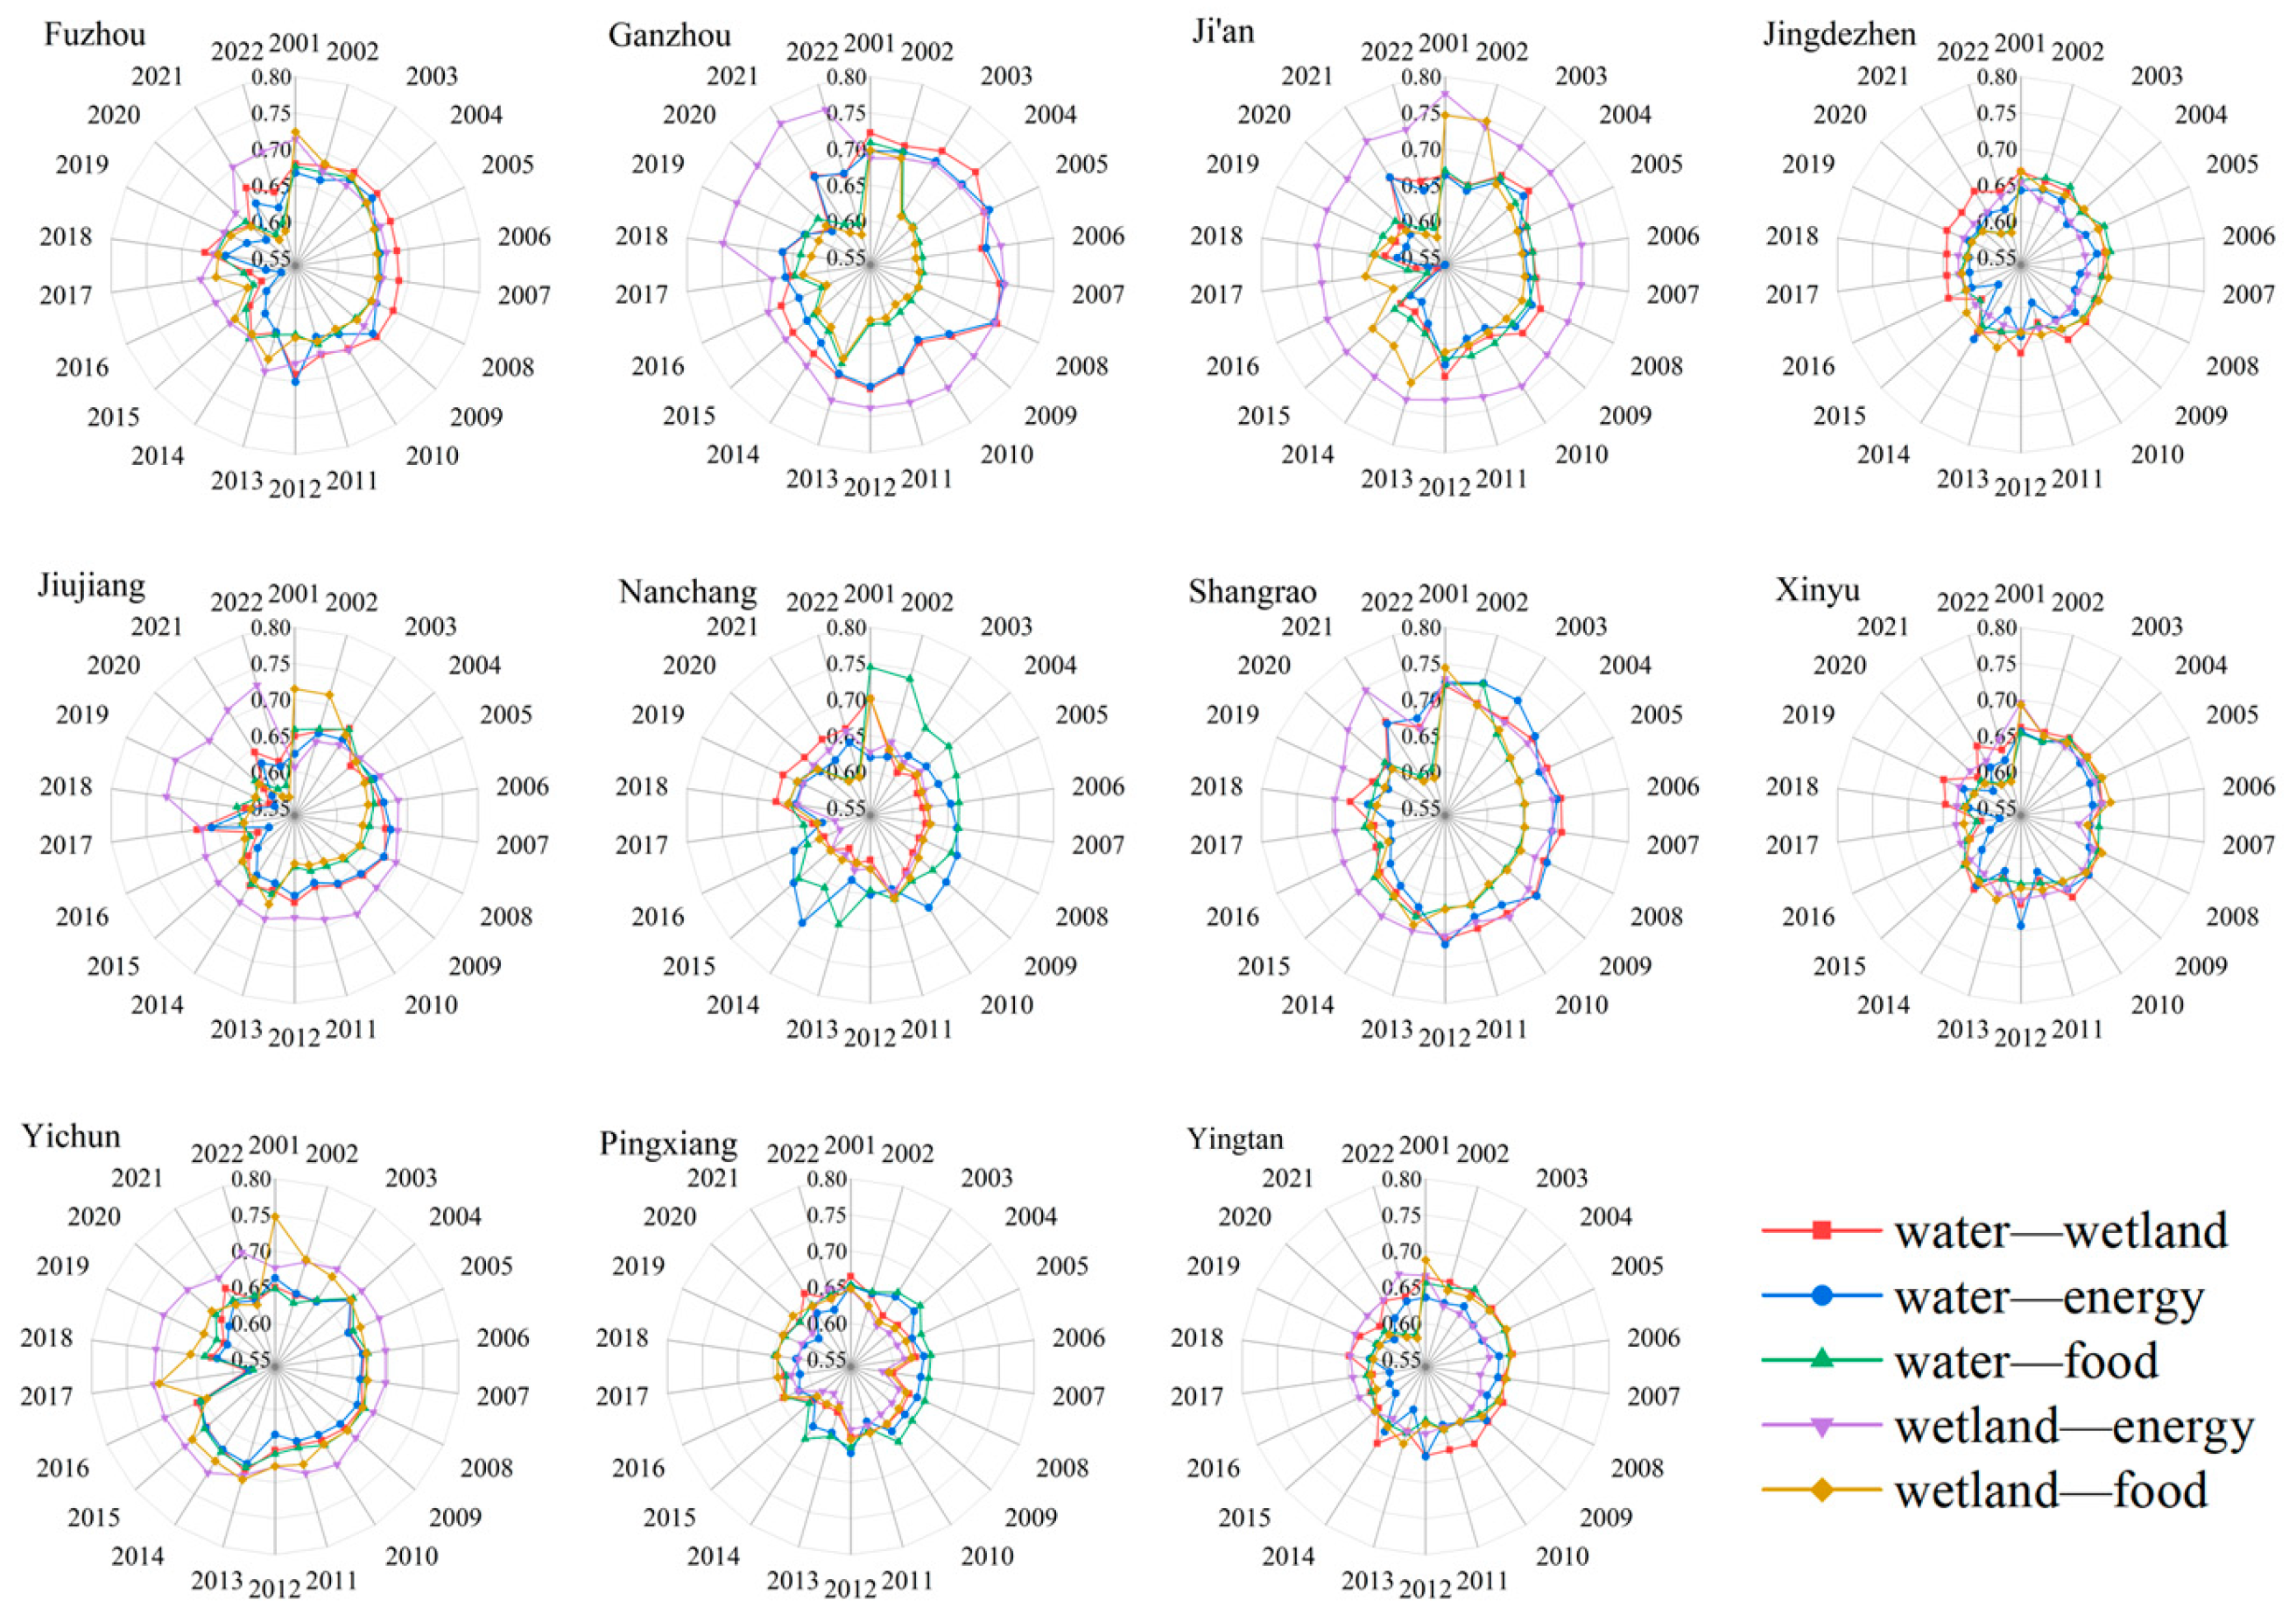
Figure 5 shows the CCD of each subsystem in Jiangxi Province. The radius of each city represents the degree of coupling coordination. Overall, the CCD of the wetland–water subsystem in 2001 to 2022 showed a fluctuating and recovering trend. From 2001 to 2008, the coordination degree was relatively stable, maintaining between medium and good coordinated development. From 2009 to 2013, the coordination degree of some cities fluctuated, especially from 2010 to 2012, with some cities below 0.7, even entering the primary coordinated development category. After 2014, the coordination degree recovered, and after 2020, it entered a relatively high and stable stage. The coordination degree of multiple cities remained between 0.7 and 0.8, indicating good coordinated development.
The CCD of the wetland–energy subsystem also showed similar fluctuations from 2001 to 2022. From 2001 to 2005, the overall coordination degree was relatively stable, maintaining between medium and good coordinated development. From 2006 to 2010, the coordination degree of some cities significantly decreased, especially from 2007 to 2009. Since 2011, the coordination degree trend has recovered; especially after 2015, the coordination degree of many cities showed a reasonable management balance, and by 2022, the coordination degree of most cities had increased compared to 2001.
The CCD of the wetland and food subsystem was generally between medium and good coordinated development from 2001 to 2005. From 2006 to 2010, there were fluctuations in some cities, especially in 2007 and 2008, with the coordination degree of some cities dropping to the excessive development category. Since 2011, the coordination degree has significantly improved, and some cities, such as Nanchang and Jiujiang, etc., gradually entered the good coordinated development category. Nanchang even reached the high-quality coordinated development category. From 2021 to 2022, the overall coordination degree remained at a high level, and Nanchang and Jiujiang continued to be in the high-quality coordinated development category, while Ganzhou, Pingxiang, and Shangrao also made progress.
Apart from wetlands, there are significant differences among the subsystems: the coordination degree of the water–energy subsystem was generally high (most cities > 0.5); the coordination degree of the water–food subsystem fluctuated greatly, with some cities such as Ganzhou, Shangrao, etc., remaining at a low-level coordinated state (<0.4). The coordination degree of the energy–food subsystem was the lowest; only a few cities such as Nanchang and Jiujiang reached a moderate coordination level (0.4–0.6).

3.2.2. CCD of WEFW

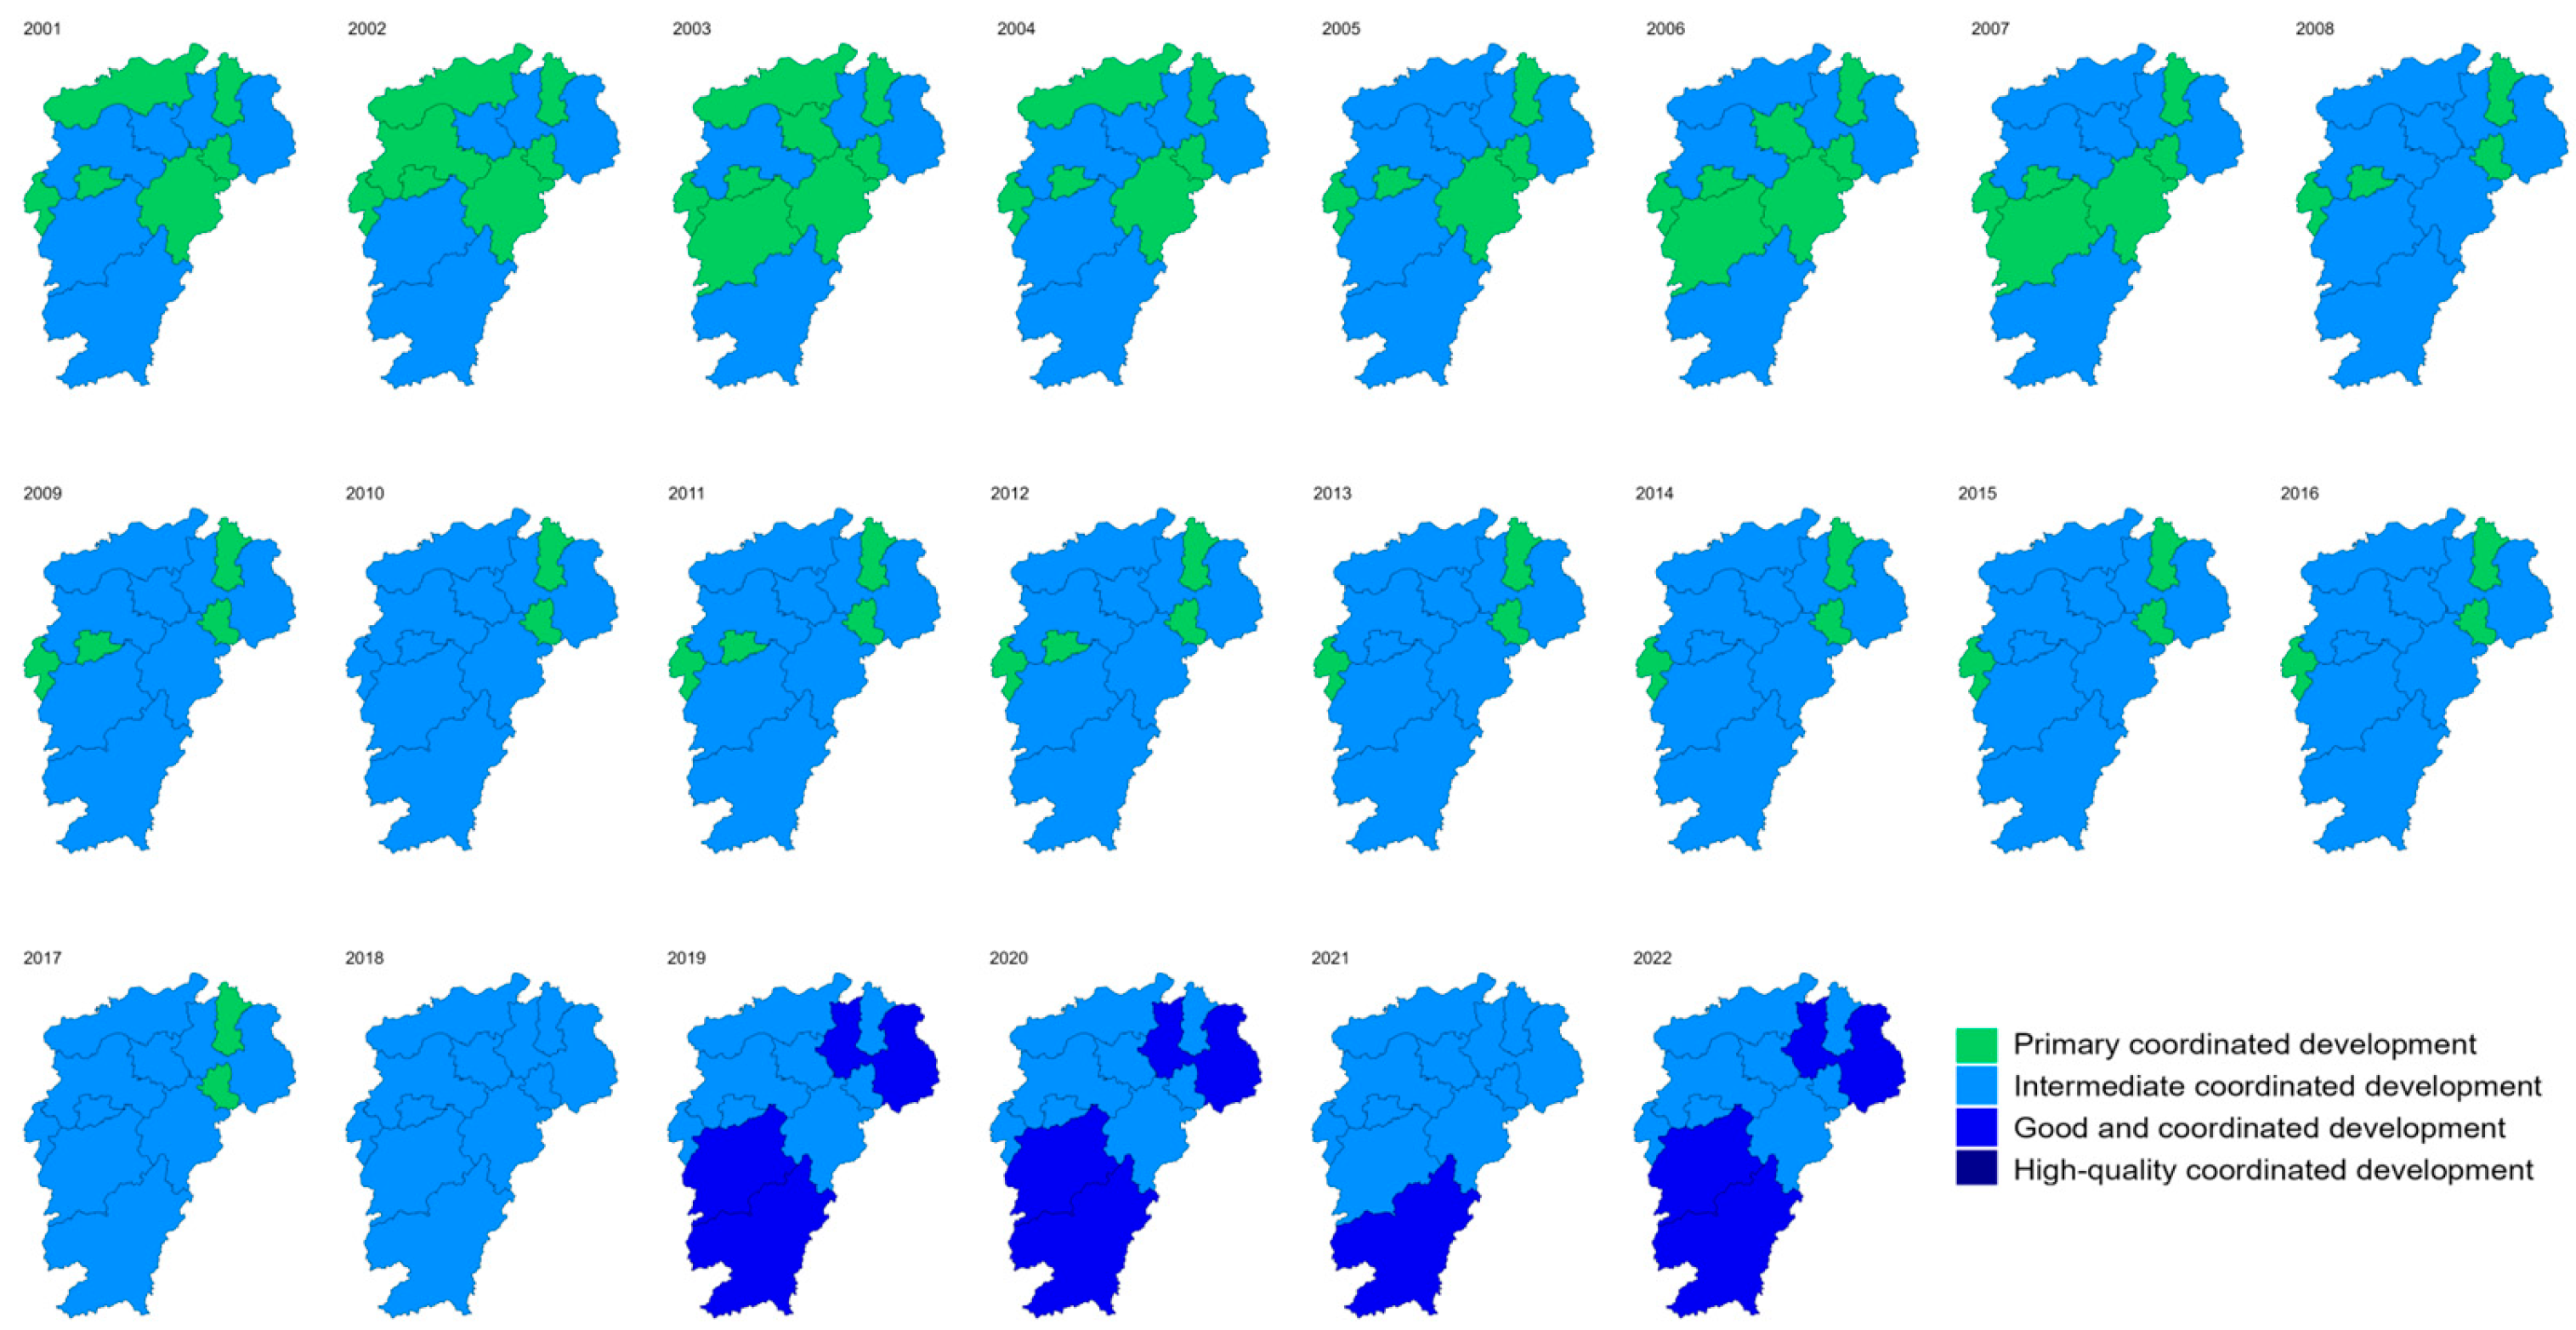
Based on the comprehensive performance assessment results of the WEFW system in Jiangxi Province, the CCD was calculated. The CCD of the WEFW system in Jiangxi Province showed a gradually rising trend in most cities. According to Figure 6, many cities were in the intermediate coordinated development category during the period from 2001 to 2010. Especially from 2007 to 2009, the CCD of some regions decreased and entered the primary coordinated development category or the excessive development category. However, starting from 2011, the coordination degree of many cities rose, and especially after 2014, Jiangxi Province as a whole showed an upward development trend, and the CCD of many regions gradually entered the good coordinated development category, and some regions even entered the high-quality coordinated development category.
In terms of spatial distribution, the CCD varies significantly among different cities. The CCDs of WEFW systems in large and medium-sized cities such as Nanchang and Jiujiang were relatively stable, with a small fluctuation range, and the coordination degree of these cities generally remained at a high level. For example, the coordination degree of Nanchang has always remained in the high-quality coordinated development category, demonstrating the good resource management and coordination mechanism of this region. In contrast, the coordination degree of cities such as Ganzhou and Pingxiang fluctuated greatly, especially in 2007 and 2008; the CCD during some years even dropped to the primary coordinated development category or the excessive development category, indicating that these regions had poor coordination in aspects such as wetland resource protection, energy development, and grain production, resulting in a decrease in the coordination degree.
In summary, different cities in Jiangxi Province show significant spatial differences in the changes in the CCD of WEFW systems, which can mainly be divided into three categories: 1. Stable regions: The CCDs of cities such as Nanchang and Jiujiang were relatively stable, with a small fluctuation range, and generally remained at a high level. In particular, Nanchang’s coordination degree gradually entered the “high-quality coordinated development category”. 2. Fluctuating regions: The CCDs of cities such as Ganzhou and Pingxiang fluctuated greatly, and even showed a downward trend in some years, indicating a level below 0.6 in the “primary coordinated development category” or “excessive development category”. 3. Improving regions: Cities such as Shangrao and Yichun, although initially at a lower coordination degree level, have gradually recovered in recent years; especially after 2015, these regions’ coordination degree have transitioned to the “good coordinated development category”.

3.2.3. Comparative Analysis of Coupling and Coordination Relationship Between WEFW and WEF Systems

The inclusion of wetlands significantly enhances the stability and synergy of the water–energy–food system. As a natural “ecological sponge”, wetlands, through functions such as water conservation, water purification, and climate regulation, indirectly alleviate resource competition among subsystems. The comparison of the CCD between the two is shown in Figure 7. Taking Jiangxi Province as an example, the CCD of the WEFW system (average value from 2001 to 2022 was 0.62–0.73) was generally higher than that of the WEF system (average value during the same period was 0.58–0.68); especially in industrial cities with greater resource pressure, the difference was more significant. For instance, the coordination degree of the WEFW system in Nanchang City (which, in 2022, was 0.674) was 12.5% higher than that of the WEF system (0.599), indicating that the regulating capacity of Poyang Lake wetlands effectively alleviated the contradiction between water resource over-exploitation and energy demand surge during the urban expansion of the metropolitan area. Through extending the hydrological cycle period and reducing the impact of extreme drought events, wetlands provide a stable water supply for agricultural irrigation and energy production, thereby reducing the direct competition intensity among subsystems.
The spatial distribution characteristics and ecological service functions of wetlands lead to significant regional heterogeneity in the improvement of CCDs. In the Gan Nan region with a high wetland coverage (>10%) (such as Ganzhou and Ji’an), the coordination degrees of the WEFW system (0.694 and 0.716, respectively, in 2022) were increased by 12.9–20.7% compared to the WEF system (0.615 and 0.593, respectively, in 2022). This is due to the retention effect of wetland ecosystems on agricultural non-point pollution, reducing water consumption per unit of grain production and reducing water treatment energy consumption. The biodiversity of wetlands further reduces the cost of controlling non-point source pollution in farmlands. It is estimated that the wetlands around Poyang Lake reduce the annual investment in controlling agricultural non-point source pollution by about 150 million yuan. Meanwhile, the humid environment formed by the microclimate regulation of wetlands has reduced the water demand for agricultural irrigation in the surrounding areas by 8% to 10%. This indirectly reduces the energy consumption of water pumping facilities, saving approximately 20 million yuan in electricity costs annually. In contrast, in degraded wetland areas (such as Jingdezhen and Pingxiang), the coordination degrees of the WEFW system (0.579 and 0.615 in 2022) were still higher than those of the WEF system (0.579 and 0.596 in 2022), but the increase was limited (0–3.2%), indicating that shrinking wetland area weakened their ecological regulatory capacity. This spatial heterogeneity confirms that the synergistic effect of wetlands is more crucial in regions with intense resource competition (such as industrial clusters).
Long-term observation data show that the inclusion of wetlands significantly enhances the resilience of coupled systems to climate fluctuations and human disturbances. During the period from 2001 to 2022, the interannual fluctuation coefficient (CV = 0.098) of the WEFW system coordination degree in Jiangxi Province was 31.0% lower than that of the WEF system (CV = 0.142), and the frequency of extreme low values decreased by 44%. For example, in the Poyang Lake basin in 2022, a historic drought occurred, and the coordination degree of the WEF system in Jiujiang and Nanchang dropped sharply to 0.572 and 0.599 (down 13.2% and 11.8% compared to a normal year), while the coordination degree of the WEFW system remained at 0.644 and 0.674 (a decrease of only 7.1% and 4.9%). Further analysis revealed that, for every 1% increase in wetland coverage, the system coordination degree loss in drought years was reduced by 0.6–0.9 percentage points. This resilience improvement stems from the multiple redundancy mechanisms of wetlands: their biodiversity maintains multiple paths of water circulation, and the accumulation of soil organic matter enhances the efficiency of carbon–water coupling, thereby buffering the chain impact of external disturbances on energy and food production.

3.3. Analysis of the Contribution Degree of Each System in WEFW to the CCD

This study employed the geographical detector model to measure the explanatory power of the four subsystems for the CCD. The results are shown in Table 3. Except for the energy subsystem, the p-values were all less than 0.01, indicating that the results were highly significant. To quantify the uncertainty of q-values (explanatory power), this study conducted a bootstrap resampling test (1000 iterations): the 95% confidence intervals for the q-values of wetland, water, energy, and food subsystems are [0.115, 0.168], [0.042, 0.091], [0.053, 0.096], and [0.038, 0.076], respectively. The narrow confidence intervals suggest relatively low uncertainty in the detector results, especially for the wetland subsystem (q = 0.142), confirming its stable dominant role in spatial differentiation. The relatively higher p-value of the energy subsystem may be attributed to the relatively stable structure of Jiangxi Province’s energy system during the study period: the energy supply is dominated by coal and hydropower, and the annual fluctuation of core indicators is small, leading to weak spatial differentiation of the energy subsystem itself and thus a relatively low statistical significance of its explanatory power for the coupling coordination degree. In this study, the four systems had a maximum q-value of 0.142 (wetland subsystem), explaining 14.2% of spatial variation for the spatial differentiation of the CCD. This was because the spatial differentiation of the CCD itself was relatively weak, suggesting that the water-energy-food-wetland system in Jiangxi Province was relatively balanced in terms of coordination level, lacking significant spatial conflicts or synergy hotspots. Nevertheless, the explanatory power of the wetland factor was stronger than that of the other three subsystems, indicating that, from the perspective of a single subsystem, the influence of the wetland on the CCD of the water-energy-food-wetland system in Jiangxi Province was relatively obvious.
The q-value of the wetland factor was 0.142, and the p-value was 0.0009, indicating that the wetland had a strong explanatory ability for the spatial differentiation of the CCD and its influence was statistically significant. The q-value of the energy factor was 0.0745, and the p-value was 0.0159, showing that energy had a certain explanatory power for the spatial differentiation of the CCD; although its influence was lower than that of the wetland, it still had statistical significance. In the context of energy development and utilization and the relationship between energy and water resources, food production was increasingly complex, and its effect on the CCD could not be ignored. The q-value of the food factor was 0.0574, and the p-value was 0.0099, indicating that food also played a significant role in the spatial differentiation of the CCD, but compared with the wetland and energy, its influence was relatively limited. In summary, the wetland occupied a dominant position in the spatial differentiation of the CCD and had the most significant impact; the influence of the energy factor was second, while the influence of the food factor was relatively weak. This result indicates that, in the evolution process of the CCD in the study area, the protection and management of wetlands were of great significance for the coordination of water resources, energy, and food production.
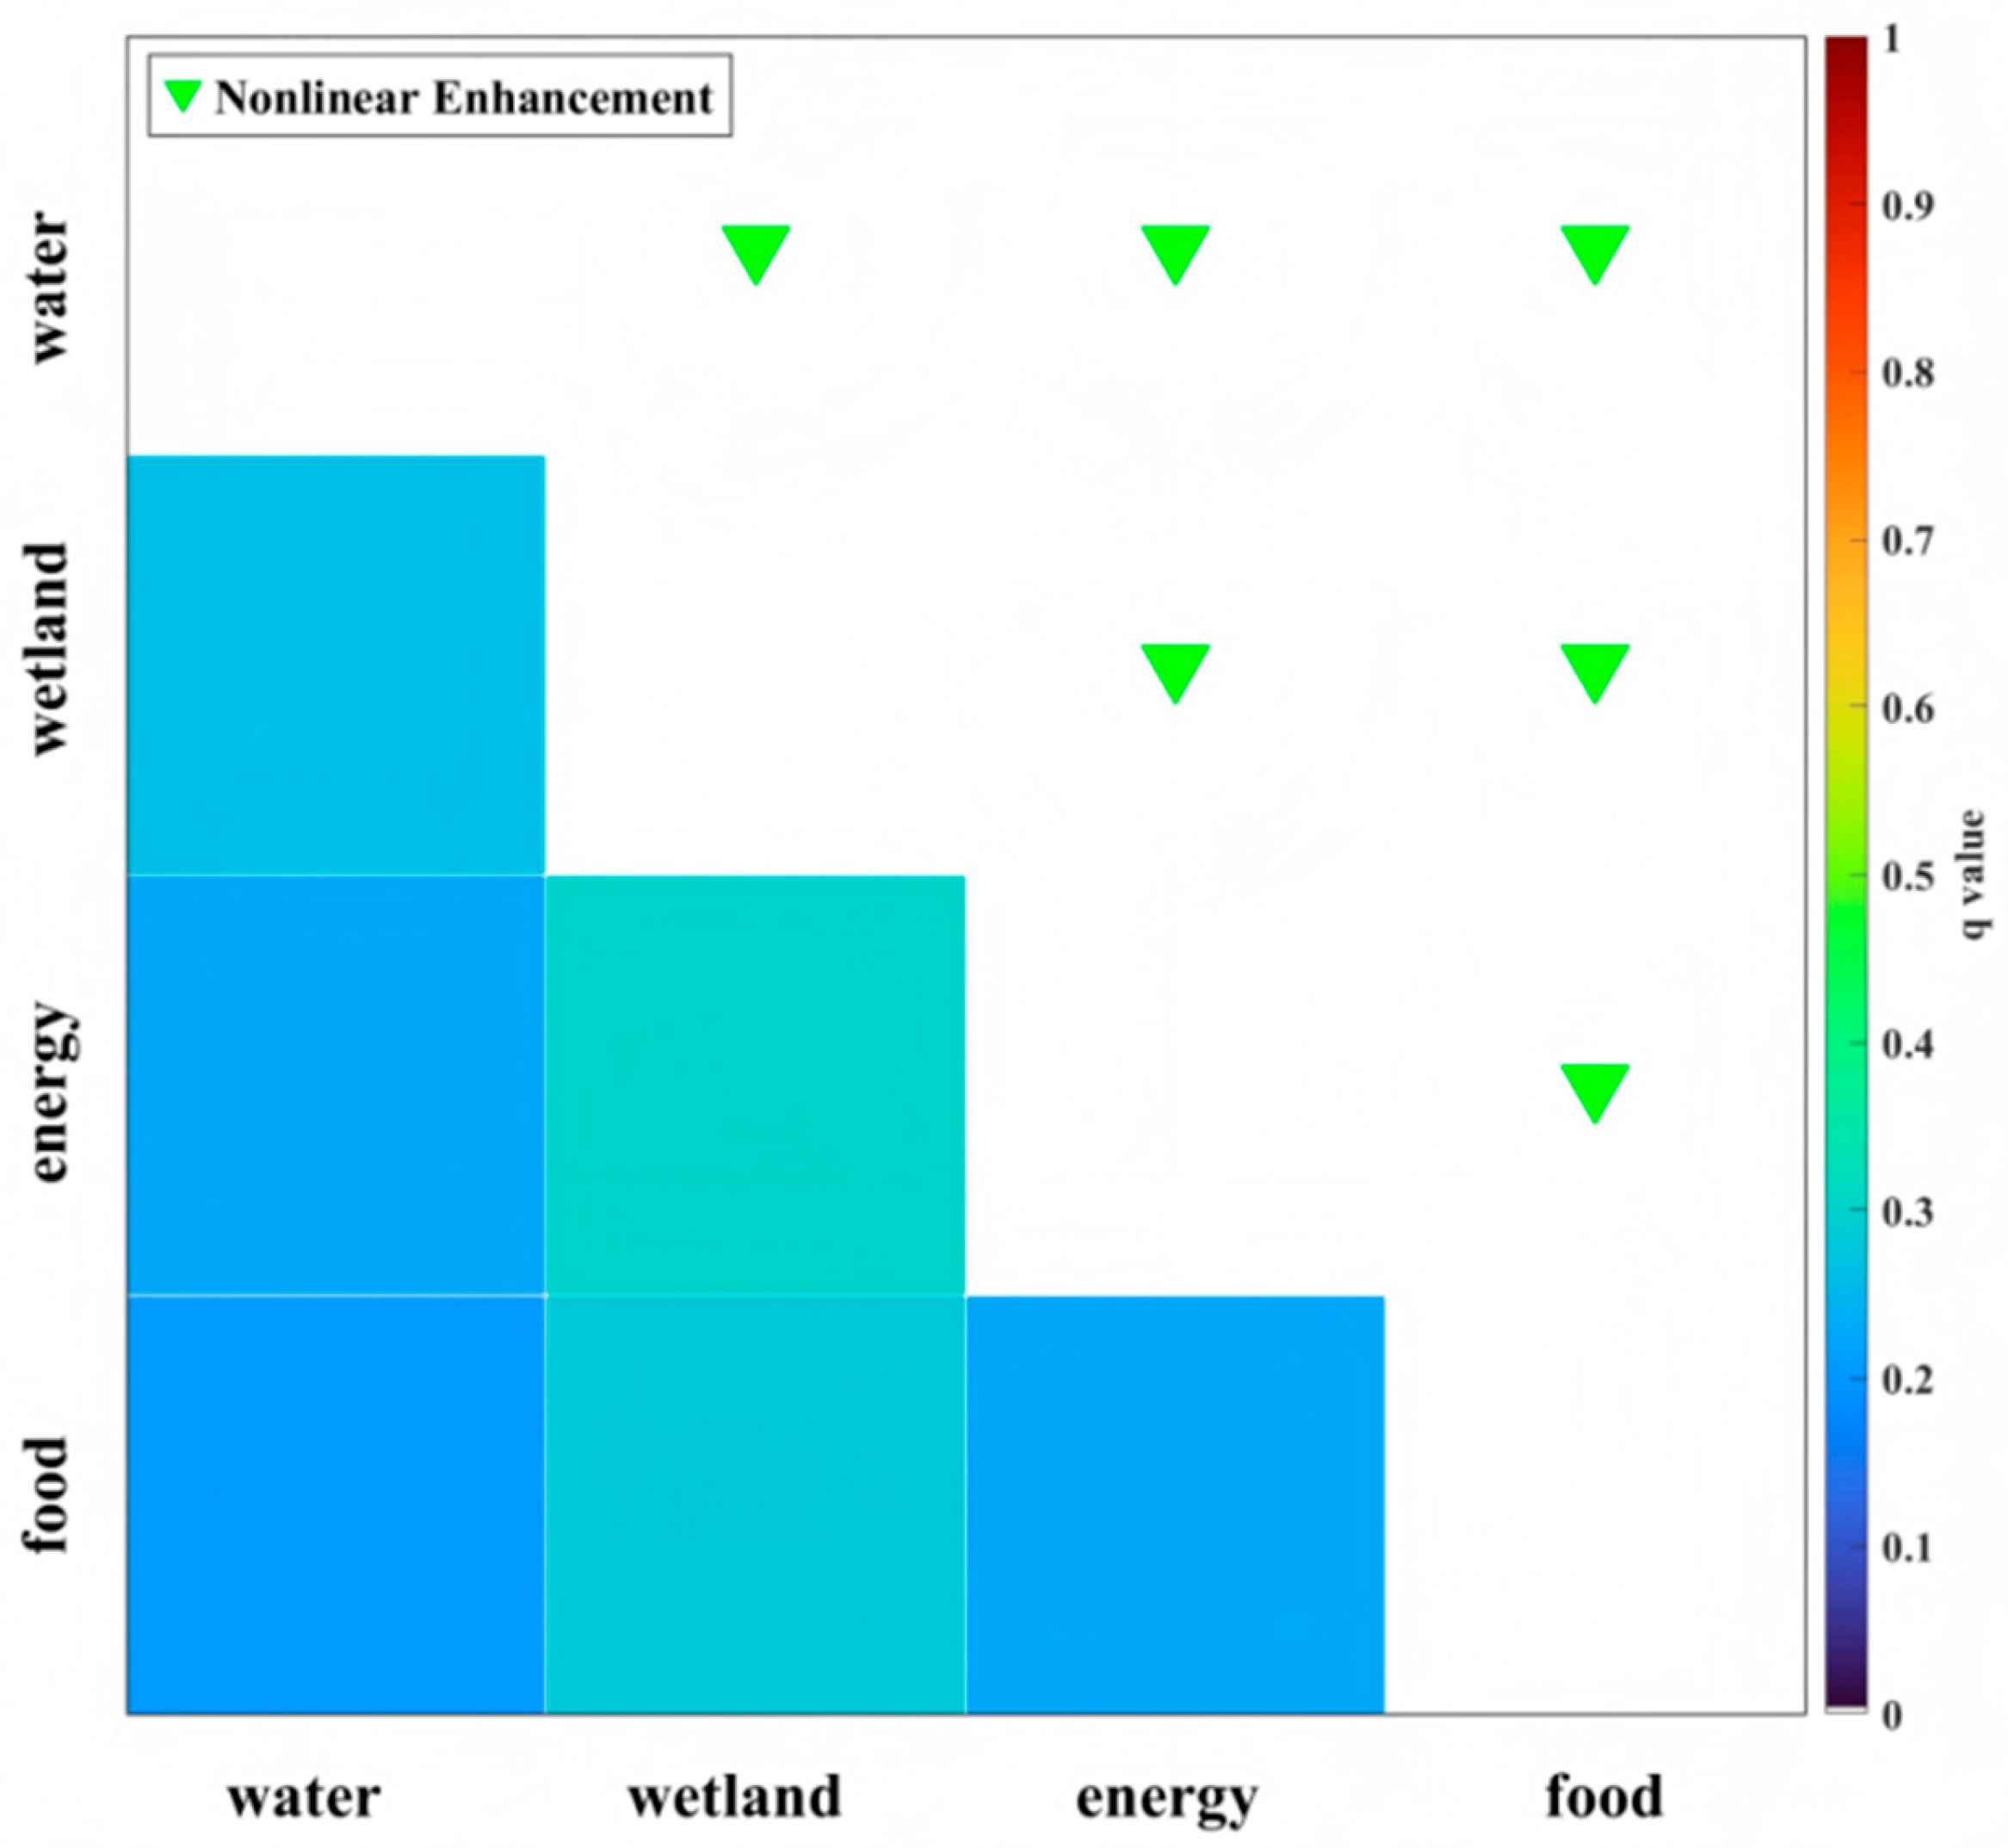
The interactive detector analysis revealed how the interactions among water resources, wetlands, energy, and food factors jointly affect the spatial differentiation of the CCD (Figure 8). The q-values and p-values quantified the explanatory power and statistical significance of the factor combinations for the spatial differentiation. From the results, it was found that the interactions of all factors on the CCD were nonlinearly enhanced, indicating that the interactions between the factors significantly improved the explanatory power for the spatial differentiation, and compared to single factors, the interaction of two factors had a significantly enhanced ability to explain the spatial differentiation of the WEFW system in Jiangxi Province.
Wetlands accounted for a large proportion in these interactions. The interaction between water resources and wetlands exhibited a wetland–water interaction increased q-value from 0.142 to 0.2653 (86.8% enhancement), with a q-value of 0.2653 and a p-value of 0.0010, indicating that the relationship between wetlands and water resources had a significant impact on the spatial differentiation of the CCD, and this effect was statistically significant. Additionally, the interaction between wetlands and energy also showed a strong nonlinear enhancement effect, with a q-value of 0.3018 and a p-value of 0.0060, further highlighting the importance of wetlands in energy utilization, especially the potential impact of wetlands on ecosystem services on energy production. Similarly, the interaction between wetlands and food also showed a significant nonlinear enhancement effect, with a q-value of 0.2844 and a p-value of 0.0010, indicating that the role of wetlands in food production is crucial, especially the influence of the water source and soil improvement functions provided by wetlands on food production.

3.4. Prediction Results of Coupled Coordination Based on GM (1,1) Model

The relative deviation of the grey model is an important indicator for evaluating the model’s accuracy. Based on the CCD intensity data of 11 prefecture-level cities in Jiangxi Province from 2002 to 2022, the results show that the relative deviation values of all cities were within the range of [0, 0.35], indicating that the GM (1,1) model had a model accuracy with an average relative residual of ≤0.02 (95% confidence interval) to the CCD of Jiangxi Province. This conclusion is based on predictive accuracy metrics: the absolute value of the annual average residual for each region ranged from 0.001 to 0.034 (far lower than the 5% error threshold usually required by the grey model), and the residual distribution was concentrated in the range of 0.001 to 0.020, fully verifying the model’s excellent fitting effect on the CCD sequence. The relative residual was the core indicator for evaluating the accuracy of the prediction model. The grey model had a good fitting effect on the urbanization rate of each region in Jiangxi Province. The absolute value of the annual average residual for each region ranged from 0.001 to 0.034, which is much lower than the 5% error threshold usually required by the grey model, and the residual distribution was concentrated in the range of 0.001 to 0.020, indicating that the model had an excellent fitting effect on the urbanization trend and the prediction results have high credibility.
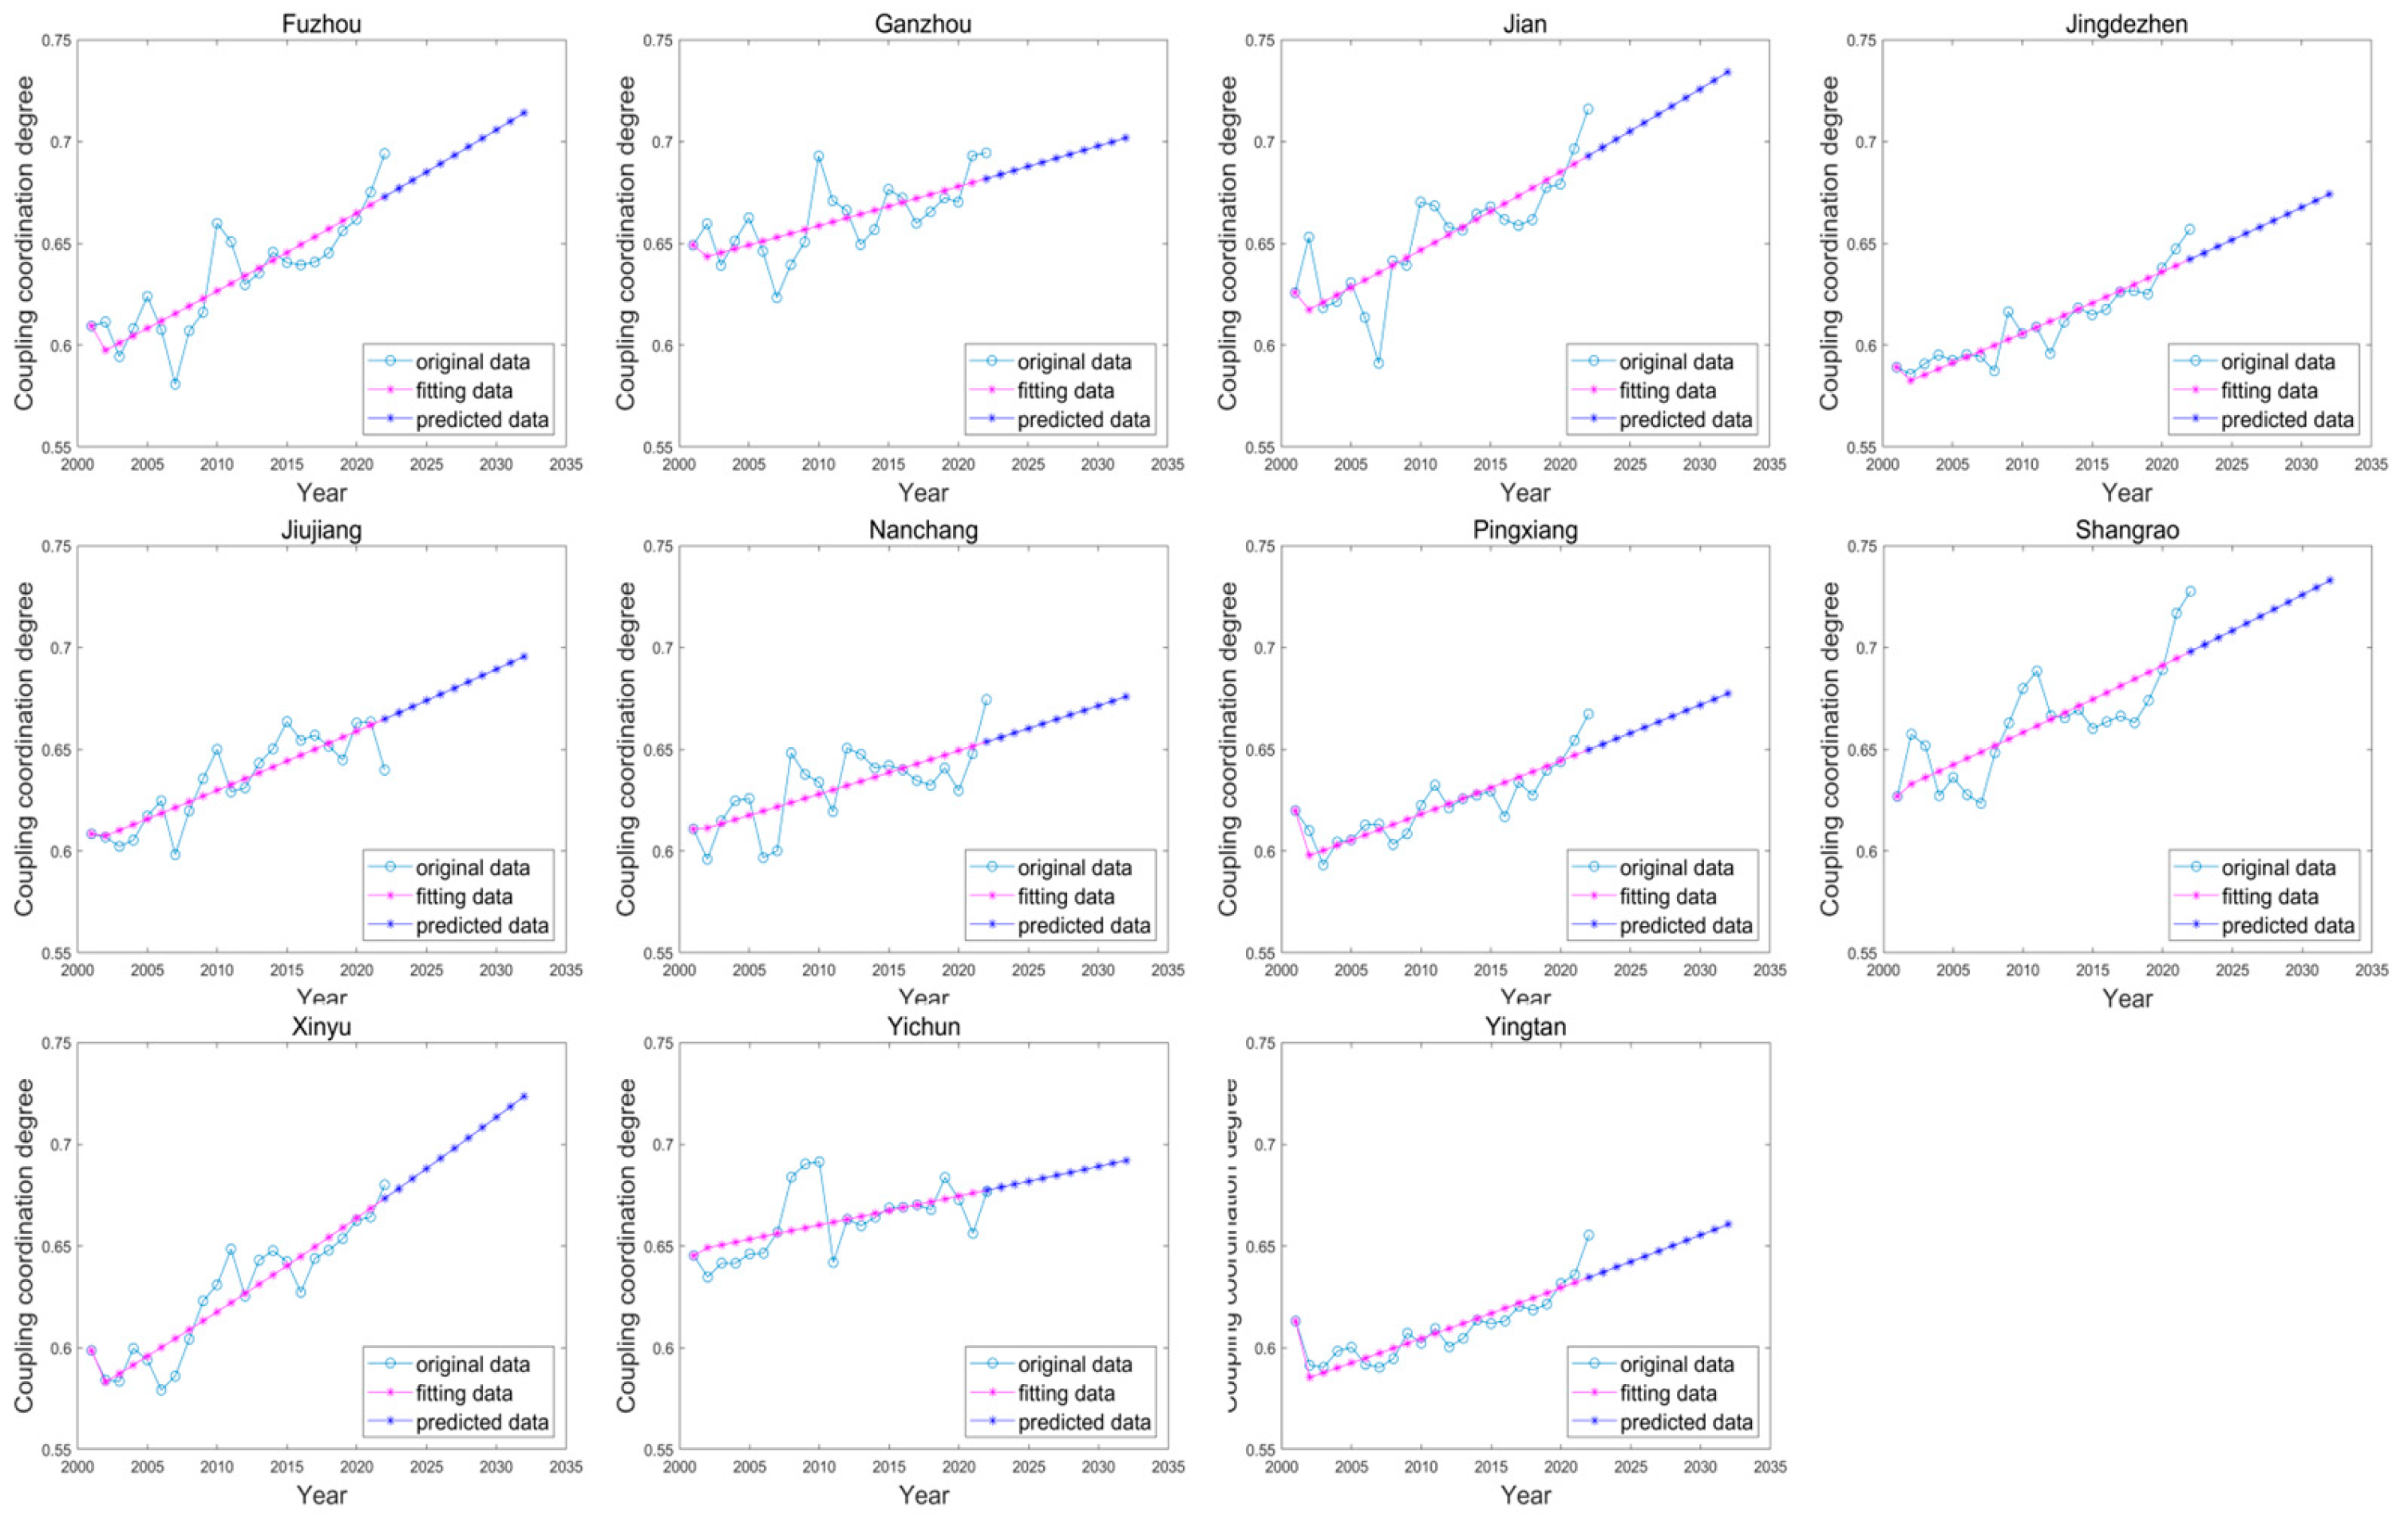
The predicted results of the WEFW CCD in Jiangxi Province from 2024 to 2032 are shown in Figure 9. To reflect prediction uncertainty, this study calculated the 95% prediction interval of the GM (1,1) model based on residual analysis: the average width of the error band for all cities was [−0.042, 0.038], with cities with stable historical trends having narrower bands ([−0.025, 0.021]) and cities with greater fluctuations having slightly wider bands ([−0.051, 0.047]). As a typical grey prediction model, GM (1,1) relies on the smoothness of input data series for long-term prediction accuracy—consistent with academic consensus, its long-term results are more sensitive to input data deviations, especially for indicators with high inter-annual volatility. In this study, input data (2001–2022) were derived from official statistical bulletins and ecological monitoring reports, which have undergone rigorous verification by local authorities. This indicates that predictions for stable regions are more reliable, while those for fluctuating regions require cautious interpretation.
In the test of the quasi-exponential law, data with a smooth ratio of less than 0.5 accounted for 95.2381% of the CCD results. Excluding the first two periods for indicator two, the data with a smooth ratio of less than 0.5 accounted for 100%. Therefore, the data in this example passed the test. In the results, the average relative residual was 0.0178, indicating that the model fit the original data very well. The average relative deviation was 0.0197, indicating that the model fit the original data very well.
The results show that, from 2022 to 2032, most cities’ indicators are predicted to show growth, reflecting an overall trend of economic development and social progress. However, the predicted growth rates of different cities vary, and some cities such as Fuzhou and Shangrao have relatively obvious predicted growth, while the predicted growth of some cities is relatively slow, indicating imbalance in economic development. From 2023 to 2032, the CCD of Fuzhou, Ganzhou, and Ji’an are expected show a stable growth trend. It is expected that by 2032, Fuzhou’s level will reach 0.71, and Ganzhou and Ji’an will be expected to reach 0.73. In contrast, the predicted CCDs of Jingdezhen and Yingtan show that Yingtan’s coordination degree growth rate (0.31%/year) will be 72% lower than Fuzhou’s (1.11%/year); although the values in 2023 were 0.65 and 0.64, they are expected to remain at the levels of 0.67 and 0.66 by 2032. The CCDs of Nanchang and Pingxiang will maintain a relatively stable level in the next 10 years, and they are expected to be 0.68 and 0.67, respectively, by 2032.

4. Optimization of Wetland Protection and Resource Management in Jiangxi Province Based on the Coupling and Coordination Development of WEFW Systems

The CCDs of WEFW systems in Jiangxi Province shows significant spatial and temporal variations (e.g., 0.674 in Nanchang and 0.579 in Jingdezhen in 2022). Wetlands play a crucial role in system synergy (q = 0.142, p < 0.01). Based on this study’s key findings—including wetlands’ dominant role in coupling coordination (q = 0.142) and the “stability-fluctuation-recovery” trend of coupling coordination degree (significant recovery after 2014)—we propose targeted optimization strategies:
1.
Strengthen wetland restoration and ecological barrier construction: Referencing the U.S.’s experience in market-oriented ecological compensation and India’s model of linking wetlands with eco-agriculture, Jiangxi could further explore market mechanisms to balance protection and resource utilization. Based on the economic value assessment of wetland ecological services, it is suggested that the wetland carbon sink be included in the provincial carbon trading market, and that a subsidy of 50–60 yuan per ton of CO2 is provided to the entities responsible for wetland restoration; at the same time, Jiangxi could establish a “microclimate regulation benefit compensation mechanism”, where the agricultural and energy enterprises that benefit contribute funds proportionally for wetland protection, for example, extracting special protection funds based on 5% of the lost income due to reduced farmland production and 3% of the energy enterprise’s energy-saving benefits, forming a “protection–benefit–feedback” virtuous cycle. Addressing the degradation of wetlands across the province, Jiangxi could implement re-wetland farming projects, with a focus on restoring degraded wetlands around Poyang Lake, construct native plant buffer zones such as reeds and bulrushes along the wetland edges to enhance water conservation capacity [69,70], and reduce the impact of agricultural non-point source pollution on wetland ecology.
2.
Promote coordinated utilization of WEFW: Promote the development of wetland biomass energy, build distributed biogas projects around cities such as Nanchang and Jiujiang, utilize waste such as reeds and algae to produce biogas, reduce reliance on fossil energy; in grain-producing areas such as Ganzhou and Ji’an, rely on wetlands to intercept agricultural non-point source pollution and reduce water treatment energy consumption and carbon emissions [71].
3.
Establish a dynamic monitoring and cross-departmental coordination mechanism: Establish a provincial wetland ecological monitoring network to track changes in wetland area, water quality, and carbon sink capacity in real time; establish a “water-energy-food-wetland” collaborative management office to integrate the functions of water conservancy, agriculture, and energy departments; formulate unified wetland protection and resource utilization plans; and conduct a WEFW system CCD assessment every three years and dynamically adjust policies.
4.
Improve ecological compensation and social participation: Promote the “wetland bank” model, encourage enterprises/individuals to obtain compensation such as carbon sink trading or water resource usage rights through wetland restoration [72], and enhance social participation; explore the realization path of wetland ecological product value, forming a “protection-revenue” virtuous cycle.
In summary, Jiangxi Province needs to take wetlands as the core link in their WEFW system and implement precise regional policies, cross-departmental collaborative governance, and dynamic monitoring assessment to promote the transformation of the WEFW system from “passive coordination” to “active coordination”, ultimately achieving a multi-objective balance of water security, energy decarbonization, and food stability.

5. Conclusions

This study evaluated the comprehensive performance and CCD of the WEFW system in Jiangxi Province from 2001 to 2022 and predicted development trends from 2022 to 2032. These analyses collectively reveal the spatiotemporal evolution of the WEFW system and the core role of wetlands, with key findings and contributions synthesized as follows:
  • From 2001 to 2022, the comprehensive evaluation of the WEFW systems in all cities of Jiangxi Province showed an overall upward trend, with significant improvements in Fuzhou, Yichun, Ganzhou, and Ji’an (e.g., Ji’an’s evaluation value rose from 0.518 in 2018 to 0.563 in 2022). However, regional development was unbalanced: large and medium-sized cities such as Nanchang and Jiujiang maintained a high level for a long time, while cities like Jingdezhen and Xinyu had lower evaluation values.
  • The CCDs of wetlands with water, energy, and food experienced a process of “stability-fluctuation-recovery”. They significantly recovered after 2014, with distinct spatial differentiation characteristics: the coordination degree in Nanchang and Jiujiang remained stable in the high-quality category (>0.75); in Ganzhou and Pingxiang, it fluctuated sharply (0.55–0.70); in Shangrao and Yichun, it increased to the good category (0.65–0.75).
  • Wetlands were the dominant factor in the spatial differentiation of CCD, with a contribution significantly higher than other subsystems. Mantel test and geographical detector analysis showed that wetlands had a strong explanatory power for the CCD; their interaction with water resources exhibited a strong nonlinear enhancement effect (highlighting the key role of wetlands in water resource management), and their interactions with energy and food were also significant. This further proves the importance of wetlands in ecosystem services and agricultural production and emphasizes the significance of wetland protection for the coordinated development of WEF.
  • Predictions indicate that the CCD of the WEFW system in Jiangxi Province will rise steadily from 2022 to 2032, with significant growth in Fuzhou, Ganzhou, and Ji’an (the coordination degree is expected to reach 0.71 and 0.73, respectively, in 2032). However, growth in Jingdezhen, Yingtan, and other cities are expected to lag behind, while that in Nanchang and Pingxiang is expected to stabilize.
Despite contributions, this study has limitations: 1. The GM (1,1) prediction model simplifies system dynamics and cannot fully simulate extreme external shocks. 2. Evidence for wetlands as “dominant drivers” of the WEFW system’s coupling coordination degree is only based on statistical associations, with no process-based model to explain their regulatory causal pathways (e.g., wetland landscape patterns’ impact on water cycles and ecological functions’ mediation of water–energy use trade-offs, both requiring mechanism-based analysis). 3. The study focuses on the provincial scale, with micro-scale mechanisms yet to be explored. Future work can focus on three aspects: 1. Combine longer time-series data with system dynamics (SD) models to simulate complex feedback loops in the WEFW system. 2. Downscale to the watershed/municipal levels to explore micro-level interaction mechanisms. 3. Integrate more external factors to enhance prediction comprehensiveness.

Author Contributions

Z.M.: data curation, methodology, writing—original draft, and writing—review and editing. L.X.: supervision, funding acquisition, and project administration. J.C.: supervision, funding acquisition, resources, conceptualization, project administration, and writing—review and editing. M.J.: methodology, visualization, and writing—review and editing. J.W.: formal analysis. All authors have read and agreed to the published version of the manuscript.

Funding

This work was supported by the National Key R&D Program of China (2023YFF0807204, 2024YFE0106400), National Natural Science Foundation of China (U2444221, U2240224), China Postdoctoral Science Foundation (2024M751237), Science and Technology Planning Project of NIGLAS (NIGLAS2022TJ13; NIGLAS2022GS09), Jiangxi Provincial Science and Technology Planning Project (20223AEI91008, 20244BCF61001, 20252BAC230006, 20243BBH81035; S20257056), and Science and Technology Plan Project of Jilin Province (2025SYHZ0021).

Data Availability Statement

Data will be made available on request.

Acknowledgments

We would like to thank Lei Sheng from the Poyang Lake Water Control Project Construction Office of Jiangxi Province for his valuable contributions to this article. His professional support and assistance have been instrumental in refining this work.

Conflicts of Interest

The authors declare no conflicts of interest.

Abbreviations

The following abbreviations are used in this manuscript:
WEFWWater-Energy-Food-Wetland
WEFWater-Energy-Food
CCDCoupling Coordination Degree
GM(1,1)Grey model

Appendix A. Weights Calculated by Entropy-CRITIC Method

The CRITIC (Criteria Importance Through Intercriteria Correlation) method can measure the objective weight of an indicator based on the variability of the indicator and the correlation between the indicators [73]. However, the traditional CRITIC method fails to reflect the discreteness of the indicator. To make up for this defect, entropy can be introduced into it [74]. The calculation steps of improved CRITIC are as follows:
a. Standardization
Positive indicator:
x i j = x i j x j m i n x j m a x x j m i n
Negative indicator:
x i j = x j m a x x i j x j m a x x j m i n
where x j m i n and x j m a x are the minimum and maximum of the jth indicator.
b. Calculation of the variance S j , conflict R j , and entropy redundancy dj:
S j = i = 1 n ( x i j x ¯ j ) 2 n 1
R i = j = 1 m ( 1 r i j ) ( i j )
d j = 1 + 1 ln n i = 1 n x i j i = 1 n x i j ln x i j i = 1 n x i j
where x ¯ j is the mean of the jth indicator, S j is the standard deviation of the jth indicator, and r i j is the correlation coefficient between indicators.
c. Calculation of the weights
W j = ( S j + d j ) / 2 × R j j = 1 m ( S j + d j ) / 2 × R j
The weight results obtained by combining the entropy weight method and the CRITIC method are shown in Table A1.
Table A1. WEFW indicator system weight results.
System LayerCriterion LayerIndicator LayerWeight
Water Resources SubsystemTotal water resources and their sourcesTotal water resources0.0359
Precipitation0.0384
Artificial ecological environment replenishment volume0.0416
Water usage structure and consumptionIndustrial water consumption0.0359
Urban public water consumption0.0419
Residential water consumption wastewater treatment rate0.0448
Water resource utilization efficiency and managementWater resource development utilization rate0.0306
Total energy consumption0.0371
Energy subsystemTotal energy and growth rateAverage annual growth rate of energy consumption0.0365
Energy consumption per unit of GDP0.0221
Energy efficiency and development elasticityEnergy consumption elasticity coefficient0.0164
Total grain output0.0113
Energy subsystemFood availabilityPer capita grain output0.0515
Grain unit output0.0727
Grain sown area0.0370
Agricultural water consumption0.0458
Effective utilization coefficient of irrigation water in farmland0.0448
Food sustainabilityRural residents’ consumption expenditure0.0400
Rural residents’ disposable income0.0451
Natural population growth rate0.0478
Density of wetland patches0.0382
Wetland subsystemFood sustainabilityWetland aggregation index0.0323
Total wetland area0.0181
Wetland landscape shape index0.0520
Patch connectivity index0.0361
Ecological functions and diversity characteristicsShannon diversity index0.0164
Total water resources0.0296

Appendix B. The GRA-TOPSIS Model

A. Construct the weighted normalization matrix
Y = (yij)m × n = [wj × xij]m × n
B. Calculate the positive ideal solution Y+ and the negative ideal solution Y−
Y j + = m a x ( y 1 j , y 2 j , , y m j )
Y j = m i n ( y 1 j , y 2 j , , y m j )
where Y j + and Y j is the positive and negative optimal solution.
C. Calculate the Euclidean matrix
d i + = j = 1 n ( Y j + y i j ) 2
d i = j = 1 n ( y i j Y j ) 2
Among them, d i + is the distance between the weighted normalized index values of all indicators in the i-th year and the positive optimal solution. The smaller this value is, the closer the evaluated object is to the positive optimal solution. d i is the distance between the weighted normalized index values of all indicators in the i-th year and the negative optimal solution. The smaller this value is, the closer the evaluated object is to the negative optimal solution.
D. Calculate the grey correlation coefficient between each evaluation object and the optimal solution (whether it is the optimal positive solution or the optimal negative solution).
r i + = 1 n j = 1 n min i   min j z j + + z i j + ρ   max i   max j z j + + z i j z j + + z i j + ρ   max i   max j z j + + z i j
r i = 1 n j = 1 n min i   min j z j z i j + ρ   max i   max j z j z i j z j z i j + ρ   max i   max j z j z i j
where r i + and r i are the grey correlation grades between the weighted normalized indicator value of all indicators and the positive and negative optimal solution in the i t h year. The large the value is, the closer the evaluation object is to the positive or the negative optimal solution. ρ is the resolution coefficient, ρ ( 0 , 1 ) , ρ = 0.5 in this study.
Step 5. Dimensionless processing of Euclidean distance and grey correlation grade.
φ i = ϕ i max ϕ i
where ϕ i is the Euclidean distance d i + , d i + and the grey correlation grade r i + , r i , and φ i is the dimensionless Euclidean distance D i + , D i and the grey correlation grade R i + , R i .
E. Calculating the relative closeness degree, the calculation formula of the comprehensive evaluation index T of the W-E-F-W system is:
T = α 1 D i + α 2 R i + α 1 ( D i + + D i ) + α 2 ( R i + + R i )
where T is the relative proximity degree based on the Euclidean distance and grey relational grade; the greater T is, the stronger the WRCC of the year. α 1 and α 2 are the weight coefficients; α 1 + α 2 = 1 , α 1 = 0.6 and α 2 = 0.4 in this study.

Appendix C. Grey Model

Let x ( 0 ) = { x ( 0 ) ( 1 ) , x ( 0 ) ( 2 ) , , x ( 0 ) ( n ) , } be the initial non-negative data sequence. We can accumulate it to obtain a new data sequence x(1). Using the expression of an exponential curve to approximate the sequence x(1) allows us to construct a first-order ordinary differential equation to solve for the function expression of the fitted exponential curve:
d x ( 1 ) d t + a x ( 1 ) = u
To obtain the expression of x(1), we need to solve the ordinary differential equation. Therefore, we must first know the parameters a and u. Then the differential equation becomes
x ( 0 ) ( t ) + a x ( 1 ) ( t ) = u
The above equation is a common linear equation with one variable. To eliminate the randomness of the data, the following definition is made:
z ( 1 ) = z ( 1 ) ( 1 ) , z ( 1 ) ( 2 ) , , z ( 1 ) ( n )
z 1 m = δ x 1 m + 1 δ x 1 m 1 , m = 2,3 , , n
And δ = 0.5, which represents the average value of the two consecutive time points. Then the differential equation is changed to
x ( 0 ) ( t ) = a z ( 1 ) ( t ) + u
We have the data of x ( 0 ) ( t ) and z ( 1 ) ( t ) . By applying knowledge of linear programming, we can either use linear programming or the least squares method to solve for the parameters.
Representing differential equations using matrices:
Y = X β + ε
Solve using the least squares method. The least squares method solves by minimizing the sum of the squared differences between the observed values of the dependent variable and the estimated values, that is,
m i n Q = ( x ( 0 ) x ^ ( 0 ) ) 2
x ^ ( 1 ) ( m + 1 ) = x ( 0 ) ( 1 ) b a ^ e a ^ m + b a ^ , 1,2 , , n 1
When m takes the values 0, 1, …, 9, the obtained x ^ ( 0 ) represents the fitted value. If the fitted value is greater than 9, it represents the predicted value.

References

  1. Farmandeh, E.; Choobchian, S.; Karami, S. Conducting water-energy-food nexus studies: What, why, and how. Sci. Rep. 2024, 14, 27310. [Google Scholar] [CrossRef] [PubMed]
  2. Barman, B.; Roy, R. Socio-economic Determinants of Rural Out-migration in Koch Bihar District of West Bengal, India. In Population, Sanitation and Health: A Geographical Study Towards Sustainability; Alam, A., Rukhsana, Islam, N., Sarkar, B., Roy, R., Eds.; Springer Nature: Cham, Switzerland, 2023; pp. 47–68. [Google Scholar]
  3. Li, C.; Liu, Y.; Xu, Z.; Zhao, G.; Bao, Y.; Cai, C.; Lu, Y.; Mao, Y.; Wang, A.B.; Wu, L. Impacts and influencing pathways of urbanization on carbon–water-energy-food nexus across Chinese cities. Environ. Dev. Sustain. 2024, 1–27. [Google Scholar] [CrossRef]
  4. Hou, Y.; Zhao, G.; Liu, Y.; Li, X. Spatial adaptation patterns and coordinated development of water-energy-food complex system in the yellow river basin. Sci. Rep. 2024, 14, 31241. [Google Scholar] [CrossRef]
  5. Wei, Y.; Feng, T.; Teng, Y.; Ren, H.; Chen, Y.; Fan, X. Research on the Optimization of Regional Sustainable Industrial Structure Considering Water-Energy-Food-Land-Carbon Constraints. Int. J. Environ. Res. 2024, 19, 56. [Google Scholar] [CrossRef]
  6. Chen, A.; Hao, Z.; Wang, R.; Zhao, H.; Hao, J.; Xu, R.; Duan, H. Cultivated Land Sustainable Use Evaluation from the Perspective of the Water–Land–Energy–Food Nexus: A Case Study of the Major Grain-Producing Regions in Quzhou, China. Agronomy 2023, 13, 2362. [Google Scholar] [CrossRef]
  7. Chaher, N.E.H.; Nassour, A.; Nelles, M. The (FWE)2 nexus: Bridging food, food waste, water, energy, and ecosystems for circular systems and sustainable development. Trends Food Sci. Technol. 2024, 154, 104788. [Google Scholar] [CrossRef]
  8. Zhang, L.; Kong, L.; Ji, X.; Ren, Y.; Lin, C.; Lu, Z. Developing a quantitative framework for watershed sustainable development: The ecology-water energy food (E-WEF) approach. Ecol. Indic. 2025, 172, 113291. [Google Scholar] [CrossRef]
  9. Yuan, W.Q.; Wang, H.X.; Guo, W.X. Supply–Demand Synergy Assessment of the Water–Energy–Food Nexus in the Hanjiang River Basin Under Future Land Scenarios. Ecohydrology 2025, 18, e2762. [Google Scholar] [CrossRef]
  10. Hao, L.; Wang, P.; Yu, J.; Ruan, H. An integrative analytical framework of water-energy-food security for sustainable development at the country scale: A case study of five Central Asian countries. J. Hydrol. 2022, 607, 127530. [Google Scholar] [CrossRef]
  11. Dias, I.Y.P.; Lazaro, L.L.B.; Castro, M.P.B.d.; Dagios, R.N.; Barros, V.G. Watersheds Governance Optimizing Water-Energy-Food Nexus Approach Across Water Users and Watershed Scales. Water Resour. Manag. 2024, 39, 705–723. [Google Scholar] [CrossRef]
  12. Tye, M.R.; Wilhelmi, O.; Boehnert, J.; Faye, E.; Milestad, R.; Pierce, A.L.; Laborgne, P. Examining urban resilience through a food-water-energy nexus lens to understand the effects of climate change. iScience 2024, 27, 110311. [Google Scholar] [CrossRef]
  13. Kundu, S.; Kundu, B.; Rana, N.K.; Mahato, S. Wetland degradation and its impacts on livelihoods and sustainable development goals: An overview. Sustain. Prod. Consum. 2024, 48, 419–434. [Google Scholar] [CrossRef]
  14. Hoffman, R.Z.; Susanne, S. Global Wetland Governance: Introducing the Transboundary Wetlands Database. Water 2022, 14, 3077. [Google Scholar] [CrossRef]
  15. Xue, Z.; Zou, Y.; Zhang, Z.; Lyu, X.; Jiang, M.; Wu, H.; Liu, X.; Tong, S. Reconstruction and Future Prediction of the Distribution of Wetlands in China. Earth’s Future 2018, 6, 1508–1517. [Google Scholar] [CrossRef]
  16. Qin, J.; Ye, H.; Lin, K.; Qi, S.; Hu, B.; Luo, J. Assessment of water-related ecosystem services based on multi-scenario land use changes: Focusing on the Poyang Lake Basin of southern China. Ecol. Indic. 2024, 158, 111549. [Google Scholar] [CrossRef]
  17. Wang, Y.; Molinos, J.G.; Shi, L.; Zhang, M.; Wu, Z.; Zhang, H.; Xu, J. Drivers and Changes of the Poyang Lake Wetland Ecosystem. Wetlands 2019, 39, 35–44. [Google Scholar] [CrossRef]
  18. Meng, J.-N.; Fang, H.; Huang, L.; He, G.; Liu, X.; Xu, C.; Wu, X.; Scavia, D. Multidimensional ecosystem assessment of Poyang Lake under anthropogenic influences. Ecol. Model. 2022, 473, 110134. [Google Scholar] [CrossRef]
  19. Junk, W.J.; An, S.; Finlayson, C.M.; Gopal, B.; Květ, J.; Mitchell, S.A.; Mitsch, W.J.; Robarts, R.D. Current state of knowledge regarding the world’s wetlands and their future under global climate change: A synthesis. Aquat. Sci. 2013, 75, 151–167. [Google Scholar]
  20. Dick, J.J.; Tetzlaff, D.; Soulsby, C. Role of riparian wetlands and hydrological connectivity in the dynamics of stream thermal regimes. Hydrol. Res. 2018, 49, 634–647. [Google Scholar]
  21. Koushal, S.; Giri, A.; Anbarasan, S.; Parmar, A.; Rahman, T.; Singh, B.; Akram, C.M.; Kambale, J.B. Enhancing Water Productivity under Climate Change Scenarios: Indian Perspective. Int. J. Environ. Clim. Change 2024, 14, 929–940. [Google Scholar] [CrossRef]
  22. Eric, A.; Chrystal, M.-P.; Erik, A.; Kenneth, B.; Robert, C. Evaluating ecosystem services for agricultural wetlands: A systematic review and meta-analysis. Wetl. Ecol. Manag. 2022, 30, 1129–1149. [Google Scholar] [CrossRef]
  23. Wu, X.; Bu, X.; Dong, S.; Ma, Y.; Ma, Y.; Ma, Y.; Liu, Y.; Wang, H.; Wang, X.; Wang, J. The Impact of Restoration and Protection Based on Sustainable Development Goals on Urban Wetland Health: A Case of Yinchuan Plain Urban Wetland Ecosystem, Ningxia, China. Sustainability 2023, 15, 12287. [Google Scholar] [CrossRef]
  24. Peng, H.; Xia, H.; Shi, Q.; Tang, Z.; Chen, H. Monitoring of wetland cover changes in protected areas to trade-offs between ecological conservation and food security: A case study from the Dongting Lake, China. Ecol. Inform. 2023, 78, 102338. [Google Scholar] [CrossRef]
  25. Ding, J.; Deng, M. Coupling coordination analysis of water-energy-food-ecology in the Yangtze River Delta. Water Supply 2022, 22, 7272–7280. [Google Scholar] [CrossRef]
  26. Wang, X.; Bai, X.; Ma, L.; He, C.; Jiang, H.; Sheng, L.; Luo, W. Snow depths’ impact on soil microbial activities and carbon dioxide fluxes from a temperate wetland in Northeast China. Sci. Rep. 2020, 10, 8709. [Google Scholar] [CrossRef]
  27. Sun, C.; König, H.J.; Uthes, S.; Chen, C.; Li, P.; Hemminger, K. Protection effect of overwintering water bird habitat and defining the conservation priority area in Poyang Lake wetland, China. Environ. Res. Lett. 2020, 15, 125013. [Google Scholar] [CrossRef]
  28. Butt, M.A.; Zafar, M.; Ahmed, M.; Shaheen, S.; Sultana, S. Wetland and Wetland Plants. In Wetland Plants: A Source of Nutrition and Ethno-Medicines; Butt, M.A., Zafar, M., Ahmed, M., Shaheen, S., Sultana, S., Eds.; Springer International Publishing: Cham, Switzerland, 2021; pp. 1–15. [Google Scholar]
  29. Wei, X.; Khachatryan, H.; Zhu, H. Poyang lake wetlands restoration in China: An analysis of farmers’ perceptions and willingness to participate. J. Clean. Prod. 2021, 284, 125001. [Google Scholar] [CrossRef]
  30. Han, X.; Feng, L.; Hu, C.; Chen, X. Wetland changes of China’s largest freshwater lake and their linkage with the Three Gorges Dam. Remote Sens. Environ. 2018, 204, 799–811. [Google Scholar] [CrossRef]
  31. Mei, X.; Dai, Z.; Fagherazzi, S.; Chen, J. Dramatic variations in emergent wetland area in China’s largest freshwater lake, Poyang Lake. Adv. Water Resour. 2016, 96, 1–10. [Google Scholar] [CrossRef]
  32. He, J.; Wang, Z. Research on Protective Development of Wetland Ecological Resources in Poyang Lake. IOP Conf. Ser. Earth Environ. Sci. 2021, 651, 032048. [Google Scholar] [CrossRef]
  33. Audréanne, L.; Raphaël, P.; Marie, L.; Stéphanie, P. Synergies and trade-offs among ecosystems functions and services for three types of lake-edge wetlands. Ecol. Indic. 2023, 154, 110547. [Google Scholar]
  34. Liu, S.; Che, L.; Wan, L.; Zhang, W.; Chen, J. Wetland types and soil properties shape microbial communities in permafrost-degraded swamps. Catena 2025, 249, 108666. [Google Scholar] [CrossRef]
  35. Jiang, W.; Wang, W.; Chen, Y.; Liu, J.; Yang, Y. Quantifying driving forces of urban wetlands change in Beijing City. J. Geogr. Sci. 2012, 22, 301–314. [Google Scholar] [CrossRef]
  36. Zeng, X.; Zhang, H.; Zhou, B.; Liang, X.; Cui, L.; Li, H.; Qu, Y.; Luo, C. Hydrological dynamics and its impact on wetland ecological functions in the Sanjiang Plain, China. Ecol. Indic. 2024, 169, 112878. [Google Scholar] [CrossRef]
  37. Dong, Y.; Kuang, W.; Ren, Z.; Dou, Y.; Deng, X. Green or grain? Impact of green space expansion on grain production in Chinese cities and its implications for national urban greening schemes. Landsc. Ecol. 2024, 39, 117. [Google Scholar] [CrossRef]
  38. Xu, X.; Chen, M.; Yang, G.; Jiang, B.; Zhang, J. Wetland ecosystem services research: A critical review. Glob. Ecol. Conserv. 2020, 22, e01027. [Google Scholar] [CrossRef]
  39. Yuan, M.-H.; Lo, S.-L. Ecosystem services and sustainable development: Perspectives from the food-energy-water Nexus. Ecosyst. Serv. 2020, 46, 101217. [Google Scholar] [CrossRef]
  40. Barbier, E.B. Chapter 27-The Value of Coastal Wetland Ecosystem Services. In Coastal Wetlands, 2nd ed.; Perillo, G.M.E., Wolanski, E., Cahoon, D.R., Hopkinson, C.S., Eds.; Elsevier: Amsterdam, The Netherlands, 2019; pp. 947–964. [Google Scholar]
  41. Liu, D.; Wu, X.; Chang, J.; Gu, B.; Min, Y.; Ge, Y.; Shi, Y.; Xue, H.; Peng, C.; Wu, J. Constructed wetlands as biofuel production systems. Nat. Clim. Change 2012, 2, 190–194. [Google Scholar] [CrossRef]
  42. van Dam, A.A.; Fennessy, M.S.; Finlayson, C.M. 11-What’s driving wetland loss and degradation? In Ramsar Wetlands; Gell, P.A., Davidson, N.C., Finlayson, C.M., Eds.; Elsevier: Amsterdam, The Netherlands, 2023; pp. 259–306. [Google Scholar]
  43. Li, M.; Cao, X.; Liu, D.; Fu, Q.; Li, T.; Shang, R. Sustainable management of agricultural water and land resources under changing climate and socio-economic conditions: A multi-dimensional optimization approach. Agric. Water Manag. 2022, 259, 107235. [Google Scholar] [CrossRef]
  44. Jägermeyr, J.; Pastor, A.; Biemans, H.; Gerten, D. Reconciling irrigated food production with environmental flows for Sustainable Development Goals implementation. Nat. Commun. 2017, 8, 15900. [Google Scholar] [CrossRef]
  45. Wang, Y.; Hu, J.; Pan, H.; Qin, Q. Water–energy nexus: The coupling effects of water and energy policy applied in China based on a computable general equilibrium model. J. Clean. Prod. 2023, 423, 138647. [Google Scholar] [CrossRef]
  46. Siri, R.; Mondal, S.R.; Das, S. Hydropower: A Renewable Energy Resource for Sustainability in Terms of Climate Change and Environmental Protection. In Alternative Energy Resources: The Way to a Sustainable Modern Society; Pathak, P., Srivastava, R.R., Eds.; Springer International Publishing: Cham, Switzerland, 2021; pp. 93–113. [Google Scholar]
  47. van Dijk, M.; Morley, T.; Rau, M.L.; Saghai, Y. A meta-analysis of projected global food demand and population at risk of hunger for the period 2010–2050. Nat. Food 2021, 2, 494–501. [Google Scholar] [CrossRef]
  48. Schramski, J.R.; Woodson, C.B.; Brown, J.H. Energy use and the sustainability of intensifying food production. Nat. Sustain. 2020, 3, 257–259. [Google Scholar] [CrossRef]
  49. Yang, J.; Huang, X. The 30 m annual land cover dataset and its dynamics in China from 1990 to 2019. Earth Syst. Sci. Data 2021, 13, 3907–3925. [Google Scholar] [CrossRef]
  50. Mundetia, N.; Sharma, D.; Sharma, A. Groundwater sustainability assessment under climate change scenarios using integrated modelling approach and multi-criteria decision method. Ecol. Model. 2023, 487, 110544. [Google Scholar] [CrossRef]
  51. Liu, M.; Zhao, Q.; Lang, Z.; Du, X.; Wu, J.; Meng, X. An integrated assessment system for regional carbon emissions: Insights into China’s sustainable development. Energy 2025, 317, 134693. [Google Scholar] [CrossRef]
  52. Albrecht, T.R.; Crootof, A.; Scott, C.A. The Water-Energy-Food Nexus: A systematic review of methods for nexus assessment. Environ. Res. Lett. 2018, 13, 043002. [Google Scholar] [CrossRef]
  53. Abootalebi, S.; Hadi-Vencheh, A.; Jamshidi, A. Ranking the Alternatives With a Modified TOPSIS Method in Multiple Attribute Decision Making Problems. IEEE Trans. Eng. Manag. 2022, 69, 1800–1805. [Google Scholar] [CrossRef]
  54. Qian, X.-Y.; Liang, Q.-M. Sustainability evaluation of the provincial water-energy-food nexus in China: Evolutions, obstacles, and response strategies. Sustain. Cities Soc. 2021, 75, 103332. [Google Scholar] [CrossRef]
  55. Lv, Y.; Yan, S.; Lai, X.; Li, Y. Dynamic modeling of the water-energy-food-carbon nexus: Scenario analysis and security assessment in Sichuan Province, China. J. Clean. Prod. 2025, 502, 145370. [Google Scholar] [CrossRef]
  56. Rane, N.L.; Achari, A.; Choudhary, S.P.; Mallick, S.K.; Pande, C.B.; Srivastava, A.; Moharir, K.N. A decision framework for potential dam site selection using GIS, MIF and TOPSIS in Ulhas river basin, India. J. Clean. Prod. 2023, 423, 138890. [Google Scholar] [CrossRef]
  57. Dai, J.; Qi, J.; Chi, J.; Chen, S.; Yang, J.; Ju, L.; Chen, B. Integrated water resource security evaluation of Beijing based on GRA and TOPSIS. Front. Earth Sci. China 2010, 4, 357–362. [Google Scholar] [CrossRef]
  58. Chen, Y.; He, Z.; Niu, X.; Huang, D. How water resource management policies shape the coupled coordination development of the water-energy-food nexus: Evidence from the dual pathways of taxation and property rights. J. Environ. Manag. 2025, 381, 125311. [Google Scholar] [CrossRef] [PubMed]
  59. Xiang, M.; Li, Y.; Yang, J.; Lei, K.; Li, Y.; Li, F.; Zheng, D.; Fang, X.; Cao, Y. Heavy metal contamination risk assessment and correlation analysis of heavy metal contents in soil and crops. Environ. Pollut. 2021, 278, 116911. [Google Scholar] [CrossRef] [PubMed]
  60. Wang, X.; Dong, X.; Liu, H.; Wei, H.; Fan, W.; Lu, N.; Xu, Z.; Ren, J.; Xing, K. Linking land use change, ecosystem services and human well-being: A case study of the Manas River Basin of Xinjiang, China. Ecosyst. Serv. 2017, 27, 113–123. [Google Scholar] [CrossRef]
  61. Zhen, J.; Guo, Y.; Wang, Y.; Li, Y.; Shen, Y. Spatial-temporal evolution and driving factors of water-energy-food-ecology coordinated development in the Tarim River Basin. J. Hydrol. Reg. Stud. 2025, 58, 102288. [Google Scholar] [CrossRef]
  62. Li, M.; Abuduwaili, J.; Liu, W.; Feng, S.; Saparov, G.; Ma, L. Application of geographical detector and geographically weighted regression for assessing landscape ecological risk in the Irtysh River Basin, Central Asia. Ecol. Indic. 2024, 158, 111540. [Google Scholar] [CrossRef]
  63. Lin, J.; He, S.; Liu, X.; Huang, Z.; Li, M.; Chen, B.; Hu, W. Identifying conservation and restoration priorities for degraded coastal wetland vegetations: Integrating species distribution model and GeoDetector. Sci. Total Environ. 2024, 906, 167491. [Google Scholar] [CrossRef]
  64. Walczak, N.; Walczak, Z. Assessing the feasibility of using Machine learning algorithms to determine reservoir water quality based on a reduced set of predictors. Ecol. Indic. 2025, 175, 113556. [Google Scholar] [CrossRef]
  65. Wei, J.; Cotterill, S.; Keenahan, J. Investigating the treatment efficiency of a baffled horizontal subsurface flow constructed wetland with diverse hydraulic efficiency. J. Environ. Manag. 2025, 379, 124864. [Google Scholar] [CrossRef]
  66. Li, X.; Zhou, X.; Zhao, Y.; Zhou, S. Exploring coupling coordination of new urbanization, green innovation and low-carbon development systems in China. J. Clean. Prod. 2025, 495, 145022. [Google Scholar] [CrossRef]
  67. Bastarianto, F.F.; Hancock, T.O.; Choudhury, C.F.; Manley, E. Agent-based models in urban transportation: Review, challenges, and opportunities. Eur. Transp. Res. Rev. 2023, 15, 19. [Google Scholar] [CrossRef]
  68. Elgohary, M.; Casier, C.; Pucci, P.; Witlox, F. Utilizing Social Media Data to Construct an Agent-Based Model in a Data-Scarce Environment: Case Study of Alexandria, Egypt; Elsevier: Amsterdam, The Netherlands, 2023. [Google Scholar]
  69. Jiang, L.; Zhang, J.; Bai, L.; Han, J.; Meng, X.; Cao, D.; Al-Sakkaf, A.S. Increased frequency and severity of global compound dry and heat wave events in a daily scale. J. Hydrol. 2025, 654, 132857. [Google Scholar] [CrossRef]
  70. Zhou, J.; Wang, Z.; He, Y.; Liu, P.; Xu, J.; Lu, C.; Lei, G.; Wen, L. Evaluating the Effects of Wetland Restoration on Ecosystem Services Using InVEST and Geostatistics: A Case Study of Dongting Lake in China. Remote Sens. 2024, 16, 4062. [Google Scholar] [CrossRef]
  71. Huixin, F.; Zhongliang, H.; Chongling, F.; Zijian, W.; Yuxin, T.; Fengfeng, M.; Hui, L.; Jing, H.; Xiaoli, Q.; Zhou, Z.; et al. Functional keystone taxa promote N and P removal of the constructed wetland to mitigate agricultural nonpoint source pollution. Sci. Total Environ. 2024, 912, 169155. [Google Scholar]
  72. Yu, S.; Cui, B.; Xie, C.; Ma, X.; Man, Y.; Ning, Z. Ecological Offsetting in China’s Coastal Wetlands: Existing Challenges and Strategies for Future Improvement. Chin. Geogr. Sci. 2019, 29, 202–213. [Google Scholar] [CrossRef]
  73. Diakoulaki, D.; Mavrotas, G.; Papayannakis, L. Determining objective weights in multiple criteria problems: The critic method. Comput. Oper. Res. 1995, 22, 763–770. [Google Scholar] [CrossRef]
  74. Xu, W.; Jin, J.; Zhang, J.; Yuan, S.; Tang, M.; Liu, Y.; Guan, T. Prediction of regional water resources carrying capacity based on stochastic simulation: A case study of Beijing-Tianjin-Hebei Urban Agglomeration. J. Hydrol. Reg. Stud. 2024, 56, 101976. [Google Scholar] [CrossRef]
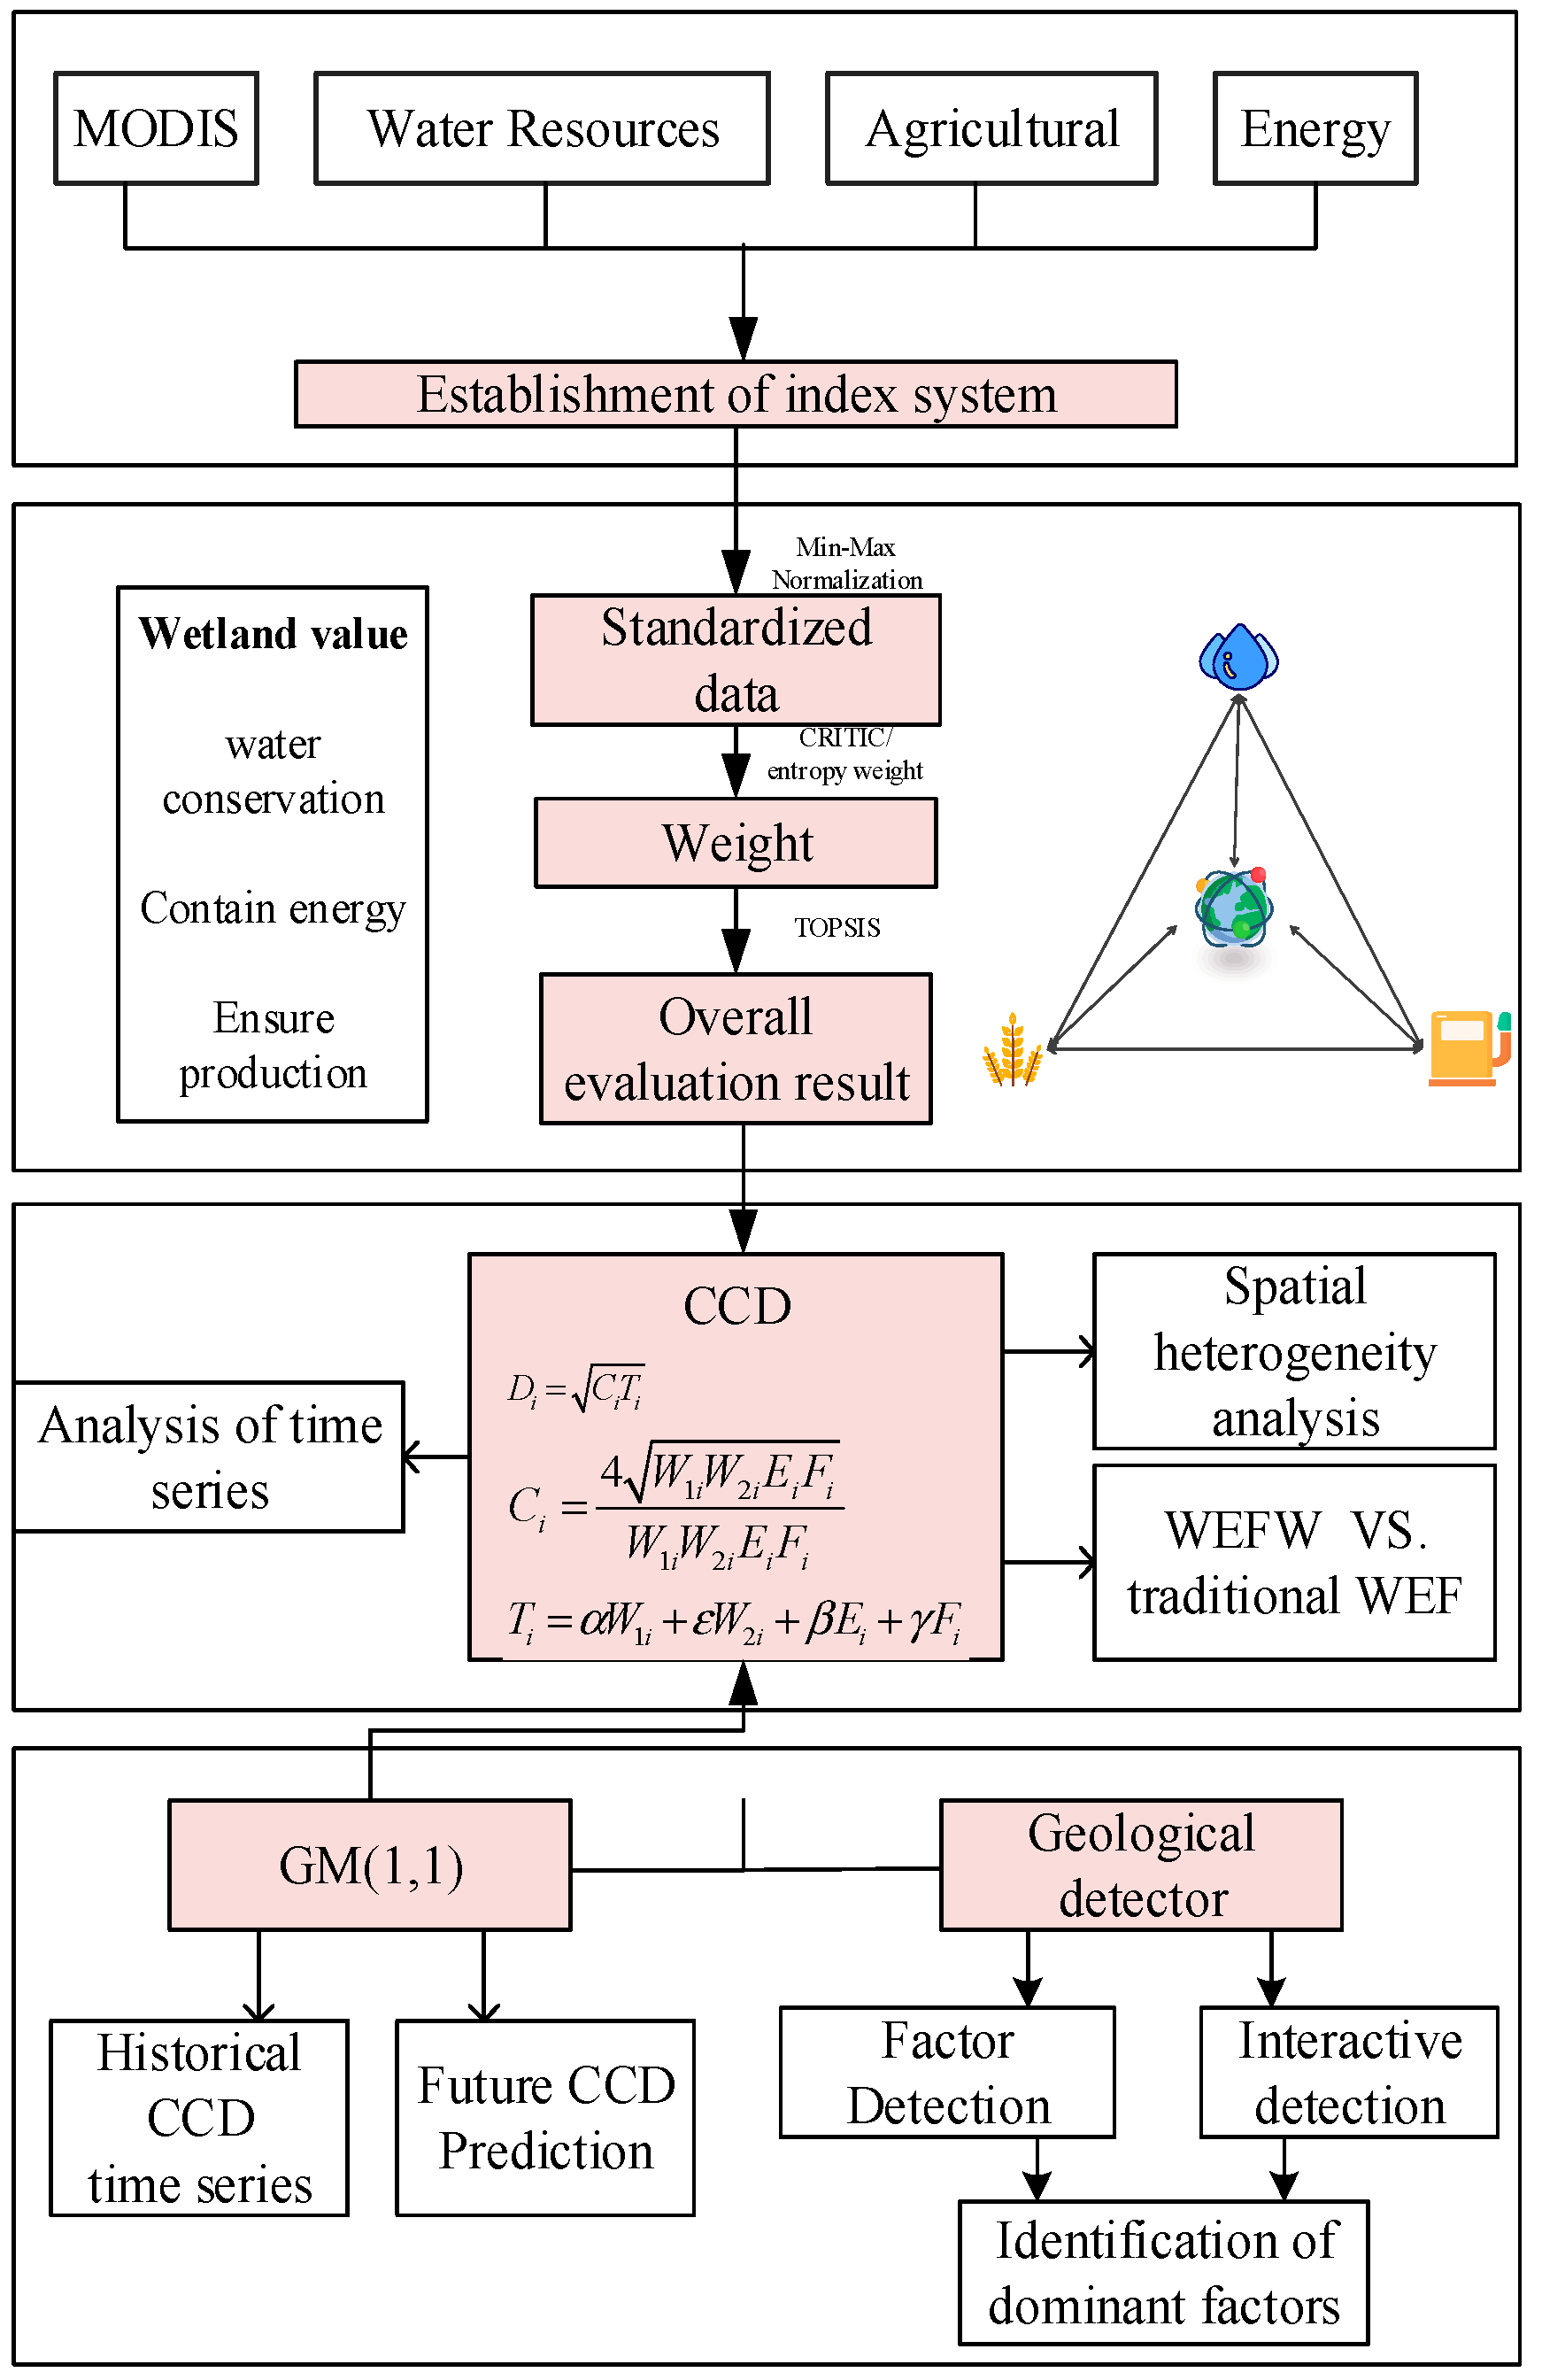
Figure 1. Technical route.
Land 14 01960 g001
Figure 2. Overview of the study area ((a) shows the location of Jiangxi Province in China, (b) represents the municipal administrative divisions of Jiangxi Province, (c) depicts the distribution of wetlands in Jiangxi Province).
Land 14 01960 g002
Figure 3. The interrelationships among WEFW.
Land 14 01960 g003
Figure 4. The comprehensive evaluation results of WEFW systems in Jiangxi Province.
Land 14 01960 g004
Figure 5. Comparison of CCD of each subsystem in Jiangxi Province from 2001 to 2022.
Land 14 01960 g005
Figure 6. The inter-annual variation in WEFW CCD from 2001 to 2022.
Land 14 01960 g006
Figure 7. Comparison of the CCD results for WEF and WEFW systems.
Land 14 01960 g007
Figure 8. Interrogation detector results.
Land 14 01960 g008
Figure 9. The GM (1,1) model results for each city in Jiangxi Province from 2022 to 2032.
Land 14 01960 g009
Table 1. WEFW Index System.
System LayerCriterion LayerIndicator LayerTypeCode
Water Resources SubsystemTotal water resources and their sourcesTotal water resources+W1
Precipitation+W2
Artificial ecological environment replenishment volume+W3
Water usage structure and consumptionIndustrial water consumptionW4
Urban public water consumption+W5
Residential water consumption Wastewater treatment rate+W6
Water resource utilization efficiency and managementWater resource development utilization rate+W7
Total energy consumption+W8
Energy subsystemTotal energy and growth rateAverage annual growth rate of energy consumptionE1
Energy consumption per unit of GDPE2
Energy efficiency and development elasticityEnergy consumption elasticity coefficientE3
Total grain outputE4
Food subsystemFood availabilityPer capita grain output+F1
Grain unit output+F2
Grain sown area+F3
Agricultural water consumption+F4
Effective utilization coefficient of irrigation water in farmlandF5
Food sustainabilityRural residents’ consumption expenditure+F6
Rural residents’ disposable income+F7
Natural population growth rate+F8
Density of wetland patchesF9
Wetland subsystemFood sustainabilityWetland aggregation index+w1
Total wetland area+w2
Wetland landscape shape index+w3
Patch connectivity index+w4
Ecological functions and diversity characteristicsShannon diversity index+w5
Total water resources+w6
Table 2. Coupling coordination stage and division criteria.
Degree of CoordinationCCDCoupling Coordination Type
Degree of coordination(0.9~1.0]High-quality coordinated development type
(0.8~0.9]Good coordinated development type
(0.7~0.8]Intermediate coordinated development type
(0.6~0.7]Primary coordinated development type
Excessive development category(0.5~0.6]Marginal coordinated development type
(0.4~0.5]On the verge of imbalance development type
Disorder and decline category(0.3~0.4]Mild imbalance and decline
(0.2~0.3]Moderate imbalance and decline
(0.1~0.2]Severe imbalance and decline
Table 3. Results of wetland contribution based on geographical detector.
Factorqp-Value
Water0.0670.0059
Wetland0.1420.0009
Energy0.07450.0159
Food0.05740.0099
Disclaimer/Publisher’s Note: The statements, opinions and data contained in all publications are solely those of the individual author(s) and contributor(s) and not of MDPI and/or the editor(s). MDPI and/or the editor(s) disclaim responsibility for any injury to people or property resulting from any ideas, methods, instructions or products referred to in the content.