Abstract
The escalating consequences of human activities and global warming have markedly increased the frequency and intensity of geological disasters worldwide, posing a formidable threat to human life and property. In the southern mountainous region of Ningxia, China—an area characterized by complex topography, interlaced ravines, and pronounced ecological fragility—recurrent geological disasters have substantially constrained rural revitalization and development. This study introduces the integration of the Information Value (IV) method with Random Forest (RF) and XGBoost models, identifying IV + XGBoost as the optimal model through rigorous ROC-curve validation. The results reveal that low- and lower-risk areas account for 58.63% of the total area (7644.20 km2 and 4038.08 km2), medium-risk areas cover 29.24% (5825.76 km2), and high-risk regions constitute 12.13% (2417.28 km2). The latter are predominantly in river valleys with high population density and intensive economic activities. These findings provide practical recommendations for scientifically informed disaster management and decision-making by relevant authorities. Furthermore, the proposed methodology offers valuable insights for disaster risk assessment in other regions with similar complex terrains and ecological vulnerabilities, contributing to developing more effective and sustainable disaster mitigation strategies.
1. Introduction
Global population growth and economic development, along with increasing human activities like mining, land development, and urbanization, have led to a rise in geological disasters worldwide [1,2,3]. In the southern Ningxia mountainous region of China, geological disasters occur frequently due to factors such as fragile ecology, human activities, groundwater scarcity, and unique geology, threatening lives and property, and hindering socioeconomic development [4,5,6]. Therefore, conducting risk assessment research is essential to evaluate and mitigate geological hazards in this region, providing a scientific basis for effective disaster prevention and control strategies.
Over the past decades, substantial progress has been made in geological disaster research, both domestically and internationally, covering landslides, earthquake-induced hazards, risk assessment, and early warning systems. Countries such as China, the United States, and Japan have made important contributions in fields such as seismic response, rock fracture mechanisms, landslide prediction models, and the application of GIS technologies, particularly in disaster monitoring and zoning studies in high-risk areas [7,8,9]. Research shows that landslides are the most common and widespread geological disasters, with their number and scale continuously increasing [10,11], especially in the southwest and northwest regions of China, where disaster frequency is higher [12,13,14]. Earthquake-induced geological disasters, such as landslides and debris flows, are often exacerbated under strong rainfall conditions after earthquakes [15,16,17]. To address these challenges, researchers worldwide have developed a range of susceptibility evaluation models utilizing methodologies such as logistic regression and the analytic hierarchy process, significantly enhancing post-earthquake landslide prediction capabilities [18,19,20]. Additionally, modern monitoring technologies such as InSAR and 3D laser scanning [21,22,23,24], and machine learning models like LSTM [25,26,27,28], have significantly enhanced the effectiveness of real-time monitoring and early warning systems for landslide dynamic changes. Although China has accumulated rich disaster risk management experience through legal frameworks and emergency response plans [29,30,31], there is still room for improvement in landslide hazard point identification technology and early warning success rates [32,33,34,35].
In addition to these efforts, a growing number of studies have applied integrated approaches that combine statistical methods with machine learning algorithms to improve susceptibility assessments in complex terrains. The Information Value (IV) method, for example, has been widely used to quantify the contributions of environmental factors, while ensemble models such as Random Forest (RF) and XGBoost have demonstrated strong capability in handling non-linear interactions and achieving high predictive accuracy [36,37]. Hybrid frameworks that integrate multi-source datasets—encompassing geological, hydrological, and socioeconomic indicators—have also been shown to enhance the robustness of risk zoning outcomes and to provide practical references for local disaster management [38].
Based on these studies, the present work develops a systematic framework for geological disaster risk assessment in the southern Ningxia mountainous region. The Information Value (IV) method is integrated with Random Forest (RF) and XGBoost models to evaluate susceptibility, leveraging their strengths in data analysis and classification. Vulnerability is further quantified using the AHP–entropy and fuzzy comprehensive evaluation methods, incorporating socioeconomic and environmental indicators. By combining multi-source data with established statistical and machine learning techniques, this study provides a reliable risk zoning framework adapted to the complex geo-environmental conditions of the region. The findings not only enhance disaster prevention and mitigation strategies in southern Ningxia but also offer transferable insights for disaster management and sustainable development in other similar mountainous areas.
2. Study Area, Data, and Methodology
2.1. Study Area
The Ningnan Mountain District comprises six counties and one district, including the whole area of Guyuan City (that is, Yuanzhou District, Lund County, Jingyuan County, Xiji County, and Pengyang County), Tongxin County of Wuzhong City, and Haiyuan County of Zhongwei City, with a total expanse of 20,176.2 km2, constituting 37% of Ningxia’s overall area. This area lies on the northwestern edge of the Loess Plateau, within the middle reaches of the Yellow River, encompassing the Loess hilly gully and desert semi-desert zone. This area is located within the Loess Plateau region. It is located at 105°19′–106°58′ east longitude and 35°14′–37°04′ north latitude. The width between east and west is about 160 km, the length between south and north reaches 250 km, and the elevation is 1280.0–2949.1 m [39]. Figure 1 (coordinates are given in the WGS_1984 geographic coordinate system) shows the Ningnan Mountain Area’s geographical location map. The region’s topography exhibits significant variation from south to north, with an overall slope from south to north, the central part showing a convex shape, the eastern part being low, and the western part being high. The area intricately distributes various topographies, including ditches, beams, rivers, sources, platforms, palm slopes, and trenches [40]. The southern mountainous region is characterized by diverse terrain types, including loess hills, red rock hills, and earthy mountains. The climate in this region transitions gradually from south to north, comprising four distinct climate zones: temperate semi-humid, semi-arid transition, temperate semi-humid regions, and semi-arid/arid regions. Each county within this region exhibits unique climatic characteristics, reflecting the complex interplay of geographical and environmental factors.
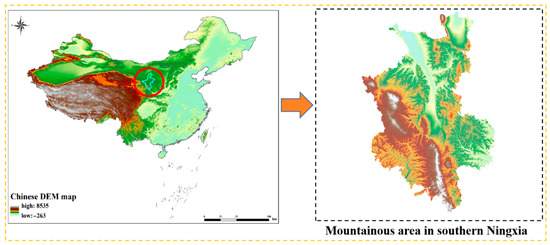
Figure 1.
Location map of the Ningnan Mountain Area.
2.2. Data Sources
In the Ningnan Mountain Area, there are a total of 2248 geological hazard points. The data source is the detailed survey data from 2008 to 2019 on geological hazard investigations in the area, including the name, location, type, and scale of the geological hazard point. The data is in Excel format; we obtained the elevation, slope, and ground undulation using the 25 m digital elevation model (DEM) grid data of the study area; we obtained faults, water systems, and more using the 1:250,000 geological map. SHP format data; NDVI grid data obtained through the Geospatial Data Cloud (https://www.gscloud.cn/, accessed on 8 September 2025); land-use type from the Resource and Environmental Science and Data Center (https://www.resdc.cn, accessed on 8 September 2025); seismic parameters obtained according to the “China Earthquake Motion Parameter Zoning Map” (http://www.gb18306.net/, accessed on 8 September 2025); precipitation annual value Excel data for 2005–2020 obtained from the Department of Land and Resources’ 2021 meteorological data, with point data interpolated to generate the average yearly rainfall map in the Ningnan Mountain Area; and 2020 road data from Shuijingzhu, the Universal Map Downloader.
2.3. Research Methods
We collected comprehensive data on hydrology, meteorology, topography, hydrogeology, and human activities within Ningnan’s mountainous regions. A thorough analysis was conducted on the types, characteristics, induced causes, and temporal and spatial distribution of geological disasters. The factors influencing the occurrence of geological disasters were identified and evaluated using a range of data sources, including demographics, topographic maps, and other relevant information. A predisposition assessment model was established, its accuracy verified, and a predisposition assessment was conducted using annual average rainfall by the optimal model. A geological hazard risk assessment system was developed, and hazard zoning maps were created. The vulnerability level was evaluated, and a vulnerability zoning map was drawn. A geological hazard risk evaluation map was generated using the outcomes of the hazard and vulnerability assessments, and the risk level was categorized (Figure 2). Based on the risk level, the treatment area was divided, and prevention and control measures were formulated to provide a scientific foundation for urban planning, disaster prevention, and mitigation efforts.
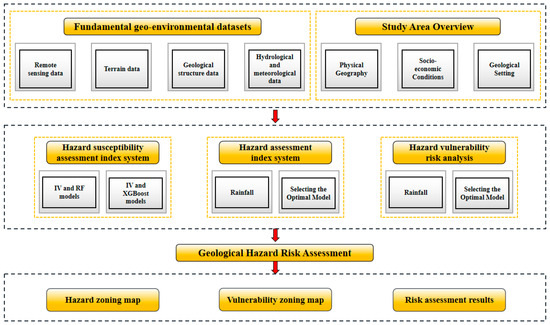
Figure 2.
Research framework.
2.3.1. Selection of Risk Evaluation Factor Indicators
By analyzing the correlation between geological disasters and pertinent factors in the study area through the amalgamation of relevant literature [41], according to the principle of selecting evaluation index factors, this paper takes the elevation, slope, terrain relief, rock and soil type, distance from faults, land-use type, distance from rivers, distance from roads, and ten evaluation factors of NDVI as the vulnerability evaluation indicators for geological disasters in the Ningnan Mountainous Area.
2.3.2. Introduction to the Disaster Evaluation Model
Principles of the Information Quantity Method
The information quantity model is a statistical prediction approach rooted in information theory, with broad application value [42] in evaluating geological disaster vulnerability and risk. The information quantity model assesses the vulnerability and risk of geological disasters. The richer the evaluation index data selected, the better the model effect. Due to the ongoing advancements in science and technology, the data obtained for modeling has become increasingly abundant. As a result, more and more experts and scholars are choosing multi-angle evaluation indicators for research, significantly improving disaster evaluation accuracy and credibility [43]. The information quantity method computes the information content regarding the occurrence of geological disasters, such as landslides. It collapsed in the past and implies the possibility of catastrophe under similar conditions. The application principle is to establish an evaluation model in ArcGIS 10.8 software, to first divide the study area into many grids or other evaluation units, and then to calculate the information value of each evaluation indicator of disaster risk within the grid evaluation unit through the distribution of hazardous points under factors affecting the occurrence of geological disasters, such as landslides and collapses. Each indicator’s computed information value reflects the contribution rate of each evaluation unit to the development of geological disasters. The information values of all evaluation indicators in each evaluation unit are then superimposed to obtain the total information value [44]. Therefore, the value of information accurately describes the vulnerability and risk of geological disasters, with higher values indicating a greater likelihood of events like landslides and collapses, and vice versa.
According to the theory of information model, geological disaster events (W) are affected by many factors (Xi, i1, 2, 3, …, n), that is, W = f (x1, x2, x3, …, xn). In general, the probability of geological disasters, like landslides and mudslides, is correlated with the statistically obtained information from damaged areas during the prediction analysis process, and we measure the degree of information by the amount of information [45]:
Through mathematical transformation, the above equation becomes
I(W, x1x2x3… xn) denotes the information value contributed by evaluation index factor x1, x2, x3, …, xn to geological hazards within the study area; P(W, x1x2x3… xn) represents the probability of geological hazards such as collapses, landslides, and debris flows occurring under the combined influence of evaluation index factor x1, x2, x3, …, xn; P(W) indicates the probability of occurrence of geological disasters such as collapses, landslides, and debris flows; stands for the information value contributed by evaluation index factor x2 to geological hazards such as landslides and debris flows, given the presence of evaluation index factor x1.
Fundamentals of Random Forest (RF)
Breiman proposed the classification tree algorithm in 1984 [46]. It iteratively classifies or regresses binary data, reducing the model’s computational load. In 2001, Breiman combined the classification tree algorithm to build a machine learning algorithm—a Random Forest model. It is a combination-classifier method that employs a diverse array of integrated learning algorithms. Evolved from the decision tree algorithm, it employs random sampling to model the decision tree, learns and trains the decision tree through the Bagging algorithm, and then combines them to obtain the final classification and prediction results by voting [47]. Since the model randomly selects sample data, it mitigates the risk of model overfitting. Numerous theoretical studies have demonstrated that the stochastic forest model possesses high prediction accuracy and is a highly flexible machine learning classification method. The evaluation of geological hazard vulnerability is a binary classification problem (the classification of disaster points and non-disaster points), so it has gained widespread usage.
In a Random Forest model, each decision tree (cart) is constructed independently, with the training set of autonomous samples being generated randomly, resulting in all cart trees having the same distribution. When the Random Forest model performs classification prediction analysis, it builds k-cart trees. After independently completing the classification task, it selects the optimal classification results [48] by voting on the classification results of each decision tree.
XGBoost Classification Algorithm
XGBoost is a popular machine learning algorithm. Through GBDT improvement, we developed it. Both are learning algorithms that belong to decision tree boosting [49]. The distinction between the XGBoost and GBDT algorithms lies in GBDT’s sole performance of the first-order Taylor expansion of the negative gradient in the error component. However, the XGBoost algorithm performs the second-order Taylor expansion; simultaneously, regularization is incorporated into the loss function to enhance algorithmic accuracy. The XGBoost algorithm also optimizes the operation efficiency. Introducing feature subsampling can reduce both overfitting and computation. The GBDT algorithm cannot support parallel processing, and the XGBoost algorithm can implement parallel processing on features [50]. Therefore, it can process sparse data to perform distributed parallel computing.
The XGBoost sub-algorithm model is expressed as follows:
where represents the predicted value; K represents the total number of decision trees; i represents the ith sample; Represents the corresponding eigenvector of the ith sample; F represents the set of all decision trees; and The kth decision tree is generated by the kth iteration.
Information Quantity Method Coupling with the Machine Learning Model
Before training the machine learning model, generating a data sample and integrating the information value into the model play a significant role in the training and learning efficacy of the model. The traditional approach of data samples involves normalizing the selected evaluation factors and then using them to create a sample dataset. However, this method cannot accurately represent the evaluation index assignment of different dimensions, and the information volume method can quantify the evaluation factors using the distribution characteristics of disaster points and the interval area of different grades of evaluation factors [51]. The data samples created in this way can not only eliminate the dimensional differences in evaluation factors but also represent the grading of each evaluation factor.
2.3.3. Introduction to Evaluation Analysis Methods
Correlation and Sample Set Selection
The 10 risk evaluation factors selected were A1: slope direction, A2: elevation, A3: fault distance, A4: geotechnical body type, A5: land use, A6: NDVI, A7: terrain relief, A8: road distance, A9: slope, A10: river distance. The Pearson correlation coefficient and the collinearity test assessed the linear correlation among the factors. We conducted Pearson correlation analysis using SPSS 22 software, and the correlation coefficient R was [−1, 1]. The greater the absolute value of R, the greater the correlation. It is generally believed that |R| < 0.3, there is no correlation between the two factors; 0.3 ≤ |R| < 0.5, the two factors are lowly correlated; 0.5 ≤ |R| < 0.8, the two factors are moderately correlated; and |R| ≥ 0.8, the two factors are highly correlated [52]. We introduce Tolerance (Tol) and Variance Expansion Factor (VIF) to determine whether there is a collinear relationship between the evaluation factors for secondary testing [53]. Generally, researchers believe there is no collinear relationship between Tol > 0.1 or VIF < 5. So, the selected evaluation factors are reasonable.
The information volume model calculates the value of each evaluation indicator in the cell, and the obtained information volume value is input into machine learning as the attribute value of the evaluation factor under different categories.
Then, we take the information value of the geological hazard sample point and the non-hidden hazard sample point at the grid cell as the model-independent variable. We use 1 to represent the disaster points and 0 to represent the non-hazard points as the dependent variables for classification and analysis. To analyze the grid units of the study area, we converted them into point features to create the overall dataset for analysis. Subsequently, we utilized the multi-value extraction to points function to extract each evaluation factor’s information value, forming the study area’s total sample dataset.
Optimal Model Analysis and Selection
Based on the coupled model geological hazard vulnerability assessment, we selected the Random Forest (RF) and XGBoost models for training. We set the training set sample partition options to 70% and 30%. We randomly selected 70% of the positive and negative sample data from the training sample set to form the dataset, and the remaining 30% were used as the test dataset. The finalized model was employed to assess the vulnerability of the study area, providing the probability value of geological disaster vulnerability for each grid cell (between 0 and 1; the larger the value, the higher the probability of vulnerability). Subsequently, leveraging the information quantity method, the principles of the Random Forest (RF) and XGBoost evaluation models, a geospatial database was established to calculate the information quantity values of each evaluation index in the cell. The information quantity method combines the Random Forest (RF) and XGBoost models to generate two geological disaster vulnerability probability values to obtain the geological disaster vulnerability evaluation results of two different models. Finally, ArcGIS randomly generated non-hazardous and disaster points as sample data. The ROC curve of the test-set data was analyzed using SPSS software to select the optimal model for evaluating the vulnerability of geological disasters.
Through this optimal model, we obtained a rainfall distribution map by interpreting the rainfall data of the study area (2005–2020) using the ArcGIS tool. Subsequently, we assigned the computed information value of the rainfall category to the grid cells of the study area.
Evaluation Indicators and Methods
We conducted the most comprehensive vulnerability evaluation using the administrative unit as the fundamental entity. The Ningnan Mountain Area vulnerability assessment was performed at the township level, dividing the area (comprising six counties and one district) into 98 vulnerability evaluation units. Due to data availability at the township scale, indicators such as medical facilities or population structure could not be consistently obtained. Therefore, this study selected four core indicators—population density, GDP density, road density, and arable land area—which are widely recognized in vulnerability assessment. We established an evaluation index system by selecting four indicators—population, GDP, roads, and arable land—to reflect the vulnerability level of socio-demographic factors, material economy, and environmental resources, respectively. In assessing the vulnerability of geological hazards, emphasis was placed on utilizing the density of each factor as a primary evaluation indicator. Normalization was conducted to ensure consistent properties among these diverse vulnerability indicators by scaling them to the range between their maximum and minimum values.
The AHP method was applied to derive the subjective weights of evaluation factors. Based on expert knowledge, a hierarchical structure model of the vulnerability index system was established for the mountainous area of Ningnan. Using the 1–9 scale [54], pairwise comparisons were performed among the factors at each level, and expert scoring was used to construct the judgment matrix (Table 1). The maximum eigenvalue method was then employed to calculate the weights, and consistency was tested using the Consistency Index (CI) and Consistency Ratio (CR). All CR values were less than 0.1, indicating satisfactory consistency in the judgment matrices.

Table 1.
Judgment matrix.
Subsequently, the entropy method was used to calculate objective weights according to the information contained in the evaluation index data. This result is highly objective, as it depends solely on the index data. To further enhance the robustness of the evaluation, a combination of subjective and objective methods was applied. Specifically, the distance function was used to integrate the two sets of weights, yielding comprehensive weights for the vulnerability assessment.
According to indicators for evaluating selection vulnerability, the population density, road density, cultivated land density, and GDP density were used as the structural evaluation factor set. Then, the vulnerability of geological disasters in the Ningnan Mountains was categorized into four levels to constitute an evaluation set. A classification system table for each factor was constructed based on the values of each factor in the dataset. According to previous relevant research [55], this paper used a trapezoidal distribution to construct a fuzzy distribution function, compositing the vulnerability evaluation factor correlation matrix R and the combined weight matrix W.
3. Results
3.1. Geohazard Susceptibility Assessment
3.1.1. Quantitative Evaluation Factor Analysis
After reclassification and information value calculation, both categorical and continuous conditioning factors were transformed into continuous information-value rasters, which were then mapped using gradient colors for consistency. The GIS chart for the information on each evaluation factor (Figure 3) is as follows. From the analysis of the correlation coefficients between the ten factors in Figure 4, it can be seen that |R| < 0.3 can be satisfied, and the correlation between the factors is low, so there is little impact on the evaluation of geological disaster susceptibility. By calculation, it is shown that all evaluation factors have TOL values < 2 and VIF values > 0.1, so there is no collinear relationship, and the selected evaluation factors are reasonable.
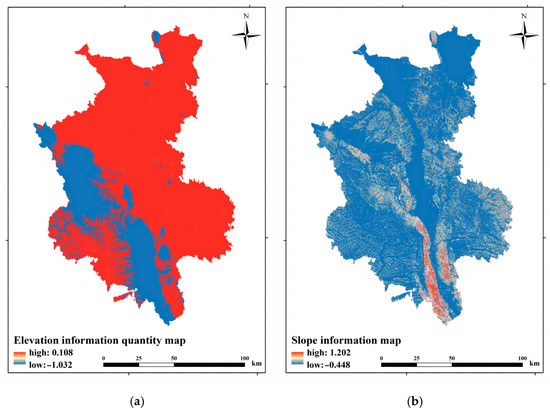
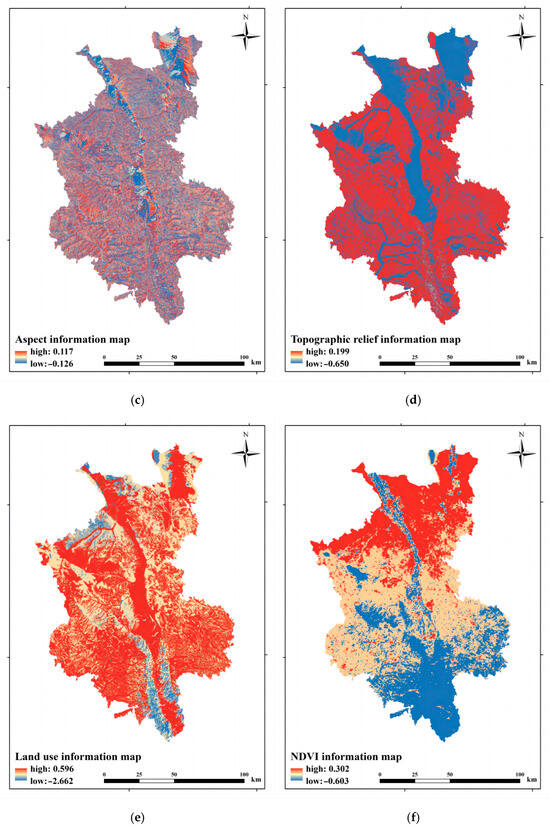
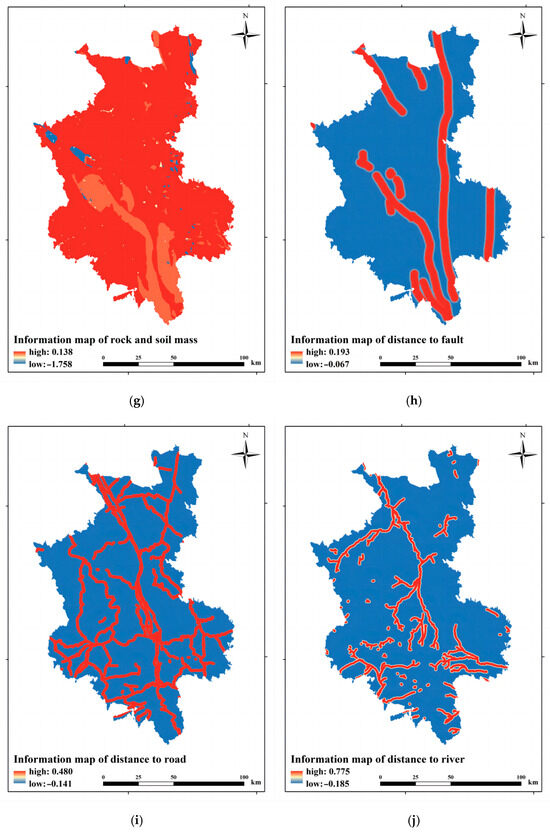
Figure 3.
Information quantity diagram of each factor. (a) Elevation information quantity map; (b) slope information map; (c) aspect information map; (d) topographic relief information map; (e) land-use information map; (f) NDVI information map; (g) information map of rock and soil mass; (h) information map of distance to fault; (i) information map of distance to road; (j) information map of distance to river. (All maps in Figure 3 represent the information values of conditioning factors rather than their original categories. Thus, both categorical and continuous factors are displayed as constant information-value maps).
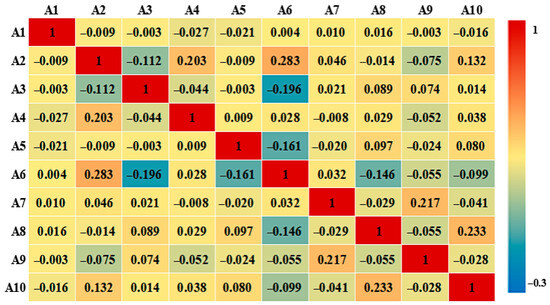
Figure 4.
Correlation chart of vulnerability evaluation factors. (A1: slope direction, A2: elevation, A3: fault distance, A4: geotechnical body type, A5: land use, A6: NDVI, A7: terrain relief, A8: road distance, A9: slope, A10: river distance).
3.1.2. Susceptibility Evaluation Results
The township administrative unit was adopted as the basic spatial unit, which aligns with both the available statistical data and the practical needs of local disaster management. Through ROC-curve analysis (Figure 5), as shown in Figure 5, the susceptibility distribution presents clear spatial differentiation, with high-susceptibility zones concentrated in the southern mountainous areas. The AUC values of the XGBoost and RF models were 0.864 and 0.822, respectively. Combined with the analysis of the vulnerability results, IV + XGBoost was chosen as the optimal model for evaluating the vulnerability of geological hazards.
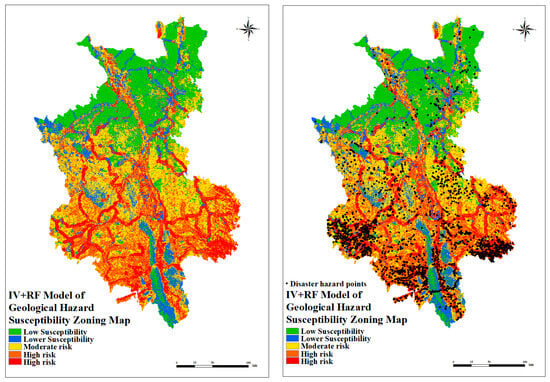
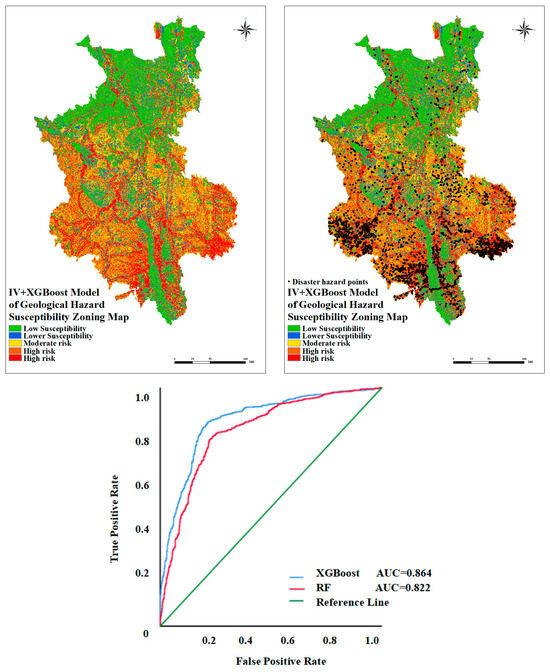
Figure 5.
Comparison of partition charts and ROC curves of two susceptibility models.
Based on the analysis above, we opted for the IV + XGBoost model to assess the vulnerability of geological disasters in the mountainous regions of Ningnan. Figure 6 illustrates the susceptibility level area of each county in the study area extracted by ArcGIS.
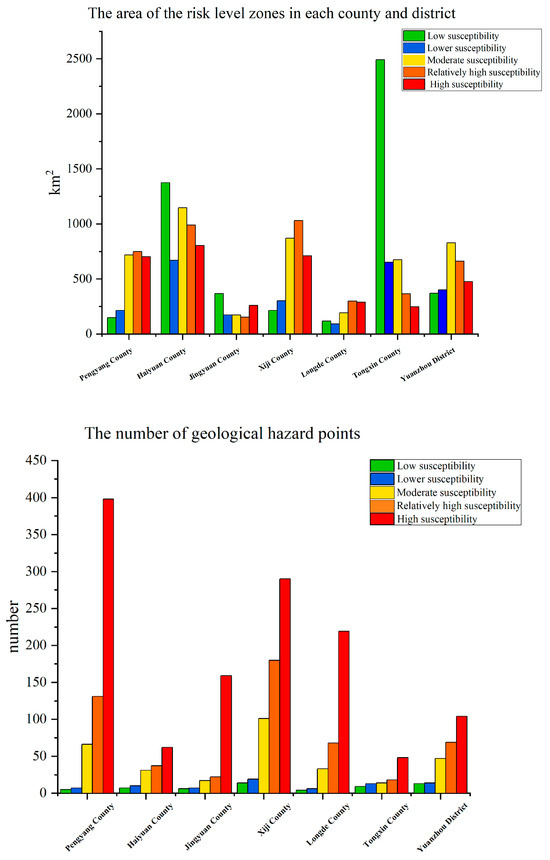
Figure 6.
Statistical chart of the area of the susceptibility level and the distribution of hazardous points in each county.
Figure 6 illustrates the distribution of geological hazards in relatively high susceptibility and vulnerability areas; the hazard assessment reveals that high-hazard areas are mainly distributed along river valleys and steep slopes. Among them, the total area of high susceptibility areas is 3488.52 km2, accounting for 17.50% of the total area. There are 1280 disaster hazards, accounting for 56.94% of the total disaster hazards, and the density of disaster points is 0.37/km2. Among them, Xiji, Pengyang, and Haiyuan areas have a high risk of occurrence. These areas are mainly loess hills and gullies. The area is the main one. Economic development is relatively slow, and geological disasters are particularly prone to occur. The total area of the relatively high-susceptibility areas is 4252.32 km2, accounting for 21.33% of the total area of the study area, a total of 525 disaster hidden-danger points, accounting for 23.35% of the total disaster hidden-danger points, and a density of 0.12/km2. The total area of the moderate susceptibility area is 4604.80 km2, accounting for 23.10% of the total area of the study area, a total of 309 disaster hidden-danger points, accounting for 13.74% of the total disaster hidden-danger points, and a density of 0.07/km2. The total area of the lower susceptibility areas is 2504.04 km2, accounting for 12.56% of the total area of the study area, a total of 76 disaster hidden-danger points, accounting for 3.38% of the total disaster hidden-danger points, and a density of 0.03/km2. The total area of the low susceptibility area is 5085.12 km2, accounting for 25.51% of the total area of the study area, a total of 58 disaster hidden-danger points, accounting for 2.58% of the total disaster hidden-danger points, and a density of 0.01/km2.
3.2. Geohazard Hazard Assessment
Figure 7 shows the results of the geohazard hazard division of the IV + XGBoost model; the hazard map indicates that densely populated and economically developed townships show higher hazard values. The high danger area, moderate danger area, lower danger area, and low danger area of geohazards accounted for 16.91%, 22.78%, 18.36%, and 41.95% of the total study area, respectively. There are 1465 high-danger internal geological disaster points, accounting for 65.17% of all geological disaster hidden-danger points, mainly distributed on both sides of the river basins. For instance, the Qingshui, Red, and Hulu rivers encompass several townships in the southern region of Tongxin County. Haiyuan County includes the Jiucai Township, Zhengqi Township, Hongyang Township, and Li Jun Township, along with the loess hilly areas in the southeast of Yuanzhou District; Huanghua Township, Jingheyuan Township, Xingshengsheng Township, and Xinliang Township, and other loess hilly areas in Jingyuan County; Xiji County, Pengyang County, and Lunde County are the counties with the most significant proportion of hazardous area and the largest number of disasters hidden-danger points. The population distribution is relatively dense, the economic development is relatively strong, the urbanization construction speed is fast, and some areas cause ground subsidence due to mining, which poses more threats to the population. The area has 556 moderate danger geological disaster points, accounting for 24.73% of the potential disaster hazard points. Among the total disaster sites, 227 are categorized as lower-danger and low-danger areas, accounting for 10.10%. Most of these sites are cultivated areas with adequate vegetation coverage, sparse population, and low susceptibility to disasters.
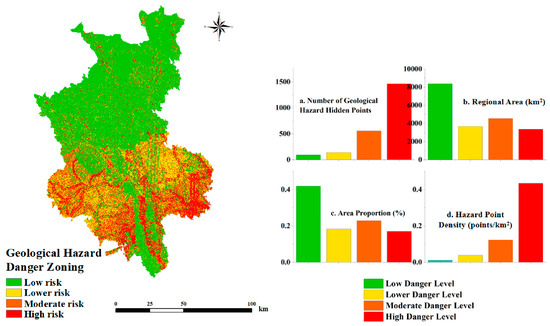
Figure 7.
IV + XGBoost model hazard zoning.
3.3. Geological Hazard Vulnerability Assessment
3.3.1. Selection and Quantification of Evaluation Indicators
During the vulnerability assessment of geological hazards, population, GDP, road, and arable land densities were chosen as indicators for evaluation (Figure 8). The evaluation factor results calculated through the integration of weights and the fuzzy comprehensive evaluation method are shown in Table 2. See Appendix A Table A1 for statistical data tables after normalizing vulnerability in seven counties and townships in the Ningnan Mountain Area.
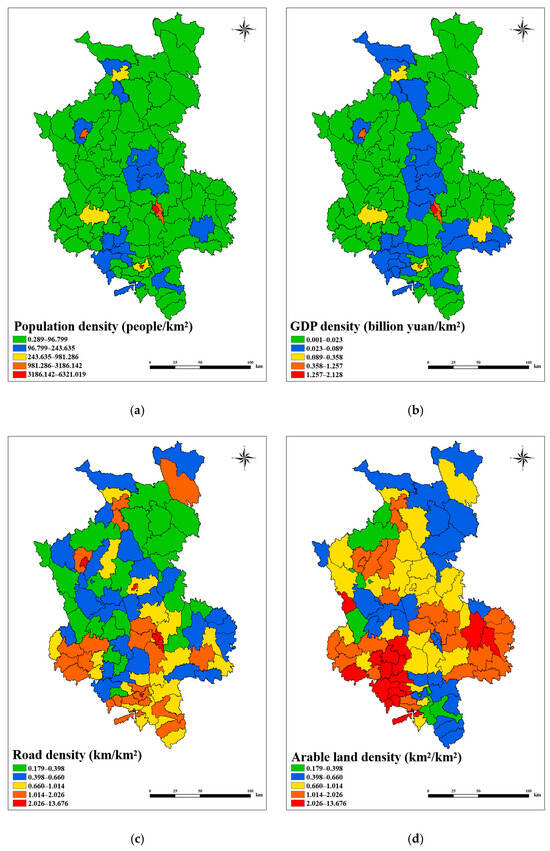
Figure 8.
Chart of vulnerability evaluation indicators. (a) Population density map; (b) road density map; (c) GDP density map; (d) arable land density map.

Table 2.
Weighted values of each indicator.
3.3.2. Evaluation Indicators and Methods
Table 3 presents the classification criteria for assessing the vulnerability of geological hazards in the Nanshan area of Ningxia. Using Gaoya Township, Haiyuan County, as an example, illustrates the hierarchical membership degree of population density, cultivated land density, road density, and GDP density.

Table 3.
Classification criteria for vulnerability assessment of geological hazards in the Nanshan area of Ningxia.
Based on the maximum degree of membership, Haiyuan County’s Gaoya Township is classified into Grade IV. Subsequently, we calculate the vulnerability results of the other 97 townships according to the evaluation steps above (Figure 9). The levels of vulnerability for each county and township are visualized in Figure 10.

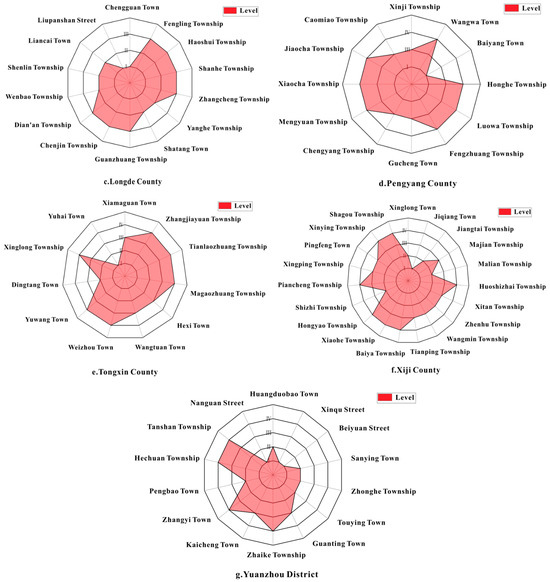
Figure 9.
The level of each county, town, and village.
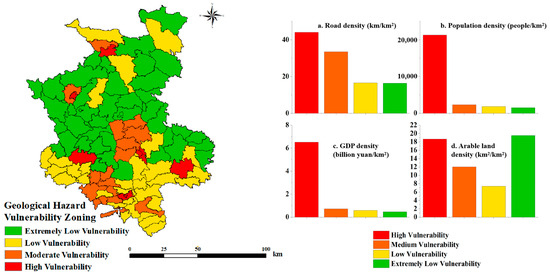
Figure 10.
Zoning map of vulnerability evaluation in the Nanshan Mountainous Area of Ningxia and statistical results of the actual situation of various evaluation indicators.
3.3.3. Partition Diagram of Vulnerability Evaluation
Utilizing data from various towns and villages in the study area, we tabulated the density of roads, population, GDP, and arable land in each vulnerable sub-area. The results depicted in Figure 11 illustrate that as the vulnerability level of geological disasters increases, road density also rises, as well as population, GDP, and arable land, which indicates that the results of the vulnerability evaluation of geological disasters are reasonable. Among them, there are 41 townships in the shallow-vulnerability area, with an area of 10,586.12 km2, which is the largest area, comprising 53.18% of the total land area, and includes 31 townships in the low-vulnerability zone, spanning 6036.32 km2; this region constitutes 30.32% of the total area and encompasses 17 municipalities in the moderately vulnerable zone, encompassing 829.84 km2; this area constitutes 4.17% of the total land area, housing nine municipalities within the highly vulnerable zone, respectively (the New District Street, Beiyan Street, Nanguan Street, Jiqiang Town, Yuhai Town, Old City Management Office, Chengguan Town, Liupanshan Street, and Baiyang Town), covering 2455 km2, and constituting 12.33% of the total land area.
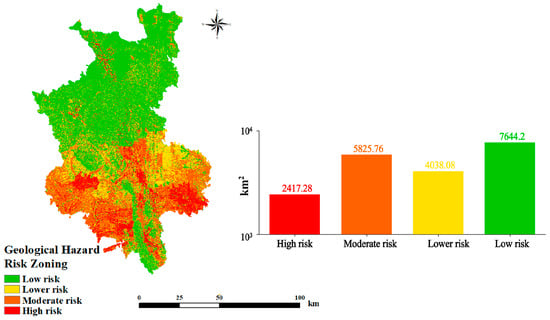
Figure 11.
Zoning map of geological disaster risk and the proportion of the zoning area in the Ningnan Mountain Area.
3.4. Risk Assessment of Geological Hazards
Upon analyzing the statistics, we determined that the areas classified as low-risk and lower-risk for geological disasters amounted to 7644.20 km2 and 4038.08 km2, respectively, comprising 38.36% and 20.27% of the total land area, primarily located in the northern regions of Xiamaguan Town, Hexi Town, and Weizhou Town in Tongxin County; the moderate-risk areas covered 5825.76 km2, accounting for 29.24% of the total area, mainly distributed in Guanzhuang Township, Hongyang Township, Shutai Township, and other areas in Haiyuan County; the high-risk areas covered 2417.28 km2, constituting 12.13% of the overall area, primarily found in Baiyang Town, Chengyang Town, Honghe Township, and other areas.
4. Discussion
This paper integrates research methods in the study of geological disaster risk assessment. It incorporates ideas from scholars both domestically and internationally, relying on qualitative models such as AHP (the analytic hierarchy process) [56,57,58,59], an expert scoring method [60,61], and more. Quantitative models such as the information quantity method [62,63,64], the fuzzy comprehensive evaluation method [65,66,67,68,69], and machine learning models such as the Random Forest model [70,71,72,73,74,75] and coupled model [76,77,78], as well as the XGBoost model [79,80,81], have been used to assess geological disaster risk in Ningnan. Simultaneously, this paper also uses the receiver operating characteristic (ROC) curve and the area under the curve (AUC) to evaluate the advantages and disadvantages of the model, making the results more scientific and reasonable. Based on the risk assessment results, the categorization of risk zones provides scientific theoretical suggestions for geological disaster prevention and emergency measures in the mountainous areas of Ningnan. This approach holds significant value in enhancing the efficacy of geological disaster prevention and control through the scientific and rational utilization of resources and in promoting the safe and sustainable development of lives and properties in the region [82,83,84].
Despite these contributions, several limitations remain. Firstly, the selection of grid cells as evaluation units may influence the accuracy of the assessment, as different spatial resolutions could affect model performance. This also introduces the modifiable areal unit problem (MAUP), in which the choice of administrative townships as the basic unit may distort spatial patterns and influence the robustness of the results. Future research should therefore examine the sensitivity of outcomes to unit size and zoning schemes to enhance reliability. Secondly, although the IV-XGBoost model demonstrated higher accuracy compared to other approaches, additional models should be explored in future studies to further improve robustness and precision. Finally, due to the relatively large scale of the study area, the availability of vulnerability indicator data was limited, and township-level units may not fully capture intra-township heterogeneity. Using finer spatial units, such as administrative villages, could help reflect local variation more realistically.
Based on the risk zoning results, this study also provides insights into targeted disaster prevention and control strategies for different risk levels in the mountainous areas of Ningnan. In high-risk areas, the frequency of subsidence, mudflows, and rockfalls is high, often in proximity to faults and associated with high road density, GDP, population, and cultivated land. These areas require intensive monitoring and early-warning systems, such as rain gauges and seismometers [85], as well as proactive relocation, biological engineering, and structural measures to mitigate long-term risks [86,87]. Medium-risk areas, where hazards are fewer but development pressures are higher, should prioritize engineering geological surveys [88,89] and strengthen slope protection, drainage, and stabilization projects. In low-risk areas, although hazards are limited, continued ecological restoration, vegetation improvement, and biodiversity protection remain important for sustainable development and long-term resilience [90].
5. Conclusions
This study constructed a comprehensive framework for geological disaster risk assessment in the southern mountainous region of Ningxia by integrating the Information Value (IV) method, Random Forest (RF), XGBoost, and AHP–entropy weighting with multi-source environmental and socioeconomic data. The results indicate that susceptibility and hazards are mainly concentrated in the steeply sloping southern areas and along fault and river valley zones, while vulnerability is higher in townships with dense populations, active economic development, and intensive land use. The risk zoning highlights several high-risk areas that should be prioritized for disaster prevention and mitigation. Beyond the case study region, this research demonstrates the applicability of combining statistical and machine learning methods to complex geo-environmental settings, providing valuable scientific support for regional disaster management and sustainable development.
Author Contributions
Formal analysis, M.R.R.M.A.Z.; funding acquisition, Q.L.; methodology, J.Z. and W.D.; project administration, W.Z.; validation, C.S.; writing—original draft, H.Z.; writing—review and editing, P.L., F.F. and C.-y.X. All authors have read and agreed to the published version of the manuscript.
Funding
All expenses are funded by the Project of Ningxia Natural Science Foundation (2022AAC03700; 2022BEG03059).
Data Availability Statement
The data presented in this study are derived from the following public domain resources and third-party sources. The geological hazard point data (including name, location, type, and scale) were obtained from the detailed survey on geological hazard investigations in the Ningnan Mountain Area (2008–2019) and are available from the corresponding author upon reasonable request with the permission of the local Department of Land and Resources. The DEM data, NDVI data, land-use data, and seismic parameters were derived from publicly available resources: the 25 m DEM and geological map (1:250,000) were provided by the Geospatial Data Cloud (https://www.gscloud.cn/, accessed in January 2021); land-use type data were obtained from the Resource and Environmental Science and Data Center (https://www.resdc.cn, accessed in January 2021); seismic parameters were obtained according to the “China Earthquake Motion Parameter Zoning Map” (http://www.gb18306.net/, accessed in January 2021). The road data were sourced from Shuijingzhu, the Universal Map Downloader. The precipitation data were processed by the authors based on meteorological data obtained from the Department of Land and Resources.
Acknowledgments
We would like to give our deep thanks to the Shaanxi Provincial Department of Education “Urban and Rural Spatial Hydrological Ecological Simulation and Management in Arid Area” Youth University Innovation Team, the China Scholarship Council (Grant No.: Liujinmei [2022] No. 45; Liujinxuan [2022] No. 133; Liujinou [2023] No. 22), the International Education Research Program of Chang’an University (300108221102), the Project of Ningxia Natural Science Foundation (2022AAC03700;2022BEG03059), the 2022 Guangdong University Youth Innovation Talent Program (2022KQNCX143), and the Yinshanbeilu Grassland Eco-hydrology National Observation and Research Station, China Institute of Water Resources and Hydropower Research, Beijing 100038, China, Grant no. YSS2022004.
Conflicts of Interest
This paper has no known competitive economic interests or personal relationships.
Appendix A

Table A1.
Vulnerability index statistics table for each township.
Table A1.
Vulnerability index statistics table for each township.
| District or County | Township | Road Density Normalization | Population Density Normalization | GDP Density Normalization | Arable Land Density Normalization |
|---|---|---|---|---|---|
| Haiyuan County | Gaoya Township | 0.070 | 0.027 | 0.022 | 0.637 |
| Xian Town | 0.024 | 0.007 | 0.006 | 0.487 | |
| Jiatang Township | 0.039 | 0.010 | 0.008 | 0.688 | |
| Zhengqi Township | 0.016 | 0.004 | 0.004 | 0.609 | |
| Hongyang Township | 0.023 | 0.003 | 0.002 | 0.349 | |
| Sheep Farm | 0.010 | 0.001 | 0.001 | 0.403 | |
| Qiyin Town | 0.024 | 0.014 | 0.012 | 0.483 | |
| Sanhe Town | 0.061 | 0.028 | 0.023 | 0.524 | |
| Jiucai Township | 0.017 | 0.003 | 0.002 | 0.665 | |
| Guanzhuang Township | 0.014 | 0.005 | 0.004 | 0.889 | |
| Guanqiao Township | 0.011 | 0.005 | 0.004 | 0.027 | |
| Shidian Township | 0.026 | 0.006 | 0.005 | 0.644 | |
| Caowa Township | 0.015 | 0.003 | 0.002 | 0.601 | |
| Lijun Township | 0.031 | 0.004 | 0.003 | 0.285 | |
| Liwang Town | 0.020 | 0.013 | 0.011 | 0.561 | |
| Shutai Township | 0.008 | 0.005 | 0.004 | 0.629 | |
| Haicheng Town | 0.070 | 0.018 | 0.015 | 0.792 | |
| Gancheng Township | 0.011 | 0.002 | 0.002 | 0.444 | |
| Conservation Forest General Field | 0.036 | 0.001 | 0.001 | 0.039 | |
| Old Town Management Office | 0.341 | 0.399 | 0.329 | 0.643 | |
| Industrial Logistics Park | 0.388 | 0.001 | 0.001 | 0.494 | |
| Jingyuan County | Xingsheng Township | 0.046 | 0.014 | 0.011 | 0.216 |
| Dawan Township | 0.050 | 0.009 | 0.007 | 0.403 | |
| Xinmin Township | 0.051 | 0.009 | 0.007 | 0.291 | |
| Xiangshui Town | 0.081 | 0.029 | 0.023 | 0.204 | |
| Huanghua Township | 0.058 | 0.007 | 0.005 | 0.293 | |
| Liupanshan Town | 0.051 | 0.004 | 0.003 | 0.280 | |
| Jingheyuan Town | 0.078 | 0.012 | 0.009 | 0.277 | |
| Longde County | Chengguan Town | 0.122 | 0.107 | 0.108 | 0.391 |
| Fengling Township | 0.048 | 0.009 | 0.010 | 0.732 | |
| Haoshui Township | 0.070 | 0.006 | 0.006 | 0.543 | |
| Shanhe Township | 0.041 | 0.001 | 0.001 | 0.001 | |
| Zhangcheng Township | 0.016 | 0.013 | 0.013 | 0.943 | |
| Yanghe Township | 0.039 | 0.023 | 0.023 | 0.873 | |
| Shatang Town | 0.098 | 0.015 | 0.015 | 0.730 | |
| Guanzhuang Township | 0.044 | 0.013 | 0.013 | 0.426 | |
| Chenjin Township | 0.074 | 0.007 | 0.007 | 0.466 | |
| Dian’an Township | 0.041 | 0.004 | 0.004 | 0.597 | |
| Wenbao Township | 0.076 | 0.017 | 0.017 | 0.841 | |
| Shenlin Township | 0.115 | 0.013 | 0.013 | 0.945 | |
| Liancai Town | 0.093 | 0.021 | 0.021 | 0.952 | |
| Liupanshan Street | 1.000 | 0.835 | 0.590 | 0.009 | |
| Pengyang County | Xinji Township | 0.029 | 0.013 | 0.019 | 0.788 |
| Wangwa Town | 0.017 | 0.007 | 0.010 | 0.830 | |
| Baiyang Town | 0.069 | 0.038 | 0.054 | 0.781 | |
| Honghe Township | 0.032 | 0.010 | 0.015 | 0.767 | |
| Luowa Township | 0.009 | 0.003 | 0.005 | 0.386 | |
| Fengzhuang Township | 0.023 | 0.002 | 0.003 | 0.759 | |
| Gucheng Town | 0.042 | 0.009 | 0.012 | 0.545 | |
| Chengyang Township | 0.050 | 0.008 | 0.012 | 0.714 | |
| Mengyuan Township | 0.019 | 0.005 | 0.006 | 0.793 | |
| Xiaocha Township | 0.019 | 0.002 | 0.003 | 0.674 | |
| Jiaocha Township | 0.001 | 0.003 | 0.004 | 0.523 | |
| Caomiao Township | 0.047 | 0.006 | 0.008 | 0.877 | |
| Tongxin County | Xiamaguan Town | 0.073 | 0.009 | 0.010 | 0.474 |
| Zhangjiayuan Township | 0.006 | 0.001 | 0.001 | 0.412 | |
| Tianlaozhuang Township | 0.007 | 0.001 | 0.001 | 0.372 | |
| Magaozhuang Township | 0.001 | 0.002 | 0.002 | 0.411 | |
| Hexi Town | 0.031 | 0.014 | 0.015 | 0.295 | |
| Wangtuan Town | 0.000 | 0.011 | 0.012 | 0.530 | |
| Weizhou Town | 0.030 | 0.006 | 0.006 | 0.362 | |
| Yuwang Town | 0.010 | 0.005 | 0.005 | 0.434 | |
| Dingtang Town | 0.060 | 0.038 | 0.042 | 0.496 | |
| Xinglong Township | 0.026 | 0.010 | 0.011 | 0.182 | |
| Yuhai Town | 0.139 | 0.155 | 0.168 | 0.689 | |
| Xiji County | Xinglong Town | 0.029 | 0.027 | 0.020 | 0.885 |
| Jiqiang Town | 0.099 | 0.069 | 0.053 | 0.740 | |
| Jiangtai Township | 0.035 | 0.025 | 0.019 | 0.909 | |
| Majian Township | 0.081 | 0.008 | 0.006 | 0.637 | |
| Malian Township | 0.004 | 0.020 | 0.015 | 1.000 | |
| Huoshizhai Township | 0.013 | 0.007 | 0.005 | 0.230 | |
| Xitan Township | 0.062 | 0.011 | 0.008 | 0.964 | |
| Zhenhu Township | 0.109 | 0.010 | 0.008 | 0.714 | |
| Wangmin Township | 0.056 | 0.009 | 0.007 | 0.746 | |
| Tianping Township | 0.050 | 0.005 | 0.004 | 0.718 | |
| Baiya Township | 0.005 | 0.005 | 0.003 | 0.619 | |
| Xiaohe Township | 0.001 | 0.012 | 0.009 | 0.954 | |
| Hongyao Township | 0.017 | 0.005 | 0.004 | 0.485 | |
| Shizhi Township | 0.025 | 0.022 | 0.016 | 0.911 | |
| Piancheng Township | 0.021 | 0.011 | 0.008 | 0.899 | |
| Xingping Township | 0.074 | 0.012 | 0.009 | 0.580 | |
| Pingfeng Town | 0.074 | 0.009 | 0.007 | 0.815 | |
| Xinying Township | 0.015 | 0.008 | 0.006 | 0.010 | |
| Shagou Township | 0.013 | 0.007 | 0.005 | 0.450 | |
| Yuanzhou District | Huangduobao Town | 0.021 | 0.019 | 0.019 | 0.381 |
| Xinqu Street | 0.532 | 1.000 | 1.000 | 0.249 | |
| Beiyuan Street | 0.417 | 0.504 | 0.504 | 0.322 | |
| Sanying Town | 0.030 | 0.029 | 0.029 | 0.472 | |
| Zhonghe Township | 0.090 | 0.015 | 0.015 | 0.592 | |
| Touying Town | 0.036 | 0.018 | 0.018 | 0.669 | |
| Guanting Town | 0.038 | 0.004 | 0.004 | 0.679 | |
| Zhaike Township | 0.002 | 0.003 | 0.003 | 0.513 | |
| Kaicheng Town | 0.074 | 0.010 | 0.010 | 0.571 | |
| Zhangyi Town | 0.022 | 0.011 | 0.010 | 0.552 | |
| Pengbao Town | 0.080 | 0.015 | 0.015 | 0.750 | |
| Hechuan Township | 0.011 | 0.004 | 0.004 | 0.729 | |
| Tanshan Township | 0.021 | 0.002 | 0.002 | 0.575 | |
| Nanguan Street | 0.421 | 0.259 | 0.259 | 0.388 |
References
- Hill, E.M.; McCaughey, J.W.; Switzer, A.D.; Lallemant, D.; Wang, Y.; Sathiakumar, S. Human amplification of secondary earthquake hazards through environmental modifications. Nat. Rev. Earth Environ. 2024, 5, 463–476. [Google Scholar] [CrossRef]
- Chamberlain, E.L.; Goodbred, S.L.; Steckler, M.S.; Wallinga, J.; Reimann, T.; Akhter, S.H.; Bain, R.; Muktadir, G.; Al Nahian, A.; Rahman, F.M.A.; et al. Cascading hazards of a major Bengal basin earthquake and abrupt avulsion of the Ganges River. Nat. Commun. 2024, 15, 4975. [Google Scholar] [CrossRef]
- Moein, M.J.; Langenbruch, C.; Schultz, R.; Grigoli, F.; Ellsworth, W.L.; Wang, R.; Rinaldi, A.P.; Shapiro, S. The physical mechanisms of induced earthquakes. Nat. Rev. Earth Environ. 2023, 4, 847–863. [Google Scholar] [CrossRef]
- Feng, S.; Shao, X.; Guo, Y. Geological disaster characteristics and treatment design analysis in Longde County, Ningxia. Eng. Technol. Res. 2023, 8, 193–195. (In Chinese) [Google Scholar]
- Shang, H. Study on the Formation Mechanism of Geological Disasters in the Southern Mountainous Area of Ningxia. Master’s Thesis, Chang’an University, Xi’an, China, 2010. (In Chinese). [Google Scholar]
- Su, C. Risk Assessment of Environmental Geological Disasters in the Southern Mountainous Area of Ningxia in the Middle and Upper Reaches of the Yellow River. Master’s Thesis, Chang’an University, Xi’an, China, 2023. (In Chinese). [Google Scholar]
- Kong, F.; Sun, S. Better understanding the catastrophe risk in interconnection and comprehensive disaster risk defense capability, with special reference to China. Sustainability 2021, 13, 1793. [Google Scholar] [CrossRef]
- Liu, R.H.; Zhou, Y.Y.; Guo, L.; Zhai, X.Y.; Tian, J.Y.; Zhang, X.L.; Li, R. Research progress on flash flood early warning in the United States. China Flood Drought Prev. 2020, 30, 141–148. (In Chinese) [Google Scholar]
- Miura, T.; Nagai, S. Landslide detection with himawari-8 geostationary satellite data: A case study of a torrential rain event in Kyushu, Japan. Remote Sens. 2020, 12, 1734. [Google Scholar] [CrossRef]
- Qiu, H.; Ma, S.; Cui, Y.; Yang, D.; Pei, Y.; Liu, Z. Rethinking the role of landslides. J. Northwest Univ. (Nat. Sci. Ed.) 2020, 3, 377–385. (In Chinese) [Google Scholar]
- Sim, K.B.; Lee, M.L.; Wong, S.Y. A review of landslide acceptable risk and tolerable risk. Geoenviron. Disasters 2022, 9, 3. [Google Scholar] [CrossRef]
- Wang, Y.; Nie, L.; Zhang, M.; Wang, H.; Xu, Y.; Zuo, T. Assessment of debris flow risk factors based on meta-analysis—Cases study of northwest and southwest China. Sustainability 2020, 12, 6841. [Google Scholar] [CrossRef]
- He, J.; Liu, Q.; Xu, D.; Liu, Q.; Mao, Y.; Wang, C.; Wang, X. Landslide susceptibility assessment in Guangyuan City based on a clustering-information volume coupling model. Surv. Spat. Geogr. Inf. 2020, 12, 25–31. [Google Scholar]
- Wang, Y.; Nie, L.; Zhang, M.; Wang, H.; Xu, Y.; Zuo, T. Assessment of relative importance of debris flow disaster risk affecting factors based on meta-analysis–Cases study of northwest and southwest China. Nat. Hazards Earth Syst. Sci. Discuss. 2020, 2020, 1–22. [Google Scholar]
- He, N.; Qu, X.; Yang, Z.; Xu, L.; Gurkalo, F. Disaster mechanism and evolution characteristics of landslide–debris-flow geohazard chain due to strong earthquake—A case study of Niumian gully. Water 2023, 15, 1218. [Google Scholar] [CrossRef]
- Li, Y.; Liu, X.N.; Gan, B.R.; Wang, X.K.; Yang, X.G.; Li, H.B.; Long, X.Y.; Zhou, J.W. Formation-evolutionary mechanism analysis and impacts of human activities on the 20 August 2019 clustered debris flows event in Wenchuan County, southwestern China. Front. Earth Sci. 2021, 9, 616113. [Google Scholar] [CrossRef]
- Zhang, S.; Zhang, L.; Lacasse, S.; Nadim, F. Evolution of mass movements near epicentre of Wenchuan earthquake, the first eight years. Sci. Rep. 2016, 6, 36154. [Google Scholar] [CrossRef]
- Luo, L.; Pei, X.; Cui, S.; Huang, R.; Zhu, L.; He, Z. Study on the selection of factor combinations for landslide susceptibility assessment in the Jiuzhaigou earthquake area. Chin. J. Rock Mech. Eng. 2021, 11, 2306–2319. (In Chinese) [Google Scholar]
- Zulkafli, S.A.; Abd Majid, N. Urban Resilience in the Face of Natural Hazards: Leveraging Machine Learning to Assess Landslide Risk in Kuala Lumpur, Malaysia. Int. J. Acad. Res. Bus. Soc. Sci. 2024, 14, 252–267. [Google Scholar] [CrossRef] [PubMed]
- Yang, G.; Zhou, W.; Fang, J. Landslide susceptibility assessment based on the information value model and data standardization. J. Geo-Inf. Sci. 2018, 5, 674–683. (In Chinese) [Google Scholar]
- Bai, Z.C.; Lv, S.; Cao, K.; Wang, Y.P. Early identification and post-disaster monitoring of the Xinmo village landslide in Sichuan based on satellite-based/ground-based InSAR analysis. Prog. Geophys. 2020, 35, 1637–1643, (In Chinese Abstract). [Google Scholar]
- Ren, K.W.; Yao, X.; Zhao, X.M.; Zhou, Z.K.; Li, L.J. Landslide instability and failure prediction based on time-series InSAR, GPS, and image offset measurement data. J. Rock Mech. Eng. 2020, 39, 3421–3431. (In Chinese) [Google Scholar]
- Chen, Y.; Gao, P. Application of 3D laser scanning technology in landslide disaster monitoring. China High-Tech Enterp. 2024, 2, 138–139+142. (In Chinese) [Google Scholar]
- Mayr, A.; Bremer, M.; Rutzinger, M. 3D point errors and change detection accuracy of unmanned aerial vehicle laser scanning data. ISPRS Ann. Photogramm. Remote. Sens. Spat. Inf. Sci. 2020, 2, 765–772. [Google Scholar] [CrossRef]
- Chen, H.; Feng, X.; Liu, Y.; Zhao, H.; Liu, Y.; Guo, L.; Zhang, J. Research on predicting surface displacement of landslides based on CNN-BiLSTM-Attention in the Three Gorges reservoir area. Sediment. Geol. Tethyan Geol. 2024, 44, 572–581. [Google Scholar]
- Wu, J. Research on Landslide Geological Disaster Prediction Methods Based on Deep Learning. Master’s Thesis, University of Electronic Science and Technology of China, Chengdu, China, 2022. (In Chinese). [Google Scholar]
- Wu, Y.; Niu, R.; Wang, Y.; Chen, T. A fast deploying monitoring and real-time early warning system for the Baige Landslide in Tibet, China. Sensors 2020, 20, 6619. [Google Scholar] [CrossRef] [PubMed]
- Chen, L.; Ge, X.; Yang, L.; Li, W.; Peng, L. An Improved Multi-Source Data-Driven Landslide Prediction Method Based on Spatio-Temporal Knowledge Graph. Remote Sens. 2023, 15, 2126. [Google Scholar] [CrossRef]
- Wen, Z.; Hao, Y. Turning crisis into opportunity: The improvement of the emergency management system and development challenges—A review of the 10th anniversary of the Wenchuan earthquake. Theor. J. 2018, 4, 62–69. (In Chinese) [Google Scholar]
- Zhang, S. Current status and reflections on the flood and drought prevention emergency plan system construction in Liaoning Province. China Flood Drought Manag. 2022, 4, 63–65. (In Chinese) [Google Scholar]
- Wang, Y. Emergency response principles of Typhoon disaster. Open J. Soc. Sci. 2017, 5, 100–104. [Google Scholar] [CrossRef][Green Version]
- Xu, Q.; Li, W.; Dong, X.; Xiao, X.; Fan, X.; Pei, X. Preliminary study on the characteristics and causative mechanisms of the landslide in Xinmo Village, Diexi Town, Mao County, Sichuan. Chin. J. Rock Mech. Eng. 2017, 36, 2612–2628. (In Chinese) [Google Scholar][Green Version]
- Zhang, L. Early identification of loess landslide hazards based on time-series InSAR: A case study of the southwestern region of Bailuyuan. Northwest Geol. 2023, 56, 250–257. (In Chinese) [Google Scholar][Green Version]
- Deng, L.Z.; Yuan, H.Y.; Zhang, M.Z.; Chen, J.G. Research progress on landslide deformation monitoring and early warning technologies. J. Tsinghua Univ. (Sci. Technol.) 2023, 63, 849–864. (In Chinese) [Google Scholar][Green Version]
- Xu, Q. Understanding the landslide monitoring and early warning: Considerations of practical issues. J. Eng. Geol. 2020, 28, 360–374, (In Chinese Abstract). [Google Scholar][Green Version]
- Rigatti, S.J. Random forest. J. Insur. Med. 2017, 47, 31–39. [Google Scholar] [CrossRef]
- Che, V.B.; Kervyn, M.; Suh, C.E.; Fontijn, K.; Ernst, G.G.J.; del Marmol, M.-A.; Trefois, P.; Jacobs, P. Landslide susceptibility assessment in Limbe (SW Cameroon): A field calibrated seed cell and information value method. Catena 2012, 92, 83–98. [Google Scholar] [CrossRef]
- Liu, Y.; Xu, C.; Huang, B.; Ren, X.; Liu, C.; Hu, B.; Chen, Z. Landslide displacement prediction based on multi-source data fusion and sensitivity states. Eng. Geol. 2020, 271, 105608. [Google Scholar] [CrossRef]
- Wang, G. Research on Prevention and Control of Soil and Water Loss from Construction Projects in Ningxia Southern Region. Master’s Thesis, Beijing Forestry University, Beijing, China, 2013. (In Chinese with English Abstract). [Google Scholar]
- Zhou, S.; Huang, A.; Wu, J.; Wang, Y.; Lu, S.; Xing, Z. Meteorological disaster risk assessment based on combination weighting-TOPSIS method: A case study of Changzhou City. Ind. Saf. Environ. Prot. 2022, 48, 6–10, (In Chinese with English Abstract). [Google Scholar]
- Wang, L.; Chang, M.; Xing, Y. Risk assessment of landslide geological hazards based on information method model and GIS. J. Geol. Hazards Environ. Preserv. 2021, 32, 14–20, (In Chinese with English Abstract). [Google Scholar]
- Yang, G. Application of GIS information quantity method in geological disaster zoning evaluation. West. Min. Eng. 2020, 32, 7–10. (In Chinese) [Google Scholar]
- Zhen, M.; Guangchao, T.; Xuan, J. Application of information quantity method based on GIS in evaluation of geological disasters susceptibility in Jiuwanxi Basin. Resour. Environ. Eng. 2021, 35, 667–673+680, (In Chinese with English Abstract). [Google Scholar]
- Xinbang, G. Study on Risk Assessment of Landslide in Yunnan Province. Ph.D. Thesis, China University of Mining & Technology, Beijing, China, 2018. (In Chinese with English Abstract). [Google Scholar]
- Wang, Z.; Luo, P.; Zha, X.; Xu, C.; Kang, S.; Zhou, M.; Nover, D.; Wang, Y. Overview assessment of risk evaluation and treatment technologies for heavy metal pollution of water and soil. J. Clean. Prod. 2022, 379, 134043. [Google Scholar] [CrossRef]
- Wang, X.; Zhang, C.; Cui, W.; Zhu, Y.; Wang, H. Geological disaster susceptibility in Helong City based on Logistic Regression and Random Forest. J. Jilin Univ. (Earth Sci. Ed.) 2022, 52, 1957–1970, (In Chinese with English Abstract). [Google Scholar]
- Deng, N.; Shi, H.; Wen, Q.; Li, Y.; Cao, X. Collapse susceptibility evaluation of random forest model supported by information value model. Sci. Technol. Eng. 2021, 21, 2210–2217, (In Chinese with English Abstract). [Google Scholar]
- Zhao, X.; Xu, Z.; Liu, F.; Yang, H.; Zhang, T. Landslide susceptibility evaluation model based on XGBoost. Sci. Technol. Eng. 2022, 22, 10347–10354, (In Chinese with English Abstract). [Google Scholar]
- Cao, W.; Deng, P.; Xu, Z.; Zhang, W.; Ren, Y.; Nan, T. Landslide disaster vulnerability mapping study in Henan Province: Comparison of different machine learning models. Bull. Geol. Sci. Technol. 2025, 44, 101–111, (In Chinese with English Abstract). [Google Scholar]
- Zhou, X.; Huang, F.; Wu, W.; Zhou, C.; Zeng, S.; Pan, L. Regional landslide susceptibility prediction based on negative sample selected by coupling information value method. Adv. Eng. Sci. 2022, 54, 25–35, (In Chinese with English Abstract). [Google Scholar]
- Long, H.; Qian, S.; Jun, H. Landslide sensitivity assessment and error correction based on InSAR and random forest method. Bull. Surv. Mapp. 2022, 10, 13–20. (In Chinese) [Google Scholar] [CrossRef]
- Wang, X.; Zhang, L.; Mo, D.; Ye, Z.; Jiang, F. Hillslope geo-hazard susceptibility assessment in Pingguo City based on coupling of CF information value and MLPC classifier model. Carsologica Sin. 2023, 42, 370–381, (In Chinese with English Abstract). [Google Scholar]
- Luo, P.; Luo, M.; Li, F.; Qi, X.; Huo, A.; Wang, Z.; He, B.; Takara, K.; Nover, D.; Wang, Y. Urban flood numerical simulation: Research, methods and future perspectives. Environ. Model. Softw. 2022, 156, 105478. [Google Scholar] [CrossRef]
- Liu, A.; Yan, H.; Zhang, R.; Liu, G.; Zhang, R. Risk assessment of storm water flooding based on fuzzy comprehensive evaluation method: A case study of Xinxiang City in Henan Province. Surv. Mapp. 2022, 45, 5. (In Chinese) [Google Scholar]
- Goumrasa, A.; Guendouz, M.; Guettouche, M.S.; Belaroui, A. Flood hazard susceptibility assessment in Chiffa wadi watershed and along the first section of Algeria North–South highway using GIS and AHP method. Appl. Geomat. 2021, 13, 565–585. [Google Scholar] [CrossRef]
- Mehmood, Q.; Qing, W.; Chen, J.; Yan, J.; Ammar, M.; Rahman, G.; Nasrullah. Susceptibility assessment of single gully debris flow based on AHP and extension method. Civ. Eng. J. 2021, 7. [Google Scholar] [CrossRef]
- Panchal, S.; Shrivastava, A.K. Landslide hazard assessment using analytic hierarchy process (AHP): A case study of National Highway 5 in India. Ain Shams Eng. J. 2022, 13, 101626. [Google Scholar] [CrossRef]
- Souissi, D.; Zouhri, L.; Hammami, S.; Msaddek, M.H.; Zghibi, A.; Dlala, M. GIS-based MCDM–AHP modeling for flood susceptibility mapping of arid areas, southeastern Tunisia. Geocarto Int. 2020, 35, 991–1017. [Google Scholar] [CrossRef]
- Liu, X.; Wang, D. Bidding evaluation behavior analysis of grouped multi-attribute reverse auction based on qualitative simulation. Dongbei Daxue Xuebao/J. Northeast. Univ. 2012, 33, 314–317+322. [Google Scholar]
- Capobianco, V.; Uzielli, M.; Kalsnes, B.; Choi, J.C.; Strout, J.M.; Von Der Tann, L.; Steinholt, I.H.; Solheim, A.; Nadim, F.; Lacasse, S. Recent innovations in the LaRiMiT risk mitigation tool: Implementing a novel methodology for expert scoring and extending the database to include nature-based solutions. Landslides 2022, 19, 1563–1583. [Google Scholar] [CrossRef]
- Ma, Z.; Mei, G. Deep learning for geological hazards analysis: Data, models, applications, and opportunities. Earth Sci. Rev. 2021, 223, 103858. [Google Scholar] [CrossRef]
- Zhang, T.Y.; Mao, Z.A.; Wang, T. GIS-based evaluation of landslide susceptibility using a novel hybrid computational intelligence model on different mapping units. J. Mt. Sci. 2020, 17, 2929–2941. [Google Scholar] [CrossRef]
- Wang, C.; Lin, Q.; Wang, L.; Jiang, T.; Su, B.; Wang, Y.; Mondal, S.K.; Huang, J.; Wang, Y. The influences of the spatial extent selection for non-landslide samples on statistical-based landslide susceptibility modelling: A case study of Anhui Province in China. Nat. Hazards 2022, 112, 1967–1988. [Google Scholar] [CrossRef]
- Chen, X.; Liu, S.; Liu, R.W.; Wu, H.; Han, B.; Zhao, J. Quantifying Arctic oil spilling event risk by integrating an analytic network process and a fuzzy comprehensive evaluation model. Ocean. Coast. Manag. 2022, 228, 106326. [Google Scholar] [CrossRef]
- He, S.; Song, D.; Mitri, H. Integrated rockburst early warning model based on fuzzy comprehensive evaluation method. Int. J. Rock Mech. Min. Sci. 2021, 142, 104767. [Google Scholar] [CrossRef]
- Akram, M.; Luqman, A.; Alcantud, J.C.R. An integrated ELECTRE-I approach for risk evaluation with hesitant Pythagorean fuzzy information. Expert Syst. Appl. 2022, 200, 116945. [Google Scholar] [CrossRef]
- Lin, S.S.; Shen, S.L.; Zhou, A.; Xu, Y.S. Risk assessment and management of excavation system based on fuzzy set theory and machine learning methods. Autom. Constr. 2021, 122, 103490. [Google Scholar] [CrossRef]
- Chen, W.L.Y. GIS-based evaluation of landslide susceptibility using hybrid computational intelligence models. Catena Interdiscip. J. Soil Sci. Hydrol.-Geomorphol. Focus. Geoecology Landsc. Evol. 2020, 195, 104777. [Google Scholar] [CrossRef]
- Zhu, W.; Zhang, T.; Wu, Y.; Li, S.; Li, Z. Research on optimization of an enterprise financial risk early warning method based on the DS-RF model. Int. Rev. Financ. Anal. 2022, 81, 102140. [Google Scholar] [CrossRef]
- Nhu, V.H.; Shirzadi, A.; Shahabi, H.; Chen, W.; Clague, J.J.; Geertsema, M.; Jaafari, A.; Avand, M.; Miraki, S.; Talebpour Asl, D.; et al. Shallow landslide susceptibility mapping by Random Forest base classifier and its ensembles in a semi-arid region of Iran. Forests 2020, 11, 421. [Google Scholar] [CrossRef]
- Band, S.S.; Janizadeh, S.; Pal, S.C.; Saha, A.; Chakrabortty, R.; Melesse, A.M.; Mosavi, A. Flash flood susceptibility modeling using new approaches of hybrid and ensemble tree-based machine learning algorithms. Remote Sens. 2020, 12, 3568. [Google Scholar] [CrossRef]
- Sun, D.; Wen, H.; Wang, D.; Xu, J. A random forest model of landslide susceptibility mapping based on hyperparameter optimization using Bayes algorithm. Geomorphology 2020, 362, 107201. [Google Scholar] [CrossRef]
- Chen, W.; Li, Y.; Xue, W.; Shahabi, H.; Li, S.; Hong, H.; Wang, X.; Bian, H.; Zhang, S.; Pradhan, B.; et al. Modeling flood susceptibility using data-driven approaches of naïve bayes tree, alternating decision tree, and random forest methods. Sci. Total Environ. 2020, 701, 134979. [Google Scholar] [CrossRef]
- Zhou, L.; Dang, X.; Sun, Q.; Wang, S. Multi-scenario simulation of urban land change in Shanghai by random forest and CA-Markov model. Sustain. Cities Soc. 2020, 55, 102045. [Google Scholar] [CrossRef]
- Zhang, K.; Shalehy, M.H.; Ezaz, G.T.; Chakraborty, A.; Mohib, K.M.; Liu, L. An integrated flood risk assessment approach based on coupled hydrological-hydraulic modeling and bottom-up hazard vulnerability analysis. Environ. Model. Softw. 2022, 148, 105279. [Google Scholar] [CrossRef]
- Feng, B.; Zhang, Y.; Bourke, R. Urbanization impacts on flood risks based on urban growth data and coupled flood models. Nat. Hazards 2021, 106, 613–627. [Google Scholar] [CrossRef]
- Chun, Y.; Wei, Z.; Xin, Y. Coupling coordination evaluation and sustainable development pattern of geo-ecological environment and urbanization in Chongqing municipality, China. Sustain. Cities Soc. 2020, 61, 102271. [Google Scholar] [CrossRef]
- Parsa, A.B.; Movahedi, A.; Taghipour, H.; Derrible, S.; Mohammadian, A.K. Toward safer highways, application of XGBoost and SHAP for real-time accident detection and feature analysis. Accid. Anal. Prev. 2020, 136, 105405. [Google Scholar] [CrossRef]
- Abedi, R.; Costache, R.; Shafizadeh-Moghadam, H.; Pham, Q.B. Flash-flood susceptibility mapping based on XGBoost, random forest and boosted regression trees. Geocarto Int. 2022, 37, 5479–5496. [Google Scholar] [CrossRef]
- Li, Z. Extracting spatial effects from machine learning model using local interpretation method: An example of SHAP and XGBoost. Comput. Environ. Urban Syst. 2022, 96, 101845. [Google Scholar] [CrossRef]
- Zhang, K.; Wang, S.; Bao, H.; Zhao, X. Characteristics and influencing factors of rainfall-induced landslide and debris flow hazards in Shaanxi Province, China. Nat. Hazards Earth Syst. Sci. 2019, 19, 93–105. [Google Scholar] [CrossRef]
- Huang, F.; Chen, J.; Liu, W.; Huang, J.; Hong, H.; Chen, W. Regional rainfall-induced landslide hazard warning based on landslide susceptibility mapping and a critical rainfall threshold. Geomorphology 2022, 408, 108236. [Google Scholar] [CrossRef]
- Huang, F.; Yan, J.; Fan, X.; Yao, C.; Huang, J.; Chen, W.; Hong, H. Uncertainty pattern in landslide susceptibility prediction modelling: Effects of different landslide boundaries and spatial shape expressions. Geosci. Front. 2022, 13, 101317. [Google Scholar] [CrossRef]
- Shi, Z.; Wu, B.; Zheng, H.; Peng, M. State of the art on prevention and control measures and impact model for debris flow. Earth Sci. 2022, 47, 4339–4349, (In Chinese with English Abstract). [Google Scholar]
- Hu, S.; Wang, J.; Zhou, C.; Zhang, J. Research on the risk assessment and prevention of collapse disaster in Huangshan scenic area. Geogr. Res. 2013, 32, 1814–1823, (In Chinese with English Abstract). [Google Scholar]
- Sun, D.; Yang, T.; Cao, N.; Qin, L.; Hu, X.; Wei, M.; Meng, M.; Zhang, W. Characteristics and mitigation of coseismic geohazards associated with the Luding Ms 6.8 earthquake. Earth Sci. Front. 2023, 30, 476–493, (In Chinese with English Abstract). [Google Scholar]
- Wang, T.; Jia, H.; Sun, Q.; Tan, X.; Tang, L. Effects of thawing-induced softening on fracture behaviors of frozen rock. J. Rock Mech. Geotech. Eng. 2023, 16, 979–989. [Google Scholar] [CrossRef]
- Jia, H.; Ding, S.; Zi, F.; Dong, Y.; Shen, Y. Evolution in sandstone pore structures with freeze-thaw cycling and interpretation of damage mechanisms in saturated porous rocks. Catena 2020, 195, 104915. [Google Scholar] [CrossRef]
- Qiao, Q. Analysis of risks and benefits of the Gujia wetland ecological restoration project. China Hous. Facil. 2023, 11, 52–54. (In Chinese) [Google Scholar]
- Liu, L.; Wu, R.; Lou, Y.; Luo, P.; Sun, Y.; He, B.; Hu, M.; Herath, S. Exploring the Comprehensive Evaluation of Sustainable Development in Rural Tourism: A Perspective and Method Based on the AVC Theory. Land 2023, 12, 1473. [Google Scholar] [CrossRef]
Disclaimer/Publisher’s Note: The statements, opinions and data contained in all publications are solely those of the individual author(s) and contributor(s) and not of MDPI and/or the editor(s). MDPI and/or the editor(s) disclaim responsibility for any injury to people or property resulting from any ideas, methods, instructions or products referred to in the content. |
© 2025 by the authors. Licensee MDPI, Basel, Switzerland. This article is an open access article distributed under the terms and conditions of the Creative Commons Attribution (CC BY) license (https://creativecommons.org/licenses/by/4.0/).