Article

Evaluating Spatial Representativity in a Stakeholder-Driven Honeybee Monitoring Network Across Italy

CREA—Research Centre for Agriculture and Environment, Via di Corticella 133, 40128 Bologna, Italy
*
Author to whom correspondence should be addressed.
Land 2025, 14(10), 1957; https://doi.org/10.3390/land14101957
Submission received: 25 August 2025 / Revised: 22 September 2025 / Accepted: 24 September 2025 / Published: 27 September 2025

Abstract

Stakeholder participation is increasingly promoted in ecological monitoring programmes, yet it raises critical questions about the spatial representativity and scientific robustness of resulting datasets. This study evaluates the representativeness of BeeNet, Italy’s national honeybee monitoring network (2019–2025), in depicting the agricultural landscape despite the non-randomised placement of selected apiaries. Apiaries were selected from voluntary beekeepers, balancing stakeholder participation with the objectives of the project. The distribution of over 300 workstations was assessed across Italian regions in relation to surface area and agricultural land-use composition, using Corine Land Cover (CLC) data aggregated into macro-categories. The analysis revealed that, although regional imbalances persist, particularly in mountainous areas or regions with challenging climatic conditions, the network broadly reflects the agricultural landscape in accordance with project objectives. Agricultural categories such as “orchards,” “meadows,” and “complex agricultural surfaces” are often well represented, though limitations in CLC classification likely lead to underestimation in mosaic agroecosystems, such as mixed olive groves and vineyards. An overrepresentation of “anthropic” areas indicated a tendency to situate apiaries in rural yet accessible locations. By combining spatial analyses with field observations and apiary-level data, a refined categorisation of land types and explicit consideration of beekeeping practices, such as nomadism, could strengthen the interpretative capacity of such network. The results underline the importance of spatial validation of stakeholder-driven monitoring to ensure ecological datasets are reliable, policy-relevant, and scientifically robust.

1. Introduction

Honeybees are increasingly used as effective bioindicators in environmental monitoring due to their close interaction with the surrounding ecosystem. In a meta-analysis of 80 plant–pollinator interaction networks, honeybees were found to be the most frequent floral visitors in natural habitats worldwide [1]. As they forage over large areas, honeybees collect pollen, nectar, resin, and water, inadvertently gathering information about the chemical and biological conditions of their environment [2,3]. This makes them valuable for detecting pollutants [2,4] and organic contaminants [3,5,6]. Their wide distribution, ecological relevance, and connection to key stakeholder groups, such as beekeepers and farmers, further support their use in large-scale monitoring programmes aimed at guiding sustainable land management and policy decisions [1,7]. This context underpins the Italian BeeNet project, which was designed to investigate the agroecosystem by selecting sentinel apiaries across the countryside. The project was confronted with several key challenges, namely the selection of apiaries, the verification of their placement, and the need to ensure that their distribution accurately reflected the agricultural landscape in line with the project’s objectives. The spatial scale adopted in honeybee-based monitoring studies varies considerably, as does the number of hives/apiaries/sites surveyed. These differences directly affect the resolution, comparability, and representativity of the data collected.
Many studies are designed around regional or sub-national boundaries, allowing researchers to highlight internal spatial heterogeneity, such as differences across land-use types or environmental gradients. For instance, Gutiérrez et al. [8] conducted a study within the municipal territory of Córdoba, Spain, which spans approximately 1255 km2. Their investigation involved 10 hives-sites, strategically placed to capture variations among urban, industrial, agricultural, and forested areas. In contrast, Ngat et al. [9] explored northern Vietnam’s agro-ecological zones, covering a much broader area: eight provinces plus one centrally administered municipality (Hanoi’s peri-urban district), representing a combined territory of approximately 40,000 km2. Their study represented 24 sites, reflecting a compromise between spatial coverage and logistical feasibility. At the national scale, van der Steen et al. [10] implemented a large-scale monitoring programme across the entire Netherlands, a country with a land area of approximately 33,720 km2. Their study is one of the most comprehensive in terms of sampling density, involving 150 apiaries-sites (and 750 hives) distributed across diverse land-use categories, including urban, agricultural, and natural zones. This level of effort enabled fine-scale spatial analyses while also supporting robust generalisations at the country level. These examples illustrate how both the geographic extent and the sampling intensity (i.e., number of hives-apiaries-sites) critically influence the interpretability of environmental monitoring data. A clear understanding of spatial representativity (how well the selected monitoring sites reflect the larger landscape or agroecosystem) is essential not only for accurate inference but also for ensuring replicability and comparability across regions and studies. As honeybee monitoring increasingly informs policy and conservation efforts, aligning sampling design with meaningful ecological and governance boundaries becomes ever more important.
Another key issue is how the inclusion of stakeholders affects both study design and outcomes, as for the degree and nature of stakeholder engagement. Beekeepers are central to honeybee management, providing both hive products and pollination services. When they place apiaries in agroecosystems, they are concerned about agricultural practices that may harm bee health [11] as well as crops that provide bees with food. Farmers benefit from pollination services, often in collaboration with beekeepers [7]. Policymakers had to respond to the request of management of resources from both, beekeepers and farmers. Researchers, who are accustomed to applying rigorous methodologies and maintaining control over data collection, are increasingly involved in designing and implementing alternative, participatory data collection protocols. These efforts legitimise the experiential knowledge stakeholders bring. Participatory research typically includes establishing a shared conceptual framework, agreeing on methods and practices, collecting data, and engaging in collaborative analyses. However, this approach demands a time-intensive and well-structured operational framework [12,13]. Scientific projects involving stakeholders offer both advantages and disadvantages [14,15]. On the one hand, stakeholder engagement can broaden data collection and facilitate the dissemination of results among target audiences. On the other hand, adopting a participatory approach may compromise the scientific rigour of the data. Such trade-offs are typically evaluated and accepted during the development of data collection protocols. However, understanding the extent to which these compromises influence the final outcomes remains a complex challenge. Researchers typically design studies to yield results that are applicable at the international level. However, stakeholder involvement introduces limitations, and descriptors must be adapted to local conditions. Still, the process of integrating stakeholders and acknowledging these constraints can enrich scientific discourse and offer a replicable model for other countries or regions.
This work examined how environmental and governance-related landscape boundaries, as well as the active involvement of beekeepers, influence the large-scale validation of results and their replicability beyond the national level. The nationwide project BeeNet (2019–2025) was established to assess Italian agroecosystems through honeybee-based monitoring. The network was built by involving beekeepers, coordinated through three major national associations, in order to achieve a broad geographical coverage of sentinel apiaries across the Italian peninsula and islands. While this participatory approach ensured large-scale data collection, the non-random selection of apiary-sites introduced potential biases in the spatial representation of the agro-environment. To evaluate the actual representativeness of the network, sentinel apiaries were compared with the distribution of Utilised Agricultural Area (UAA) at both national and regional (NUTS2) levels. Landscape analyses were conducted using the CORINE Land Cover (CLC) inventory, which was further aggregated into macro-categories relevant to honeybee foraging. This approach not only validates the representativity of a stakeholder-driven monitoring framework, but also provides a transferable methodology that can be adopted in other countries where the honeybee sector plays a key role in both agriculture and the national economy.

2. Materials and Methods

2.1. Selection of BeeNet Workstations

The network of apiaries (Figure 1a) was established through a selection process based on a list of candidates voluntarily proposed by members of three major national beekeeping associations. Each association was asked to nominate a limited number of participants. This number was defined a priori according to regional characteristics, including total area (Figure 1b), agricultural surface, and the coverage of the beekeepers’ associations in the region. Each association informed its members of the opportunity to participate in the monitoring project. Participating beekeepers were required to dedicate five colonies from one apiary for data collection (on management and colony conditions) and for the sampling of adult bees and bee bread. Proposed apiaries were expected to meet the following criteria:
  • Fixed location in an agroecosystem: the apiary (at least, the five colonies devoted to the project) had to be stationary and not used for migratory beekeeping.
  • Beekeepers were asked to confirm that more than 50% of the land within a 1.5 km radius around the apiary consisted of agricultural or semi-natural habitats. This ensured that the data collected would reliably reflect the characteristics of the surrounding agri-environment.
  • Professional production: only apiaries used for professional honey production were eligible. This criterion helped maintain consistency in management practices across sites and reliability of samples. Production goals (e.g., honey, queens, royal jelly) and beekeeping experience can greatly influence hive management.
  • Long-term commitment: beekeepers had to agree to participate for the full duration of the monitoring period (three years), allow regular technical visits, share management data, and permit the installation of experimental high-tech monitoring devices on their hives.
Once the list of potential apiaries was received, each location was reviewed using cartographic tools to verify eligibility avoiding spatial overlap (apiaries should be at least at 3 km one from the other). Appendix A, Table A1 reports details on means of verification applied on the above criteria, carried out along the project and before the current analyses. In total, the monitoring network included nearly 420 apiaries, though the analyses presented here refer to 363 of them.

2.2. Landscape Analyses: Apiary Surroundings

The analysis focuses on the landscape as experienced by a foraging honeybee, which typically covers an area within a 1.5 km radius from the hive. Accordingly, a circular buffer was defined around each apiary, using the apiary as the centre point (Figure 1c). This area, hereafter referred to as the BeeNet buffer, represents the spatial scale of landscape interaction for each monitoring site. From an administrative perspective, each apiary’s location was initially determined based on regional boundaries, using data from the Italian National Institute of Statistics (ISTAT; https://www.istat.it/it/archivio/222527; updated 2021; accessed on 21 July 2022). Each apiary was therefore assigned to a specific region. Although the apiary itself is a single georeferenced point that clearly falls within one region, the corresponding 1.5 km buffer could extend across multiple regions. This occurred in five cases. In such instances, the buffer was split, and the corresponding contents were attributed proportionally to each relevant region. Additionally, in four cases, the buffers of different apiaries overlapped within the same region, possibly due to poor precision on initial coordinates; overlapping areas were only counted once in the regional tally.
The next step involved characterising the content of each buffer in terms of land-use and landscape structure. The Corine Land Cover (CLC) inventory (https://groupware.sinanet.isprambiente.it/uso-copertura-e-consumo-di-suolo/library/copertura-del-suolo/corine-land-cover/clc2018_shapefile; updated 2018; accessed on 21 July 2022) was employed as primary data source (Figure 1d). To make the information more relevant to bee foraging and habitat use, a custom classification system was developed, based on the original CLC categories, grouping them into broader macro-categories with potential ecological value for bees (Table 1; Figure 1e). The macro-categories “Anthropic” and “Waters” were retained as they may include important foraging and nesting habitats such as urban parks, rural green areas, and riparian zones, known to support both aquatic and terrestrial biodiversity. The category “Seas and Oceans”, although present in the CLC data, was excluded from further analysis due to its irrelevance to bee ecology. As a result, a dataset was completed with entries for each region, reporting varying values depending on the extent of Utilised Agricultural Area (UAA) and other land-use types within each buffer (see Appendix A, Table A2 on regional buffers and Table A3 on BeeNet buffers). All spatial analyses were carried out using the open-source software QGIS (version 3.28.4 Firenze).
Table 1. CLC categories defining the environment, present in the country (Italy) and in the buffers of BeeNet apiaries.
Macro-Categories 1CLC Categories Identifier 2CLC
Italy 3
CLC BeeNet 4
Anthropic 111; 112; 121; 1211; 122; 123; 124; 131; 132; 133; 141; 1421211
Arable Crops211; 2111; 2112; 21243
Paddies21311
Vineyards22111
Orchards22211
Olive Groves22311
Meadows23111
Complex Agricultural Surfaces224; 2241; 241; 242; 243; 24466
Woods311; 3111; 3112; 3113; 3114; 3115; 3116; 3117; 312; 3121; 3122; 3123; 3124; 3125; 313; 3131; 31321713
Other Natural Areas321; 3211; 3212; 322; 323; 3231; 3232; 324; 3241; 331; 332; 333; 334; 335; 411; 412; 421; 4221812
Waters511; 512; 521; 52242
Seas And Oceans52311
1 macro-categories defined for the present study, according to a bee perspective; 2 CLC categories conceptually fitting into the macro-categories; light grey corresponds to presence in Italy but not in BeeNet buffers; bold black corresponds to presence in both, Italy and BeeNet buffers. 3 Number of CLC categories present in Italy; 4 Number of CLC categories present in the BeeNet buffers.

2.3. Data Analyses

Each region was described individually using the following parameters (Table 2): the total regional surface area as defined by administrative boundaries (km2); the area encompassed by BeeNet buffers within the region (i.e., the combined area of all buffers for workstations located in that region, in km2); the number of monitoring workstations present in the region (n); and an estimation of the area around workstations (in km2), assuming they were evenly distributed across the region.
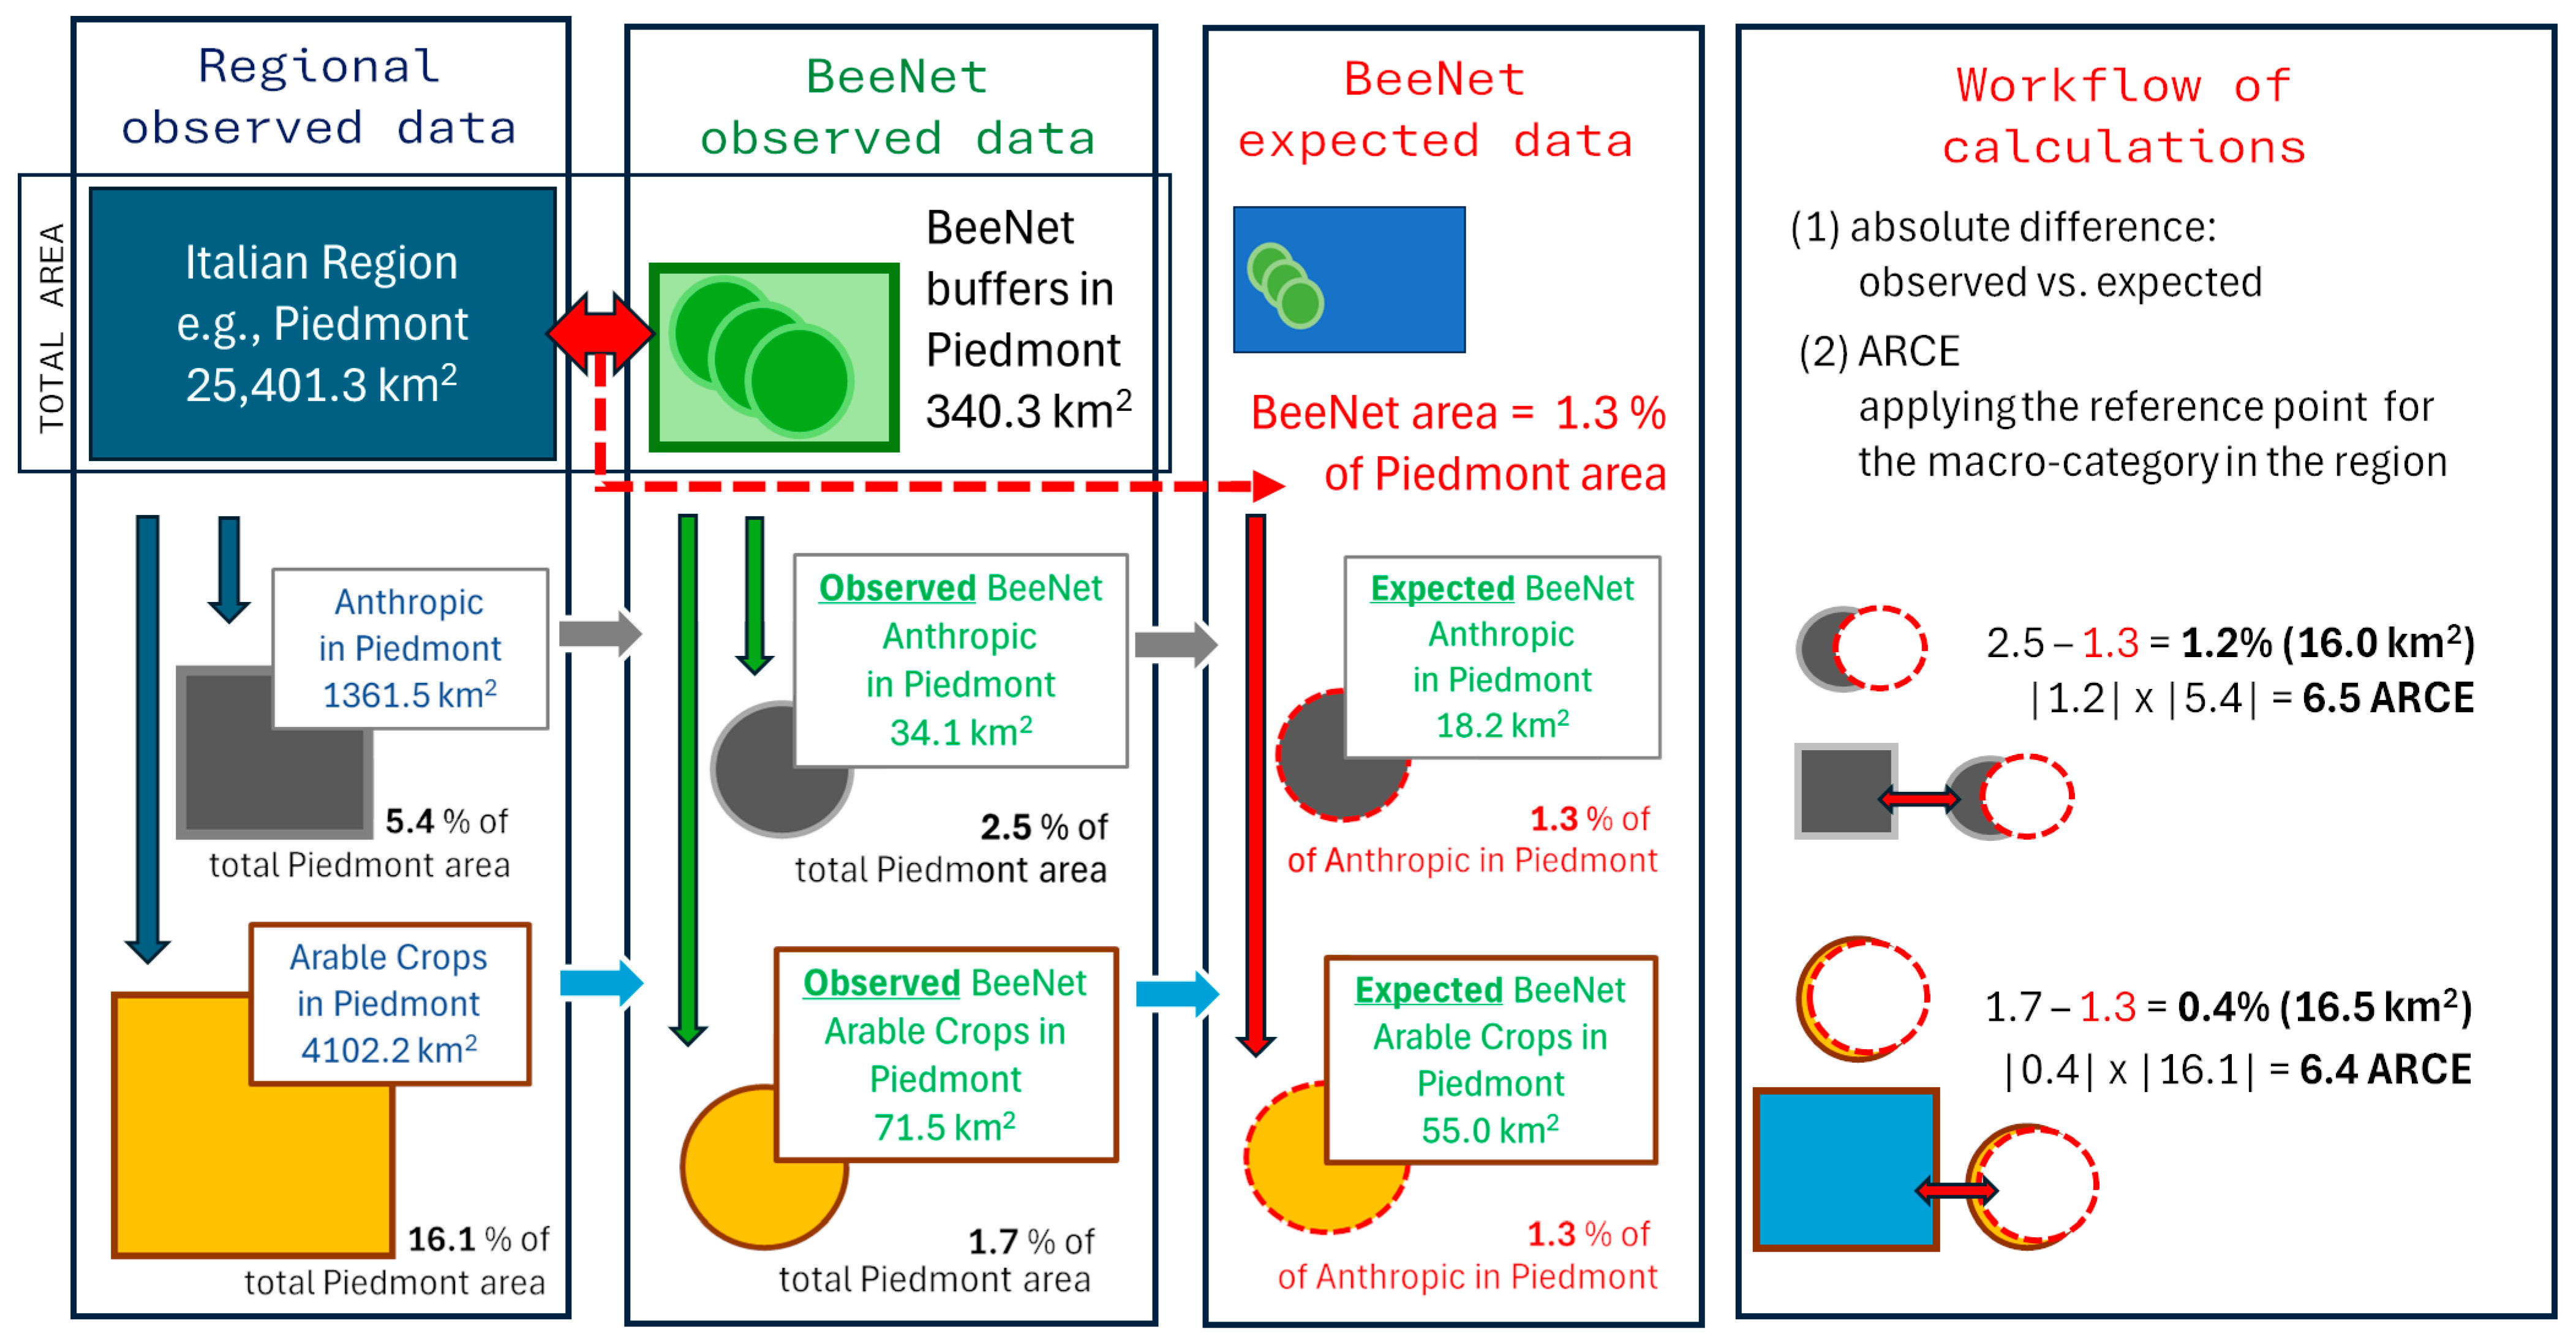
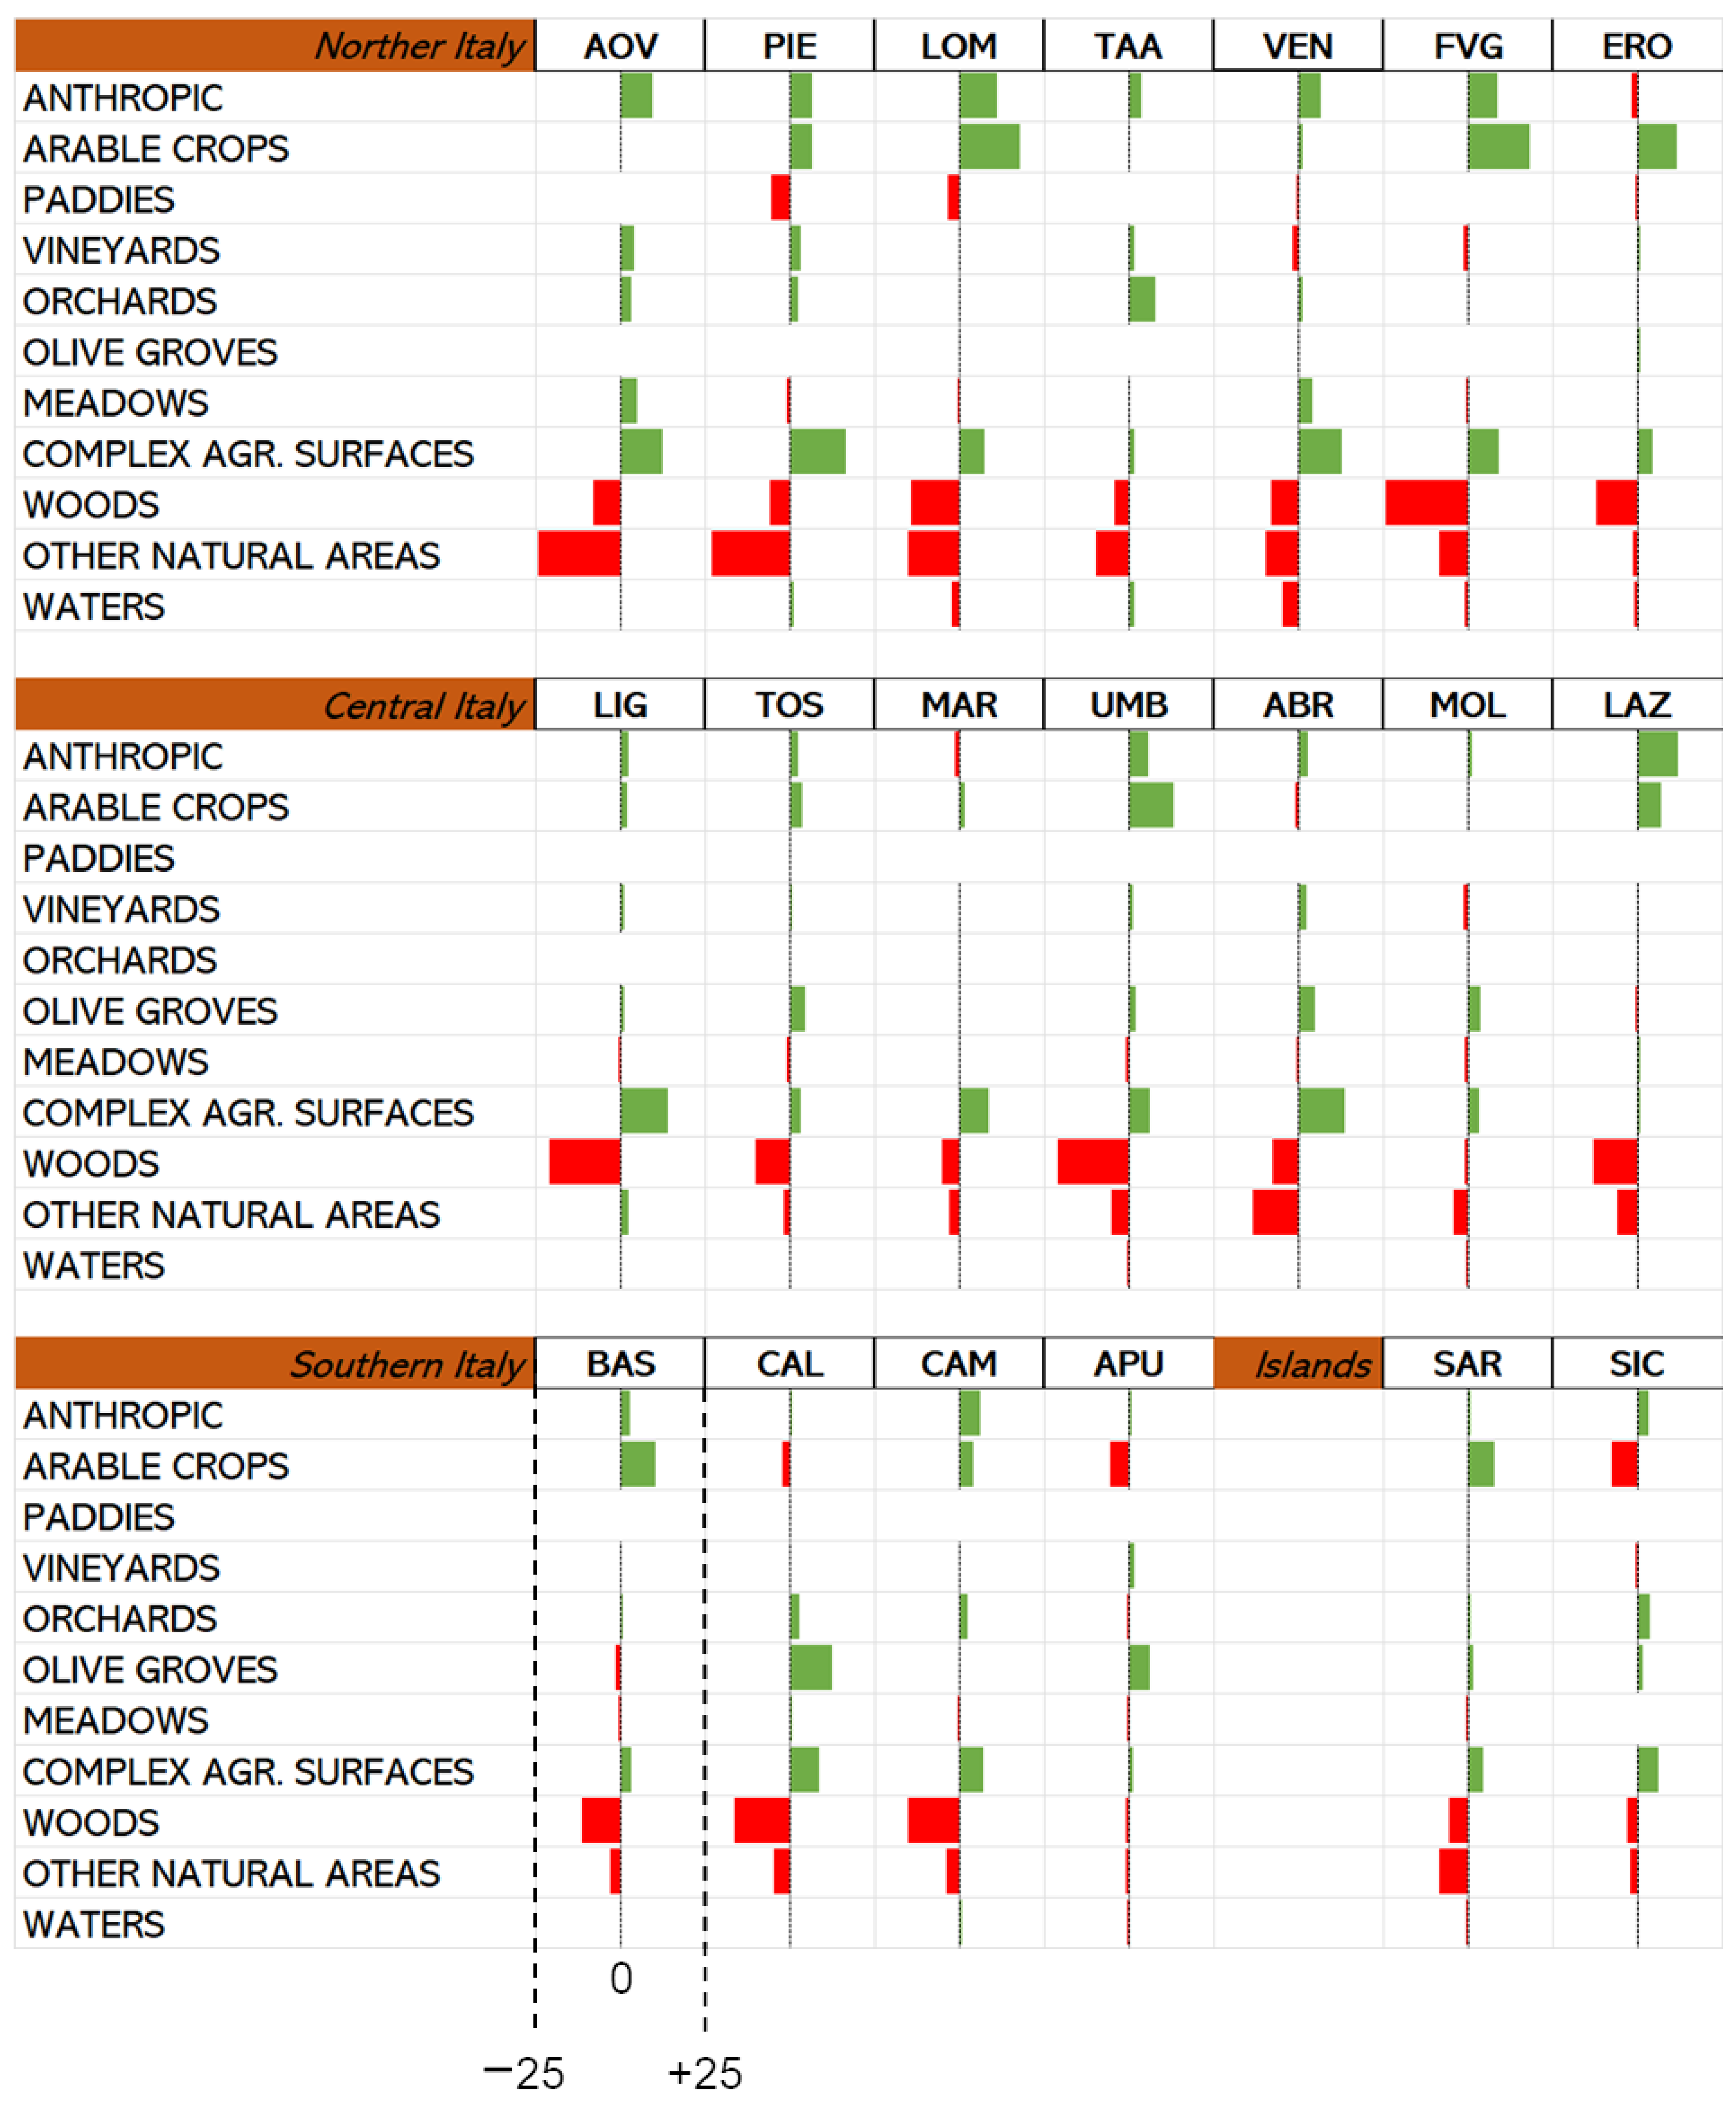
The distribution of macro-categories was compared at both, the national and the regional levels. At the national level, the percentage differences between two land area clusters was calculated: the entire Italian territory and the BeeNet buffer areas. At the regional level, the percentage representation of each macro-category was analysed and differences assessed between observed and expected values (Figure 2). Expected values were based on reference points calculated for each macro-category within each region (e.g., “anthropic” in Piedmont; “arable crops” in Piedmont). These reference points reflect the percentage of each macro-category in the regional landscape. The proportion of each region covered by BeeNet buffers was then estimated and applied this proportion to the regional reference values to calculate the expected coverage of each macro-category within BeeNet buffers. This assumes that, if the BeeNet network is spatially representative, the macro-category distribution within BeeNet buffers should match or exceed the expected values based on the regional proportions. This comparison allows to evaluate whether the monitoring network adequately represents the agri-environmental diversity of each region.
To standardise comparisons across categories and regions, the ARCE value (Absolute Reference for Comparing Extensions) was introduced, which quantifies the difference between observed and expected macro-category coverage. The ARCE value was calculated as the average (and standard deviation) of all macro-categories within each region, visualising differences among regions.

3. Results

3.1. Selection of BeeNet Workstations

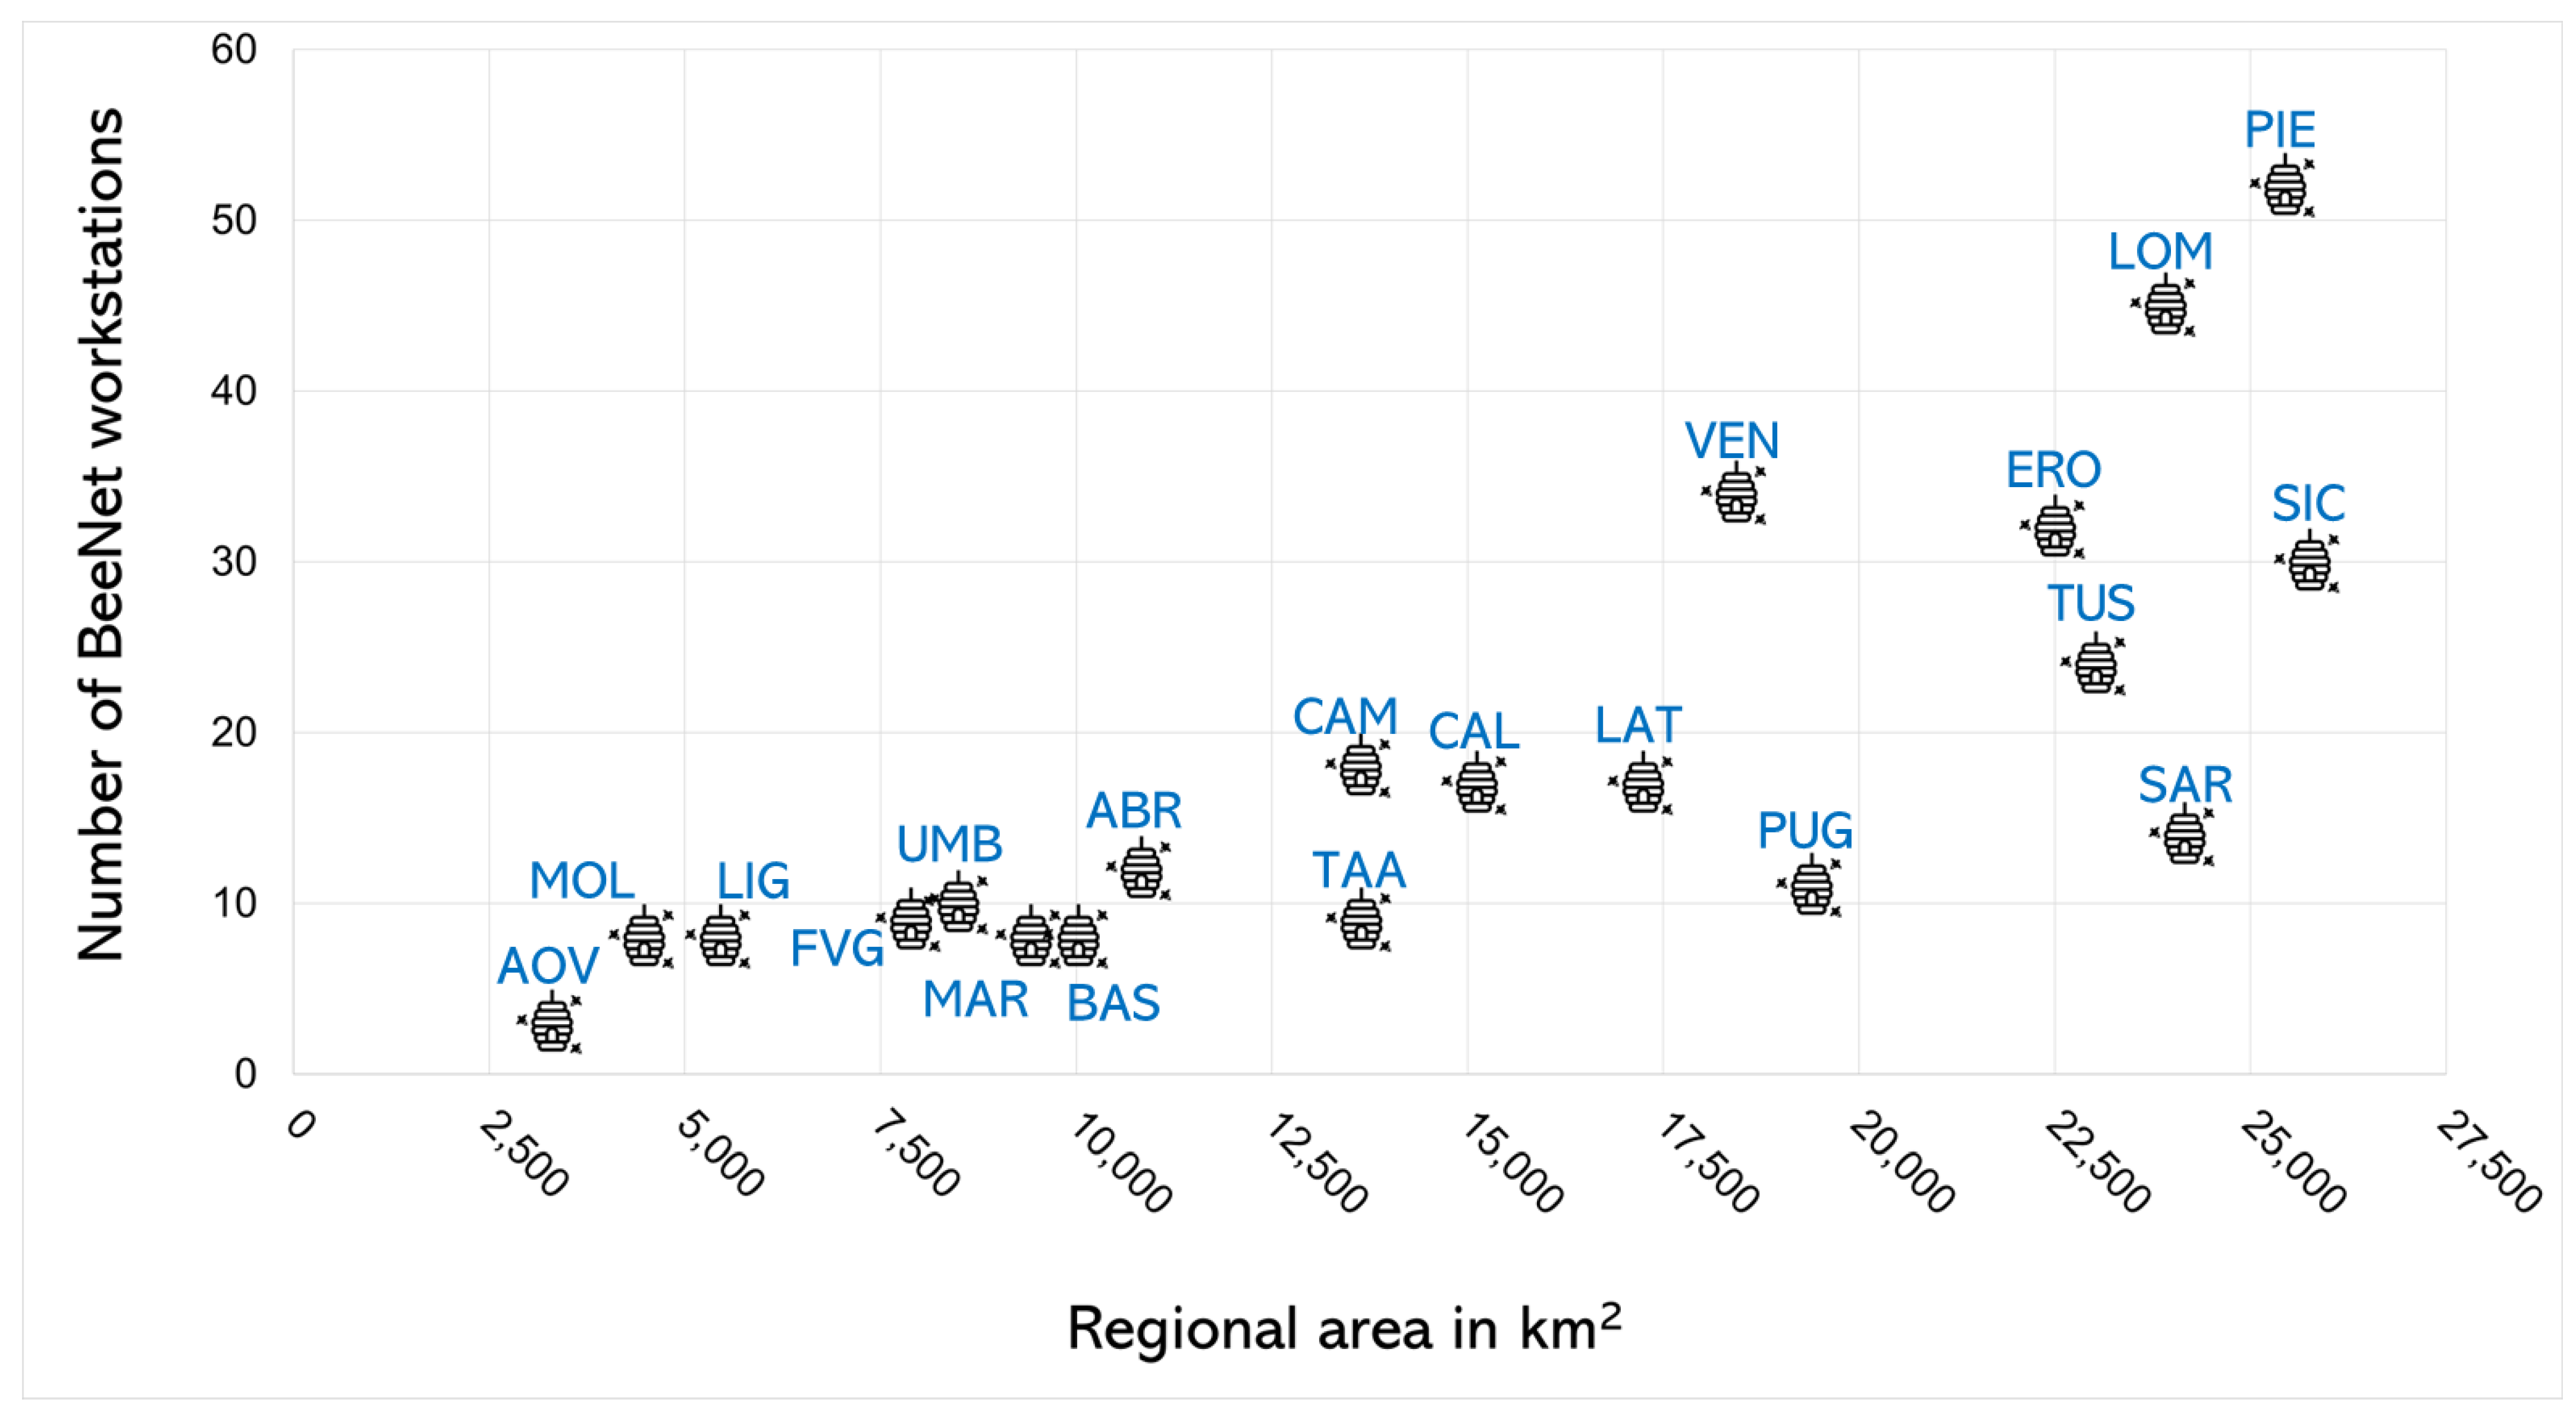
The first approach refers to the variation in the number of workstations across regions. Italian regions vary considerably in size: the smallest is Aosta Valley (AOV), covering 3262.2 km2, while the largest is Sicily (SIC), with 25,705.2 km2. Overall, the distribution of BeeNet apiaries appears to reflect regional surface area relatively well (Figure 3), aligning with our effort to maintain a balance between the number of workstations per region and the extent of Utilised Agricultural Area (UAA). The smallest number of workstations was recorded in the smallest region (Aosta Valley, n = 3), while the highest number was found in Piedmont (PIE, n = 49), a region whose size (25,401.3 km2) is comparable to that of Sicily. However, some discrepancies emerge. For example, the two largest regions, Piedmont and Sicily, host markedly different numbers of workstations (PIE: n = 49; SIC: n = 30). Similarly, regions such as Friuli-Venezia Giulia (FVG) and Trentino-Alto Adige (TAA), or Molise (MOL) and Marche (MAR), have nearly equal numbers of workstations, despite one region being approximately half the size of the other. This imbalance is also reflected in the estimated land area surrounding a single workstation (Table 2). If the workstations were evenly distributed across a region, the area assigned to each (based on total regional surface) would be relatively uniform. Instead, this figure ranges from 518.4 km2 per workstation in Piedmont to 1757.0 km2 in Apulia (APU), illustrating the variation in coverage density across regions.

3.2. Landscape Analyses: Apiary Surroundings

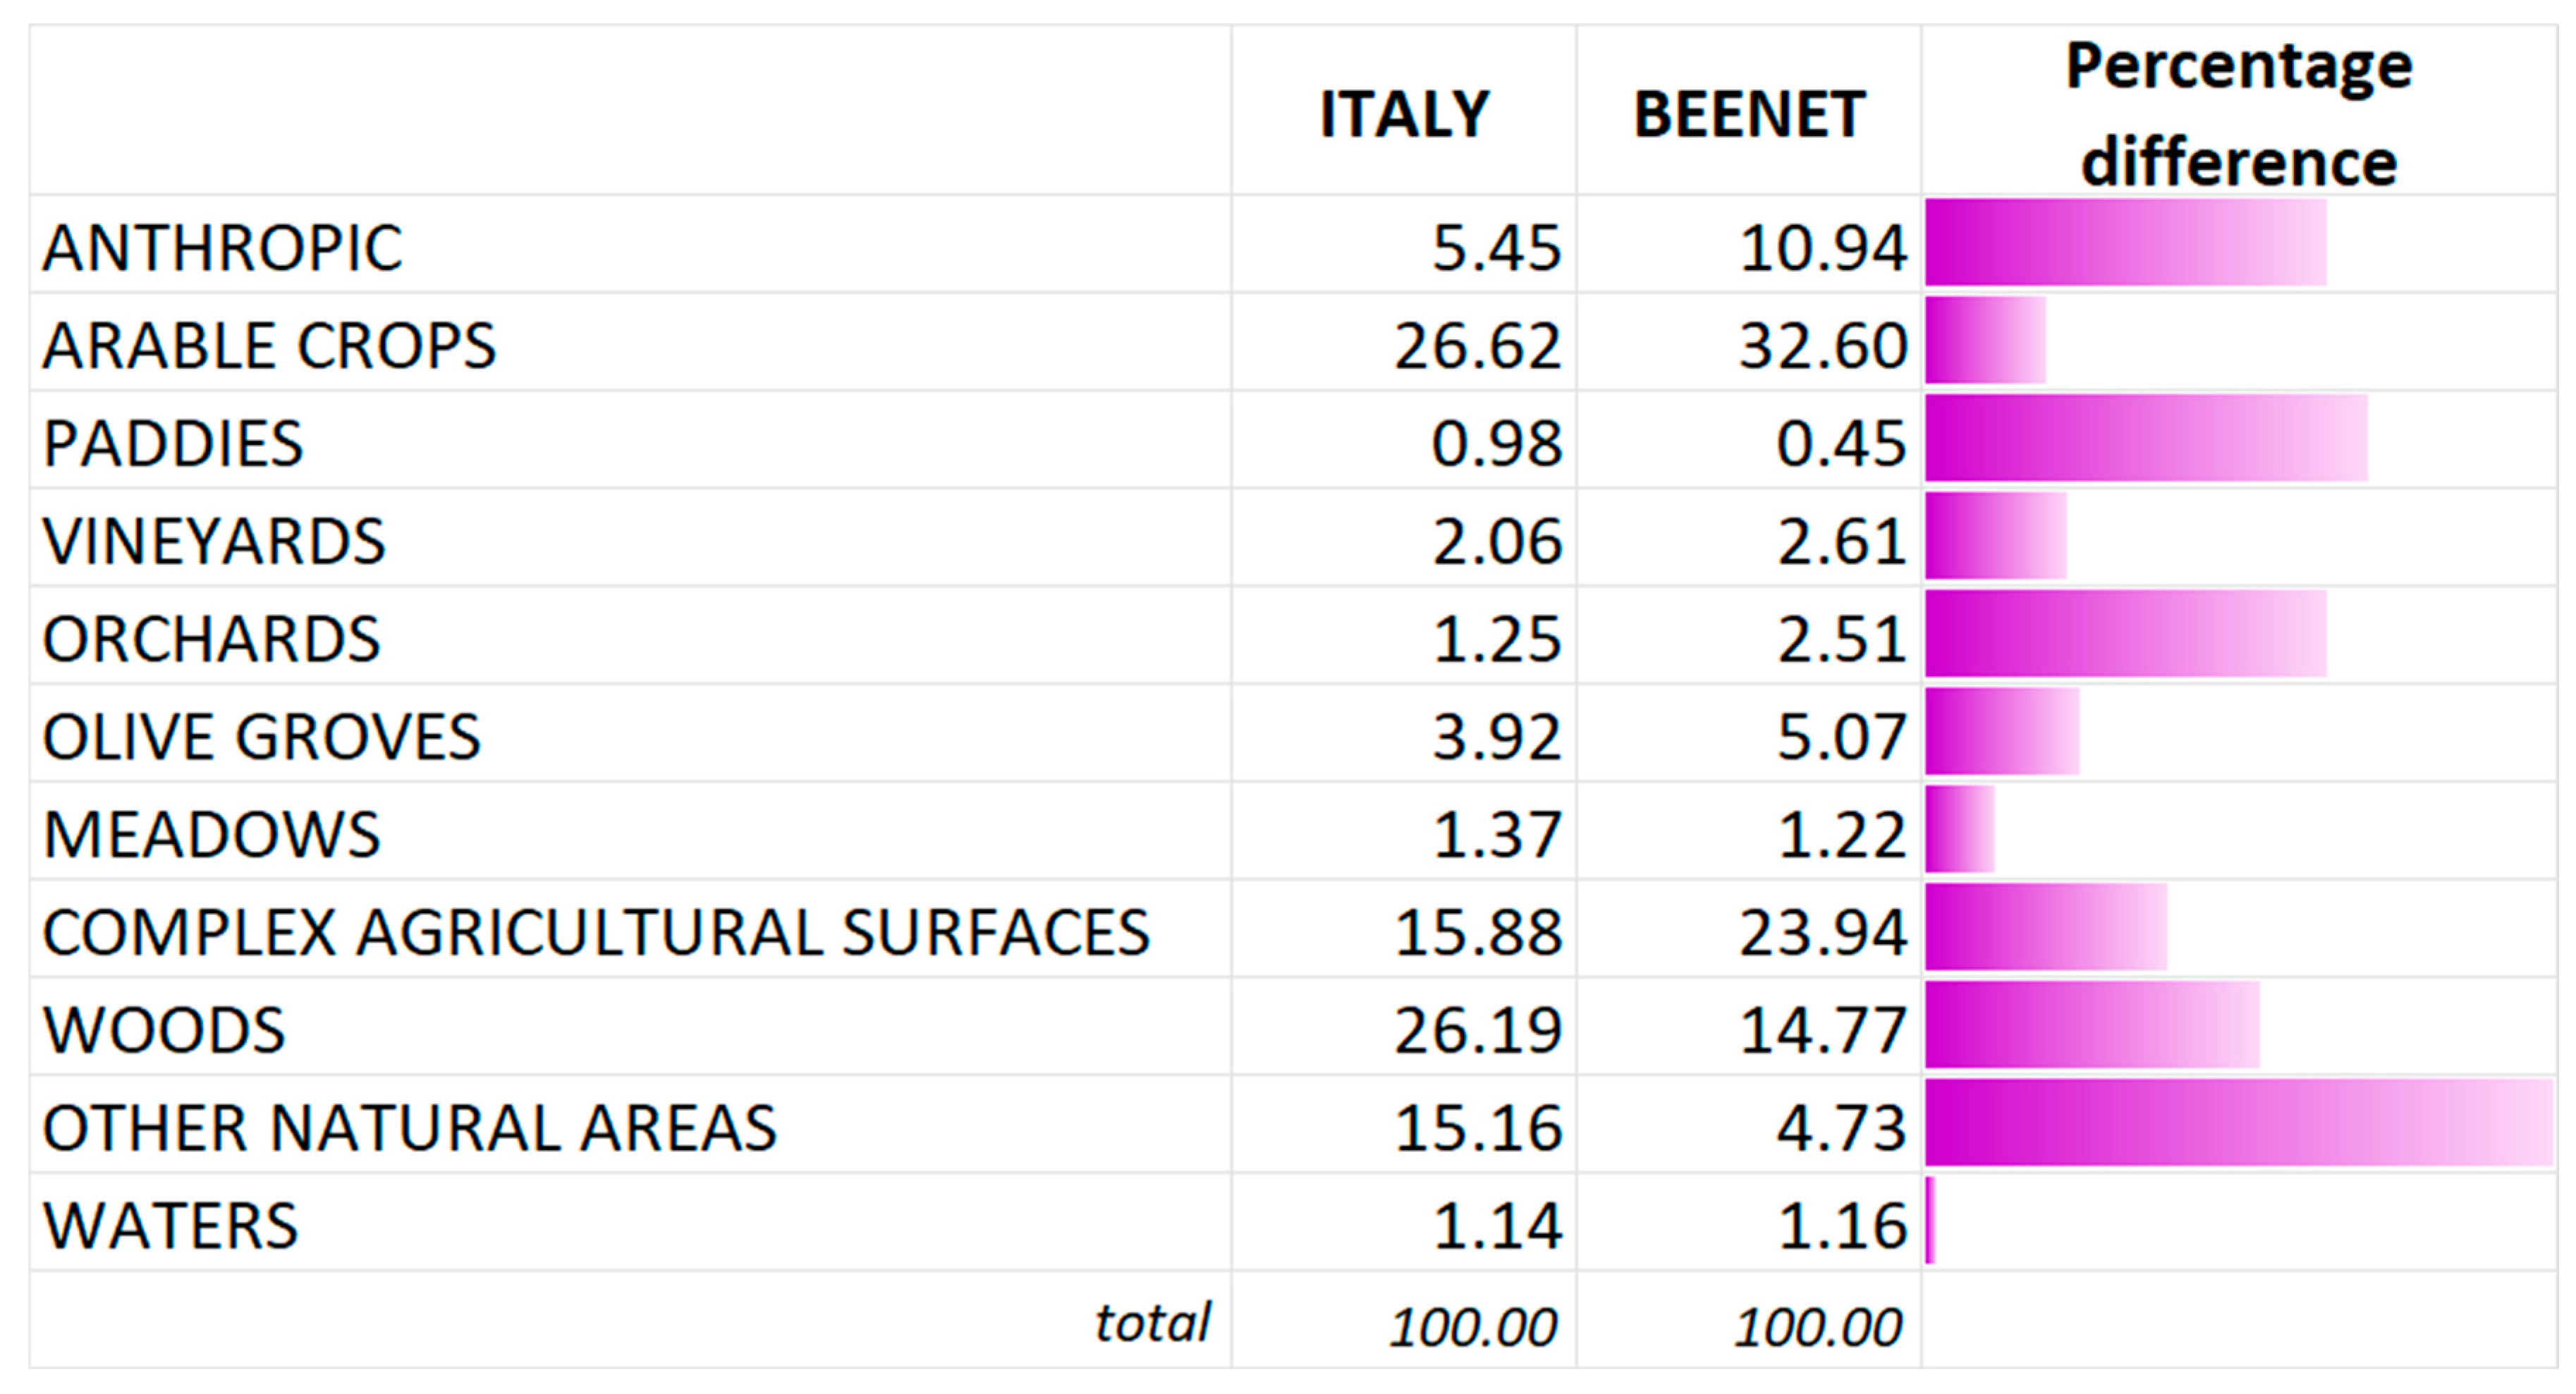
The second approach addresses the extent to which the environmental composition of the agricultural landscape (national or regional) is captured within the BeeNet buffers. At the national level, Figure 4 shows the percentage share of each macro-category within the two spatial clusters, the entire Italian territory and the BeeNet network area, and the corresponding percentage differences. The greatest differences (>50%) are observed in the categories of anthropic areas, paddy fields, orchards, woods, and particularly other natural areas. Of the eleven macro-categories, six are over-represented in the BeeNet buffers, most notably anthropic areas and orchards. Conversely, five categories are under-represented, three of which show deviations exceeding 50%.
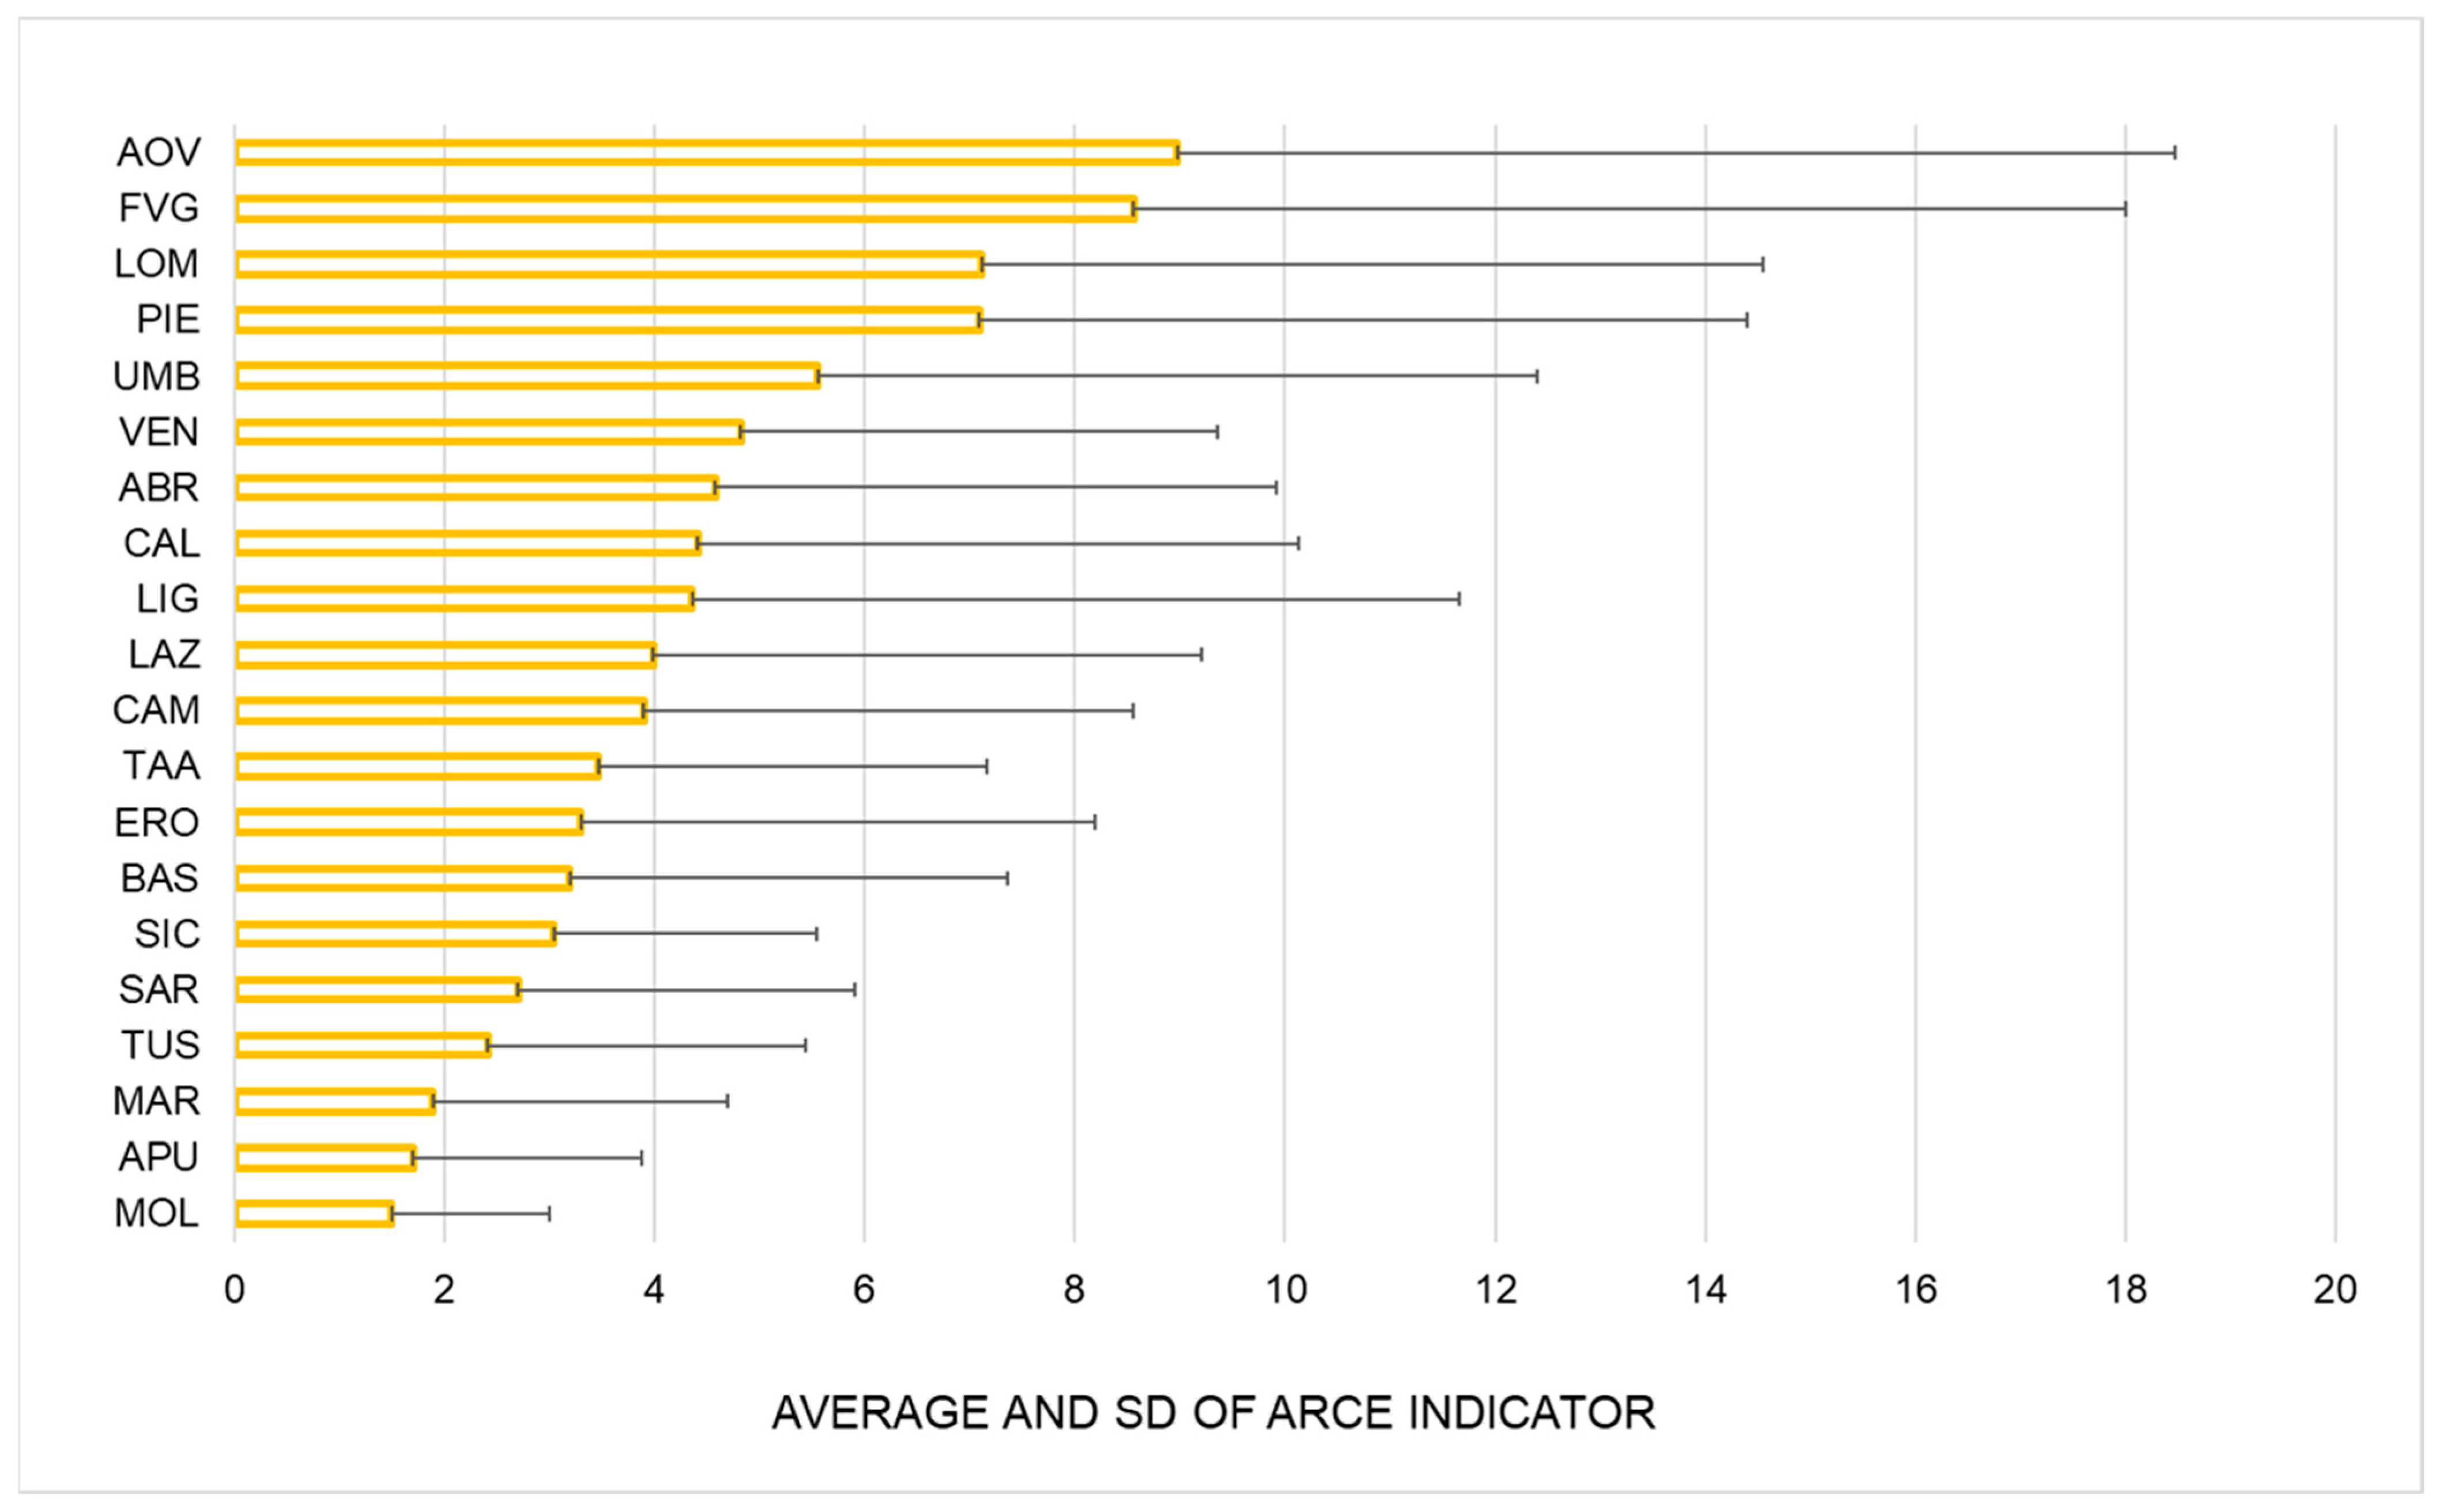
At the regional level, Figure 5 provides a visual summary of the regional ARCE values. In all cases, the average ARCE deviates from zero, indicating some degree of mismatch. The highest ARCE values are observed in Aosta Valley (AOV) and Friuli-Venezia Giulia (FVG), followed by Piedmont (PIE) and Lombardy (LOM). A more detailed interpretation is presented in Figure 6, where regional differences are shown along a national north–south axis within a ±25% range. The central line (0%) represents a perfect match between observed and expected BeeNet values, with red and green indicating under- or over-representation, respectively. Focusing first on the regions with the largest absolute deviations, AOV and FVG—both in northern Italy—show marked under-representation of ‘other natural areas’ (−30.38%) and woods (−26.88%), respectively, alongside notable over-representation of anthropic areas (AOV: +11.21%; FVG: +9.27%) and complex agricultural landscapes (AOV: +15.21%; FVG: +9.48%). FVG also over-represents arable crops. Similar patterns can be observed in the other prominent regions identified in Figure 5, such as PIE and LOM, where deviations follow comparable trends.
Overall, the national pattern confirms that in most regions, the BeeNet network tends to over-represent land categories more directly linked to agriculture. Over-estimation values (though never exceeding 20%) are most frequent in arable crops (peaking in FVG at +19.75% and LOM at +19.19%, followed by Umbria at +13.38%) and in complex agricultural surfaces (PIE: +16.64%; AOV: +15.21%; LIG: +14.01%). More modest over-representation is found nationally in orchards (except Trentino, TRN, at +8.17%), vineyards, olive groves (with the exception of Calabria, CAL, at +12.32%), and meadows. On the other hand, the most pronounced under-representation is seen in other natural areas (AOV: −30.38%; PIE: −23.36%) and in woods (FVG: −26.88%; LIG and UMB both around −21%). Some under-representation is also evident in Sicily and Apulia for arable crops (SIC: −7.80%; APU: −5.51%), though the percentages are relatively modest.

4. Discussion

Ecological monitoring programmes are among the scientific endeavours that benefit most from stakeholder involvement (e.g., [16,17]). Monitoring plays a critical role in assessing current conditions and tracking changes over time, often requiring large-scale strategies that can be complex and costly, particularly in the context of resource management. A lack of stakeholder engagement and failure to consider landscape-scale processes are frequently cited as key reasons why policy measures underperform [18,19,20].
In this context, the BeeNet project (2019–2025) was launched in Italy to assess agri-environmental quality by using honeybees as in situ sentinels across the country. The project aligns with legislation that increasingly promotes actions to preserve and enhance the agri-environment for the benefit of present and future generations [21,22]. BeeNet adopted a participatory approach, involving researchers, national beekeeping associations, and individual beekeepers in the co-design and implementation of monitoring activities. This study examined whether, and to what extent, the involvement of stakeholders in establishing a national network of apiaries for monitoring the Italian agroecosystem may compromise the representativeness of the environmental context (national and regional landscape-scale), given that the location of apiaries was not determined through randomisation. The adoption of a multi-actor approach is increasingly common and often mandated by funding bodies [23], necessitating certain trade-offs. Nevertheless, the accuracy of the environmental representation generated by such a network remains essential for the interpretation of monitoring data and for providing reliable guidance to policymakers at both national and regional levels.
One of the initial challenges addressed in this study concerned the distribution of workstations across Italian regions. In an ideal scientific design, the number of monitoring sites would be proportionally allocated according to regional surface area. This regional scale is particularly relevant, as agricultural policy measures are typically implemented within this territorial framework. In Tuscany, Italy, the regional administration tailors agri-environmental schemes under the Rural Development Programme (RDP) to local conditions, supporting organic farming, soil conservation, and biodiversity through region-specific incentives [24]. These measures reflect the flexibility given to regions in adapting EU Common Agricultural Policy (CAP) priorities to their territorial contexts. However, given the participatory nature of the project, involving multiple stakeholders, a uniform distribution was not anticipated due to factors such as withdrawal from the initiative or low engagement in specific areas. Despite these constraints, our analysis indicates that a reasonable balance was achieved in most regions. This outcome is especially significant for the extrapolation of results, as many economic and agricultural statistics are structured according to regional divisions. Nonetheless, some notable discrepancies in coverage were identified. A notable case was the Aosta Valley, where only three workstations were included. This region is not only the smallest in Italy but is also entirely mountainous. The harsh climate strongly affects plant phenology [25], and consequently, beekeeping practices. Low participation may be linked to the need for nomadism: beekeepers are often forced to relocate hives seasonally to maintain economically viable production [26], which conflicted with our requirement for stationary apiaries. Similar caution in interpreting data is needed for large regions with relatively few workstations (e.g., Apulia, Sardinia, Sicily), where climatic conditions may also favour nomadic practices to avoid drought-related stress. A dedicated study would be valuable in assessing environmental constraints driving nomadism and could inform the development of a tailored monitoring protocol.
This study employed both detailed land cover inventories and broader macro-categories to evaluate the landscape around the workstations. The robustness of this approach was demonstrated by the percentage differences observed across all macro-categories when comparing their distribution in the BeeNet buffers with that of the entire Italian territory. These differences pointed in two opposing directions: BeeNet buffers over-represented agricultural areas while under-representing natural areas. This outcome aligns well with the project’s objectives. The under-representation of categories such as “paddies”, “woods”, and “other natural areas” (land types not directly linked to agricultural production relevant to the project) further supports that apiaries were indeed located predominantly within agricultural landscapes. Consequently, future findings can reliably reflect the impact of agricultural practices on honeybee health and productivity. However, even within the agricultural macro-categories, certain preferences in the placement of apiaries became evident, suggesting a non-random distribution influenced by beekeeper choices or regional agricultural characteristics.
The macro-category “anthropic” is typically over-represented by BeeNet workstations across most regions. Since apiaries were required to be located outside urban centres, this likely reflects a preference for rural or peri-urban areas in the countryside. This preference is consistent with the practical needs of beekeeping: such areas offer scattered yet sufficient floral resources to support honey production along the entire season, while also providing favourable working conditions. Beekeepers consistently select apiary sites near floral-rich agricultural areas [27,28], water sources, and accessible terrain, with good sun exposure and shelter [29,30,31]. These criteria not only align with ecological considerations but also with practical needs, ensuring sustainability and productivity. Empirical surveys and decision-support models underscore these factors as priorities when establishing hive locations.
The macro-categories “orchards” and “meadows” are generally well represented by the network across all regions. The “complex agricultural surfaces” macro-category aggregates CLC classifications that combine agricultural and semi-natural elements, which individually do not meet the minimum mapping unit thresholds. However, in Italy, these categories may in fact be underestimated due to the limitations inherent in the Corine Land Cover (CLC) classification system. According to CLC criteria, an area must be at least 50% covered by a specific crop type (such as orchards or vineyards) to be classified accordingly. Our own field observations suggest that these mixed-use or small-scale agricultural landscapes may be under-represented in the current analysis. These land types are widely recognised for providing abundant forage for bees [32,33], with large orchards not only contributing to honey production but also frequently relying on honeybee pollination [34]. Brunori et al. [35], through a landscape-level spatial analysis using remote sensing and geographic information systems (GIS), investigated traditional olive-based agroforestry in the Calabria region of southern Italy, where olive groves are often interspersed with vineyards, orchards, and small-scale arable fields. Their study highlights how such mixed agricultural mosaics contribute to land conservation, support biodiversity, and preserve landscape identity. It underscores the importance of diversified land-use patterns for both environmental resilience and cultural heritage in Mediterranean agroecosystems. Such heterogeneity may benefit bees by ensuring a more continuous availability of floral resources throughout the year: an essential condition for maintaining stationary apiaries. However, the impact of these landscapes on bee health also depends on farming practices. For example, vineyards and olive groves may either enhance or degrade bee foraging quality, depending on how the inter-row vegetation is managed. If left untreated, these strips may offer valuable food sources; if treated with herbicides or pesticides, they may pose toxic risks [36,37]. A more nuanced interpretation of spatial data will benefit from further analysis of workstations located in these areas, integrated with hive-level data. This should be supported by a refined classification approach that accounts for the heterogeneous representation of vineyards, olive groves, and orchards across the various CLC categories.
Finally, farming practices may also explain the unexpected patterns observed in the “arable crops” category. This macro-category is under-represented in southern regions such as Apulia, Calabria, and Sicily, where hot, dry summers and limited irrigation reduce floral availability in the absence of active tillage. Drought has significant negative effects on honeybee health and colony performance, primarily by reducing the availability and diversity of floral resources. Extended dry periods reduce flower abundance, size, and nectar volume in plants, leading to restricted nectar and pollen availability. This reduction undermines food resources for bees and other pollinators, thereby compromising colony development and ecological resilience. Drought stress can also alter the nutritional quality of pollen and nectar [38,39], possibly impacting bee immunity and increasing susceptibility to pathogens. In addition, limited water availability disrupts hive thermoregulation, particularly during heat stress. Without water, colonies are unable to perform evaporative cooling, resulting in brood nest temperatures rising to dangerous levels. These conditions amplify physiological stress, increase energy demands on foragers, and jeopardise colony health [40,41]. As a result, in our study fewer permanent apiaries may have been placed in these regions, confirming consistency with our observations of low workstation density relative to regional surface area. Unfortunately, the “arable crops” category is particularly lacking in detail: it does not specify which crops are grown, which hinders accurate assessment of key factors such as forage quality, food availability, and exposure to phytosanitary treatments. This lack of specificity currently limits deeper analysis and interpretation.

5. Conclusions

The approach adopted by the BeeNet project in involving stakeholders proved satisfactory, resulting in a reasonably balanced number of apiaries and an overall over-representation of agricultural contexts across most regions. Despite relying on a non-random stakeholder-driven selection of apiary sites, the network broadly reflected the Italian agricultural landscape. Regional analyses, however, highlighted some discrepancies, particularly in mountainous and southern areas, which call for cautious interpretation and, in some cases, tailored monitoring approaches. These findings indicate that stakeholder involvement can substantially enhance both the ecological validity and policy relevance of monitoring initiatives, especially in contexts where biodiversity conservation and agri-environmental quality are priorities.
From a practical perspective, the results suggest that close collaboration with beekeepers, through structured feedback loops, participatory decision-making, and transparent dissemination of results, helps to improve both data collection and the applicability of findings. The BeeNet project engaged regularly with beekeepers and their associations in online meetings to discuss project results and needs and get their feedback. The scientific team elaborated and published yearly project reports (free download from the Italian webpage of the National Rural Network, https://www.reterurale.it/progettobeenet, accessed on 20 September 2025) and reports for the newsletters of the bee-keepers associations. Similar approaches are implemented in other Italian projects [42] and elsewhere [43]. For stakeholders, the study underlines the value of aligning beekeeping practices with monitoring objectives and suggests that locally adapted monitoring protocols could provide more reliable information in areas with climatic or topographical constraints, directly helping honey production and bee health.
Looking ahead, a future research agenda should explore the applicability and scalability of this methodology in other national contexts, particularly in countries where the honeybee sector is of economic importance. The landscape level addressed to analyse monitoring data is still an issue. Although the CLC cartography represents the most appreciated tool to describe the territory since it allows a homogeneous analysis at a national or even continental level, detail levels in terms of minimum map unit, botanical reference of the categories and updating periods may influence the readability of the territory. This result is especially impactful when thinking in terms of bees and beekeepers [44]. For this reason, future cartographical analyses to be linked with project results should consider the integration with other sources of cartographic information (e.g., EUROSTAT, other cartographic maps), especially to help epidemiological or colony growth data interpretation. Networks similar to BeeNet could play a pivotal role not only in Europe but also in less developed countries, where establishing such initiatives would contribute to environmental monitoring capacity, strengthen rural economies, and support pollinator conservation. Methodological refinements, such as integrating finer-scale land-use data with hive-level information, would further improve the robustness and transferability of results, enabling broader adoption of stakeholder-based monitoring frameworks worldwide.

Author Contributions

Conceptualization, M.G. and S.A.; methodology, M.G., S.A. and L.B.; validation, M.G. and L.B.; formal analysis, M.G., S.A. and I.G.; investigation, S.A. and I.G.; resources, L.B. and P.M.; data curation, S.A. and I.G.; writing—original draft preparation, M.G., P.M. and S.A.; writing—review and editing, M.G. and L.B.; visualisation, M.G. and S.A.; supervision, L.B. and P.M.; project administration, L.B.; funding acquisition, L.B. All authors have read and agreed to the published version of the manuscript.

Funding

This research was funded under the project BeeNet 2019–2025, supported by the funding programme FEASR 2014–2020 (Fondo Europeo Agricolo per lo Sviluppo Rurale), under the control of the RRN (Rete Rurale Nazionale) and MASAF (Ministry of Agriculture, Food Sovereignty and Forestry).

Data Availability Statement

Most data supporting the conclusions of this article are available as Appendix A (Table A1 and Table A2). Other data (apiaries locations) are restricted following privacy rules.

Acknowledgments

We are indebted to the entire BeeNet working group for the collaborative support during the preparation of the data, the analyses and the development of the project. We sincerely thank the three anonymous reviewers for their careful reading of our manuscript and their insightful, constructive comments, which greatly helped improving the clarity and quality of this work.

Conflicts of Interest

The authors declare no conflicts of interest.

Appendix A

Table A1. Added information on methods.
CriterionPeriod of ControlPopulation Under ControlMeans of Verification
distance from other workstationsbeginning of the studyall workstationsupon receiving the coordinates, an immediate verification was carried out, and locations were rejected if situated less than 3 km from already approved workstations.
fixed locationend of first yearall workstationswhile flexibility in the location of workstations was allowed during the first year, no further repositioning was permitted thereafter: the selection process was somewhat flexible in the first year, allowing minor location adjustments if the previous beekeeper’s selection interfered with beekeeping activities; however, from March 2022 onwards, no further changes were permitted to ensure data consistency and integrity.
between second and third yearon a random sample of workstations with hi-tech hivesthe GPS installed in the hi-tech hive enabled continuous monitoring of its position over the following months.
long-term commitmentend of first yearall workstationsthe project provided funding to beekeepers’ associations to ensure the maintenance of a constant number of active workstations
precision of coordinatesbetween first and second yearall workstationsthe presence of workstations was verified using local orthophotos. If a workstation was not detected, beekeepers were asked to re-check the coordinates or provide an explanation for apiary movements. During this process, positional errors of approximately 30–50 km were identified.
professional productionfirst yearworkstations of the regions Emilia-Romagna and UmbriaThe team carried out interviews with beekeepers, but the majority of verification and validation was delegated to the associations.
agroecosystemthird yearall workstationsthis work
Table A2. Km2 of regional surface under each macro-category; missing data indicate absence of given macro-category in that region.
Italian Region
Extended Name
AcronymAnthropicArable CropsPaddiesVineyardsOrchardsOlive GrovesMeadowsComplex
Agricultural
Surfaces
WoodsOther Natural
Areas
Waters
AbruzzoABR327.001970.36 211.1715.26435.96157.602051.993063.022542.3721.05
BasilicataBAS157.463818.40 15.28123.89273.7876.971383.782794.221312.7434.67
CalabriaCAL561.122080.107.3444.59530.411943.43107.312544.175488.391733.1432.96
CampaniaCAM1018.383086.23 12.73563.43612.87123.063084.263808.541257.7529.34
Emilia-RomagnaERO1249.799662.66150.7539.23104.686.9142.555059.454810.611097.93217.69
Friuli Venezia GiuliaFVG623.661837.00 143.001.40 56.95983.642977.011135.07152.90
LazioLAZ1099.594857.95 142.55342.14962.2778.543312.764448.641701.42253.23
LiguriaLIG275.4565.21 4.29 162.9914.69672.203326.19888.144.36
LombardiaLOM2776.427945.541237.07164.5712.535.11375.651777.815540.053354.94686.43
MarcheMAR448.213958.30 59.953.421.9535.391924.371993.37947.459.85
MoliseMOL81.651707.31 49.622.04138.4635.40797.541202.83412.2312.34
PiedmontPIE1361.484102.221413.32629.52153.23 418.544316.087469.555317.26220.14
ApuliaAPU1058.956721.53 1407.59218.923942.48248.093069.761259.561263.24137.37
SardiniaSAR722.035249.2754.2190.84100.01414.87405.834930.674030.147888.35211.00
SicilySIC1302.448874.92 1569.421149.991775.59 4212.832560.994160.0698.93
TuscanyTUS1121.405214.163.91672.6019.46819.50630.613097.549942.721365.6794.57
Trentino-Alto AdigeTAA293.9174.68 148.39330.28 749.40563.686526.604854.4063.59
UmbriaUMB299.752433.39 60.461.04300.3198.441405.173078.06629.22148.16
Aosta ValleyAOV47.180.27 3.572.17 94.10167.10738.842205.513.42
VenetoVEN1700.346559.9476.35738.1983.9622.79386.062502.383876.971595.76790.11
ITALYIT16,526.2080,219.442942.956207.553758.2611,819.264135.2147,857.1778,936.2945,662.643222.10
Table A3. Km2 of regional surface of BeeNet buffers under each macro-category; missing data indicate absence of given macro-category in that region; 0 value represents value smaller than 0.005.
Italian Region
Extended Name
AcronymAnthropicArable CropsPaddiesVineyardsOrchardsOlive GrovesMeadowsComplex
Agricultural
Surfaces
WoodsOther
Natural Areas
Waters
AbruzzoABR5.1114.54 3.960.008.330.5430.9615.725.170.00
BasilicataBAS3.5331.14 0.060.940.370.1210.613.994.400.00
CalabriaCAL4.8012.630.000.137.6733.671.7832.8317.526.110.00
CampaniaCAM17.6133.46 0.058.305.730.5237.2714.226.381.03
Emilia-RomagnaERO8.76124.430.001.840.801.170.0060.9118.208.030.25
Friuli Venezia GiuliaFVG12.0529.50 0.010.00 0.0714.921.221.380.60
LazioLAZ28.3345.06 0.722.255.571.3423.497.601.691.92
LiguriaLIG3.791.47 0.55 2.110.0013.9119.689.420.00
LombardiaLOM63.60146.446.361.690.000.003.2141.6533.082.923.42
MarcheMAR1.3021.49 0.250.000.000.0017.815.572.130.00
MoliseMOL1.4420.61 0.050.003.240.0010.9114.223.110.00
PiedmontPIE34.0971.515.0816.417.19 3.81100.1185.0511.915.23
ApuliaAPU5.3815.66 7.730.0027.150.0013.263.423.060.00
SardiniaSAR4.2939.680.000.781.855.200.5530.533.1111.410.00
SicilySIC18.0049.20 10.9717.7616.97 48.2812.5326.480.36
TuscanyTUS13.4345.650.005.820.1715.422.2029.1348.025.930.49
Trentino-Alto AdigeTAA6.050.00 2.7112.47 2.873.8820.285.531.85
UmbriaUMB7.1430.96 1.390.003.900.0016.436.890.600.98
Aosta ValleyAOV3.960.00 1.571.18 2.446.031.494.200.00
VenetoVEN34.4887.550.006.073.040.2612.4857.5334.881.301.46
ITALYIT277.13820.9911.4562.7763.61129.0931.92600.43366.70121.1517.59

References

  1. Hung, K.L.J.; Kingston, J.M.; Albrecht, M.; Holway, D.A.; Kohn, J.R. The worldwide importance of honey bees as pollinators in natural habitats. Proc. R. Soc. B Biol. Sci. 2018, 285, 20172140. [Google Scholar] [CrossRef]
  2. Porrini, C.; Sabatini, A.G.; Girotti, S.; Fini, F.; Monaco, L.; Celli, G.; Bortolotti, L.; Ghini, S. The death of honey bees and environmental pollution by pesticides: The honey bees as biological indicators. Bull. Insectol. 2003, 56, 147–152. [Google Scholar]
  3. Cilia, G.; Bortolotti, L.; Albertazzi, S.; Ghini, S.; Nanetti, A. Honey bee (Apis mellifera L.) colonies as bioindicators of environmental SARS-CoV-2 occurrence. Sci. Total Environ. 2022, 805, 150327. [Google Scholar] [CrossRef] [PubMed]
  4. Nicewicz, Ł.; Nicewicz, A.W.; Kafel, A.; Nakonieczny, M. Set of stress biomarkers as a practical tool in the assessment of multistress effect using honeybees from urban and rural areas as a model organism: A pilot study. Environ. Sci. Pollut. Res. 2021, 28, 9084–9096. [Google Scholar] [CrossRef]
  5. Murcia-Morales, M.; Van der Steen, J.J.M.; Vejsnæs, F.; Díaz-Galiano, F.J.; Flores, J.M.; Fernández-Alba, A.R. APIStrip, a new tool for environmental contaminant sampling through honeybee colonies. Sci. Total Environ. 2020, 729, 138948. [Google Scholar] [CrossRef] [PubMed]
  6. Cilia, G.; Resci, I.; Scarpellini, R.; Zavatta, L.; Albertazzi, S.; Bortolotti, L.; Nanetti, A.; Piva, S. Antimicrobial-Resistant Environmental Bacteria Isolated Using a Network of Honey Bee Colonies (Apis mellifera L. 1758). Transbound. Emerg. Dis. 2023, 2023, 5540574. [Google Scholar] [CrossRef]
  7. Durant, J.L.; Ponisio, L.C. A Regional, Honey Bee-Centered Approach Is Needed to Incentivize Grower Adoption of Bee-Friendly Practices in the Almond Industry. Front. Sustain. Food Syst. 2021, 5, 628802. [Google Scholar] [CrossRef]
  8. Gutiérrez, M.; Molero, R.; Gaju, M.; van der Steen, J.; Porrini, C.; Ruiz, J.A. Assessment of heavy metal pollution in Córdoba (Spain) by biomonitoring foraging honeybee. Environ. Monit. Assess. 2015, 187, 651. [Google Scholar] [CrossRef]
  9. Ngat, T.T.; Xuan Lam, T.; Gia Minh, H.; Thi Phuong Lien, N. Honeybee products as potential bioindicators of heavy metals contamination from Northern Vietnam. Vietnam J. Biotechnol. 2020, 18, 373–384. [Google Scholar] [CrossRef]
  10. van der Steen, J.J.M.; Cornelissen, B.; Blacquière, T.; Pijnenburg, J.E.M.L.; Severijnen, M. Think regionally, act locally: Metals in honeybee workers in the Netherlands (surveillance study 2008). Environ. Monit. Assess. 2016, 188, 463. [Google Scholar] [CrossRef]
  11. Perichon, S.; Adamchuk, L.; Biber, L.; Bozic, J.; Chlebo, R.; Filipi, J.; Leidenberger, S.; Mavrofridis, G.; Ozgor, E.; Pocol, C.; et al. Perception of threats to bee colonies and the future of local beekeeping by beekeepers in various european countries perception des menaces pour les colonies d ’ abeilles et futur. Bull. La Société Géographique Liège 2024, 82, 19–46. [Google Scholar] [CrossRef]
  12. Lindenmayer, D.; Woinarski, J.; Legge, S.; Southwell, D.; Lavery, T.; Robinson, N.; Scheele, B.; Wintle, B. A checklist of attributes for effective monitoring of threatened species and threatened ecosystems. J. Environ. Manag. 2020, 262, 110312. [Google Scholar] [CrossRef]
  13. Giovanetti, M.; Dettori, A.; Cargnus, E.; Tafi, E.; Caringi, V.; Bortolotti, L. Bees: How and what to monitor to convey critical information. IOBC-WPRS Bull. (Landsc. Manag. Funct. Biodivers.) 2022, 156, 55–60. [Google Scholar]
  14. Neef, A.; Neubert, D. Stakeholder participation in agricultural research projects: A conceptual framework for reflection and decision-making. Agric. Hum. Values 2011, 28, 179–194. [Google Scholar] [CrossRef]
  15. Kok, K.P.W.; Gjefsen, M.D.; Regeer, B.J.; Broerse, J.E.W. Unraveling the politics of ‘doing inclusion’ in transdisciplinarity for sustainable transformation. Sustain. Sci. 2021, 16, 1811–1826. [Google Scholar] [CrossRef]
  16. Barot, S.; Abbadie, L.; Auclerc, A.; Barthélémy, C.; Bérille, E.; Billet, P.; Clergeau, P.; Consales, J.N.; Deschamp-Cottin, M.; David, A.; et al. Urban ecology, stakeholders and the future of ecology. Sci. Total Environ. 2019, 667, 475–484. [Google Scholar] [CrossRef]
  17. Carvalho, J.; Leite, P.; Valente, A.M.; Fonseca, C.; Torres, R.T. Stakeholders engagement as an important step for the long-term monitoring of wild ungulate populations. Ecol. Solut. Evid. 2021, 2, e12088. [Google Scholar] [CrossRef]
  18. Sikor, T. Legislation in Central and Eastern Europe. Sociologia Ruralis 2005, 45, 187–201. [Google Scholar] [CrossRef]
  19. Luján Soto, R.; de Vente, J.; Cuéllar Padilla, M. Learning from farmers’ experiences with participatory monitoring and evaluation of regenerative agriculture based on visual soil assessment. J. Rural Stud. 2021, 88, 192–204. [Google Scholar] [CrossRef]
  20. Tyllianakis, E.; Martin-Ortega, J. Agri-environmental schemes for biodiversity and environmental protection: How were are not yet “hitting the right keys”. Land Use Policy 2021, 109, 105620. [Google Scholar] [CrossRef]
  21. Latacz-Lohmann, U.; Hodge, I. European agri-environmental policy for the 21st century. Aust. J. Agric. Resour. Econ. 2003, 47, 123–139. [Google Scholar] [CrossRef]
  22. Poláková, J.; Soukup, J. Results of implementing less-favoured area subsidies in the 2014–2020 time frame: Are the measures of environmental concern complementary? Sustainability 2020, 12, 10534. [Google Scholar] [CrossRef]
  23. Feo, E.; Spanoghe, P.; Berckmoes, E.; Pascal, E.; Mosquera-Losada, R.; Opdebeeck, A.; Burssens, S. The multi-actor approach in thematic networks for agriculture and forestry innovation. Agric. Food Econ. 2022, 10, 3. [Google Scholar] [CrossRef] [PubMed]
  24. Pascucci, S.; De-Magistris, T.; Dries, L.; Adinolfi, F.; Capitanio, F. Participation of Italian farmers in rural development policy. Eur. Rev. Agric. Econ. 2013, 40, 605–631. [Google Scholar] [CrossRef]
  25. Caramiello, R.; Siniscalco, C. Quaternary vegetation landscapes in Piedmont and in the Aosta valley with particular reference to the Holocene. Biogeogr. J. Integr. Biogeogr. 1998, 19, 69–84. [Google Scholar] [CrossRef]
  26. Bertoni, D.; Pardo, A.; Paracchini, M.L. Assessing the environmental, social and economic sustainability of beekeeping activities. J. Apic. Res. 2025, 64, 1275–1293. [Google Scholar] [CrossRef]
  27. Otto, C.R.V.; Roth, C.L.; Carlson, B.L.; Smart, M.D. Land-use change reduces habitat suitability for supporting managed honey bee colonies in the Northern Great Plains. Proc. Natl. Acad. Sci. USA 2016, 113, 10430–10435. [Google Scholar] [CrossRef] [PubMed]
  28. Melin, A.; Rouget, M.; Colville, J.F.; Midgley, J.J.; Donaldson, J.S. Assessing the role of dispersed floral resources for managed bees in providing supporting ecosystem services for crop pollination. PeerJ 2018, 9, e5654. [Google Scholar] [CrossRef]
  29. Elmastaş, N.; Ölmez, İ.; Vural, E. Suitability Analysis of Apiculture (Beekeeping) Activity Areas with Multi-Criteria Method: A Case Study of Adıyaman. Coğrafya Derg. J. Geogr. 2022, 44, 19–30. [Google Scholar] [CrossRef]
  30. Walther, G.R.; Roques, A.; Hulme, P.E.; Sykes, M.T.; Pyšek, P.; Kühn, I.; Zobel, M.; Bacher, S.; Botta-Dukát, Z.; Bugmann, H.; et al. Alien species in a warmer world: Risks and opportunities. Trends Ecol. Evol. 2009, 24, 686–693. [Google Scholar] [CrossRef]
  31. Roque, N.; Fernandez, P.; Silveira, C.; Vilas-Boas, M.; Anjos, O. Using Analytic Hierarchy Process to Assess Beekeeping Suitability in Portuguese Controlled Areas: A First Approach. Insects 2024, 15, 91. [Google Scholar] [CrossRef]
  32. Malagnini, V.; Cappellari, A.; Marini, L.; Zanotelli, L.; Zorer, R.; Angeli, G.; Ioriatti, C.; Fontana, P. Seasonality and Landscape Composition Drive the Diversity of Pollen Collected by Managed Honey Bees. Front. Sustain. Food Syst. 2022, 6, 865368. [Google Scholar] [CrossRef]
  33. Parreno, M.A.; Werle, S.; Buydens, L.; Leroy, C.; Roberts, S.; Koirala, S.; Filipiak, M.; Kuhlmann, M.; Brunet, J.L.; Henry, M.; et al. Landscape heterogeneity correlates with bee and pollen diversity while size and specialization degree explain species-specific responses of wild bees to the environment. Sci. Total Environ. 2024, 954, 176595. [Google Scholar] [CrossRef]
  34. Pardo, A.; Borges, P.A.V. Worldwide importance of insect pollination in apple orchards: A review. Agric. Ecosyst. Environ. 2020, 293, 106839. [Google Scholar] [CrossRef]
  35. Brunori, E.; Maesano, M.; Moresi, F.V.; Matteucci, G.; Biasi, R.; Scarascia Mugnozza, G. The hidden land conservation benefits of olive-based (Olea europaea L.) landscapes: An agroforestry investigation in the southern Mediterranean (Calabria region, Italy). L. Degrad. Dev. 2020, 31, 801–815. [Google Scholar] [CrossRef]
  36. Dobrei, A.I.; Nan, A.; Eleonora, N.; Daniela, D.; Georgeta, D.A. Research on honeybee pollination influence in increasing the fruit set rate and improving yield components in several grapevine varieties. J. Hortic. For. Biotechnol. 2021, 25, 88–95. [Google Scholar]
  37. Mueller, T.G.; Baert, N.; Muñiz, P.A.; Sossa, D.E.; Danforth, B.N.; McArt, S.H. Pesticide risk during commercial apple pollination is greater for honeybees than other managed and wild bees. J. Appl. Ecol. 2024, 61, 1289–1300. [Google Scholar] [CrossRef]
  38. Waser, N.M.; Price, M.V. Drought, pollen and nectar availability, and pollination success. Ecology 2016, 97, 1400–1409. [Google Scholar] [CrossRef]
  39. Kuppler, J.; Wieland, J.; Junker, R.R.; Ayasse, M. Drought-induced reduction in flower size and abundance correlates with reduced flower visits by bumble bees. AoB Plants 2021, 13, plab001. [Google Scholar] [CrossRef] [PubMed]
  40. Kovac, H.; Käfer, H.; Stabentheiner, A. The energetics and thermoregulation of water collecting honeybees. J. Comp. Physiol. A Neuroethol. Sens. Neural Behav. Physiol. 2018, 204, 783–790. [Google Scholar] [CrossRef]
  41. Ostwald, M.M.; Smith, M.L.; Seeley, T.D. The behavioral regulation of thirst, water collection and water storage in honey bee colonies. J. Exp. Biol. 2016, 219, 2156–2165. [Google Scholar] [CrossRef]
  42. Pagliarino, E.; Orlando, F.; Vaglia, V.; Rolfo, S.; Bocchi, S. Participatory research for sustainable agriculture: The case of the Italian agroecological rice network. Eur. J. Futures Res. 2020, 8, 7. [Google Scholar] [CrossRef]
  43. Luyet, V.; Schlaepfer, R.; Parlange, M.B.; Buttler, A. A framework to implement Stakeholder participation in environmental projects. J. Environ. Manag. 2012, 111, 213–219. [Google Scholar] [CrossRef] [PubMed]
  44. Kuchling, S.; Kopacka, I.; Kalcher-Sommersguter, E.; Schwarz, M.; Crailsheim, K.; Brodschneider, R. Investigating the role of landscape composition on honey bee colony winter mortality: A long-term analysis. Sci. Rep. 2018, 8, 12263. [Google Scholar] [CrossRef] [PubMed]
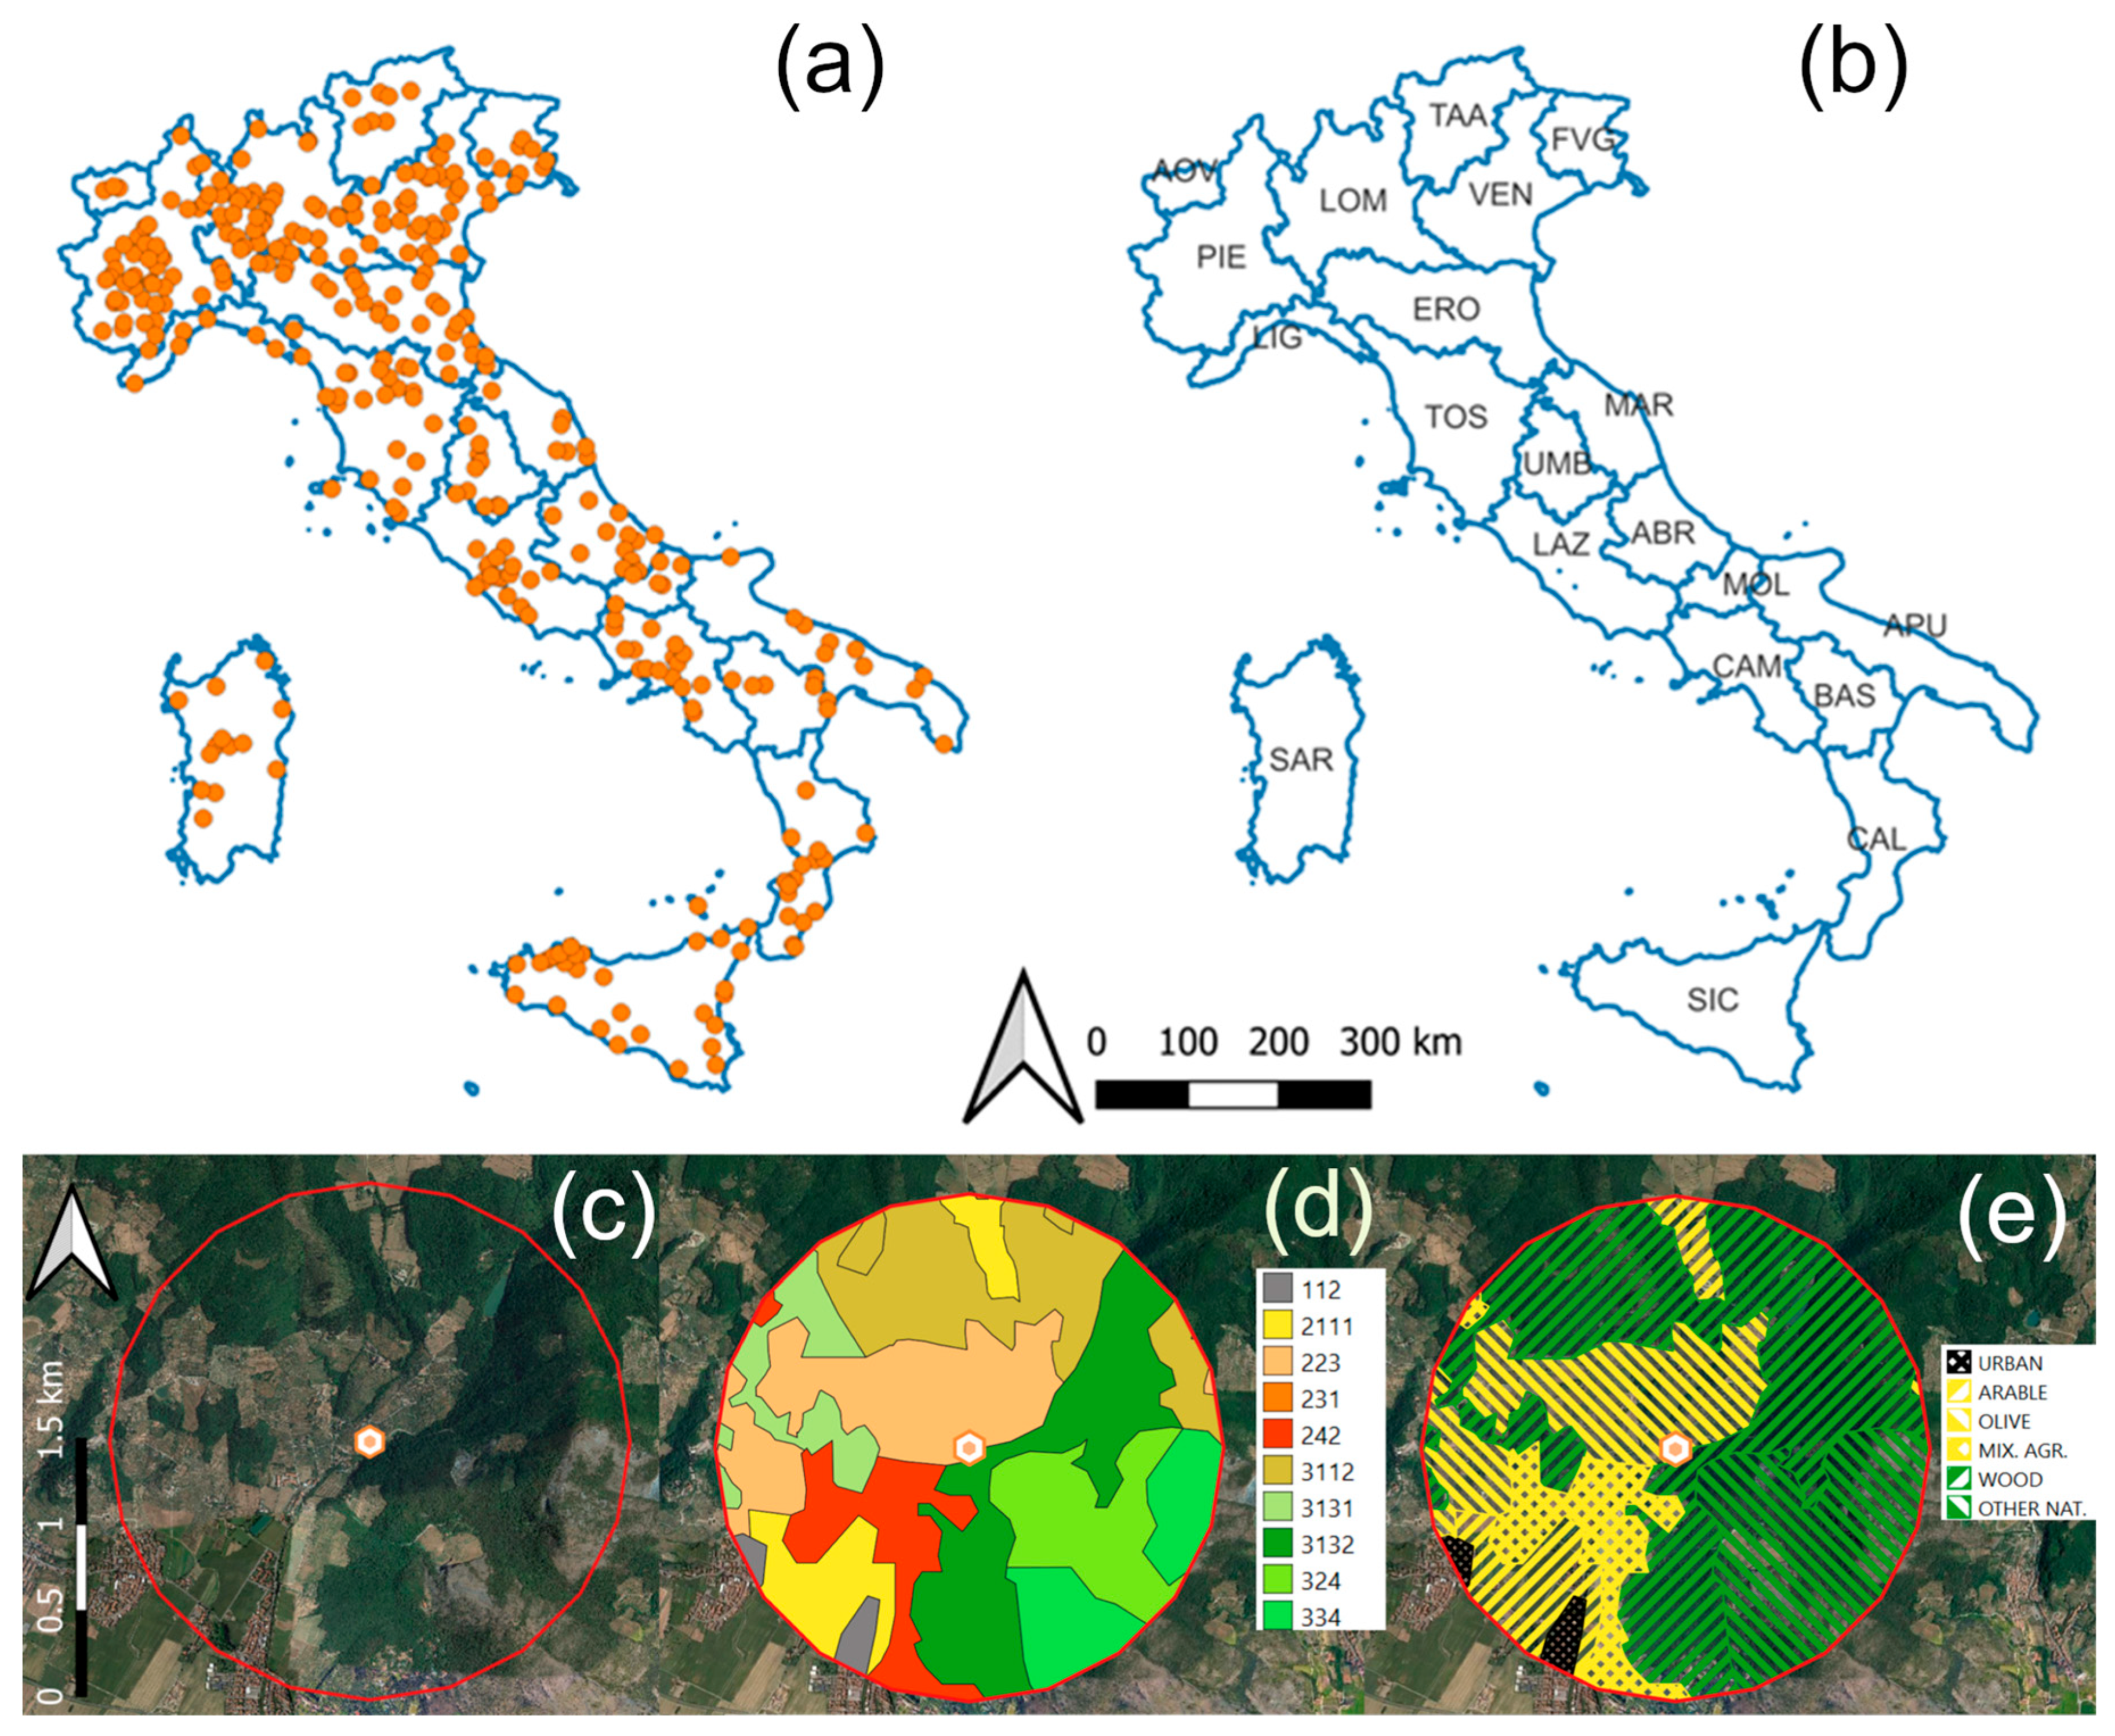
Figure 1. The workstations of the BeeNet network: (a) workstations distribution in Italy; (b) the regional (NUTS2) levels. Abbreviations (in alphabetical order) refer to Italian regions: AOV = Aosta Valley; ABR = Abruzzo; BAS = Basilicata; CAL = Calabria; CAM = Campania; ERO = Emilia-Romagna; FVG = Friuli Venezia-Giulia; LAT = Latium; LIG = Liguria; LOM = Lombardy; MAR = Marche; MOL = Molise; PIE = Piedmont; PUG = Apulia; SAR = Sardinia; SIC = Sicily; TAA = Trenitno Alto-Adige; TUS = Tuscany; UMB = Umbria; VEN = Veneto. The BeeNet buffer around each apiary of the network: (c) apiary in the centre of a circle of 1.5 km of radius; (d) the BeeNet buffer content, expressed by CLC categories (number acknowledgement in Table 1); (e) the BeeNet buffer content, expressed by macro-categories designed in this study (details in Table 1).
Land 14 01957 g001
Figure 2. Workflow of calculations. We assumed that the region and the BeeNet area have exactly the same percentual coverage of a given macro-category.
Land 14 01957 g002
Figure 3. BeeNet Network. Number of selected BeeNet apiaries in each region. Abbreviations (in alphabetical order) refer to Italian regions: AOV = Aosta Valley; ABR = Abruzzo; BAS = Basilicata; CAL = Calabria; CAM = Campania; ERO = Emilia-Romagna; FVG = Friuli Venezia-Giulia; LAT = Latium; LIG = Liguria; LOM = Lombardy; MAR = Marche; MOL = Molise; PIE = Piedmont; PUG = Apulia; SAR = Sardinia; SIC = Sicily; TAA = Trenitno Alto-Adige; TUS = Tuscany; UMB = Umbria; VEN = Veneto.
Land 14 01957 g003
Figure 4. BeeNet–Italy comparison: percentage differences between clusters.
Land 14 01957 g004
Figure 5. Comparison among regions. The average (and SD) of the ARCE value of macro-categories in each region. Abbreviations (in alphabetical order) refer to Italian regions: AOV = Aosta Valley; ABR = Abruzzo; BAS = Basilicata; CAL = Calabria; CAM = Campania; ERO = Emilia-Romagna; FVG = Friuli Venezia-Giulia; LAT = Latium; LIG = Liguria; LOM = Lombardy; MAR = Marche; MOL = Molise; PIE = Piedmont; PUG = Apulia; SAR = Sardinia; SIC = Sicily; TAA = Trenitno Alto-Adige; TUS = Tuscany; UMB = Umbria; VEN = Veneto.
Land 14 01957 g005
Figure 6. Regional data: differences between observed and expected BeeNet area percentages by macro-category. Axes for each region range from –25 to +25 to highlight even minimal deviations. Refer to the text for more details. Abbreviations (in alphabetical order) refer to Italian regions: AOV = Aosta Valley; ABR = Abruzzo; BAS = Basilicata; CAL = Calabria; CAM = Campania; ERO = Emilia-Romagna; FVG = Friuli Venezia-Giulia; LAT = Latium; LIG = Liguria; LOM = Lombardy; MAR = Marche; MOL = Molise; PIE = Piedmont; PUG = Apulia; SAR = Sardinia; SIC = Sicily; TAA = Trentino Alto-Adige; TUS = Tuscany; UMB = Umbria; VEN = Veneto.
Land 14 01957 g006
Table 2. Summary of data of each Italian region. In the last column, theoretical density if workstations would be disposed regularly in each region; value is obtained by dividing total area of region by the number of BeeNet workstations.
RegionAcronym Land Included in the Regional Boundaries (km2)Land Included in Regional BeeNet Buffers (km2)Number of BeeNeet WorkstationsRegional Area (%) in BeeNet Buffers Estimation of Land Around Each Workstation km2
AbruzzoABR10,795.884.3120.78899.6
BasilicataBAS9991.255.280.551248.9
CalabriaCAL15,073.0117.1170.78886.6
CampaniaCAM13,596.6124.6180.92755.4
Emilia-RomagnaERO22,442.3224.4321.00701.3
Friuli-Venezia GiuliaFVG7910.659.790.76879.0
LazioLAT17,199.1118.0170.691011.7
LiguriaLIG5413.550.980.94676.7
LombardyLOM23,876.1302.4441.27542.6
MarcheMAR9382.248.670.521340.3
MoliseMOL4439.453.681.21554.9
PiedmontPIE25,401.3340.4491.34518.4
ApuliaAPU19,327.575.7110.391757.0
SardiniaSAR24,097.297.4140.401721.2
SicilySIC25,705.2200.6300.78856.8
TuscanyTUS22,982.1166.3240.72957.6
Trentino- Alto-AdigeTAA13,604.955.680.411700.6
UmbriaUMB8454.068.3100.81845.4
Aosta ValleyAOV3262.220.930.641087.4
VenetoVEN18,332.8239.0341.30539.2
Country levelITALY301,287.12502.83630.83830.0
Disclaimer/Publisher’s Note: The statements, opinions and data contained in all publications are solely those of the individual author(s) and contributor(s) and not of MDPI and/or the editor(s). MDPI and/or the editor(s) disclaim responsibility for any injury to people or property resulting from any ideas, methods, instructions or products referred to in the content.