Article

Land Use and Land Cover Change Patterns from Orbital Remote Sensing Products: Spatial Dynamics and Trend Analysis in Northeastern Brazil

by
Jhon Lennon Bezerra da Silva
1,*,
Marcos Vinícius da Silva
2,
Pabrício Marcos Oliveira Lopes
3,
Rodrigo Couto Santos
4,
Ailton Alves de Carvalho
5,
Geber Barbosa de Albuquerque Moura
3,
Thieres George Freire da Silva
3,5,
Alan Cézar Bezerra
5,
Alexandre Maniçoba da Rosa Ferraz Jardim
3,6,
Maria Beatriz Ferreira
7,
Patrícia Costa Silva
8,
Josef Augusto Oberdan Souza Silva
1,9,
Marcio Mesquita
1,10,
Pedro Henrique Dias Batista
11,
Rodrigo Aparecido Jordan
4 and
Henrique Fonseca Elias de Oliveira
1
1
Cerrado Irrigation Graduate Program, Goiano Federal Institute—Campus Ceres, GO-154, km 218-Zona Rural, Ceres 76300-000, GO, Brazil
2
Department of Engineering Agricultural, Centro of Sciences Chapadinha, Federal University of Maranhão, BR-222, Chapadinha 65500-000, MA, Brazil
3
Department of Engineering Agricultural, Federal Rural University of Pernambuco (UFRPE), Rua Dom Manoel de Medeiros, Dois Irmãos, Recife 52171-900, PE, Brazil
4
Faculty of Agricultural Sciences, Federal University of Grande Dourados (UFGD), Rodovia Dourados-Itahum, km 12, Campus Universitário (Unidade II), Dourados 79804-970, MS, Brazil
5
Academic Unit of Serra Talhada (UAST), Federal Rural University of Pernambuco (UFRPE), Gregório Ferraz Nogueira Ave., Serra Talhada 56909-535, PE, Brazil
6
Department of Biodiversity, Institute of Biosciences, São Paulo State University (UNESP), Rio Claro 13506-900, SP, Brazil
7
Postgraduate Program in Forest Sciences, Federal Rural University of Pernambuco (UFRPE), Rua Dom Manoel de Medeiros, Dois Irmãos, Recife 52171-900, PE, Brazil
8
Department of Agricultural Engineering, State University of Goiás, Santa Helena de Goiás 75920-000, GO, Brazil
9
Postgraduate Program in Computing (PPGC), Federal University of Pelotas (UFPEL), Rua Gomes Carneiro, 01-Balsa, Campus Anglo—UFPEL, Pelotas 96010-610, RS, Brazil
10
Faculty of Agronomy, Federal University of Goiás (UFG), Nova Veneza, km 0, Campus Samambaia—UFG, Goiânia 74690-900, GO, Brazil
11
Ceará State Technical Assistance and Rural Extension Company, Tenente José Vicente Avenue, 1017, Center, Itapipoca 62504-095, CE, Brazil
*
Author to whom correspondence should be addressed.
Land 2025, 14(10), 1954; https://doi.org/10.3390/land14101954
Submission received: 1 August 2025 / Revised: 14 September 2025 / Accepted: 23 September 2025 / Published: 26 September 2025

Abstract

Environmental degradation and soil desertification are among the most severe environmental issues of recent decades worldwide. Over time, these processes have led to increasingly extreme and highly dynamic climatic conditions. In Brazil, the Northeast Region is characterized by semi-arid and arid areas that exhibit high climatic variability and are extremely vulnerable to environmental changes and pressures from human activities. The application of geotechnologies and geographic information system (GIS) modeling is essential to mitigate the impacts and pressures on the various ecosystems of Northeastern Brazil (NEB), where the Caatinga biome is predominant and critically threatened by these factors. In this context, the objective was to map and assess the spatiotemporal patterns of land use and land cover (LULC), detecting significant trends of loss and gain, based on surface reflectance data and precipitation data over two decades (2000–2019). Remote sensing datasets were utilized, including Landsat satellite data (LULC data), MODIS sensor data (surface reflectance product) and TRMM data (precipitation data). The Google Earth Engine (GEE) software was used to process orbital images and determine surface albedo and acquisition of the LULC dataset. Satellite data were subjected to multivariate analysis, descriptive statistics, dispersion and variability assessments. The results indicated a significant loss trend over the time series (2000–2019) for forest areas (ZMK = −5.872; Tau = −0.958; p < 0.01) with an annual loss of −3705.853 km2 and a total loss of −74,117.06 km2. Conversely, farming areas (agriculture and pasture) exhibited a significant gain trend (ZMK = 5.807; Tau = 0.947; p < 0.01), with an annual gain of +3978.898 km2 and a total gain of +79,577.96 km2, indicating a substantial expansion of these areas over time. However, it is important to emphasize that deforestation of the region’s native vegetation contributes to reduced water production and availability. The trend analysis identified an increase in environmental degradation due to the rapid expansion of land use. LULC and albedo data confirmed the intensification of deforestation in the Northern, Northwestern, Southern and Southeastern regions of NEB. The Northwestern region was the most directly impacted by this increase due to anthropogenic pressures. Over two decades (2000–2019), forested areas in the NEB lost approximately 80.000 km2. Principal component analysis (PCA) identified a significant cumulative variance of 87.15%. It is concluded, then, that the spatiotemporal relationship between biophysical conditions and regional climate helps us to understand and evaluate the impacts and environmental dynamics, especially of the vegetation cover of the NEB.

1. Introduction

Land degradation is frequently studied and reported in research as one of the major environmental problems causing imbalances in the natural environment and socio-economic conditions at local, regional and global scales [1,2,3,4,5,6,7]. In recent decades, environmental degradation has intensified due to climate change and anthropogenic pressures, where their combined effects have been altering landscape patterns and terrestrial ecosystem mechanisms, especially in the semi-arid and arid regions of the world [8,9,10,11,12,13,14,15].
In Brazil, studies have been warning that the ecosystem services of biomes are increasingly affected by the inability to provide climate control, maintain natural soil fertility and ensure water and energy availability [14,16]. The situation is particularly evident in the Caatinga biome, where these factors have been causing complex processes such as desertification over time [17,18,19,20,21,22].
The Northeastern Brazilian region (NEB) and its semi-arid areas have high vulnerability to climate effects, with studies identifying processes such as reduced precipitation, increased temperature and evaporation, most notably, the intensification of drought in terms of frequency, duration and magnitude [23,24,25,26,27,28]. Additionally, these regions also face pressures from human activities, which have been altering land use and land cover conditions through degrading actions such as deforestation, burning, intensive agricultural practices and improper land management, among other impacts that contribute to the intensification of environmental degradation processes [17,29,30].
The NEB has historically been neglected compared to the level of research conducted in other regions of Brazil, making it difficult to promote modern, decentralized and participatory public policies for effective pre-planning and decision-making. Given these issues and considering the significant current challenges, understanding and quantifying the spatiotemporal patterns of land cover in the NEB is essential to guide more effective public policies and mitigation strategies for recurrent environmental impacts in arid and semi-arid regions [14,22,24].
Recently, there has been a notable increase in mapping levels in Brazil, which, in both past and current contexts, have provided effective support for direct applications in Earth sciences studies [14,24,31,32]. For example, the MapBiomas project, which is a global reference in the production and mapping of land use and land cover (LULC) data through geospatial monitoring of transformations in Brazilian territory, among others, utilizes remote sensing datasets and satellite imagery combined with GIS modeling and cloud-based digital processing in Google Earth Engine (GEE) [33,34]. Based on this database, the present study aims to characterize significant change trends over time, particularly in areas of forest cover, agriculture, non-vegetated land and water resources in the NEB.
In this context, statistical modeling of LULC data through multivariate analysis and the non-parametric Mann–Kendall test was applied to identify change patterns and significant correlations in the trends of loss and gain in the time series [35,36,37]. The objective is to enhance the understanding of the variability dimensions of land use change in response to climate change and anthropogenic pressures [16], generating results for adequate planning and adaptation management under current and future conditions.
Additionally, multitemporal data from the MODIS sensor was incorporated into the present study to determine surface albedo at a regional scale, as most studies focus only on a local scale. Albedo is a fundamental biophysical parameter for understanding surface alteration processes, as it is associated with LULC and functions as an indicator of climate and anthropogenic change impacts. It is one of the main components of the surface energy balance, meaning it controls climatic and environmental conditions as well as the Earth’s radiation absorption processes, which can affect processes such as evapotranspiration, photosynthesis and plant respiration [38,39,40,41].
Given the issue of global environmental degradation, it is essential to adopt remote sensing technologies and geospatial modeling that offer high applicability, cost-effectiveness and operational efficiency. These tools help bridge gaps related to the lack of agro-environmental data at local and regional scales, enabling more precise and comprehensive analyses. In NEB, land degradation and changes in the LULC are driven by climatic and anthropogenic factors, generating significant socio-environmental impacts. However, there remains a shortage of studies integrating long-term time series, advanced digital processing techniques and robust statistical methods to assess these transformations. Understanding LULC trends over time is crucial for supporting mitigation and adaptation strategies, providing a basis for the sustainable management of natural resources in the region. This necessity justifies the present investigation.
In Northeastern Brazil, the concurrent action of climatic and anthropic pressures on a semi-arid–humid–dry gradient that crosses multiple biomes constitutes a problem that generates heterogeneous environmental responses. These pressures modify annual LULC patterns, alter surface properties (e.g., albedo), influence the levels of degradation and desertification, and intensify fragmentation. The effects extend beyond biome boundaries, with direct implications for water availability, agro-environmental productivity, and thermal regulation [6,8,14,18,20].
Despite sectoral advances, a knowledge gap persists, as there is a lack of integrated, annual, multi-biome assessments that treat NEB as a continuous system and quantify, with the same taxonomy and resolution, the spatial dynamics and trends of LULC along the semi-arid–humid–dry gradient. Available evidence remains fragmented by biome or administrative boundaries, which prevents comparability of metrics in space and time, hinders the identification of inter-biome connections (hydrology, degradation, fragmentation), and limits the detection of spillover effects and changes in surface properties. This gap restricts operational diagnoses and the calibration of regional public policies, reinforcing the need for an approach that produces consistent indicators of magnitude and direction of change for the entire NEB, as proposed in this investigation.
Thus, analyzing NEB as a contiguous territory allows measurement of humid–dry transitions with harmonized annual series (2000–2019) and derivation of comparable indicators of cover loss/gain, albedo variations, and degradation patterns. This framework strengthens the usefulness of results for territorial planning, risk management, and climate adaptation, overcoming thematic fragmentation and enabling operational diagnoses for regional-scale public policies, justifying the proposal of this research.
In this study, the innovation lies in treating NEB as a contiguous mosaic under contrasting climatic conditions, using harmonized annual LULC series (2000–2019) and re-producible trend metrics to estimate comparable magnitudes and directions of change among biomes, in addition to understanding biophysical parameters such as albedo using a practical and effective language for spatiotemporal monitoring through automatic cloud processing associated with machine learning-based models. By articulating the continuous regional delineation with time series statistics and biophysical variables derived from remote sensing, the work overcomes thematic fragmentation, offering a unified framework to assess semi-arid–humid–dry transitions and their implications for ecosystem services and environmental governance.
In this context, the (i) problem of this research is summarized (climatic and anthropogenic pressures acting on the semi-arid–dry–humid gradient and their inter-biome effects in NEB); (ii) the gap (lack of integrated, annual, and comparable assessments that treat NEB as a continuous system); (iii) the justification (relevance of the contiguous regional delineation and the harmonized treatment of LULC series associated with robust sets of remote sensing); and (iv) the research contribution (analytical integration of the magnitude and direction of environmental changes and indicators applicable to management and public policies).
This study aimed to spatiotemporally map and analyze annual land use and land cover change patterns using satellite data and GIS modeling, identifying significant loss/gain trends over two decades (2000–2019) in NEB and its ecosystems. The specific objectives were to quantify the variations in LULC classes over the analyzed period, relating forest areas with farming, and water with non-vegetated areas; to determine the spatial and temporal patterns of LULC using remote sensing data and multivariate statistics; and to apply the non-parametric Mann–Kendall and Sen tests to estimate the magnitude of temporal changes and identify statistically significant trends.
With this study, we expect to provide a robust diagnosis of the spatiotemporal land use and land cover (LULC) trends in Northeastern Brazil (NEB) over two decades, identifying degradation patterns and the expansion of agricultural areas. Additionally, we intend to assess the influence of climate change, particularly rainfall variability, on these transformations. The findings may contribute to the formulation of environmental public policies and conservation strategies, supporting decision-making processes aimed at regional sustainability.

2. Materials and Methods

2.1. Characterization of the Study Area

The study area is the Northeastern region of Brazil (NEB), located within the following geographical coordinates: southern latitudes from 1°27′ S to 18°19′ S and western longitudes from 34°45′ W to 47°12′ W (Figure 1). It is noteworthy that the NEB covers a total area of 1,553,402 km2, which represents approximately 18.24% of Brazilian territory [42]. Based on the Köppen climate classification map for Brazil from the modified methodology of Alvares et al. [43], it is highlighted that the climate of the NEB has in its interior, the predominant climate is Semi-arid (BSh), characterized by low annual precipitation (<800 mm), high evaporation rates and prolonged drought periods. In contrast, the coastal region is dominated by the Tropical Savanna (Aw) and Tropical Monsoon (Am) climates, which have higher water availability and an annual precipitation ranging from 1000 to 2500 mm, distributed throughout the year [14,43].
The maps present LULC data (Figure 1a,b) based on the thematic classification of the MapBiomas Project, as well as the digital elevation model (DEM) (Figure 1c) derived from the Shuttle Radar Topography Mission (SRTM) project, provided by the United States Geological Survey (USGS) and the National Institute for Space Research (INPE), both with a spatial resolution of 30 m. The thematic maps are georeferenced using the Geographic Coordinate System “DATUM: WGS1984”, covering zones 23, 24 and 25 South (Figure 1).
We selected NEB as the experimental field because it concentrates, in a contiguous manner, the largest portion of Brazilian drylands while simultaneously integrating multiple climatic regimes and four biomes directly aligned with the scope of Land (climate–soil–water–biodiversity–land use interactions) [44,45]. Geographically and environmentally, NEB describes a zonal gradient extending from the humid coast (Am/Aw) to the semi-arid interior (BSh), which enables the investigation of spatiotemporal dynamics emerging from transitions between semi-arid–dry–humid domains with greater spatial robustness than a restricted delineation to the Brazilian Semi-Arid region [43].
From a biogeographical perspective, it is noteworthy that the NEB encompasses important ecosystems (integrated multi-biome mosaic), including the Amazon biome, which represents 7.35%; the Cerrado biome, covering 29.11%; the Atlantic Forest biome, accounting for 10.05%; and the Caatinga biome, which constitutes 53.49% of the region [42]. The Caatinga biome occupies a total area of 830,205 km2 within the NEB, with the Brazilian seasonally dry tropical forest (Caatinga) prevailing at 63.30% [18,42].

2.2. Processing, Statistical Tests and Classification of LULC Data (MapBiomas)

2.2.1. LULC Classification and Cloud Processing

The MapBiomas initiative includes collaborative applications and geospatial monitoring efforts not only in Brazil but also in other South American countries and Indonesia (https://brasil.mapbiomas.org/iniciativas-mapbiomas/, accessed on 10 September 2025). The LULC data are publicly accessible, open access and free under the CC-BY-SA license (https://brasil.mapbiomas.org/produtos/?category=maps, accessed on 10 September 2025) [34].
The LULC mapping process was carried out for each year, between 2000 and 2019, and determined by emphasizing the majority classes of level 1 of collection 5 of the MapBiomas product such as forest, non-forest natural, farming, non-vegetated area and water (https://mapbiomas.org/o-projeto, accessed on 10 September 2025). It is worth noting that each of the major classes has its subclasses, which are configured as other levels of the product. The forest class encompasses the subclasses: natural forest, natural forest, forest formation, savanna formation, mangrove and forest plantation; the non-forest natural class as subclasses: wetland, grassland formation, salt flat, rocky outcrop and other non-forest formations; the farming class the subclasses: pasture, agriculture, temporary crop, soybean, sugarcane, other temporary crops, perennial crop and mosaic of agriculture and pasture; the non-vegetated area class the subclasses: beach and dune, urban infrastructure, mining and other non-vegetated areas; and, the water class the subclasses: river, lake and ocean, and aquaculture. However, it was not one of the objectives of this study to present other specific levels of subclasses in the LULC maps. Highlighting that level 1 has greater accuracy and statistical precision when compared to the other levels.
It is worth noting that, despite having new collections and LULC highlights with technological advances and improvements in map production, MapBiomas data generally follows a standardized basic methodology, using the same sensors over time, such as the Landsat satellite series. In this regard, MapBiomas collections have similar statistical validation and good statistical precision, justifying the use of any collection of interest. The reasons for using MapBiomas, MODIS, and TRMM products were technical and logistical, considering the objective of associating three different satellites in an annual spatiotemporal analysis, which covers exactly the period from 2000 to 2019. Several studies have studied the last two decades (2000–2020) in light of the intensified effects of climate change at regional and global levels. And when it comes to the Brazilian Northeast, the decade 2010–2020 has been shown in several climate variability studies and multiscale projections as one of the most remarkable periods. Where the challenges and impacts revolved around reduced precipitation, increased temperature, and increased frequency and intensity of droughts, with a marked water deficit, such as the prolonged severe drought from 2012 to 2019, which affected practically the entire NEB region, with impacts on vegetative resilience as well as local and regional water availability.
The geospatial dataset used for the LULC classifications was based on multitemporal data series from Landsat satellites, with a spatial resolution of 30 m, from the National Aeronautics and Space Administration (NASA) and the United States Geological Survey (USGS), with complete and specific characteristics available in the following access: (https://www.usgs.gov/landsat-missions/landsat-satellite-missions, accessed on 1 October 2020). The orbital images were from Landsat-5, with the Thematic Mapper (TM) sensor, from 2000 to 2010 (except 2001 and 2002—due to technical problems); from Landsat-7, with the Enhanced Thematic Mapper (ETM+) sensor, in 2001 and 2002, and 2011 and 2012; and also from Landsat-8, with the Operational Land Imager (OLI) and Thermal Infrared Sensor (TIRS) sensors, from 2013 to 2020. Thus, the top-of-atmosphere reflectance (TOA) and surface reflectance (SR) data from the USGS were used, accessed in the Google Earth Engine (GEE) platform library, available at: (https://earthengine.google.com/).
The data are digitally processed using machine learning algorithms through the GEE software, employing computational modeling and cloud-based digital processing [30]. The time series used in the present study corresponds to the thematic classification of Collection 5, released in August 2020, using the “toolkit-lulc” as predefined scripts within GEE, link to access the script code: https://code.earthengine.google.com/b5b02c706eb181be4f106368003667ba, accessed on: 1 October 2020. In GEE, digital data processing stands out for the use of cloud-free Landsat compositions, based on specific time periods, which aims to optimize spectral contrast and assist in class discrimination. In this regard, it is worth highlighting the use of scripts for masking clouds and their shadows, which takes advantage of the quality assessment (QA) band and the GEE median reducer, which can improve data integrity by indicating which pixels may be affected or subject to cloud contamination [46]. Scripts are available from the GEE library in the following ID codes: for TM and ETM+ sensors (https://code.earthengine.google.com/1eaa85c5dd5ec9bbfc5402ef183a28e2?noload=true, accessed on 10 September 2025) and for OLI/TIRS sensors (https://code.earthengine.google.com/9841241f7ed93a37ca16cf6064241328?noload=true, accessed on 10 September 2025) and (https://code.earthengine.google.com/4afa9376dd042029f6ea23eb0ef46422?noload=true, accessed on 10 September 2025).
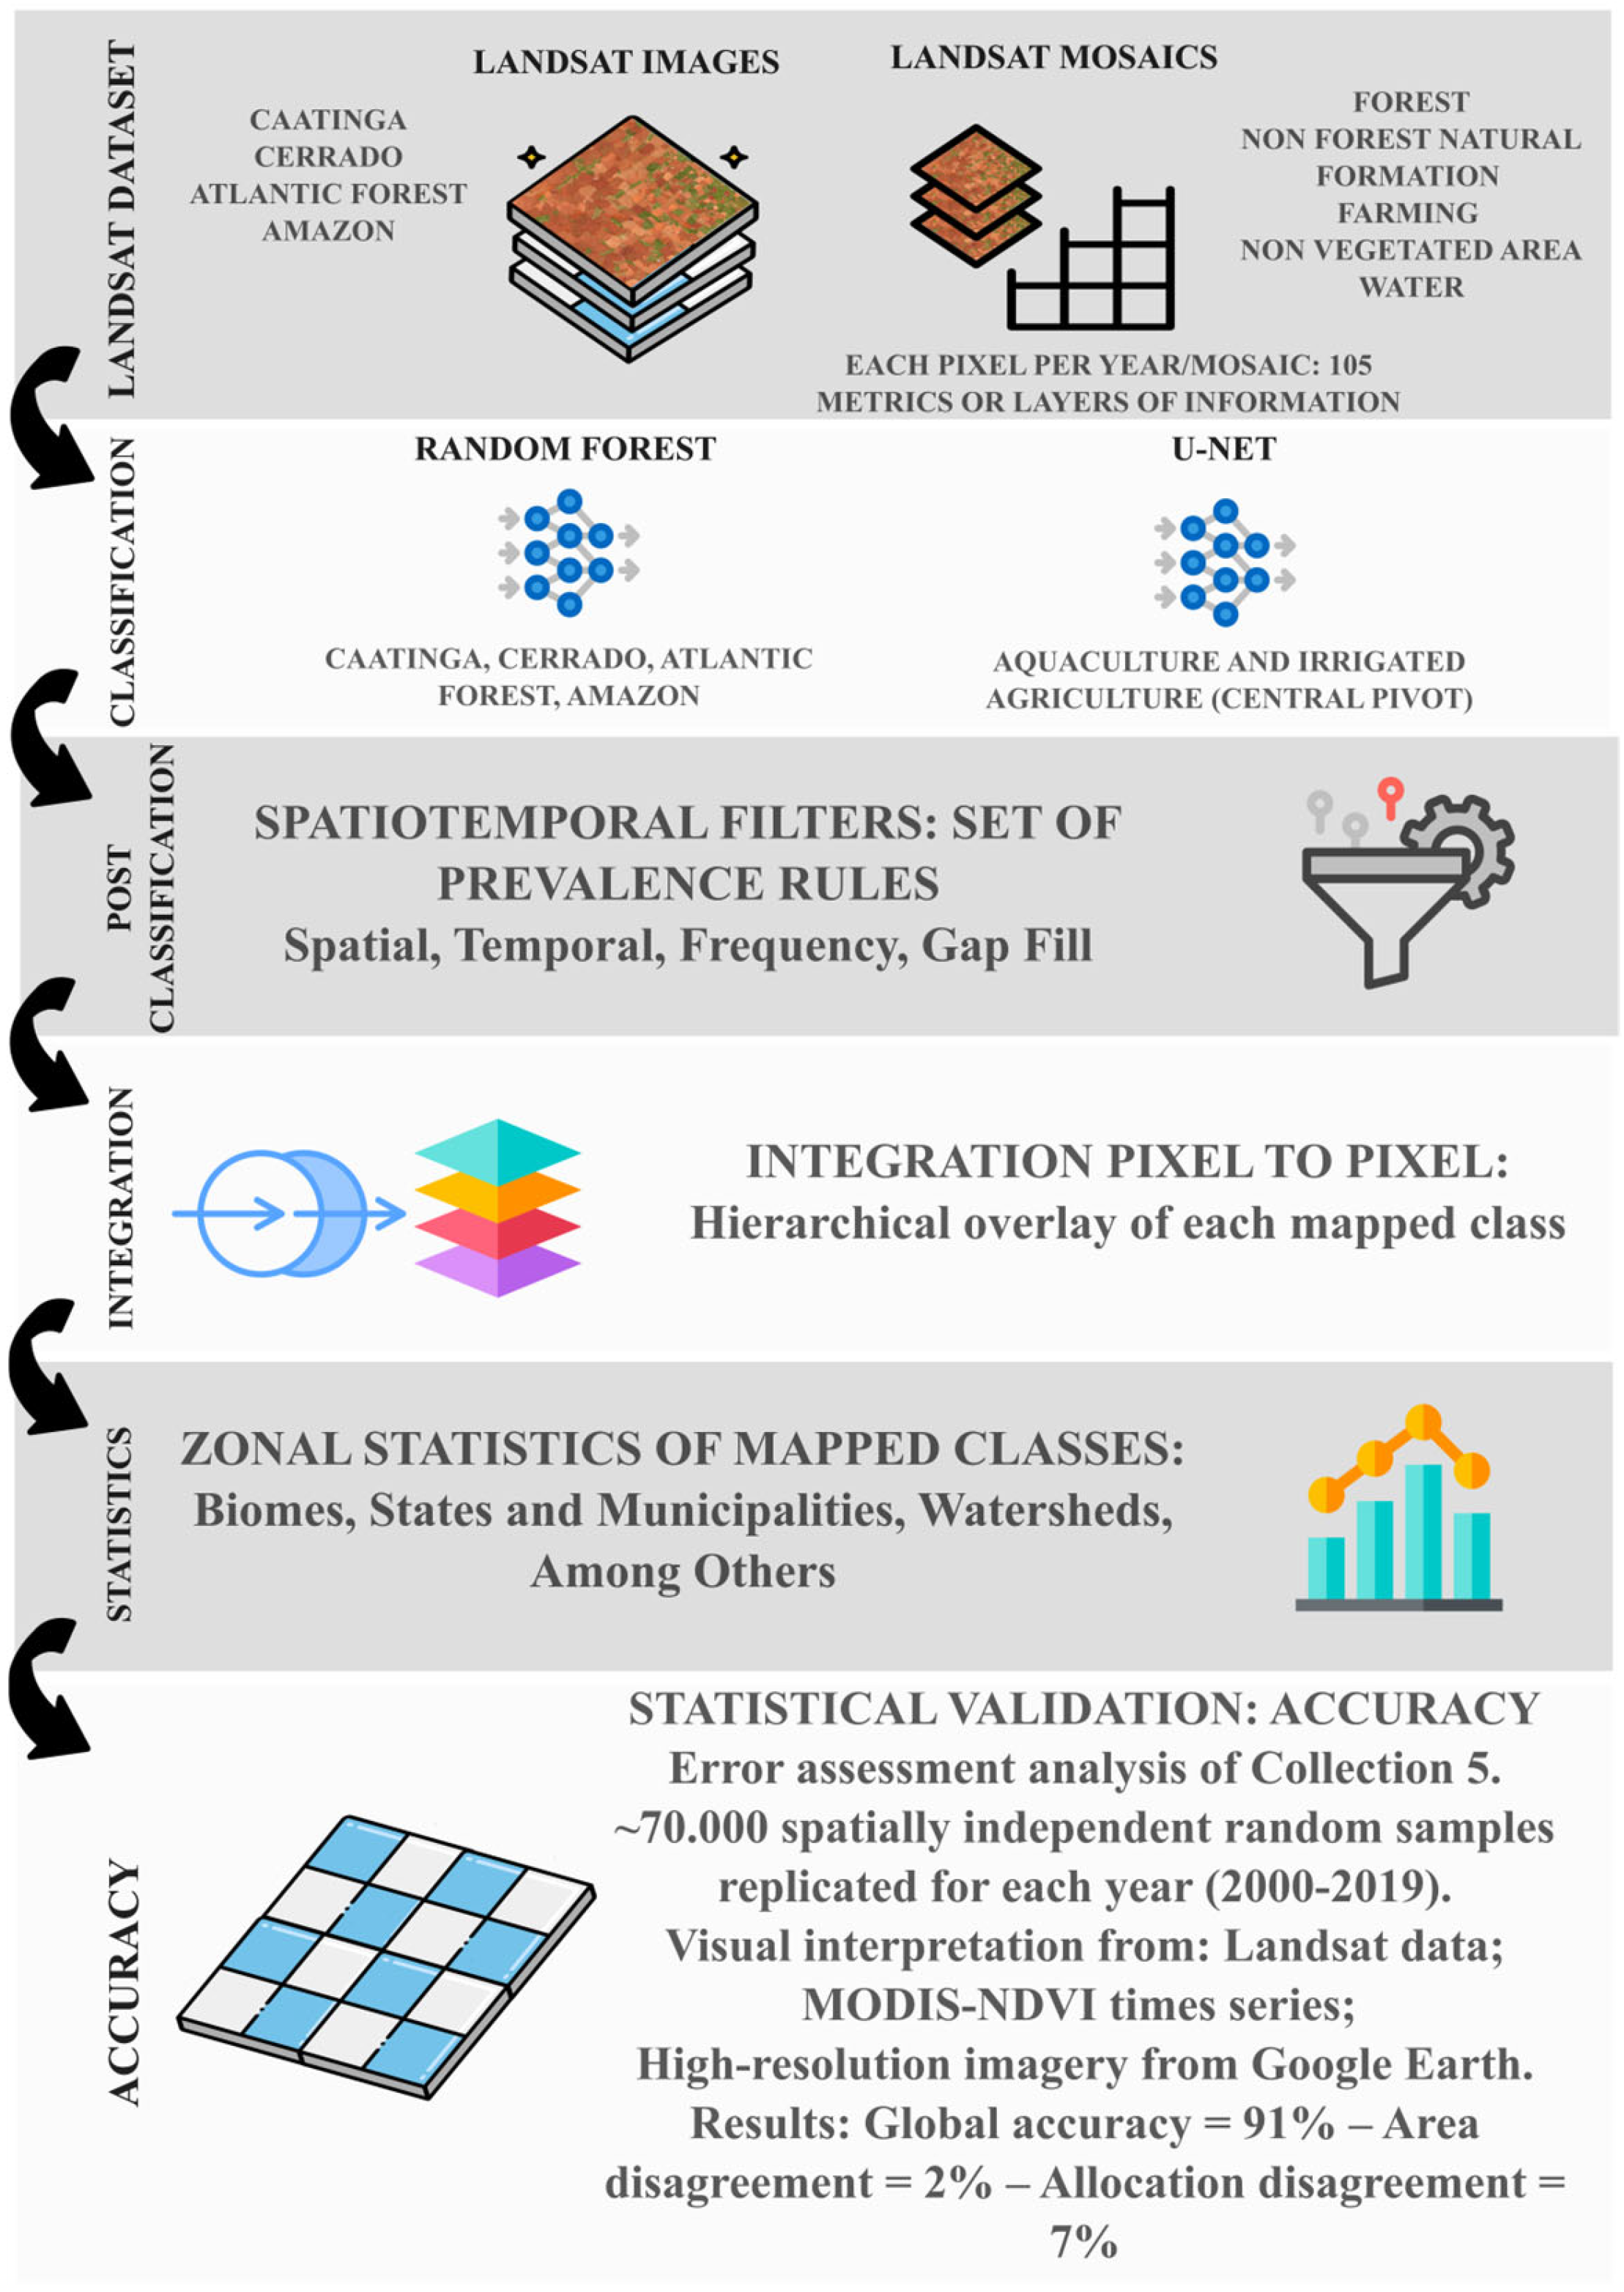
Figure 2 presents the main methodological steps of the LULC classifications. In the first step, all available satellite images for the period evaluated (2000–2019) were searched, aiming to calculate the spectral indices and fractions for each of the satellite observations. With this, representative annual mosaics were generated containing more than a hundred layers or information metrics per pixel, based on the multispectral bands of the TM, ETM+ and OLI/TIRS sensors, specifically explaining the spatiotemporal behavior pixel by pixel. Thus, a set of 20-year mosaics (a source of parameters that aims to classify images through an algorithm) was produced to understand and optimize the conditions of specific spatial and spectral contrasts, promoting better detection of LULC classes both between biomes and between transversal themes (majority classes).
The second stage involved defining the feature space, where all the characteristic attributes of the multispectral bands of the TM, ETM+ and OLI/TIRS sensors were derived to train a machine learning-based model for each year, such as the automatic classifier/random forest algorithm [47]. Thus, annual training samples were acquired for each of the biomes (Caatinga, Cerrado, Atlantic Forest and Amazon) and cross-cutting themes (forest, non-forest natural, farming, non-vegetated area and water). Based on the trained dataset for the given years (2000–2019), the output data in the random forest was a thematic map of LULC by year. Some specific subclasses have exceptions and were detected using the U-Net convolutional neural network (CNN) classifier, such as aquaculture belonging to the water class, and irrigated agriculture (central pivot) inserted in the farming class (Figure 2).
In the third stage, spatiotemporal filters were applied to the LULC classification data, aiming at noise removal and temporal stabilization. It is noteworthy that the spatial filter aimed to increase the spatial consistency of the LULC data, for example, by suppressing isolated or edge pixels. Also, to fill gaps related to Landsat-7 issues, a gap-filling algorithm was applied to each scene (USGS—https://www.usgs.gov/media/files/landsat-7-slc-gap-filled-products-phase-one-methodology, accessed on accessed on 10 September 2025). This employed a multitemporal mosaic strategy, selecting appropriate pixels from different dates to fill the remaining gaps after gap filling.
Gap filling was implemented early in the post-classification process, assigning a label to any missing pixel based on the previous or subsequent LULC classification. It is worth noting that MapBiomas multitemporal approach significantly reduces reliance on a single Landsat-7 image or scene (Figure 2). In this context, customized rules were defined for each class, as well as applied to each of the pixels in each year (neighborhood rules that can change the pixel classification), given as a criterion: if the number of neighboring pixels of the same class is less than 2 pixels out of a total of 9 neighbors, the pixel was reclassified to the predominant class of the neighborhood. The temporal filter aims to reduce inconsistencies (incoherent or unauthorized changes in land cover) and correct errors due to excessive cloud cover or even the absence of data. Therefore, each pixel has its classification history evaluated, where temporal consistency rules are applied with at least 100 filter rules.
In the fourth stage, each LULC class was integrated into an annual map (overlapping map), thus representing the land cover data for the entire study area and for each year analyzed. In this context, given the concern regarding the overlapping of classes, specific prevalence rules were applied considering the particularities of each biome and cross-cutting theme (Figure 2). For example, in cases of classifying the same pixel in two different class mappings, it is possible to decide to which the given pixel actually belongs in the final map product. And due to the consequence of this integration process, LULC went through another stage of spatial filtering to clean up edges and loose pixels.
In the fifth stage, the zonal statistics of the LULC classes mapped to different spatial units such as biomes, states and municipalities, among other regions of interest, were calculated (Figure 2). Likewise, LULC data were calculated for different categories of environmental variables, which involved geomorphological and pedological data, hypsometry data, vegetation and slope data [42,48,49]. However, in this research, zonal statistics were calculated for the entire Northeast region of Brazil.
In the sixth stage, for the analysis of accuracy and error assessment, validation with independent points, a reference database was used that encompasses the entire territorial extension of the biomes: Caatinga (9738 samples), Cerrado (21,290 samples), Atlantic Forest (14,497 samples) and Amazon (25,258 samples), composed of approximately a total of 70,000 spatially independent random samples (Figure 2), where a stratified sampling strategy by two levels, being the junction of every four IBGE letters (1:250.000) and based on the slope classes of the Brazilian Agricultural Research Corporation—EMBRAPA, which were replicated for each of the years of the spatiotemporal analysis. Assessment points for the entire NEB totaled 17,907 spatial samples. To acquire the validation samples, practices proposed by Stehman and Fody [50], Stehman et al. [51] and Olofsson et al. [52] were followed. A total sample size was established to ensure a maximum margin of error of 5% and a confidence level of 95% (https://brasil.mapbiomas.org/pontos-de-validacao/, accessed on 10 September 2025). The reference samples were labeled according to the LULC classification, produced from visual interpretations using a sample evaluation using the Temporal Visual Inspection (TVI) web platform, developed by the Remote Sensing and GIS Laboratory of the Federal University of Goiás (Lapig/UFG), extracting data from the Landsat satellite series, through RGB compositions, used for the collection of training samples and also for the evaluation of accuracy by visual interpretation, by the MODIS-NDVI product and high-resolution images from Google Earth [53].
Therefore, the mapping quality as a function of reference satellite data was subjected to statistical accuracy metrics, using the population error matrix for estimates of global, user and producer accuracies (Figure 2) based on Stehman [51], and Stehman and Fody [50]. These metrics were evaluated for each year, based on cross-tabulation of sample counts for mapped and reference classes, including accuracy criteria and rate of omission and inclusion errors for each LULC class [54]. Further details on the overall accuracy and precision assessment of land cover mapping and other important methodological specifics can be accessed from the following link: https://brasil.mapbiomas.org/estatistica-de-acuracia/colecao-5-0/, accessed on 10 September 2025 [53].

2.2.2. Estimation of Spectral and Surface Indices, Predictor Variables and Their Statistical Reducers

The characteristic input data for the actual LULC classification process included a robust set of at least 100 variables, with emphasis on the reflectance bands and thermal bands of the satellites (Table 1), as well as the determination of vegetation indices and estimation of other predictor variables (Table 2) derived from the spectral modeling process.
Table 1 presents the characteristics of the satellite/sensor bands used as input to the LULC map production and classification process. It should be noted that in this process, all bands were subjected to statistical analysis using a set of statistical reducers to evaluate the spectral data pixel by pixel and band by band.
Table 2 presents specific methodological processes for spectral vegetation indices, which were determined from satellite/sensor bands, as well as highlighting the estimation of other indices and fractions of predictor variables used as input data to classify the LULC for the NEB region. It is noteworthy that the numerical values observed in some equations favor the stabilization of atmospheric conditions according to the specific patterns of the study area, which involves different biomes, favoring the reduction in the residual effects of aerosols.
The complete development processes for LULC production can be explored in the Algorithm Theoretical Base Document (ATBD), available at: https://brasil.mapbiomas.org/download-dos-atbds-com-metodo-detalhado/, accessed on 10 September 2025. As well as the main processing codes employed are publicly available in the GitHub repository: https://github.com/mapbiomas-brazil, accessed on 10 September 2025 [34].
Studies aligned with the platform’s objectives include monitoring native vegetation areas, focusing on mapping the loss and resilience of natural vegetation cover in biomes [22,70,71], monitoring pasture areas, evaluating their quality and degradation [72,73], and assessing agricultural areas, with emphasis on the evolution of irrigation and mapping of diverse crops [66,74]. Additionally, MapBiomas enables the monitoring of water resources, mapping hydrological coverage patterns of rivers, lakes and reservoirs across various strategic regional levels [75,76], as well as tracking urban infrastructure expansion and non-vegetated areas, among other cross-cutting themes [1,71,77].

2.2.3. Mann–Kendall and Sen’s Slope Trend Tests in LULC Data

Based on the quantitative values of the thematic classifications from the annual MapBiomas maps, the non-parametric temporal trend tests of Mann–Kendall and Sen’s slope were applied [78,79,80] to analyze the significant trends of loss and gain in land use and land cover classes between 2000 and 2019. In this context, the aim was to identify landscape dynamics change patterns and assess the impacts of change in response to climate variability and pressures from anthropogenic activities [35,81].
Mann–Kendall is a non-parametric trend test that does not assume a specific data distribution but requires consistent time series data. Thus, the autocorrelation function test was applied to verify whether the time series variables were independent of each other. The Mann–Kendall test was not applied to dependent variables [82,83]. However, the modified Mann–Kendall test was applied to variables that exhibited autocorrelation [84].
The null hypothesis (h0) of the test states that there is no trend in the data, while the alternative hypothesis (h1) indicates that the data exhibit a monotonic trend. The Mann–Kendall test statistic (S) is described by Equation (1) [78,79].
S = i = 1 n 1 j = i + 1 n Sgn x j x i  
where n corresponds to the number of data points; xi and xj are data in time series i and j (j > i), respectively, and Sgn (xj − xi) is defined by Equation (2).
Sgn   x j x i = + 1   i f   x j x i   >   0 0   i f   x j x i = 0 1   i f   x j x i   <   0
When the number of observations (n) is large, the probability distribution S converges to a normal distribution with zero mean and variance (Var(S)) defined according to Equation (3).
Var S = n n 1 2 n + 5 i = 1 q t i t i 1 2 t i + 5 18
where n is the number of data points; ti—number of values in the i-th group; q—number of groups containing repeated values.
The Mann–Kendall test statistic is estimated through the observed value for the variable ZMK, where the statistical value S can be transformed into ZMK, according to the conditions given in Equation (4).
Z MK = S 1 Var ( S ) ,   i f   S   >   0 0 , i f   S = 0 S + 1 Var ( S ) ,   i f   S   <   0
where −1.96 ≤ ZMK ≤ 1.96, the null hypothesis (h0) is accepted, indicating that there is no statistically significant trend in the time series. Therefore, the trend is significant at the 95% confidence level (p < 0.05) if |ZMK| > 1.96 and at the 99% confidence level (p < 0.01) if |ZMK| > 2.58. However, when the ZMK value is positive, the time series period is characterized as having an increasing trend, while a negative ZMK characterizes a decreasing trend.
Once the trends for the LULC data classes were identified based on the p-value, in addition to the time trend test, the non-parametric Sen’s slope trend test and Kendall’s Tau statistic were applied to estimate the true trend slope in a sample of “n” data pairs. It is noteworthy that the Tau value varies between −1 and 1, expressing the strength and direction of the association between the LULC classes. Therefore, negative values indicate a decreasing trend and positive values indicate an increasing trend within the class. Sen’s slope applies a linear trend estimation model, where the variance in residuals must remain constant over time [80], according to Equation (5).
Q i = x j     x k   j k ,   for   i = 1 , 2 , 3 , , n  
where xj and xk are given values at respective times j and k (j > k). When there is only one data point per time period, then N = n(n − 1)/2, where n is the number of time periods. However, when multiple observations exist in one or more time periods, then N < n(n − 1)/2. The n values of Qi are ranked from smallest to largest and the median slope (Sen’s slope estimator) is calculated according to Equation (6).
Q med = Q [ ( n + 1 ) / 2 ]   ,     i f   n   i s   o d d Q [ n / 2 ]   + Q [ ( n + 2 ) / 2 ]   2 ,     i f   n   i s   e v e n
The sign of Qmed reflects the trend direction of the data, while its value indicates the trend slope. Thus, to estimate whether the median slope is significantly different from zero, the confidence interval for Qmed is obtained from a specific probability, as shown in Equation (7) [85].
Var S = Z 1 p / 2   Var ( S )
where Var(S) is obtained according to Equation (4); Z1 − p/2 is obtained from the standard normal distribution table. In the present study, the following confidence level intervals were assigned: 99% (p < 0.01) and 95% (p < 0.05). Then, the values are calculated as M1 = (n − Cp)/2 and M2 = (n + Cp)/2. Accordingly, the lower (Qmin) and upper (Qmax) confidence interval limits are the M1th largest and (M2 + 1)th largest of the n-ordered slope estimates [85]. Therefore, the Qmed slope is significantly different from zero if the Qmin and Qmax limits have the same sign.
The methodology presented is widely used in research on LULC change patterns, identifying whether there is a significant trend of land use changes over time [36,86,87], as well as in climate variability studies, to identify significant trends in meteorological variables such as precipitation and temperature [16,23,35,88,89,90,91,92], evaluating these contexts in relation to climate change events and pressures from anthropogenic activities.

2.3. TRMM_3B43v7 Data and Surface Data Validation

Precipitation data from the Tropical Rainfall Measuring Mission (TRMM 3B43, version 7) satellite were used, originating from the joint mission of the National Aeronautics and Space Administration (NASA) and the Japan Aerospace Exploration Agency (JAXA), available at: https://pmm.nasa.gov/TRMM, accessed on 10 January 2021. TRMM has effective and validated data for global rainfall estimates [93,94,95,96].
The TRMM_3B43v7 dataset was obtained through the Giovanni platform in GeoTIFF file format, available at: https://giovanni.gsfc.nasa.gov/giovanni/, accessed on 10 January 2021. The TRMM product data are available from 1 January 1998 to 31 December 2019. The precipitation data have a spatial resolution of 0.25° × 0.25° and were acquired for this study on a monthly temporal scale, with the unit of measurement in mm/monthly, classified as processing level “L3” [97,98,99,100].
Annual rainfall totals were estimated by accumulating monthly data over twelve months, i.e., on an annual basis, using the ordinary kriging spatial interpolation method [101,102,103]. Based on these estimation data, the mean pixel statistical value for the multitemporal series (2000–2019) was used.
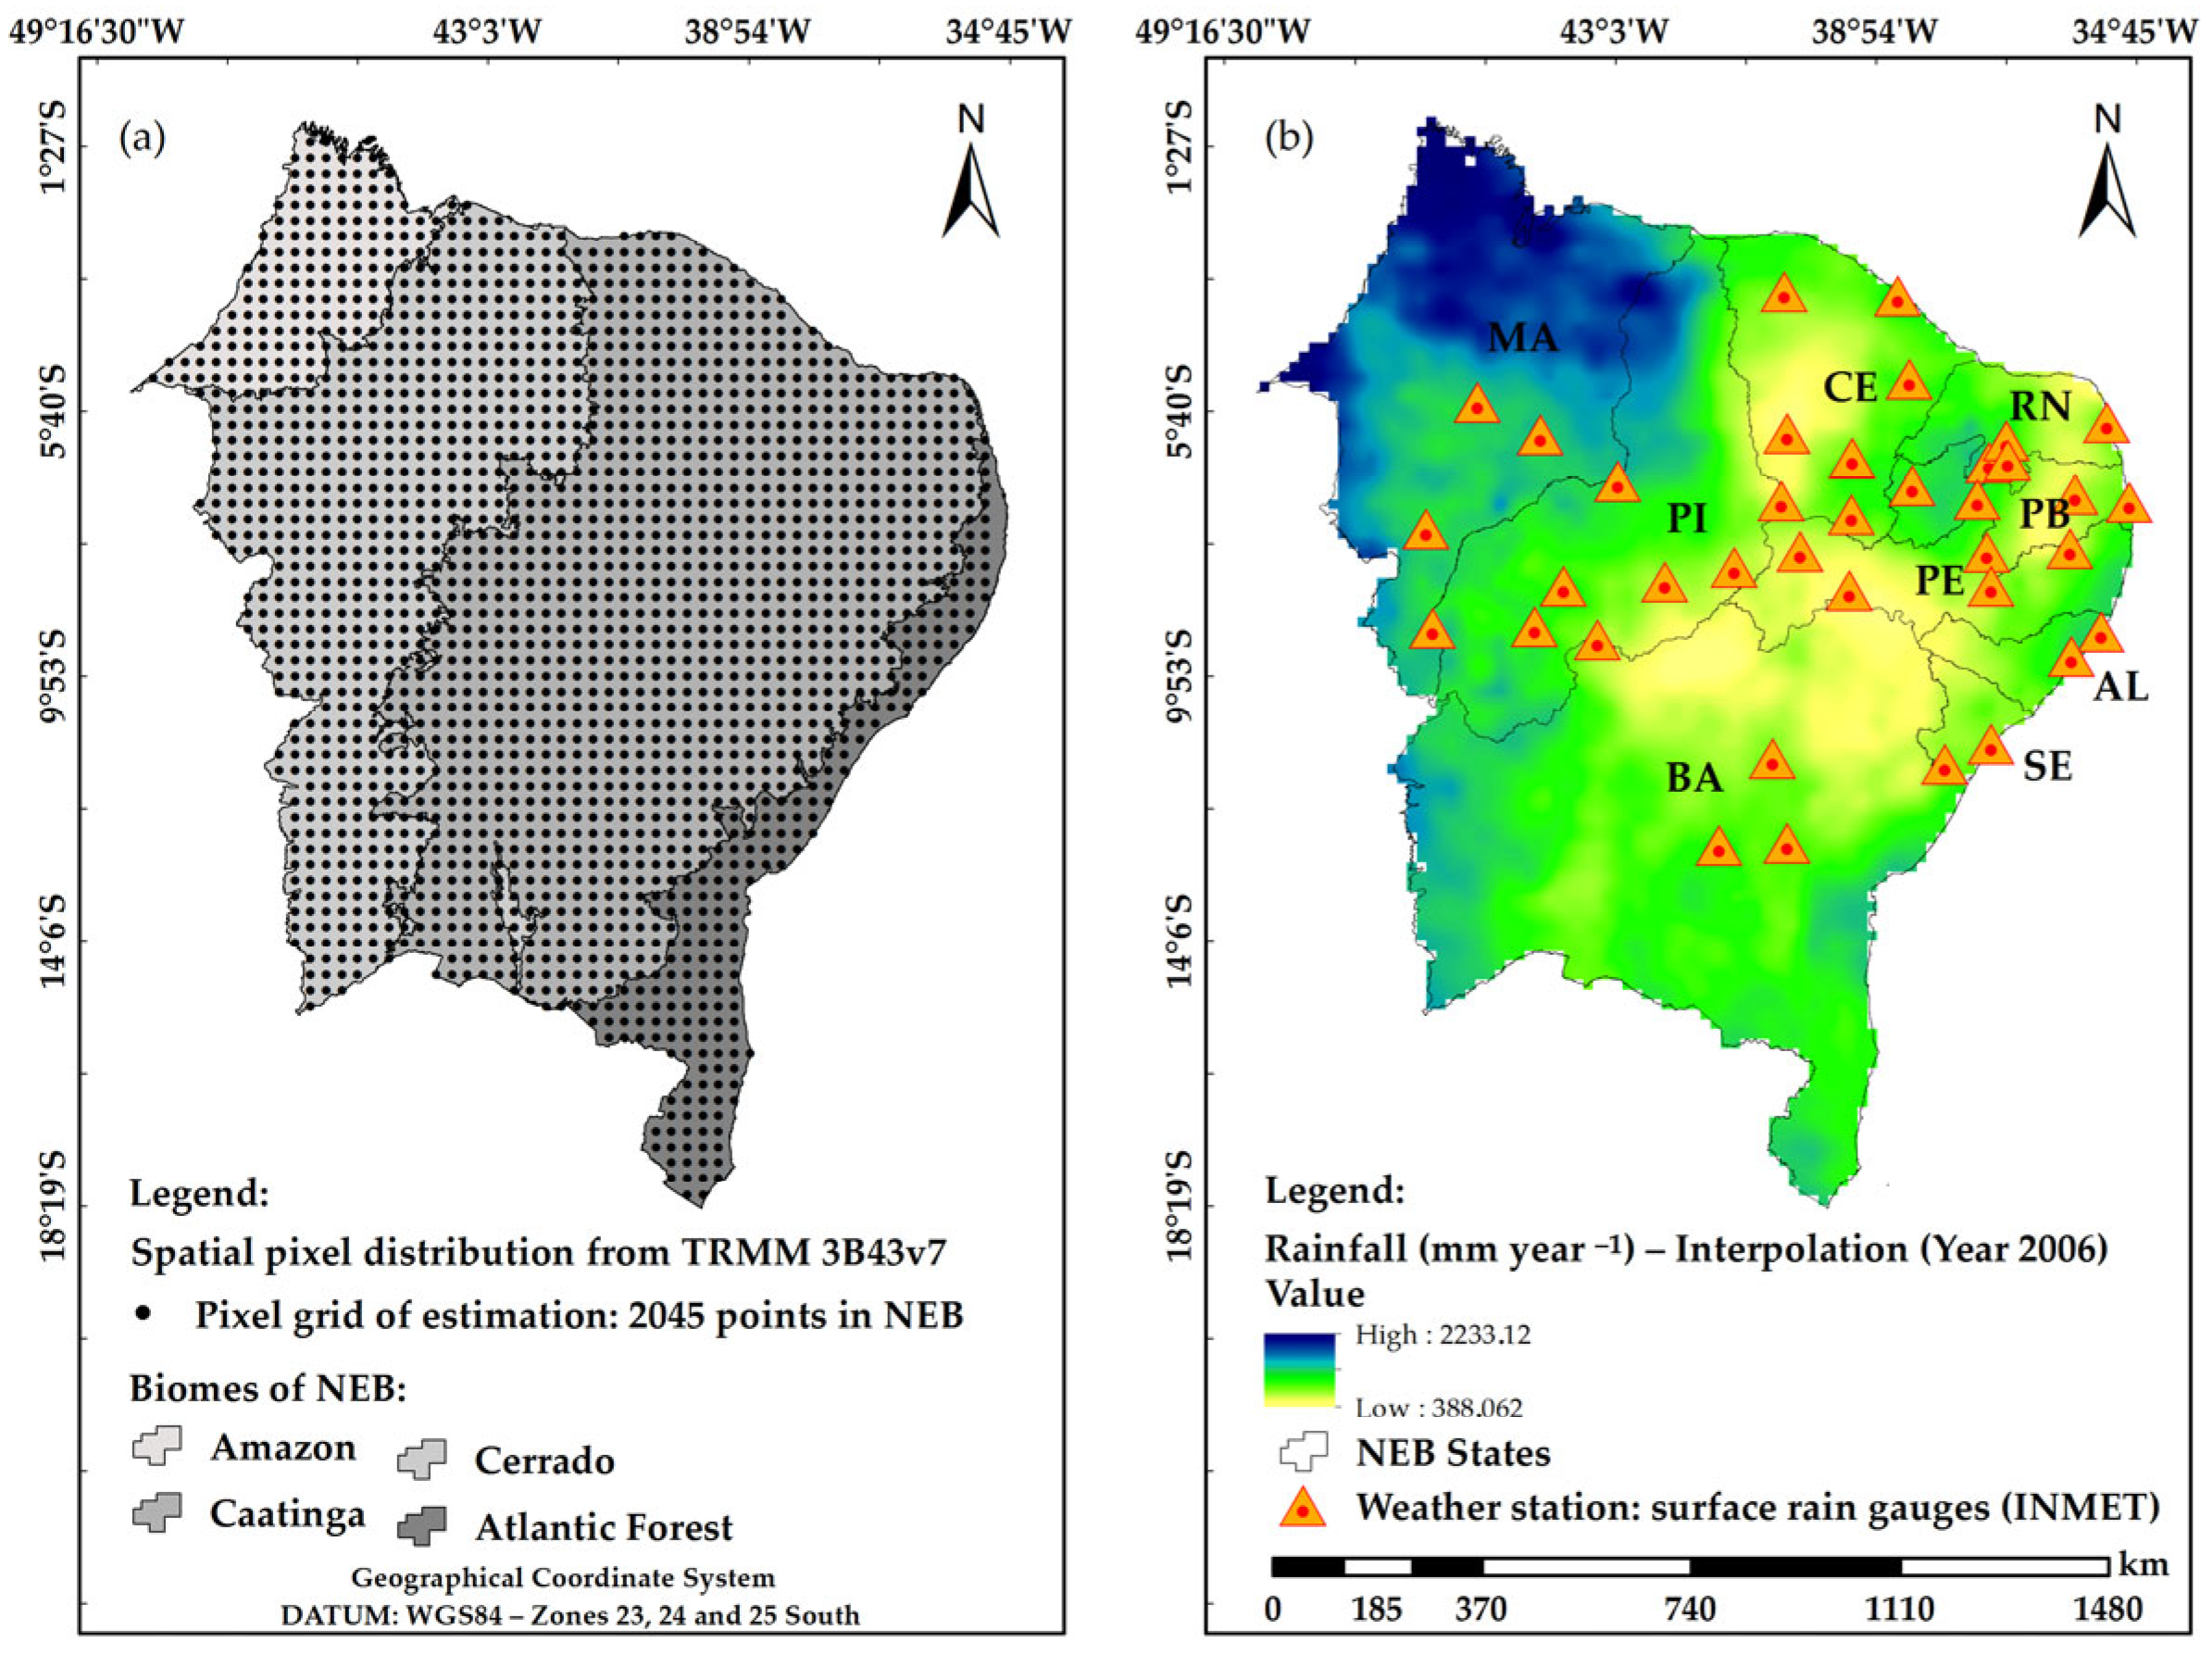
Figure 3 presents the spatial distribution of the biomes that comprise the NEB, as well as shows that each pixel represented on the map corresponds to a TRMM precipitation estimate. In the NEB, a total of 2045 estimation pixels were distributed, where the spatial and quantitative variation in the data was based on weighted average techniques.
The ordinary kriging applied was based on statistical models of autocorrelation between the sampled points, which made it possible to predict and interpolate the estimates between the points of the pixel grid (Figure 3a), including exploratory statistical analysis, accompanied by the mapping of the estimated surface with rainfall values for the study area (Figure 3b).
In order to validate the TRMM geospatial data, precipitation data were collected from a total of 37 rain gauges installed in conventional surface weather stations, distributed in different regions of the NEB (Figure 3b). The surface stations belong to the National Institute of Meteorology (INMET), with meteorological data available for download at the following link: https://bdmep.inmet.gov.br/—accessed on 10 August 2025 [104]. A 20-year climatological series of rainfall data was used, comprising the TRMM spatiotemporal analysis, where each of the weather stations validated the TRMM data year by year, from 2000 to 2019.
The spatial distribution of the stations in the NEB are located more specifically in the states of Ceará-CE (with a total of 7 rain gauges), Rio Grande do Norte-RN (4 rain gauges), Paraíba-PB (5 rain gauges), Pernambuco-PE (4 rain gauges), Alagoas-AL (2 rain gauges), Sergipe-SE (2 rain gauges), Bahia-BA (3 rain gauges), Piauí-PI (6 rain gauges) and Maranhão (4 rain gauges) (Figure 3b).
Therefore, for validation purposes, it is important to note that the TRMM pixel-by-pixel values were collected exactly at the reference grid point, that is, with the same coordinates and location as the INMET rain gauges, aiming to evaluate the predicted and observed variables through linear correlation and error metrics.

2.4. Data from Terra and Aqua Satellites (MODIS Sensor)

The MODIS reflectance product, onboard the Terra—MOD09A1 and Aqua—MYD09A1 satellites, version 6, was used, available at: https://modis.gsfc.nasa.gov/, accessed on 2 January 2021. This product provides an estimate of surface spectral reflectance through a set of multispectral bands [105]. It contains validated geospatial data, with high accuracy and precision, to quantify regional and global environmental changes conditions through remote sensing. The reflectance product is georeferenced and corrected for atmospheric effects associated with clouds and their shadows, as well as for aerosols [104,105,106,107].
The use of MODIS imagery is not intended to compare with Landsat data, given the different spectral resolutions. On the other hand, the MODIS surface reflectance product has a robust database that can confirm the spectral patterns of changes in LULC maps. Considering that the biophysical characteristics of surface albedo are associated with changes in land cover and use and are sensitive to climate and environmental change conditions [38,39].
Table 3 highlights the characteristics of each multispectral band of the MODIS surface reflectance product (version 6), with a spatial resolution of 500 m. The data consist of pixel-by-pixel values corresponding to an 8-day period and are classified as processing level “L3”, available at: https://modis.gsfc.nasa.gov/data/dataprod/mod09.php, accessed on 2 January 2021 [104,105,106].
As part of the spatiotemporal analysis (2000–2019), a total of 911 satellite images were analyzed, with each year containing between 40 and 46 available orbital images. Therefore, the corrected surface reflectance product presented was used to estimate the surface albedo biophysical parameter on an annual time scale, based on the mean pixel value of the MODIS multitemporal series.
Surface albedo is calculated using the multispectral bands of the surface spectral reflectance product. In this study, the weighting coefficients suggested by Tasumi et al. [39] were applied. These coefficients are determined based on surface solar radiation, specifically for use in operational energy balance applications. As a criterion, each weighting coefficient is obtained by the ratio between the specific solar constant of each multispectral band and the sum of all seven bands of the reflectance product (Table 3). These values are calibrated for different land use and land cover types, associated with each of the multispectral reflectance bands, showing good agreement and accuracy [108]. Albedo was estimated using Equation (8) [39].
α sup = 0.215   ×   r BLUE   + 0.215   ×   r GREEN   + 0.242   ×   r RED   + 0.129   ×   r NIR 1   + 0.101   ×   r NIR 2   + 0.062   ×   r SWIR 1 0.036   ×   r SWIR 2
where αsup—surface albedo; numerical values—weighting coefficients corresponding to each multispectral band of the surface reflectance product [39]; rBLUE, rGREEN, rRED, rNIR1, rNIR2, rSWIR1 and rSWIR2—correspond to the multispectral bands of the reflectance product (Table 3).
It is important to emphasize that this product, in addition to the seven reflectance bands with 500 m spectral resolution, also includes a quality variable and four observation bands. This allows a reference value to be selected for each pixel—the best observation from all acquisitions over an 8-day period (which corresponds to the temporal resolution of the product used), free of noise and free of clouds and their shadows, as described by Vermote et al. [106]. On the other hand, the MODIS reflectance product can also incorrectly flag high-aerosol retrievals on surfaces with intense brightness and high viewing angles, generally affecting some MODIS products such as the vegetation index (MOD13 and MYD13).
MODIS images were automatically processed using the GEE software [109], accessed on 2 January 2021. Spatiotemporal modeling was performed by developing a digital processing script using cloud computing language, involving the following collection of MODIS sensor images: ee.ImageCollection(‘MODIS/006/MOD09A1’). Aiming to broaden the scope of this type of research with the processing of geospatial data for other regions, this study makes the code/script for this automatic processing available for public access: (https://code.earthengine.google.com/7fa51af0d9790492201acf7888efd1ff?noload=true, accessed on 2 January 2021). The programming carried out involves masking clouds based on the specific script for cloud and shadow corrections from QA band, available in the GEE library (https://code.earthengine.google.com/d4f08554f3360d134b65804f3eaa3b2e?noload=true, accessed on 2 January 2021). Likewise, to calculate the albedo, a correction and calibration factor was applied to each MODIS band, a multiplicative factor of 0.0001 (Table 3).

2.5. Multivariate Principal Component Analysis (PCA)

Principal Component Analysis (PCA) and correlation matrix was applied based on the following predictor variables: LULC data (forest; non-forest natural; farming; non-vegetated area; water) and precipitation (TRMM). Thus, the covariance matrix was obtained based on the principal components (PCs) to extract eigenvalues, which generate eigenvectors [18]. Eigenvalues were calculated to determine the contribution of each variable to the total variance of the PCs. The Kaiser criterion was applied to identify correlated variables based on eigenvalues greater than 1, in order to generate components with a relevant amount of information contained in the original data [110].

2.6. Statistical Analysis

The quantitative and spatiotemporal results of surface albedo were evaluated pixel by pixel using descriptive statistics, measures of central tendency and dispersion, including minimum, mean, maximum, standard deviation (SD) and coefficient of variation (CV, %). The spatial pattern of the thematic albedo maps was assessed in terms of its variability, based on CV (%) values, according to the classification criteria of Warrick and Nielsen [111]: low variability (CV < 12%), moderate variability (CV 12–60%) and high variability (CV > 60%).
The multivariate principal component analysis (PCA) and correlation matrix, descriptive statistics and trend analysis using the Mann–Kendall and Sen’s slope tests were performed using R software, version 4.4.0. For trend analysis, the “modifiedmk” package was used, which is essential for defining parameters and significance levels at 1% (p < 0.01) and 5% (p < 0.05) [112]. The descriptive statistical values for LULC and albedo data were extracted using GEE software.
The choice of descriptive statistics was essential to characterize the spatiotemporal variability of the data due to the heterogeneity of albedo and land use patterns in the NEB. The use of the non-parametric Mann–Kendall and Sen’s slope tests was justified by the absence of normality and homoscedasticity assumptions, which are common characteristics in environmental time series with a skewness coefficient frequently exceeding 1.5 [113]. Before the trend test application, serial autocorrelation was verified using the Durbin-Watson test, considering values close to 2 as indicative of residual independence [114]. The principal component analysis (PCA) was conducted based on the Kaiser criterion, ensuring that the retained components explained at least 70% of the total variance [115]. Additionally, statistical results were assessed using GEE and R, ensuring the coherence of the inferences made.

3. Results and Discussion

3.1. Spatiotemporal Dynamics of LULC, Global Accuracy and Surface Albedo

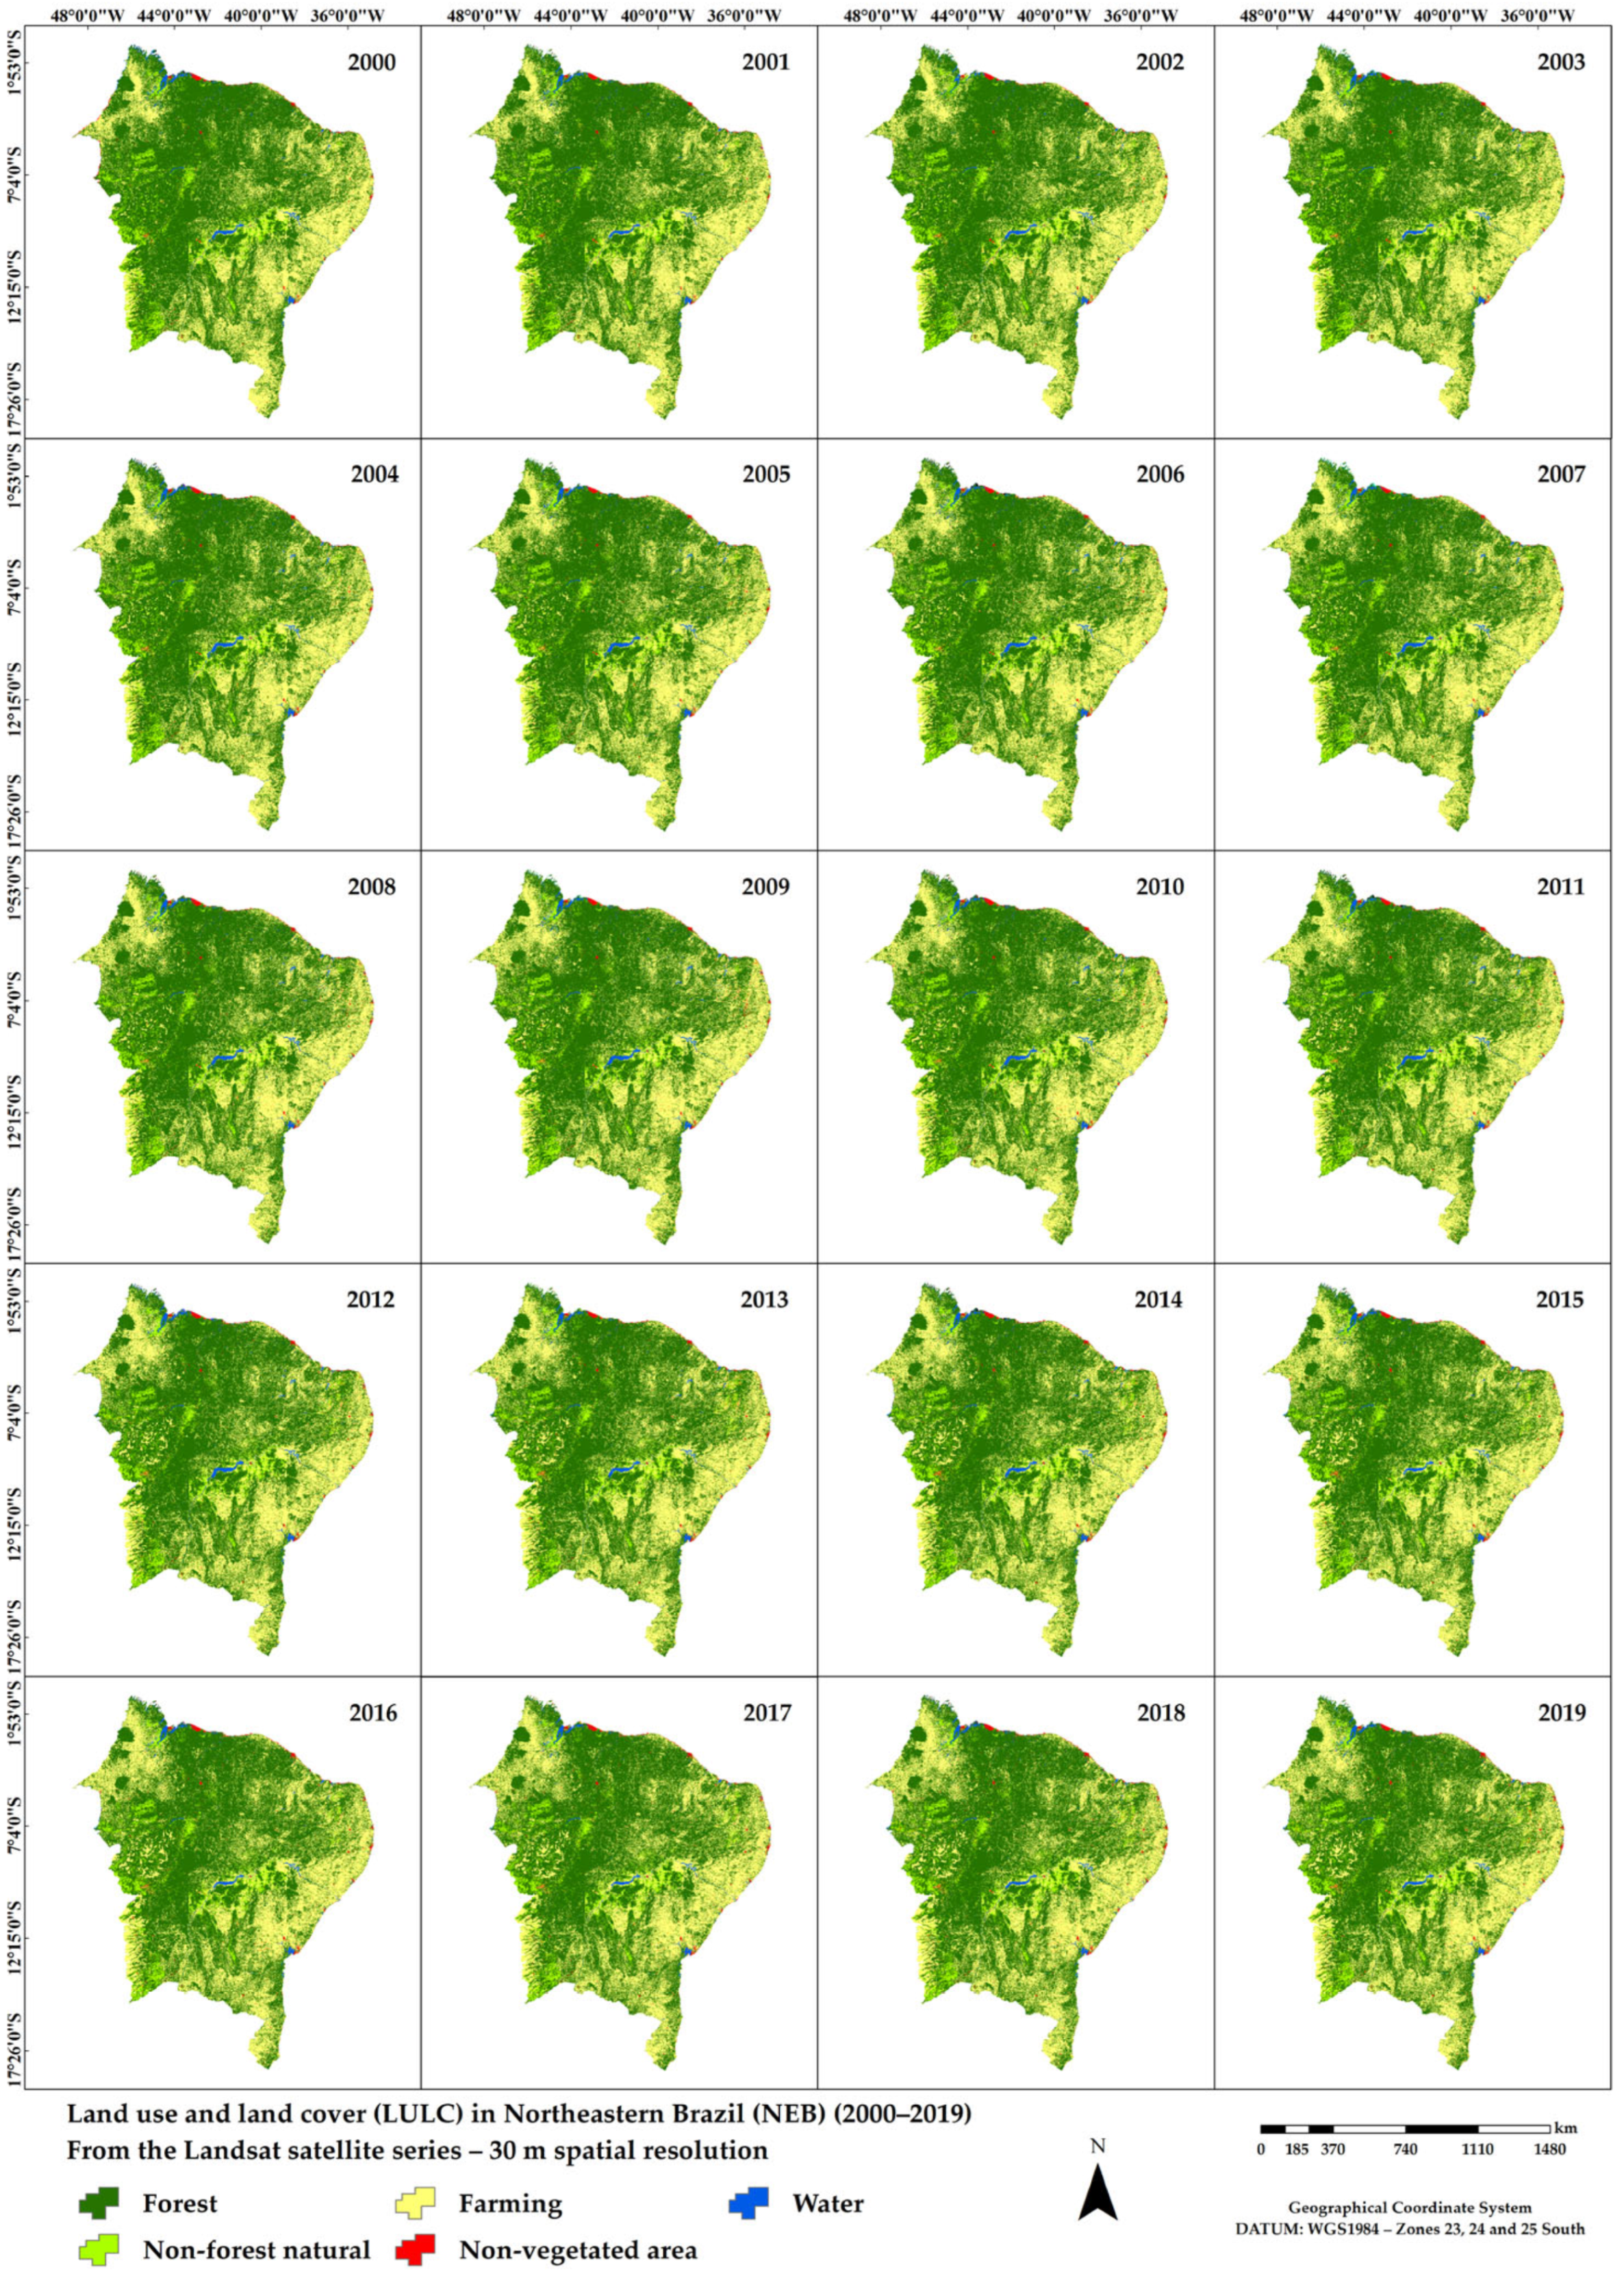
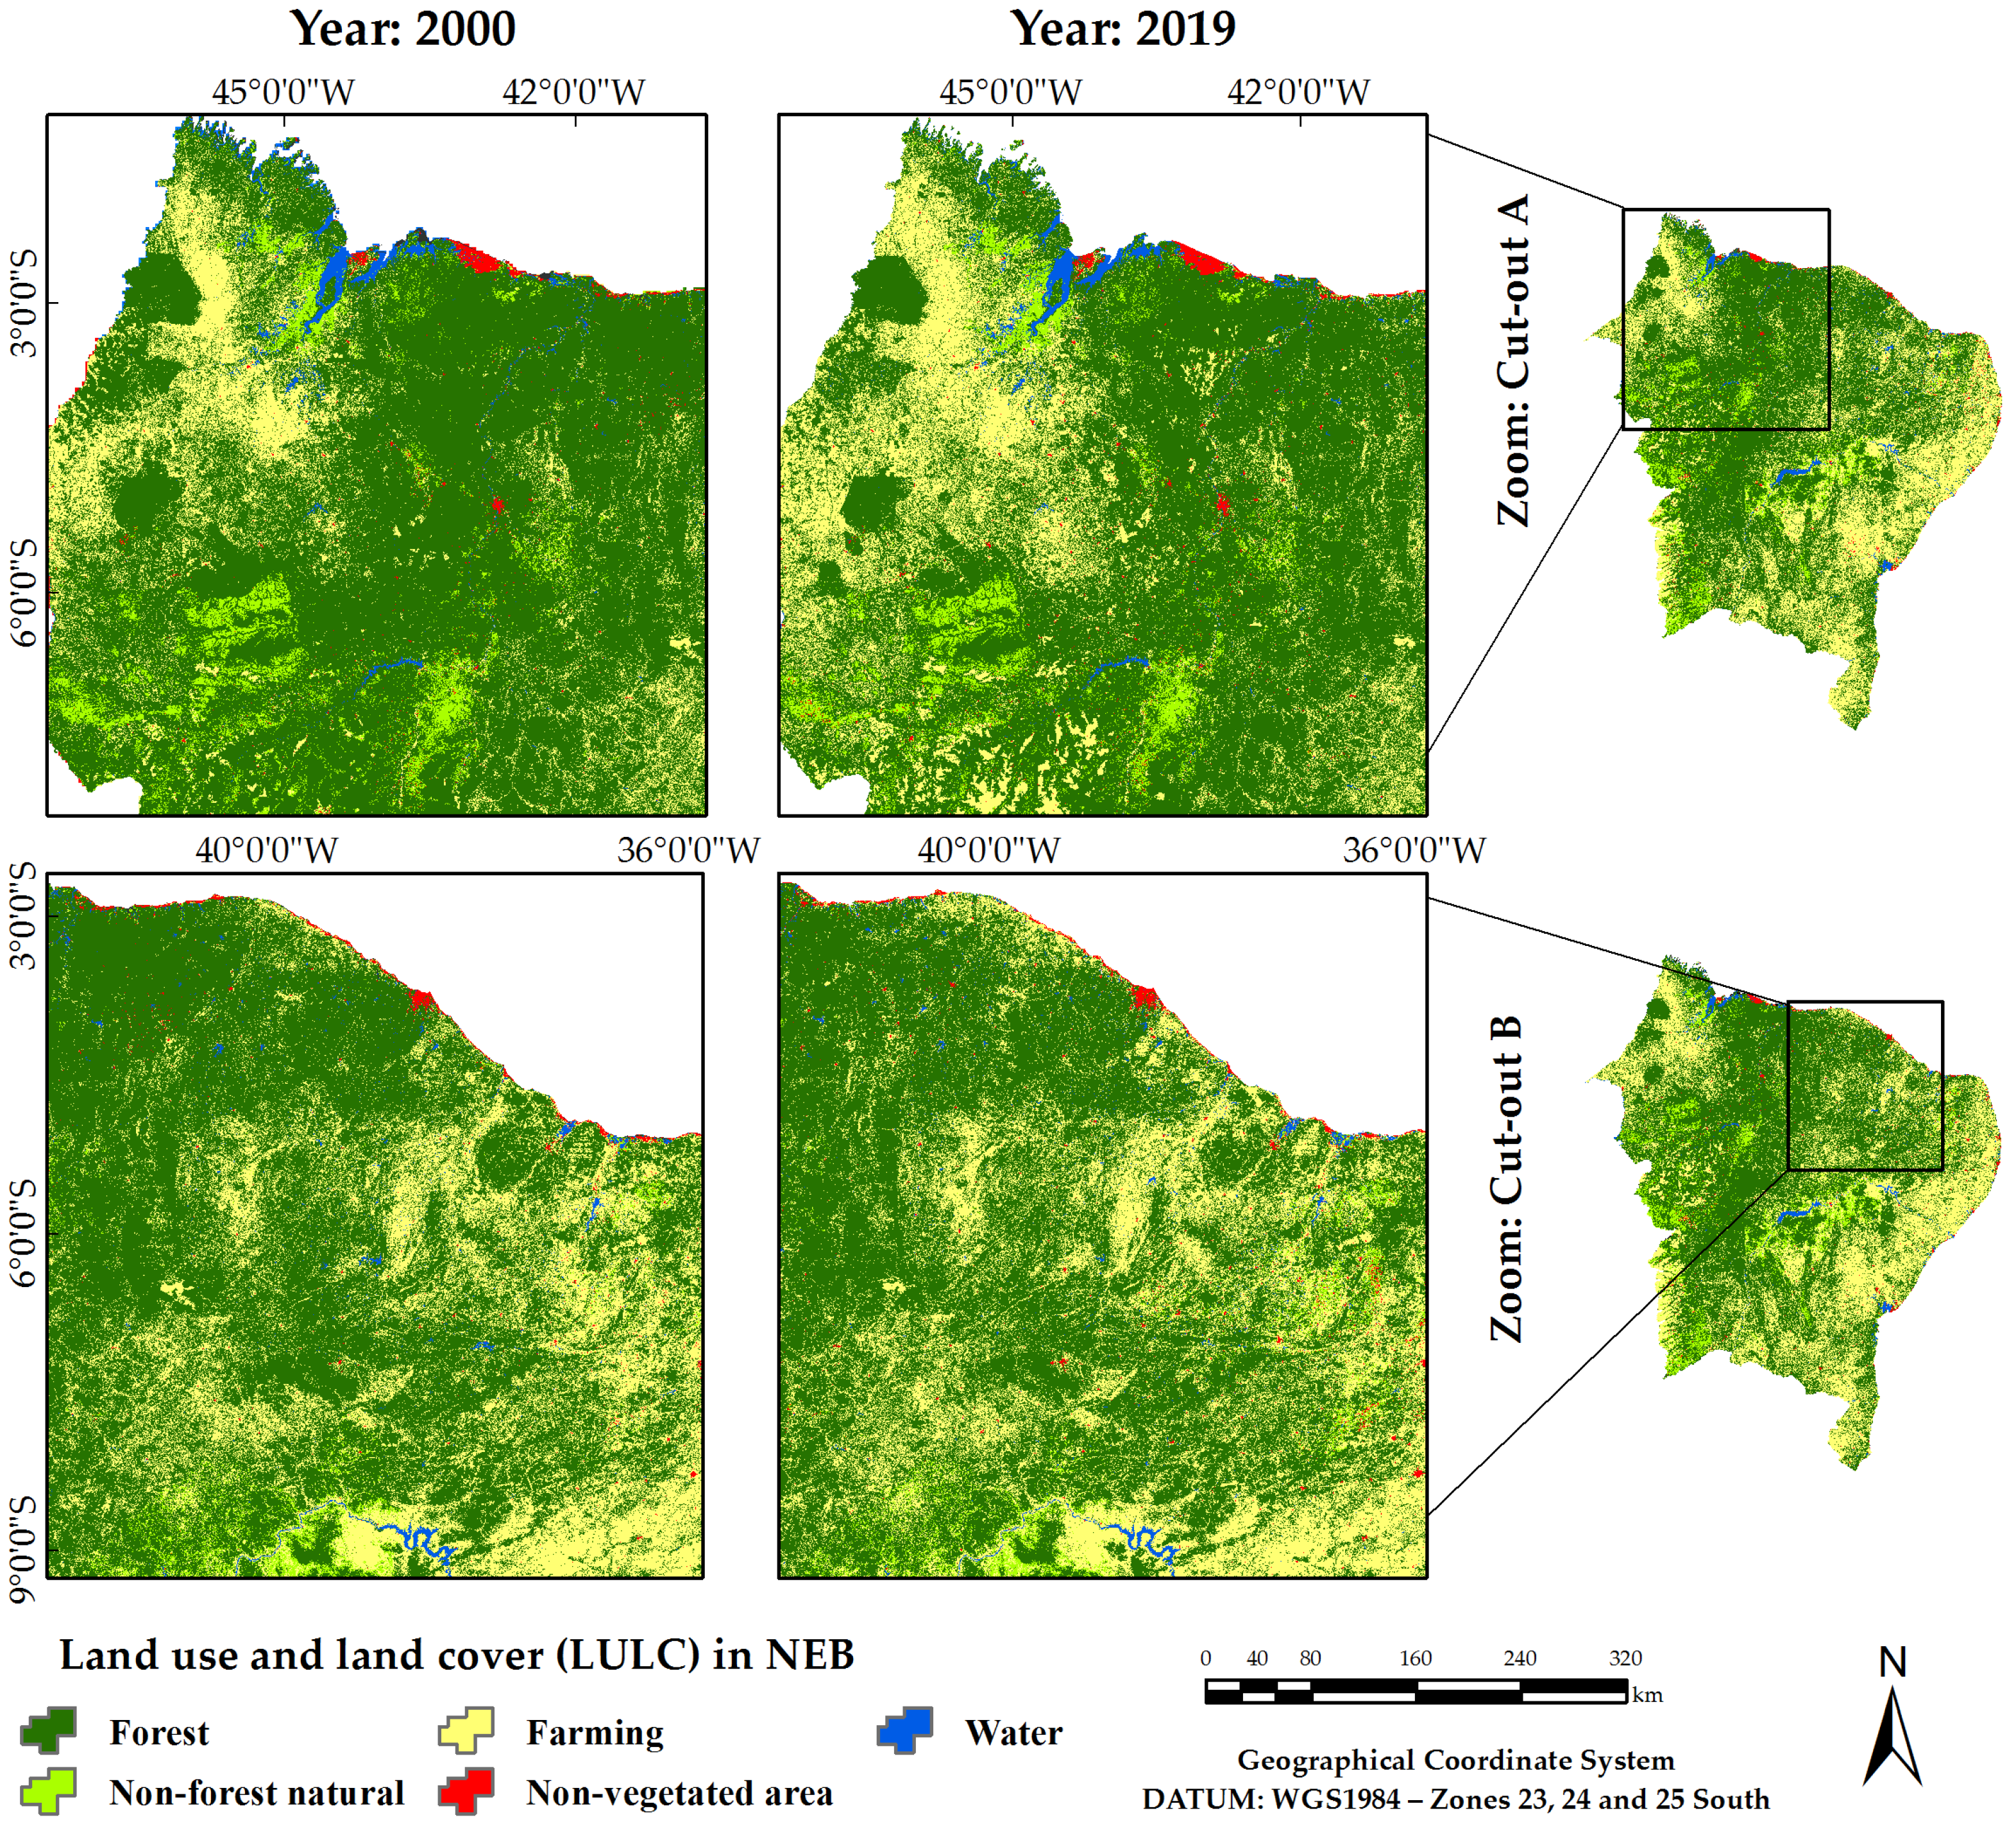
Figure 4 presents the spatiotemporal dynamics of land use and land cover (LULC) in Northeastern Brazil (NEB). The maps display the thematic classifications of the following land use types: forest, non-forest natural, farming, non-vegetated area and water for the period from 2000 to 2019. The spatiotemporal monitoring was conducted using multitemporal Landsat satellite data, with a spatial resolution of 30 m.
Table 4 and Table 5 show the effective statistical validation of the global accuracy for the LULC classification in each of the NEB biomes, as well as highlighting the global inclusion and omission errors for each mapped class, respectively. Thus, highlighting a validation with high global accuracy, ranging from 81.8% to 97.6%. Annual statistics for the 2000 to 2019 data series detected an annual overall accuracy ranging from 91% to 92%, as well as an area disagreement of 1% to 2% and an allocation disagreement of 5% to 7%.
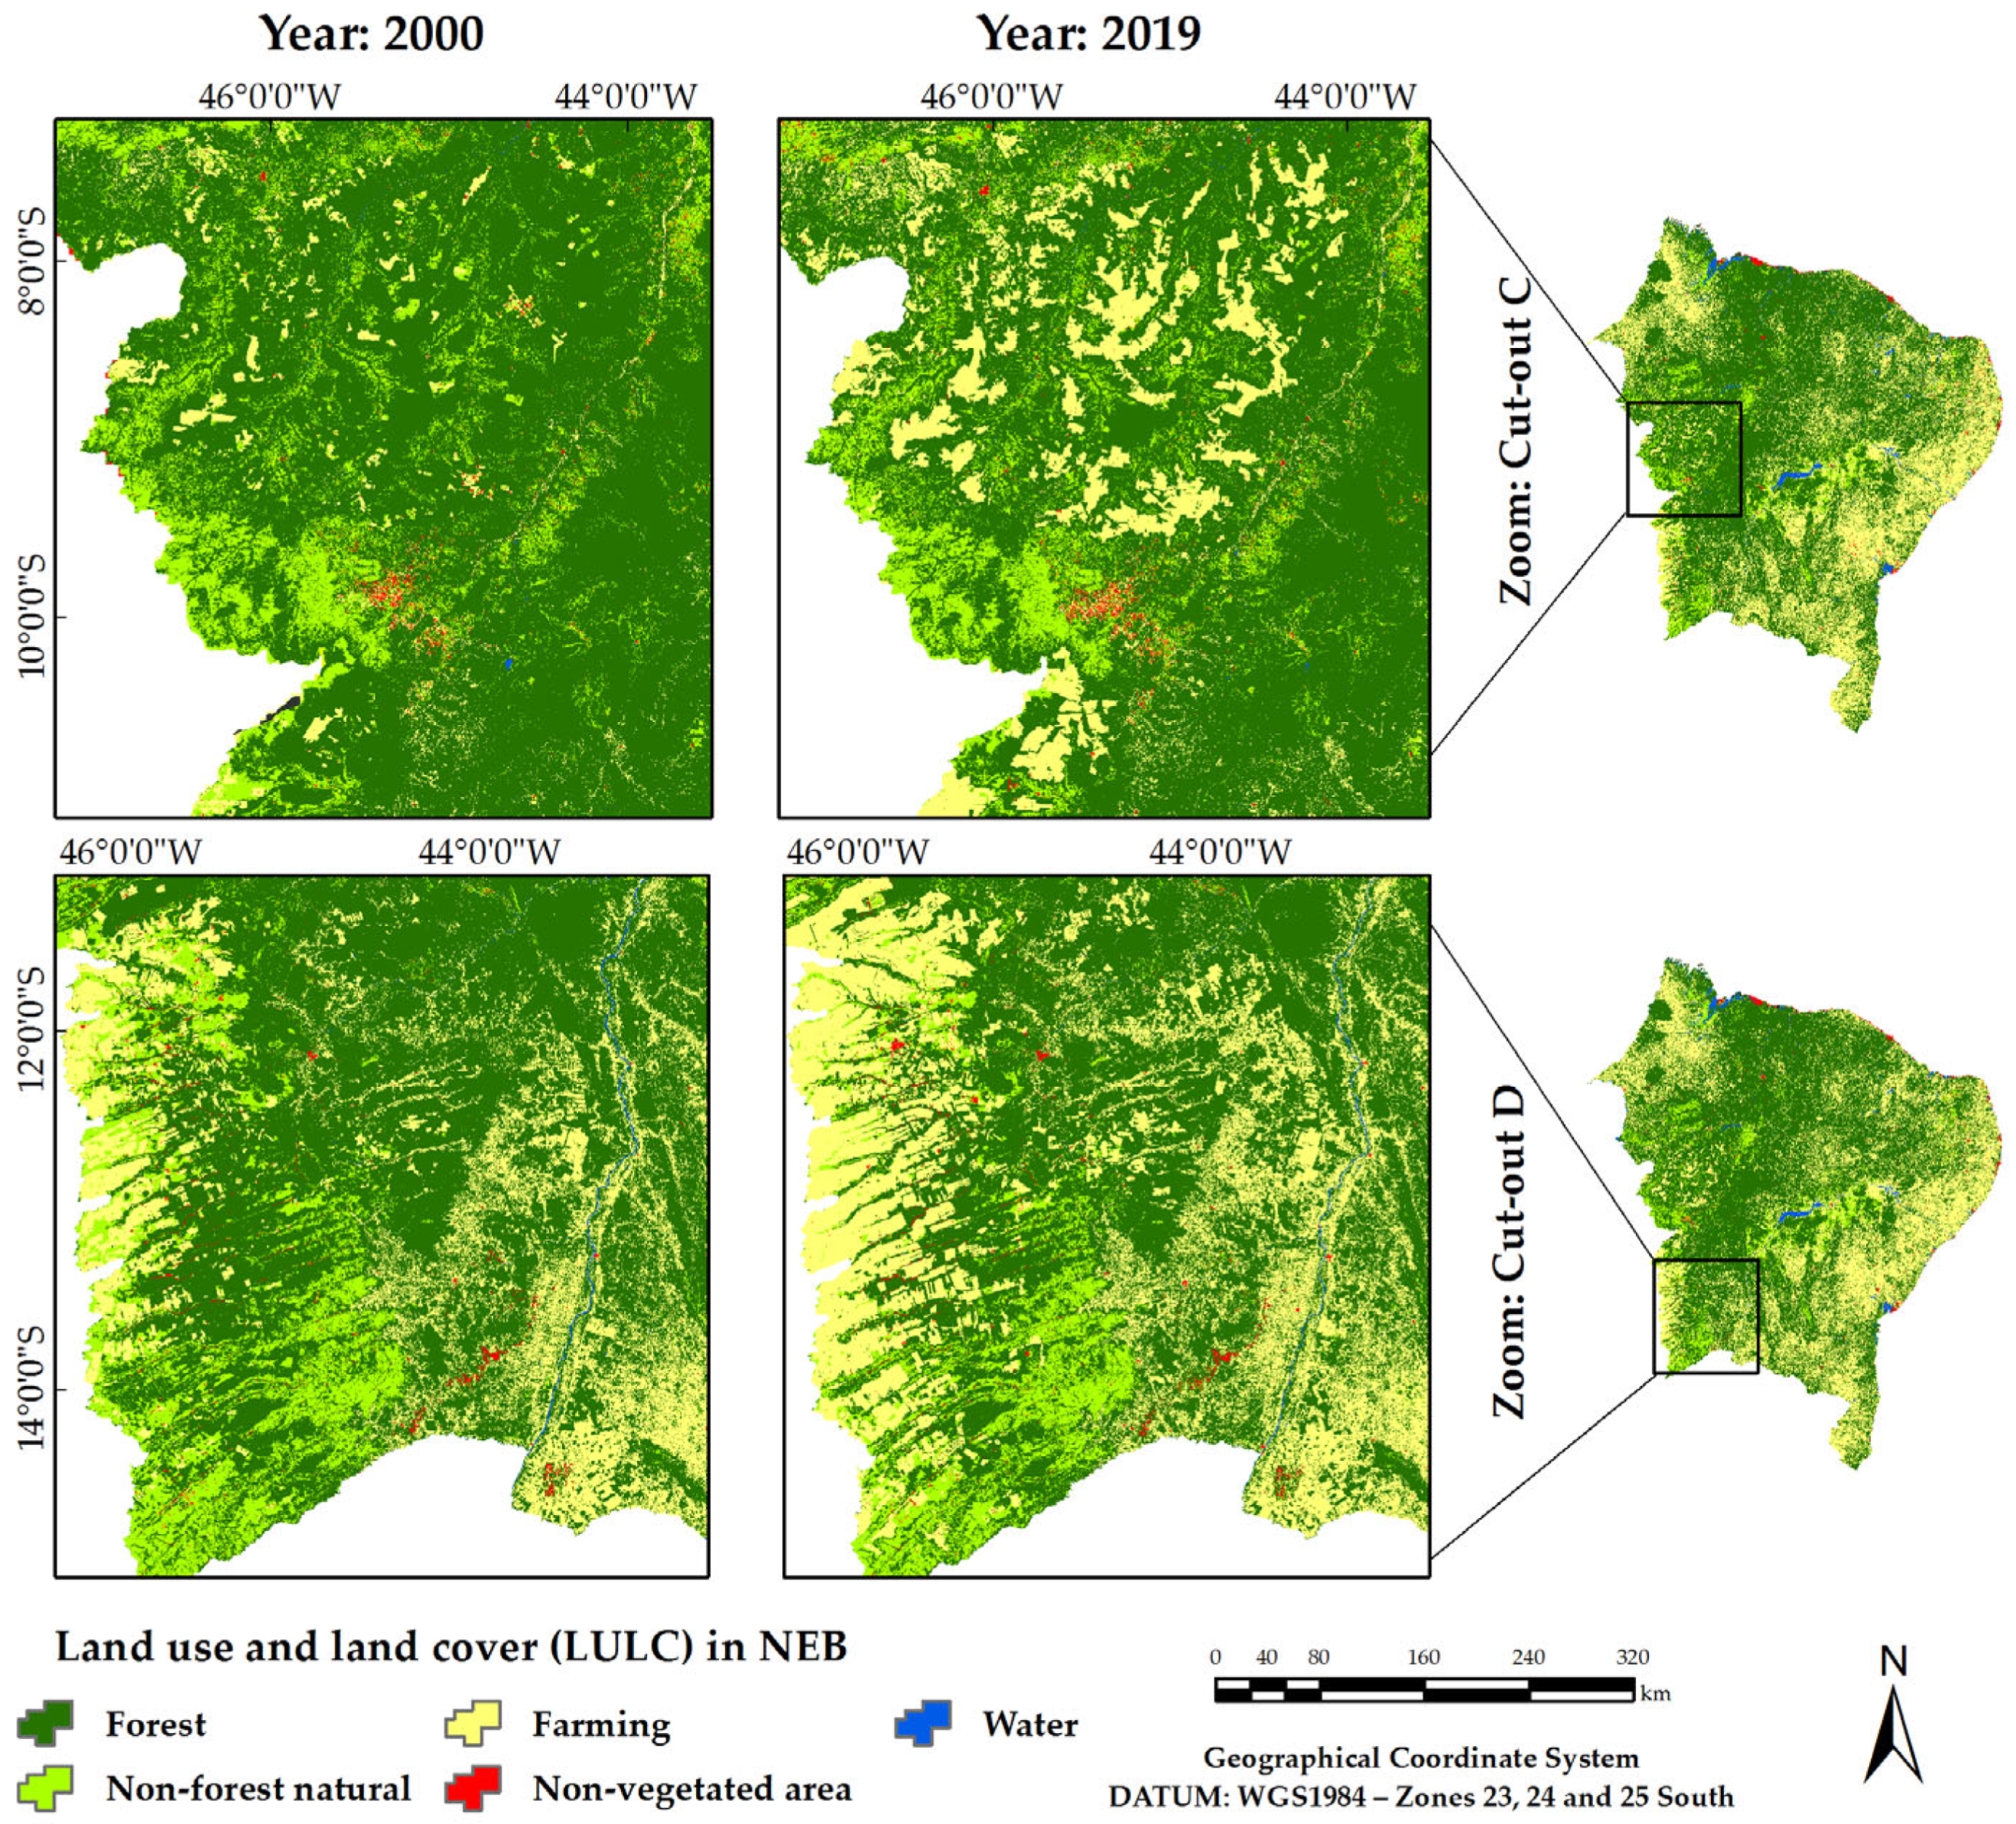
In the forest class (dark green pixels), areas with natural forest cover (e.g., forest formation, savanna and mangrove) and planted forest are included. In the non-forest natural class (light green pixels), the following land types are highlighted: flooded fields, swamp areas, grassland formations, apicum (herbaceous vegetation), rocky outcrops and other non-forest formations. In the farming class (yellow pixels), the land is divided into pasture and agriculture, with temporary and perennial crops specifically observed. In the non-vegetated area class (red pixels), the following land types stand out: beach and dune areas (coastal regions), mining areas and mainly urban infrastructure, in addition to other non-vegetated areas observed in the region. In the water class (blue pixels), the land includes areas covered by rivers, streams, lakes, lagoons and the ocean, as well as aquaculture areas (e.g., artificial lakes dominated by aquaculture and/or salt production activities) (Figure 4).
To ensure quality in the categorization of LULC classes, this study followed approaches widely used in thematic mapping of remote sensing time series [69,116,117]. The segmentation into forest, non-forest natural, farming, non-vegetated area and water enhances the identification of degradation patterns and agricultural expansion [76]. The differentiation between forest and non-forest vegetation is crucial for assessing ecosystem impacts [118], just as the detailed categorization of water bodies is essential for climate monitoring [119]. Thus, the segmentation adopted in Figure 4 enhances the analysis of environmental transformations in a standardized manner, making it comparable to international methodologies.
Throughout the spatiotemporal analysis, the maps reveal a decline in the vigor of natural vegetation in NEB, a condition spectrally detected by Landsat sensors (Figure 4 an Table 6), which was when the thematic maps went from a condition of pixels with dark green tones to conditions of changes with pixels under light green and burnt yellow tones, that is, it is noted that the NEB region is losing the resilience capacity of the natural vegetation of the biomes, impacted by anthropic and climate pressures. Research has detected these conditions in addition to the degradation of water bodies in the NEB, based on the determination of physical-hydric parameters at the surface [6,14]. The scientific literature demonstrates significant environmental pressures acting differently on Amazonia (western sector), Cerrado (southern–southwestern strip), Atlantic Forest (coastal strip), and Caatinga (core), which explicitly justifies a multi-biome discussion to support diagnosis and regional-scale public policy [22,70,120].
In the western sector of NEB, Amazon Biome, especially in Maranhão and more specifically the eastern Amazonian border and the Amazon–Cerrado transition (MATOPIBA) has been exhibit warming, lengthening of the dry season, and greater vapor deficit, with a consistent signal of recent intensification [121]. A high-impact synthesis indicates that between 10 and 47% of the Amazon forest may be exposed to multiple stressors by 2050, with potential for local/regional transitions [31]. These findings reinforce the need to treat the Amazonian component of NEB as part of a bio-climatic continuum under increasing pressure [31,121].
This study produces results of global importance, since the Amazon regulates moisture transport and large-scale precipitation in South America, and the combination of deforestation and warming alters vapor fluxes, mesoscale circulation, and rainfall regimes, with impacts on water and energy security beyond the basin [122]. In addition, deforestation induces regional and continental warming, with possible global implications [123]. The results of this research, by confirming influence on conservation and restoration policies in the Amazon, can be replicated in analogous tropical forests (e.g., Congo and Southeast Asia), tending to stabilize the regional climate of these regions while also reducing the loss of strategic ecosystem services [122,123], contributing to global climate sustainability.
It was detected also that the Northwestern areas of NEB, particularly in the state of Maranhão, show significant forest removal and/or replacement, indicating severe deforestation conditions (Figure 4). It is worth noting that the vegetation in NEB is heavily influenced by rainfall variability, due to the predominance of the Caatinga biome, which exhibits rapid resilience in response to rainfall events [20,124]. However, in the Northwestern NEB regions, rainfall accumulation is considerably high due to its proximity to the Northern region of Brazil, which is climatically influenced by the Amazonian atmospheric mass [23]. This confirms that the spatiotemporal changes observed in the Northwest region of the NEB are not related solely to climate variability conditions.
Data from the National Institute for Space Research (INPE), through the satellite monitoring project on the TerraBrasilis platform (http://terrabrasilis.dpi.inpe.br/app/map/deforestation?hl=pt-br, accessed on 9 January 2024), also confirm that from 2000 to 2019, accumulated deforestation of approximately 12,441 km2 of primary vegetation occurred in the state of Maranhão [125]. INPE has issued even stronger warnings about the deforestation conditions in the Northwestern of NEB, where the present study evidences changes in land use and land cover.
In the NEB Cerrado (southern–southwestern strip), human occupation regulates the sensitivity of burned area to climate. In landscapes with more than 40% anthropic use, climate explains less of the response to fire regimes, while in more intact landscapes, hotter and drier conditions increase burning [120]. This interaction shifts burning patterns and vegetation structure, which requires addressing the Cerrado together with the Caatinga and adjacent humid ecotones [120].
In this context, analogous savanna mosaics, such as those in southern Africa and northern Australia, show that human occupation and warming are reshaping fire regimes with consequences for biodiversity, carbon footprint, and public health, indicating a projected increase in the frequency/severity of wildfires in almost all biomes under high-emission scenarios [126]. Thus, disseminating the results from NEB helps global savanna managers adjust fire management and climate targets, aligning conservation and mitigation [126], converging toward global strategies for environmental sustainability.
Despite being the most extensive in NEB, the Caatinga has historically received less continuous monitoring compared to the Amazon and Atlantic Forest. A 35-year annual series (1985–2019), processed in Google Earth Engine, showed an 11% reduction in natural vegetation (≈6.57 Mha), with strong agricultural expansion [22]. Recent methodological advances identify fire drivers in the biome and project future susceptibility using machine learning, integrating climate and land use [127,128]. These results support treating the Caatinga within the NEB multi-biome context to infer regional biogeochemical effects [22,127,128], justifying the relevance of this research in addressing other regional biomes as well, even if they occupy smaller territorial extents, in order to highlight their importance in the global context.
The high spatial and temporal variability of this ecosystem is a major challenge, specifically due to seasonal changes (variability between the rainy and dry seasons) and climate fluctuations (interannual variability in precipitation that affects vegetation cover) [18,22]. Therefore, LULC classification can present ambiguous information, compromising data accuracy. The lack of accurate data references is quite common in the NEB region, especially within the Caatinga territorial boundaries. Consequently, the absence of representative samples can result in inaccurate training of the biome’s classification algorithms. However, MapBiomas multiscale processing has advanced an innovative technological methodology for the specificities of each biome, focusing on validating change patterns pixel by pixel. For example, the sample evaluation on the web by the TVI platform, developed by LAPIG/UFG, which presents a maximum error of only 0.5% for the whole of Brazil, considering a sample set of approximately 85,000 random stratified samples [53].
It is worth highlighting that the decline and fragmentation of mature forests, such as the Atlantic Forest biome, coastal strip of NEB, generate disproportionate losses of biodiversity and ecosystem services, and although there are net gains in young cover in some areas, the replacement of old-growth forests with physiognomies of lower functional integrity compromises connectivity and microclimatic regulation [70].
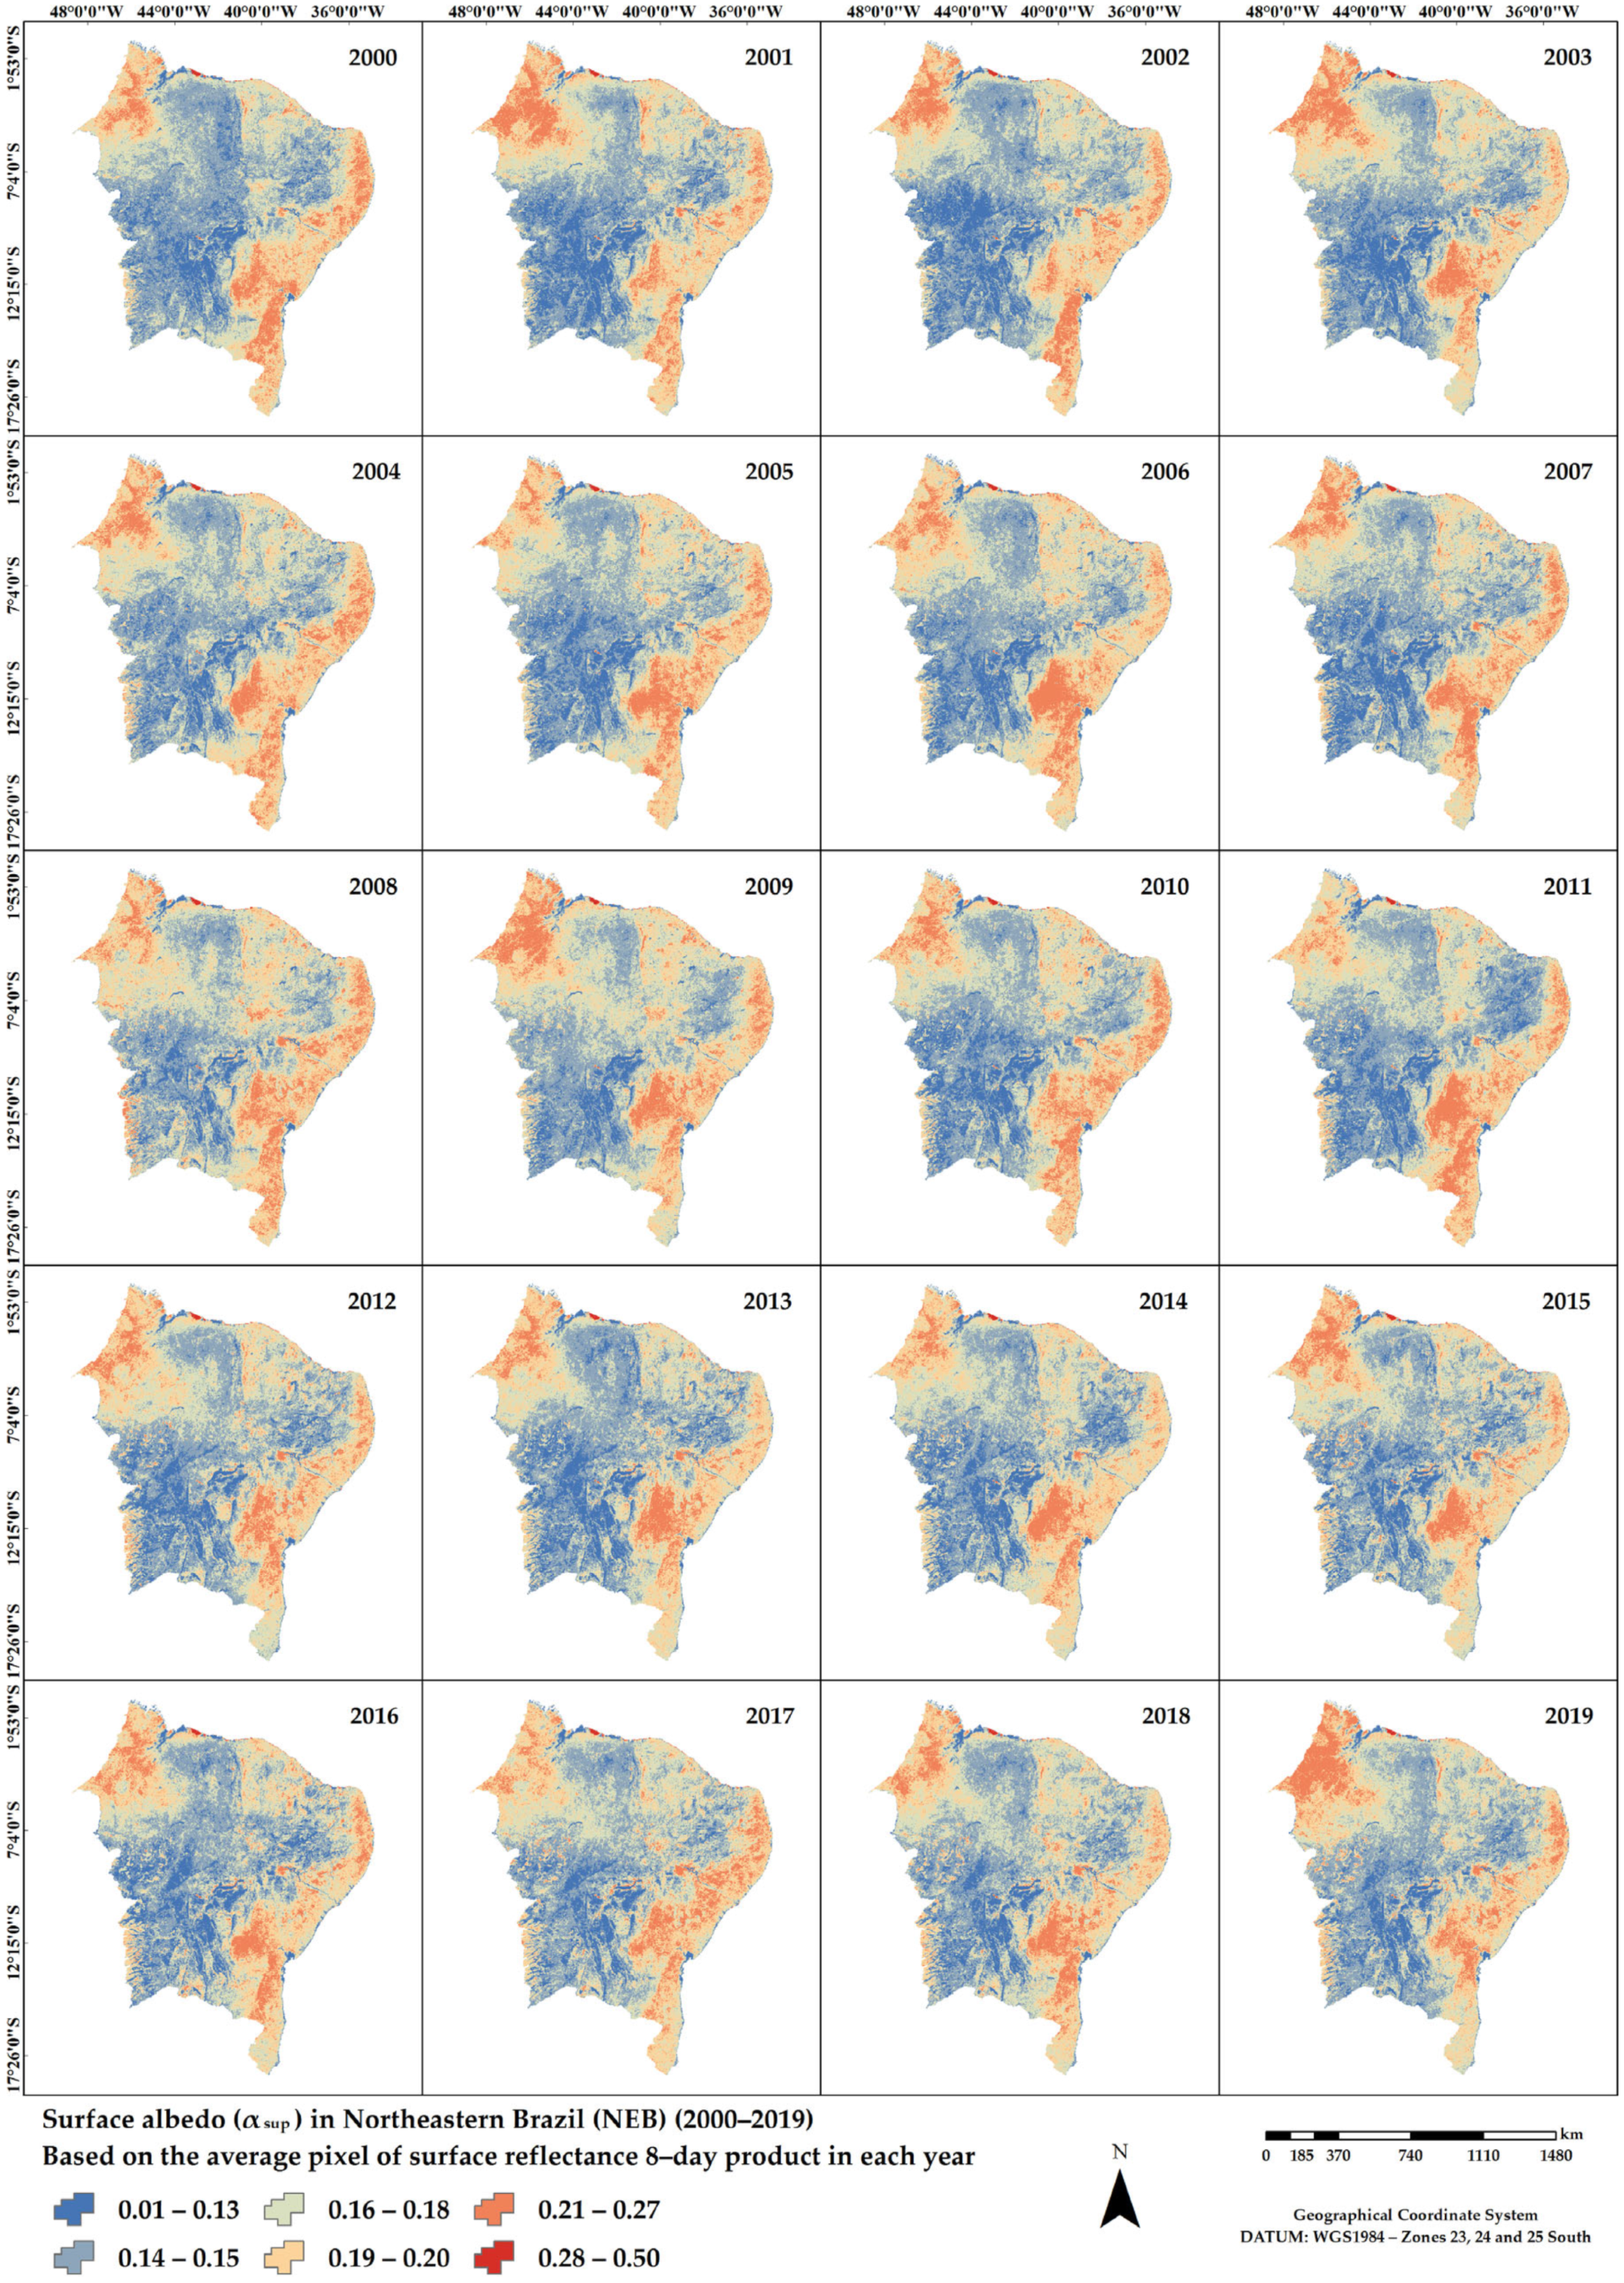
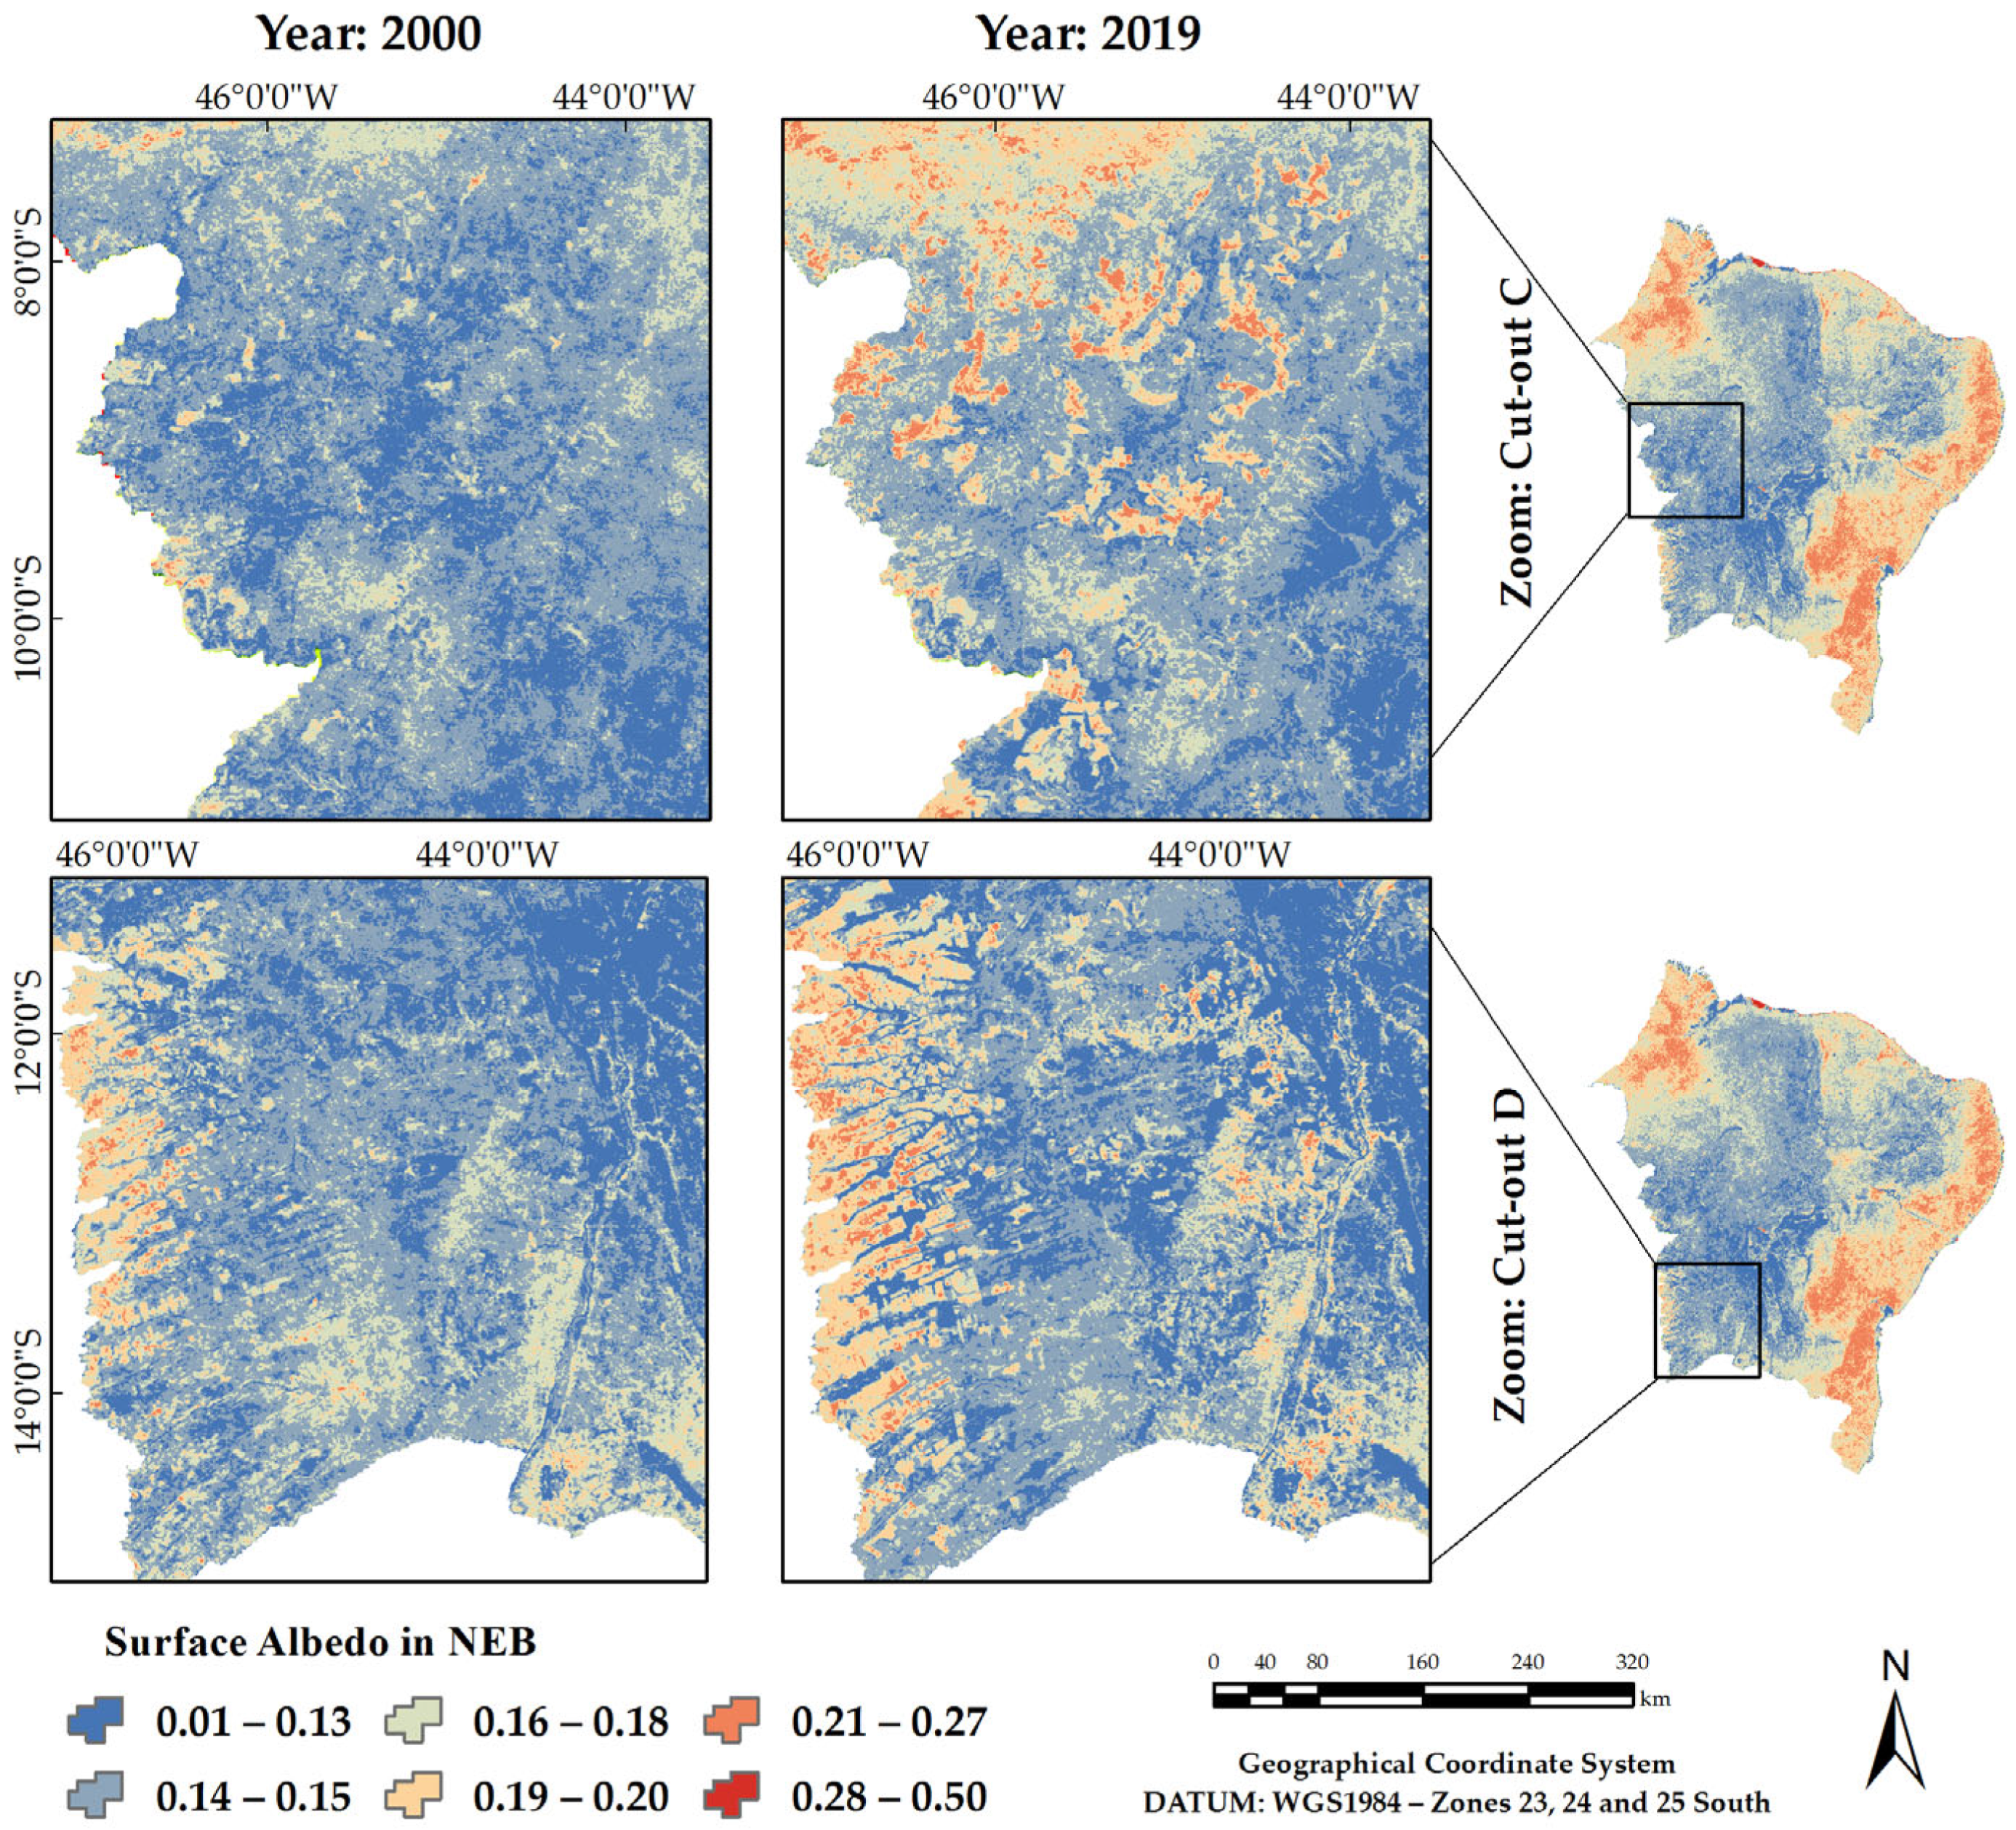
Figure 5 presents the spatiotemporal distribution of surface albedo in NEB from 2000 to 2019. The biophysical parameter highlights a value range from 0.01 to 0.50. The range with the lowest albedo values (0.01–0.13) corresponds to pixels over water bodies and forest areas. Values closer to zero represent areas covered by water bodies such as rivers, lakes and reservoirs. The intermediate range (0.14–0.20) corresponds to pixels over agricultural areas and the typical vegetation cover of the Caatinga biome (the predominant biome in NEB). The highest values (0.28–0.50) correspond to pixels over infrastructure areas (in smaller proportions), areas with low vegetation cover and especially exposed soil areas (Figure 5).
The thematic albedo map presents a high level of detail regarding land use, highlighting an important spectral condition (due to the good radiometric resolution of the MODIS which is 16-bit) and the loss of vegetation resilience over time (Figure 5). This fact directly corroborates the condition of the LULC data map (Figure 4).
The persistence of pixels with high albedo values over time may indicate degraded areas and those under strong impacts from regional drought, which may negatively impact energy balance processes [40,129]. In some NEB regions, these areas are a growing concern, showing low and/or absent energy availability for processes such as evapotranspiration and energy fluxes, as also identified in several studies [14,29,124,130]. The research conducted by Mariano et al. [29] and Silva et al. [14], also in Northeastern Brazil, found that land degradation processes significantly reduced evapotranspiration.
For these regions, Oliveira et al. [19] emphasize that climatic conditions (drought) and anthropogenic pressures jointly impact both the regional climate and the relationship between energy and water availability. Considering the high variability of the NEB climate, especially in the years 2012 to 2019 of the spatiotemporal analysis (Figure 4), Wang et al. [38] stated that changes in climatic conditions can cause changes in the biophysical characteristics of the albedo.
Figure 4 and Figure 5 present the change patterns based on LULC and albedo data for specific areas located in the Northwestern (Cut-out A) and Northern (Cut-out B) regions of the NEB, comparing the initial year (2000) with the final year (2019) of the spatiotemporal analysis. In these specific regions, the forest class has been severely impacted over time, indicating the replacement of natural vegetation cover by farming areas (Figure 6). Albedo supports this change indication, where the spectral behavior pattern in these areas highlights pixels with high and pronounced values in 2019 (Figure 7). Therefore, the association of LULC and albedo data indicates that these areas exhibit large-scale deforestation characteristics when evaluated over two decades, comparing 2000 and 2019.
Figure 4 and Figure 5 show that between 2000 and 2019, the Northwestern and Northern regions of Northeastern Brazil underwent significant conversion of forested areas into agricultural lands, resulting in an increase in surface albedo. This phenomenon is supported by studies associating deforestation with an increase in albedo, due to the replacement of forests with more reflective surfaces, such as pastures and agricultural fields [131,132]. Furthermore, the loss of vegetation cover intensifies desertification processes, especially in vulnerable biomes such as the Caatinga, as observed by Araujo et al. [133]. These changes compromise biodiversity and ecosystem services, highlighting the need for effective public policies to ensure the conservation and sustainable management of these areas.
Figure 6 and Figure 7 also present change patterns based on LULC and albedo for the Western (Cut-out C) and Southwestern (Cut-out D) regions of the NEB, comparing 2000 with 2019. The forest class was also extensively impacted in these regions over time, indicating a significant increase in deforestation, as seen in 2019 in Cut-outs C and D (Figure 8). For these regions, the albedo confirms the LULC change, highlighting pixels with high values (Figure 9). The association of LULC and albedo confirms the degradation of these areas as well as the loss of forest resilience over time, with 2019 highlighting the significant impact of these changes.
The change conditions presented in Figure 4, Figure 5, Figure 6 and Figure 7 are directly associated with the pressures from anthropogenic activities, which are rapidly encroaching on the natural environment, causing imbalances and environmental impacts in the NEB regions over time. Other studies conducted in NEB have also evaluated these and other impacts, which have affected surface energy balance components, such as changes in regional biophysical parameters. For example, an increase in surface temperature and a reduction in evapotranspiration [14,134], as well as low water availability in rivers, lakes and reservoirs [14,135].

3.2. Dynamics of Quantitative Variability of LULC Data

Table 6 highlights the annual total quantification of LULC for the NEB, considering the main level classes of forest, non-forest natural, farming, non-vegetated area and water, based on Collection 5 of MapBiomas Brazil. Additionally, the annual average totals of rainfall (TRMM) are presented, along with descriptive and dispersion statistical values, which characterize the temporal quantitative variability patterns over the period from 2000 to 2019.
The thematic classifications of LULC data exhibit a low spatiotemporal quantitative variability, confirmed by the CV values, which ranged from 2.38% to 10.39% for the forest, non-forest natural, farming, non-vegetated area and water classes. The CV value also confirmed the high variability of rainfall, at 168.03% (Table 6), a common spatial behavior for this variable and TRMM product, according to the criteria of Warrick and Nielsen [111].
It is noteworthy that the NEB has a significantly large territorial extent, approximately 1,553,402 km2, comprising subregions and diverse ecosystems with peculiar and unique conditions, such as climate variability (high variability) and active atmospheric systems [8,23,136,137]. Therefore, understanding rainfall data and its influence on LULC data is a key factor in Earth sciences research, particularly in the fields of hydrology, agro-environmental studies, water resources, weather forecasting, climate change events and drought [14,15,73,98,138,139,140].
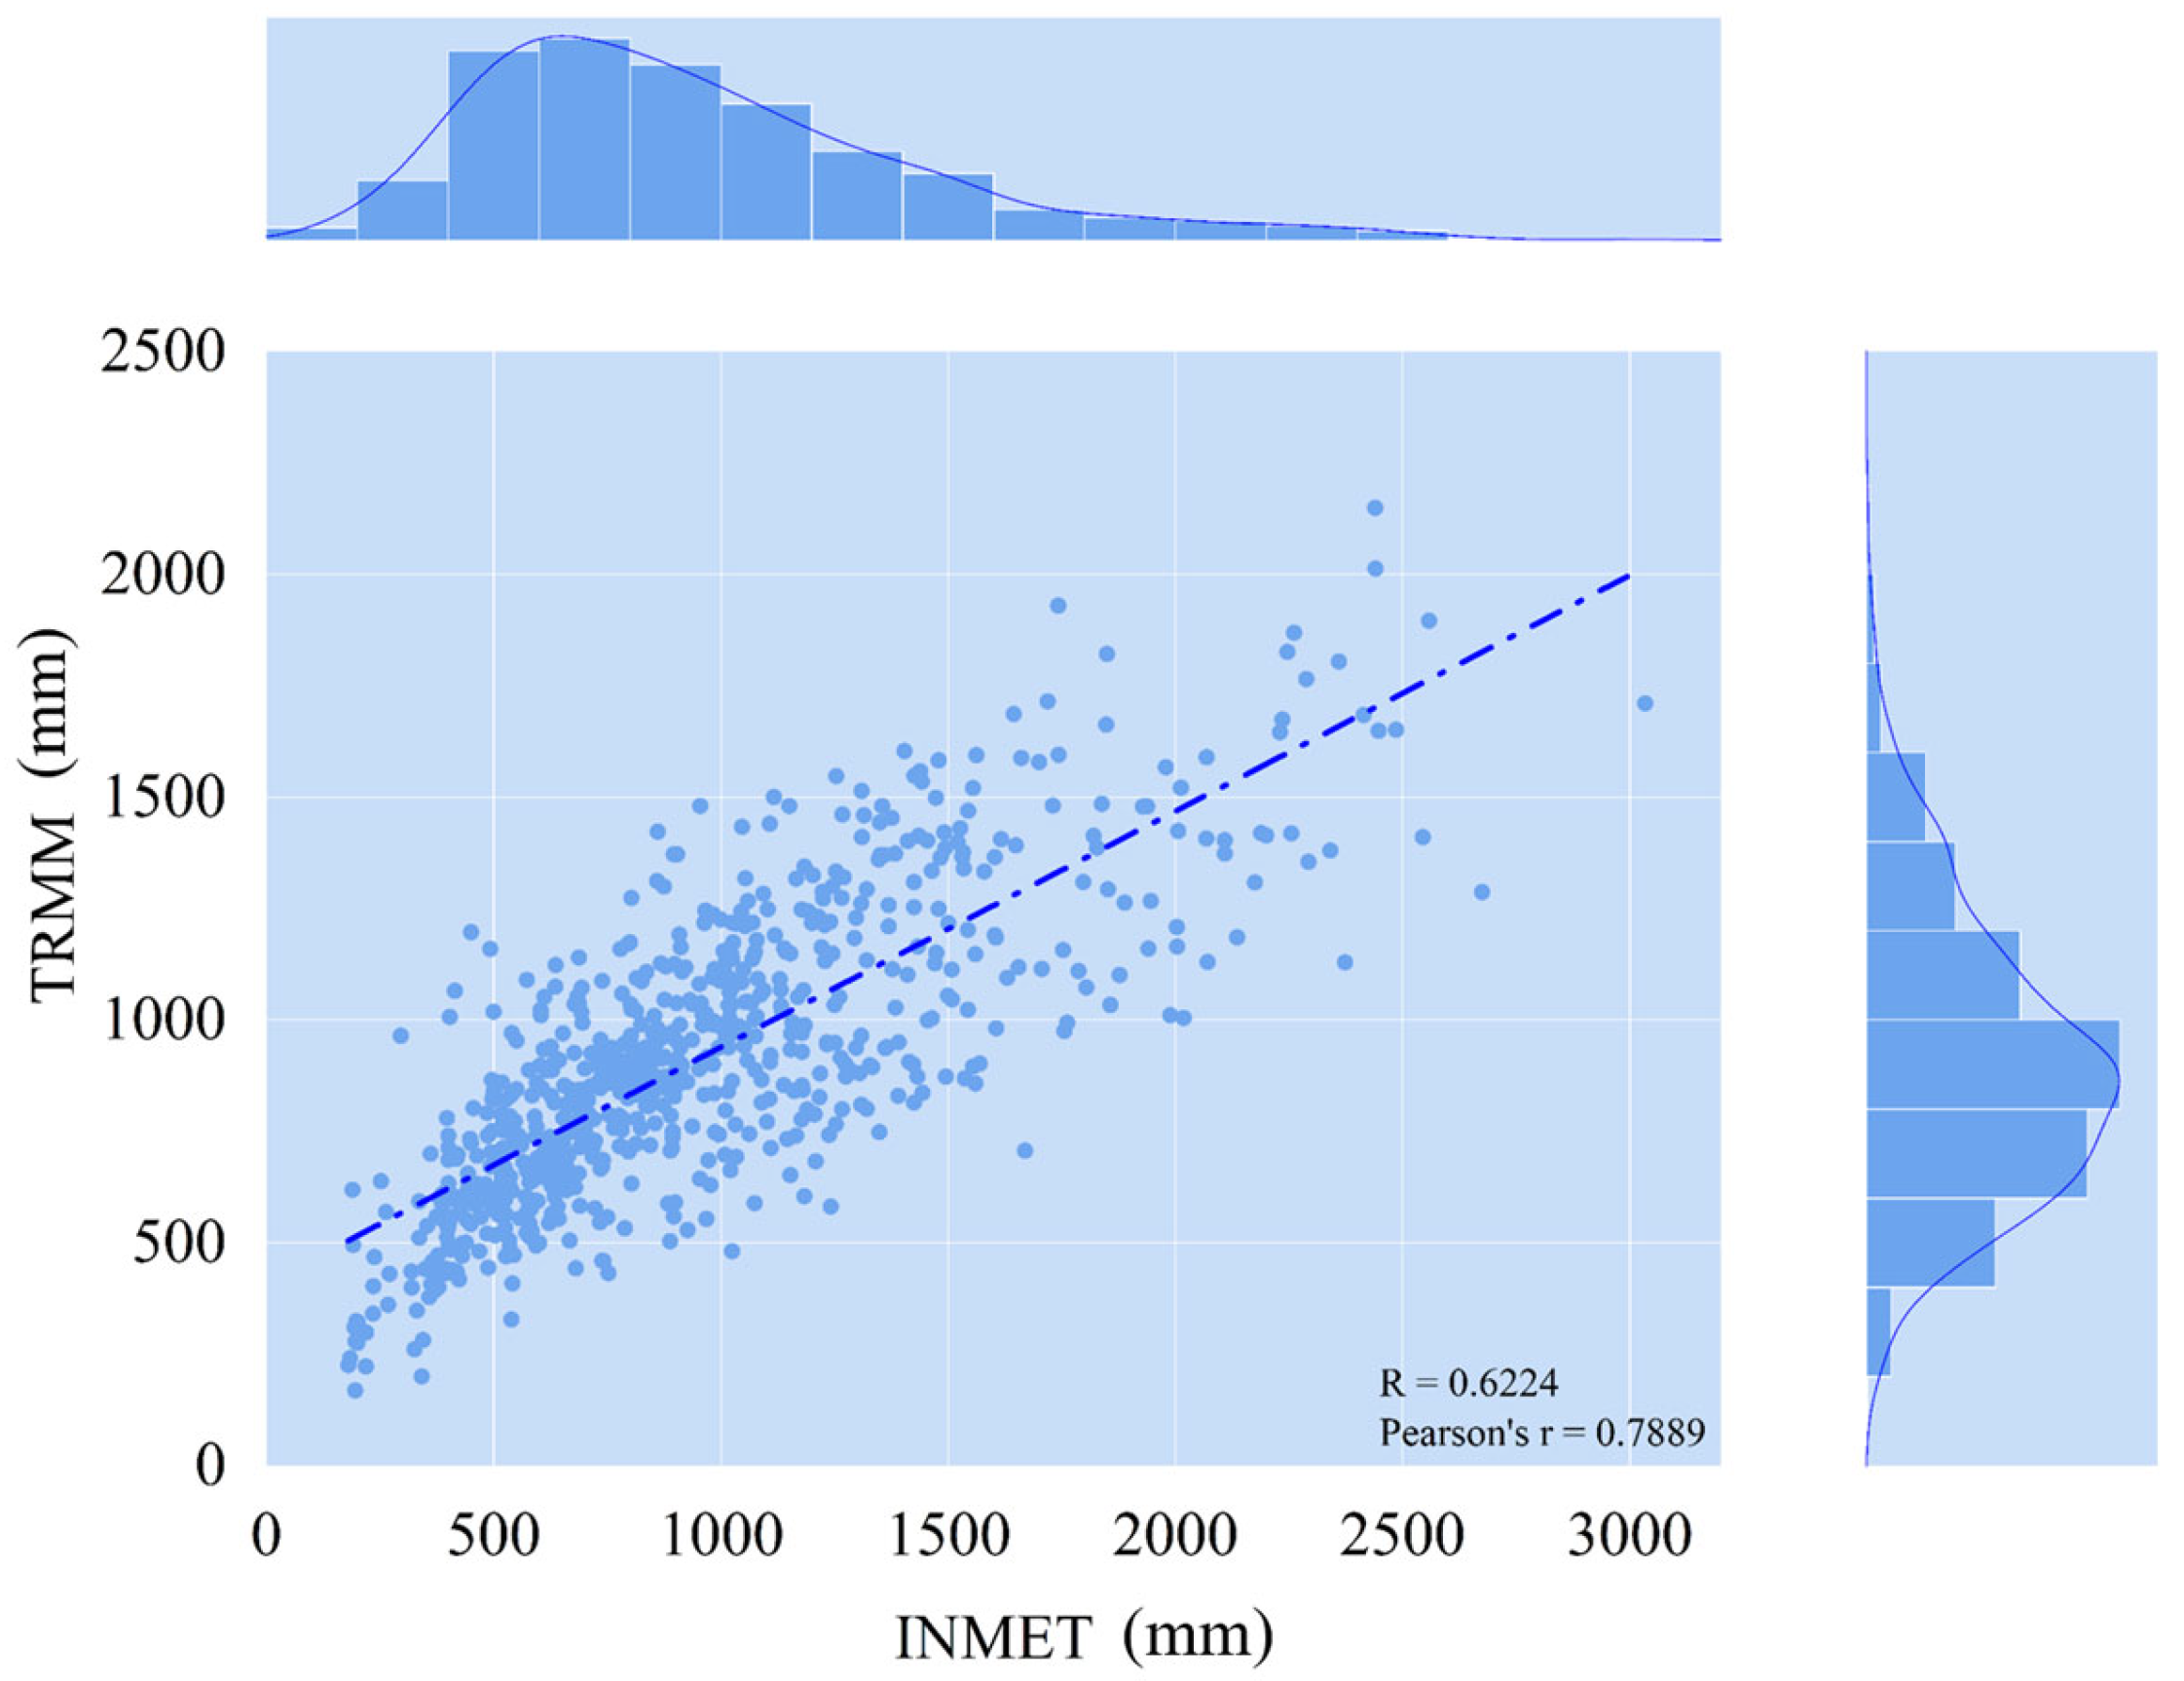
Figure 10 presents the validation of precipitation on an annual time scale. The data estimated by the TRMM_3B43v7 product and those recorded by rain gauges at surface weather stations demonstrated consistent and well-related linear correlation and error metrics, according to the adjustments of the coefficient of determination (R2) and Pearson’s correlation coefficient (r), with values of 0.6224 and 0.7889, respectively.
The study by Brasil Neto [141] also evaluated TRMM satellite data for monitoring meteorological drought in the Northeast region of Brazil, presenting satisfactory validation with R2 = 0.65. Therefore, TRMM data can be considered effective for monitoring the occurrence of climate variability and drought in the NEB regions on an annual time scale. TRMM detected that from 2012 to 2019, the NEB was impacted by low average rainfall levels (Table 6). Studies have observed that during this period, the NEB regions experienced high climate variability, favoring prolonged droughts [6,14,20,21]. Other studies on climatological research classified the drought from 2012 to 2019 as the most severe in recent decades in the NEB, in terms of magnitude and duration [8,24,28].
The classes with vegetated cover areas (forest and non-forest natural) exhibit decreasing quantitative data over the time series (2000–2019), according to the maximum (981,577.33 km2) and minimum (903,850.95 km2) values for the forest area and the maximum (91,018.31 km2) and minimum (82,260.09 km2) values for the non-forest natural area. In contrast, the farming (minimum = 456,363.72 km2; maximum = 536,750.41 km2) and non-vegetated area (minimum = 9826.72 km2; maximum = 13,449.03 km2) classes show increasing trends (Table 6).
The water class exhibits considerable variability over time, with 2016 showing the lowest water coverage (13,911.23 km2), while 2009 recorded the highest (18,556.61 km2). These water replenishment levels are consistent with the rainfall fluctuation patterns detected by the TRMM_3B43v7 satellite, with respective mean volumes of 1266 mm year−1 (2009) and 848 mm year−1 (2016) (Table 6).
The annual mean rainfall totals ranged from 651 to 1266 mm year−1, with the 2012–2019 period being the most critical in the time series, detecting severe drought conditions across most NEB regions, particularly in semi-arid areas (Table 6). A series of studies in Brazil have significantly validated the efficiency and accuracy of TRMM rainfall data, concluding that rainfall estimates are reliable both for drier periods and at an annual timescale, making them essential for research in hydrology, climatology, water resources, climate change events and severe droughts [14,73,98,138,139].

3.3. Trend Analysis from Mann–Kendall and Sen’s Slope

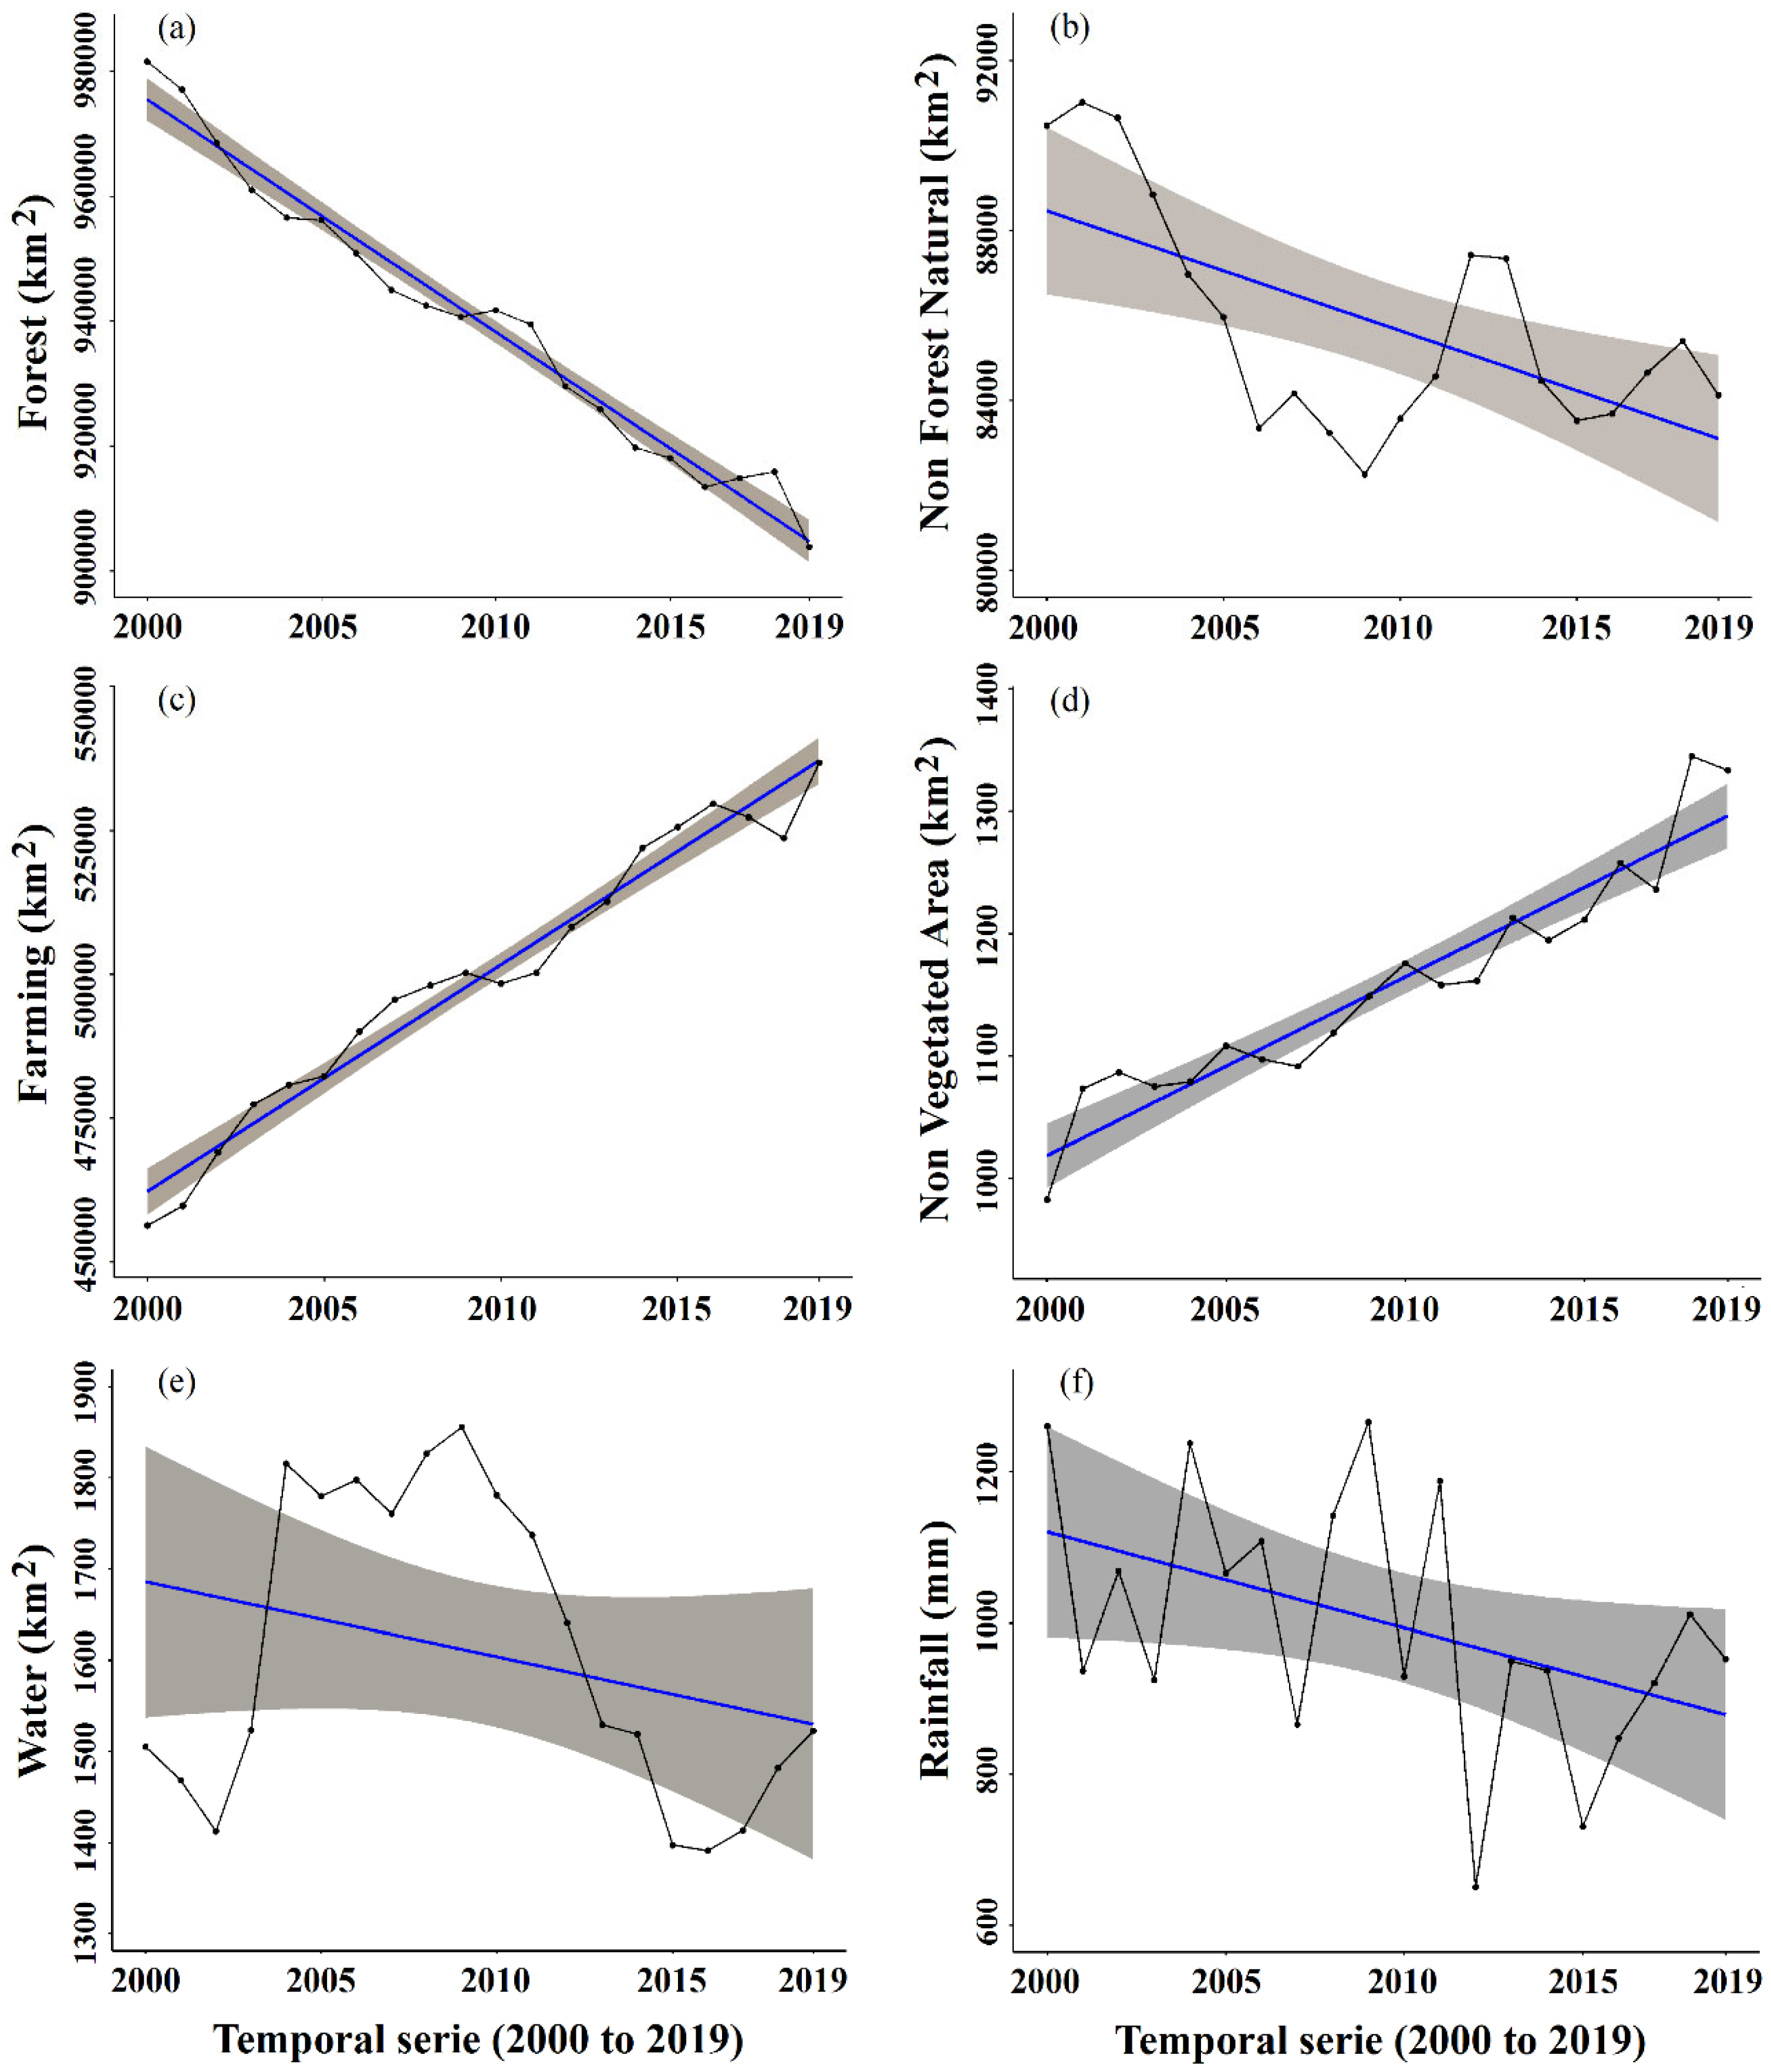
The main change conditions of LULC and precipitation data were evaluated through trend analysis of loss and gain over time (Figure 11 and Table 7), using the non-parametric temporal trend tests of Mann–Kendall and Sen’s slope, also assessing the magnitude of the trend [78,79,80]. Figure 11 present the trends for the time series (2000–2019) of the main LULC classes: forest (a), non-forest natural (b), farming (c), non-vegetated area (d) and water (e), as well as for the rainfall trend analysis (f) for the NEB, from 2000 to 2019, statistically analyzed according to the significance levels of 1% (p < 0.01) and 5% (p < 0.05), and the magnitude of the trend. It is noticeable that the impacts of environmental and climate changes are being driven by the rapid evolution of land use change patterns, indicating that these areas are becoming increasingly susceptible to degradation processes [14,20], and in some specific regions, there is an exponential increase in desertified areas and reduced water conditions [14,21,27,101]. The detected error results were close to zero, indicating that the annual time series dataset has sufficient information and good fit (adequate sample size), in addition to the low variability of the classes indicated by the CV values (Table 6).
For the forest class (Figure 11a), a significant decreasing trend was identified at the 99% confidence level (ZMK = −5.872; Tau = −0.958; p-value < 0.01). Therefore, this decline trend was estimated by the magnitude of the trend using Sen’s slope, with an annual loss of −3705.853 km2 (Table 7). Over the 20-year time series, the forest class is estimated to have lost a total of 74,117.06 km2. Kendall’s Tau statistic value close to −1 represents a strong and shift toward replacement of that class over time. The non-forest natural class (Figure 11b) no significant trend was identified (ZMK = −1.914; Tau = −0.316; p-value > 0.055). However, this is a class where a statistical margin close to significance can be observed (p < 0.05), which will possibly happen in the future due to the increasing deforestation and degradation of these environments. The magnitude of the trend, using Sen’s slope, estimated an annual loss of −277,263 km2, totaling 5545.26 km2 (Table 7). This means that in a few years the non-forest natural class will have a significant loss time trend, given that the strength and intensity reference by Tau, equal to −0.316, has been showing considerable negative strength.
In contrast, for the farming class (Figure 11c), a significant increasing trend was observed at the 99% confidence level (ZMK = 5.807; Tau = 0.947; p-value < 0.01), with the trend’s magnitude by Sen’s slope identifying an annual gain of 3978.898 km2 and a total gain estimate of 79,577.96 km2 for farming over the 2000–2019 period (Table 7). Thus, the forest and non-forest natural classes are inversely proportional to farming, with greater certainty that forest cover areas are being directly impacted by the exponential increase in pasture and agricultural areas. A significant increasing trend (ZMK = 5.418; Tau = 0.884; p-value < 0.01) was also identified for the non-vegetated area class (Figure 11d) at the 99% confidence level. The trend’s magnitude, using Sen’s slope, showed an annual gain of 137.084 km2, with a total gain estimate for farming of 2741.68 km2 (Table 7). Kendall’s Tau statistic values close to 1 represent intense and directed change for these classes over time.
Santos et al. [73] also analyzed loss and gain trends using the non-parametric Mann–Kendall and Sen tests for forest cover in the Brazilian semi-arid region between 2000 and 2018, where they observed a growing trend of annual losses with a significance level of 0.004, detecting an increase in deforestation over time, totaling approximately 60,769.39 km2 of forest loss over 18 years. Specifically, the authors highlighted that between 2010 and 2018, over 50% of this deforestation occurred, with the highest amounts in 2012 and 2016.
In the water class (Figure 11e), no significant trend was identified (ZMK = −1.330; Tau = −0.221; p-value > 0.05). However, a reduction in water covered areas was observed over the time series, estimated by the magnitude of the trend using Sen’s slope, which showed an annual loss of −93.586 km2, totaling 1871.72 km2 (Table 7). This behavior pattern can primarily be explained by the high climatic variability in the NEB regions [23]. Statistically, the Tau reference value (−0.221) did not show any indications of major loss over time.
Analyzing the annual values of the water areas, from 2004 to 2011, an increase and stability pattern was observed for water covered areas (Figure 11e), driven by higher rainfall volumes according to TRMM data (in Table 6). During this period, this pattern of rainfall above the climatological mean was confirmed for the NEB and its semi-arid regions [14]. Reductions in water areas occurred mainly from 2012 to 2017, due to the severe drought period from 2012 to 2019 [14,24,27], with the peak of drought in 2016 and 2017 showing the lowest water coverage (Figure 11e). These facts reinforce that low water availability between 2012 and 2019 was due to low rainfall indices, the intensification of flash droughts and changes in land use in the region [21,142].
Barbosa and Buriti [27] assessed water flow in response to flash droughts in the São Francisco River basin over three decades (1991–2020), covering various NEB regions. The study detected a significant trend (p < 0.05) of a 63% reduction in São Francisco River discharge due to the intensification of flash droughts, which, according to the authors, are rapid-onset, high-intensity climate extremes, characterized by a sharp drop in precipitation volumes, with a trend of reduction of 450 mm, combined with high temperatures, showing a trend increase of 0.021 °C per year. The research further indicated that the basin lost 15% of its forest cover only between 2012 and 2020.
For rainfall, no significant trend was identified (ZMK = −1.460; Tau = −0.242; p-value > 0.05) (Figure 11f). Nonetheless, a mean reduction in rainfall was observed, as estimated by the magnitude of the trend using Sen’s slope, detecting an annual loss of −11.878 mm, or a total reduction of 237.56 mm for NEB, over the 20 years of the time series (Table 7). Supporting this finding, Barbosa [21] reported a decreasing trend in cloud cover in the central semi-arid region of the NEB, based on satellite remote sensing data collected between 2004 and 2022. According to the author, these are severely degraded areas, confirming the existence of arid lands, which influence the atmosphere and, consequently, the reduction in rainfall volumes in these regions.
Therefore, spatiotemporal and quantitative mapping of water conditions in these regions is essential for devising appropriate and sustainable water resource management measures, for example, in agriculture, to optimize the use of irrigation water in agricultural crops, avoiding conflicts with strategic decision-making [20]. Regarding forest transformations, Rosa et al. [70] emphasizes that understanding the quantification of the dynamics of loss and gain, especially in native forest areas, is crucial for biodiversity conservation and ecosystem services.

3.4. Multivariate Analysis: Principal Components (PC)

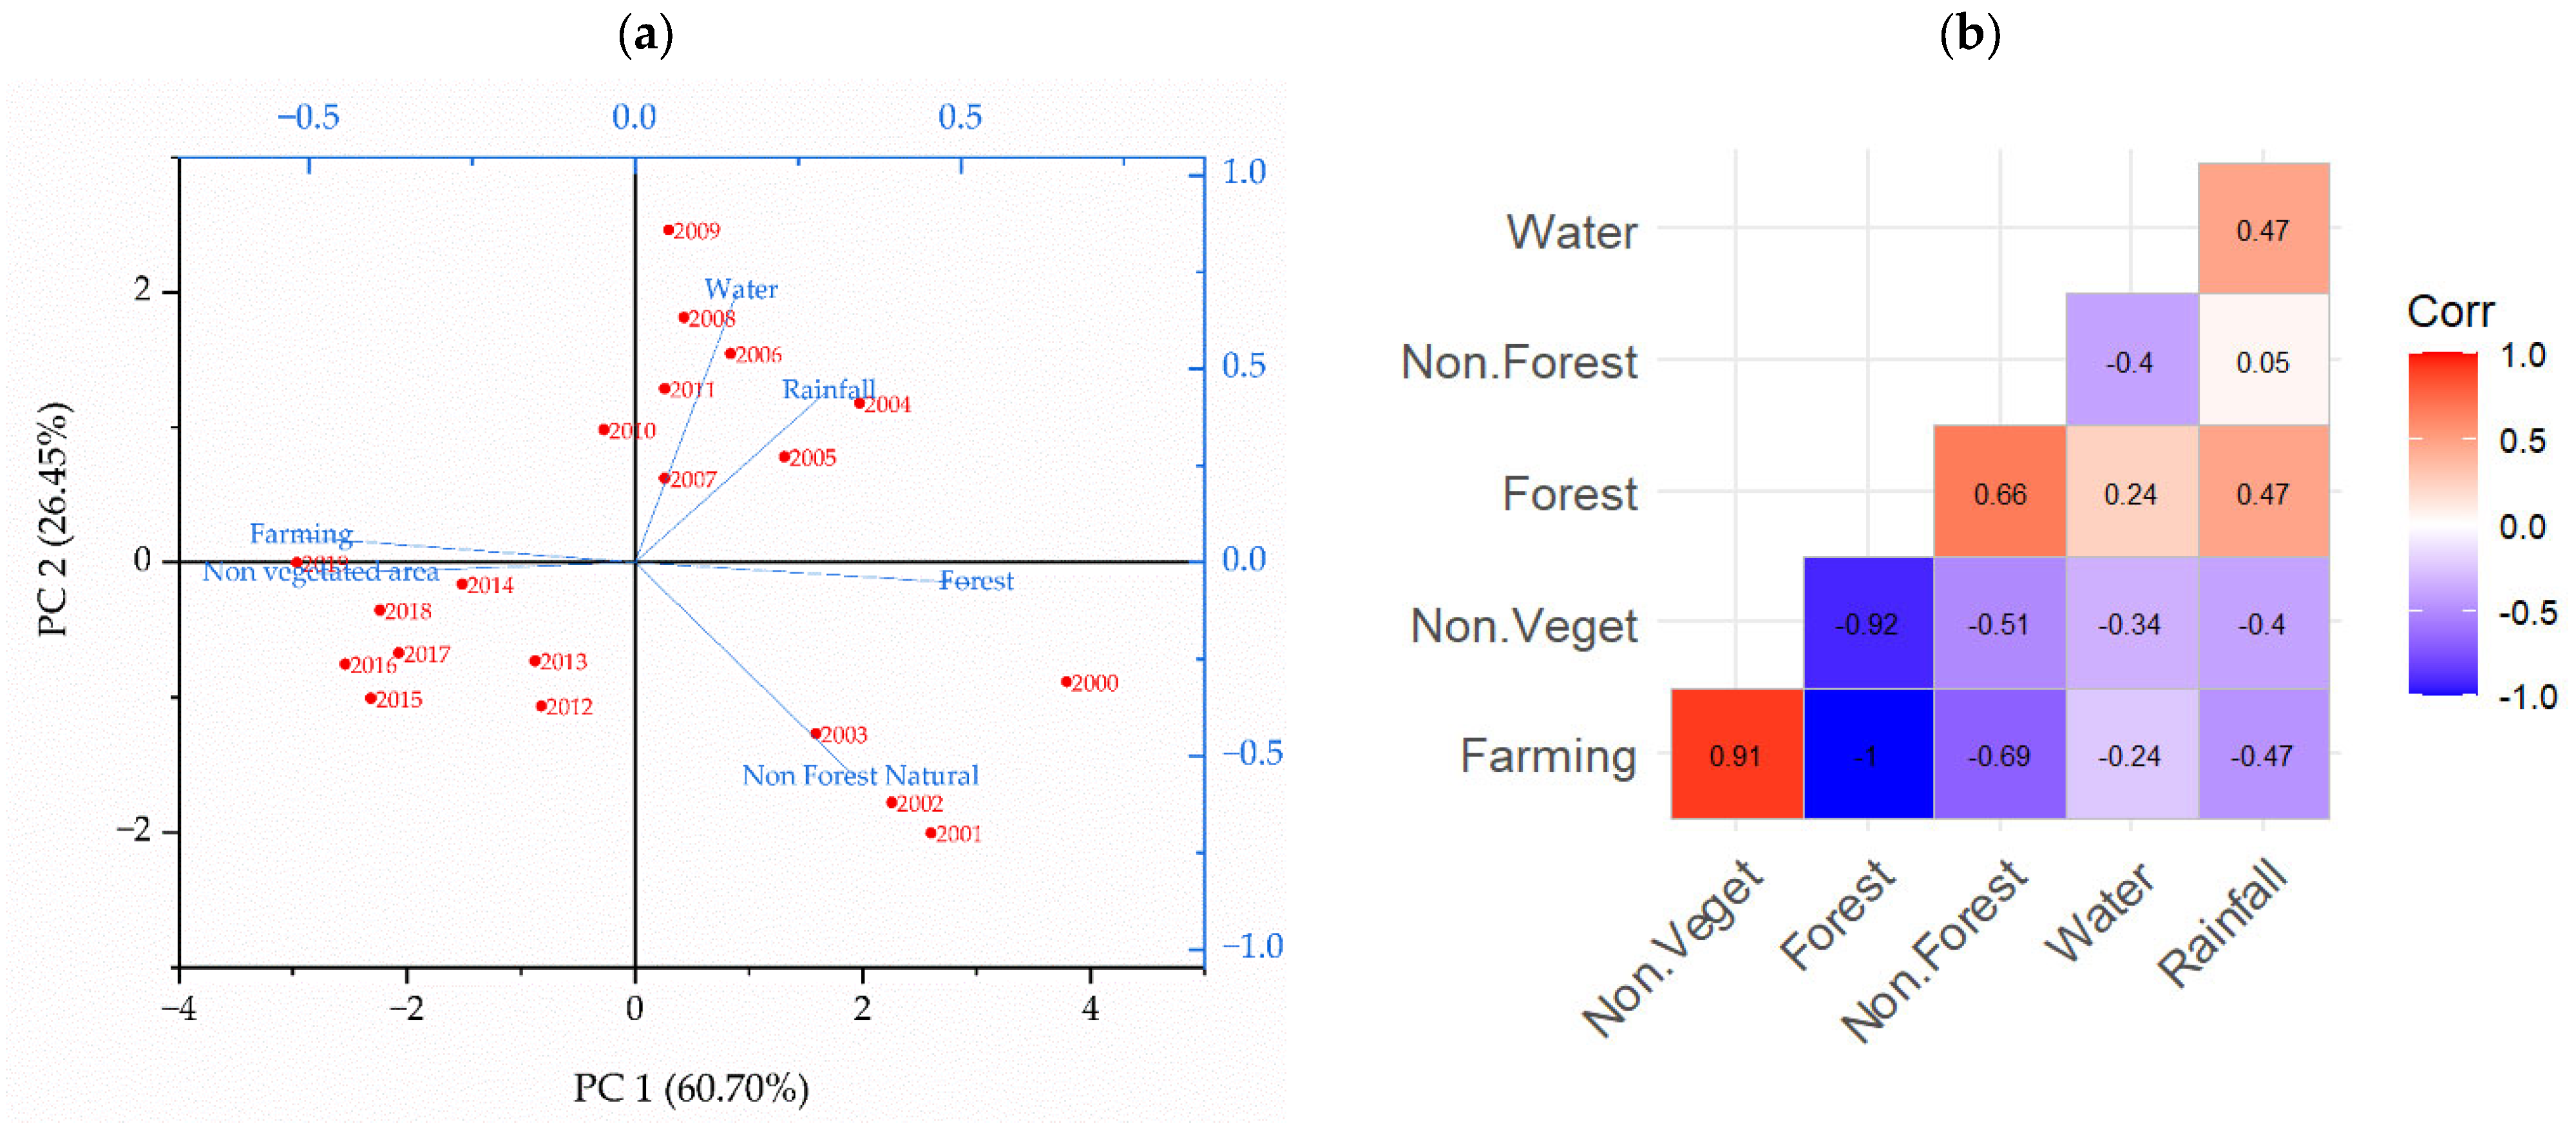
Figure 12 shows the principal component analysis (PCA), based on the time series of LULC data and rainfall by TRMM, between 2000 and 2019. It is highlighted that principal components 1 and 2 (PC1 and PC2) accounted for a total variance of 87.15%, which is highly significant. Studies have confirmed that a high value of cumulative variance contribution of ≥85% indicates that the variable is well represented in the PC [14,20,143]. The PC1 showed a significant informational load, being predominant in the analysis, with an eigenvalue of 3.64, and the PC2 showed an eigenvalue of 1.59 (Figure 12). The PCs presented a relevant amount of information contained in the original data, with eigenvalues greater than 1, as established by the criterion of Kaiser [79].
PCA highlights an important behavior during the periods most impacted by the evolution of land use. The years with the lowest annual precipitation (in Table 6) correlated with the areas of farming and non-vegetated area. This indicates that the period from 2012 to 2019 was the most critical for regions of the NEB, with potential impacts associated both with climatic variability (severe drought) and pressures from anthropogenic activities (Figure 12a). The correlation matrix indicated that the severe impact detected in the forest area (with degradation over time) was directly influenced by the significant increase in the farming and non-vegetated areas, highlighting an inversely proportional correlation of −1 and −0.92, respectively (Figure 12b). Several studies involving the NEB, as well as some regions of the Brazilian semi-arid, identified during this same period the absence and/or low resilience of natural vegetation cover, mainly in areas of the Caatinga biome, due to severe drought and pronounced water deficit [14,20,27,124]. Therefore, the PCA effectively defined the patterns of dry and wet years in the NEB over time.
The PCA also shows correlations with the non-forest natural, forest and water classes, and rainfall during the other years, from 2000 to 2011. The latter two are better correlated because the increase in areas with water bodies in the NEB regions is more associated with the highest rainfall volumes. For example, indicating that the period from 2004 to 2011 experienced regular rainfall regimes for the region (Figure 12a). Consequently, the vegetation (Forest) responded similarly during this period, both highlighting a correlation of 0.47 (Figure 12b). The increase in annual precipitation volumes during this period (in Table 6) indicated a rapid recovery of vegetation cover and water bodies. A similar behavior was identified by Abubakar et al. [90], where the increase in annual precipitation in the Niger River Basin, Nigeria, indicated a higher tendency for groundwater resource recharge and improved agricultural productivity.

4. Conclusions

The spatiotemporal mapping of natural forest areas of the biomes (Caatinga, Cerrado, Atlantic Forest and Amazon) of the Northeast of Brazil (NEB) identified a significant loss trend of approximately 80.000 km2 of these covers throughout the time series (2000–2019). According to land use and land cover (LULC) data, these areas were directly replaced by farming areas. Thus, the deforestation of native vegetation in the region favors mainly low water production and availability. These patterns signal possible implications for the spatial structure of the NEB, with reflections yet to be explored in depth in terms of biodiversity, the hydrological cycle, and sustainable land use.
The association of LULC data with surface albedo confirms land use change and increased deforestation in the North, Northwest, South and Southeast regions of the NEB. The Northwestern region was directly more impacted by this increase due to anthropogenic pressures and climate variability. The spatiotemporal relationship between biophysical conditions and regional climate helps us understand and evaluate impacts and environmental dynamics, especially those of the native vegetation of the NEB. The TRMM satellite proved to be effective in monitoring the occurrence of climate variability and drought in the NEB regions, where it detected high interannual variability in precipitation from 2012 to 2019.
The trend and magnitude analysis of the change identified the increase in degradation and areas of climatic vulnerability due to the rapid evolution of land use, further intensified by the association of climate change effects, such as drought, especially in semi-arid regions. The significant change condition of the LULC data projects greater transparency of information regarding environmental impacts and land degradation levels in the NEB. It envisions the urgent and direct involvement of public institutional management in planning mitigation actions and appropriate management in decision-making due to the response patterns of this product.
Principal component analysis (PCA) identified highly significant cumulative variance contribution rates, with a total PCA of 87.15% and eigenvalues greater than 1.5. CP1 equal to 60.70% showed a predominance of informational load from the original dataset, with an eigenvalue of 3.64. Interestingly, PCA also separately confirmed years with low average annual precipitation and those affected by regional drought, as well as detecting regular and rainy years, associating them with the main land uses.
One of the limiting factors of this research was the use of few years in the spatiotemporal analysis, considering the high capacity of the Mann–Kendall test. Therefore, for future research on the LULC classification, the complete data series should be used in order to significantly consolidate the loss and gain conditions of the LULC classes over time.
Geospatial satellite data processing is an innovative technology for mapping and monitoring land cover over time. When combined with Google Earth Engine’s cloud processing infrastructure and machine learning algorithms, it enables robust, large-scale analysis in a practical, effective manner, and at low operating costs.

Author Contributions

Conceptualization, J.L.B.d.S. and M.V.d.S.; methodology, J.L.B.d.S., M.V.d.S., A.A.d.C. and A.M.d.R.F.J.; software, J.L.B.d.S., M.V.d.S., M.B.F., A.C.B., R.C.S., R.A.J., J.A.O.S.S., A.M.d.R.F.J. and A.A.d.C.; validation, J.L.B.d.S., M.V.d.S., A.C.B., T.G.F.d.S., P.C.S., G.B.d.A.M. and A.M.d.R.F.J.; formal analysis, T.G.F.d.S., M.B.F., H.F.E.d.O., P.C.S., J.A.O.S.S., R.C.S., G.B.d.A.M., A.C.B., R.A.J., P.H.D.B., P.M.O.L., A.M.d.R.F.J., A.A.d.C. and M.M.; investigation, J.L.B.d.S., P.H.D.B., T.G.F.d.S., G.B.d.A.M., P.M.O.L., M.M., M.V.d.S. and H.F.E.d.O.; resources, J.L.B.d.S., M.M., R.A.J., M.B.F., P.M.O.L., P.C.S., T.G.F.d.S., M.V.d.S., A.A.d.C., A.C.B., P.H.D.B., J.A.O.S.S. and R.C.S.; data curation, J.L.B.d.S., M.V.d.S., A.C.B., A.A.d.C. and A.M.d.R.F.J.; writing—original draft preparation, J.L.B.d.S. and M.V.d.S.; writing—review and editing, J.L.B.d.S., M.V.d.S., J.A.O.S.S., R.C.S., T.G.F.d.S., P.M.O.L., H.F.E.d.O., G.B.d.A.M., P.C.S., A.A.d.C., M.B.F., R.A.J., A.M.d.R.F.J., M.M., A.C.B. and P.H.D.B.; visualization, J.A.O.S.S., P.C.S., R.A.J., H.F.E.d.O., T.G.F.d.S., P.H.D.B., A.C.B., P.M.O.L., M.M., M.B.F., R.C.S. and A.M.d.R.F.J.; supervision, G.B.d.A.M., P.M.O.L. and H.F.E.d.O.; project administration, J.L.B.d.S., G.B.d.A.M. and M.V.d.S.; funding acquisition, J.L.B.d.S., P.M.O.L., M.M., A.M.d.R.F.J., H.F.E.d.O., A.A.d.C., R.C.S. and M.V.d.S. All authors have read and agreed to the published version of the manuscript.

Funding

This study is supported by the National Council for Scientific and Technological Development (CNPq). A.M.d.R.F.J. is supported by the São Paulo Research Foundation (FAPESP) grant No. 2023/05323-4.

Data Availability Statement

Publicly available datasets were analyzed in this study and can be found in the manuscript. Other data presented in this study are available on request from the first author. These data can be found here: The TRMM satellite precipitation dataset featured in this study is available on the website on NASA’s GIOVANNI platform (https://giovanni.gsfc.nasa.gov/giovanni/—accessed 10 January 2021). The multitemporal series of images from the MODIS sensor aboard the Terra and Aqua satellites featured in this study are available on the NASA/MODIS website, surface reflectance product (Terra/MOD09A1 and Aqua/MYD09A1 version 6, https://modis.gsfc.nasa.gov/data/dataprod/mod09.php—accessed 2 January 2021). Rainfall data from surface weather stations used in this study are available on the website of the National Institute of Meteorology (INMET), at the following access link (https://bdmep.inmet.gov.br/—accessed 24 July 2024). The scripts in computer language for the digital processing of satellite data presented in this study were developed on the Google Earth Engine (GEE) platform, available on the website (https://earthengine.google.com/—accessed 4 January 2021).

Acknowledgments

We would like to thank the Federal Rural University of Pernambuco and the Goiano Federal Institute—Campus Ceres for supporting the research. The authors express their gratitude to NASA/MODIS and the GIOVANNI/NASA platform for providing free satellite data products (TRMM). To MapBiomas Brazil for the LULC data. Also, to the Google Earth Engine platform for providing free access using its GIS modeling library.

Conflicts of Interest

The authors declare no conflicts of interest.

References

  1. Fendrich, A.N.; Barretto, A.; de Faria, V.G.; de Bastiani, F.; Tenneson, K.; Guedes Pinto, L.F.; Sparovek, G. Disclosing Contrasting Scenarios for Future Land Cover in Brazil: Results from a High-Resolution Spatiotemporal Model. Sci. Total Environ. 2020, 742, 140477. [Google Scholar] [CrossRef] [PubMed]
  2. Leng, X.; Feng, X.; Fu, B. Driving Forces of Agricultural Expansion and Land Degradation Indicated by Vegetation Continuous Fields (VCF) Data in Drylands from 2000 to 2015. Glob. Ecol. Conserv. 2020, 23, e01087. [Google Scholar] [CrossRef]
  3. Liu, Y.; Guo, B.; Lu, M.; Zang, W.; Yu, T.; Chen, D. Quantitative Distinction of the Relative Actions of Climate Change and Human Activities on Vegetation Evolution in the Yellow River Basin of China during 1981–2019. J. Arid Land 2023, 15, 91–108. [Google Scholar] [CrossRef]
  4. Parracciani, C.; Buitenwerf, R.; Svenning, J.C. Impacts of Climate Change on Vegetation in Kenya: Future Projections and Implications for Protected Areas. Land 2023, 12, 2052. [Google Scholar] [CrossRef]
  5. da Silva Pinto Vieira, R.M.; Tomasella, J.; Cunha, A.P.M.D.A.; Barbosa, A.A.; Pompeu, J.; Ferreira, Y.; Santos, F.C.; Alves, L.M.; Ometto, J. Socio-Environmental Vulnerability to Drought Conditions and Land Degradation: An Assessment in Two Northeastern Brazilian River Basins. Sustainability 2023, 15, 8029. [Google Scholar] [CrossRef]
  6. da Silva, J.L.B.; da Silva, M.V.; da Rosa Ferraz Jardim, A.M.; Lopes, P.M.O.; de Oliveira, H.F.E.; Silva, J.A.O.S.; Mesquita, M.; de Carvalho, A.A.; Cézar Bezerra, A.; de Oliveira-Júnior, J.F.; et al. Geospatial Insights into Aridity Conditions: MODIS Products and GIS Modeling in Northeast Brazil. Hydrology 2024, 11, 32. [Google Scholar] [CrossRef]
  7. Song, Z.; Lu, Y.; Yuan, J.; Lu, M.; Qin, Y.; Sun, D.; Ding, Z. Research on Desertification Monitoring and Vegetation Refinement Extraction Methods Based on the Synergy of Multi-Source Remote Sensing Imagery. IEEE Trans. Geosci. Remote Sens. 2025, 63, 1–19. [Google Scholar] [CrossRef]
  8. Marengo, J.A.; Cunha, A.P.M.A.; Nobre, C.A.; Ribeiro Neto, G.G.; Magalhaes, A.R.; Torres, R.R.; Sampaio, G.; Alexandre, F.; Alves, L.M.; Cuartas, L.A.; et al. Assessing Drought in the Drylands of Northeast Brazil under Regional Warming Exceeding 4 °C. Nat. Hazards 2020, 103, 2589–2611. [Google Scholar] [CrossRef]
  9. Akinyemi, F.O. Vegetation Trends, Drought Severity and Land Use-land Cover Change during the Growing Season in Semi-arid Contexts. Remote Sens. 2021, 13, 836. [Google Scholar] [CrossRef]
  10. Guo, B.; Wei, C.; Yu, Y.; Liu, Y.; Li, J.; Meng, C.; Cai, Y. The dominant influencing factors of desertification changes in the source region of Yellow River: Climate change or human activity? Sci. Total Environ. 2022, 813, 152512. [Google Scholar] [CrossRef]
  11. Barbosa, H.A. Flash Drought and Its Characteristics in Northeastern South America during 2004–2022 Using Satellite-Based Products. Atmosphere 2023, 14, 1629. [Google Scholar] [CrossRef]
  12. Kumar, B.P.; Anusha, B.N.; Babu, K.R.; Sree, P.P. Identification of climate change impact and thermal comfort zones in semi-arid regions of AP, India using LST and NDBI techniques. J. Clean. Prod. 2023, 407, 137175. [Google Scholar] [CrossRef]
  13. Paredes-Trejo, F.; Barbosa, H.A.; Daldegan, G.A.; Teich, I.; García, C.L.; Kumar, T.V.L.; de Oliveira Buriti, C. Impact of Drought on Land Productivity and Degradation in the Brazilian Semiarid Region. Land 2023, 12, 954. [Google Scholar] [CrossRef]
  14. Silva, J.L.B.; Moura, G.B.A.; Silva, M.V.; Oliveira-Júnior, J.F.; Jardim, A.M.D.R.F.; Refati, D.C.; da Cunha Correia Lima, R.; de Carvalho, A.A.; Ferreira, M.B.; de Brito, J.I.B.; et al. Environmental degradation of vegetation cover and water bodies in the semiarid region of the Brazilian northeast via cloud geoprocessing techniques applied to orbital data. J. South Am. Earth Sci. 2023, 121, 104164. [Google Scholar] [CrossRef]
  15. Manikanta, B.; Yaswanth, K.K. Impact Assessment of Future LULC and Climate Change on Hydrology in the Upper Pennar Basin, India. Sustain. Water Resour. Manag. 2025, 11, 15. [Google Scholar] [CrossRef]
  16. Stríkis, N.M.; Buarque, P.F.S.M.; Cruz, F.W.; Bernal, J.P.; Vuille, M.; Tejedor, E.; Santos, M.S.; Shimizu, M.H.; Ampuero, A.; Du, W.; et al. Modern Anthropogenic Drought in Central Brazil Unprecedented during Last 700 Years. Nat. Commun. 2024, 15, 1728. [Google Scholar] [CrossRef]
  17. Tomasella, J.; Silva Pinto Vieira, R.M.; Barbosa, A.A.; Rodriguez, D.A.; de Oliveira Santana, M.; Sestini, M.F. Desertification Trends in the Northeast of Brazil over the Period 2000–2016. Int. J. Appl. Earth Obs. Geoinf. 2018, 73, 197–206. [Google Scholar] [CrossRef]
  18. da Rosa Ferraz Jardim, A.M.; Araújo Júnior, G.D.N.; da Silva, M.V.; Dos Santos, A.; da Silva, J.L.B.; Pandorfi, H.; de Oliveira-Júnior, J.F.; de Castro Teixeira, A.H.; Teodoro, P.E.; de Lima, J.L.M.P.; et al. Using Remote Sensing to Quantify the Joint Effects of Climate and Land Use/Land Cover Changes on the Caatinga Biome of Northeast Brazilian. Remote Sens. 2022, 14, 1911. [Google Scholar] [CrossRef]
  19. Oliveira, M.L.; dos Santos, C.A.; de Oliveira, G.; Silva, M.T.; da Silva, B.B.; Cunha, J.E.B.L.; Ruhoff, A.; Santos, C.A.G. Remote sensing-based assessment of land degradation and drought impacts over terrestrial ecosystems in Northeastern Brazil. Sci. Total Environ. 2022, 835, 155490. [Google Scholar] [CrossRef]
  20. Refati, D.C.; Silva, J.L.B.; Macedo, R.S.; Lima, R.C.C.; Silva, M.V.; Pandorfi, H.; Silva, P.C.; de Oliveira-Júnior, J.F. Influence of drought and anthropogenic pressures on land use and land cover change in the Brazilian semiarid region. J. South Am. Earth Sci. 2023, 126, 104362. [Google Scholar] [CrossRef]
  21. Barbosa, H.A. Understanding the Rapid Increase in Drought Stress and Its Connections with Climate Desertification since the Early 1990s over the Brazilian Semi-Arid Region. J. Arid Environ. 2024, 222, 105142. [Google Scholar] [CrossRef]
  22. Rocha, W.J.S.F.; Vasconcelos, R.N.; Costa, D.P.; Duverger, S.G.; Lobão, J.S.B.; Souza, D.T.M.; Herrmann, S.M.; Santos, N.A.; Rocha, R.O.F.; Ferreira-Ferreira, J.; et al. Towards Uncovering Three Decades of LULC in the Brazilian Drylands: Caatinga Biome Dynamics (1985–2019). Land 2024, 13, 1250. [Google Scholar] [CrossRef]
  23. Oliveira, P.T.; Santos e Silva, C.M.; Lima, K.C. Climatology and Trend Analysis of Extreme Precipitation in Subregions of Northeast Brazil. Theor. Appl. Climatol. 2017, 130, 77–90. [Google Scholar] [CrossRef]
  24. Marengo Orsini, J.A.; Alves, L.M.; Alvala, R.C.S.; Cunha, A.P.; Brito, S.; Moraes, O.L.L. Climatic Characteristics of the 2010-2016 Drought in the Semiarid Northeast Brazil Region. An. Acad. Bras. Cienc. 2018, 90, 1973–1985. [Google Scholar] [CrossRef] [PubMed]
  25. Costa, R.L.; de Mello Baptista, G.M.; Gomes, H.B.; Daniel dos Santos Silva, F.; Lins da Rocha Júnior, R.; de Araújo Salvador, M.; Herdies, D.L. Analysis of Climate Extremes Indices over Northeast Brazil from 1961 to 2014. Weather Clim. Extrem. 2020, 28, 100254. [Google Scholar] [CrossRef]
  26. Rezende, L.F.; Alves, L.; Barbosa, A.A.; Sales, A.T.; Pedra, G.U.; Menezes, R.S.C.; Arcoverde, G.F.; Ometto, J.P. Greening and Water Use Efficiency during a Period of High Frequency of Droughts in the Brazilian Semi-Arid. Front. Water 2023, 5, 1295286. [Google Scholar] [CrossRef]
  27. Barbosa, H.A.; de Oliveira Buriti, C. Assessment of Long-Term Streamflow Response to Flash Drought in the São Francisco River Basin over the Last Three Decades (1991–2020). Water 2024, 16, 2271. [Google Scholar] [CrossRef]
  28. Santos, J.A.S.; Wanderley, H.S.; de Amorim, R.F.C.; Delgado, R.C.; Fernades, R.C. The longest multiannual drought in Northeastern Brazil. J. S. Am. Earth Sci. 2024, 143, 104976. [Google Scholar] [CrossRef]
  29. Mariano, D.A.; Santos, C.A.C.D.; Wardlow, B.D.; Anderson, M.C.; Schiltmeyer, A.V.; Tadesse, T.; Svoboda, M.D. Use of Remote Sensing Indicators to Assess Effects of Drought and Human-Induced Land Degradation on Ecosystem Health in Northeastern Brazil. Remote Sens. Environ. 2018, 213, 129–143. [Google Scholar] [CrossRef]
  30. Nogueira, E.M.; Clemente, C.M.S.; Yanai, A.M.; dos Reis, M.; Fearnside, P.M. Cutting of Dry Forests in a Semiarid Region of Northeastern Brazil. Reg. Environ. Change 2024, 24, 25. [Google Scholar] [CrossRef]
  31. Flores, B.M.; Montoya, E.; Sakschewski, B.; Nascimento, N.; Staal, A.; Betts, R.A.; Levis, C.; Lapola, D.M.; Esquível-Muelbert, A.; Jakovac, C.; et al. Critical Transitions in the Amazon Forest System. Nature 2024, 626, 555–564. [Google Scholar] [CrossRef] [PubMed]
  32. Oliveira, A.C.; Sehn Körting, T. A multi-temporal dataset for mapping burned areas in the Brazilian Cerrado using time series of remote sensing imagery. Big Earth Data 2025, 9, 473–504. [Google Scholar] [CrossRef]
  33. Souza, C.M., Jr.; Shimbo, J.Z.; Rosa, M.R.; Parente, L.L.; Alencar, A.A.; Rudorff, B.F.; Hasenack, H.; Matsumoto, M.; Ferreira, L.G.; Souza-Filho, P.W.M.; et al. Reconstructing three decades of land use and land cover changes in brazilian biomes with landsat archive and earth engine. Remote Sens. 2020, 12, 2735. [Google Scholar] [CrossRef]
  34. MapBiomas Project. Collection 5 of the Annual Land Cover and Land Use Maps of Brazil (1985–2019). 2024. Available online: https://brasil.mapbiomas.org/produtos/ (accessed on 1 October 2020).
  35. Carvalho, A.A.; Lopes, I.; da Silva, O.F. Tendências observadas na precipitação sobre a Bacia do Riacho do Navio (Pernambuco). Anuário Do Inst. De Geociências 2019, 42, 56–70. [Google Scholar] [CrossRef]
  36. Bezerra, A.C.; Silva, J.L.B.; Moura, G.B.A.; Lopes, P.M.O.; Nascimento, C.R.; Ribeiro, E.P.; Galvíncio, J.D.; da Silva, M.V. Dynamics of land cover and land use in Pernambuco (Brazil): Spatio-temporal variability and temporal trends of biophysical parameters. Remote Sens. Appl. Soc. Environ. 2022, 25, 100677. [Google Scholar] [CrossRef]
  37. Dong, D.; Zhang, R.; Guo, W.; Gong, D.; Zhao, Z.; Zhou, Y.; Xu, Y.; Fujioka, Y. Assessing Spatiotemporal Dynamics of Net Primary Productivity in Shandong Province, China (2001–2020) Using the CASA Model and Google Earth Engine: Trends, Patterns, and Driving Factors. Remote Sens. 2025, 17, 488. [Google Scholar] [CrossRef]
  38. Wang, S.; Grant, R.F.; Verseghy, D.L.; Black, T.A. Modelling Plant Carbon and Nitrogen Dynamics of a Boreal Aspen Forest in CLASS-The Canadian Land Surface Scheme. Ecol. Model. 2001, 142, 135–154. [Google Scholar] [CrossRef]
  39. Tasumi, M.; Allen, R.G.; Trezza, R. At-Surface Reflectance and Albedo from Satellite for Operational Calculation of Land Surface Energy Balance. J. Hydrol. Eng. 2008, 13, 51–63. [Google Scholar] [CrossRef]
  40. Silva, B.B.D.; Braga, A.C.; Braga, C.C.; de Oliveira, L.M.; Montenegro, S.M.; Barbosa Junior, B. Procedures for calculation of the albedo with OLI-Landsat 8 images: Application to the Brazilian semi-arid. Rev. Bras. Eng. Agrícola Ambient. 2016, 20, 3–8. [Google Scholar] [CrossRef]
  41. Zheng, L.; Qi, Y.; Qin, Z.; Xu, X.; Dong, J. Assessing Albedo Dynamics and Its Environmental Controls of Grasslands over the Tibetan Plateau. Agric. For. Meteorol. 2021, 307, 108479. [Google Scholar] [CrossRef]
  42. IBGE. Instituto Brasileiro de Geografia e Estatística. Biomas e Sistema Costeiro-Marinho do Brasil: Compatível Com A Escala 1:250000/IBGE. In Relatórios Metodológicos; Coordenação de Recursos Naturais e Estudos Ambientais: Rio de Janeiro, Brasil, 2019; Volume 45, p. 164. [Google Scholar]
  43. Alvares, C.A.; Stape, J.L.; Sentelhas, P.C.; De Moraes Gonçalves, J.L.; Sparovek, G. Köppen’s Climate Classification Map for Brazil. Meteorol. Z. 2013, 22, 711–728. [Google Scholar] [CrossRef]
  44. Correia Filho, W.L.F.; Oliveira-Júnior, J.F.; Santiago, D.B.; Terassi, P.M.B.; Teodoro, P.E.; Gois, G.; Blanco, C.J.C.; Souza, P.H.A.; Costa Mda, S.; Gomes, H.B.; et al. Rainfall variability in the Brazilian northeast biomes and their interactions with meteorological systems and ENSO via CHELSA product. Big Earth Data 2019, 3, 315–337. [Google Scholar] [CrossRef]
  45. Ganem, K.A.; Xue, Y.; Dutra, A.C.; Pareyn, F.G.C.; Shimabukuro, Y.E. From rainforests to drylands: A context-specific framework for mapping LULC dynamics in Northeast Brazil (2000–2020). GIScience Remote Sens. 2025, 62, 2510140. [Google Scholar] [CrossRef]
  46. USGS. Landsat Collection 1 Level 1 Product Definition. 2017. Available online: https://www.usgs.gov/landsat-missions (accessed on 8 June 2025).
  47. Breiman, L. Random forests. In Machine Learning; Springer: Berlin/Heidelberg, Germany, 2001; Volume 45, pp. 5–32. [Google Scholar]
  48. IBGE. Banco de Dados E Informações Ambientais (BDiA)-Mapeamento de Recursos Naturais (MRN), Escala 1:250 000. 2023. Available online: https://bdiaweb.ibge.gov.br/#/home. (accessed on 1 September 2024).
  49. NASA JPL. NASADEM Merged DEM Global 1 Arc Second V001. NASA EOSDIS Land Processes DAAC, 2020. Available online: https://www.earthdata.nasa.gov/data/catalog/lpcloud-nasadem-hgt-001 (accessed on 8 June 2025).
  50. Stehman, S.V.; Foody, G.M. Key issues in rigorous accuracy assessment of land cover products. Remote Sens. Environ. 2019, 231, 111199. [Google Scholar] [CrossRef]
  51. Stehman, S.V. Estimating area and map accuracy for stratified random sampling when the strata are different from the map classes. Int. J. Remote Sens. 2014, 35, 4923–4939. [Google Scholar] [CrossRef]
  52. Olofsson, P.; Foody, G.M.; Herold, M.; Stehman, S.V.; Woodcock, C.E.; Wulder, M.A. Good practices for estimating area and assessing accuracy of land change. Remote Sens. Environ. 2014, 148, 42–57. [Google Scholar] [CrossRef]
  53. MapBiomas Project. Collection 9 of the Annual Land Cover and Land Use Maps of Brazil (1985–2019). 2025. Available online: https://mapbiomas.org/ (accessed on 8 June 2025).
  54. Pontius, R.G.; Millones, M. Death to Kappa: Birth of Quantity Disagreement and Allocation Disagreement for Accuracy Assessment. Int. J. Remote Sens. 2011, 32, 4407–4429. [Google Scholar] [CrossRef]
  55. USGS/NASA. United States Geological Survey/National Aeronautics and Space Administration. Landsat Satellite Missions. Available online: https://www.usgs.gov/land-resources/nli/landsat/landsat-satellite-missions (accessed on 1 June 2025).
  56. Nagler, P.L.; Inoue, Y.; Glenn, E.P.; Russ, A.L.; Daughtry, C.S.T. Cellulose absorption index (CAI) to quantify mixed soil–plant litter scenes. Remote Sens. Environ. 2003, 87, 310–325. [Google Scholar] [CrossRef]
  57. Parente, L.; Ferreira, L. Assessing the Spatial and Occupation Dynamics of the Brazilian Pasturelands Based on the Automated Classification of MODIS Images from 2000 to 2016. Remote Sens. 2018, 10, 606. [Google Scholar] [CrossRef]
  58. Burke, M.; Lobell, D.B. Satellite-based assessment of yield variation and its determinants in smallholder African systems. Proc. Natl. Acad. Sci. USA 2017, 114, 2189–2194. [Google Scholar] [CrossRef]
  59. Hall, R.J.; Skakun, R.S.; Arsenault, E.J.; Case, B.S. Modeling forest stand structure attributes using Landsat ETM+ data: Application to mapping of aboveground biomass and stand volume. For. Ecol. Manag. 2006, 225, 378–390. [Google Scholar] [CrossRef]
  60. Rouse, R.W.H.; Haas, J.A.W.; Deering, D.W. Monitoring Vegetation Systems in the Great Plains with ERTS. Third Earth Resources Technology Satellite (ERTS) Symposium 1974, 309–317. Available online: https://ntrs.nasa.gov/api/citations/19730017588/downloads/19730017588.pdf (accessed on 19 August 2024).
  61. Gao, B.C. NDWI-A normalized difference water index for remote sensing of vegetation liquid water from space. Remote Sens. Environ. 1996, 58, 257–266. [Google Scholar] [CrossRef]
  62. Gamon, J.A.; Penuelas, J.; Field, C.B. A narrow-waveband spectral index that tracks diurnal changes in photosynthetic efficiency. Remote Sens. Environ. 1992, 41, 35–44. [Google Scholar] [CrossRef]
  63. Huete, A.R. A soil-adjusted vegetation index (SAVI). Remote Sens. Environ. 1988, 25, 295–309. [Google Scholar] [CrossRef]
  64. Souza, C.M.; Roberts, D.A.; Cochrane, M.A. Combining spectral and spatial information to map canopy damage from selective logging and forest fires. Remote Sens. Environ. 2005, 98, 329–343. [Google Scholar] [CrossRef]
  65. Housman, I.; Chastain, R.; Finco, M. An Evaluation of Forest Health Insect and Disease Survey Data and Satellite-Based Remote Sensing Forest Change Detection Methods: Case Studies in the United States. Remote Sens. 2018, 10, 1184. [Google Scholar] [CrossRef]
  66. Alencar, A.; Shimbo, J.Z.; Lenti, F.; Marques, C.B.; Zimbres, B.; Rosa, M.; Arruda, V.; Castro, I.; Ribeiro, J.P.F.M.; Varela, V.; et al. Mapping Three Decades of Changes in the Brazilian Savanna Native Vegetation Using Landsat Data Processed in the Google Earth Engine Platform. Remote Sens. 2020, 12, 924. [Google Scholar] [CrossRef]
  67. Rosa, M.R. Metodologia de Classificação de Uso E Cobertura da Terra Para Análise de Três Décadas de Ganho E Perda Anual da Cobertura Florestal Nativa Na Mata Atlântica. Ph.D. Thesis, Universidade de São Paulo, São Paulo, Brasil, 2020. [Google Scholar]
  68. Tadono, T.; Ishida, H.; Oda, F.; Naito, S.; Minakawa, K.; Iwamoto, H. Precise Global DEM Generation by ALOS PRISM. ISPRS Ann. Photogramm. Remote Sens. Spatial Inf. Sci. 2014, 2, 71–76. [Google Scholar] [CrossRef]
  69. Wang, J.; Bretz, M.; Dewan, M.A.A.; Delavar, M.A. Machine learning in modelling land-use and land cover-change (LULCC): Current status, challenges and prospects. Sci. Total Environ. 2022, 822, 153559. [Google Scholar] [CrossRef]
  70. Rosa, M.R.; Brancalion, P.H.S.; Crouzeilles, R.; Tambosi, L.R.; Piffer, P.R.; Lenti, F.E.B.; Hirota, M.; Santiami, E.; Metzger, J.P. Hidden Destruction of Older Forests Threatens Brazil’s Atlantic Forest and Challenges Restoration Programs. Sci. Adv. 2021, 7, eabc4547. [Google Scholar] [CrossRef]
  71. Souza, C.M.; Oliveira, L.A.; de Souza Filho, J.S.; Ferreira, B.G.; Fonseca, A.V.; Siqueira, J.V. Landsat Sub-Pixel Land Cover Dynamics in the Brazilian Amazon. Front. For. Glob. Change 2023, 6, 1294552. [Google Scholar] [CrossRef]
  72. Baeza, S.; Vélez-Martin, E.; de Abelleyra, D.; Banchero, S.; Gallego, F.; Schirmbeck, J.; Veron, S.; Vallejos, M.; Weber, E.; Oyarzabal, M.; et al. Two decades of land cover mapping in the Río de la Plata grassland region: The MapBiomas Pampa initiative. Remote Sens. Appl. Soc. Environ. 2022, 28, 100834. [Google Scholar] [CrossRef]
  73. Santos, C.O.D.; Mesquita, V.V.; Parente, L.L.; Pinto, A.D.S.; Ferreira, L.G., Jr. Assessing the wall-to-wall spatial and qualitative dynamics of the Brazilian pasturelands 2010–2018, based on the analysis of the Landsat data archive. Remote Sens. 2022, 14, 1024. [Google Scholar] [CrossRef]
  74. Saraiva, M.; Protas, É.; Salgado, M.; Souza, C. Automatic Mapping of Center Pivot Irrigation Systems from Satellite Images Using Deep Learning. Remote Sens. 2020, 12, 558. [Google Scholar] [CrossRef]
  75. Souza, C.M.; Kirchhoff, F.T.; Oliveira, B.C.; Ribeiro, J.G.; Sales, M.H. Long-Term Annual Surface Water Change in the Brazilian Amazon Biome: Potential Links with Deforestation, Infrastructure Development and Climate Change. Water 2019, 11, 566. [Google Scholar] [CrossRef]
  76. Feitosa, J.D.N.A.; Coelho, C.F.; Silva, R.C.C.; Ribeiro, A.T.; Simplicio, A.A.F. Land Use and Land Cover Mapping of the Saco River’s Watershed, State of Maranhão, Brazil. Rev. Bras. Cienc. Ambient. 2024, 59, e2127. [Google Scholar] [CrossRef]
  77. Nunes, S.; Oliveira, L.; Siqueira, J.; Morton, D.C.; Souza, C.M. Unmasking secondary vegetation dynamics in the Brazilian Amazon. Environ. Res. Lett. 2020, 15, 034057. [Google Scholar] [CrossRef]
  78. Mann, H.B. Non-Parametric Test Against Trend. Econometrica 1945, 13, 245–259. [Google Scholar] [CrossRef]
  79. Kendall, M.G. Rank Correlation Methods; Charles Griffin: London, UK, 1975; p. 199. [Google Scholar]
  80. Sen, P.K. Estimates of the Regression Coefficient Based on Kendall’s Tau. J. Am. Stat. Assoc. 1968, 63, 1379–1389. [Google Scholar] [CrossRef]
  81. Guo, J.; Shen, B.; Li, H.; Wang, Y.; Tuvshintogtokh, I.; Niu, J.; Potter, M.A.; Li, F.Y. Past dynamics and future prediction of the impacts of land use cover change and climate change on landscape ecological risk across the Mongolian plateau. J. Environ. Manag. 2024, 355, 120365. [Google Scholar] [CrossRef]
  82. Sneyers, R. On the Statistical Analysis of Series of Observations; Technical Note; World Meteorological Organization: Geneva, Switzerland, 1991; Volume 143, p. 192. ISBN 978-92-63-10415-1. CABI Record Number: 19912451385. [Google Scholar]
  83. Miura, Y.; Nakaegawa, T. Long-Term Experimental Evaluation of a High-Resolution Atmospheric General Circulation Model From a Hydrological Perspective. J. Geophys. Res. Atmos. 2024, 129, e2023JD038786. [Google Scholar] [CrossRef]
  84. Hamed, K.H.; Rao, A. Ramachandra. A Modified Mann-Kendall Trend Test for Autocorrelated Data. J. Hydrol. 1998, 204, 182–196. [Google Scholar] [CrossRef]
  85. Gilbert, R.O. Statistical Methods for Environmental Pollution Monitoring; John Wiley & Sons: New York, NY, USA, 1987; p. 257. [Google Scholar]
  86. Santos, C.A.G.; do Nascimento, T.V.M.; da Silva, R.M. Analysis of forest cover changes and trends in the Brazilian semiarid region between 2000 and 2018. Environ. Earth Sci. 2020, 79, 418. [Google Scholar] [CrossRef]
  87. Sparsha, S.; Parida, B.R. Vegetation browning trend progressively leading to forest degradation in eastern himalaya in response to climatic and anthropogenic drivers. Remote Sens. Appl. Soc. Environ. 2024, 35, 101209. [Google Scholar] [CrossRef]
  88. Pandey, V.; Pandey, P.K.; Chakma, B.; Ranjan, P. Influence of short- and long-term persistence on identification of rainfall temporal trends using different versions of the Mann-Kendall test in Mizoram, Northeast India. Environ. Sci. Pollut. Res. 2024, 31, 10359–10378. [Google Scholar] [CrossRef] [PubMed]
  89. Qadem, Z.; Tayfur, G. In-Depth Exploration of Temperature Trends in Morocco: Combining Traditional Methods of Mann Kendall with Innovative ITA and IPTA Approaches. Pure Appl. Geophys. 2024, 181, 2717–2739. [Google Scholar] [CrossRef]
  90. Abubakar, M.L.; Ahmed, M.S.; Abdussalam, A.F.; Mohammed, S. Meteorological drought and long-term trends and spatial variability of rainfall in the Niger River Basin, Nigeria. Environ. Sci. Pollut. Res. 2025, 32, 5302–5319. [Google Scholar] [CrossRef]
  91. Dong, L.; Wang, X. Inconsistent Influence of Temperature, Precipitation, and CO2 Variations on the Plateau Alpine Vegetation Carbon Flux. npj Clim. Atmos. Sci. 2025, 8, 91. [Google Scholar] [CrossRef]
  92. Jardim, A.M.R.F.; da Silva, M.V.; Silva, A.R.; Santos, A.D.; Pandorfi, H.; de Oliveira-Júnior, J.F.; de Lima, J.L.M.P.; de Souza, L.S.B.; Júnior, G.D.N.A.; Lopes, P.M.O.; et al. Spatiotemporal Climatic Analysis in Pernambuco State, Northeast Brazil. J. Atmos. Sol.-Terr. Phys. 2021, 223, 105733. [Google Scholar] [CrossRef]
  93. TRMM. Tropical Rainfall Measuring Mission. In (TMPA/3B43) Rainfall Estimate L3 1 Month 0.25 Degree × 0.25 Degree V7; Goddard Earth Sciences Data and Information Services Center (GES DISC): Greenbelt, MD, USA, 2011. [Google Scholar] [CrossRef]
  94. Wang, X.; Ding, Y.; Zhao, C.; Wang, J. Similarities and improvements of GPM IMERG upon TRMM 3B42 precipitation product under complex topographic and climatic conditions over Hexi region, Northeastern Tibetan Plateau. Atmos. Res. 2019, 218, 347–363. [Google Scholar] [CrossRef]
  95. Pan, X.; Wu, H.; Chen, S.; Nanding, N.; Huang, Z.; Chen, W.; Li, C.; Li, X. Evaluation and Applicability Analysis of GPM Satellite Precipitation over Mainland China. Remote Sens. 2023, 15, 2866. [Google Scholar] [CrossRef]
  96. NASA/JAXA/TRMM. National Aeronautics and Space Administration/Japan Aerospace Exploration Agency/Tropical Rainfall Measuring Mission. The Tropical Rainfall Measuring Mission (TRMM). 2024. Available online: https://trmm.gsfc.nasa.gov/ (accessed on 10 January 2021).
  97. Huffman, G.J.; Adler, R.F.; Bolvin, D.T.; Nelkin, E.J. The TRMM multi-satellite precipitation analysis (TMPA). In Satellite Rainfall Applications for Surface Hydrology; Springer: Dordrecht, The Netherlands, 2009; pp. 3–22. [Google Scholar] [CrossRef]
  98. Brasil Neto, R.M.; Santos, C.A.G.; Nascimento, T.V.M.D.; Silva, R.M.D.; Santos, C.A.C. Evaluation of the TRMM product for monitoring drought over Paraíba State, northeastern Brazil: A statistical analysis. Remote Sens. 2020, 12, 2184. [Google Scholar] [CrossRef]
  99. Mo, S.; Zhao, P.; Zhao, C.; Xiao, H.; Wang, Y.; Zhang, P.; Wen, X.; Qiu, S. Climatic precipitation efficiency and its dependence on environmental factors over the Sichuan Basin and adjacent regions, Southwest China. Theor. Appl. Climatol. 2024, 155, 3613–3629. [Google Scholar] [CrossRef]
  100. NASA/GIOVANNI. National Aeronautics and Space Administration/Giovanni. Giovanni Measurement Definitions: Precipitation. 2024. Available online: https://giovanni.gsfc.nasa.gov/giovanni/ (accessed on 10 January 2021).
  101. Silva, J.L.B.; de Albuquerque Moura, G.B.; da Silva, M.V.; Lopes, P.M.O.; de Souza Guedes, R.V.; de França e Silva, Ê.F.; Ortiz, P.F.S.; de Moraes Rodrigues, J.A. Changes in the Water Resources, Soil Use and Spatial Dynamics of Caatinga Vegetation Cover over Semiarid Region of the Brazilian Northeast. Remote Sens. Appl. Soc. Environ. 2020, 20, 100372. [Google Scholar] [CrossRef]
  102. Luiz-Silva, W.; Oscar-Júnior, A.C.; Cavalcanti, I.F.A.; Treistman, F. An Overview of Precipitation Climatology in Brazil: Space-Time Variability of Frequency and Intensity Associated with Atmospheric Systems. Hydrol. Sci. J. 2021, 66, 289–308. [Google Scholar] [CrossRef]
  103. Sabareeshwari, V.; Mary, P.C.N.; Mahendran, P.P.; Pandian, P.S.; Gurusamy, A.; Subhashini, R. Kriging: An Advanced Geostatistical Tool to Interpolate the Textural Variation Influences the Yield and Productivity of Tapioca (Manihot Esculenta) in Namakkal District, Tamil Nadu, India. Int. J. Plant Soil Sci. 2021, 33, 53–59. [Google Scholar] [CrossRef]
  104. Justice, C.O.; Giglio, L.; Korontzi, S.; Owens, J.; Morisette, J.T.; Roy, D.; Descloitres, J.; Alleaume, S.; Petitcolin, F.; Kaufman, Y. The MODIS Fire Products. Remote Sens. Environ. 2002, 83, 244–262. [Google Scholar] [CrossRef]
  105. NASA/MODIS. National Aeronautics and Space Administration/Moderate Resolution Imaging Spectroradiometer. Data Products. MODIS Surface Reflectance Products. 2024. Available online: https://modis.gsfc.nasa.gov/data/dataprod/mod09.php (accessed on 2 January 2021).
  106. Vermote, E.F.; Roger, J.C.; Ray, J.P. MOD09A1 MODIS Surface Reflectance 8-Day L3 Global 500m SIN Grid V006. In NASA EOSDIS Land Processes DAAC (For Collection 6); National Aeronautics and Space Administration: Washington, DC, USA, 2015; Version 1.4; p. 35. [Google Scholar] [CrossRef]
  107. Helmer, E.; Goodwin, N.R.; Gond, V.; Souza, C.M.; Asner, G.P. Characterizing tropical forests with multispectral imagery. In Remote Sensing Handbook, 2nd ed.; CRC Press: Boca Raton, FL, USA, 2025; Volume 4, pp. 3–46. [Google Scholar] [CrossRef]
  108. Allen, R.G.; Tasumi, M.; Morse, A.; Trezza, R.; Wright, J.L.; Bastiaanssen, W.; Kramber, W.; Lorite, I.; Robison, C.W. Satellite-Based Energy Balance for Mapping Evapotranspiration with Internalized Calibration (METRIC)—Applications. J. Irrig. Drain. Eng. 2007, 133, 395–406. [Google Scholar] [CrossRef]
  109. Gorelick, N.; Hancher, M.; Dixon, M.; Ilyushchenko, S.; Thau, D.; Moore, R. Google Earth Engine: Planetary-Scale Geospatial Analysis for Everyone. Remote Sens. Environ. 2017, 202, 18–27. [Google Scholar] [CrossRef]
  110. Kaiser, H.F. The Varimax Criterion for Analytic Rotation in Factor Analysis. Psychometrika 1958, 23, 187–200. [Google Scholar] [CrossRef]
  111. Warrick, A.W.; Nielsen, D.R. Spatial variability of soil physical properties in the field. In Applications of Soil Physics; Hillel, D., Ed.; Academic Press: Cambridge, MA, USA, 1980; p. 350. [Google Scholar]
  112. R Core Team. _R: A Language and Environment for Statistical Computing_. R Foundation for Statistical Computing, Vienna, Austria, 2024. Available online: https://www.R-project.org/ (accessed on 10 January 2025).
  113. Collaud Coen, M.; Andrews, E.; Bigi, A.; Martucci, G.; Romanens, G.; Vogt, F.P.; Vuilleumier, L. Effects of the prewhitening method, the time granularity, and the time segmentation on the Mann–Kendall trend detection and the associated Sen’s slope. Atmos. Meas. Tech. 2020, 13, 6945–6964. [Google Scholar] [CrossRef]
  114. Masaev, S.; Ivanitskiy, N.; Oreshnikov, I. Application of the CANARSPI control method for a digital twin of an enterprise by the Durbin-Watson test. AIP Conf. Proc. 2025, 3268, 040037. [Google Scholar] [CrossRef]
  115. Larsen, R.; Warne, R.T. Estimating Confidence Intervals for Eigenvalues in Exploratory Factor Analysis. Behav. Res. Methods 2010, 42, 871–876. [Google Scholar] [CrossRef] [PubMed]
  116. Shafizadeh-Moghadam, H.; Khazaei, M.; Alavipanah, S.K.; Weng, Q. Google Earth Engine for Large-Scale Land Use and Land Cover Mapping: An Object-Based Classification Approach Using Spectral, Textural and Topographical Factors. GIScience Remote Sens. 2021, 58, 914–928. [Google Scholar] [CrossRef]
  117. Amini, S.; Saber, M.; Rabiei-Dastjerdi, H.; Homayouni, S. Urban Land Use and Land Cover Change Analysis Using Random Forest Classification of Landsat Time Series. Remote Sens. 2022, 14, 2654. [Google Scholar] [CrossRef]
  118. Klinkovská, K.; Sperandii, M.G.; Knollová, I.; Danihelka, J.; Hájek, M.; Hájková, P.; Hroudová, Z.; Jiroušek, M.; Lepš, J.; Navrátilová, J.; et al. Half a Century of Temperate Non-Forest Vegetation Changes: No Net Loss in Species Richness, but Considerable Shifts in Taxonomic and Functional Composition. Glob. Change Biol. 2025, 31, e70030. [Google Scholar] [CrossRef] [PubMed]
  119. Zhu, Y.; Ye, A.; Zhang, Y. Water body seasonality reveals the dominant role of human activity across the Yangtze River Basin in China. J. Hydrol. 2025, 653, 132759. [Google Scholar] [CrossRef]
  120. Segura-Garcia, C.; Bauman, D.; Arruda, V.L.S.; Alencar, A.A.C. Human land occupation regulates the effect of the climate on the burned area of the Brazilian Cerrado. Commun. Earth Environ. 2024, 5, 382. [Google Scholar] [CrossRef]
  121. Marengo, J.A.; Jimenez, J.C.; Espinoza, J.-C.; Cunha, A.P.; Aragão, L.E.O.C. Increased climate pressure on the agricultural frontier in the Eastern Amazonia–Cerrado transition zone. Sci. Rep. 2022, 12, 457. [Google Scholar] [CrossRef]
  122. Lemes, M.R.; Sampaio, G.; Garcia-Carreras, L.; Fisch, G.; Alves, L.M.; Bassett, R.; Betts, R.; Maksic, J.; Shimizu, M.H.; Torres, R.R.; et al. Impacts on South America moisture transport under Amazon deforestation and 2 °C global warming. Sci. Total Environ. 2023, 905, 167407. [Google Scholar] [CrossRef]
  123. Butt, E.W.; Baker, J.C.; Bezerra, F.G.; von Randow, C.; Aguiar, A.P.; Spracklen, D.V. Amazon deforestation causes strong regional warming. Proc. Natl. Acad. Sci. USA 2023, 120, e2309123120. [Google Scholar] [CrossRef]
  124. Silva, J.L.B.; Bezerra, A.C.; Moura, G.B.A.; Jardim, A.M.D.R.F.; Batista, P.H.D.; Jesus, F.L.F.; Sanches, A.C.; da Silva, M.V. Spatiotemporal dynamics of agricultural areas with central pivot using orbital remote sensing in the Brazilian semiarid. Smart Agric. Technol. 2022, 2, 100052. [Google Scholar] [CrossRef]
  125. PRODES/INPE. Monitoramento da Floresta Amazônica Brasileira Por Satélite/Instituto Nacional de Pesquisas Espaciais. Mapa de Desmatamento. Available online: http://terrabrasilis.dpi.inpe.br/app/map/deforestation?hl=pt-br (accessed on 10 January 2021).
  126. Sayedi, S.S.; Abbott, B.W.; Vannière, B.; Leys, B.; Colombaroli, D.; Romera, G.G.; Słowiński, M.; Aleman, J.C.; Blarquez, O.; Feurdean, A.; et al. Assessing changes in global fire regimes. Fire Ecol. 2024, 20, 18. [Google Scholar] [CrossRef]
  127. Martins, S.F.S.; Santos, A.M.; Silva, C.F.A.; Rudke, A.P. The drivers of fire in the Caatinga biome in Brazil. For. Ecol. Manag. 2024, 572, 122260. [Google Scholar] [CrossRef]
  128. Vasconcelos, R.N.; de Santana, M.M.M.; Costa, D.P.; Duverger, S.G.; Ferreira-Ferreira, J.; Oliveira, M.; Barbosa, L.S.; Cordeiro, C.L.; Franca Rocha, W.J.S. Machine learning model reveals land use and climate’s role in Caatinga wildfires: Present and future scenarios. Fire 2025, 8, 8. [Google Scholar] [CrossRef]
  129. Khan, M.; Chen, R. Assessing the Impact of Land Use and Land Cover Change on Environmental Parameters in Khyber Pakhtunkhwa, Pakistan: A Comprehensive Study and Future Projections. Remote Sens. 2025, 17, 170. [Google Scholar] [CrossRef]
  130. Silva, N.C.D.; Santos, R.C.; Zucca, R.; Geisenhoff, L.O.; Cesca, R.S.; Lovatto, J. Enthalpy thematic map interpolated with spline method for management of broiler chicken production. Rev. Bras. De Eng. Agrícola E Ambient. 2020, 24, 431–436. [Google Scholar] [CrossRef]
  131. Justino, S.T.P.; Silva, R.B.; Guerrini, I.A.; da Silva, R.B.G.; Simões, D. Monitoring Environmental Degradation and Spatial Changes in Vegetation and Water Resources in the Brazilian Pantanal. Sustainability 2025, 17, 51. [Google Scholar] [CrossRef]
  132. Uchôa, S.C.P.; de Souza Farage, S.; Alves, J.M.A.; de Matos, C.H.L.; do Nascimento Tavares, I.; Melo, V.F. Impacts of Replacing the Amazon Rainforest with Pasture on Soil Properties. Rev. Agric. Neotrop. 2025, 12, 1–9. [Google Scholar] [CrossRef]
  133. Araujo, A.S.F.; de Medeiros, E.V.; da Costa, D.P.; Mendes, L.W.; Cherubin, M.R.; de Alcantara Neto, F.; Beirigo, R.M.; Lambais, G.R.; Melo, V.M.M.; Nobrega, G.G.; et al. Caatinga Microbiome Initiative: Disentangling the Soil Microbiome across Areas under Desertification and Restoration in the Brazilian Drylands. Restor. Ecol. 2024, 33, e14298. [Google Scholar] [CrossRef]
  134. Yoon, A.; Hohenegger, C. Muted Amazon Rainfall Response to Deforestation in a Global Storm-Resolving Model. Geophys. Res. Lett. 2025, 52, e2024GL110503. [Google Scholar] [CrossRef]
  135. Rodrigues, I.S.; Rodrigues, G.P.; Costa, C.A.G.; Hopkinson, C.; de Araújo, J.C. Connectivity of evapotranspiration processes in a Brazilian dryland reservoir using remote sensing. Agric. For. Meteorol. 2024, 351, 110017. [Google Scholar] [CrossRef]
  136. Hastenrath, S. Exploring the Climate Problems of Brazil’s Nordeste: A Review. Clim. Change 2012, 112, 243–251. [Google Scholar] [CrossRef]
  137. Mutti, P.R.; de Abreu, L.P.; de M. B. Andrade, L.; Spyrides, M.H.C.; Lima, K.C.; de Oliveira, C.P.; Dubreuil, V.; Bezerra, B.G. A Detailed Framework for the Characterization of Rainfall Climatology in Semiarid Watersheds. Theor. Appl. Climatol. 2020, 139, 109–125. [Google Scholar] [CrossRef]
  138. Franchito, S.H.; Rao, V.B.; Vasques, A.C.; Santo, C.M.E.; Conforte, J.C. Validation of TRMM Precipitation Radar Monthly Rainfall Estimates over Brazil. J. Geophys. Res. Atmos. 2009, 114, D2. [Google Scholar] [CrossRef]
  139. Moraes, R.B.F.D.; Gonçalves, F.V. Validation of TRMM data in the geographical regions of Brazil. Rev. Bras. De Recur. Hídricos 2021, 26, e36. [Google Scholar] [CrossRef]
  140. Ali, M.H.; Bertini, C.; Popescu, I.; Jonoski, A. Comparative Analysis of Hydrological Impacts from Climate and Land Use/Land Cover Changes in a Lowland Mesoscale Catchment. Int. J. River Basin Manag. 2025, 23, 1–19. [Google Scholar] [CrossRef]
  141. Brasil Neto, R.M.; Santos, C.A.G.; Silva, R.M.; Santos, C.A.C. Evaluation of TRMM satellite dataset for monitoring meteorological drought in northeastern Brazil. Hydrol. Sci. J. 2022, 67, 2100–2120. [Google Scholar] [CrossRef]
  142. Ballarin, A.S.; Vargas Godoy, M.R.; Zaerpour, M.; Abdelmoaty, H.M.; Hatami, S.; Gavasso-Rita, Y.L.; Wendland, E.; Papalexiou, S.M. Drought Intensification in Brazilian Catchments: Implications for Water and Land Management. Environ. Res. Lett. 2024, 19, 054030. [Google Scholar] [CrossRef]
  143. Zhang, Z.; Chang, J.; Xu, C.Y.; Zhou, Y.; Wu, Y.; Chen, X.; Jiang, S.; Duan, Z. The Response of Lake Area and Vegetation Cover Variations to Climate Change over the Qinghai-Tibetan Plateau during the Past 30 Years. Sci. Total Environ. 2018, 635, 443–451. [Google Scholar] [CrossRef]
Figure 1. Spatial location of the study area, Northeastern Brazil (NEB), with emphasis on the location at national and continental level (a), also emphasizing the LULC (b) and elevation (c) data from NEB.
Land 14 01954 g001
Figure 2. Methodological steps of geospatial processing and classification of LULC data, highlighting the set of mosaics, classifiers/algorithms, spatiotemporal filters, pixel-by-pixel integration, zonal statistics and data accuracy analysis.
Land 14 01954 g002
Figure 3. Spatial distribution of the biomes comprising the NEB and the precipitation estimate pixel grid (a), and the estimated surface forecast applying interpolation, highlighting the surface weather stations (b).
Land 14 01954 g003
Figure 4. Conditions of spatiotemporal changes in the land use and land cover (LULC) in Northeastern Brazil (NEB), from 2000 to 2019.
Land 14 01954 g004
Figure 5. Spatiotemporal distribution of surface albedo in Northeastern Brazil (NEB), from 2000 to 2019.
Land 14 01954 g005
Figure 6. Comparison of land use and land cover (LULC) change patterns in the Northwest (Cut-out A) and North (Cut-out B) areas in Northeastern Brazil (NEB) between the specific years of 2000 and 2019.
Land 14 01954 g006
Figure 7. Comparison of surface albedo change patterns in the Northwest (Cut-out A) and North (Cut-out B) areas in Northeastern Brazil (NEB) between the specific years of 2000 and 2019.
Land 14 01954 g007
Figure 8. Comparison of land use and land cover (LULC) change patterns in the Western (Cut-out C) and Southwestern (Cut-out D) areas in Northeastern Brazil (NEB) between the specific years of 2000 and 2019.
Land 14 01954 g008
Figure 9. Comparison of surface albedo change patterns in the Western (Cut-out C) and Southwestern (Cut-out D) areas in Northeastern Brazil (NEB) between the specific years of 2000 and 2019.
Land 14 01954 g009
Figure 10. Statistical validation of the TRMM_3B43v7 precipitation dataset (mm year−1) against surface rainfall data recorded for the NEB region, between 2000 and 2019.
Land 14 01954 g010
Figure 11. Time series and trend lines for forest (a), non-forest natural (b), farming (c), non-vegetated area (d), and water (e) areas, as well as rainfall (f) for the Northeastern Brazil (NEB) from 2000 to 2019. The gray hatched area represents the 99% and 95% confidence interval of the linear trend line.
Land 14 01954 g011
Figure 12. Multivariate principal component analysis (a) and correlation analysis (b) for the temporal series of LULC data and rainfall from 2000 to 2019 in Northeast Brazil (NEB).
Land 14 01954 g012
Table 1. Landsat satellite series multispectral bands and statistical reducers for LULC classification.
SatelliteMultispectral BandBand DescriptionWavelength (μm)Statistical Reducers per Band
Landsat-5
TM and Landsat-7
ETM+
B1 Blue0.45–0.52Minimum;
Annual median;
Dry season median;
Rainy season median;
Standard deviation
B2 Green0.52–0.60
B3 Red0.63–0.69
B4 Near infrared—NIR0.76–0.90
B5 Shortwave infrared 1—SWIR11.55–1.75
B6 Thermal infrared10.40–12.50
B7 Shortwave infrared 2—SWIR22.08–2.35
Landsat-8
OLI/TIRS
B2 Blue0.45–0.51
B3 Green0.53–0.59
B4 Red0.64–0.67
B5 Near infrared—NIR0.85–0.88
B6 Shortwave infrared 2—SWIR11.57–1.65
B7 Shortwave infrared 2—SWIR22.11–2.29
B10 Thermal infrared10.60–11.19
Source: Adapted from USGS/NASA [55].
Table 2. Subset of the feature space from the Landsat image mosaic classification, highlighting spectral and surface indices and predictor variables used for LULC classification.
Spectral IndexEquationSource/AuthorsStatistical Reducers per Band
Cellulose Absorption Index—CAICAI = SWIR2/SWIR1Nagler et al. [56]Amplitude;
Maximum;
Minimum;
Annual median;
Dry season median;
Rainy season median;
Standard deviation
Enhanced Vegetation Index 2—EVI 2EVI 2 = 2.5 × (NIR − Red)/(NIR + 2.4 × Red + 1)Parente et al. [57]
Green Chlorophyll Vegetation Index—GCVIGCVI = (NIR/Green − 1)Burke et al. [58]
Hall CoverHall Cover = (– Red × 0.017 − NIR × 0.007 − SWIR2 × 0.079 + 5.22)Hall et al.
[59]
Normalized Difference Vegetation Index—NDVINDVI = (NIR − Red)/(NIR + Red)Rouse et al. [60]
Normalized Difference Water Index—NDWINDWI = (NIR − SWIR1)/(NIR + SWIR1)Gao et al.
[61]
Normalized Difference Fraction Index—NDFINDFI = (GV − (NPV + SOIL))/(GV + NPV + SOIL)USGS
Photochemical Reflectance Index—PRIPRI = (Blue − Green)/(Blue + Green)Gamon et al. [62]
Soil-Adjusted Vegetation Index—SAVISAVI = 1.5 × (NIR − Red)/(NIR + Red + 0.5)Huete et al. [63]
Surface IndexEquationSource/AuthorsStatistical reducers per band
Hall’s Forest CoverHFC = −0.017 × RED − 0.007 × NIR − 0.079 × SWIR2 + 5.22-Annual median;
Dry season median;
Rainy season median
Hall’s Forest HeightHFH = −0.039 × RED − 0.011 × NIR − 0.026 × SWIR1 + 4.13-
Index/FractionEquationSource/AuthorsStatistical reducers per band
Green Vegetation Fraction—GVGV = Fractional abundance of green vegetation within the pixelSouza et al. [64]Amplitude;
Maximum;
Minimum;
Annual median;
Dry season median;
Rainy season median;
Standard deviation
Green Vegetation Shade Fraction—GVSGVS = GV/(GV + NPV + Soil + Cloud)Housman et al. [65]
Normalized Difference Fraction Index—NDFINDFI = (GVS − (NPV + Soil))/(GVS + (NPV + Soil))Souza et al. [64]
Non-photosynthetic Vegetation Fraction—NPVNPV = Fractional abundance of non-photosynthetic vegetation within the pixelSouza et al. [64]
Savanna Ecosystem Fraction Index—SEFISEFI = (GV + NPV_S − Soil)/(GV +
NPV_S + Soil)
Alencar et al. [66]
Shade Fraction—ShadeShade = 100 − (GV + NPV + Soil + Cloud)Housman et al. [65]
Soil Fraction—Soil)Soil = Fractional abundance of soil within the pixelSouza et al. [64]
Wetland Ecosystem Fraction Index—WEFIWEFI = ((GV + NPV) − (Soil + Shade))/((GV + NPV)) + (Soil + Shade))Rosa [67]
Spectral
Mixture Analysis
EquationSource/AuthorsStatistical reducers per band
Green VegetationGV = SMA(GV) × 100Fraction
from SMA
Annual median;
Standard deviation
SoilSOIL = SMA(Soil) × 100
Forest/Non-Forest
Index
FNS = 100 × (GVshade − SOIL)/(GVshade + SOIL) + 100Adapted
from NDFI
GVshade = GV + |GV + NPV + SOIL − 100|
Scaled
Water-Enhanced
Forest Index
WEFI = ((GV + NPV) − (SOIL + SHADE))/((GV + NPV) + (SOIL + SHADE)) × 100 + 100Fraction
from SMA
Land SlopeGlobal digital surface model: 30 mTadono et al. [68]
Source: Adapted from MapBiomas Project [69].
Table 3. MODIS surface reflectance product features with multispectral bands with wavelengths from 0.459 to 2.155 µm.
Band/MODISWavelengthSpatial
Resolution
(Meters)
Temporal
Resolution
(Days)
Radiometric Resolution
(Bits)
Processing
Level
Multiplier
Factor
(for Each Band)
rBLUE0.459–0.479 µm500816L30.0001
rGREEN0.545–0.565 µm
rRED0.620–0.670 µm
rNIR10.841–0.876 µm
rNIR21.230–1.250 µm
rSWIR11.628–1.652 µm
rSWIR22.105–2.155 µm
Table 4. Global accuracy statistics of the LULC classification for each NEB biome.
Biome/CollectionGlobal
Accuracy (%)
Area
Disagreement (%)
Allocation
Disagreement (%)
Caatinga81.83.514.7
Cerrado83.84.911.3
Atlantic Forest90.72.07.3
Amazon97.60.81.6
Collection 591.02.07.0
Table 5. Statistics of inclusion and omission errors in global data for each class of the LULC collection.
Inclusion Errors
Mapped ClassForestNon-Forest NaturalFarmingNon-Vegetated AreaWater
Forest0.93−0.02−0.04−0.0002−0.001
Non-forest natural−0.170.70−0.12−0.001−0.005
Farming−0.05−0.030.91−0.003−0.0009
Non-vegetated area−0.01−0.0052−0.030.950.00
Water−0.01−0.04−0.006−0.000020.94
Errors of omission
Forest0.96−0.02−0.02−0.00006−0.0002
Non-forest natural−0.190.68−0.12−0.0002−0.009
Farming−0.11−0.030.85−0.0005−0.00035
Non-vegetated area−0.02−0.02−0.200.76−0.00007
Water−0.05−0.02−0.010.000.91
Table 6. Descriptive and dispersion statistics, annual total quantitative data on land use and land cover (LULC) changing conditions in Northeastern Brazil (NEB) and average annual total rainfall from 2000 to 2019.
YearForestNon-Forest NaturalFarmingNon-Vegetated
Area
WaterNon
Observed
Rainfall
(TRMM)
Total Area of Classes: 1,553,402 km2mm Year−1
2000981,577.3390,468.03456,363.729826.7115,050.78115.411261
2001977,099.9591,018.30459,750.9410,732.9014,685.71114.19937
2002968,541.3690,650.87469,107.6410,865.8414,121.95114.331069
2003961,045.1788,843.80477,413.5310,749.3615,234.77115.35925
2004956,590.8486,963.71480,788.5510,788.4318,154.12116.351238
2005956,164.2885,964.77482,273.7011,083.9717,798.70116.511066
2006950,886.4783,349.65490,099.7510,972.0417,977.24116.841108
2007945,015.9284,166.35495,581.5710,915.8717,605.67116.61866
2008942,529.5383,239.95498,061.5511,188.7218,265.55116.691142
2009940,718.5382,260.09500,258.7911,490.7518,556.61117.221266
2010941,757.2983,572.40498,390.8211,757.7917,807.39116.30930
2011939,495.9284,562.89500,277.4111,580.4917,370.16115.111188
2012929,616.5787,419.77508,230.9511,613.8816,407.51113.32651
2013925,884.2287,341.30512,643.2012,127.8415,293.59111.84950
2014919,758.5184,463.21521,930.2211,946.4815,190.72112.85938
2015918,074.9183,524.76525,599.7512,114.8313,973.08114.67731
2016913,452.6383,687.29529,657.7112,576.5113,911.23116.62848
2017914,847.9984,653.53527,286.5012,359.6214,135.78118.55921
2018915,881.5685,401.19523,671.0813,449.0214,820.50178.631011
2019903,850.9584,122.09536,750.4113,334.8815,224.77118.883953
Descriptive and dispersion statistics
Minimum903,850.9582,260.09456,363.729826.7213,911.23111.84651.00
Mean940,139.5085,783.70499,706.8911,573.8016,079.30118.81999.95
Maximum981,577.3391,018.31536,750.4113,449.0318,556.62178.631266.00
1 SD22,332.432696.5723,723.34910.821670.97116.33951.50
2 CV (%)2.383.144.757.8710.3914.19168.03
Note: 1 SD = Standard Deviation; 2 CV = Coefficient of Variation.
Table 7. Significance and magnitude of the Mann–Kendall’s time trend and Sen’s slope from land use and land cover (LULC) and rainfall in Northeastern Brazil (NEB) over two decades.
LULC Data and Rainfall DataMann–Kendall Trend Test
ZMK-ValueTauSen’s Slopep-Value
Forest−5.872−0.958−3705.8534.29 × 10−9 **
Non-forest natural−1.914−0.316−277.2630.055 ns
Farming5.8070.9473978.8986.34 × 10−9 **
Non-vegetated area5.4180.884137.0846.02 × 10−8 **
Water−1.330−0.221−93.5860.183 ns
Rainfall/TRMM−1.460−0.242−11.8780.144 ns
Note: ** = significance at 1% (p-value < 0.01); ns = non-significant (p-value > 0.05).
Disclaimer/Publisher’s Note: The statements, opinions and data contained in all publications are solely those of the individual author(s) and contributor(s) and not of MDPI and/or the editor(s). MDPI and/or the editor(s) disclaim responsibility for any injury to people or property resulting from any ideas, methods, instructions or products referred to in the content.