

Enhanced Landslide Susceptibility Assessment in Western Sichuan Utilizing DCGAN-Generated Samples


Abstract
1. Introduction
2. Materials
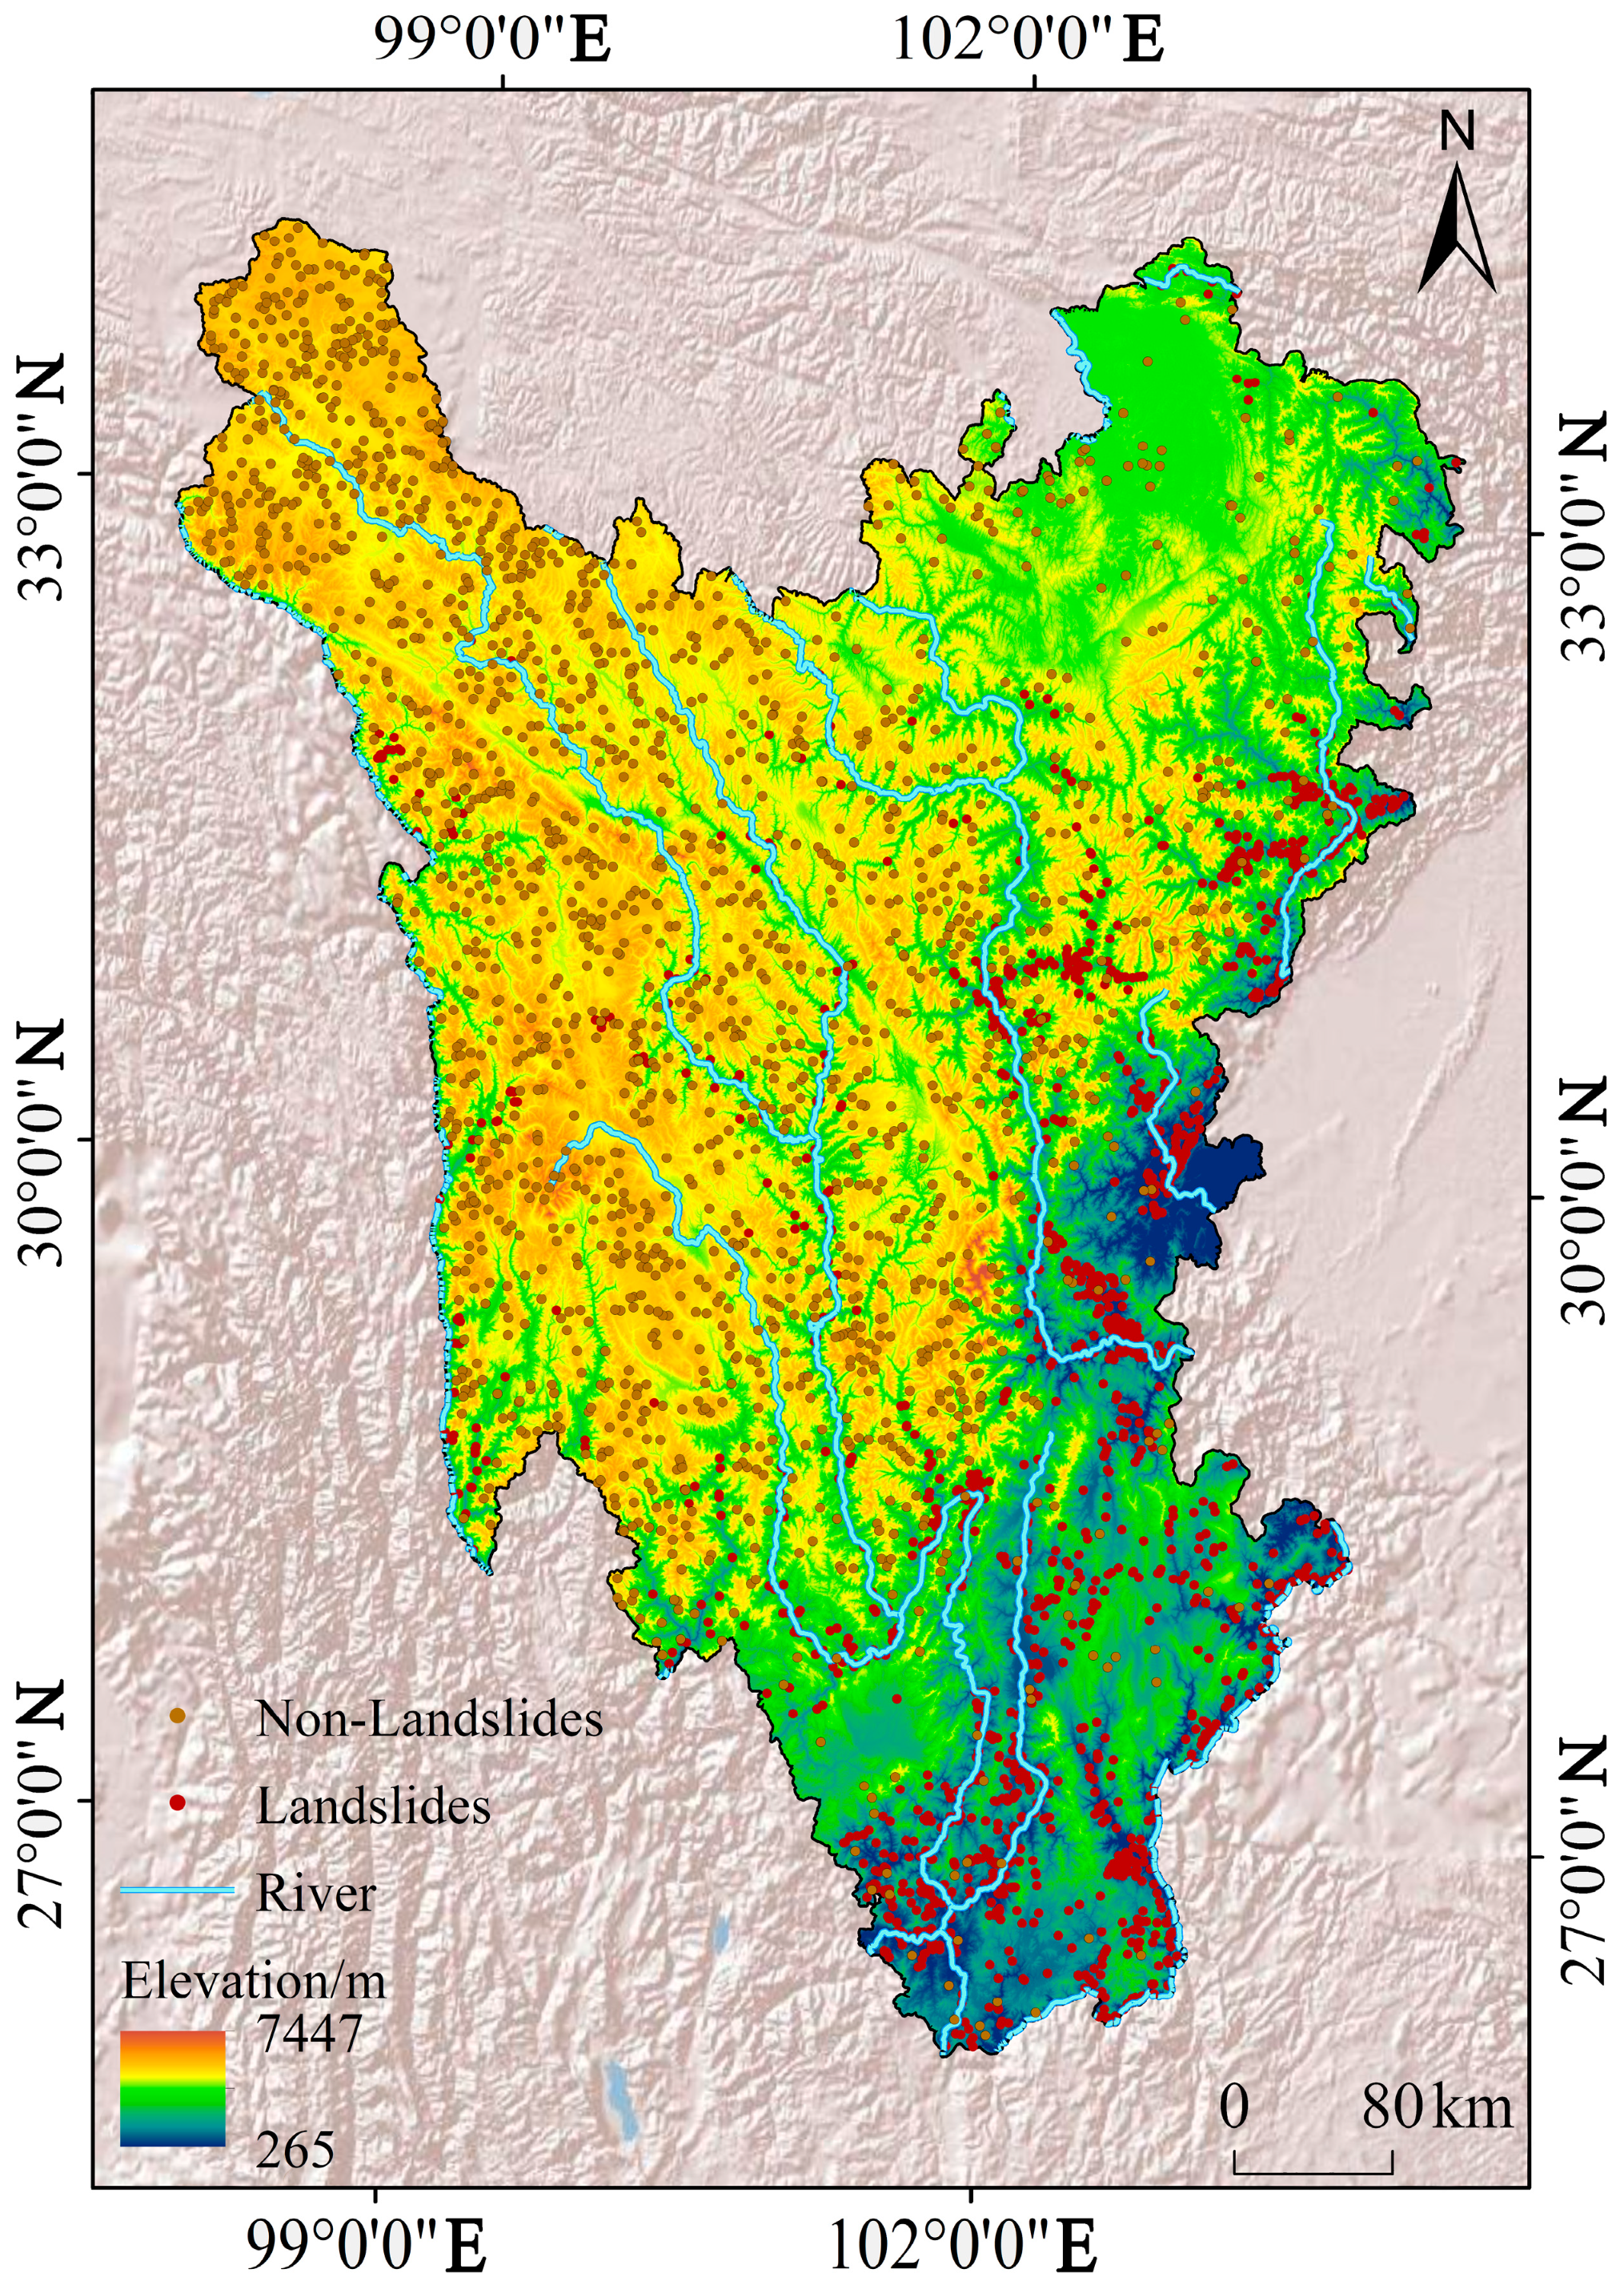
2.1. Study Area
2.2. Inventory of Landslides
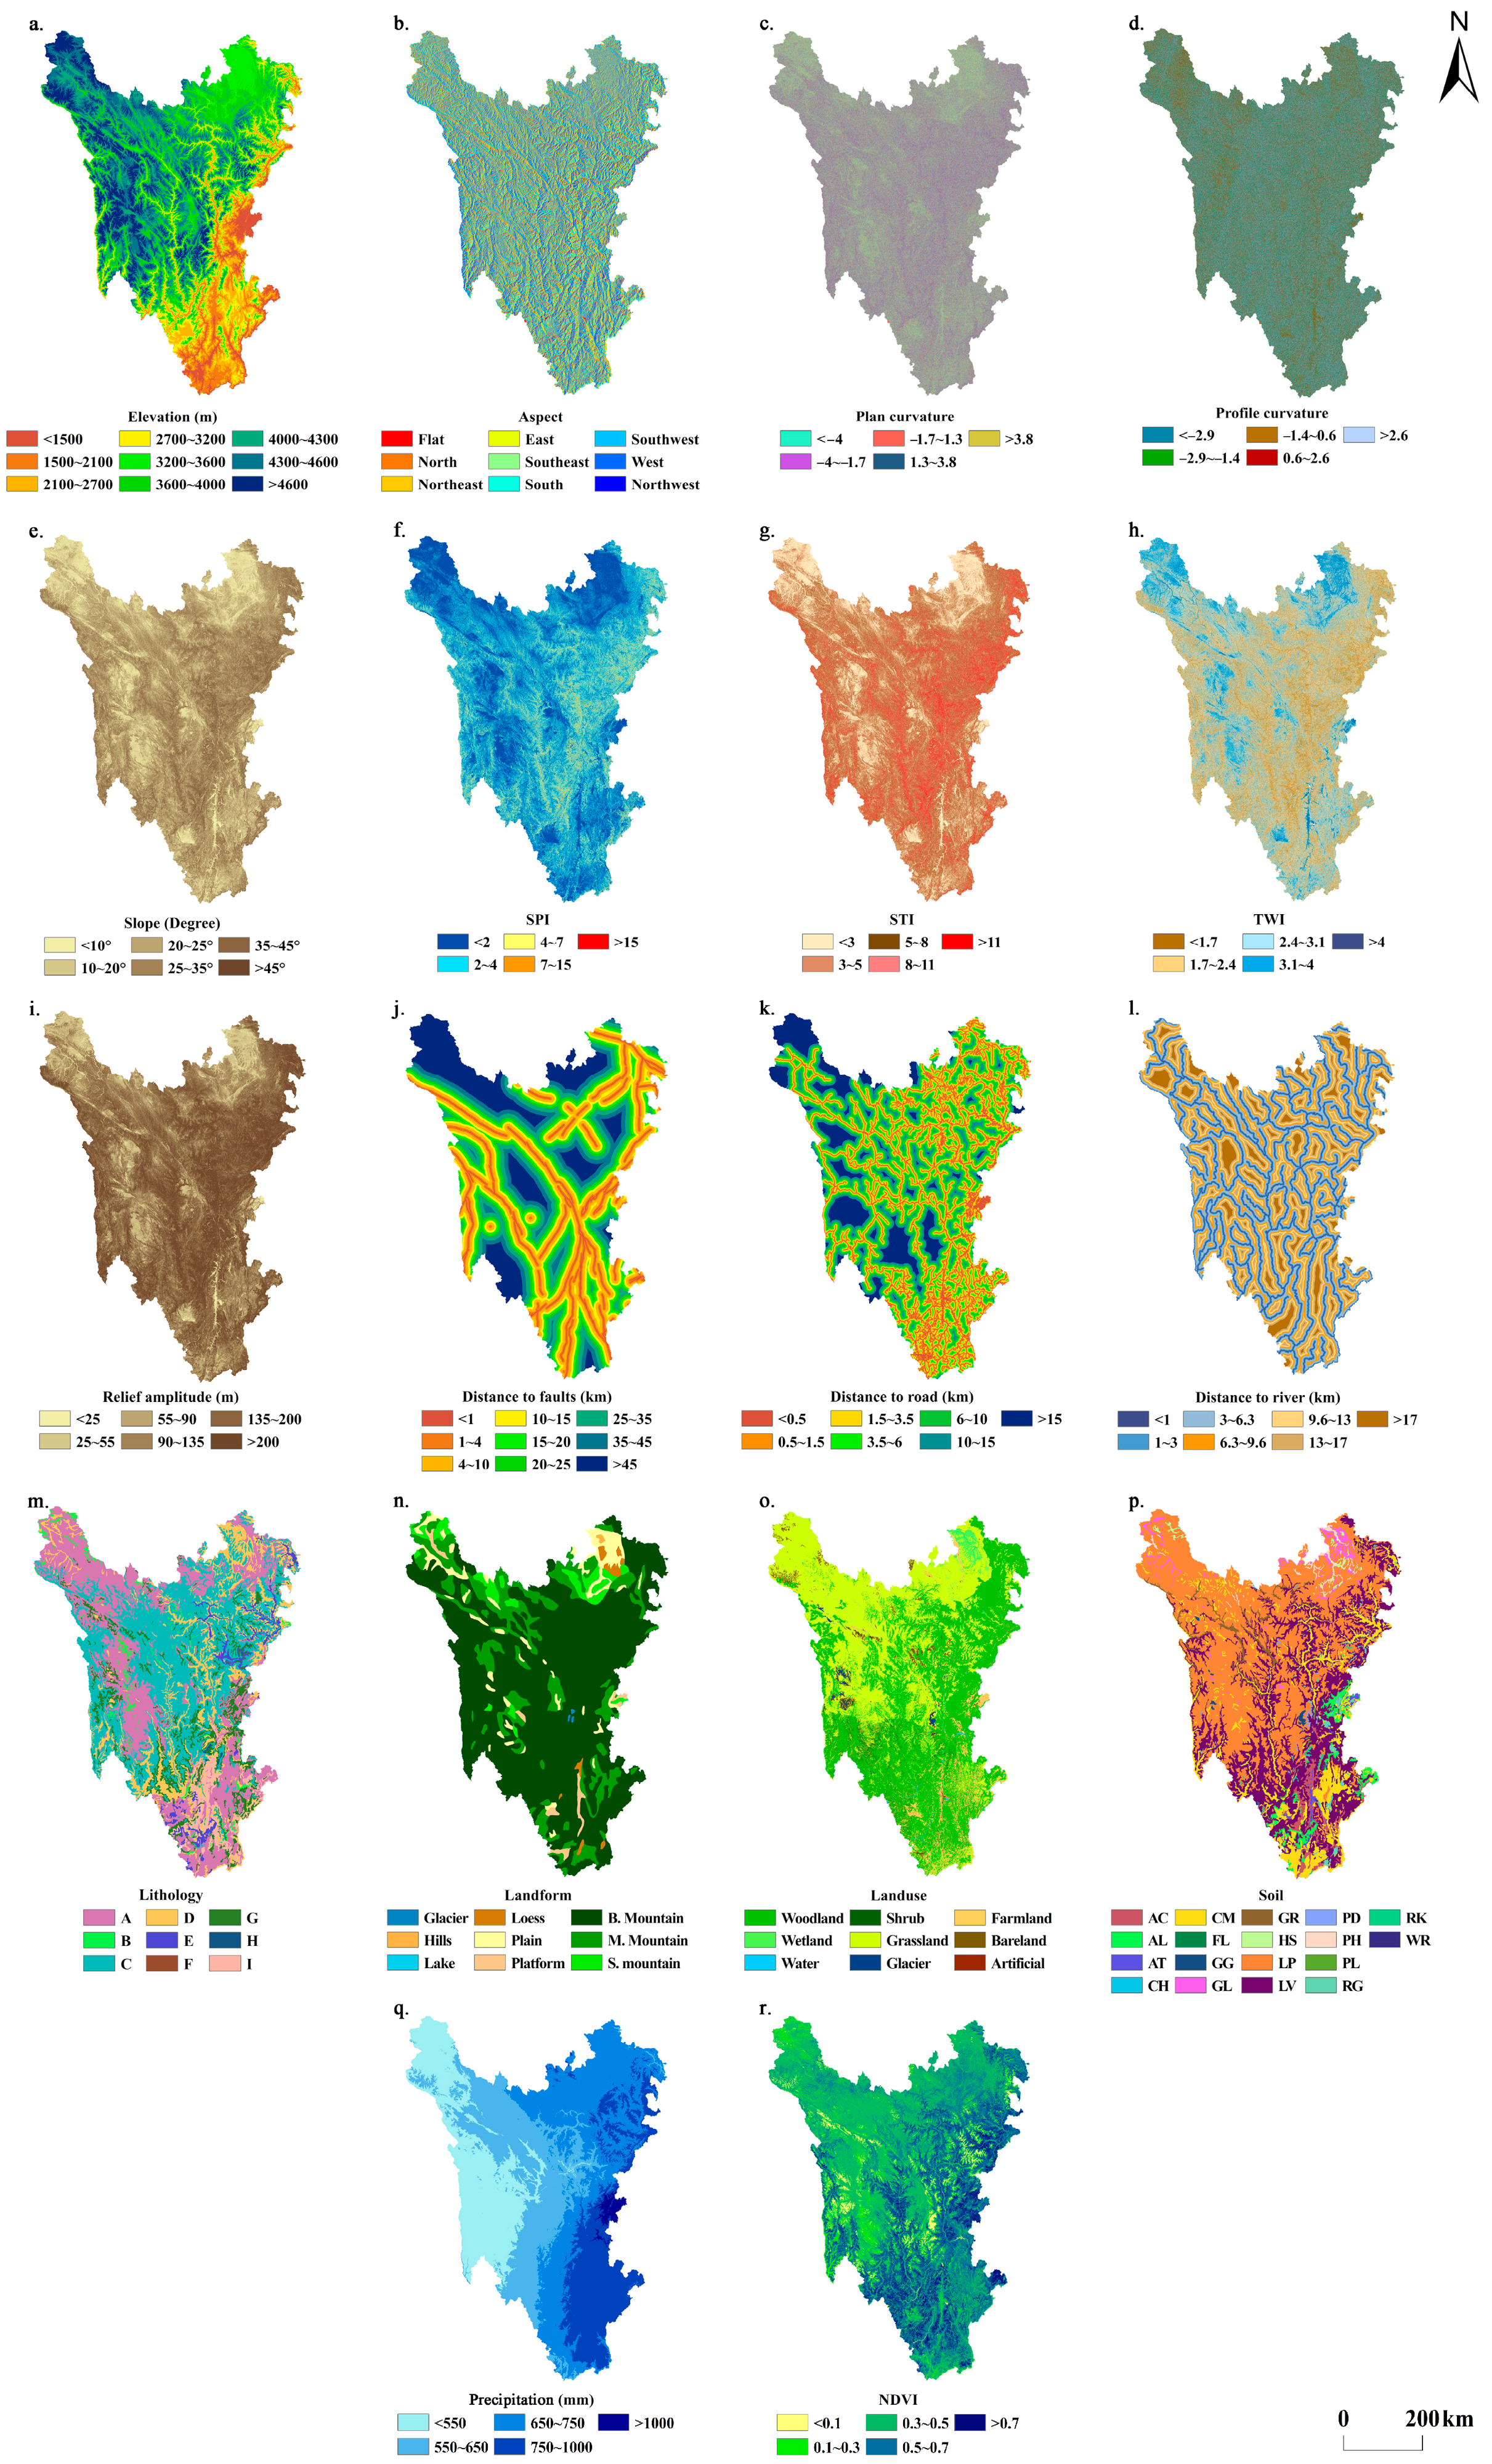
2.3. Landslide Factors
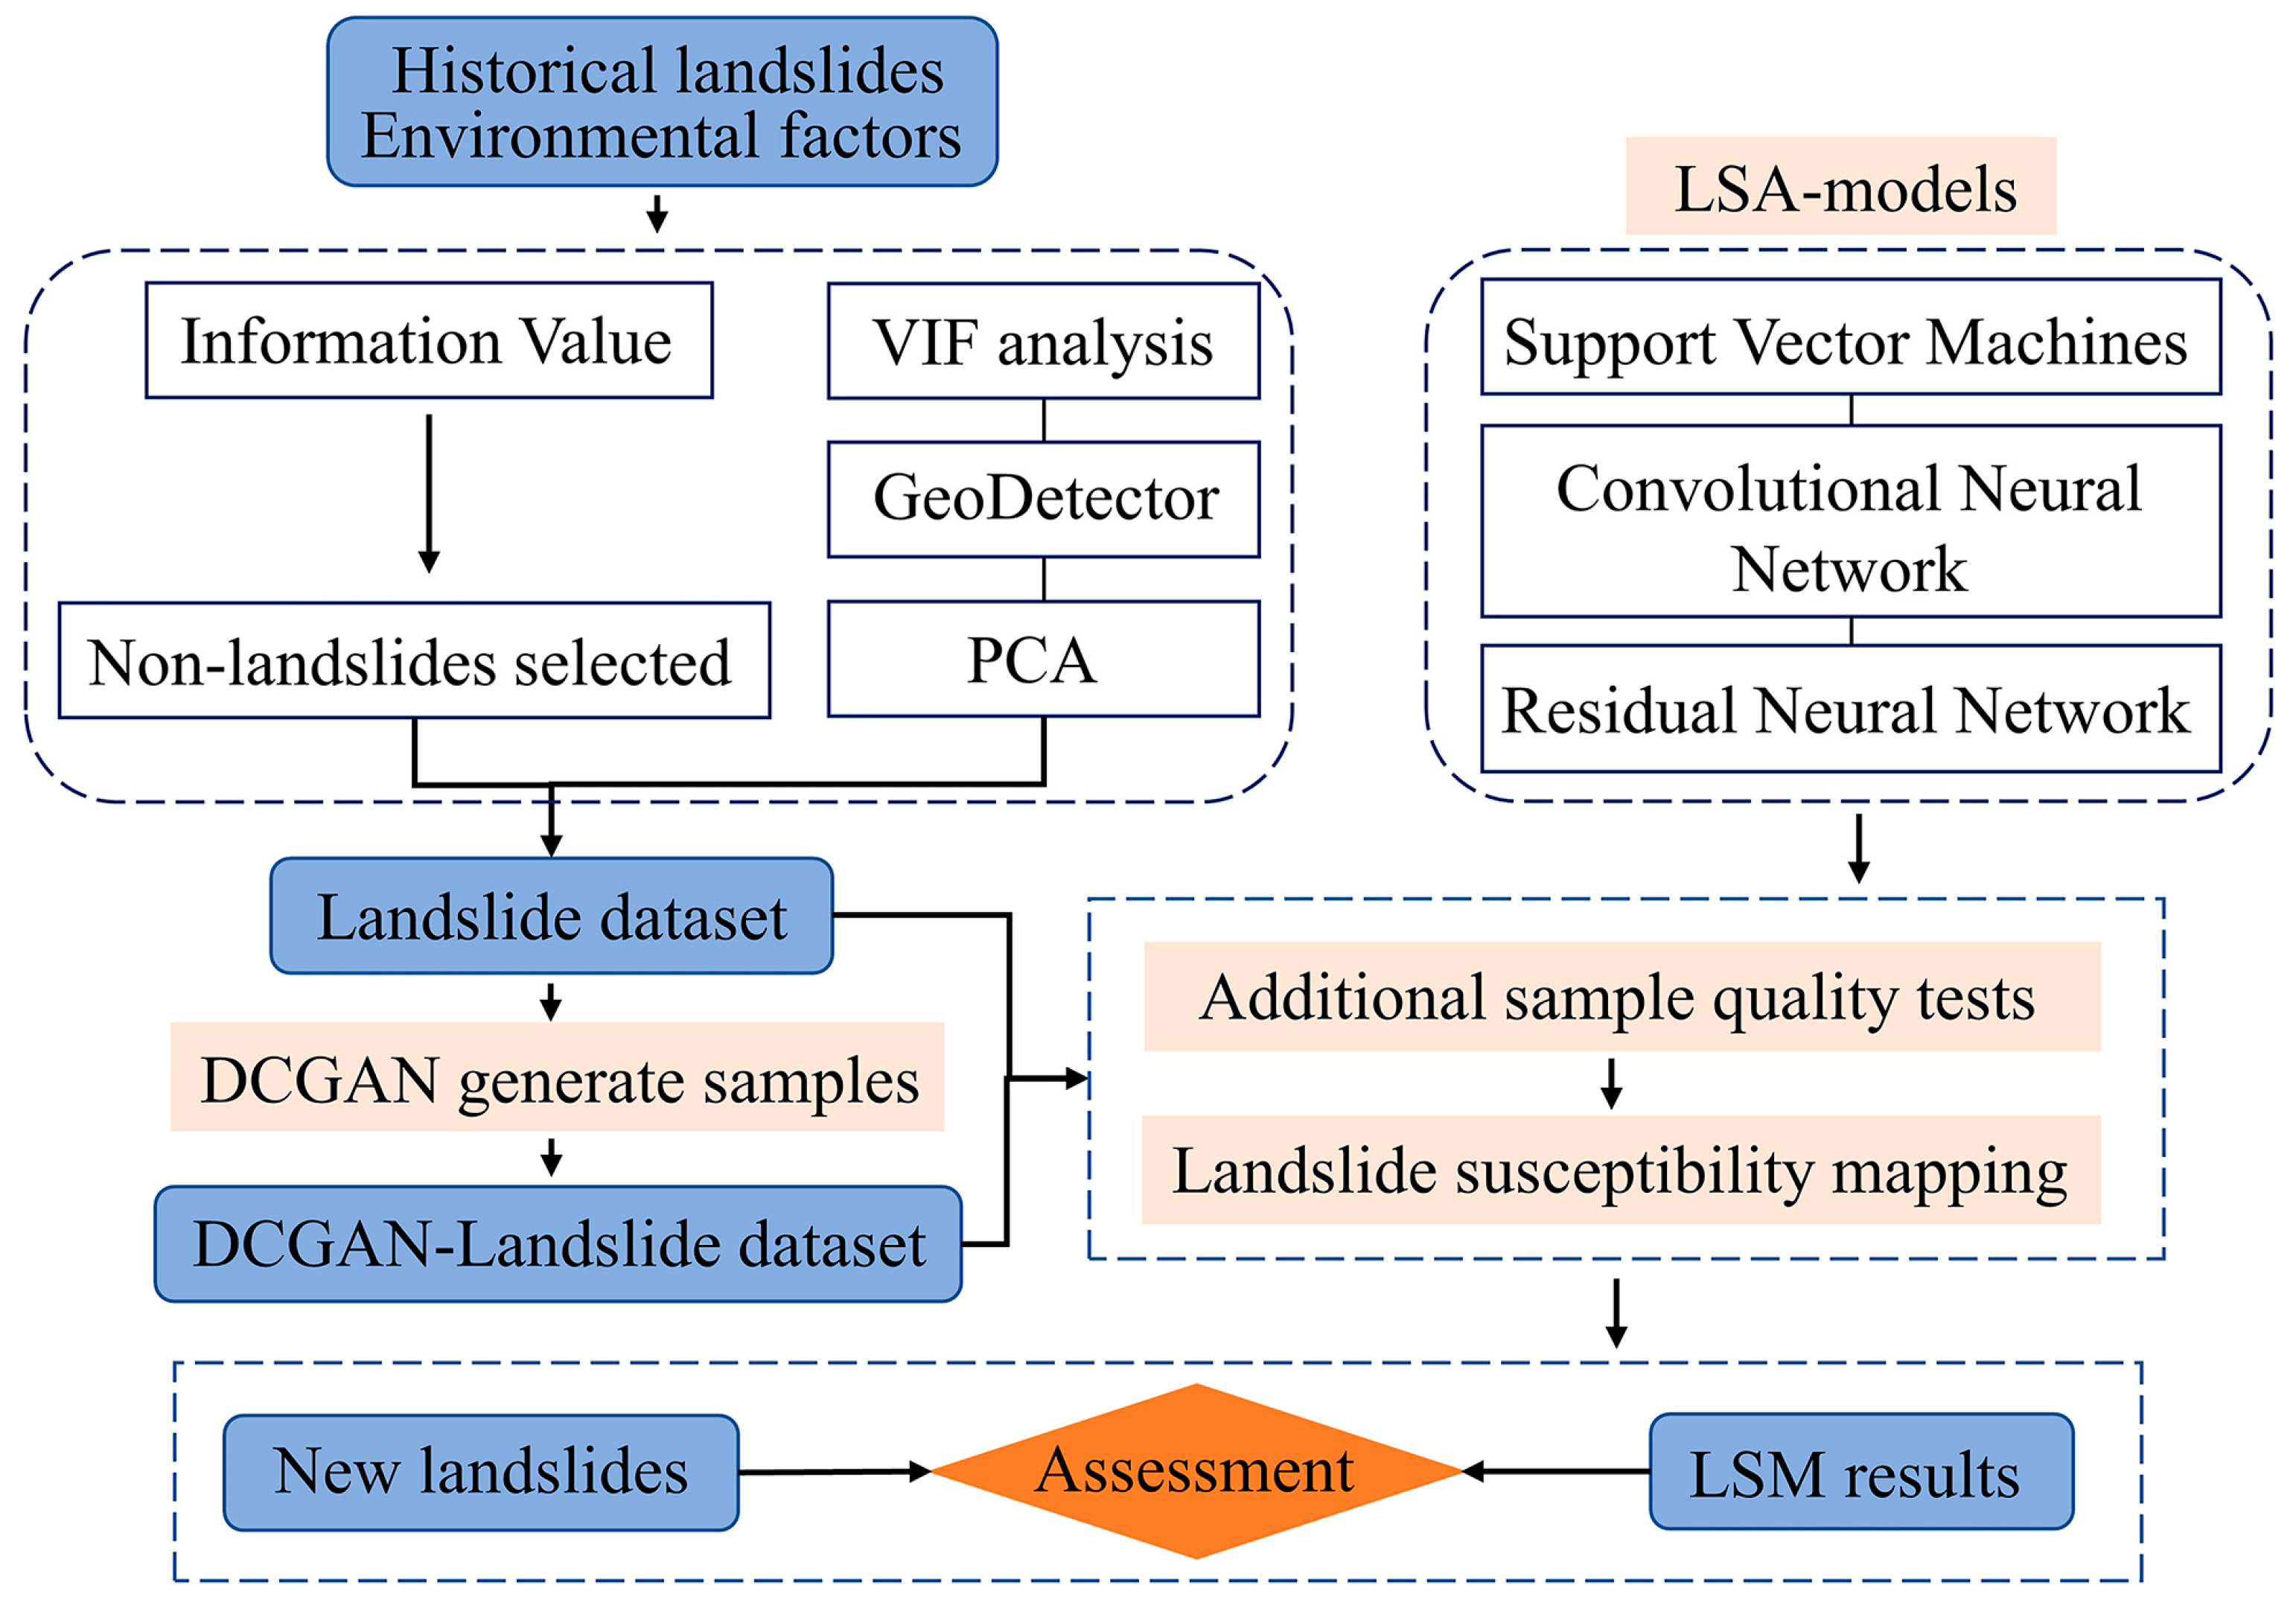
3. Methods
3.1. VIF Analysis and GeoDetector
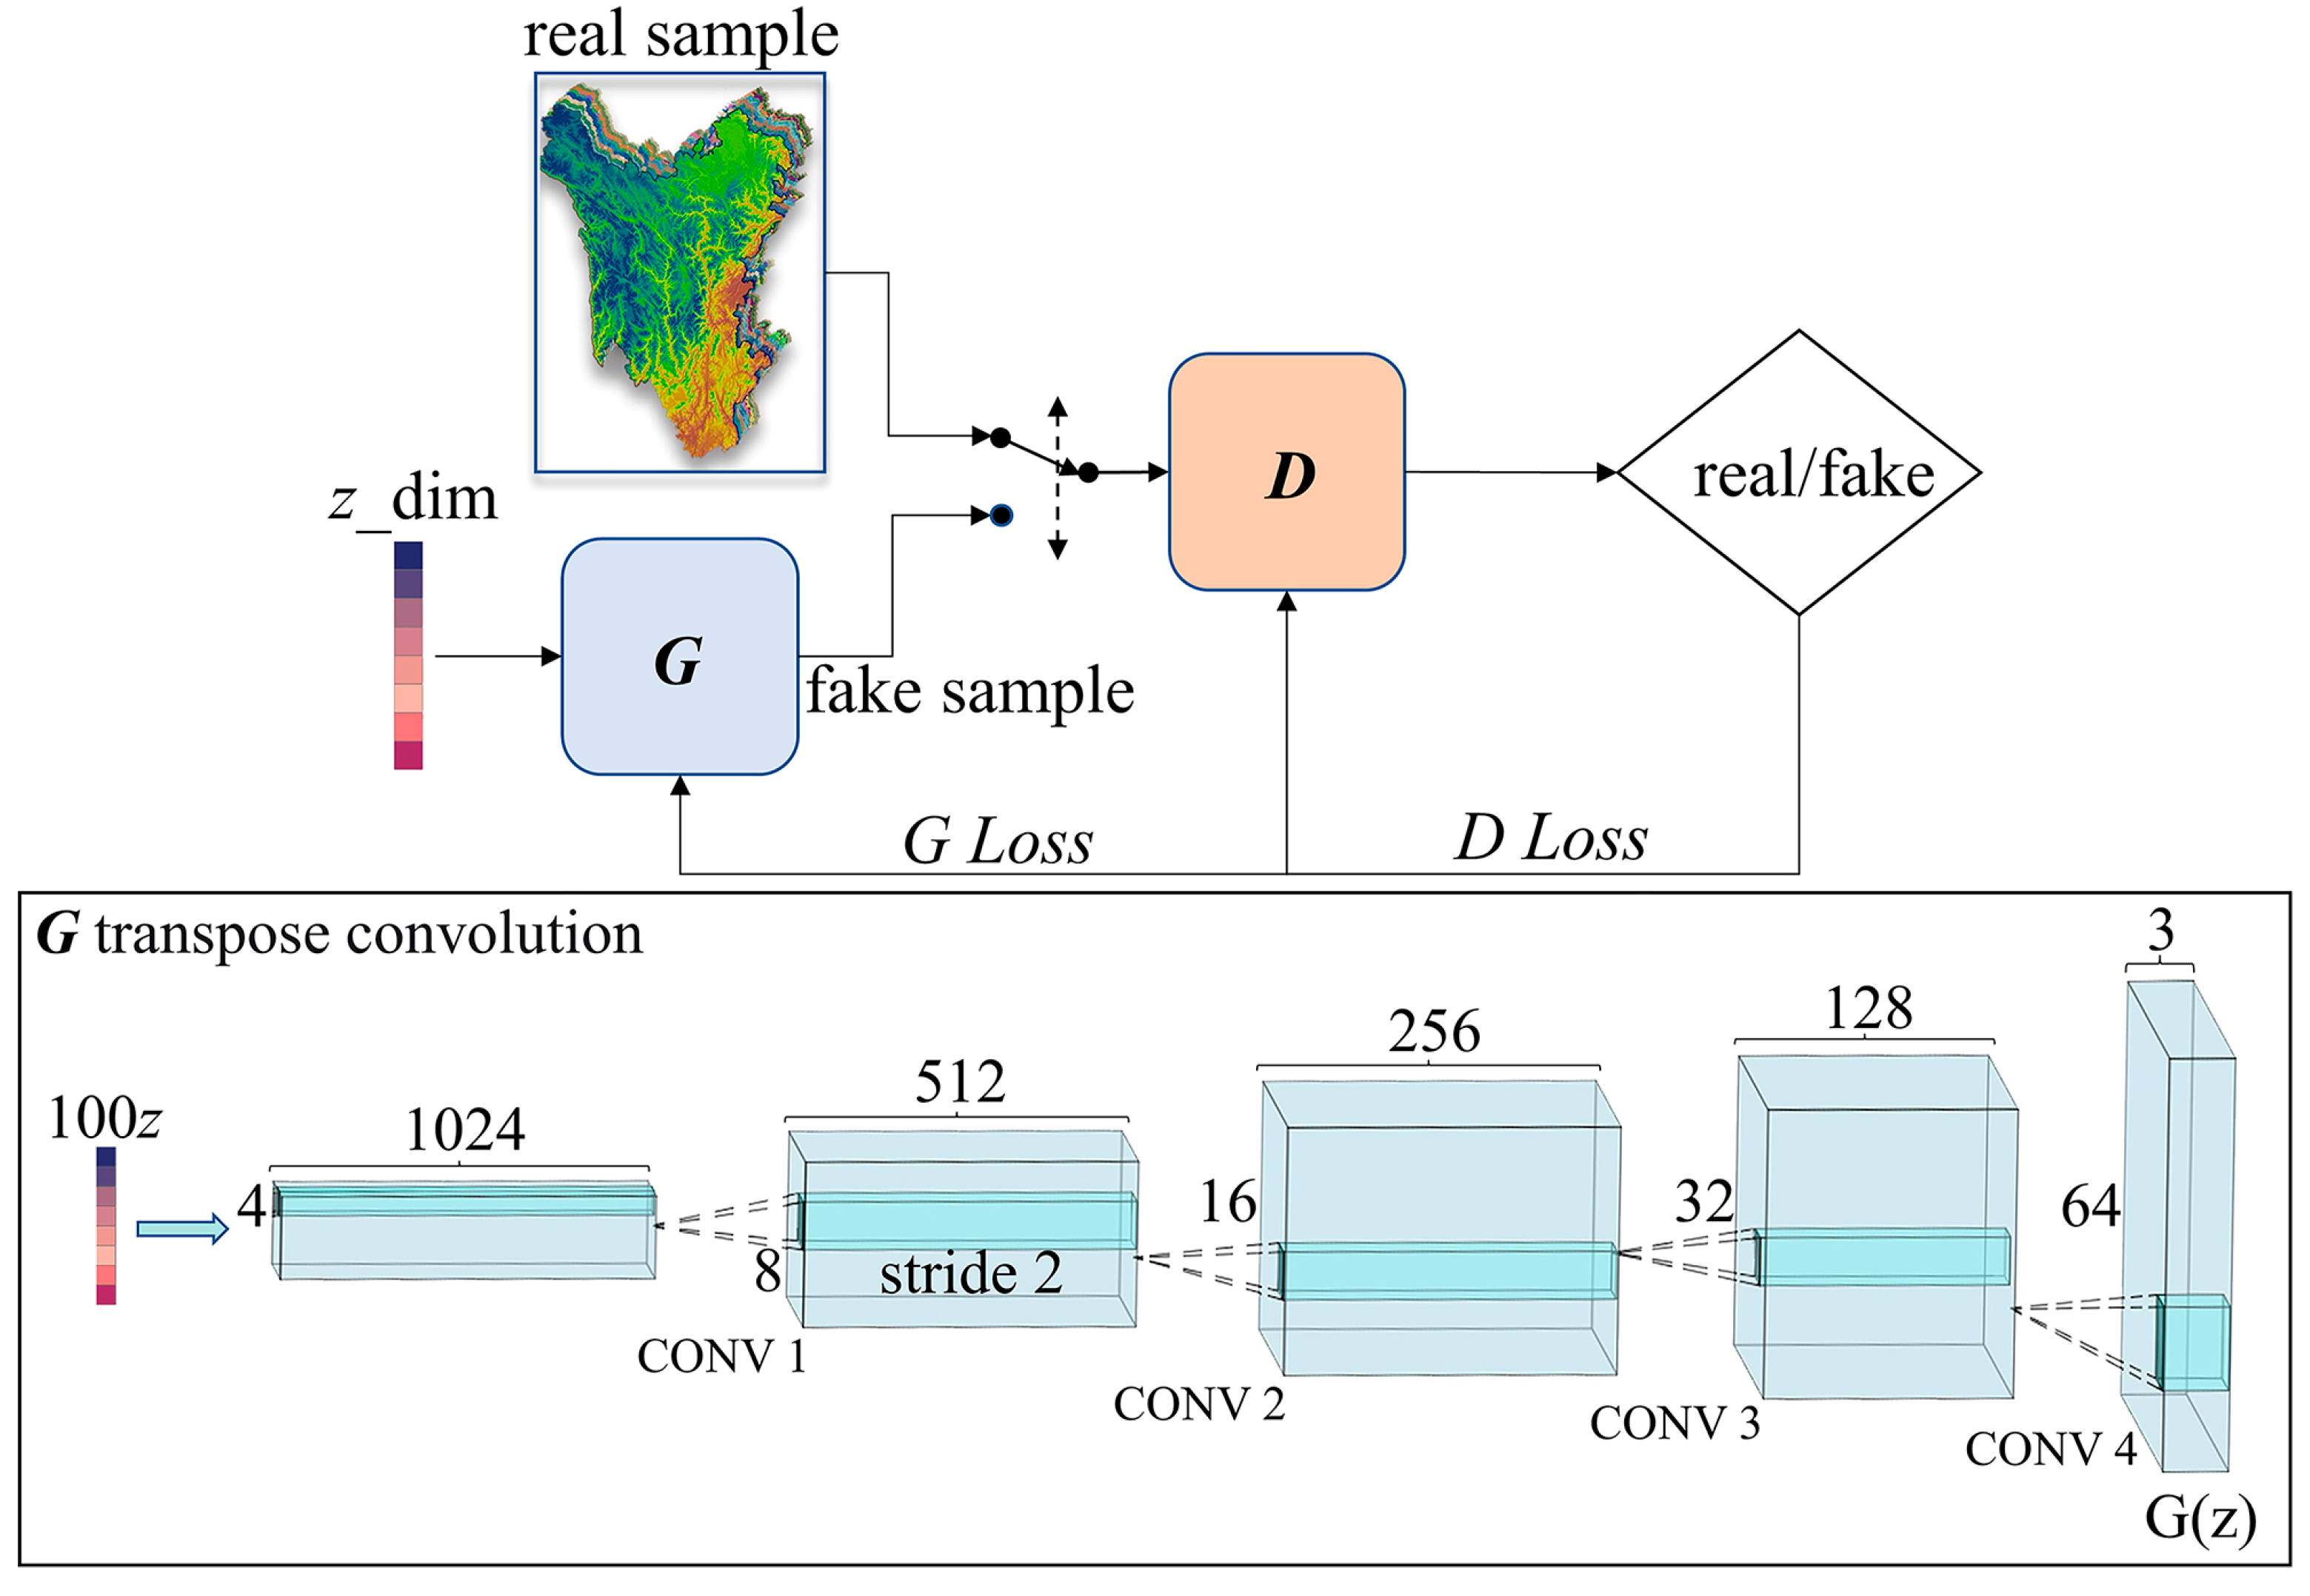
3.2. Data Augmentation Based on DCGAN
3.3. LSA Machine Learning Models
3.3.1. Support Vector Machine (SVM)
3.3.2. Convolutional Neural Network (CNN)
3.3.3. Residual Neural Network (ResNet)
3.4. Evaluation Indicators
4. Results
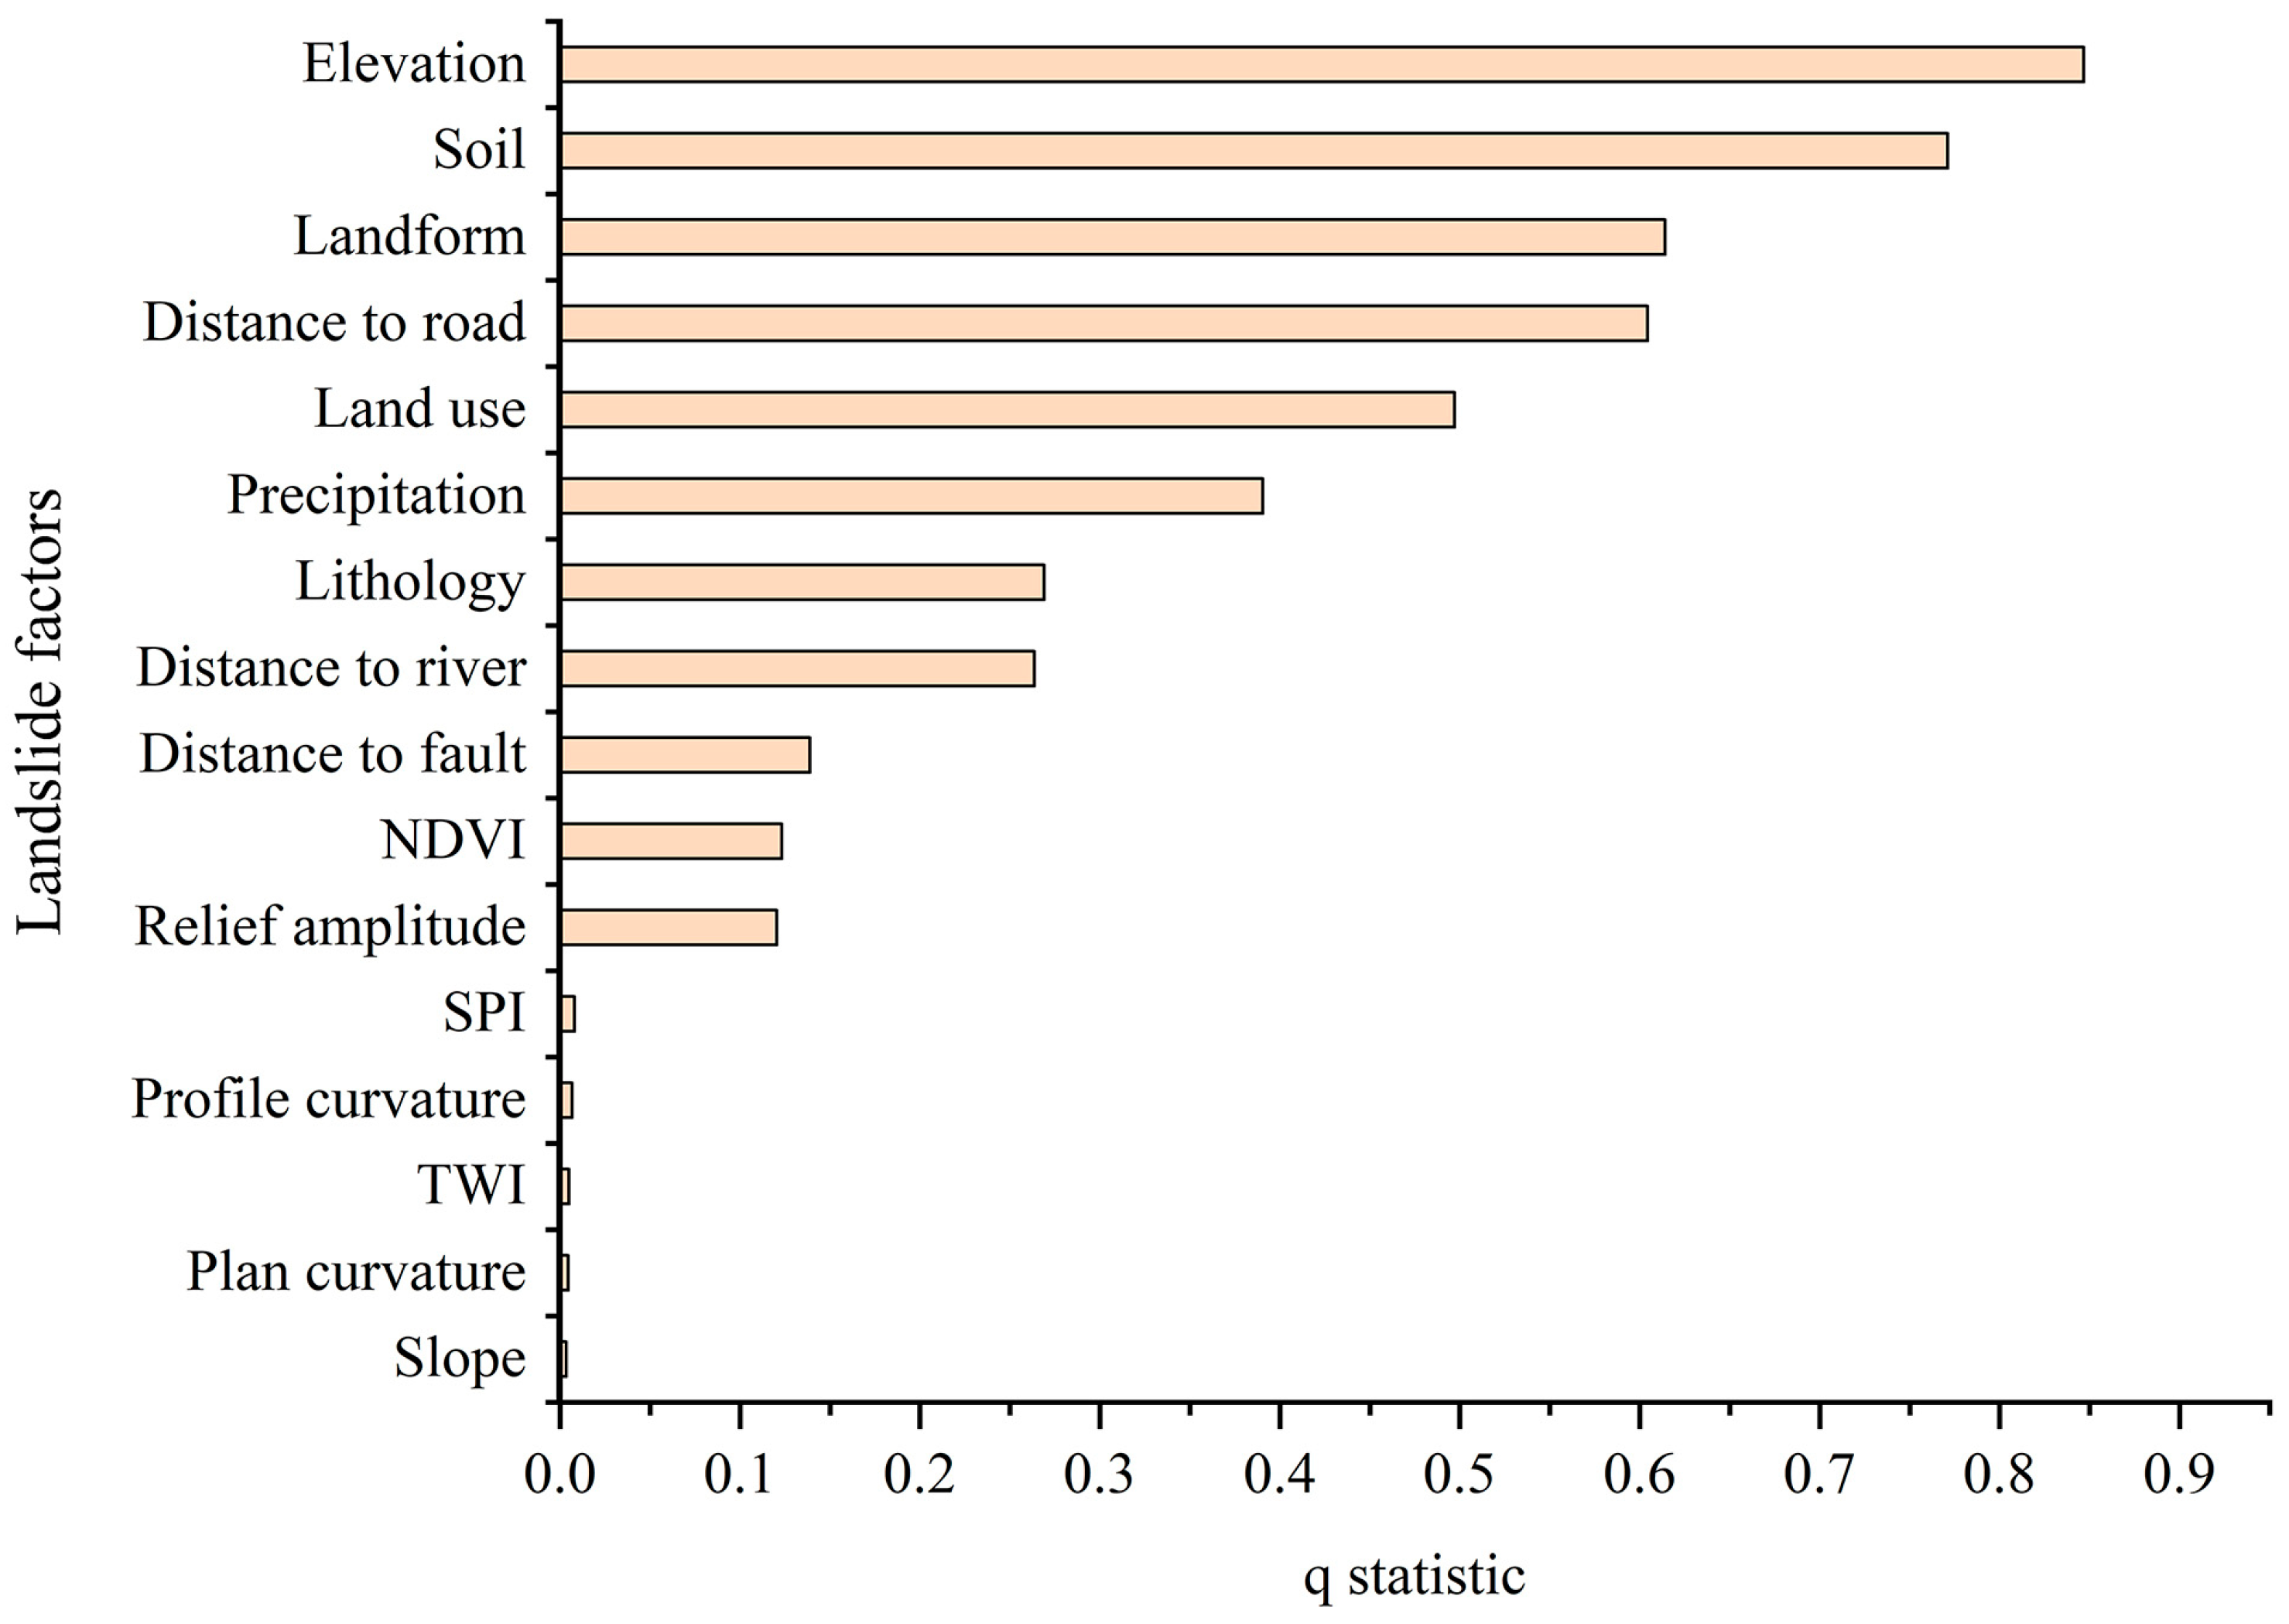
4.1. Landslide Factor Screening
4.2. Quality Analysis of Additional Landslide Samples
- (1)
- When the number of additional samples is 100, 200, and 300, the testing accuracies of the SVM are improved by 2.56%, 2.66%, and 2.3%, respectively. However, those of the CNN and ResNet show no significant changes, and there is a difference of approximately 5% to 10% between the accuracy of the training and testing datasets, indicating the presence of overfitting.
- (2)
- With 400 and 500 additional samples, the testing accuracies of the SVM are improved by 1.88% and 2.18%, respectively. The testing accuracies of the CNN are improved by 1.54% and 2.57%, respectively. Moreover, those of the ResNet are improved by 3.37% (400) and 5.28%, respectively.
- (3)
- When there are 600 additional samples, compared to 200 additional samples, the testing accuracy of the SVM is decreased by 2.31%. However, it is improved by 0.35% compared to the original dataset. Additionally, compared to 500 additional samples, the testing accuracies of the CNN and ResNet were decreased by 2.11% and 4.3%, respectively, although compared to the original dataset, they were improved by 0.46% and 0.98%, respectively.
4.3. LSA Results
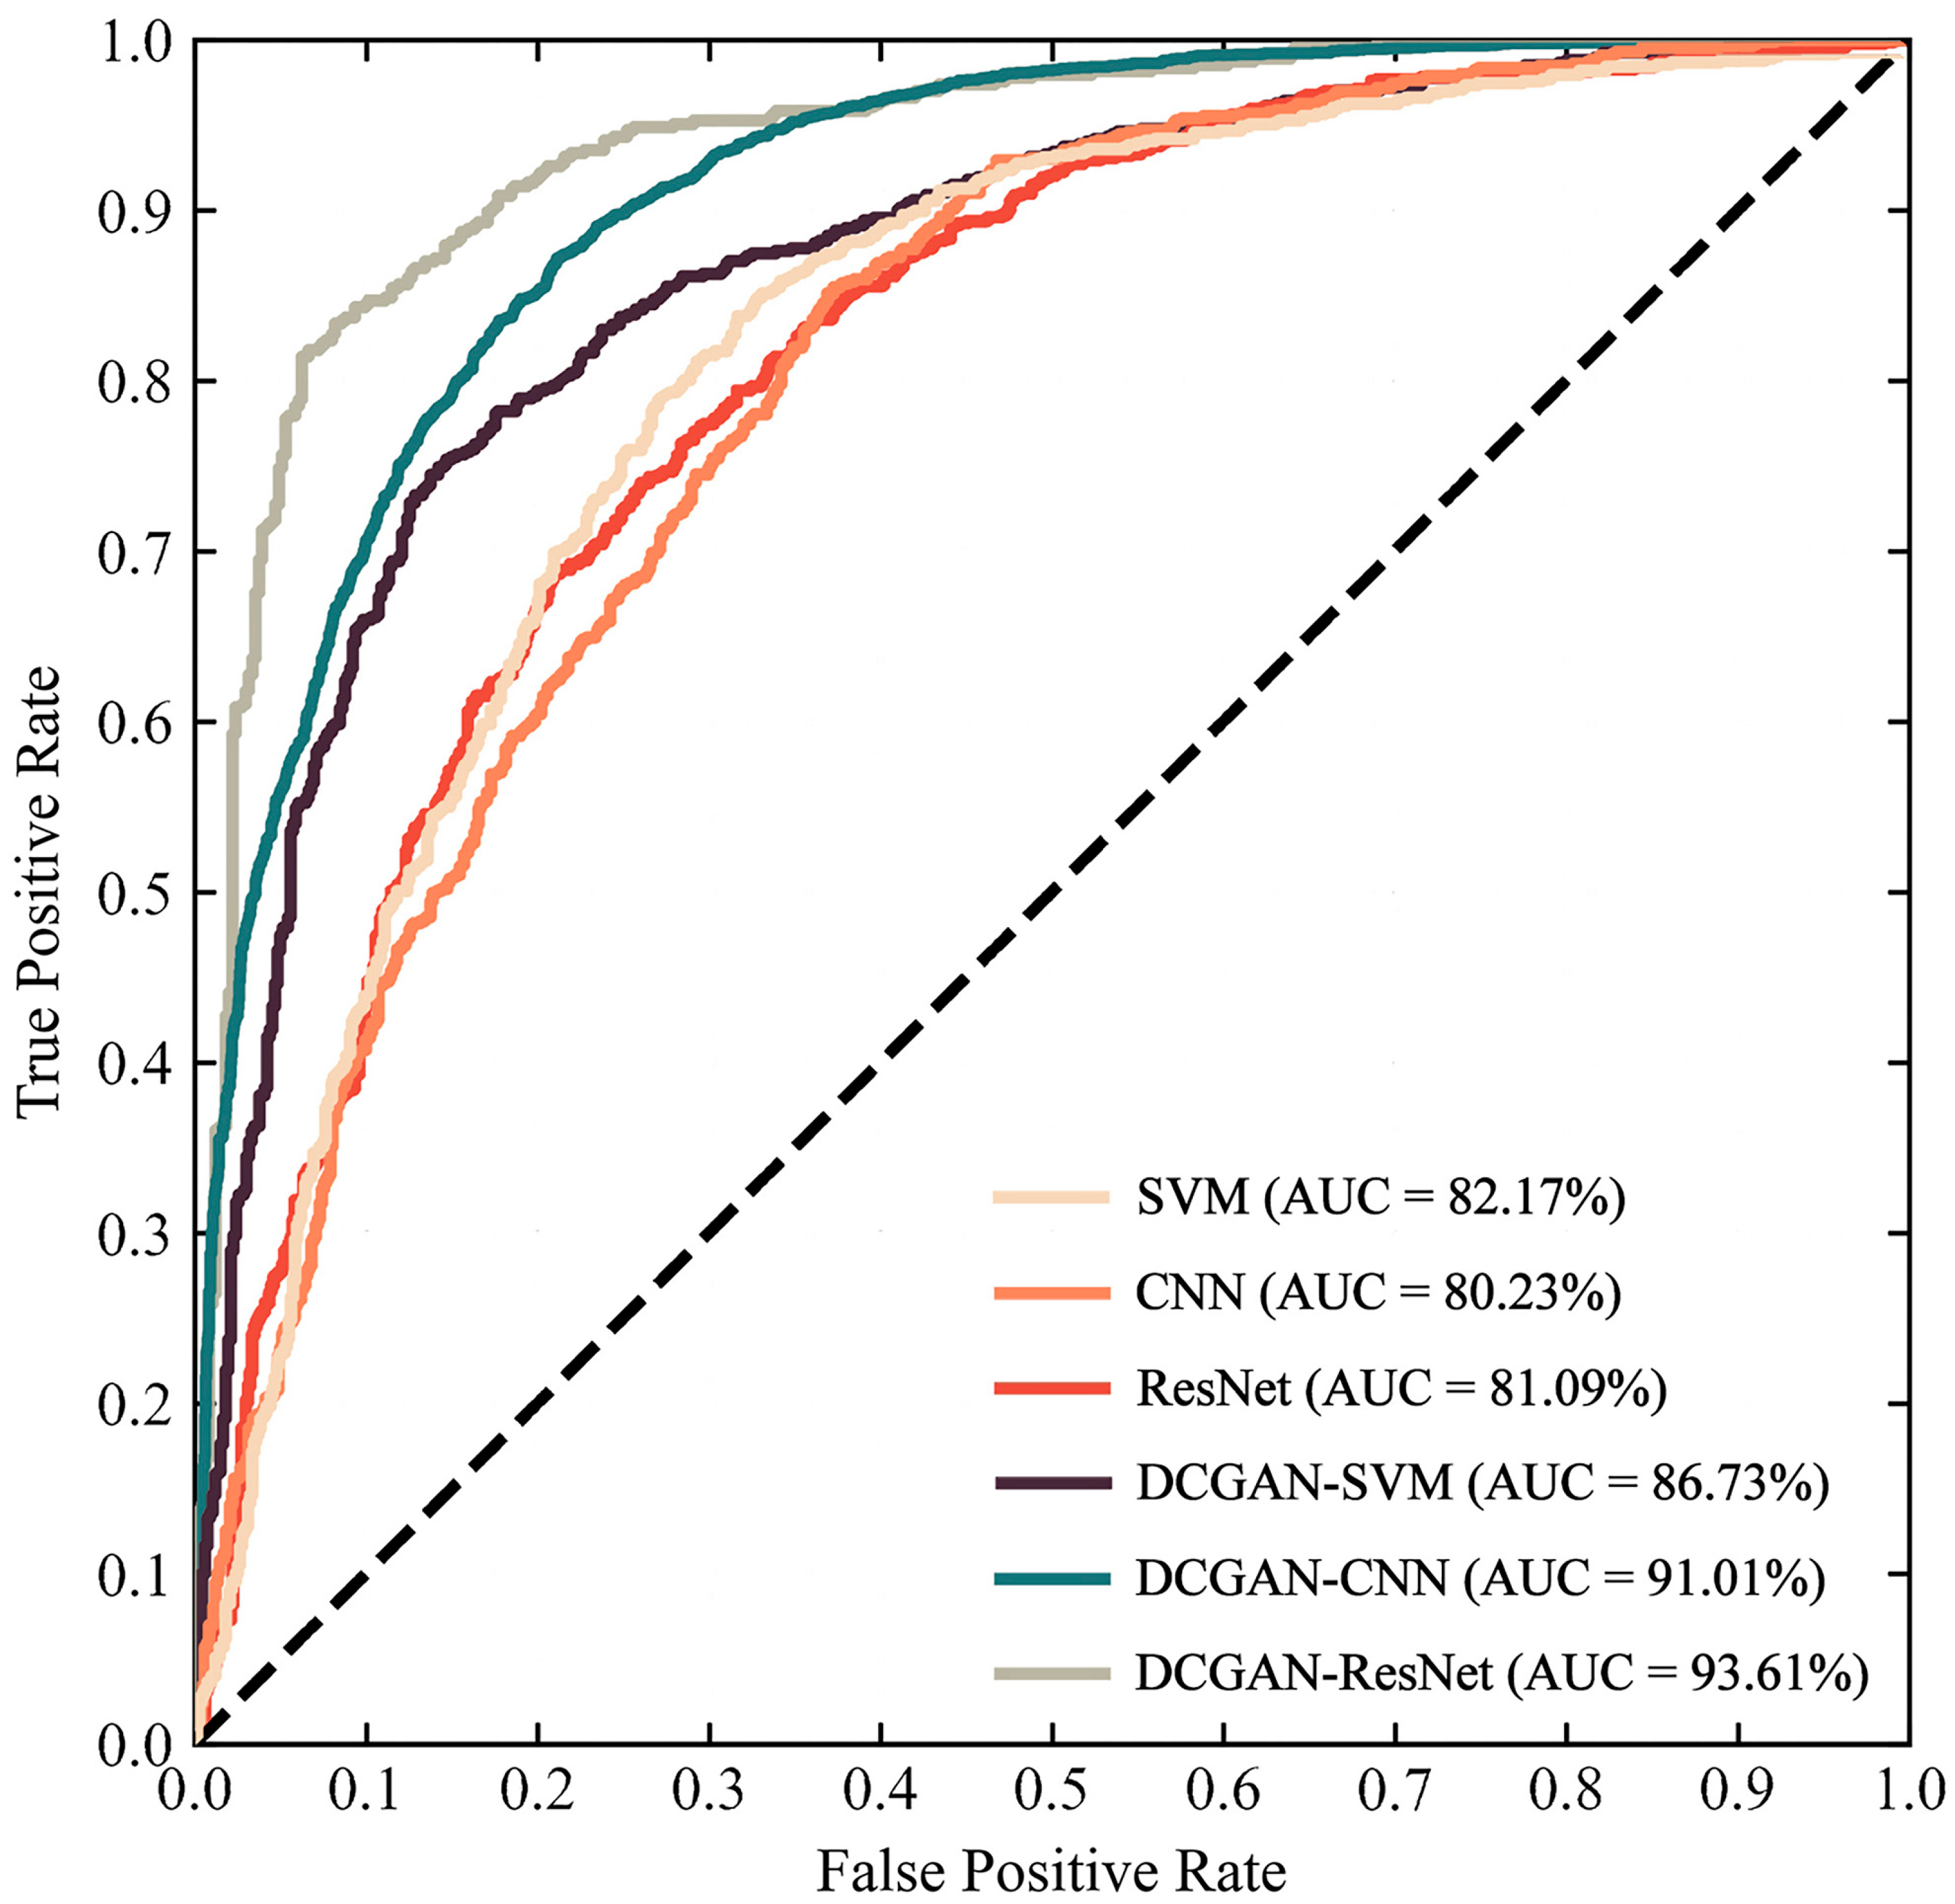
4.3.1. Effectiveness of LSA Machine Learning Models
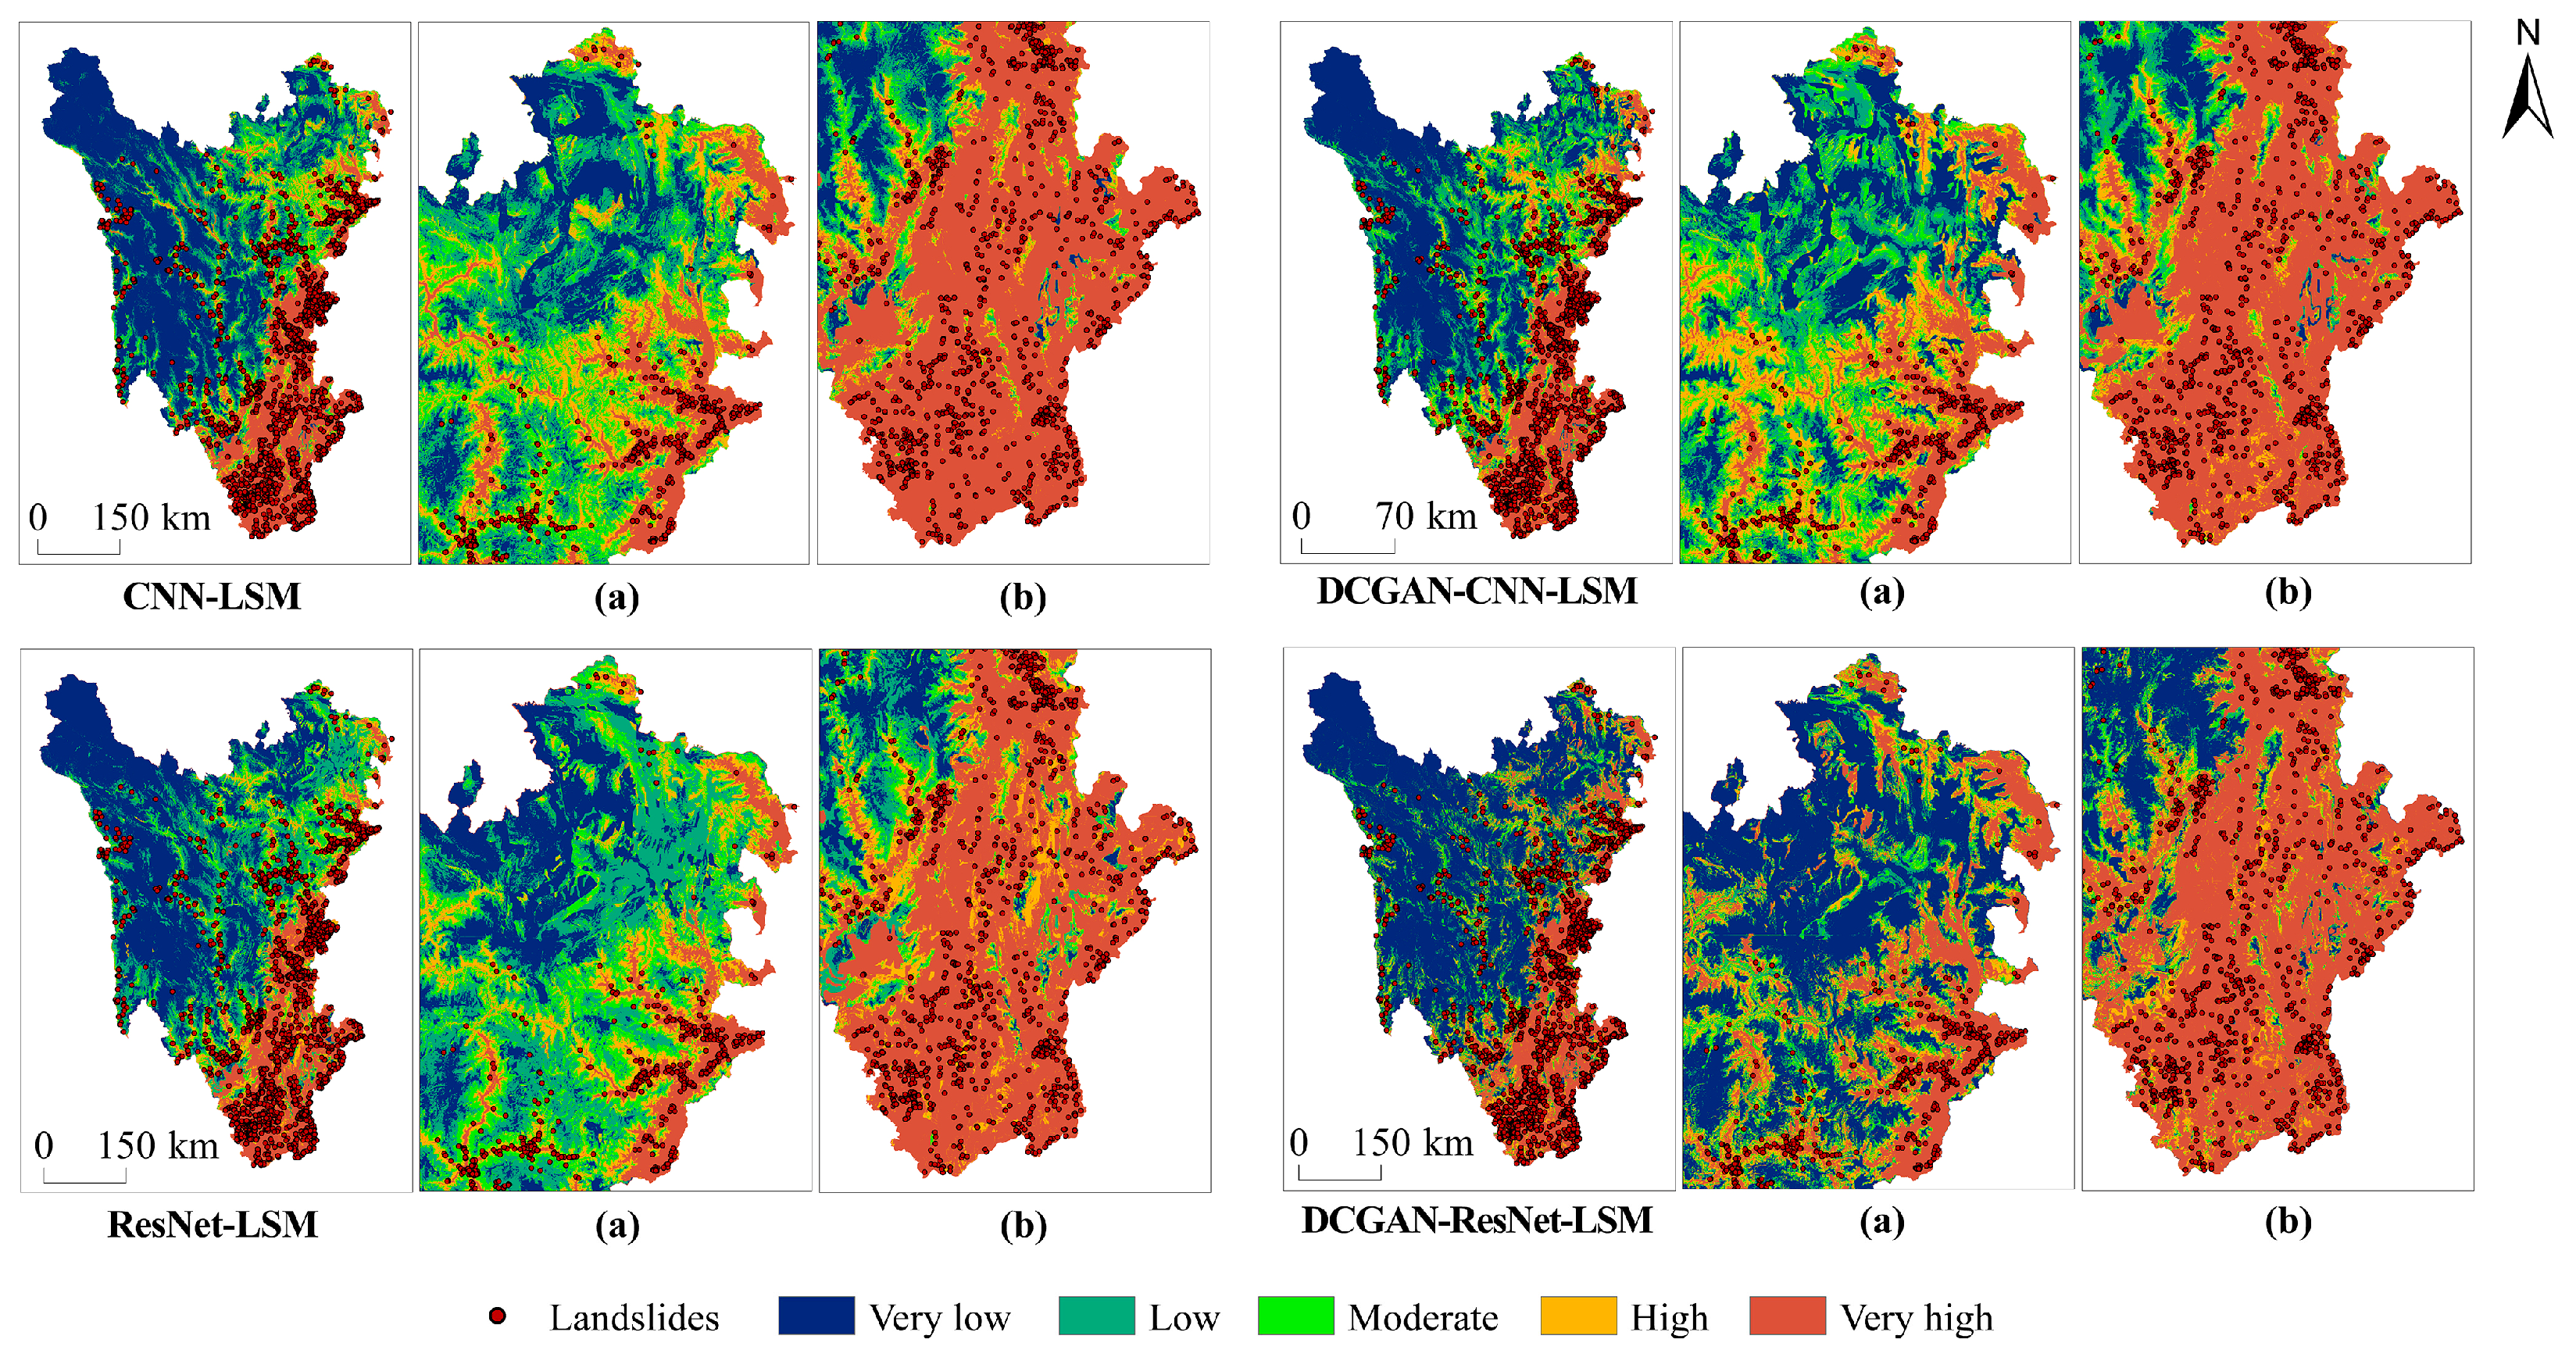
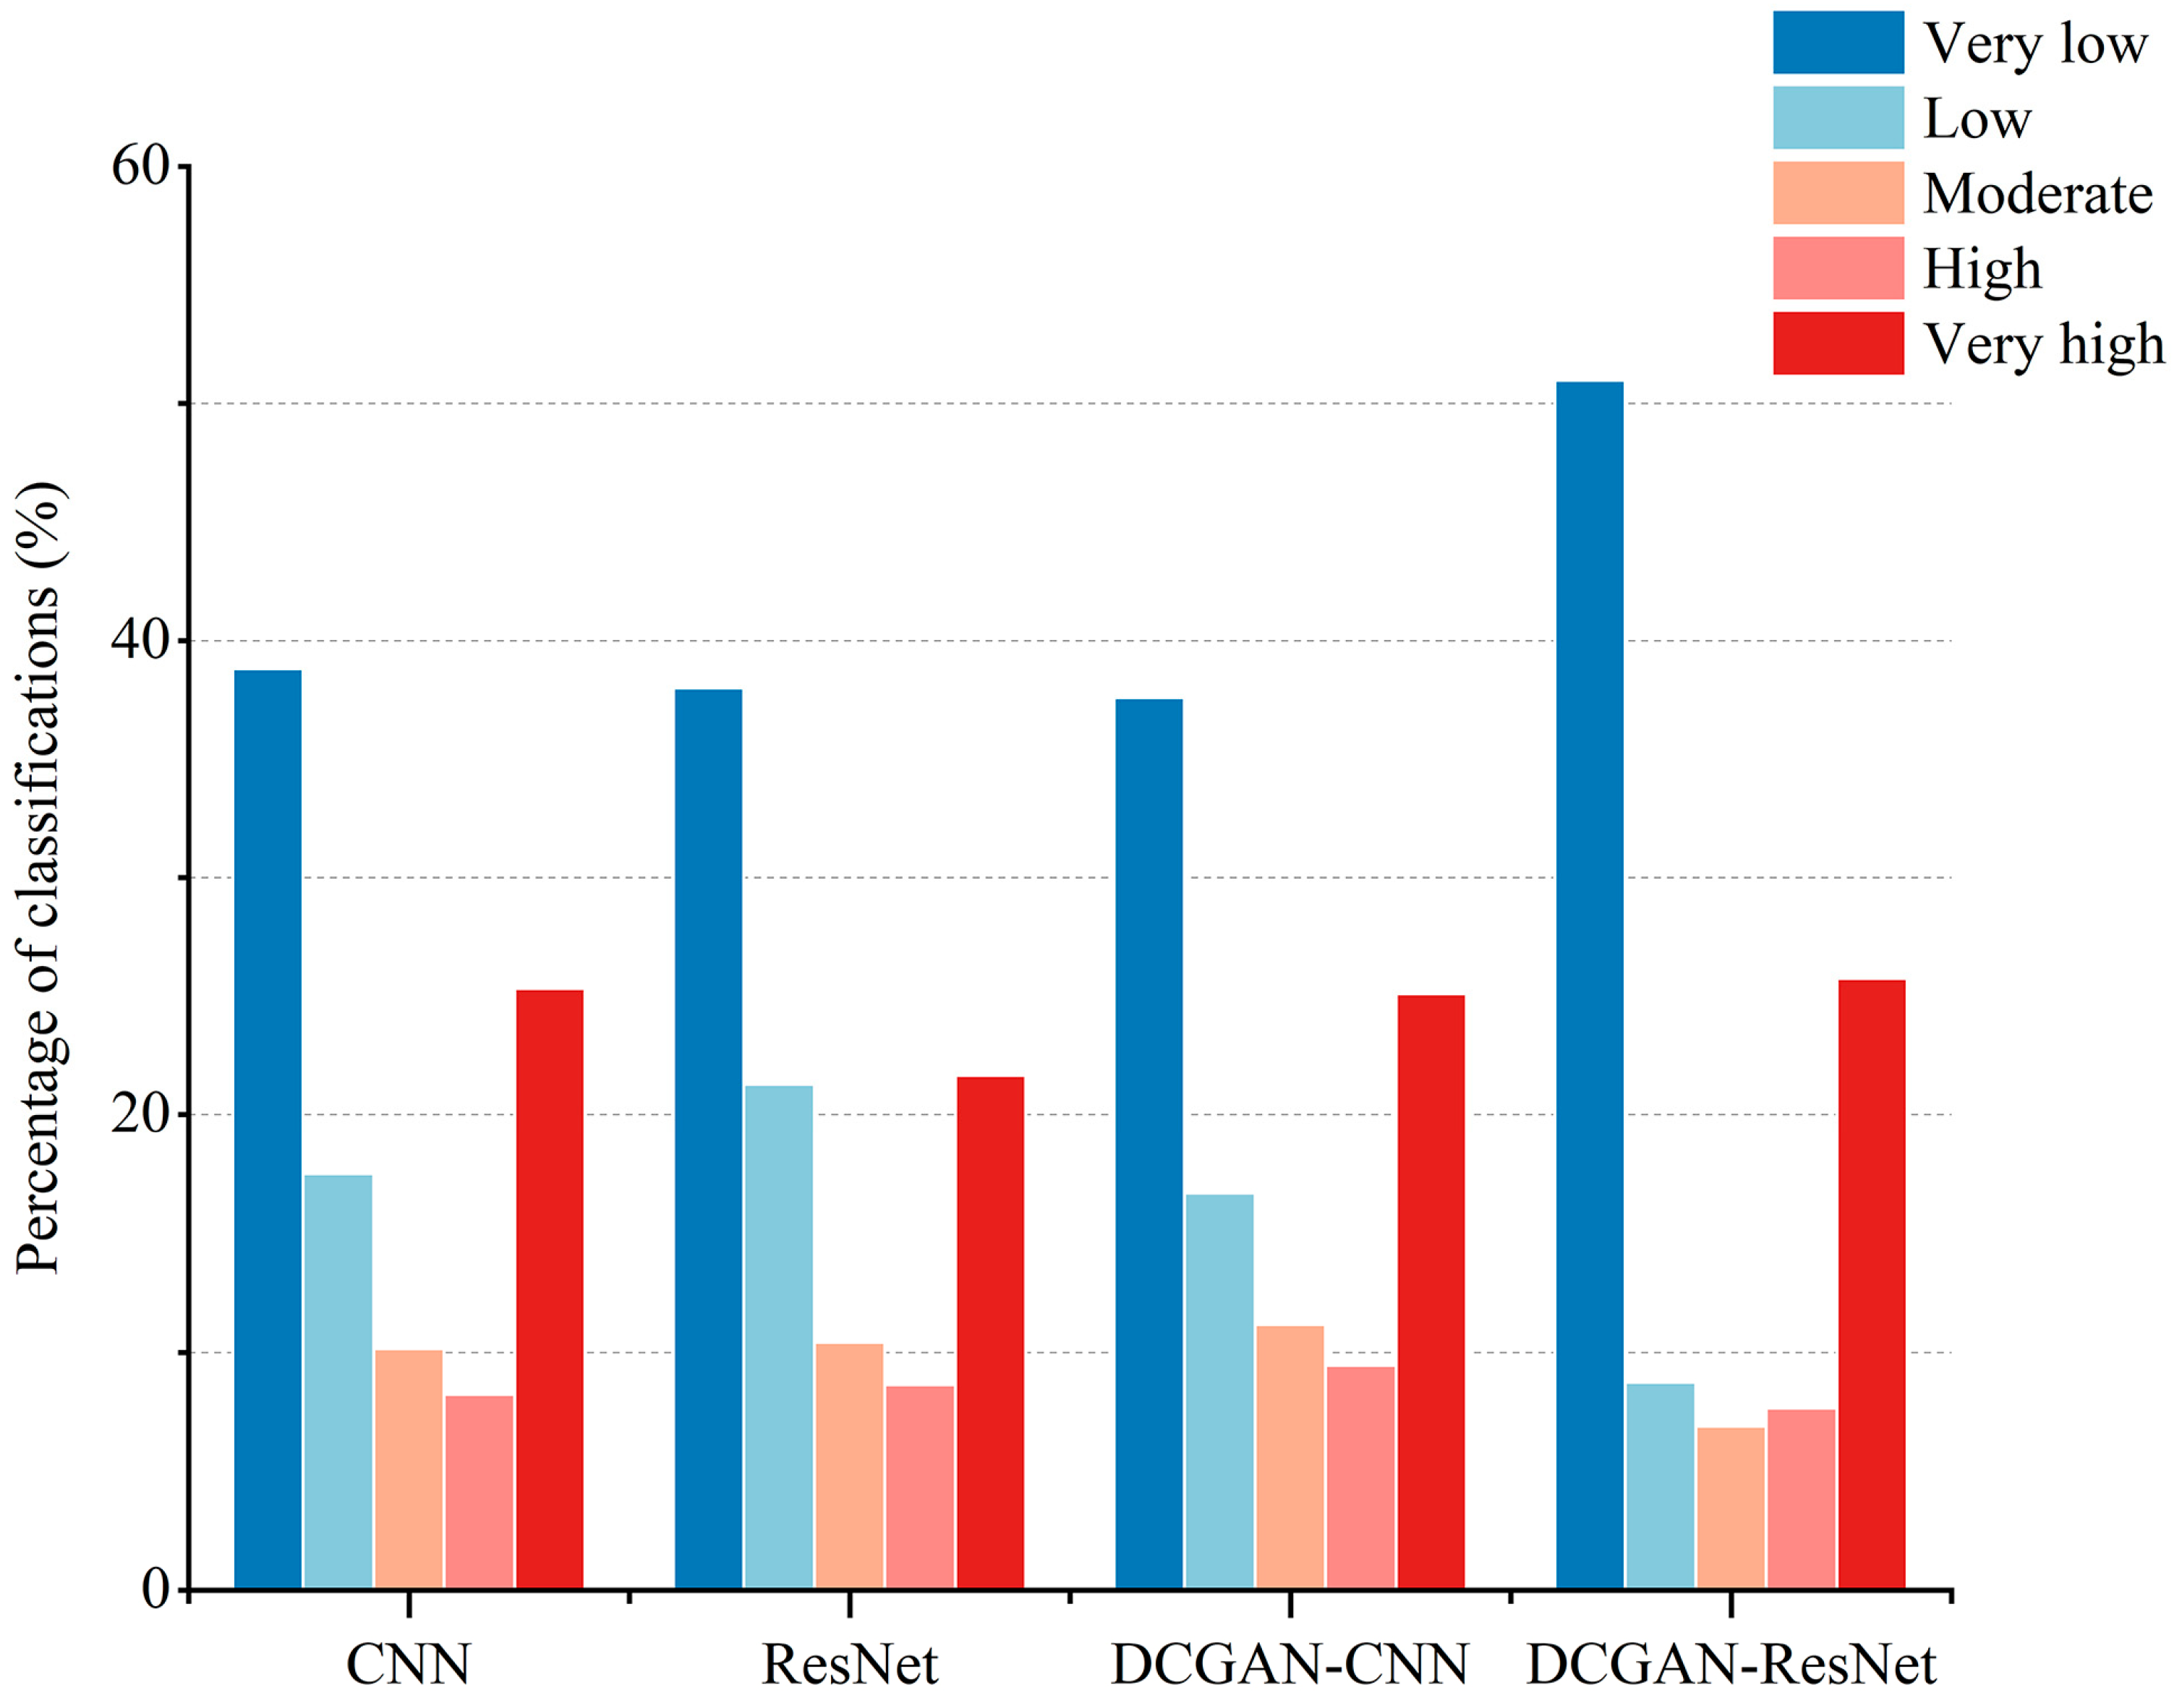
4.3.2. Analysis of Landslide Susceptibility Mapping (LSM)
4.3.3. Validation Based on Large-Scale Landslide Images
5. Discussion
6. Conclusions
Author Contributions
Funding
Data Availability Statement
Acknowledgments
Conflicts of Interest
References
- Fan, X.M.; Scaringi, G.; Korup, O.; West, A.J.; van Westen, C.J.; Tanyas, H.; Hovius, N.; Hales, T.C.; Jibson, R.W.; Allstadt, K.E.; et al. Earthquake-Induced Chains of Geologic Hazards: Patterns, Mechanisms, and Impacts. Rev. Geophys. 2019, 57, 421–503. [Google Scholar] [CrossRef]
- Liu, S.G.; Yang, Y.; Deng, B.; Zhong, Y.; Wen, L.; Sun, W.; Li, Z.W.; Jansa, L.; Li, J.X.; Song, J.M.; et al. Tectonic evolution of the Sichuan Basin, Southwest China. Earth-Sci. Rev. 2021, 213, 103470. [Google Scholar] [CrossRef]
- Zhou, S.Y. Seismicity simulation in Western Sichuan of China based on the fault interactions and its implication on the estimation of the regional earthquake risk. Chin. J. Geophys.-Chin. Ed. 2008, 51, 165–174. [Google Scholar] [CrossRef]
- Chae, B.G.; Park, H.J.; Catani, F.; Simoni, A.; Berti, M. Landslide prediction, monitoring and early warning: A concise review of state-of-the-art. Geosci. J. 2017, 21, 1033–1070. [Google Scholar] [CrossRef]
- Dietrich, W.E., Jr.; Dunne, T. Sediment Budget for a Small Catchment in Mountainous Terrain; Routledge: London, UK, 1978. [Google Scholar]
- Tarboton, D.; Goodwin, C. The SINMAP approach to terrain stability mapping. In Proceedings of the 8th Congress of the International Association of Engineering Geology, Vancouver, BC, Canada, 21–25 September 1998; pp. 21–25. [Google Scholar]
- Reichenbach, P.; Rossi, M.; Malamud, B.D.; Mihir, M.; Guzzetti, F. A review of statistically-based landslide susceptibility models. Earth-Sci. Rev. 2018, 180, 60–91. [Google Scholar] [CrossRef]
- Abdelaziz, M.; Ali, P.Y.; Jie, D.; Jim, W.; Binh, T.; Dieu, T.B.; Ram, A.; Boumezbeur, A. Machine learning methods for landslide susceptibility studies: A comparative overview of algorithm performance. Earth-Sci. Rev. 2020, 207, 103225. [Google Scholar] [CrossRef]
- Bahareh, K.; Biswajeet, P.; Seyed, A.N.; Alireza, M.; Shattri, M. Assessment of the effects of training data selection on the landslide susceptibility mapping: A comparison between support vector machine (SVM), logistic regression (LR) and artificial neural networks (ANN). Geomat. Nat. Hazards Risk 2018, 9, 49–69. [Google Scholar] [CrossRef]
- Hakim, W.L.; Rezaie, F.; Nur, A.S.; Panahi, M.; Khosravi, K.; Lee, C.W.; Lee, S. Convolutional neural network (CNN) with metaheuristic optimization algorithms for landslide susceptibility mapping in Icheon, South Korea. J. Environ. Manag. 2022, 305, 114367. [Google Scholar] [CrossRef]
- Mohan, A.; Singh, A.K.; Kumar, B.; Dwivedi, R. Review on remote sensing methods for landslide detection using machine and deep learning. Trans. Emerg. Telecommun. Technol. 2021, 32, e3998. [Google Scholar] [CrossRef]
- Yu, C.X.; Huo, J.Y.; Li, C.J.; Zhang, Y.N. Landslide Displacement Prediction Based on a Two-Stage Combined Deep Learning Model under Small Sample Condition. Remote Sens. 2022, 14, 3732. [Google Scholar] [CrossRef]
- Hussin, H.Y.; Zumpano, V.; Reichenbach, P.; Sterlacchini, S.; Micu, M.; van Westen, C.; Balteanu, D. Different landslide sampling strategies in a grid-based bi-variate statistical susceptibility model. Geomorphology 2016, 253, 508–523. [Google Scholar] [CrossRef]
- Cubuk, E.D.; Zoph, B.; Mané, D.; Vasudevan, V.; Le, Q.V. AutoAugment: Learning Augmentation Policies from Data. arXiv 2018, arXiv:1805.09501. [Google Scholar] [CrossRef]
- Taylor, L.; Nitschke, G.S. Improving Deep Learning using Generic Data Augmentation. arXiv 2017, arXiv:1708.06020. [Google Scholar] [CrossRef]
- Moreno-Barea, F.J.; Strazzera, F.; Jerez, J.M.; Urda, D.; Franco, L. Forward Noise Adjustment Scheme for Data Augmentation. In Proceedings of the 2018 IEEE Symposium Series on Computational Intelligence (SSCI), Bangalore, India, 18–21 November 2018; pp. 728–734. [Google Scholar] [CrossRef]
- Shorten, C.; Khoshgoftaar, T.M. A survey on Image Data Augmentation for Deep Learning. J. Big Data 2019, 6, 60. [Google Scholar] [CrossRef]
- Yi, X.; Walia, E.; Babyn, P. Generative adversarial network in medical imaging: A review. Med. Image Anal. 2019, 58, 101552. [Google Scholar] [CrossRef]
- Gu, S.W.; Zhang, R.; Luo, H.X.; Li, M.Y.; Feng, H.M.; Tang, X.G. Improved SinGAN Integrated with an Attentional Mechanism for Remote Sensing Image Classification. Remote Sens. 2021, 13, 1713. [Google Scholar] [CrossRef]
- Husam, A.H.A.; Biswajeet, P. Spatial landslide susceptibility assessment using machine learning techniques assisted by additional data created with generative adversarial networks. Geosci. Front. 2021, 12, 625–637. [Google Scholar] [CrossRef]
- Fang, W.; Zhang, F.H.; Sheng, V.S.; Ding, Y.W. A Method for Improving CNN-Based Image Recognition Using DCGAN. Cmc-Comput. Mat. Contin. 2018, 57, 167–178. [Google Scholar] [CrossRef]
- Yongjian, B.; Yongbo, T.; Mingjie, M.; Xiaohui, X.; Yanchao, G.; Hua, G.; Renji, B.; Wei, X. Characteristics and temporal-spatial distribution of geohazards in western Sichuan. Sediment. Geol. Tethyan Geol. 2022, 42, 666–674. [Google Scholar] [CrossRef]
- Liu, T.; Chen, T.; Niu, R.Q.; Plaza, A. Landslide Detection Mapping Employing CNN, ResNet, and DenseNet in the Three Gorges Reservoir, China. IEEE J. Sel. Top. Appl. Earth Observ. Remote Sens. 2021, 14, 11417–11428. [Google Scholar] [CrossRef]
- Liu, G.X.; Dai, E.F.; Xu, X.C.; Wu, W.X.; Xiang, A.C. Quantitative Assessment of Regional Debris-Flow Risk: A Case Study in Southwest China. Sustainability 2018, 10, 2223. [Google Scholar] [CrossRef]
- Chang, Z.L.; Huang, J.S.; Huang, F.M.; Bhuyan, K.; Meena, S.R.; Catani, F. Uncertainty analysis of non-landslide sample selection in landslide susceptibility prediction using slope unit-based machine learning models. Gondwana Res. 2023, 117, 307–320. [Google Scholar] [CrossRef]
- Wubalem, A.; Meten, M. Landslide susceptibility mapping using information value and logistic regression models in Goncha Siso Eneses area, northwestern Ethiopia. SN Appl. Sci. 2020, 2, 807. [Google Scholar] [CrossRef]
- Zeng, C.; Cao, Z.; Su, F.; Zeng, Z.; Yu, C. A dataset of high-precision aerial imagery and interpretation of landslide and debris flow disaster in Sichuan and surrounding areas between 2008 and 2020. China Sci. Data 2022, 7. [Google Scholar] [CrossRef]
- Fan, X.; Scaringi, G.; Xu, Q.; Zhan, W.; Dai, L.; Li, Y.; Pei, X.; Yang, Q.; Huang, R. Coseismic landslides triggered by the 8th August 2017 Ms 7.0 Jiuzhaigou earthquake (Sichuan, China): Factors controlling their spatial distribution and implications for the seismogenic blind fault identification. Landslides 2018, 15, 967–983. [Google Scholar] [CrossRef]
- Xie, W.; Li, X.; Jian, W.; Yang, Y.; Liu, H.; Robledo, L.F.; Nie, W. A Novel Hybrid Method for Landslide Susceptibility Mapping-Based GeoDetector and Machine Learning Cluster: A Case of Xiaojin County, China. ISPRS Int. J. Geo-Inf. 2021, 10, 93. [Google Scholar] [CrossRef]
- Yi, Y.; Zhang, Z.; Zhang, W.; Jia, H.; Zhang, J. Landslide susceptibility mapping using multiscale sampling strategy and convolutional neural network: A case study in Jiuzhaigou region. Catena 2020, 195, 104851. [Google Scholar] [CrossRef]
- Aditian, A.; Kubota, T.; Shinohara, Y. Comparison of GIS-based landslide susceptibility models using frequency ratio, logistic regression, and artificial neural network in a tertiary region of Ambon, Indonesia. Geomorphology 2018, 318, 101–111. [Google Scholar] [CrossRef]
- Li, L.P.; Lan, H.X.; Guo, C.B.; Zhang, Y.S.; Li, Q.W.; Wu, Y.M. A modified frequency ratio method for landslide susceptibility assessment. Landslides 2017, 14, 727–741. [Google Scholar] [CrossRef]
- Castronova, A.M.; Goodall, J.L. A hierarchical network-based algorithm for multi-scale watershed delineation. Comput. Geosci. 2014, 72, 156–166. [Google Scholar] [CrossRef]
- Wang, J.F.; Zhang, T.L.; Fu, B.J. A measure of spatial stratified heterogeneity. Ecol. Indic. 2016, 67, 250–256. [Google Scholar] [CrossRef]
- Yang, J.T.; Song, C.; Yang, Y.; Xu, C.D.; Guo, F.; Xie, L. New method for landslide susceptibility mapping supported by spatial logistic regression and GeoDetector: A case study of Duwen Highway Basin, Sichuan Province, China. Geomorphology 2019, 324, 62–71. [Google Scholar] [CrossRef]
- Zhou, X.Z.; Wen, H.J.; Zhang, Y.L.; Xu, J.H.; Zhang, W.G. Landslide susceptibility mapping using hybrid random forest with GeoDetector and RFE for factor optimization. Geosci. Front. 2021, 12, 101211. [Google Scholar] [CrossRef]
- Radford, A.; Metz, L.; Chintala, S. Unsupervised Representation Learning with Deep Convolutional Generative Adversarial Networks. arXiv 2016. [Google Scholar] [CrossRef]
- Yao, X.; Tham, L.G.; Dai, F.C. Landslide susceptibility mapping based on support vector machine: A case study on natural slopes of Hong Kong, China. Geomorphology 2008, 101, 572–582. [Google Scholar] [CrossRef]
- Bui, D.T.; Tuan, T.A.; Klempe, H.; Pradhan, B.; Revhaug, I. Spatial prediction models for shallow landslide hazards: A comparative assessment of the efficacy of support vector machines, artificial neural networks, kernel logistic regression, and logistic model tree. Landslides 2016, 13, 361–378. [Google Scholar] [CrossRef]
- Huang, Y.; Zhao, L. Review on landslide susceptibility mapping using support vector machines. Catena 2018, 165, 520–529. [Google Scholar] [CrossRef]
- Pradhan, B. A comparative study on the predictive ability of the decision tree, support vector machine and neuro-fuzzy models in landslide susceptibility mapping using GIS. Comput. Geosci. 2013, 51, 350–365. [Google Scholar] [CrossRef]
- Shorten, C.; Khoshgoftaar, T.M. Spatial Correlation and Value Prediction in Convolutional Neural Networks. IEEE Comput. Archit. Lett. 2019, 18, 10–13. [Google Scholar] [CrossRef]
- Wang, Y.; Fang, Z.C.; Hong, H.Y. Comparison of convolutional neural networks for landslide susceptibility mapping in Yanshan County, China. Sci. Total Environ. 2019, 666, 975–993. [Google Scholar] [CrossRef]
- Qin, Z.L.; Zhou, X.Y.; Li, M.Y.; Tong, Y.X.; Luo, H.X. Landslide Susceptibility Mapping Based on Resampling Method and FR-CNN: A Case Study of Changdu. Land 2023, 12, 1213. [Google Scholar] [CrossRef]
- He, K.; Zhang, X.; Ren, S.; Sun, J. Deep Residual Learning for Image Recognition. In Proceedings of the 2016 IEEE Conference on Computer Vision and Pattern Recognition (Cvpr), Las Vegas, NV, USA, 27–30 June 2016; pp. 770–778. [Google Scholar] [CrossRef]
- Ullo, S.L.; Mohan, A.; Sebastianelli, A.; Ahamed, S.E.; Kumar, B.; Dwivedi, R.; Sinha, G. A New Mask R-CNN-Based Method for Improved Landslide Detection. IEEE J. Sel. Top. Appl. Earth Observ. Remote Sens. 2021, 14, 3799–3810. [Google Scholar] [CrossRef]
- Wang, Y.T.; Seijmonsbergen, A.C.; Bouten, W.; Chen, Q.T. Using statistical learning algorithms in regional landslide susceptibility zonation with limited landslide field data. J. Mt. Sci. 2015, 12, 268–288. [Google Scholar] [CrossRef]
- Demoulin, A.; Chung, C. Mapping landslide susceptibility from small datasets: A case study in the Pays de Herve (E Belgium). Geomorphology 2007, 89, 391–404. [Google Scholar] [CrossRef]


| Data Name | Sources | Type | Resolution |
|---|---|---|---|
| Elevation | NASA SRTM DEM | raster | 30 (m) |
| Geological faults | Active tectonic map of China (1:4,000,000) | vector | 1:4,000,000 |
| Road | National Basic Geographic Database | vector | 1:250,000 |
| River system | National Basic Geographic Database | vector | 1:250,000 |
| Lithology | National 1:200,000 digital geological map | vector | 1:200,000 |
| Landform | National 1:200,000 digital geological map | vector | 1:200,000 |
| Soil | 1:1 million soil map of the People’s Republic of China | vector | 1:1,000,000 |
| Precipitation | China Meteorological Administration (CMA) | station | - |
| Land use | GLOBELAND30 | raster | 30 (m) |
| NDVI | Google Earth Engine | raster | 30 (m) |
| Landslide Factors | Value | Landslides | Pixel Number | Frequency Ratios |
|---|---|---|---|---|
| Elevation (m) | <1500 | 762 | 12,521,106 | 10.701 |
| 1500~2100 | 566 | 22,803,722 | 4.364 | |
| 2100~2700 | 378 | 32,203,639 | 2.064 | |
| 2300~3200 | 152 | 31,160,160 | 0.858 | |
| 3200~3600 | 66 | 43,476,058 | 0.267 | |
| 3600~4000 | 51 | 59,416,050 | 0.151 | |
| 4000~4300 | 14 | 54,487,458 | 0.045 | |
| 4300~4600 | 8 | 58,221,426 | 0.024 | |
| >4600 | 3 | 37,378,450 | 0.014 | |
| NDVI | <0.1 | 26 | 11,539,489 | 0.396 |
| 0.1~0.3 | 147 | 36,268,491 | 0.713 | |
| 0.3~0.5 | 788 | 159,049,040 | 0.871 | |
| 0.5~0.7 | 886 | 112,372,150 | 1.386 | |
| >0.7 | 153 | 32,438,852 | 0.829 | |
| Precipitation (mm) | <550 | 155 | 81,219,497 | 0.336 |
| 550~650 | 256 | 93,794,711 | 0.480 | |
| 650~750 | 490 | 106,941,315 | 0.806 | |
| 750~1000 | 798 | 65,695,362 | 2.136 | |
| >1000 | 301 | 4,017,184 | 13.175 | |
| Distance to a river (km) | <1 | 519 | 29232080 | 3.122 |
| 1~3 | 585 | 56,067,215 | 1.835 | |
| 3~6.3 | 402 | 85,449,923 | 0.827 | |
| 6.3~9.6 | 220 | 70,887,607 | 0.546 | |
| 9.6~13 | 143 | 52,398,139 | 0.480 | |
| 13~17 | 80 | 34,924,928 | 0.403 | |
| >17 | 51 | 22,708,218 | 0.395 | |
| Lithology | A (Clastic rock) | 724 | 107,987,222 | 1.179 |
| B (Granite) | 34 | 6,525,398 | 0.916 | |
| C (Metamorphic rock) | 269 | 133,115,327 | 0.355 | |
| D (Continental deposit) | 317 | 49,941,742 | 1.116 | |
| E (Urban) | 239 | 9,216,852 | 4.560 | |
| F (Lake) | 3 | 111,410 | 4.735 | |
| G (Carbonatite) | 251 | 31,535,669 | 1.400 | |
| H (Outcrop) | 0 | 660,414 | 0 | |
| I (Basalt) | 163 | 12,401,449 | 2.311 | |
| Distance to road (km) | <0.5 | 964 | 32,899,167 | 5.152 |
| 0.5~1.5 | 458 | 47,514,033 | 1.695 | |
| 1.5~3.5 | 314 | 71,330,026 | 0.774 | |
| 3.5~6 | 136 | 61,810,401 | 0.387 | |
| 6~10 | 63 | 58,396,257 | 0.190 | |
| 10~15 | 31 | 36,685,427 | 0.149 | |
| >15 | 34 | 43,032,799 | 0.139 |
| Landslide Factors | VIF | TOL |
|---|---|---|
| Aspect | 1.00676 | 0.99329 |
| Lithology | 1.09788 | 0.91085 |
| Profile curvature | 1.1011 | 0.90818 |
| Plan curvature | 1.22913 | 0.81358 |
| Distance to fault | 1.28592 | 0.77765 |
| Landform | 1.35468 | 0.73818 |
| NDVI | 1.41616 | 0.70613 |
| Land use | 1.45153 | 0.68892 |
| Distance to a river | 1.45996 | 0.68495 |
| Soil | 1.8564 | 0.53868 |
| Relief amplitude | 1.99312 | 0.50173 |
| Precipitation | 2.34496 | 0.42645 |
| Distance to road | 2.64131 | 0.37860 |
| SPI | 4.15778 | 0.24051 |
| TWI | 4.18707 | 0.23883 |
| Elevation | 5.88457 | 0.16994 |
| STI | 9.73319 | 0.10274 |
| Slope | 11.0813 | 0.09024 |
| Hyperparameter | DCGAN | CNN | ResNet18 |
|---|---|---|---|
| Kernel | 4 × 4 | 3 × 3 | 3 × 3 |
| Pooling | - | 2 × 2 | 3 × 3 |
| Activation Function | D: LeakyReLU G: Tanh,ReLu | Tanh | ReLU |
| Optimizer | Adam | Adam | Adam |
| Loss Function | BCELoss | CELoss | CELoss |
| Learning Rate | D: 0.0002 G: 0.001 | 5 × 10⁻⁴ | 5 × 10⁻⁴ |
| Epoch | 6000 | 150 | 150 |
| Model | ACC% | PRE | TPR | F1-Socer | MCC |
|---|---|---|---|---|---|
| SVM | 77.08 | 0.7627 | 0.7607 | 0.7604 | 0.5236 |
| CNN | 86.69 | 0.8631 | 0.8731 | 0.8681 | 0.7339 |
| ResNet | 86.50 | 0.8718 | 0.8401 | 0.8557 | 0.7294 |
| DCGAN-SVM | 79.26 | 0.7927 | 0.7906 | 0.7826 | 0.5853 |
| DCGAN-CNN | 89.26 | 0.9074 | 0.8741 | 0.8899 | 0.7856 |
| DCGAN-ResNet | 91.78 | 0.9149 | 0.9094 | 0.9121 | 0.8257 |
| Model | Very Low | Low | Moderate | High | Very High |
|---|---|---|---|---|---|
| CNN | 0 | 0 | 12.24% | 28.68% | 59.08% |
| ResNet | 0 | 0 | 19.62% | 60.42% | 19.96% |
| DCGAN-CNN | 0 | 0 | 16.37% | 22.65% | 60.98% |
| DCGAN-ResNet | 0 | 4.15% | 5.79% | 24.79% | 66.5% |
Disclaimer/Publisher’s Note: The statements, opinions and data contained in all publications are solely those of the individual author(s) and contributor(s) and not of MDPI and/or the editor(s). MDPI and/or the editor(s) disclaim responsibility for any injury to people or property resulting from any ideas, methods, instructions or products referred to in the content. |
© 2024 by the authors. Licensee MDPI, Basel, Switzerland. This article is an open access article distributed under the terms and conditions of the Creative Commons Attribution (CC BY) license (https://creativecommons.org/licenses/by/4.0/).
Share and Cite
Tong, Y.; Luo, H.; Qin, Z.; Xia, H.; Zhou, X. Enhanced Landslide Susceptibility Assessment in Western Sichuan Utilizing DCGAN-Generated Samples. Land 2025, 14, 34. https://doi.org/10.3390/land14010034
Tong Y, Luo H, Qin Z, Xia H, Zhou X. Enhanced Landslide Susceptibility Assessment in Western Sichuan Utilizing DCGAN-Generated Samples. Land. 2025; 14(1):34. https://doi.org/10.3390/land14010034
Chicago/Turabian StyleTong, Yuanxin, Hongxia Luo, Zili Qin, Hua Xia, and Xinyao Zhou. 2025. "Enhanced Landslide Susceptibility Assessment in Western Sichuan Utilizing DCGAN-Generated Samples" Land 14, no. 1: 34. https://doi.org/10.3390/land14010034
APA StyleTong, Y., Luo, H., Qin, Z., Xia, H., & Zhou, X. (2025). Enhanced Landslide Susceptibility Assessment in Western Sichuan Utilizing DCGAN-Generated Samples. Land, 14(1), 34. https://doi.org/10.3390/land14010034