1. Introduction
UAs are regional complexes centered around mega-cities, relying on an interwoven network of infrastructure to form areas with close economic ties, compact spatial organization, and integrated urban functions [
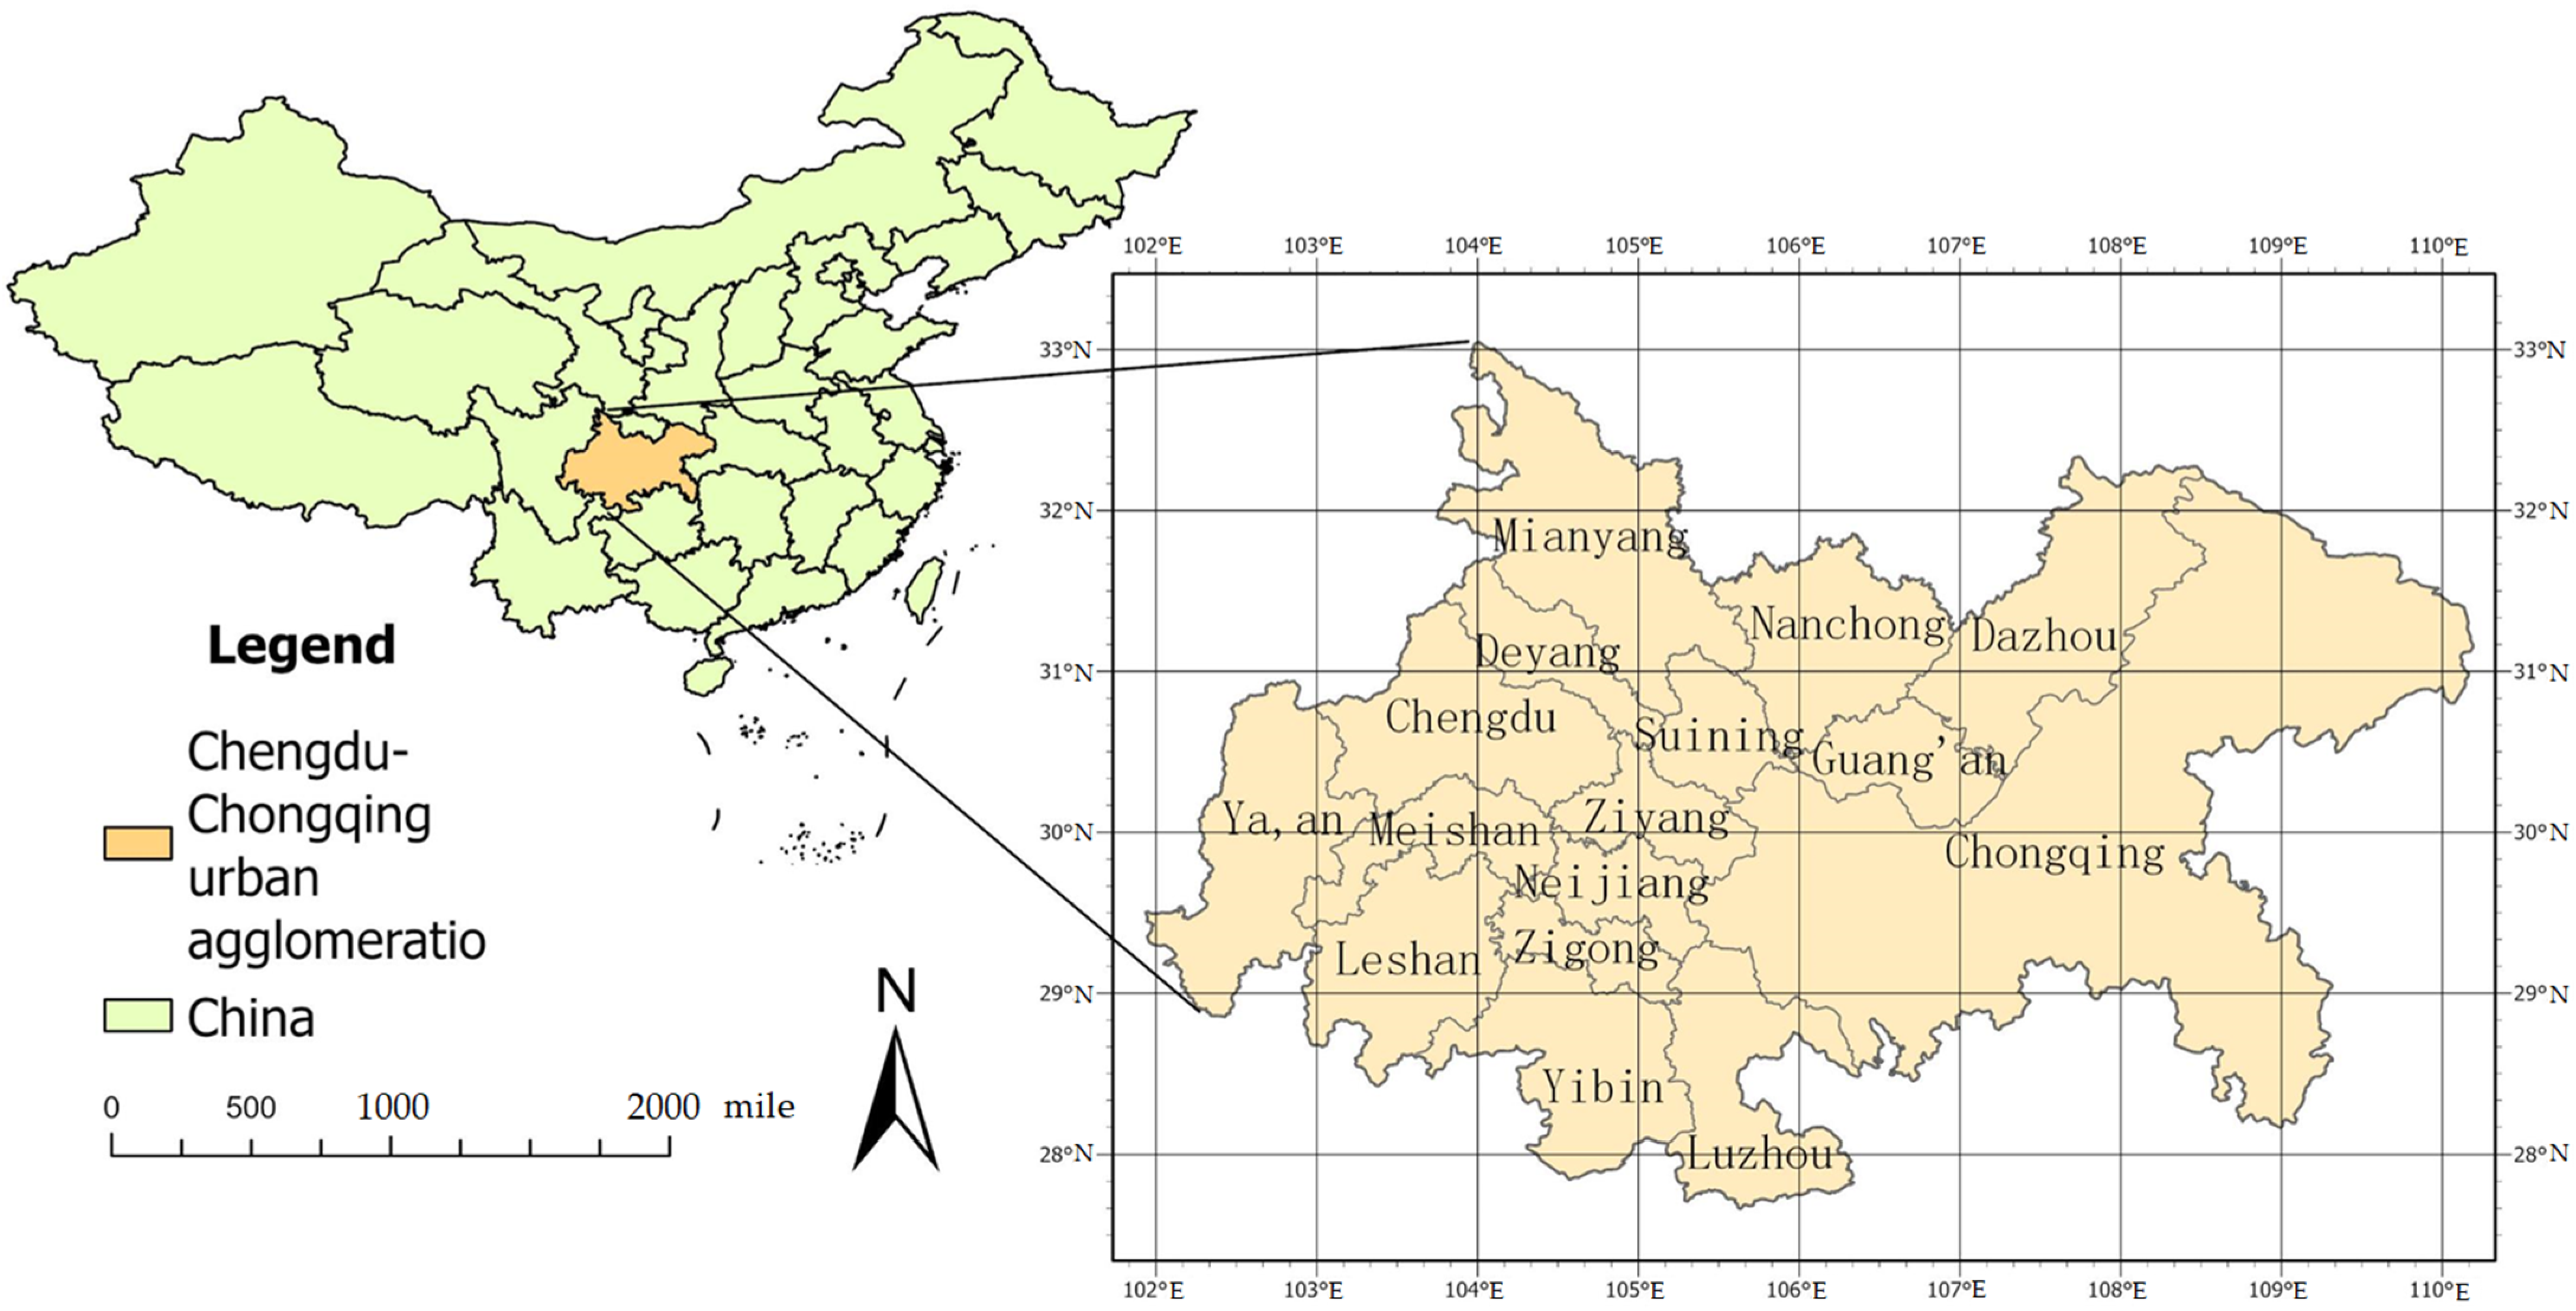
1]. However, the CCUA exhibits immaturity in its urban scale hierarchy, with Chengdu and Chongqing serving as dual core cities, presenting a bipolar characteristic and significant siphoning effects. The development level of secondary cities has experienced a collapse, leading to highly uncoordinated regional development, which is detrimental to the coordinated and integrated development of the regional space [
2].
The spatial pattern of UAs refers to the spatial relationships among various elements within the agglomeration. Its rationality affects the efficiency of resource allocation within the UAs and is a reflection of the high-quality development and regional integration level of the UAs [
3]. Current research on the spatial structure of UAs often employs classic geographical spatial models [
4]. Based on the spatial location and scale distribution of cities, these studies draw on gravity models [
5], accessibility models [
6], and interaction models [
7] to analyze the urban hierarchy or rank-size patterns [
8]. Reilly W J’s “Retail Gravitation Law” is the foundation for quantitatively analyzing economic connections between cities [
9]; Simeon Dankov and others used the gravity model, based on trade flow data, to study the changes in economic connections in the Soviet Union over a decade [
10]; and Hidenobu Matsumoto employed the gravity model to study the intensity of air traffic flows, thereby analyzing the network characteristics of UAs [
11].
The concept of “flow space” provides a new perspective for the study of urban spatial structure connections [
12], shifting the focus from geographical space to flow space. The movement of materials is no longer limited by whether the geographical locations are adjacent, and the flow of elements is more considered as an activity. Various elements flow within a certain spatial range, forming a cross-space social resource sharing. Research centered on spatial networks and flows has become the dominant paradigm in regional studies [
13]. In 1989, Castells proposed the theory of flow space, which gave rise to the research perspective of urban networking [
14]. Different from the traditional urban system perspective based on central place theory, the urban network perspective pays more attention to the interaction and linkage between cities and regions. The study of form and hierarchy under the central place paradigm is transformed into the study of urban network structure under the flow paradigm [
15]. From the research process of spatial structure, it can be seen that regional spatial structure is mainly divided into two levels: morphological spatial structure and flow spatial structure. The morphological spatial structure presents the pattern and state of the spatial layout of resource elements, while the flow spatial structure mainly describes the flow activities of elements in space. The flow spatial structure reflects the circulation, diffusion, and transfer of elements in space and is ultimately mapped onto the morphological space [
16]. This effectively meets the demands of the integrated spatial structure of urban agglomeration. The flow of elements between cities within the agglomeration promotes regional integration and ultimately forms the spatial structure and regional development model of the urban agglomeration in the physical space.
From the perspective of flow space, spatial network analysis is compared to traditional research paradigms; firstly, it models the relationships of urban agglomeration regional spatial structures through network models, which promotes the understanding of the connections between regional spatial units; secondly, it broadens the dimensions of data analysis [
17]. Currently, urban network analysis mainly uses flow data and social network analysis methods for a comprehensive qualitative and quantitative analysis. Manuel Curado and others analyzed the research methods for measuring urban network centrality and proposed new centrality measurement approaches on this basis [
18]. Tianyu Wang and others used taxi trajectory data from Shanghai, employing complex network analysis and community detection to study the hierarchical structure of polycentric cities [
19]. From the perspective of network analysis, cities are regarded as nodes in the network, and the flow of elements is the carrier of the network flow. Taylor P J and others pointed out that the network between cities has characteristics of fluidity and nodality, and proposed the characteristics of horizontal connections between cities, which complements and develops the traditional central hierarchy model [
20]. In terms of the interaction between flowing elements and spatial form, Serok and others used data from London and Lattife to explain the relationship between dynamic traffic flows and static street networks [
21]. It can be seen that the analysis of urban dynamic “flow” data has become a new paradigm for the study of urban spatial network structures, which currently mainly includes economic flows [
22], traffic flows [
23], information flows [
24], and population flows [
25]. Kasper Kerkman and others constructed an urban traffic network model based on traffic flow in a certain urban area in the Netherlands [
26].
In the discussion of factors influencing the characteristics of urban spatial network connections, regarding the flow of elements, the book “Cities, Regions and Flows” authored by Hesse M et al. in 2013 revealed that the flow of goods between network nodes is influenced by the flow of information, and explored the interplay between cities, regions, and flows [
27]. Some scholars have found that the main tourist flow in China occurs between metropolises or within urban agglomerations, which is largely related to the tourism resources and economic development level of the cities. Additionally, due to seasonal variations, there is a significant difference in tourist flow between the northern and southern regions of China [
28]. Liu et al., through the analysis of the actual service range and capacity of urban functions and the characteristics of population flow, proposed a population flow network associated with functional linkages, quantifying the impact of urban functional accessibility on population mobility [
29].
In complex network systems characterized by the flow of elements, Bo Wang and others used data from online media to study the hierarchical structure characteristics of Chinese cities in the virtual space network under the information flow space, and evidence showed that network hierarchy features are influenced by specific social, economic, and political factors [
30]. Mirzaee Salas and others used Twitter data to explore the spatial network characteristics of intercity population flows in Boston, and polynomial regression analysis indicated that race and income levels of populations have a significant impact on the formation of network patterns [
31]. Bindong Sun and others analyzed the overall pattern of city networks through the client-service relationships of law firms and proposed that administrative factors, market economy, and spatial patterns are the main influencing factors in shaping spatial networks [
32].
The scale and scope of spatial networks also affect the positional relationships of cities within the spatial network. The roles that cities play and the dimensions measured within global, national, and regional network contexts can vary. Scholars have analyzed the positional relationships and economic connections of cities in the world city network through the Australian enterprise network, providing scientific guidance for better formulating global urban strategies [
33]. Ye Wei analyzes the three-node and four-node colored patterns of passenger air routes from a microstructural perspective and explores the impact of microstructures on the viability of airline networks [
34]. With the rapid development of urban agglomeration networks, the connections within these agglomerations have become increasingly intertwined, forming a complex network system characterized by the flow of population, capital, information, and other elements. This has reshaped the spatial structure and functional positioning of urban agglomerations. The urban spatial network at the scale of UAs is becoming an important characteristic of regional spatial organization [
35]. The Yangtze River Delta urban agglomeration, as the region with the highest population density in China, exhibits characteristics of spatial dependence and hierarchy in its spatial network when viewed from the perspective of ride-hailing travel data. The strength of network connections is closely related to the level of economic development of the cities [
36]. A comparison between Spring Festival travel and regular period travel shows that during the Spring Festival (Chunyun) period, population flow and migration in the Yangtze River Delta urban agglomeration mainly occur through secondary network relationships, while during regular times, population flow primarily relies on primary network paths. Economic scale, political resources, industrial structure, and historical foundations are the main factors affecting population mobility in the Yangtze River Delta urban agglomeration [
37]. The spatial network of the Central Plains urban agglomeration, with the Zhengzhou metropolitan area as its core, shows that the network density and connection strength of the Zhengzhou metropolitan area are the highest. Regional Gross Domestic Product (GDP), online shopping index, population density, and the number of logistics network points are significant factors affecting the strength of network connections in the Central Plains urban agglomeration [
38].
However, based on current research on urban spatial connections, existing studies focusing on single-element flows have confirmed the important position of element flows in the development of modern cities, but exploring the spatial structure characteristics of element flows is difficult to fully reflect the overall spatial pattern. For urban agglomeration studies, it is more necessary to summarize the differentiation characteristics between cities under different element flows from a multi-dimensional perspective of element flows. On the level of influencing factors, most existing studies are based on qualitative analysis, lacking a quantitative perspective to specifically analyze the degree of influence of different elements, and the selection of influencing elements is also not comprehensive enough. Finally, at the research scale level, there is also a lack of research from the perspective of urban agglomeration, summarizing the significance of element flow to regional integrated sustainable development and formulating corresponding regional development strategies.
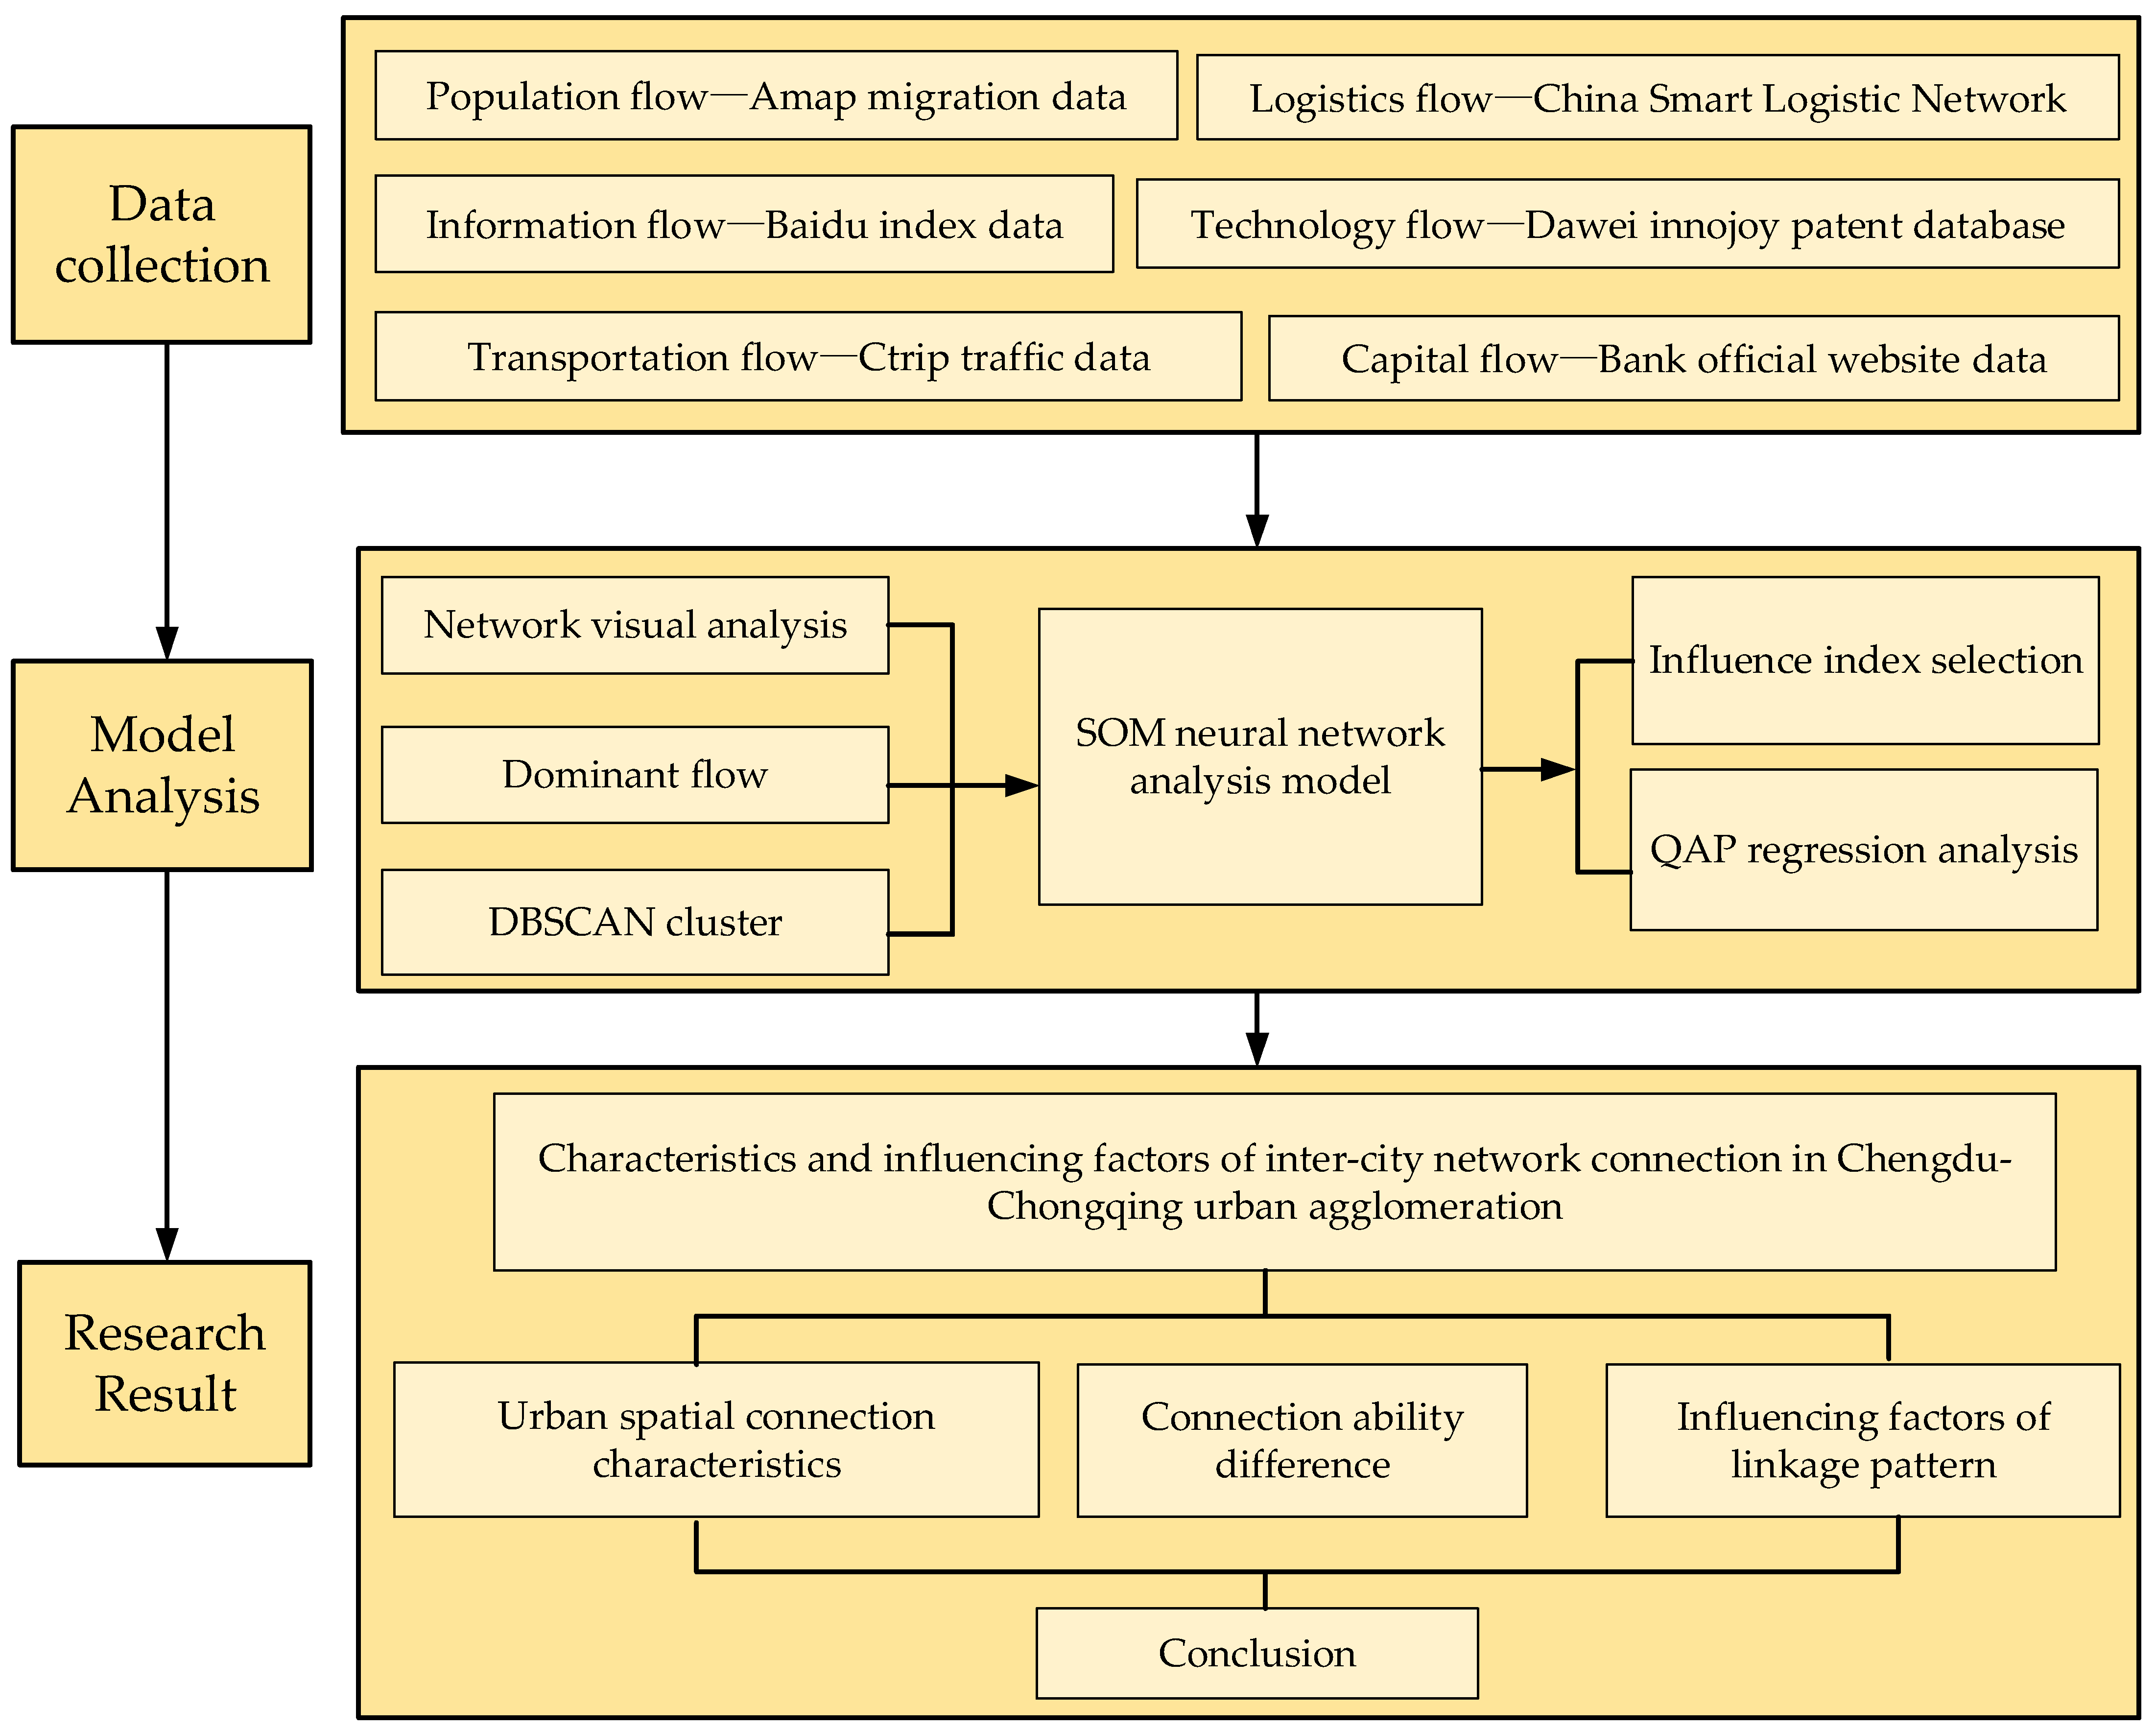
Based on this, this paper intends to take the CCUA as an example, from the perspective of multi-source element flow space, by collecting population migration data, Baidu Index data, Ctrip transportation schedule data, logistics data, technology flow data, and capital flow data. It employs research methods such as network visualization analysis, SOM neural network machine learning models, and QAP relational regression models to study the spatial connection characteristics and influencing factors of the CCUA, which holds an important strategic position in the western region and proposes a scientific basis for the optimization of the spatial connection pattern of the CCUA.
3. Results
3.1. Analysis of the Characteristics of Interurban Spatial Network Connection
- (1)
Network connection pattern
Using ArcGIS10.8 software, the inter-element contact patterns between cities in the CCUA are visualized, and the natural break point grading method is used to divide the contacts into five levels, forming 120 multi-dimensional element contact maps with different levels of association (
Figure 4). In terms of urban spatial network contacts, within the multi-dimensional element flow network, Chengdu and Chongqing have the closest interval contacts, forming the spatial backbone of the multi-dimensional element flows; among them, the Chengdu-Deyang-Meishan association interval and the Chongqing-Guang’an association interval have a relatively strong stability, mainly in the second and third levels; the network structure between other cities will show multi-faceted differentiated characteristics due to different element flows, mainly in the fourth and fifth levels.
In terms of multi-dimensional element flow contacts, the structure of population flow and technology flow is similar, mainly reflecting the dendritic backbone network with Chengdu and Chongqing as the main core nodes. The radiating and driving ability of Chengdu as the core city is significantly higher than that of Chongqing, and the overall grading results of the elements show that there are more contacts at the fourth and fifth levels. Chengdu has particularly close ties with surrounding cities such as Mianyang, Deyang, and Meishan, where the intensity of population flow is high, demonstrating Chengdu’s leading role in regional development. There is a significant difference in the level of element flow between different cities within the UAs, and the trend of western city clusters serving as centers of element flow is becoming more pronounced. Among them, Chongqing has established a strong association with the western core city of Chengdu, which helps to promote the integrated development of the CCUA.
In the logistics network, Chengdu and Chongqing serve as the core nodes of the region, likely because they are the economic centers of the area. Logistics connections geographically exhibit a radiating structure centered around Chongqing and Chengdu, with Chongqing’s radiating intensity being greater than Chengdu’s. Logistics show a certain concentration geographically, mainly focused on Chongqing, Chengdu, and their surrounding cities, forming close-knit logistics networks with neighboring cities. Neijiang, Ziyang, and Suining also demonstrate strong logistics connections. This may be related to the geographical location, economic development level, and transportation infrastructure of these cities.
The network of information flow within the UAs presents an interwoven and nested spatial pattern, primarily forming a radiating structural characteristic centered around Chengdu and Chongqing. The intensity of information flow is distributed relatively evenly across the UAs, with a predominance of medium to high levels of contact strength, which may be related to the rapidity and extensive nature of information dissemination. The role of western regional city clusters in information flow is increasingly prominent, aligning with the trends in population flow, technology flow, and logistics flow. This indicates that western city clusters are gradually becoming important nodes for regional information exchange.
In the transportation flow network, Chongqing and Chengdu once again emerge as the core cities of regional traffic flow. The most intense traffic connections are between these two cities, with the darkest lines indicating the highest volume of traffic flow between them. Chengdu’s traffic connection strength with its neighboring cities significantly surpasses that of other cities. Suining, Nanchong, Meishan, and other cities also show strong traffic connections. These cities may play a role as secondary hubs in the regional transportation network. The entire transportation network exhibits a radiating structure centered on Chongqing and Chengdu, indicating that these two cities are the main origin and destination points for traffic flow. This is likely related to the economic scale, transportation infrastructure, and regional strategic position of these cities.
In terms of capital flow, the internal capital flow within the CCUA shows a clear network characteristic. Chengdu and Chongqing, as the dual cores, are the main hubs of capital flow, with particularly close connections to other cities. The intensity of capital flow between the northern cities of the UAs and the core cities is significantly higher than that between the southern cities. This pattern is likely mainly due to Chengdu and Chongqing transferring some industries to the northern cities, such as Nanchong and Deyang, which has driven the industrial development and investment attraction of these cities. Capital flow not only promotes the optimal allocation of resources but also strengthens the economic connections between cities, enhancing the overall competitiveness of the entire region.
- (2)
Network group characteristics
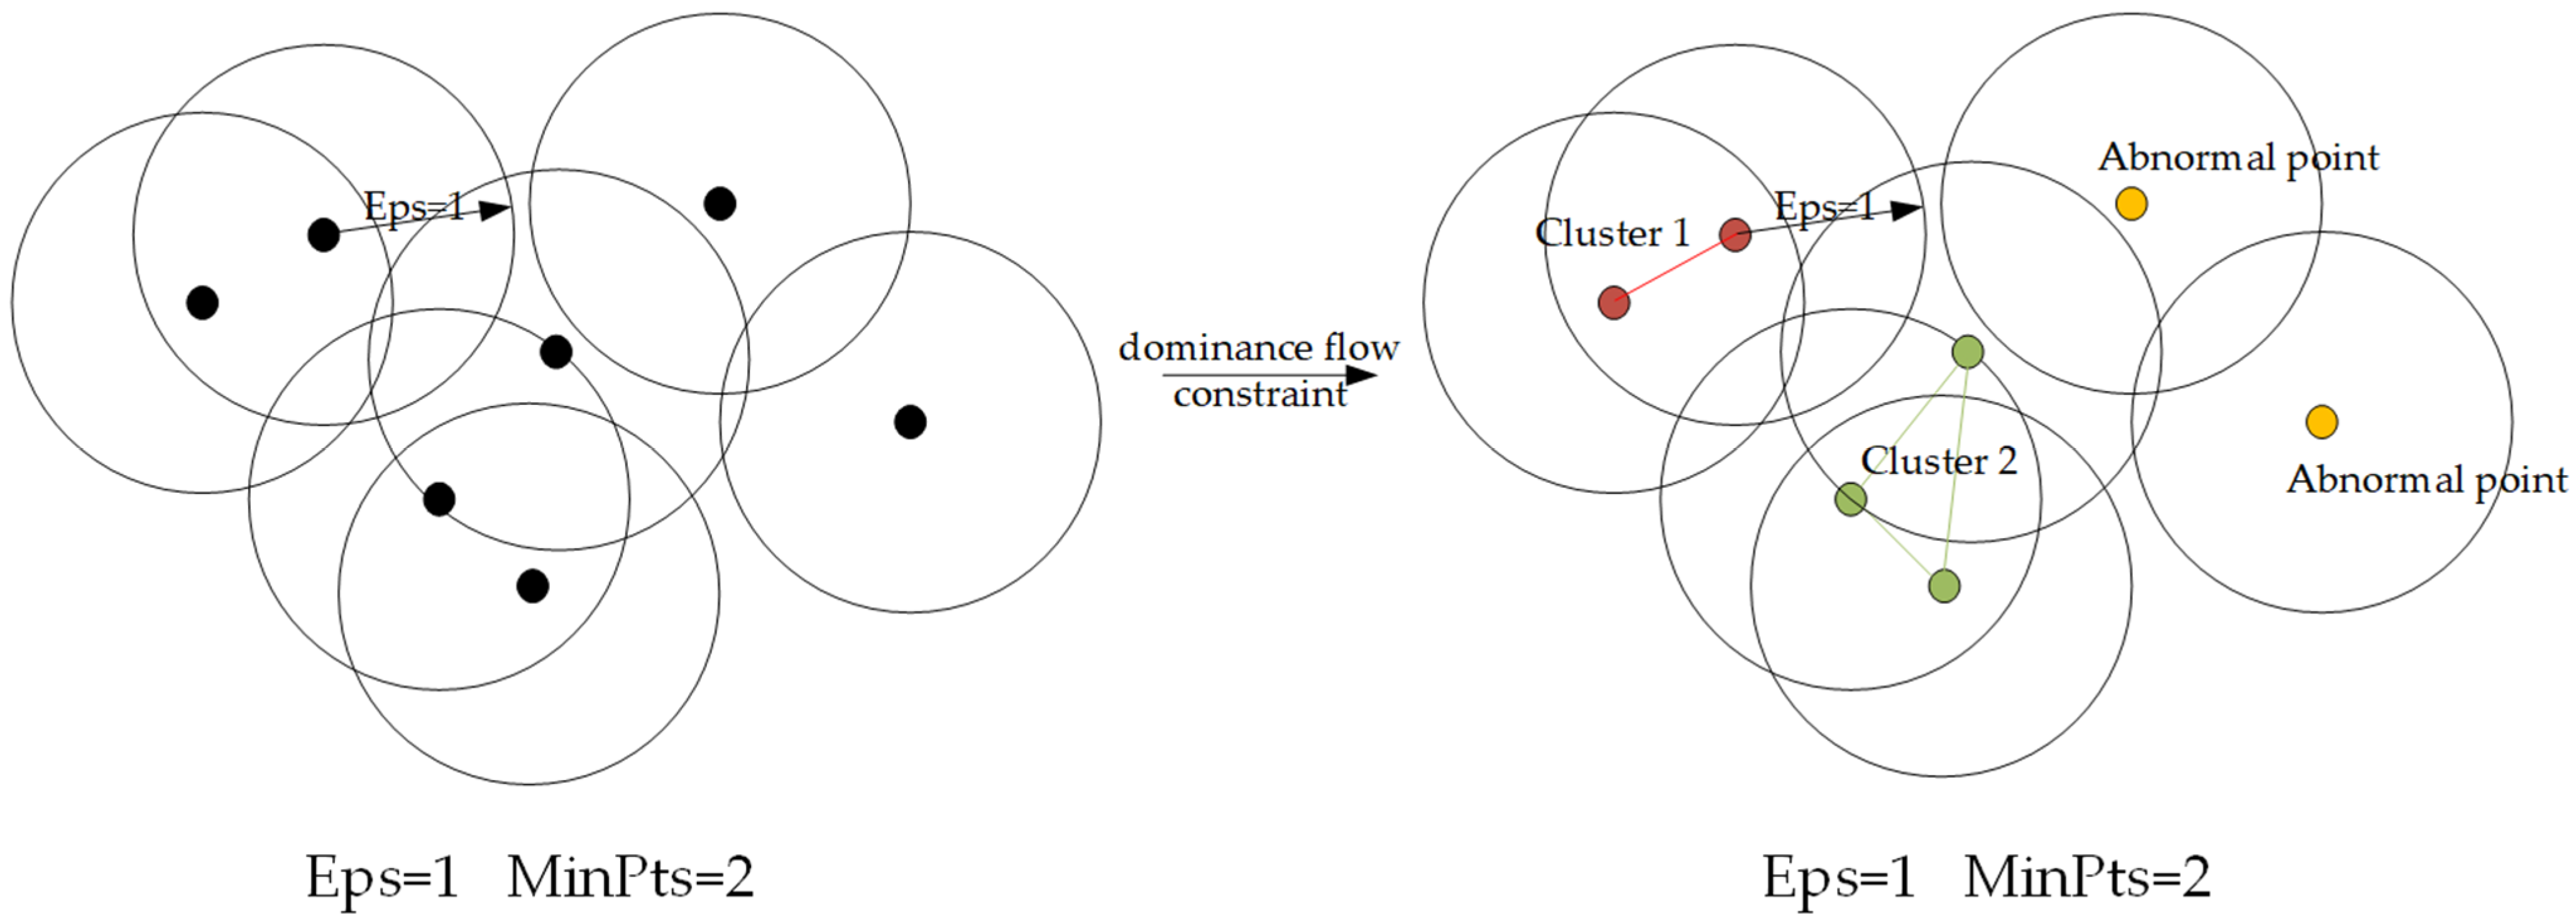
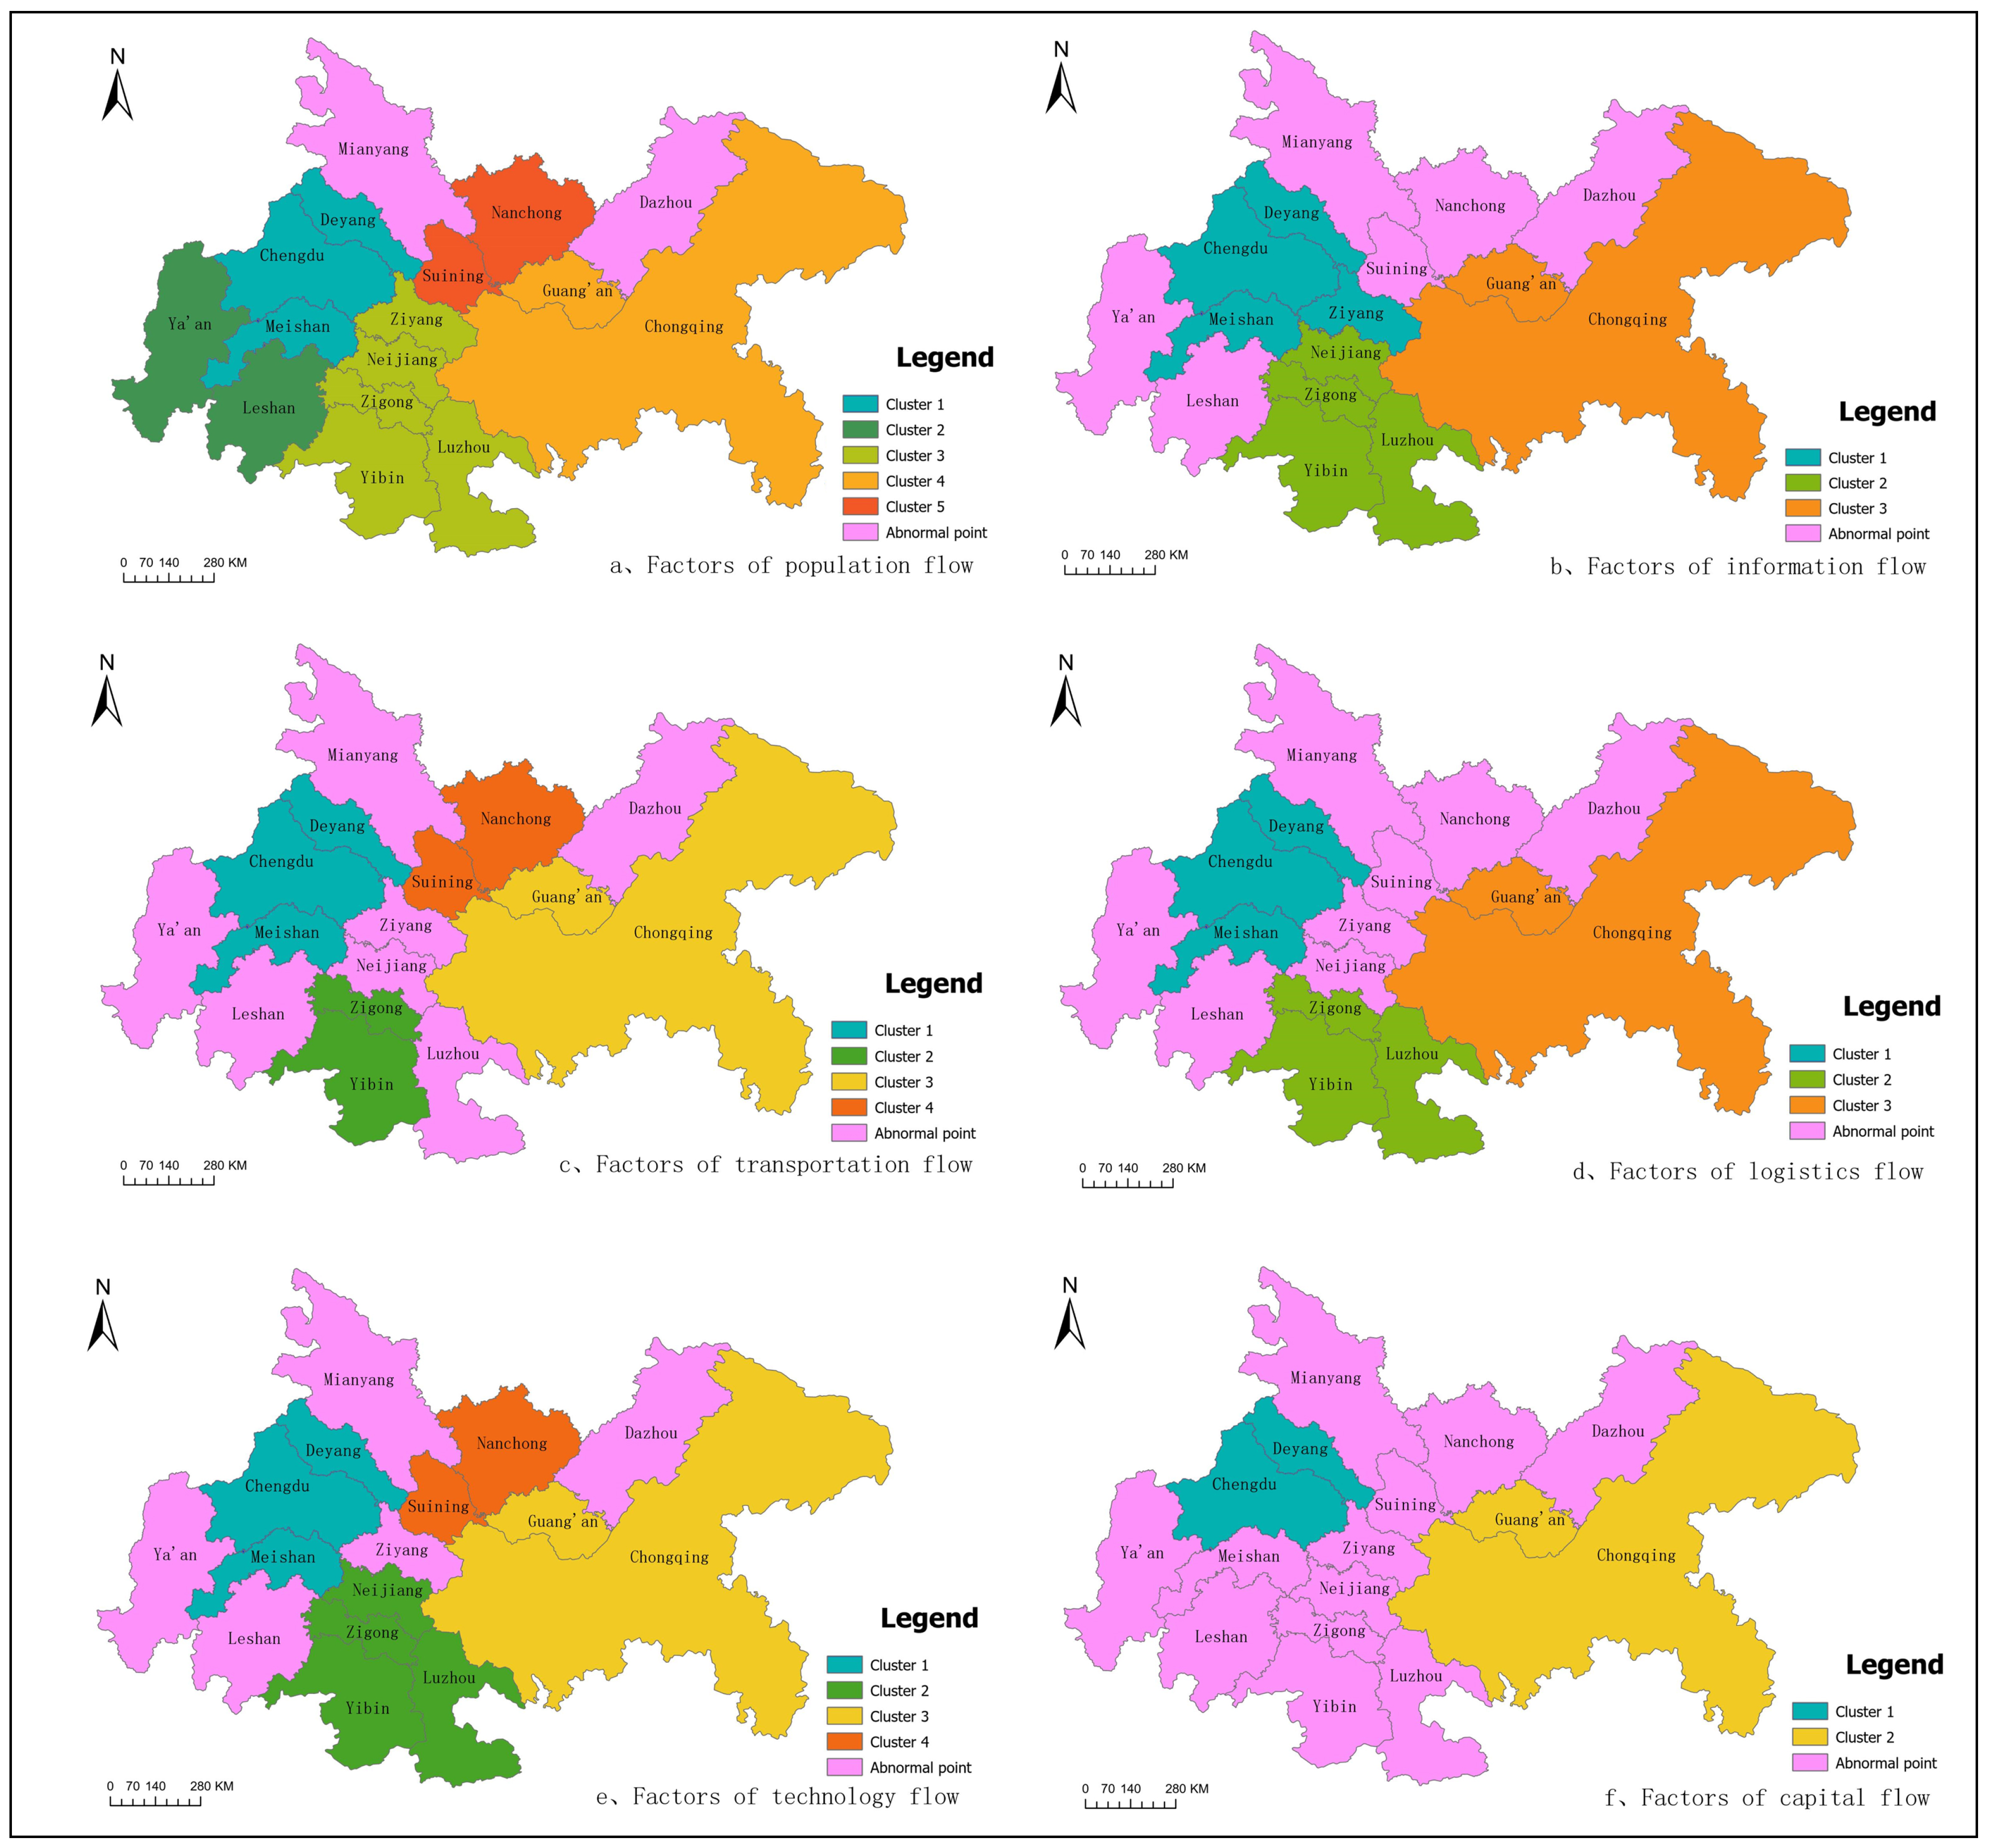
The top 50% of the multi-dimensional factor flow is taken as the dominant flow, drawing on the 1-h commuting standard, selecting the current largest commuting circle radius distance, setting Eps = 100 km, MinPts = 2, and using the improved DBSCAN clustering method to divide the multi-dimensional factor flow network cluster of CCUA, so that the elements between cities are closely linked and spatially adjacent (
Figure 5).
The results of the six-dimensional factor flow network cluster division reflect the heterogeneity characteristics of the elements in the spatial network group. Under the development requirements of the 1-h commuting circle, the factor flow between cities shows the characteristics of differentiated group. Among them, Chengdu-Deyang-Meishan is divided into a cluster in the multi-dimensional factor flow. Only in the capital flow, Meishan has a weak connection and is divided into abnormal points, indicating that the commuter circle of Chengdu has obvious group characteristics. The flow of factors between cities is more active and closely related. Chongqing-Guang ’an has established a close relationship between multi-dimensional elements and is divided into a cluster. Among them, in the largest number of population flow network clusters, mainly five clusters, two cities are abnormal points, indicating that the population flow has a stable regional scope, and each group also has its own independence; transportation flow and technology flow have high similarity. The three clusters of Chengdu-Deyang-Meishan, Suining-Nanchong, and Chongqing-Guang’an are consistent. The difference is that, in terms of transportation flow, Zigong-Yibin is divided into a cluster, and Luzhou and Neijiang are identified as abnormal points due to weak traffic links with surrounding cities. In terms of capital flow, two clusters of Chengdu-Deyang and Chongqing-Guang’an are mainly formed, and the remaining cities are abnormal points, indicating that the development of the internal capital network structure of the CCUA is mainly dominated by the development of the two core cities of Chengdu and Chongqing, and the capital investment level of the remaining cities is relatively balanced.
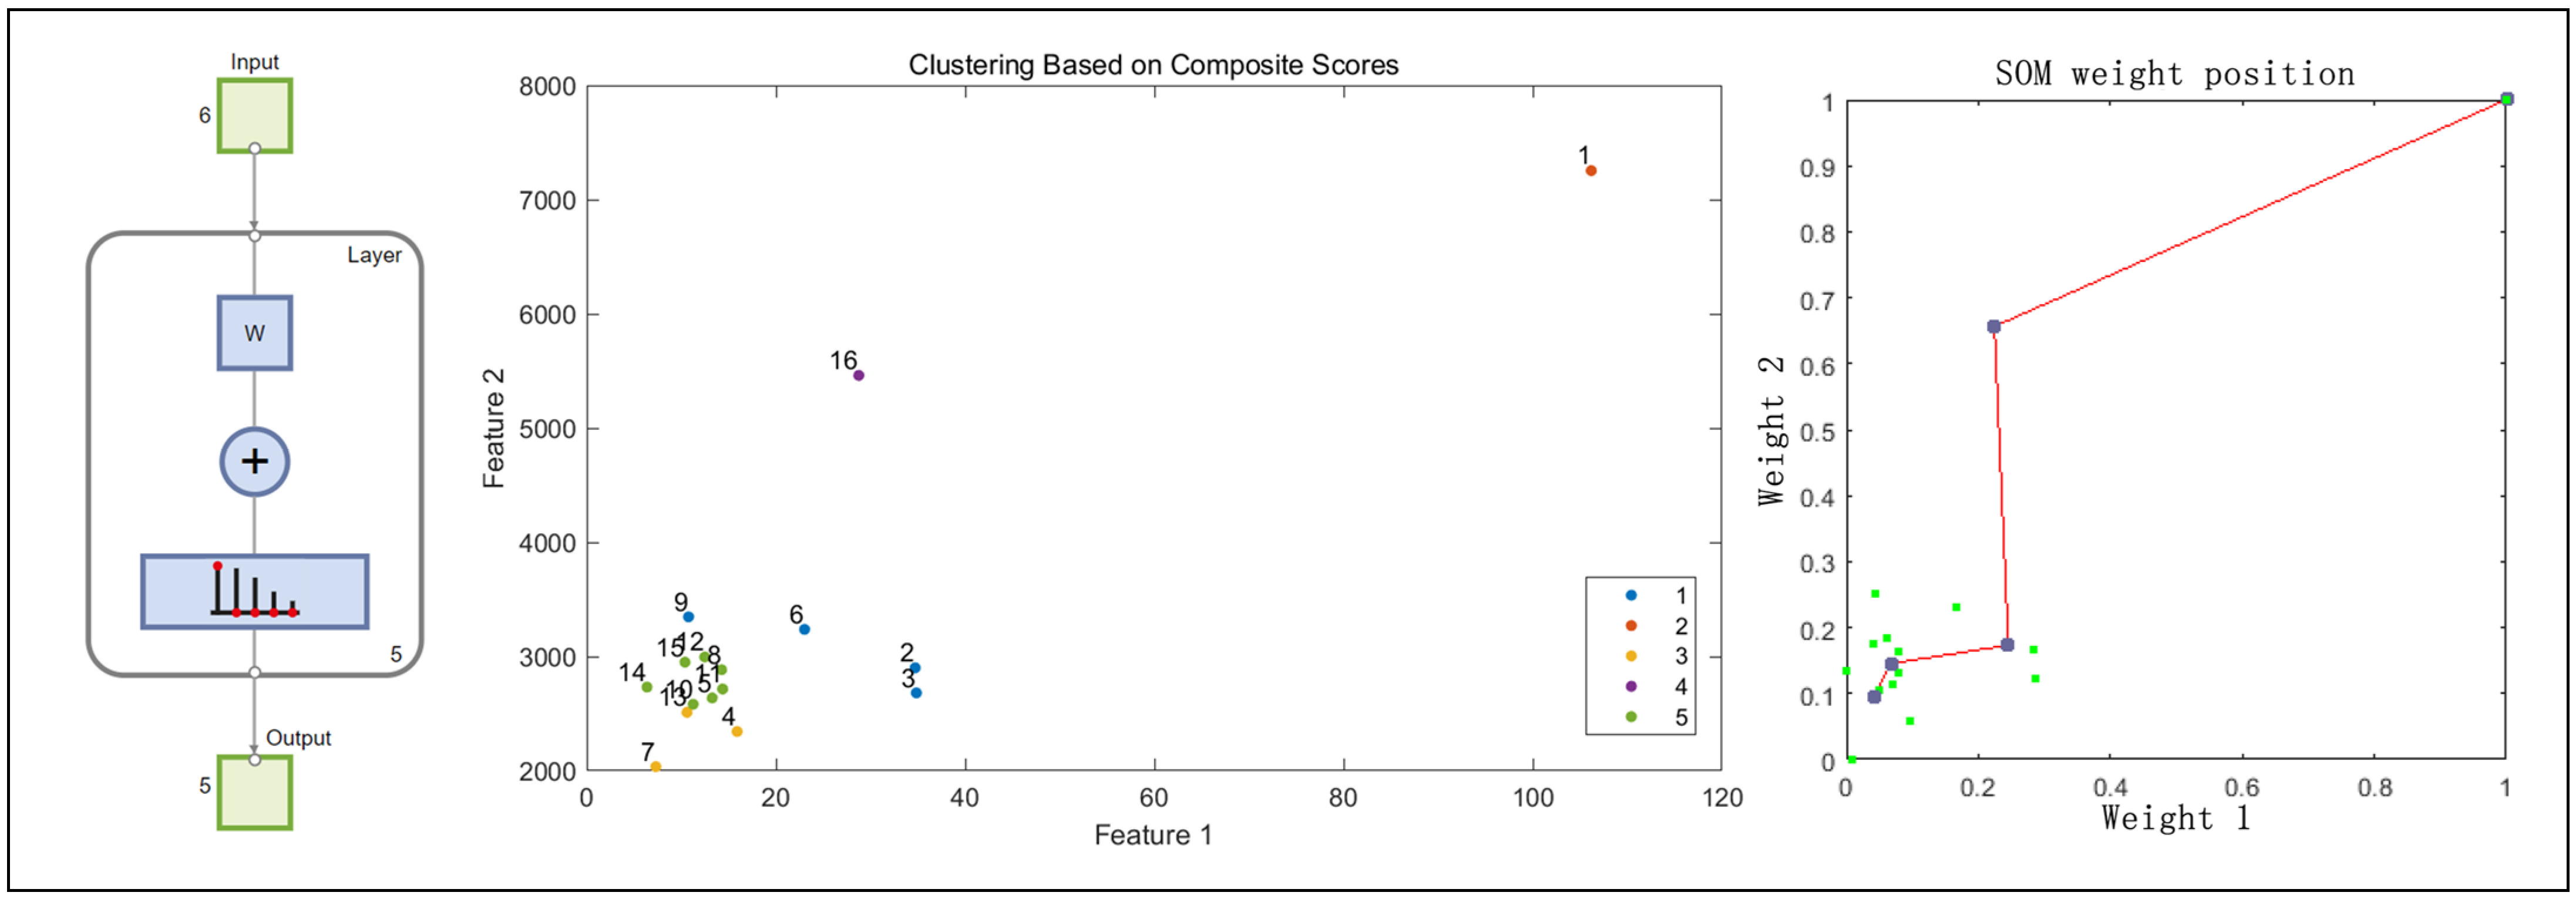
3.2. Difference Analysis of Urban Network Connection Ability Based on the SOM Neural Network Model
Based on the connection characteristics of various elements of CCUA in the previous multi-dimensional factor flow, the SOM neural network analysis model is used to characterize the city’s connection ability based on the total amount of connection of various urban factor flows. The SOM neural network machine learning model based on MATLAB classifies the data by learning the characteristics and laws of the total amount of contact input, so as to calculate the centroid of each cluster and the weight of the index. To a certain extent, it can predict the trend of urban connection ability and allocate resources reasonably according to the difference in the weight of the factor flow index.
This paper selects the total population contact, total information contact, total traffic contact, total logistics flow contact, total technical contact, and total capital contact of 16 cities in CCUA as the classification index of the connection ability between cities. The random data matrix is generated and standardized, and then the SOM network model is established by using the neural network toolbox of Matlab R2022b. The evaluation indexes of 16 cities in CCUA after standardization are taken as the input layer, and the maximum number of rounds of network training is 200. Considering that the number of cities in the CCUA area is 16, the number of nodes in the competition layer determines the size of SOM. It should have enough nodes to ensure the accuracy of the model. Based on the formula of the minimum number of nodes, the urban data points are divided into five clusters and sorted according to the comprehensive score of contact ability. Among them, I–V level represents the city connection ability in CCUA from strong to weak (
Figure 6).
As shown in
Table 2, the SOM neural network grading model learns the characteristics and patterns of the existing flow intensity data of various cities, uncovering the trends in connectivity capabilities among cities within the Chengdu-Chongqing urban agglomeration. Through six characteristic flow elements, data dimensionality reduction and clustering are performed. It can be observed that cities are divided into five distinct clusters (ranging from 1 to 5). The ’Score’ column likely represents the comprehensive competitiveness score of each city within the SOM network; the higher the score, the more prominent the city’s representation within the network. Based on the score, cities are graded from Level I to Level V, with higher scores indicating higher levels.
Chengdu and Chongqing, designated as Level I and Level II cities, respectively, lead in both comprehensive scores and connectivity strength, markedly surpassing other cities in the urban cluster. Their roles as central cities are solidified. These two urban powerhouses exhibit formidable connectivity across all six flow elements, with especially pronounced influence in the networks of population and capital mobility. This underscores their significant appeal and expansive impact as pivotal regional centers. The four Level III cities, situated around the core cities of Chengdu and Chongqing, exhibit geographical proximity characteristics. These cities also display relatively uniform connectivity and mobility across various flow elements, making them well-suited to serve as regional central cities. Enhancing the construction of transportation and information infrastructure and leveraging their locational advantages to strengthen ties with the core cities will be beneficial for their development. The cities classified as Level IV generally perform well in the technology flow network but are relatively weaker in population mobility and capital mobility. This may primarily be due to these cities being located on the periphery of the UAs, resulting in weaker connections with the core cities. Cities in Level V, which mainly include Ziyang, Ya’an, and Guang’an, exhibit weaker levels in all connection elements. These cities should leverage their unique strengths and strive to break the stalemate.
In the context of the CCUA, Chengdu and Chongqing have a comprehensive score of over 9, while the remaining 14 cities have a comprehensive score below 4. The majority of cities are in a state of weak comprehensive connectivity, indicating a significant disparity in the integrated connectivity capabilities among cities. This tiered structure, with a sharp decline in connectivity, is not conducive to enhancing the overall comprehensive and coordinated development capabilities of the UAs. For cities that perform weakly in certain flow networks, development strategies can be formulated, such as strengthening the construction of transportation infrastructure and promoting technological innovation cooperation.
As can be seen from
Table 3, in the weight of inter-city contact capability indicators, the order is: transportation flow > logistics flow > population flow > information flow > technology flow > capital flow. This indicates that in the evaluation process of inter-city contact capabilities within the UAs, transportation flow is the dominant element flow. Transportation flow, logistics flow, and human flow are important supporting elements that strengthen inter-city contact capabilities and promote the integrated development of UAs.
3.3. Research on the Influencing Factors of the Inter-Urban Contact Pattern of CCUA
The results of urban linkage analysis from the perspective of multi-factors of flow space show that there are common and different characteristics of factor flow between CCUA networks. The intensity of population flow, information flow, transportation flow, logistics flow, technology flow, and capital flow between cities is different and presents differentiated group characteristics. The SOM neural network based on MATLAB also specifically analyzes the differences in the connection ability of different cities and the weight of different index element flows in the spatial connection pattern of UAs. In order to further explore the reasons for this spatial pattern difference, it is proposed to introduce explanatory variables and construct a relational regression model to quantitatively identify and measure the influencing factors of multi-dimensional networks.
This paper selects 10 influencing factors from four dimensions: urban development scale, industrial structure, people’s living standards, and fiscal revenue and expenditure, as explanatory variables, and six types of element flows as dependent variables. Since the differences in influencing factors between cities will affect the flow of elements between cities, two spatial matrices are constructed based on the differences in influencing factors between cities and the contact intensity of six types of element flows between cities. The Ucinet 6 software is used to build a QAP (Quadratic Assignment Procedure) relational regression model for regression analysis, with 2000 random permutations selected. The determination coefficient (R
2) is a measure of the fit of the regression model. The regression results are shown in
Table 4, with the model’s R
2 values ranging from 0.4 to 0.9, indicating that the selected influencing factors can effectively explain the characteristics of the multi-dimensional element network space contact.
From the significance and regression coefficient of various influencing factors on the factor flow network pattern, it can be seen that:
First, in terms of urban development scale, the difference in resident population size is significantly negative for the information flow network at the 0.05 level and significantly negative for the logistics flow network, technology flow network, and capital flow network at the 0.1 level. It can be seen that the larger the difference in the size of the resident population, the more unfavorable the flow of various elements between cities. The difference in urbanization rate is significantly negative at the level of 0.1 in the population flow network and significantly negative at the level of 0.001 in the technology flow network and the capital flow network. The greater the difference in urbanization rate, the more unfavorable it will be to the flow of population, technology, and capital among urban nodes to a certain extent. However, the difference in regional GDP is not significant in the multi-dimensional factor flow network.
Second, in terms of industrial structure differences, the first industrial difference only has a significant positive impact at the level of 0.1 in the flow network. The secondary industry has a significant positive impact on the transportation flow network and logistics network at the 0.1 level. The significant positive impact at the 0.05 level in the flow network, technology flow network, and capital flow network indicates that the greater the difference in the secondary industry between cities, the stronger the industrial cooperation and complementarity between cities may be, thus promoting the circulation of relevant factors between cities. This difference is more significant in the technology flow network and the capital flow network. The difference in the tertiary industry has no significant impact.
Third, in terms of people’s living standards, the difference in per capita consumption expenditure has a significant negative impact on the information flow network and the logistics network at the 0.1 level, a significant negative impact on the flow of people, transportation flow, and technology flow at the 0.05 level, and a significant negative impact on the capital flow network at the 0.001 level. The per capita disposable income difference only has a significant negative impact at the 0.1 level under the logistics network, technology flow network, and capital flow network. On the whole, the greater the difference between per capita consumption expenditure and per capita disposable income, the less conducive it will be to the flow of various factors between cities.
Fourth, in terms of fiscal revenue and expenditure, the differences in public budget expenditures have a significant negative impact on the information flow and transportation flow networks. At the 0.05 significance level, these differences are notably influential in both the information flow and transportation flow networks. In the logistics, technology flow, and capital flow networks, the impact is significant at the 0.1 level. This indicates that variations in public budget expenditures directly affect the construction of information and transportation infrastructure. However, in other element flow networks, the impact is only slightly significant, suggesting that, overall, differences in public budget expenditures between cities are detrimental to the circulation of elements between cities. In contrast, differences in public budget revenues do not have a significant impact in any aspect.
4. Discussion
Inter-city element flow is an important driving force in promoting the urbanization process and plays a significant role in shaping the spatial pattern of UAs and guiding spatial planning. The study found that the inter-city contact network in the CCUA exhibits complex differentiated characteristics, differentiated clustering characteristics of element flows, unbalanced contact capabilities, and specific characteristics of influencing factor indicators. Therefore, the following considerations are proposed for the future construction of the CCUA.
4.1. Characteristics of Inter-City Network Connection
In the multi-dimensional element flow network, Chengdu and Chongqing, as the core cities of the region, have an influence that far exceeds that of other cities, while the development of secondary central cities lags behind, relatively speaking. Over-reliance on a single element flow between cities, and the obvious structural differentiation in various element flow networks, lead to weak comprehensive contact capabilities among cities within element clusters. The multi-dimensional element flow spatial network clusters show differentiated characteristics, which will affect the overall operational efficiency between cities and widen the gap in urban economic development, leading to unbalanced regional development.
Firstly, by improving public transportation and other infrastructure, the cost of element flow can be reduced and mobility barriers can be diminished, thereby promoting the free flow of elements between cities. For instance, in the southern fringe areas of the Chengdu-Chongqing urban agglomeration, efforts should be intensified to leverage the Yangtze River waterway transportation conditions and port advantages to strengthen industrial cooperation along the river economic belt. It is also important to enhance the construction of industrial parks in Zigong, Yibin, Neijiang, and Luzhou and to improve the industrial structure system. Additionally, by integrating ecological resources, a green tourism corridor along the river can be created.
Secondly, the radiating and driving role of core cities should be fully leveraged, combined with the resource endowment and environmental carrying capacity of surrounding cities, to attract investment, guide, and support surrounding cities in industrial upgrading and transformation, and cross-regional cooperation mechanisms should be established to promote capital flow and information resource sharing. In the regions of Guang’an, Nanchong, and Suining, the advantages of convenient transportation with core cities should be leveraged, and a solid industrial foundation should be created to strengthen collaborative development with Chongqing and Chengdu, building it into a demonstration area for cross-regional collaborative development.
Thirdly, the establishment of an integrated logistics working mechanism should be explored to enhance the coordination of logistics planning, policy, standards, and management within the region, strengthening the coupling of the modern logistics industry with the integrated development of the regional economy and enhancing the ability of the logistics industry to serve regional economic development. The transportation infrastructure of the Chengdu-Chongqing urban agglomeration should be combined, including airports, railway networks, highways, and waterway transportation, to optimize the construction of the urban agglomeration’s logistics network, develop multimodal transport, and improve the efficiency of logistics and transportation while reducing costs. For example, constructing riverside industrial clusters and waterway transportation logistics networks enhances the ability of the logistics industry to serve regional economic development. Increasing the use of digital technologies such as IoT, AI, and blockchain improves transparency, traceability, and efficiency in the logistics process.
Lastly, in terms of population flow, job opportunities can be created through industrial transfer, public service facilities can be improved, and the free and rational flow and effective aggregation of the population within the region can be promoted. Relying on the transportation channels of the Chengdu-Kunming Railway and the Baoji-Chengdu Railway, the industrial systems should be strengthened, as well as the supporting role of node cities such as Mianyang, Deyang, Leshan, and Meishan, and the comprehensive population carrying capacity will be enhanced along the line.
4.2. Ability of Inter-City Network Connection
In the grading of comprehensive contact capabilities within the CCUA network, Chengdu and Chongqing, as the core cities of the region, have an external contact capability that far exceeds other cities. This leads to insufficient development of secondary cities, unbalanced inter-city contacts, and hinders the integrated development of the UAs. Chengdu and Chongqing should fully leverage their roles as core cities to radiate and drive the development of surrounding areas, clarifying the functional positioning of Ziyang and Neijiang, creating a developmental backbone, and promoting the flow and optimal allocation of elements between cities.
On the one hand, by utilizing the Yangtze River economic belt and the expressway network along the river, the radiating role of Chongqing can be enhanced to promote the development of node cities and cultivate an economic belt along the river. On the other hand, based on the strengthening, radiating, and driving effects of Chongqing and Chengdu, focusing on nurturing regional central cities, and supporting the construction of small and medium-sized cities and key towns, the urban size structure should be optimized to promote the flow of elements and balanced regional development.
In response to the construction needs of a 1-h commuting circle, a regional transportation network with high-speed railways, inter-city railways, and expressways as the backbone should be developed to create a transportation circle that allows for 1-h access between core cities, between core cities and surrounding cities, and between adjacent cities. This will reduce the cost of element flow, decrease mobility barriers, and form an urbanization pattern of “circles supporting clusters,” enhancing the region’s comprehensive and coordinated development-driving ability. On the one hand, the radiating and driving effects of the core cities of Chengdu and Chongqing should be leveraged to consolidate the Chengdu-Deyang-Meishan metropolitan circle and the Chongqing-Guang’an metropolitan circle. The supporting and industrial reception roles of node cities should be strengthened to promote the extension of multi-dimensional element flows between the two ends of the cities. On the other hand, the development of the dense urban area of Nanchong-Suining should be fostered, shaping Nanchong into a secondary central city in the northern Sichuan region to promote balanced urban-rural development. Additionally, peripheral cities should seek their own development advantages and actively establish a complementary pattern with core cities.
4.3. Influencing Factors of Inter-City Network Connection Pattern
By investigating the factors influencing the inter-city connectivity patterns in the CCUA, it can be found that there is a positive correlation between the differences in permanent population size and urbanization rates. The larger the differences, the more detrimental they are to the flow of various elements. Specifically, differences in permanent population size have a significantly negative impact on the information flow network, logistics network, technology flow network, and capital flow network. Therefore, it is important to avoid the population suction effect of core cities. In the future, the focus will be on developing towns with a certain population size and significant development potential. This involves strengthening the industrial foundation of towns, moderately increasing the supply of construction land and job opportunities, reducing population outflow, and meeting the housing and employment needs of local urbanization to promote localized urbanization processes.
In terms of industrial structure differences, compared to other industries, differences in the secondary industry have a significantly positive impact on the transportation flow network, logistics network, population flow network, technology network, and capital flow network. Therefore, while enhancing the level of industrial development in different cities, it is also important to fully leverage local resource endowments for differentiated and complementary development. This promotes the complementarity of the secondary industry and creates local advantageous industries. For example, in large industries such as automotive parts, it is necessary to establish complementary relationships between regional industries to form a complete upstream and downstream industrial chain, thereby increasing the flow of elements between cities.
Regarding the level of people’s livelihood, it is evident that stimulating consumption and improving the standard of living can facilitate the flow of various element streams. Differences in per capita consumption expenditure have a significantly negative impact on the information flow network, logistics network, population flow network, transportation flow network, and technology flow network. To promote the circulation of various elements between cities, on the one hand, it is possible to improve the basic social security system to reduce the living pressure on residents. On the other hand, different regions can be encouraged to explore development paths suitable to local conditions, such as developing local tourism and characteristic agricultural product industries, to increase employment and raise the basic income of residents. At the same time, the regulatory role of government public budget expenditures in the development process of various cities should also be fully utilized to accelerate urban infrastructure construction, promote regional market integration, and break down administrative barriers.
The limitations of this study are mainly reflected in two aspects. On the one hand, the limitations are primarily in the sources of data. Data captured from different platforms has certain limitations. For example, when capturing population mobility data through the Amap platform, there is still a portion of the population that does not use Amap devices; thus, their migration is not well-collected. In the future, more reliable and complete data platforms such as mobile signaling can be used for further research. On the other hand, regarding influencing factors, the influencing factors between cities within a city cluster are complex. Based on various statistical data from the urban statistical yearbook, it is only possible to grasp the impact of economic development, industrial structure, and fiscal revenue and expenditure, etc., from a macro perspective. The unique geographical environment and resource conditions of the city itself are difficult to quantify, leading to a lack of comprehensive consideration of influencing factors. At the same time, there are also interactive effects between various influencing factors, which will also have an uncertain impact on the formation of the overall network structure.
5. Conclusions
Entering the stage of high-quality development, UAs serve as the primary form of regional development and the spatial carrier for international competition and cooperation. This study takes the CCUA as the research area, based on multi-source big data such as population migration data and Baidu Index, to quantitatively analyze the multi-dimensional element flow contact pattern and grouping characteristics of the CCUA. It employs the SOM neural network machine learning method to identify different city contact capability levels and predict future development trends. Finally, the QAP relational regression model is used to analyze the influencing factors in the formation of the multi-dimensional element flow spatial pattern. The main conclusions are as follows.
Firstly, regarding the network connection characteristics of the UAs, the Chengdu-Chongqing association interval has the closest connections, forming the backbone of the element flow network. The Chengdu-Deyang-Meishan association interval and the Chongqing-Guang’an association interval exhibit strong stability. The population flow and technology flow primarily feature a divergent network structure with Chengdu and Chongqing as the core nodes. The logistics network and information flow network show radiative structural characteristics, while the transportation flow and capital flow display triangular network structural features. In terms of network clustering characteristics, the division results of the multi-dimensional element flow network reflect the differentiated characteristics of element contact clustering. The Chengdu-Deyang-Meishan cluster and the Chongqing-Guang’an cluster show strong stability. The number of clusters divided based on the population flow element is the highest, with 5 clusters, while the number of clusters divided in the capital flow element network is the lowest, with only 2 clusters. The clusters divided into specific single-element flow networks exhibit differences.
Secondly, the grading results of the SOM neural network machine learning model indicate that there is a significant difference in spatial contact capabilities within the CCUA, with Chengdu having the strongest spatial contact capability. Neijiang, Leshan, Zigong, Luzhou, Suining, Dazhou, Ziyang, Ya’an, and Guang’an, a total of 9 cities, are at the lowest level, indicating a large disparity in contact capabilities between cities. In the process of government investment and construction, it is necessary to avoid a situation where “one city dominates” and the contact capabilities of other cities become polarized, as this would hinder the integrated development process of the UAs.
Thirdly, regarding the influencing factors of the multi-dimensional element flow spatial pattern, the greater the differences in the levels of various impact factors of the urban development scale, the less favorable it will be for the flow of various elements between cities. In terms of industrial structure differences, the differences in the development of the secondary industry have a positive promotional effect on all element flow networks except for the information flow network. Regarding the standard of living of the people, the greater the differences in various impact factors, the less favorable it will be for the flow of various elements between cities. In terms of fiscal revenue and expenditure, the greater the differences in public budget expenditures, the more it will help promote the circulation of various elements, especially in the information flow network, transportation flow network, and capital flow network, where the impact is the most significant.


