Article

Landscape Reconstruction with Earth-and-Timber Medieval Stronghold—Immersive Geovisualization

by
Jakub Zawadzki
and
Beata Medyńska-Gulij
*
Department of Cartography and Geomatics, Adam Mickiewicz University, 61-712 Poznań, Poland
*
Author to whom correspondence should be addressed.
Land 2024, 13(8), 1323; https://doi.org/10.3390/land13081323
Submission received: 15 July 2024 / Revised: 18 August 2024 / Accepted: 20 August 2024 / Published: 21 August 2024

Abstract

:
This study focuses on the problem of reconstruction and immersive visualization of cultural heritage objects such as medieval strongholds. Geomatics-specific methods were applied, based on the use of reference data such as maps, topographic databases, LIDAR, aerial photography, and three-dimensional modeling. Search and transformation of reconstructed historical data were also carried out according to various historical–geographical–archaeological theories. The result of the work was the creation of a desktop application that presents the interactive landscape reconstruction as an immersive geovisualization of a typical medieval Eastern European earth-and-timber stronghold in two time periods and in its current state. Conclusions include the changes in land topographical levels, demonstrating how the topographical level has changed over time, and data identification to categorize and process it in order to visualize cultural heritage objects such as medieval strongholds in today’s landscape.

1. Introduction

Cultural computing is a field of activity that aims to incorporate computer technologies and scientific methods into the processing of information about culture, art, and social sciences in order to expand, transform, and better present them [1]. This approach also includes presenting cultural heritage objects as 3D models through immersive geovisualization. Immersive visualization refers to a realistic simulation of a three-dimensional environment, presented as an interactive, computer-generated space [2].
In terms of the immersion of the device on which the visualization is presented, there are several levels that influence the user’s ability to interact with the computer environment. These levels range from low immersion, such as desktop applications, through medium immersion, including physical simulators, to high immersion, which includes stationary and mobile VR systems. An important aspect of designing immersive geovisualizations is ensuring an appropriate level of immersion for accurately representing real-world geographic objects [3]. Among VR devices, stationary Google VR provides the highest level of immersion, as computers with high computing power can generate images with great realism and naturalness [4]. Several methods of interaction with visualization are listed in the research, including device-based, sensor-based, and hybrid [5]. Each of these methods has its own characteristics and can present different challenges to the user and provide different methods of manipulating the virtual experience.
Virtual cultural heritage enables the reconstruction of the historical state of important architectural objects that no longer exist, have been partially destroyed, or have changed their architectural and landscape features [3]. To create a virtual heritage experience, it is essential to collect appropriate data, as the object to be modeled is a real (or historical) structure with specific dimensions and shapes. Research recommends incorporating digital surveying into the data collection process [6]. To ensure accurate reconstruction of cultural heritage objects, digital surveying should utilize new technologies such as LIDAR [7].
The specificities of working with cultural heritage require collaboration between representatives of technical and social research, as well as the involvement of the wider community through crowdsourcing [8] and the use of methods based on machine learning [9] and artificial intelligence [10].
The change in the reconstructed objects of the landscape over the centuries introduces a fourth dimension to the immersive visualization, which represents time. This is significant because it further connects the reconstruction of objects with the expertise of professionals from other fields [11]. Diachronic reconstruction also allows us to show the changes in the topology of objects over time, including those that have been destroyed or degraded by various factors [12,13]. In addition to time, there is a strong connection between reconstructed sites and the evolving space and landscape, which can also change [14].
The reconstruction of cultural heritage objects also requires appropriate input data from measurements using technologies such as LIDAR and photogrammetry [15], as well as their effective fusion [16]. This fusion combines cartometric data from various sources into a comprehensive and accurate visualization. The environment for the visualization can be created using GIS tools [17], while the visualization itself can be achieved with a game engine [18]. This work also advocates for including relevant non-cartometric data in the fusion process, particularly data on degraded or destroyed objects from the past, provided by archaeologists and historians.
The case study focuses on a typical earth-and-timber fortification, which embodies the standard characteristics of such structures. Although this type of fortification can also be referred to as a hillfort, we chose the term earth-and-timber stronghold for its simplicity and convenience, and because it aligns with sources in the literature [19]. This object was selected mainly because of its representative nature, which also facilitates the integration of information about the architectural and landscape context.

2. Aim and Questions

The aim of this study is to reconstruct a typical medieval earth-and-timber stronghold to identify and validate useful data sources and materials for this process. It also aims to demonstrate how to differentiate and integrate these data to create an accurate and appropriate visualization. Reconstructing historical objects from different time periods presents numerous challenges. These challenges are compounded by the fact that the structures may have undergone significant changes in function and appearance over the years or may have been completely destroyed. This situation raises several research questions that reflect the issues encountered in developing the visualization:
  • What types of data should be used when creating 3D reconstructions of objects? Does the inclusion of data from historical studies and the distinction between reconstruction and reference sources help in the development of visualizations, and which sources should be placed in these categories?
  • Which typical objects in a stronghold should be distinguished and reconstructed?
  • How can changes in the terrain and the developing structures be visualized in such a way that no information noise is created?
  • Do GIS tools and game engines enable the effective implementation and integration of data to create an immersive geovisualization?

3. Materials and Methods

The stronghold, located in Greater Poland in the town of Giecz, was chosen as the object of reconstruction. It is an earth-and-timber stronghold that, in the 11th century, was part of the Piast dynasty state. Although the stronghold was most influential in the 10th century, it underwent significant expansion and development in the 11th century, reaching its most advanced form during medieval period. Currently, the stronghold site functions as an archaeological museum and an open-air museum with degraded artifacts from earlier periods (Figure 1).
In order to achieve the above objectives and find answers to the above-mentioned questions, several main phases of the study were chosen (Figure 2):
  • Defining the basic visualization concepts (Section 3.1);
  • Inquiry of the data acquisition and segmentation of the data (Section 3.2);
  • Presentation of the individual fortress elements and selection of the time frame for the reconstruction of the fortress (Section 3.3);
  • Data transformation using GIS software tools (Section 3.4);
  • Data for the reconstruction of the terrain and lake (Section 3.5);
  • Modeling of the reconstruction elements (Section 3.6);
  • Immersive geovisualization of the research results (Section 3.7);

3.1. Concepts

Considering the goal of representing the stronghold in two different temporal contexts, the need to model objects within the stronghold area, and the IT aspects such as computer game engines and scripting, we have developed a conceptual framework. This framework is designed to meet all requirements and address the questions posed.
  • Collection and classification: structuring the data required for visualization and dividing the materials into two categories: reference sources and reconstruction sources.
  • The literature [20] points to the existence of several typical elements that are typical of most strongholds regardless of the time of their construction and the culture of the builders, including the following:
    Defensive facility (rampart).
    Object of worship (church).
    Residential facility of the government (palatium).
    Additional defensive elements related to natural conditions (e.g., bridge).
  • Visualization design: simple objects without excessive detail, aiming to represent the spatial distribution of features mainly related to the terrain and the functional transformations that have taken place within the site over the years.
  • Software and Equipment: GIS software (QGIS 3.30, TreeIT2023), 3D graphics software (Blender 3.6), computer game engine (Unity 6).
  • Visualization features: ability to navigate freely around objects and switch between different states of objects from different eras.
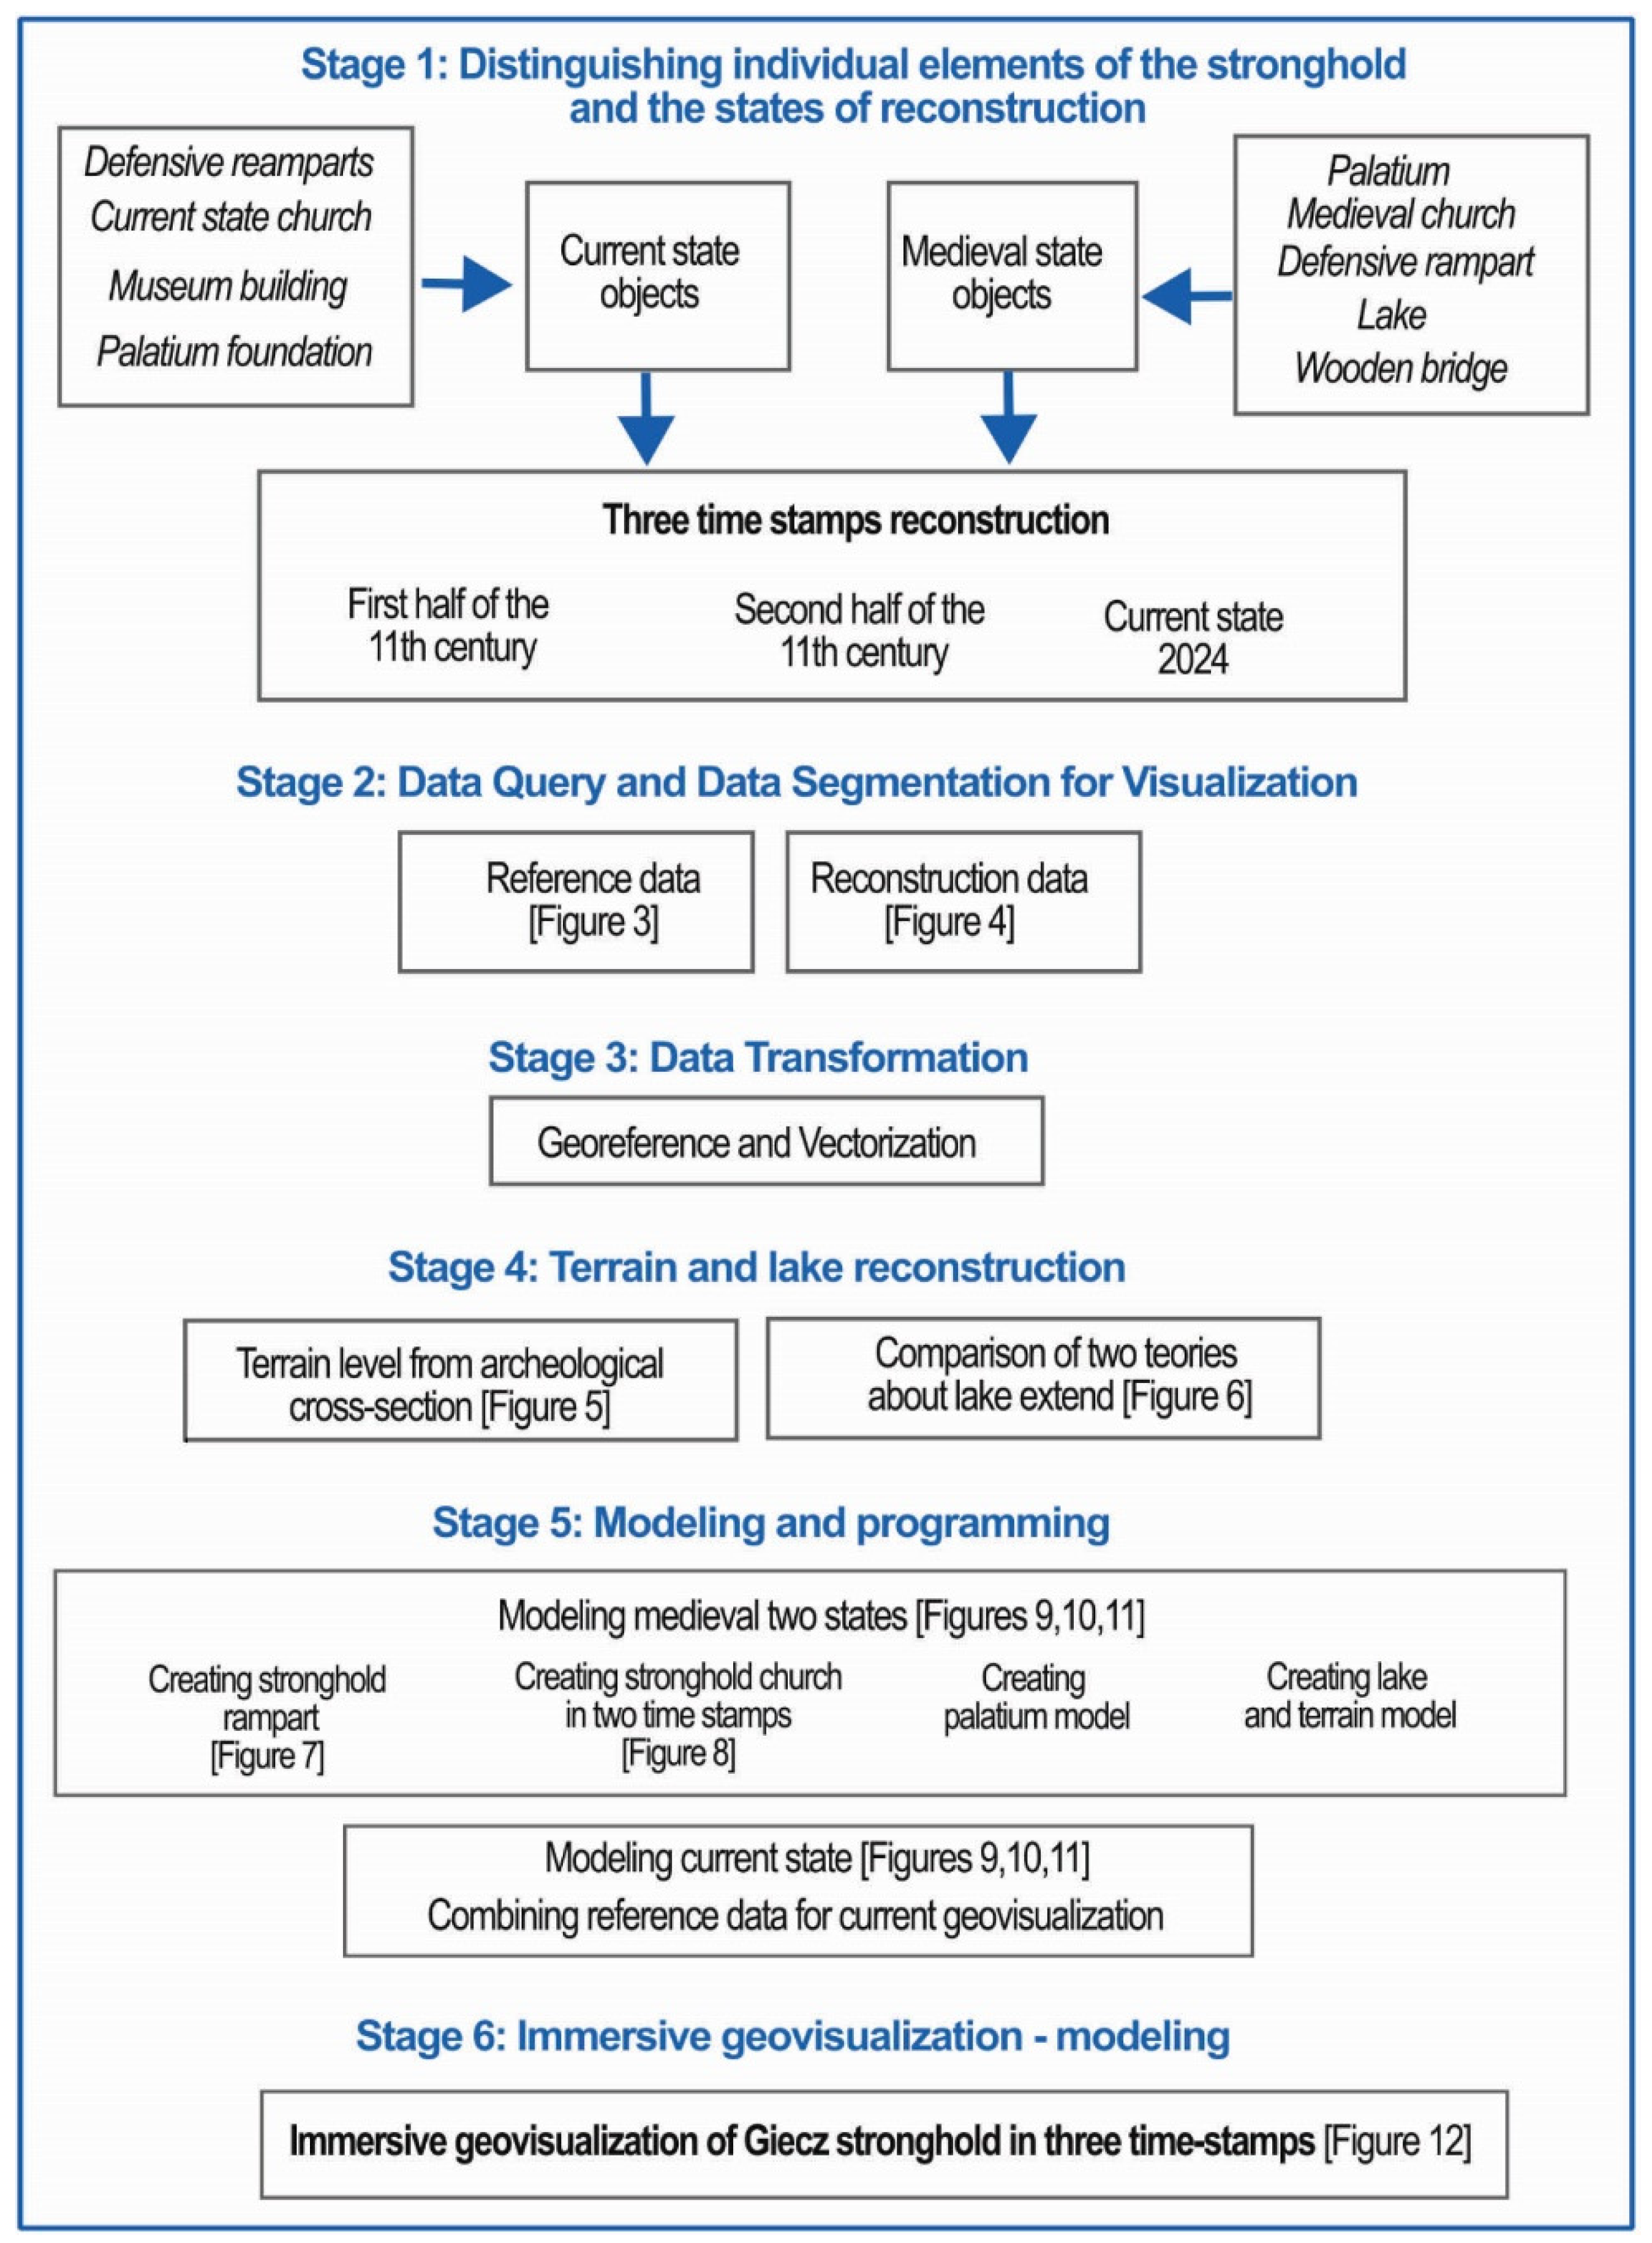
Figure 2. Stages of creating immersive geovisualization.
Land 13 01323 g002

3.2. Distinguishing Individual Elements of the Stronghold and the States of Reconstruction

Within the boundaries of the current stronghold, there are various structures ranging from medieval remains to modern buildings. The Giecz Fortress, which now serves as an archaeological reserve, is part of the Museum of the First Piasts in Lednica. A pavilion on the site hosts a permanent exhibition detailing the history of Giecz as a significant Piast settlement and the chronicles of archaeological excavations in the area. The grounds also feature an 18th-century wooden church dedicated to St. John the Baptist [21], surrounded by the ruins of earlier church buildings. Visitors can see the remains of a medieval palatium and an exposed section of medieval church walls located beneath the preserved wooden church structure.
Based on the data collected, the following elements were distinguished within the medieval fortification system:
  • The palatium of the fortress, closely linked to the reign of Mieszko I and his son Bolesław Chrobry—the first king of Poland—is a significant architectural complex [22]. The foundations, thoroughly studied by archaeologists and art historians, were excavated in the late 1950s and early 1960s. The palatium comprises two distinct components: a princely residence and a rotunda for religious purposes, serving as a testament to the architectural splendor and socio-political importance of the Middle Ages.
  • The church of St. John the Baptist dates back to at least the early 11th century and was extended in at least two phases. It is now replaced by an 18th-century wooden church. There are overlaps between the medieval church and the current building, with the southern westwork of the Romanesque church lying beneath the foundations of the present church. Additionally, the apse of the medieval church overlaps with the old parish building.
  • The defense ramparts surrounding the entire stronghold.
  • The water reservoir or lake, which no longer exists today, was an important part of the stronghold’s defenses. Research is attempting to delineate its territorial extent.
  • The wooden bridge served as a link between the eastern part of the fortress and the eastern shore of the lake and facilitated access to a trading settlement. Its structure was modified and reconstructed several times over the course of time.
The changes to the landscape and urban development of the stronghold over the research period necessitated reconstructing it at two different points in time. Archaeological finds and historical analyses [23] revealed the extensive use of the stronghold during the investigated period, which was crucial for this decision. Thus, it was essential to reconstruct the stronghold in two medieval periods. Additionally, to visualize the changes in the terrain, we needed to depict the stronghold in its present fragmented state, which has gradually lost its original meaning and form over the centuries. In total, three reconstruction time stamps were created:
  • Hypothetical reconstruction of the stronghold in the first half of the 11th century.
  • Hypothetical reconstruction of the stronghold in the second half of the 11th century.
  • Reconstruction of the stronghold in its current appearance from 2024.

3.3. Data Query and Data Segmentation for Visualization

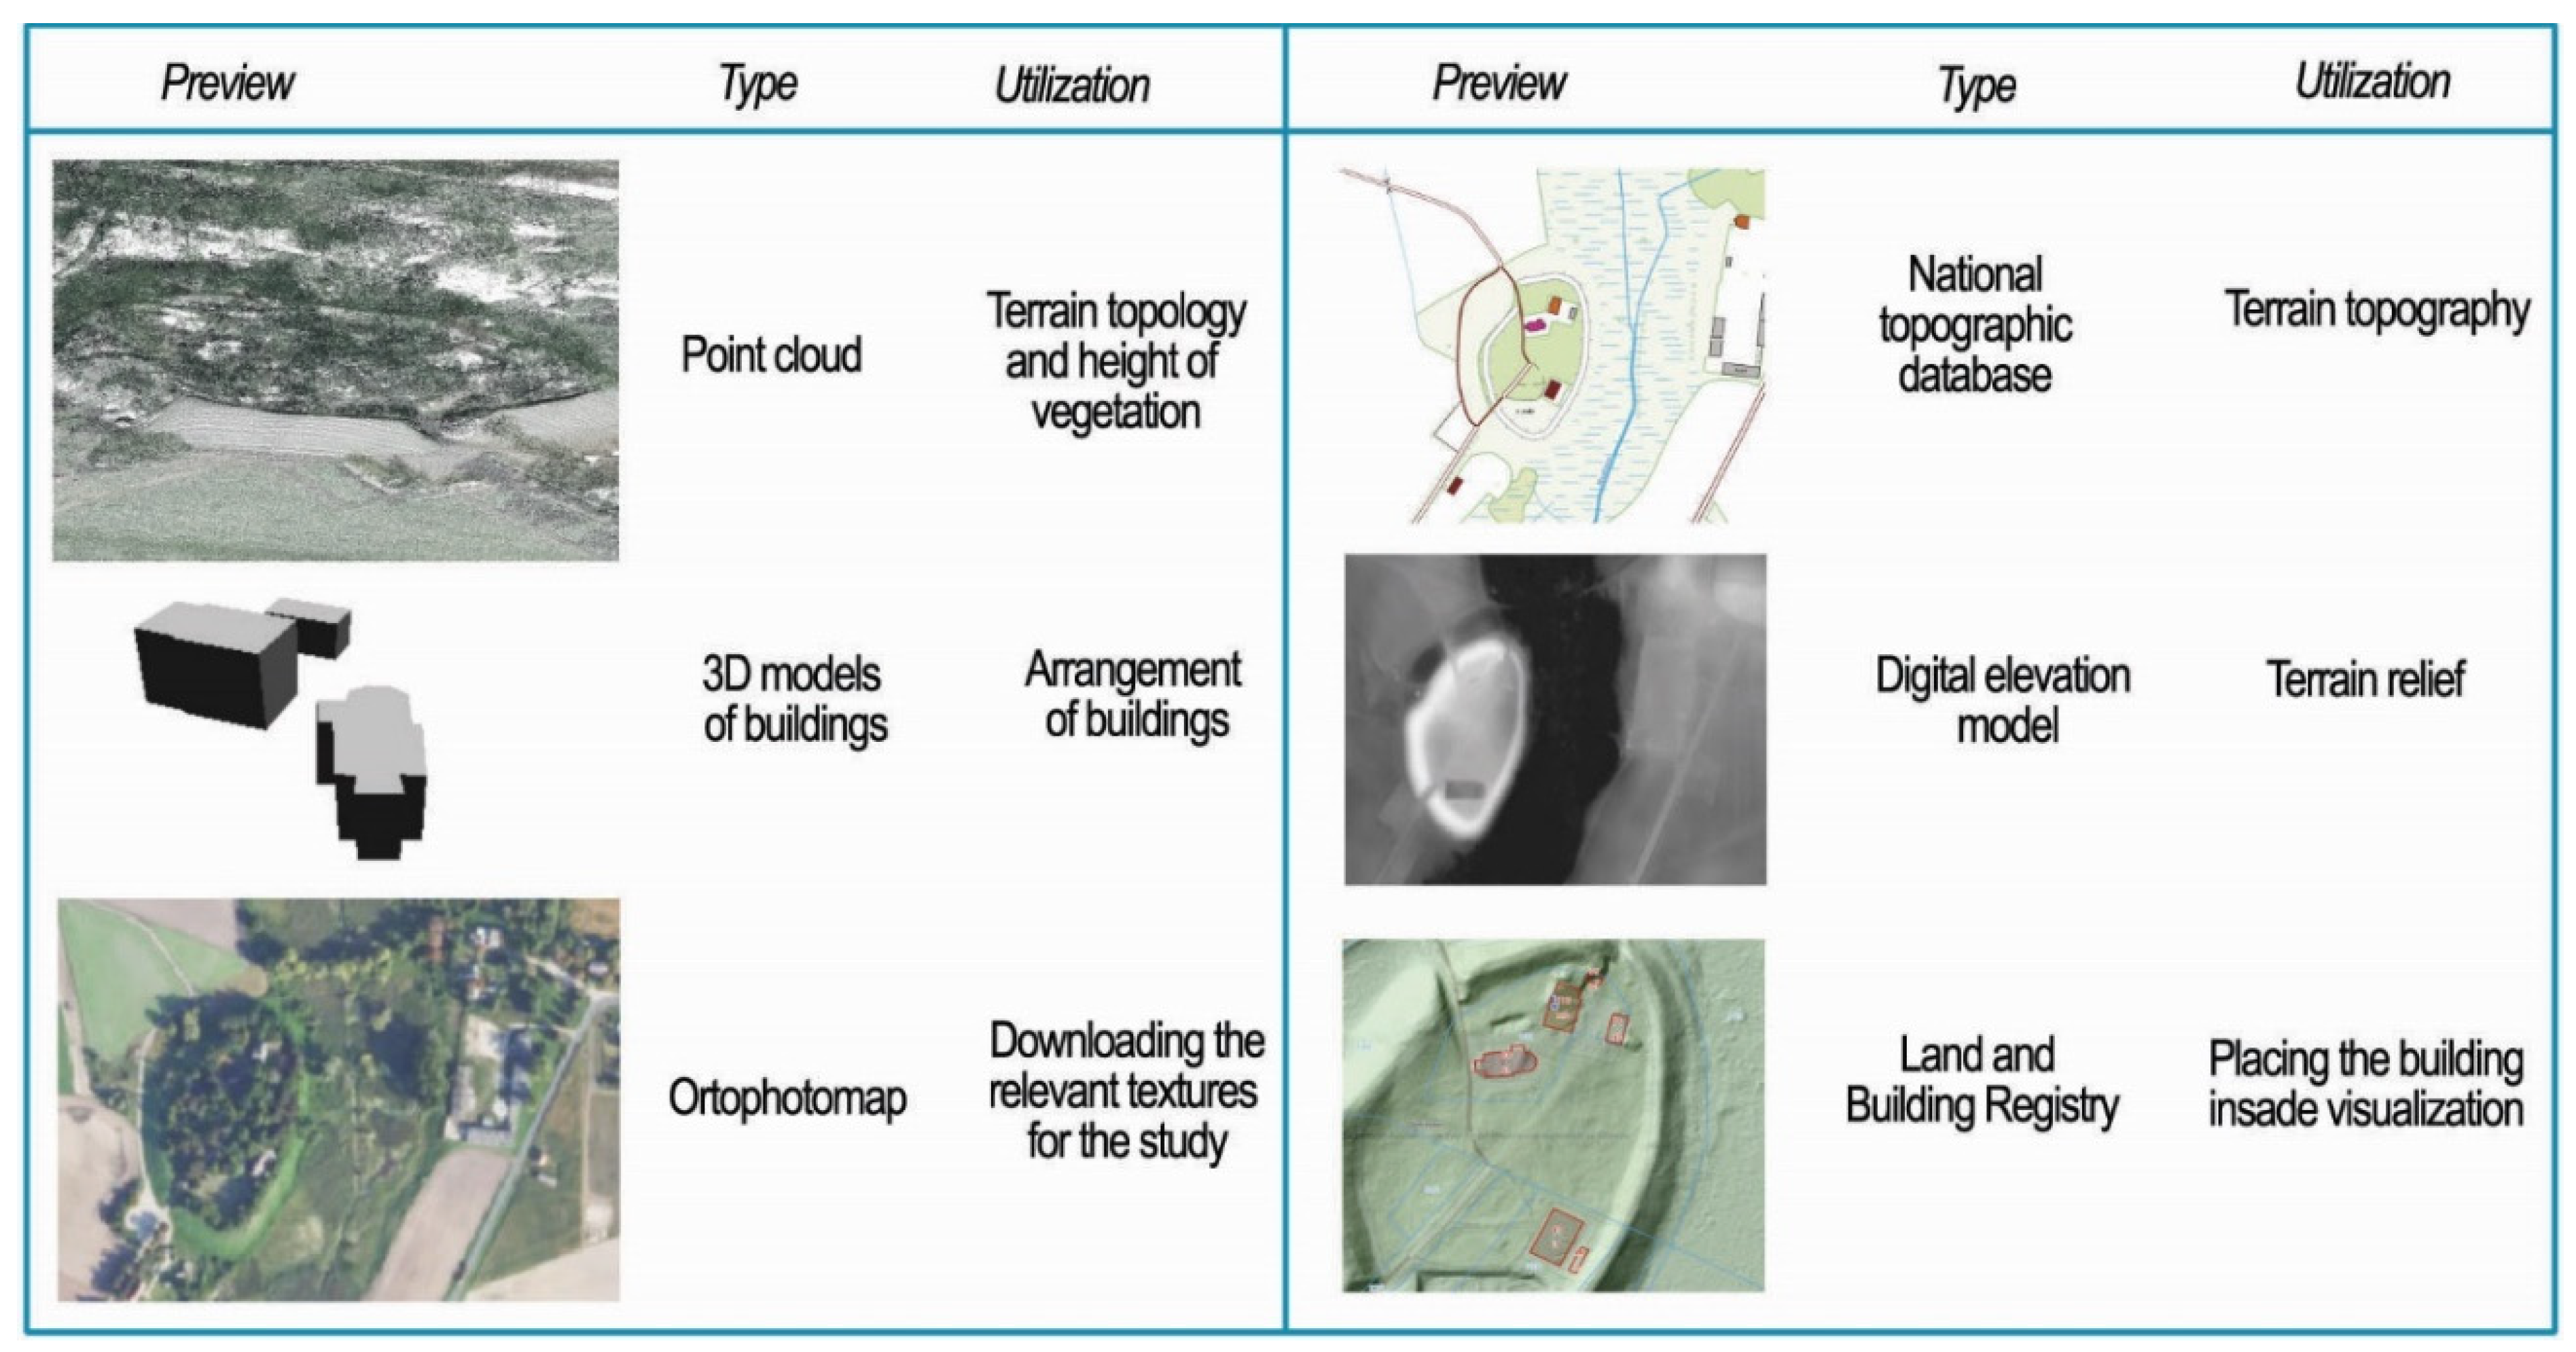
The topic of visualization is supported by modern technological principles such as laser scanning and photogrammetry [24]. However, available measurement data may be insufficient for reconstructing completely destroyed or only fragmentary objects. In these cases, it is necessary to integrate cartometric material with non-cartometric data. To address this, the sources were categorized into cartometric (reference) and non-cartometric (reconstruction) axes.
  • Reconstruction data: In this study, the primary sources for reconstruction data include various photographic documentation, plastic models, illustrations, and scholarly articles. These sources help clarify the architectural concepts of objects, facilitating their temporal and spatial classification and contributing to the creation of geographically accurate geovisualizations. A key part of this project is evaluating and classifying these sources based on their utility, reliability, and credibility to summarize their contributions to the individual visualization elements. This evaluation is detailed in the chapter on creating virtual object models.
  • Reference data: These sources are maintained by the Geodetic and Cartographic Agency of Poland and include data derived from measurements connected to the spatial data infrastructure (SDI) system. Such data can be categorized as exemplary, basic, normative, or fundamental [25]. For this study, we refer to them as reference data/sources. To be considered reliable, reference data must meet certain criteria: they must be recorded in an appropriate data format and spatial reference system, have sufficient accuracy, and possess a metadata structure that allows clear identification of the content [26]. The availability of data freely accessible via the national geoportal is also crucial.
Reference data are crucial for positioning this work within the scientific discussion on historical landscape reconstruction. They allow for precise spatial localization of the data and form the basis for historical transformations, with the eleventh-century model derived from cartometric models. To ensure clarity, all sources are presented in a table (Figure 3).
The essence of reconstruction data lies in their versatility. For the purposes of this study, any analog or digital compilation that is deemed useful for achieving the objectives and does not necessarily conform to cartometric principles can serve as a reconstruction source. Below is a list of the reconstruction sources used for this study (Figure 4).

3.4. Data Transformation

When summarizing how to systematize sources for visualization, two main factors influence their classification: (1) some sources have high cartographic value and are closely linked to spatial reference systems, while (2) others are content-rich but lack a spatial reference frame. As a result, these sources cannot be effectively visualized or compared within the spatial data infrastructure (SDI) without proper processing. Therefore, converting reconstruction sources into reference frames that align with spatially anchored data is crucial. This issue requires further clarification.
The method proposed in this study provides a practical solution for converting both analog and digital materials into non-cartometric formats (PDF, JPG, PNG). The transformation process involves several steps using GIS software tools. Georeferencing and vectorization are essential for digital data, while analog data requires additional digitization.

3.5. Terrain and Lake Reconstruction

Visualizing the Middle Ages presents different challenges compared to modern visualization efforts. One major challenge is the lack of direct links to current information databases. This study relies on existing reconstruction sources as alternative information. Analyzing these sources involves continuous validation to determine which data are relevant for creating a digital model of the 11th-century stronghold.
Modeling the topographic terrain level is challenging because it requires analyzing changes in the upper layers of the earth over time. Within the stronghold, terrain use varies significantly due to two main factors: its proximity to a eutrophic lake and continuous settlement development, typical of a medieval defensive site [27].
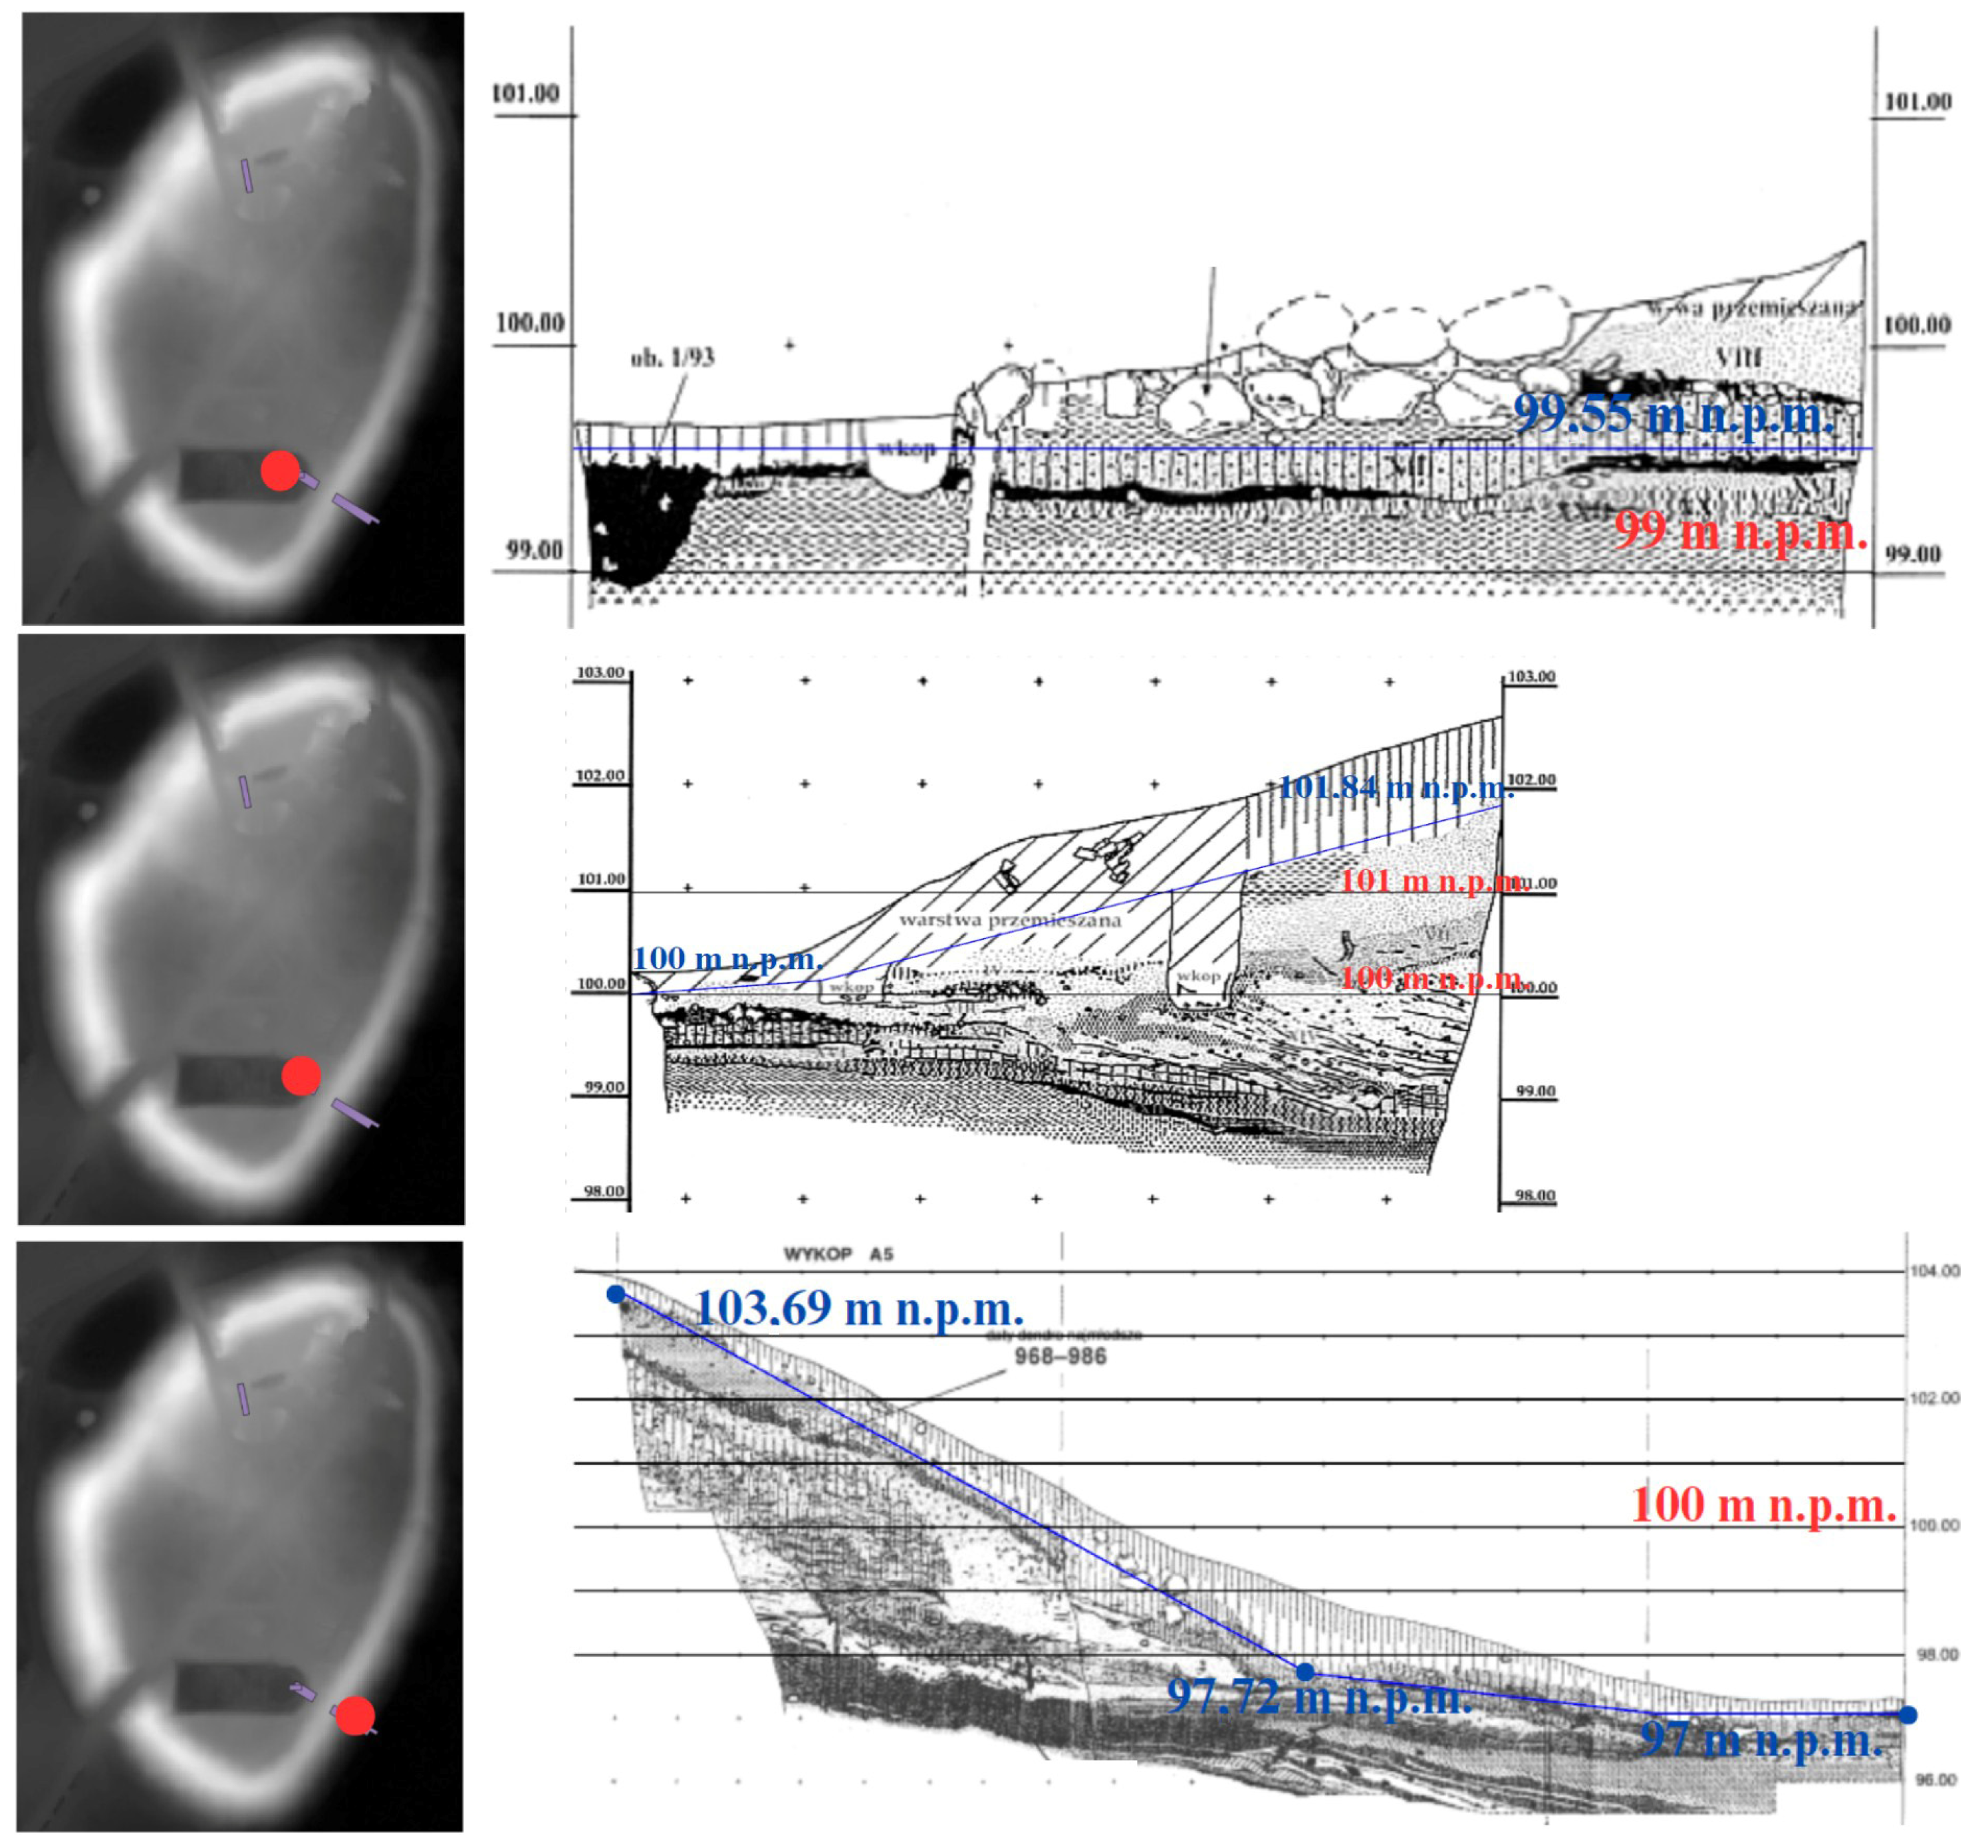
Essentially, the possibility of reconstructing the medieval ground level depends on extrapolations derived from archeologically investigated sites. Archeological cross-sections, labeled as reconstruction sources in Figure 4, support the determination of terrain changes. The annotations in Figure 5 show the levels derived from the individual cross-sections.
The extrapolation of the topographical level across the entire fortress was based on the determined heights. The heights within the fortress range from 100.14 to 101.15 m, reflecting the 11th century, which was the peak period for the Giecz stronghold. Delineating different development phases, particularly the terrain around the Prince’s Palace and the rampart levels that evolved with successive constructions, is challenging. Incorporating these proposed topographical levels requires significant generalization, a limitation of the current research phase.
Outside the stronghold, the height of the terrain has been estimated at around 97–99 m above sea level, with the lower elevations corresponding to the former seabed during the medieval period. This estimate is partly based on investigations on a medieval cemetery north of the fortress walls [22]. The excavated graves showed depths between 50 cm and 1.5 m, indicating minimal differences in topographic level between the medieval and modern periods. The level of 97 m above sea level indicated in Figure 5 refers to the eastern outer area of the fortification, which is now a marshy area that was once flooded by a lake.
The height of the ramparts was estimated to be about 4.5 m based on the cross-sections shown in Figure 5. However, due to the limited scope of the studies, a uniform height of the embankments was assumed throughout the study area.
In the course of investigating the state of the fossil lake, attention was drawn to two theories regarding its geographical structure [28,29]. Although these theories are basically similar, they differ in two essential aspects: a smaller bay on the northern promontory and the eastern region of the lake [22,30]. In connection with the reconstruction of the medieval configuration of the lake, it was decided to adopt the newer theory as the authoritative version. In order to establish precise spatial relationships, both spatial hypotheses of the medieval lakes were vectorized and juxtaposed with contemporary maps, as shown in Figure 6. This method made it possible to gain comprehensive and detailed insights into the medieval state of the fossil lake. The depth of the non-existent lake was determined to be around 1–2 m [27]. It was therefore also a shallow, eutrophic lake in the Middle Ages.

3.6. Modeling

Performing an immersive geovisualization is a nuanced process characterized by continuous navigation through different sources and careful selection from the various options available. You must also face the challenge of seamlessly integrating these sources into a coherent geovisualization. In the following sections, we will explain the process of selecting, creating, and compiling sources in digital systems.
The digital representation of contemporary topographic features marks the first phase in the development of a digital model of the property. The modeling of today’s terrain relief seems to be a relatively simple and objective undertaking, especially when compared to the reconstruction of medieval topography, which requires the compilation and validation of a large number of sources. The data from the Polish Main Office of Geodesy and Cartography provide sufficient precision so that subjective transformations are not necessary, and the integrity of the data set is guaranteed.
The development of the topographic layer can be improved by using several spatial datasets. Among these, two primary reference sources were considered: the digital terrain model (DTM) and the point cloud derived from aerial laser scanning (ALS). Both datasets were acquired free of charge from the Polish National Geoportal (https://mapy.geoportal.gov.pl, accessed on 16 July 2024).
The buildings in .shp format from the national geoportal were seamlessly integrated into Blender using the BlenderGIS extension, a freely available tool. This method preserved the accurate scale and spatial distribution of the objects typical of GIS environments and facilitated the seamless transition to a 3D editing environment.
The original object shapes conform to Level of Detail 1 (LOD 1) standards, lacking detailed roof geometries and precise elevations. To overcome this limitation, a process of aligning the objects with a point cloud was carried out to facilitate the recognition of prominent object features [33]. By comparing the buildings with the digital elevation model (derived from the point cloud) in the LOD 1 standard, it was possible to generate buildings with accurate roof geometries and heights. A total of six different objects were digitally reconstructed, each complying with the corresponding Level of Detail 2 (LOD 2) standard.
In order to reconstruct the earth-and-timber fortifications of the Giecz stronghold, it is essential to accurately represent their precise topology, which may differ from modern assumptions. Research on mapping the defensive walls provided valuable insights for this reconstruction [27]. The reconstructed course of the defensive walls in the southern part of the study area corresponds well with the current course of the present embankment. In contrast, the rampart tapers towards the northern part and covers a smaller area than the present embankment. This demarcation of the defensive rampart is shown visually in the illustration and is provided in the form of spatial data in .shp format, which serves as the basis for the reconstruction of the medieval defenses.
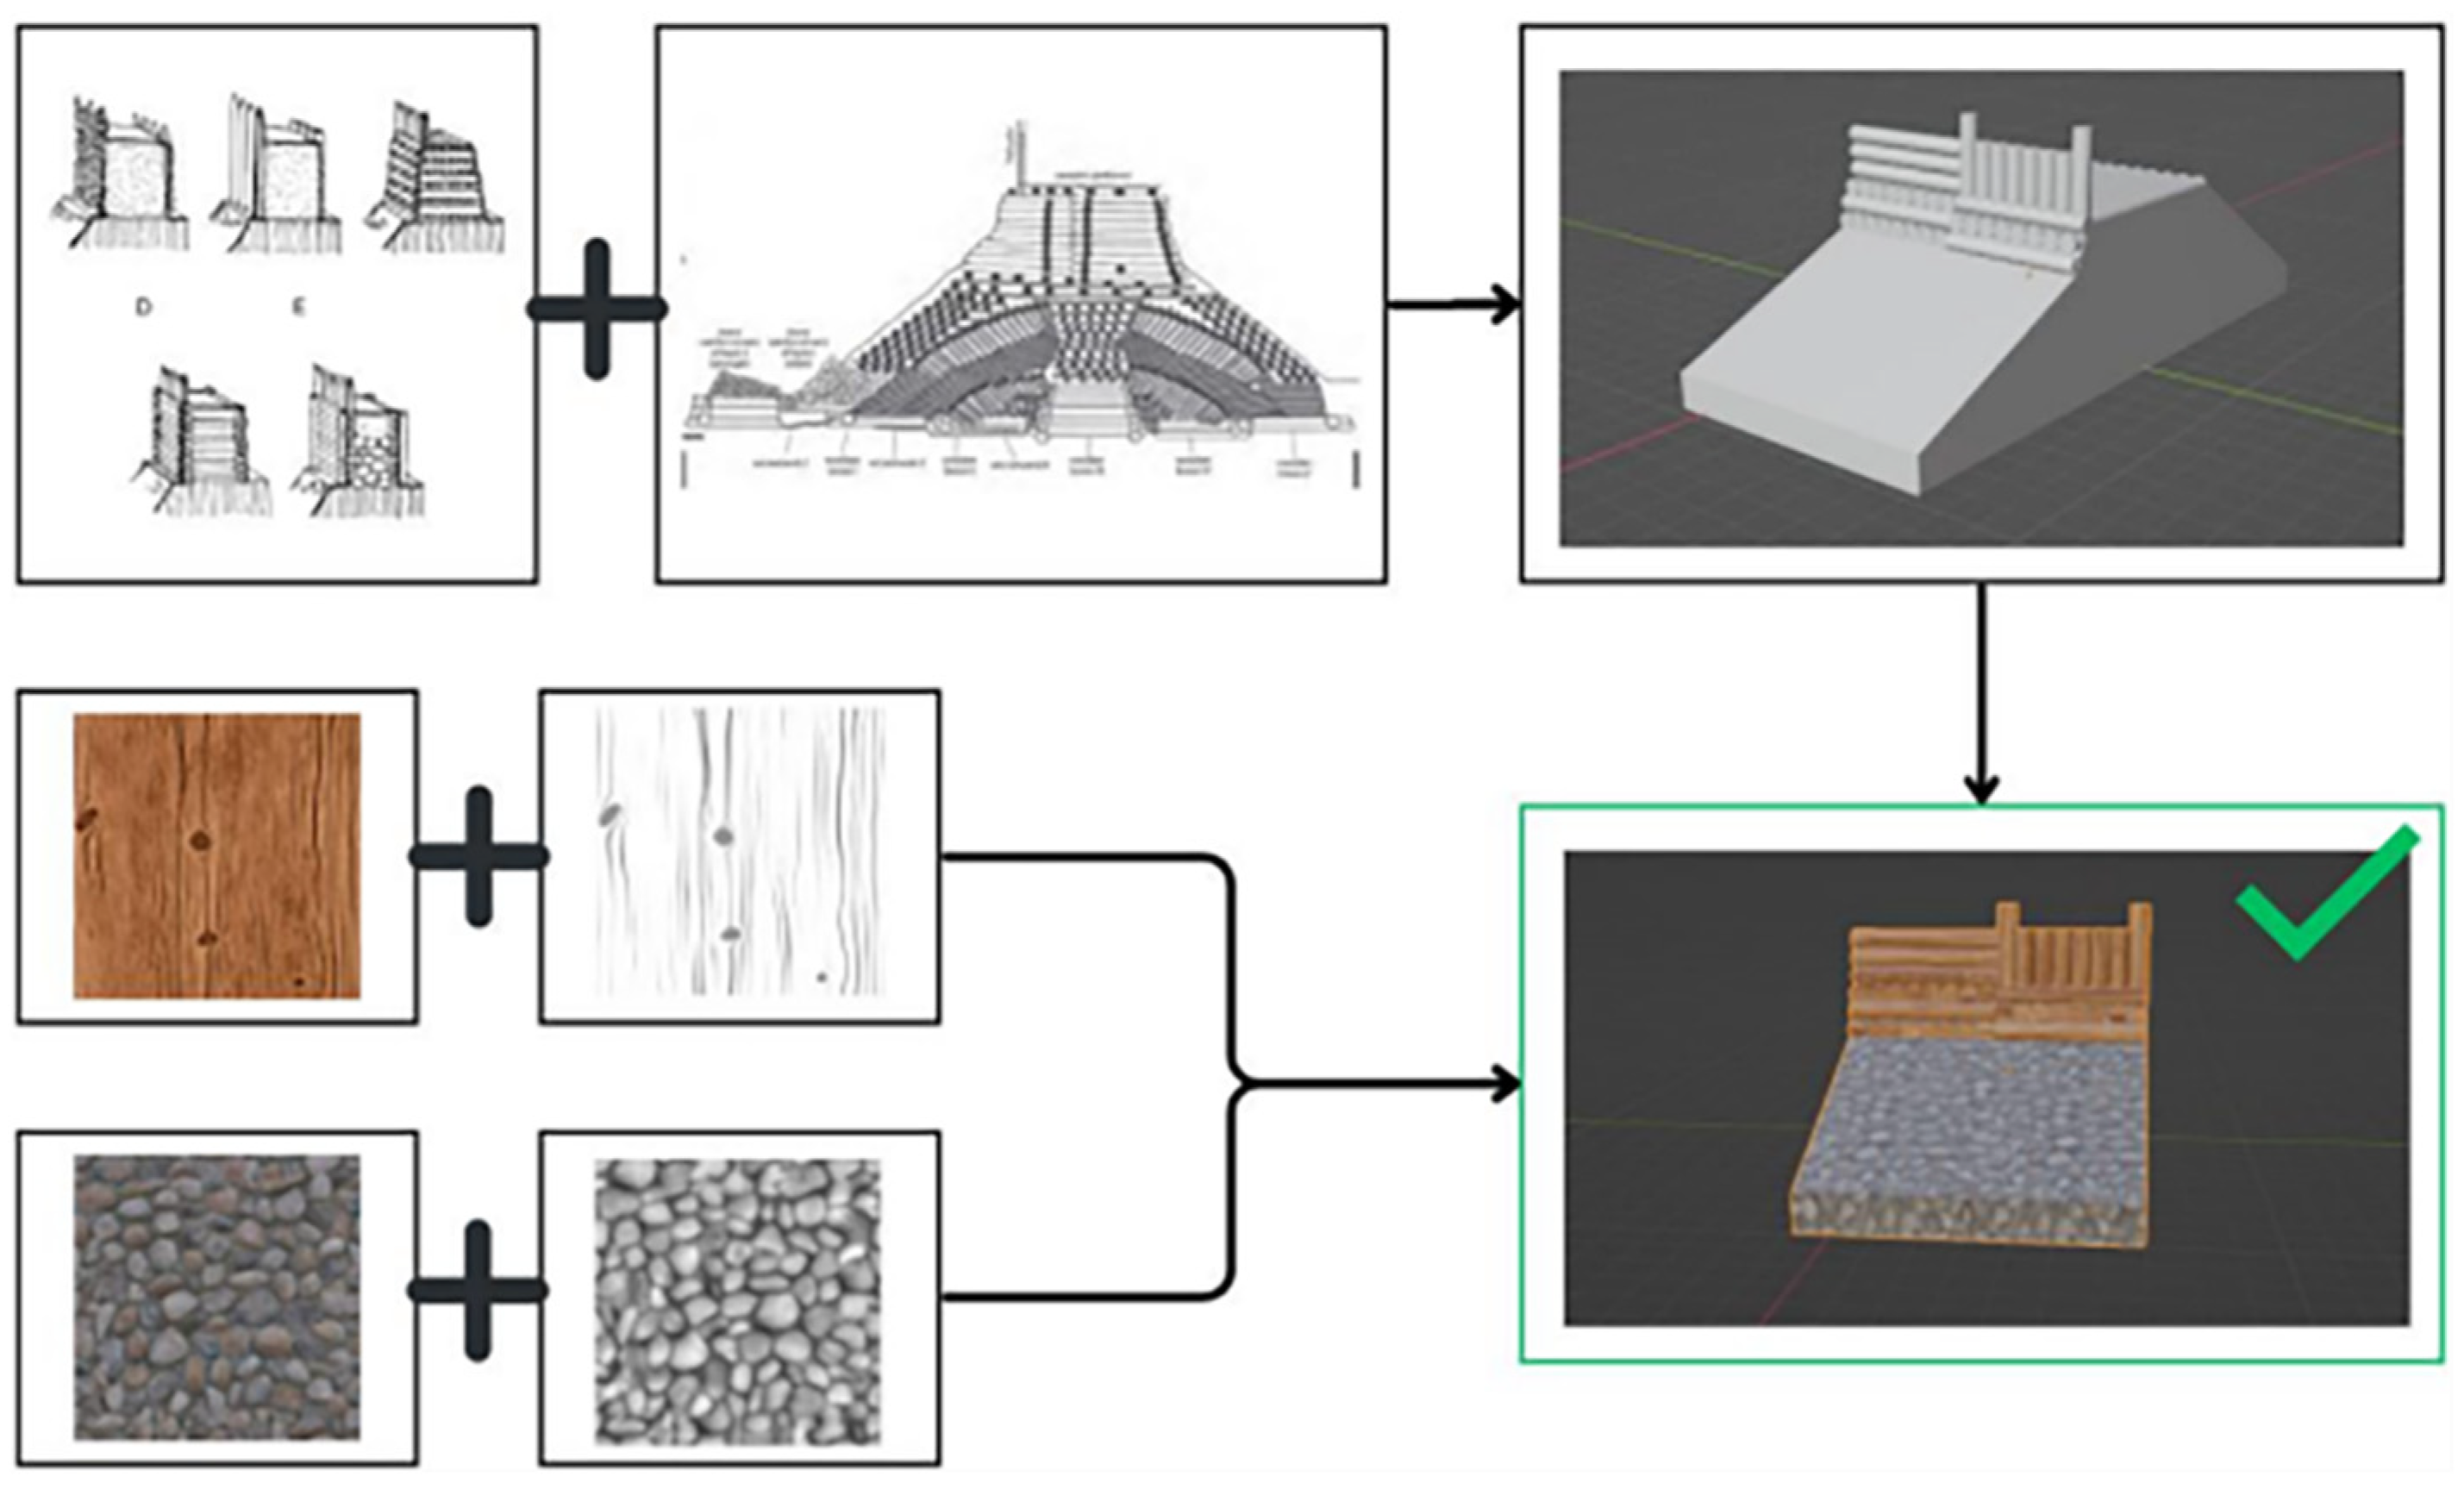
A 3D model with a width of 19 m had to be created for the reconstruction of the defensive wall. This was based on references from other early Piast fortresses and infographics describing various wooden fortress structures. The design was created using Blender software. The model was highly detailed and included textures that mimicked the stone facade of the rampart and the wooden logs that form the palisade. Elevation maps were used to give the objects a lifelike depth reminiscent of organic surfaces. The comprehensive workflow is visually illustrated in Figure 7.
The digital reconstruction of the church of the fortress depends on the question of chronological attribution. The construction of the church consisted of two distinct phases, which are explained in the theoretical sections of this study [21]. Given the temporal parameters established for this study, it was essential to determine the phase in which the church was to be digitally restored. The first construction phase took place between the end of the 10th and the beginning of the 11th century [21]. However, the second phase cannot be precisely dated, so there is a possibility that it took place after Czech Duke Bretislaus invaded Poland in 1038, which led to the weakening of Giecz’s role within the monarchy’s defensive structure. Consequently, the renovation and enlargement of the church probably took place in the second half of the 11th century or, equally plausibly, during the 12th century. Some sources assume that the westwork was built in the second half of the 11th century [21]. To facilitate the visualization, it was considered appropriate to create two digital models representing the two different phases of the church’s development [Figure 8], thus enabling the interchangeability of the models within the intended geovisualization platform.
The exact position of the stronghold gates is still disputed among researchers and archeologists. It is assumed that the outer gates were placed on the eastern side for defensive reasons, which corresponds to the location of the lake. Currently, the section of the embankment where the gates of the fortress could have been located according to this hypothesis has been partially altered. In order to propose a theoretical location for the stronghold gates, reference was made to the existing literature [31].
The presence of the palatium serves as a central link between the present-day landscape and the reconstructed state from the early 11th century. It is the only structure that has not been affected by any displacement or alteration. As the palatium retains its unchanged position over both periods, it is a reliable indicator of the development of the terrain and architecture. Therefore, it was deemed prudent to use the existing model of the palatium from the contemporary context for the 11th-century geovisualization. This decision was guided by the realization that both temporal representations only show the foundation embankment of the palatium, a construction project that was never fully realized [31].
As part of the visualization of the complex, digital models of other buildings within the stronghold were created, as well as the city gates and the bridge that serves as the main access to the stronghold itself [32]. However, these are objects that are not so important in the context of the terrain changes, and their exact modeling process was not taken into account.

3.7. Immersive Geovisualization

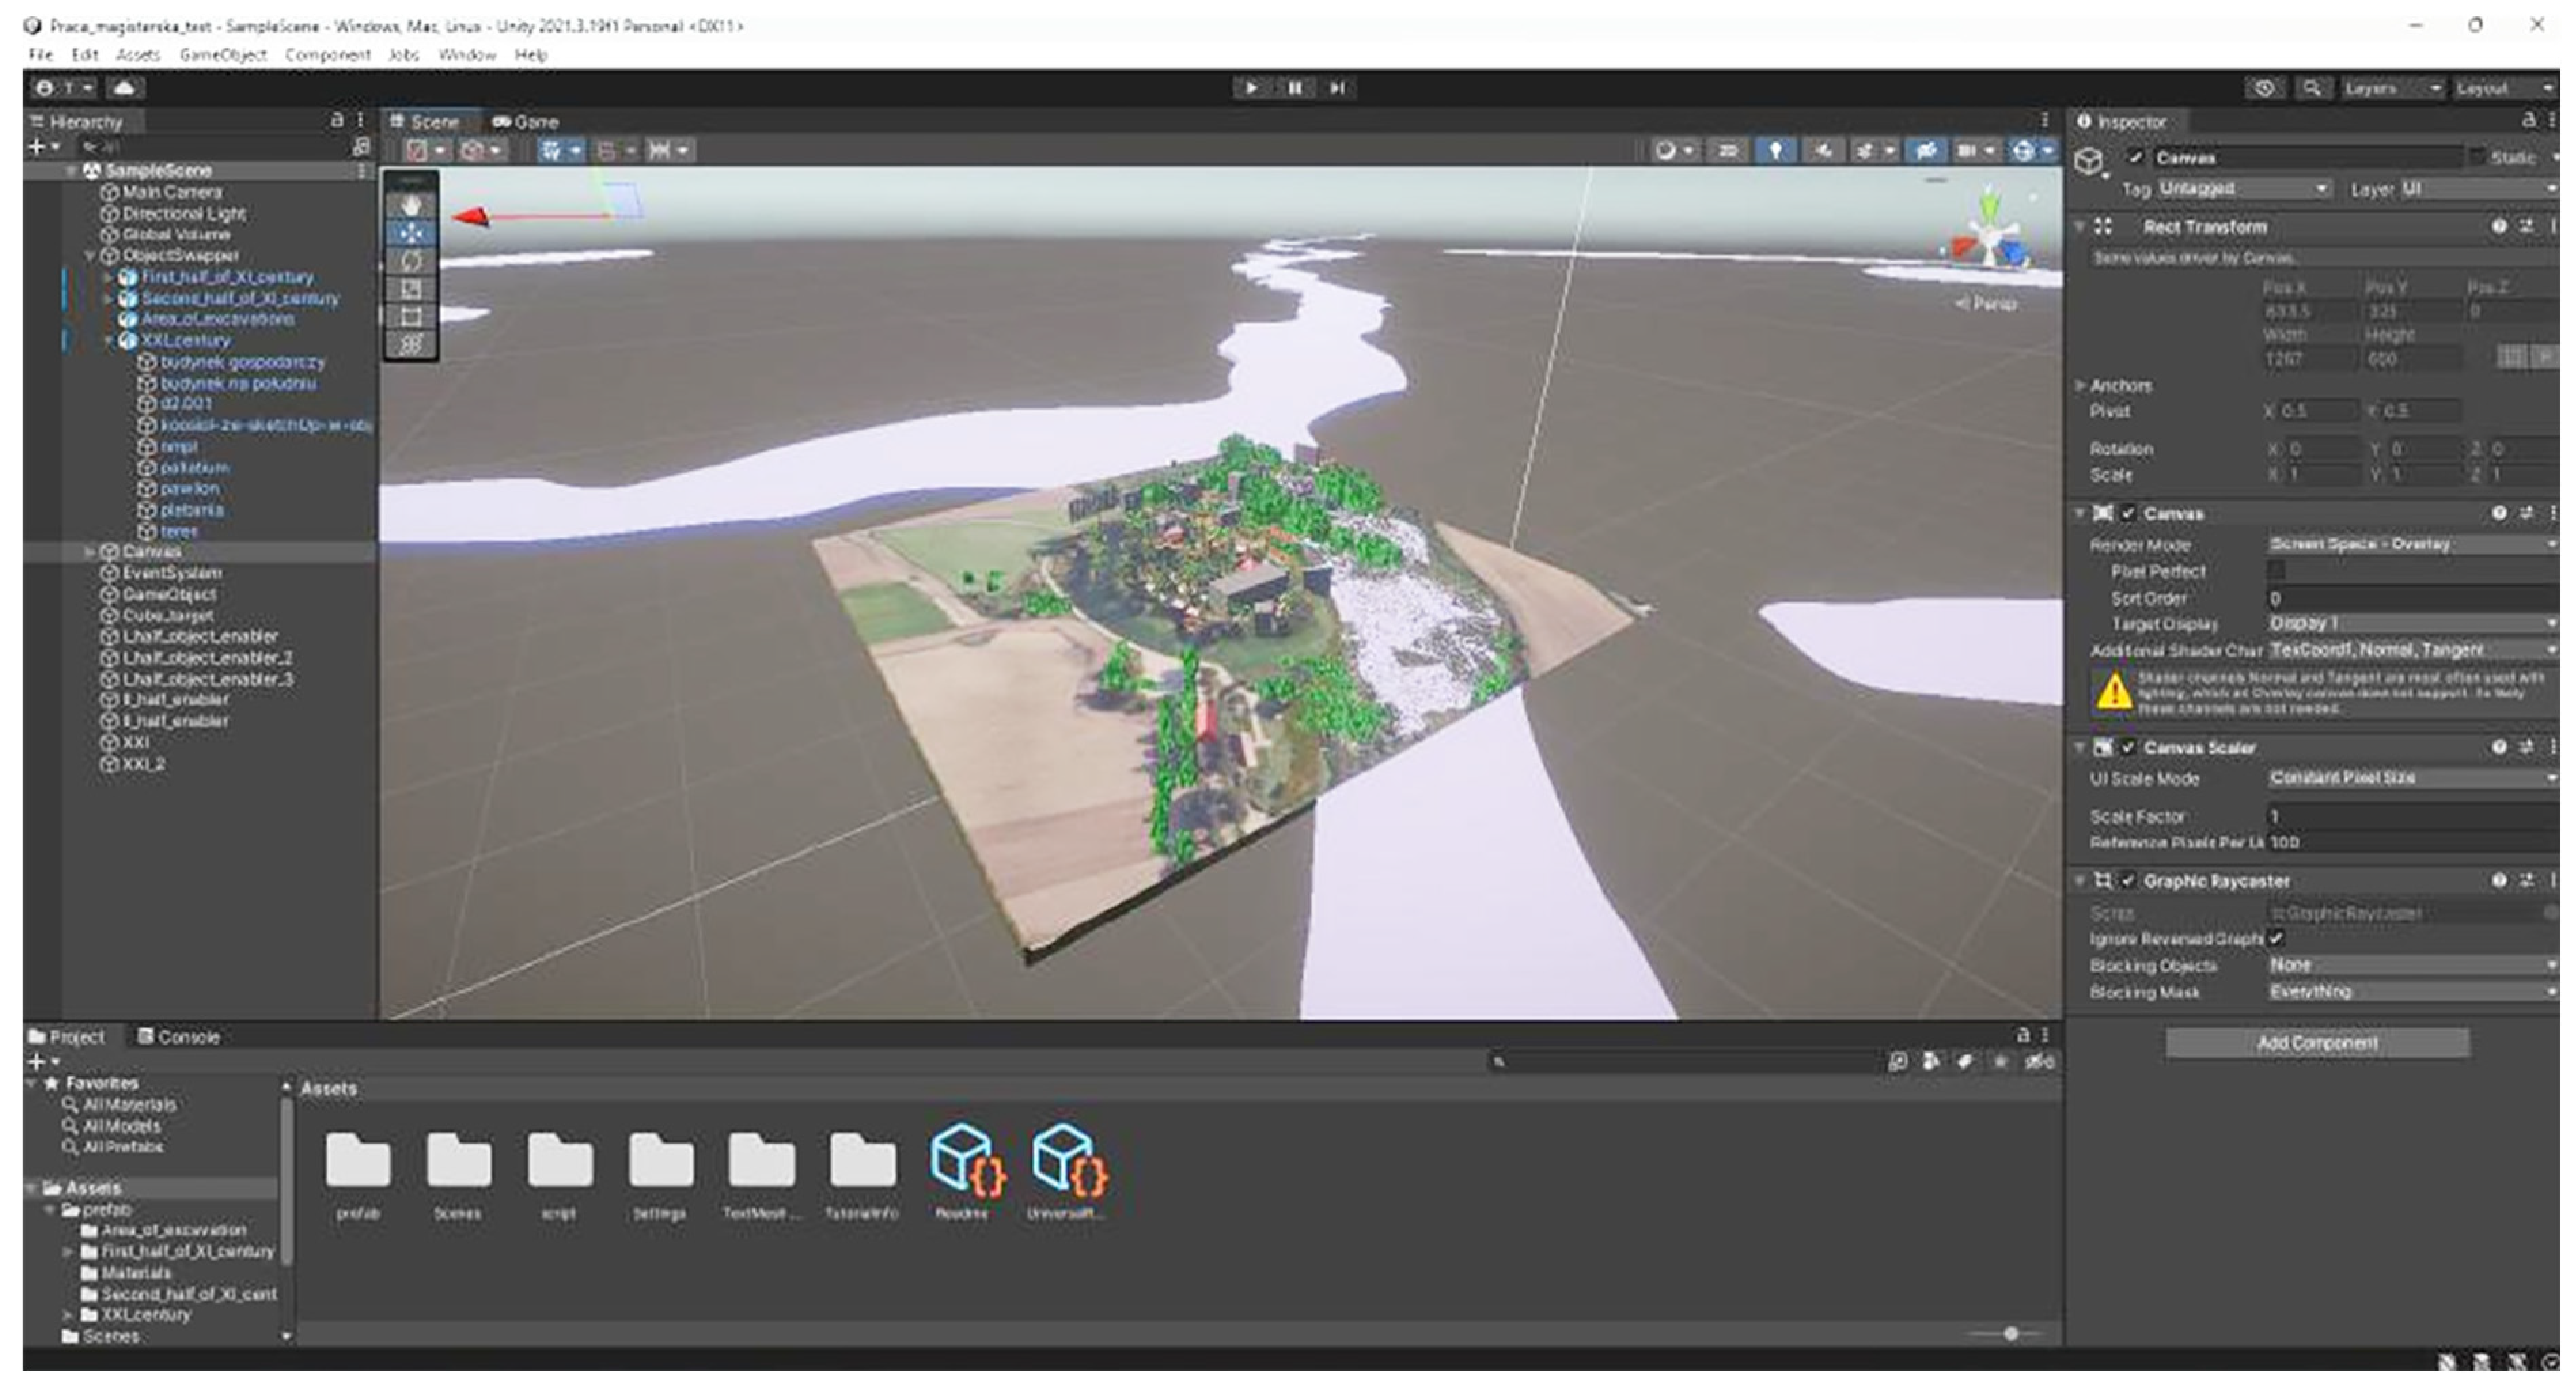
In line with visualization principles, integration into the Unity environment facilitates the addition of interactivity to geovisualization (Figure 9) [34]. This interactivity includes camera control, zoom function, and the possibility to include or exclude certain predefined visualization elements corresponding to different temporal states of the settlement.
The presence of the object in Unity’s game development environment allows the creation of a quasi-game with functionalities tailored to specific geovisualizations. The models from Blender, which were structured according to the states of the present, early 11th century, and late 11th century, were exported along with textures in .fbx format for seamless integration into the Unity program [Figure 10].
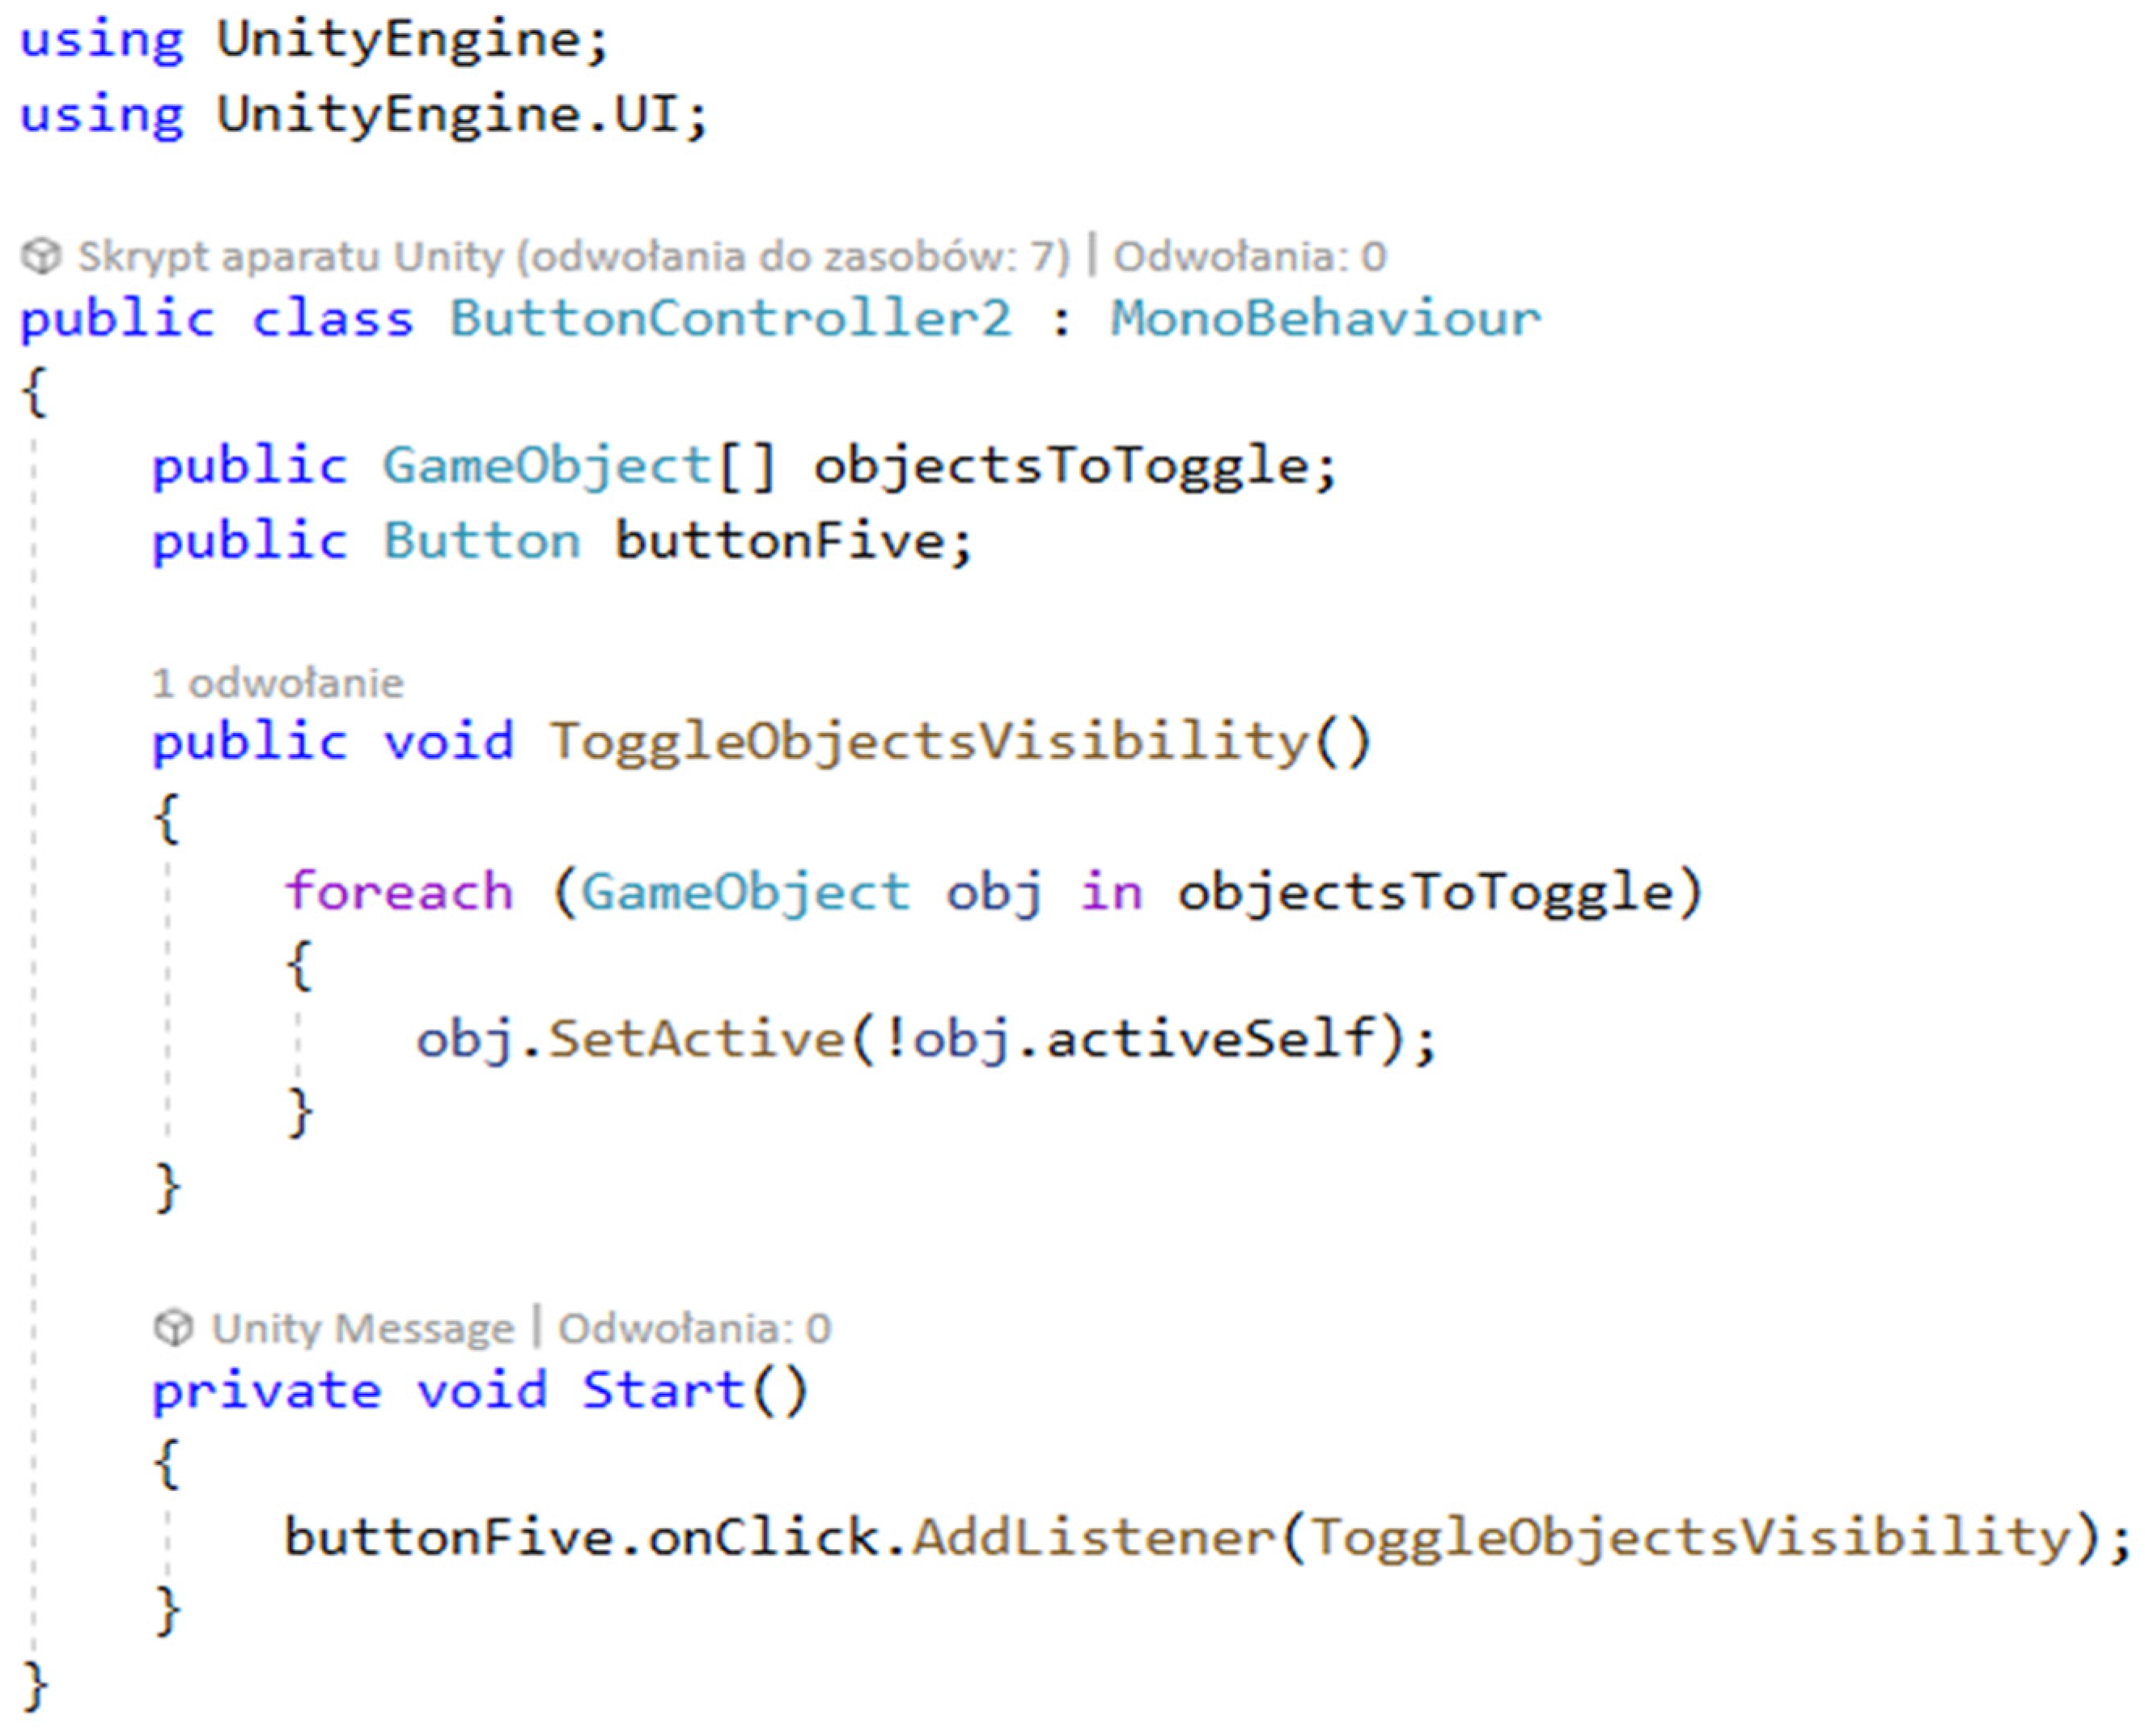
The precise positioning of objects in accordance with the previously defined topographic plane made it possible to display object overlays. Subsequently, the introduction of interactivity facilitated the manipulation of the imported models. The integration of options to facilitate the modification of individual objects entails two main considerations. The first is to integrate appropriate buttons into the Unity user interface, each representing specific actions. Secondly, appropriate scripts must be developed and implemented that are responsible for executing the desired actions per program (Figure 11).

4. Results

The achievement of the main goal was preceded by the achievement of a specific goal, namely the creation of a coherent classification of the sources, which are divided into reconstructive and referential sources. The data compiled and presented in tabular form served as the basis and reference point for the creation of the digital representation of all the models that make up the resulting object. The final series of screenshots of the visualization can be seen on the screen in Figure 12.
Based on geodetic and topographic data and analysis of archeological cross-sections, the topographical profile of the stronghold was reconstructed and contrasted with the current terrain, taking into account changes caused by natural erosion and sedimentation processes. A 3D model was then developed to visualize the differences in terrain morphology between these different periods.
Using the available historical and archeological records, key architectural structures within the 11th-century stronghold, such as the prince palatium and stronghold church, were identified. Using digital reconstruction methods, these structures were digitally recreated, given contemporary architectural features, and rendered in a manner consistent with the contemporary architectural style.

5. Discussion

The results of the study demonstrate a method for creating an interactive three-dimensional visualization of cultural heritage. Virtual heritage aims to go beyond simply producing digital replicas by focusing on the cognitive benefits derived from interaction [35]. Thus, the proposed interactions in this geovisualization are particularly significant. The visualization represents the state of the objects in the first half of the 11th century and the second half of the 11th century. These periods were chosen to highlight changes in the form and function of the objects. While other temporal and spatial reconstructions were also considered, the 11th century offers the most accurate reflection of the object’s original function. Contemporary visualization enhances the spatial perception of the overall object geometry.
The reconstruction of topographical elevation changes is associated with the challenge of extrapolating elevation data of the terrain. In the extrapolation of the topography presented in this paper, all available data for the Giecz stronghold itself were used. However, in order to visualize the terrain changes even more accurately, it would be necessary to increase the number of excavations from which the topography could be extrapolated [36].
The method of visualization through the possibility of circling the object itself makes it possible to compare the intersections of objects. Although it would be possible to present the fortress as a virtual tour, the bird’s eye view provides a better perspective for comparing significant terrain changes [37].
The division into reconstruction and reference data proved to be important for the creation of a diachronic reconstruction, as it enabled the comparison of changes in the objects over time and the attribution of certain materials to certain objects at certain times. Even more precise materials are desirable in order to create even more precise visualizations [38]. In this comparative geovisualization, reference data and reconstruction data were used, the classification of which can also be performed in other ways consistent with the specific features of virtual cultural heritage [39].
In addition, this study highlights the superimposition of objects from different periods, an aspect that is not often emphasized but which greatly enhances the spatial understanding of the objects. This overlay creates a comprehensive spatial perception and enriches the viewer’s insight into the historical development and transformation of the cultural heritage site. However, such time–space overlap may cause visual discomfort for a layman or a primary school student [40], which is why in this case the proposed functions are dedicated to experts [41].

6. Conclusions

Therefore, the main objective of this study—extending the operation of objects in several time dimensions and appropriately incorporating selected cultural landscape objects—is possible thanks to the proposed scheme of activities and its application to a typical medieval Eastern European earth-and-timber stronghold. The immersive geovisualization makes it possible to depict both the current state and the state in the first and second half of the 11th century.
In creating the geovisualization, a variety of data and materials were used, both those that correspond to the geodetic datum and those that come from the work of historians and archeologists and do not fit into the conditions of cartometrization. These data were classified as reference or reconstruction data. This categorization allows us to understand the nature of the sources, which affects their accuracy and consequently, the level of confidence we can place in these sources.
The representation of land and architectural changes was made possible through the use of bird’s eye view and the ability to include objects whose geometry overlaps in the visualization, showing the changes that took place in the stronghold.
The example of a stronghold in Giecz can be seen in the following:
  • Changes in the height, structure, and geometry of the defensive embankment;
  • Degradation of objects such as the bridge to the stronghold, the lake, and the castle church;
  • A change in the general topographic level, which in the Middle Ages was about 1.5 m lower than today;
  • Construction of new facilities such as a museum pavilion and a new wooden church.
The use of three-dimensional modeling and GIS programs as well as game engines makes it possible to collect, compare, and integrate data and present visualizations in the form of a desktop application. Such a framework can be universally applied to all damaged cultural heritage objects.
However, the presentation of the three states of an object can create a sense of disorientation for users who have not visited the object in person. This feeling can be exacerbated by the fact that we perceive visualizations from a bird’s eye view, which makes it difficult to build a spatial concept of dimensions and distances between objects. However, experts, especially in the field of earth and environmental sciences as well as historians and archeologists, will find in visualization a tool to present the results of their research together in an accessible form, although this topic undoubtedly deserves further investigation.
The use of three-dimensional modeling and GIS programs as well as game engines makes it possible to collect, compare, and integrate data and present visualizations in the form of a desktop application. Such a framework can be universally applied to all damaged cultural heritage objects. Expert opinions on medieval strongholds and cultural heritage of the specific ways of immersion geovisualization for reconstructed landscape with core objects in the current state provide researchers with an extended view of its effectiveness; therefore, the authors plan further research on evaluation among experts [42].

Author Contributions

Conceptualization, B.M.-G.; methodology, J.Z. and B.M.-G.; software, J.Z.; validation, B.M.-G.; formal analysis, J.Z. and B.M.-G.; investigation, J.Z.; resources, J.Z.; data curation, J.Z.; writing—original draft preparation, J.Z.; writing—review and editing, B.M.-G.; visualization, J.Z. and B.M.-G. All authors have read and agreed to the published version of the manuscript.

Funding

This research received no external funding.

Data Availability Statement

Dataset available on request from the authors.

Conflicts of Interest

The authors declare no conflicts of interest.

References

  1. Wang, R. 3D Building Modeling Using Images and LiDAR: A Review. Int. J. Image Data Fusion 2013, 4, 273–292. [Google Scholar] [CrossRef]
  2. Kersten, T.P.; Tschirschwitz, F.; Deggim, S. Development of a Virtual Museum Including a 4D Presentation of Building History in Virtual Reality. In Proceedings of the ISPRS—International Archives of the Photogrammetry, Remote Sensing and Spatial Information Sciences, Nafplio, Greece, 1–3 March 2017; Volume XLII-2/W3. pp. 361–367. [Google Scholar] [CrossRef]
  3. Medyńska-Gulij, B. Kartografia-Geomatycznie I Geomedialnie; Wydawnictwo Naukowe PWN: Warszawa, Poland, 2024; ISBN 9788301235888. [Google Scholar]
  4. Halik, Ł.; Wielebski, Ł. Usefulness of Plane-Based Augmented Geovisualization—Case of “The Crown of Polish Mountains 3D”. ISPRS Int. J. Geo Inf. 2023, 12, 38. [Google Scholar] [CrossRef]
  5. Bekele, M.K.; Champion, E. A comparison of immersive realities and interaction methods: Cultural learning in virtual heritage. Front. Robot. AI 2019, 6, 91. [Google Scholar] [CrossRef]
  6. Vital, R.; Sylaiou, S. Digital survey: How it can change the way we perceive and understand heritage sites. Digit. Appl. Archaeol. Cult. Herit. 2022, 24, e00212. [Google Scholar] [CrossRef]
  7. Forti, L.; Brandolini, F.; Oselini, V.; Peyronel, L.; Pezzotta, A.; Vacca, A.; Zerboni, A. Geomorphological Assessment of the Preservation of Archaeological Tell Sites. Sci. Rep. 2023, 13, 7683. [Google Scholar] [CrossRef]
  8. Spadoni, F.; Tariffi, F.; Rossi, R.; Lusso, S. Chapter A Techno Social Collaborative Platform to Manage Optimize and Crowdfund Cultural Heritage Initiatives. In Electronic Imaging & the Visual Arts; Firenze University Press: Florence, Italy, 2018. [Google Scholar]
  9. Mazzacca, G.; Karami, A.; Rigon, S.; Farella, E.M.; Trybala, P.; Remondino, F. NeRF for heritage 3D reconstruction. Int. Arch. Photogramm. Remote Sens. Spat. Inf. Sci. 2023, 48, 1051–1058. [Google Scholar]
  10. Pisoni, G.; Díaz-Rodríguez, N.; Gijlers, H.; Tonolli, L. Human-centered artificial intelligence for designing accessible cultural heritage. Appl. Sci. 2021, 11, 870. [Google Scholar] [CrossRef]
  11. Rodríguez-Gonzálvez, P.; Muñoz-Nieto, A.L.; del Pozo, S.; Sanchez-Aparicio, L.J.; Gonzalez-Aguilera, D.; Micoli, L.; Barsanti, S.G.; Guidi, G.; Mills, J.; Fieber, K.; et al. 4D reconstruction and visualization of cultural heritage: Analyzing our legacy through time. Int. Arch. Photogramm. Remote Sens. Spat. Inf. Sci. 2017, 42, 609–616. [Google Scholar]
  12. Guidi, G.; Russo, M. Diachronic 3D Reconstruction for Lost Cultural Heritage. Int. Arch. Photogramm. Remote Sens. Spat. Inf. Sci. 2011, 38, 371–376. [Google Scholar] [CrossRef]
  13. Rodríguez-Gonzálvez, P.; Guerra Campo, Á.; Muñoz-Nieto, Á.L.; Sánchez-Aparicio, L.J.; González-Aguilera, D. Diachronic Reconstruction and Visualization of Lost Cultural Heritage Sites. ISPRS Int. J. Geo-Inf. 2019, 8, 61. [Google Scholar] [CrossRef]
  14. Brůha, L.; Laštovička, J.; Palatý, T.; Štefanová, E.; Štych, P. Reconstruction of lost cultural heritage sites and landscapes: Context of ancient objects in time and space. ISPRS Int. J. Geo Inf. 2020, 9, 604. [Google Scholar]
  15. Griwodz, C.; Gasparini, S.; Calvet, L.; Gurdjos, P.; Castan, F.; Maujean, B.; Lanthony, Y. AliceVision Meshroom: An open-source 3D reconstruction pipeline. In Proceedings of the 12th ACM Multimedia Systems Conference, Istanbul, Turkey, 28 September–1 October 2021; pp. 241–247. [Google Scholar]
  16. Ramos, M.M.; Remondino, F. Data fusion in cultural heritage–A review. Int. Arch. Photogramm. Remote Sens. Spat. Inf. Sci. 2015, 40, 359–363. [Google Scholar]
  17. Nishanbaev, I.; Champion, E.; McMeekin, D.A. A web Gis-based integration of 3D digital models with linked open data for cultural heritage exploration. ISPRS Int. J. Geo Inf. 2021, 10, 684. [Google Scholar]
  18. Lazarinis, F.; Boididis, I.; Kozanidis, L.; Kanellopoulos, D.; Education, S.M.O. An adaptable multi-learner serious game for learning cultural heritage. Adv. Mob. Learn. Educ. Res. 2022, 2, 201–215. [Google Scholar]
  19. Wiewióra, M.; Wasik, B.; Molewski, P.; Misiewicz, K.; Małkowski, W.; Bogacki, M. New historical data on the Teutonic Order crusades in Prussia: Geophysical and archaeological research into an earth-and-timber stronghold and city of the 1230s at Starogrod, northern-central Poland. Archaeol. Prospect. 2020, 27, 135–152. [Google Scholar] [CrossRef]
  20. Lisowska, E.; Jaworski, K. 8th–10th Century Hillforts in the Sudetes—Exploring Current State of Research and Observations, towards New Horizons. Acta Archaeol. Carpathica 2021, 56, 335–386. [Google Scholar]
  21. Krysztofiak, T. Wczesnopiastowski Kościół p.w. Św. Jana Chrzciciela na Grodzie w Gieczu w Świetle Najnowszych Odkryć. In Początki Architektury Monumentalnej w Polsce; Janiak, T., Stryjak, D., Eds.; 20-21 Muzeum Początków Państwa Polskiego: Gniezno, Poland, 2004; pp. 181–198. ISBN 83-921201-0-0. [Google Scholar]
  22. Kostrzewski, B. Gród Piastowski w Gieczu; Biblioteczka Popularnonaukowa Muzeum Archeologicznego: Poznań, Poland, 1966; Volume 2. [Google Scholar]
  23. Indycka, E.Z. Badań nad Cmentarzyskami Gieckiego Kompleksu Osadniczego. Stud. Lednickie 2000, 6, 69–90. [Google Scholar]
  24. Yakar, M.; Dogan, Y. 3D Reconstruction of Residential Areas with SfM Photogrammetry. In Advances in Remote Sensing and Geo Informatics Applications; El-Askary, H., Lee, S., Heggy, E., Pradhan, B., Eds.; Springer: Cham, Switzerland, 2018; ISBN 978-3-030-01440-7. [Google Scholar]
  25. Michałowska, K.; Nałęcz, T. Terminologia Definiująca Rejestry Zasobów Danych Przestrzennych jako Normatywne Źródła Krajowej Infrastruktury Informacji Przestrzennej. Rocz. Geomatyki 2012, 10, 79–91. [Google Scholar]
  26. Bielecka, E.; Zwirowicz-Rutkowska, A. Organisational aspects of spatial information infrastructure in Poland. Geod. Cartogr. 2013, 62, 85–95. [Google Scholar]
  27. Krąpiec, M.; Krysztofiak, T. Potwierdzenie Plemiennej Genezy Grodu w Gieczu. Wielkop. Spraw. Archeol. 2003, 6, 32–51. [Google Scholar]
  28. Kostrzewski, B. Sprawozdanie z Badań na Grodzisku w Gieczu w Pow. Średzkim za Rok 1949. Stud. Wczesnośredniowieczne 1952, 1, 149–170. [Google Scholar]
  29. Kowalewski, G.; Gałka, M. Współczesny i Dawniejszy Układ Hydrograficzny Rejonu Giecza w Świetle Źródeł Kartograficznych. In Architektoniczno-Przestrzenne i Przyrodnicze Podstawy Rekonstrukcji Wczesnośredniowiecznych Założeń Obronnych Giecza; Grygorowicz, A., Milecka, K., Tobolski, K., Eds.; Instytut Architektury i Planowania Przestrzennego Wydziału Architektury Politechniki Poznańskiej: Poznań, Poland, 2007; pp. 105–112. [Google Scholar]
  30. Tobolski, K.; Milecka, K.; Kowalewski, G. Development of wetlands adjacent to Giecz stronghold and its meaning during the early middle ages. In Physical, Chemicaland Biological Processes in Soils; Szajdak, W.J., Karabanov, A.K., Eds.; Instytut Środowiska Rolniczego i Leœnego PAN: Poznań, Poland, 2010; pp. 623–634. [Google Scholar]
  31. Krysztofiak, T. Ośrodek Grodowy w Gieczu w Okresie Przed i Wczesnopiastowskim. In Gród Piastowski w Gieczu—GenezaFunkcja—Kontekst; Kara, M., Krzysztofiak, T., Wyrwa, A., Eds.; Wydawnictwo Poznańskiego Towarzystwa Przyjaciół Nauk: Poznań, Poland, 2016; pp. 115–154. ISBN 9788376543307. [Google Scholar]
  32. Kubiak, L.; Makohonienko, M.; Polcyn, M. Wstępne Doniesienie z Badań Średniowiecznego Mostu/Grobli w Gieczu koło Środy Wlkp. Stud. Lednickie 1991, 2, 217–227. [Google Scholar]
  33. Volk, R.; Stengel, J.; Schultmann, F. Building Information Modeling (BIM) for existing buildings — Literature review and future needs. Autom. Constr. 2014, 38, 109–127. [Google Scholar]
  34. Zagata, K.; Gulij, J.; Halik, Ł.; Medyńska-Gulij, B. Mini-Map for Gamers Who Walk and Teleport in a Virtual Stronghold. ISPRS Int. J. Geo Inf. 2021, 10, 96. [Google Scholar] [CrossRef]
  35. Pietroni, E.; Ferdani, D. Virtual Restoration and Virtual Reconstruction in Cultural Heritage: Terminology, Methodologies, Visual Representation Techniques and Cognitive Models. Information 2021, 12, 167. [Google Scholar] [CrossRef]
  36. Baubinienė, A.; Morkūnaitė, R.; Bauža, D.; Vaitkevičius, G.; Petrošius, R. Aspects and methods in reconstructing the medieval terrain and deposits in Vilnius. Quat. Int. 2014, 386, 83–88. [Google Scholar] [CrossRef]
  37. Deggim, S.; Kersten, T.; Tschirschwitz, F.; Hinrichsen, N. Segeberg 1600—Reconstructing a Historic Town for Virtual Reality Visualisation as an Immersive Experience. In Proceedings of the ISPRS—International Archives of the Photogrammetry, Remote Sensing and Spatial Information Sciences, Hamburg, Germany, 28–29 November 2017; Volume XLII-2/W8. pp. 87–94. [Google Scholar] [CrossRef]
  38. Schindling, J.; Gibbes, C. LiDAR as a Tool for Archaeological Research: A Case Study. Archaeol Anthr. Sci. 2014, 6, 411–423. [Google Scholar] [CrossRef]
  39. Mościcka, A.; Zwirowicz-Rutkowska, A. Description of old maps in the Europeana Data Model. J. Cult. Herit. 2020, 45, 315–326. [Google Scholar]
  40. Liritzis, I.; Volonakis, P.; Vosinakis, S. 3D Reconstruction of Cultural Heritage Sites as an Educational Approach. The Sanctuary of Delphi. Appl. Sci. 2021, 11, 3635. [Google Scholar] [CrossRef]
  41. Hruby, F.; Ressl, R.; de la Borbolla del Valle, G. Geovisualization with Immersive Virtual Environments in Theory and Practice. Int. J. Digit. Earth 2018, 12, 123–136. [Google Scholar] [CrossRef]
  42. Medyńska-Gulij, B.; Zagata, K. Experts and Gamers on Immersion into Reconstructed Strongholds. ISPRS Int. J. Geo Inf. 2020, 9, 655. [Google Scholar] [CrossRef]
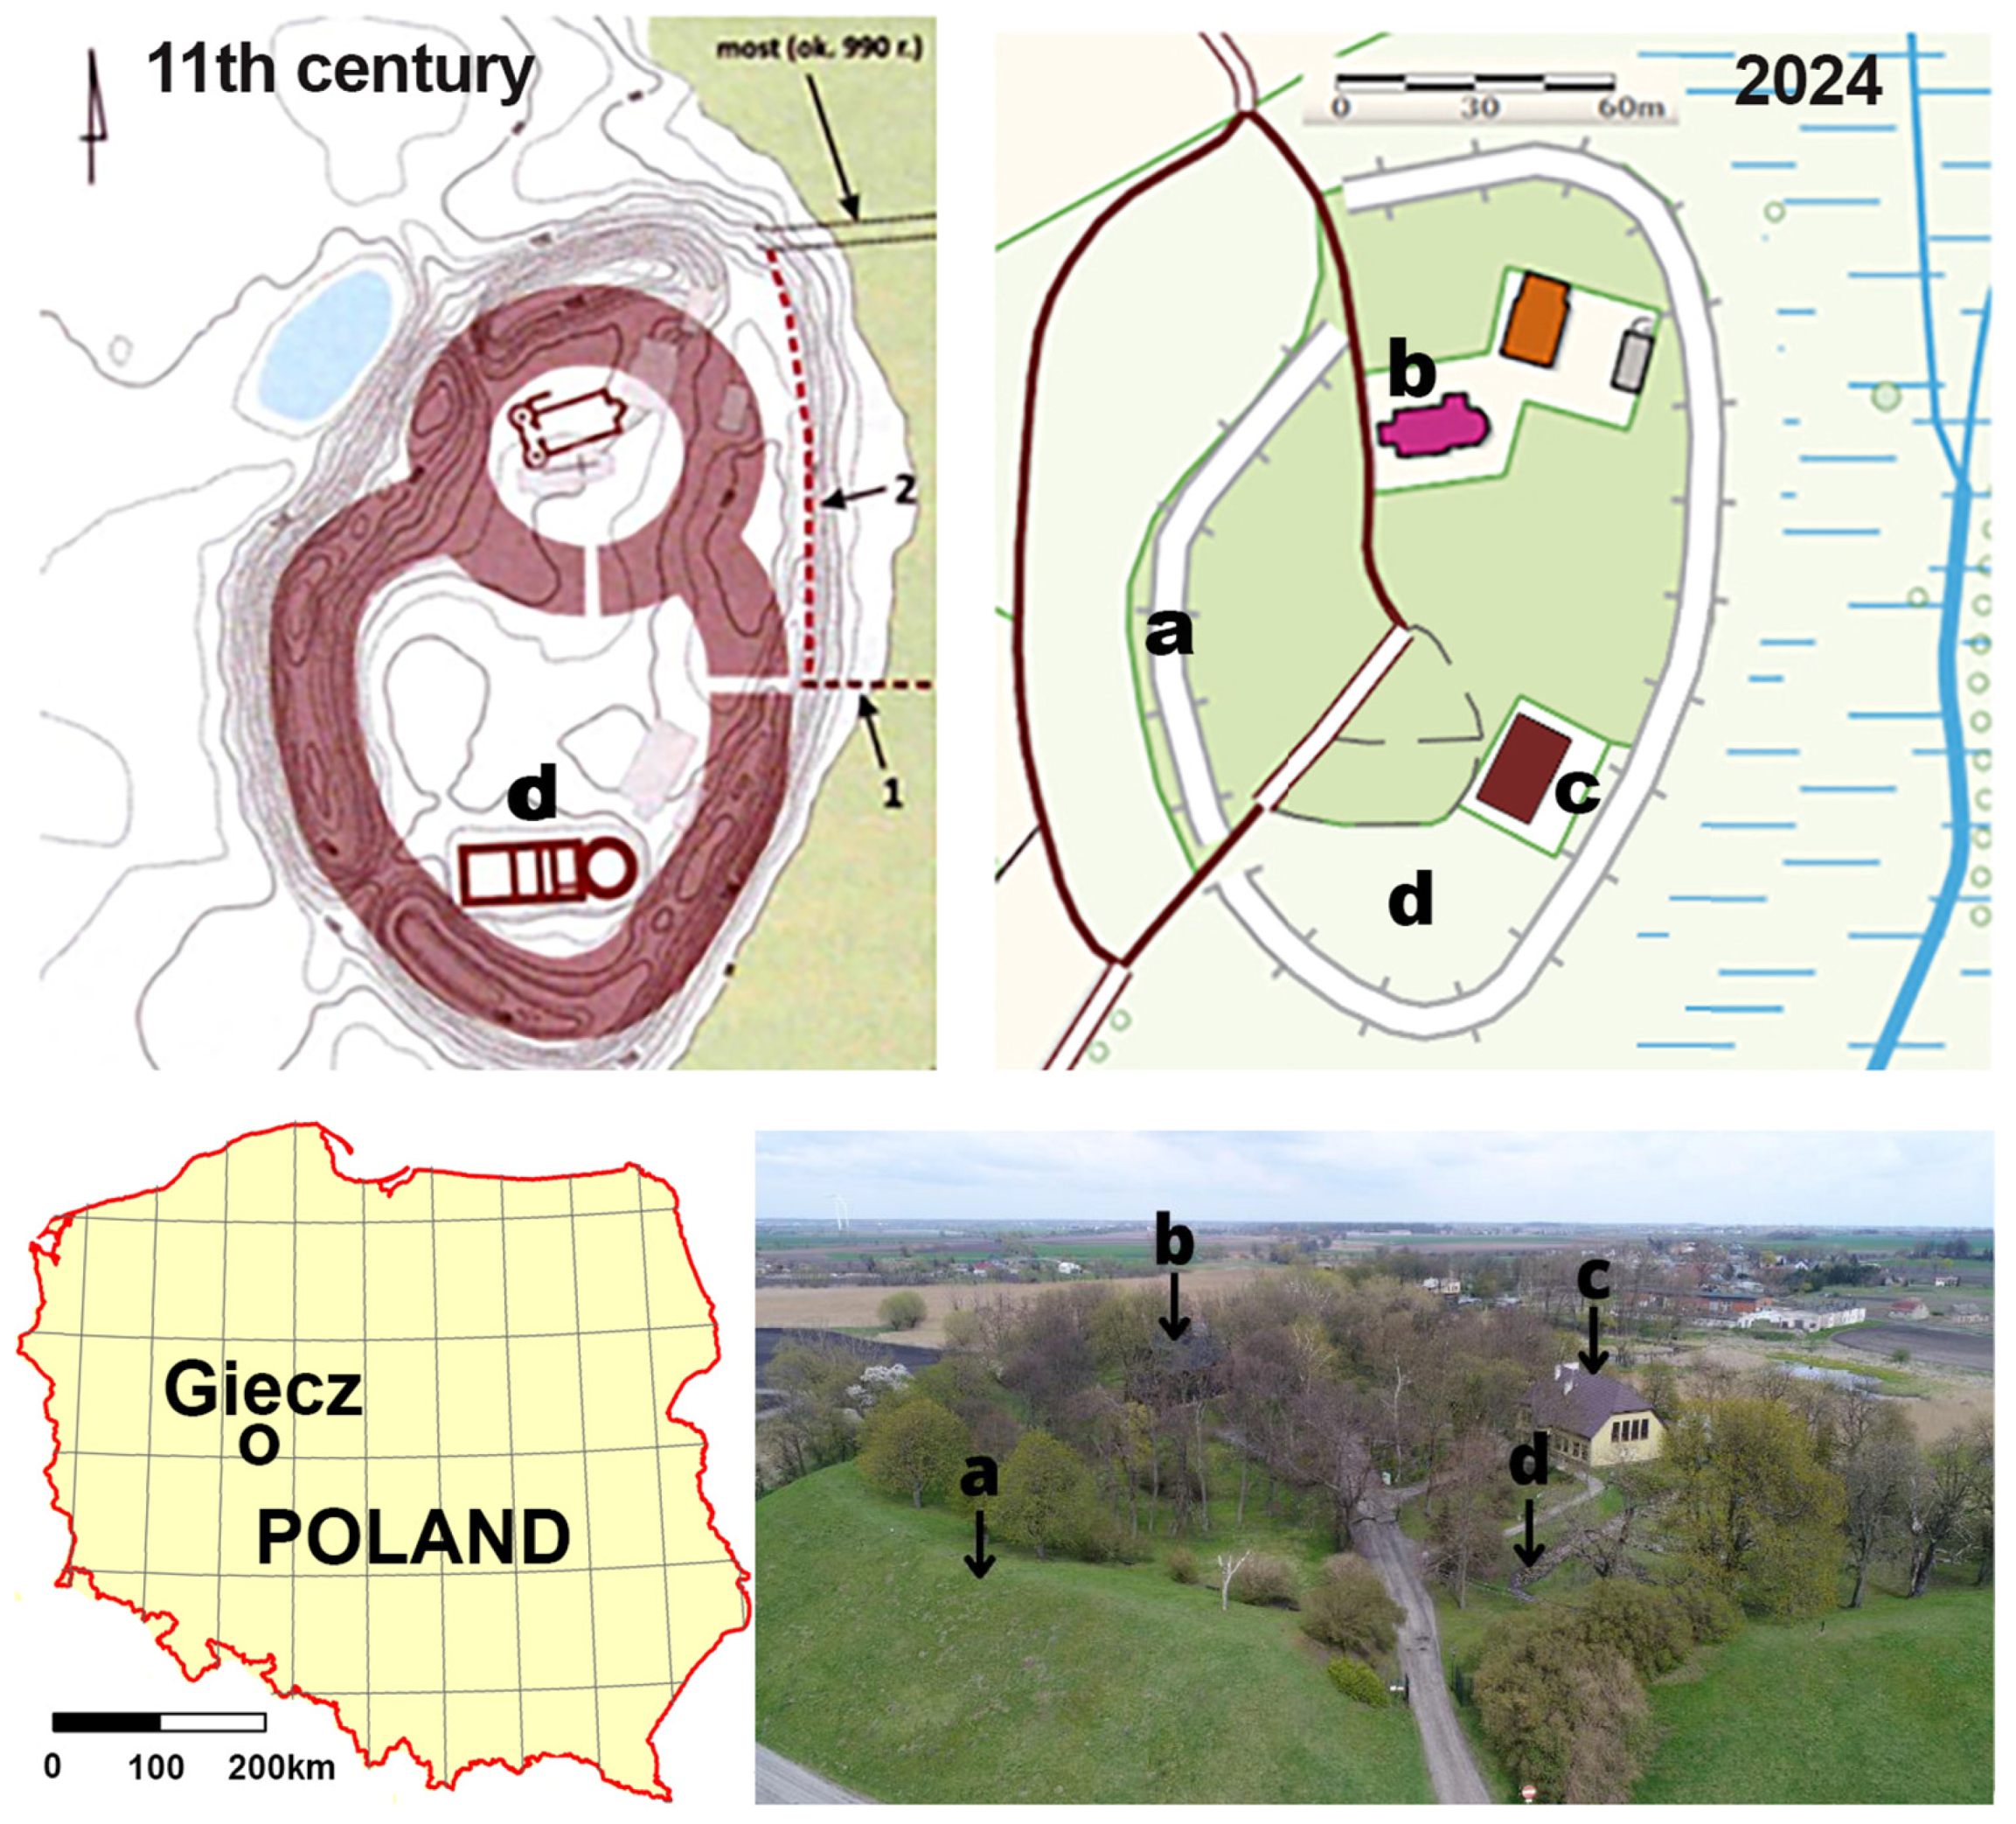
Figure 1. The Giecz stronghold localization in Poland in and view of objects: defensive rampart (a), current state church (b), museum building (c), foundations of the palatium (d).
Land 13 01323 g001
Figure 3. Reference data from official Polish geoportal (https://mapy.geoportal.gov.pl, accessed on 14 July 2024).
Land 13 01323 g003
Figure 4. Reconstruction data: preview, type, and utilization, in brackets data sources according to the literature given in references [21,22,27,28,29,30,31,32].
Land 13 01323 g004
Figure 5. Terrain level from archeological cross-sections [21].
Land 13 01323 g005
Figure 6. Comparison of two hypotheses about lake extent in the 11th century: left from 1966 [22] and right from [30].
Land 13 01323 g006
Figure 7. Creation of stronghold rampart, according to [27].
Land 13 01323 g007
Figure 8. Creation of two states of church [31], plastic model from Giecz Museum).
Land 13 01323 g008
Figure 9. Visualization of Giecz stronghold in Unity engine workspace.
Land 13 01323 g009
Figure 10. Buttons for managing geovisualization features and objects.
Land 13 01323 g010
Figure 11. Code for managing geovisualization.
Land 13 01323 g011
Figure 12. Six views from the immersive geovisualization of Giecz stronghold.
Land 13 01323 g012
Disclaimer/Publisher’s Note: The statements, opinions and data contained in all publications are solely those of the individual author(s) and contributor(s) and not of MDPI and/or the editor(s). MDPI and/or the editor(s) disclaim responsibility for any injury to people or property resulting from any ideas, methods, instructions or products referred to in the content.